
Fine-Grained Cross-Modal Retrieval for Cultural Items with Focal Attention and Hierarchical Encodings


1
Department of Computer Science, KU Leuven, 3001 Leuven, Belgium
2
Department of Electrical Engineering, KU Leuven, 3001 Leuven, Belgium
*
Author to whom correspondence should be addressed.
Computers 2021, 10(9), 105; https://0-doi-org.brum.beds.ac.uk/10.3390/computers10090105
Submission received: 13 July 2021
/
Revised: 11 August 2021
/
Accepted: 19 August 2021
/
Published: 25 August 2021
(This article belongs to the Special Issue Artificial Intelligence for Digital Humanities (AI4DH))
Abstract
:In this paper, we target the tasks of fine-grained image–text alignment and cross-modal retrieval in the cultural heritage domain as follows: (1) given an image fragment of an artwork, we retrieve the noun phrases that describe it; (2) given a noun phrase artifact attribute, we retrieve the corresponding image fragment it specifies. To this end, we propose a weakly supervised alignment model where the correspondence between the input training visual and textual fragments is not known but their corresponding units that refer to the same artwork are treated as a positive pair. The model exploits the latent alignment between fragments across modalities using attention mechanisms by first projecting them into a shared common semantic space; the model is then trained by increasing the image–text similarity of the positive pair in the common space. During this process, we encode the inputs of our model with hierarchical encodings and remove irrelevant fragments with different indicator functions. We also study techniques to augment the limited training data with synthetic relevant textual fragments and transformed image fragments. The model is later fine-tuned by a limited set of small-scale image–text fragment pairs. We rank the test image fragments and noun phrases by their intermodal similarity in the learned common space. Extensive experiments demonstrate that our proposed models outperform two state-of-the-art methods adapted to fine-grained cross-modal retrieval of cultural items for two benchmark datasets.
1. Introduction
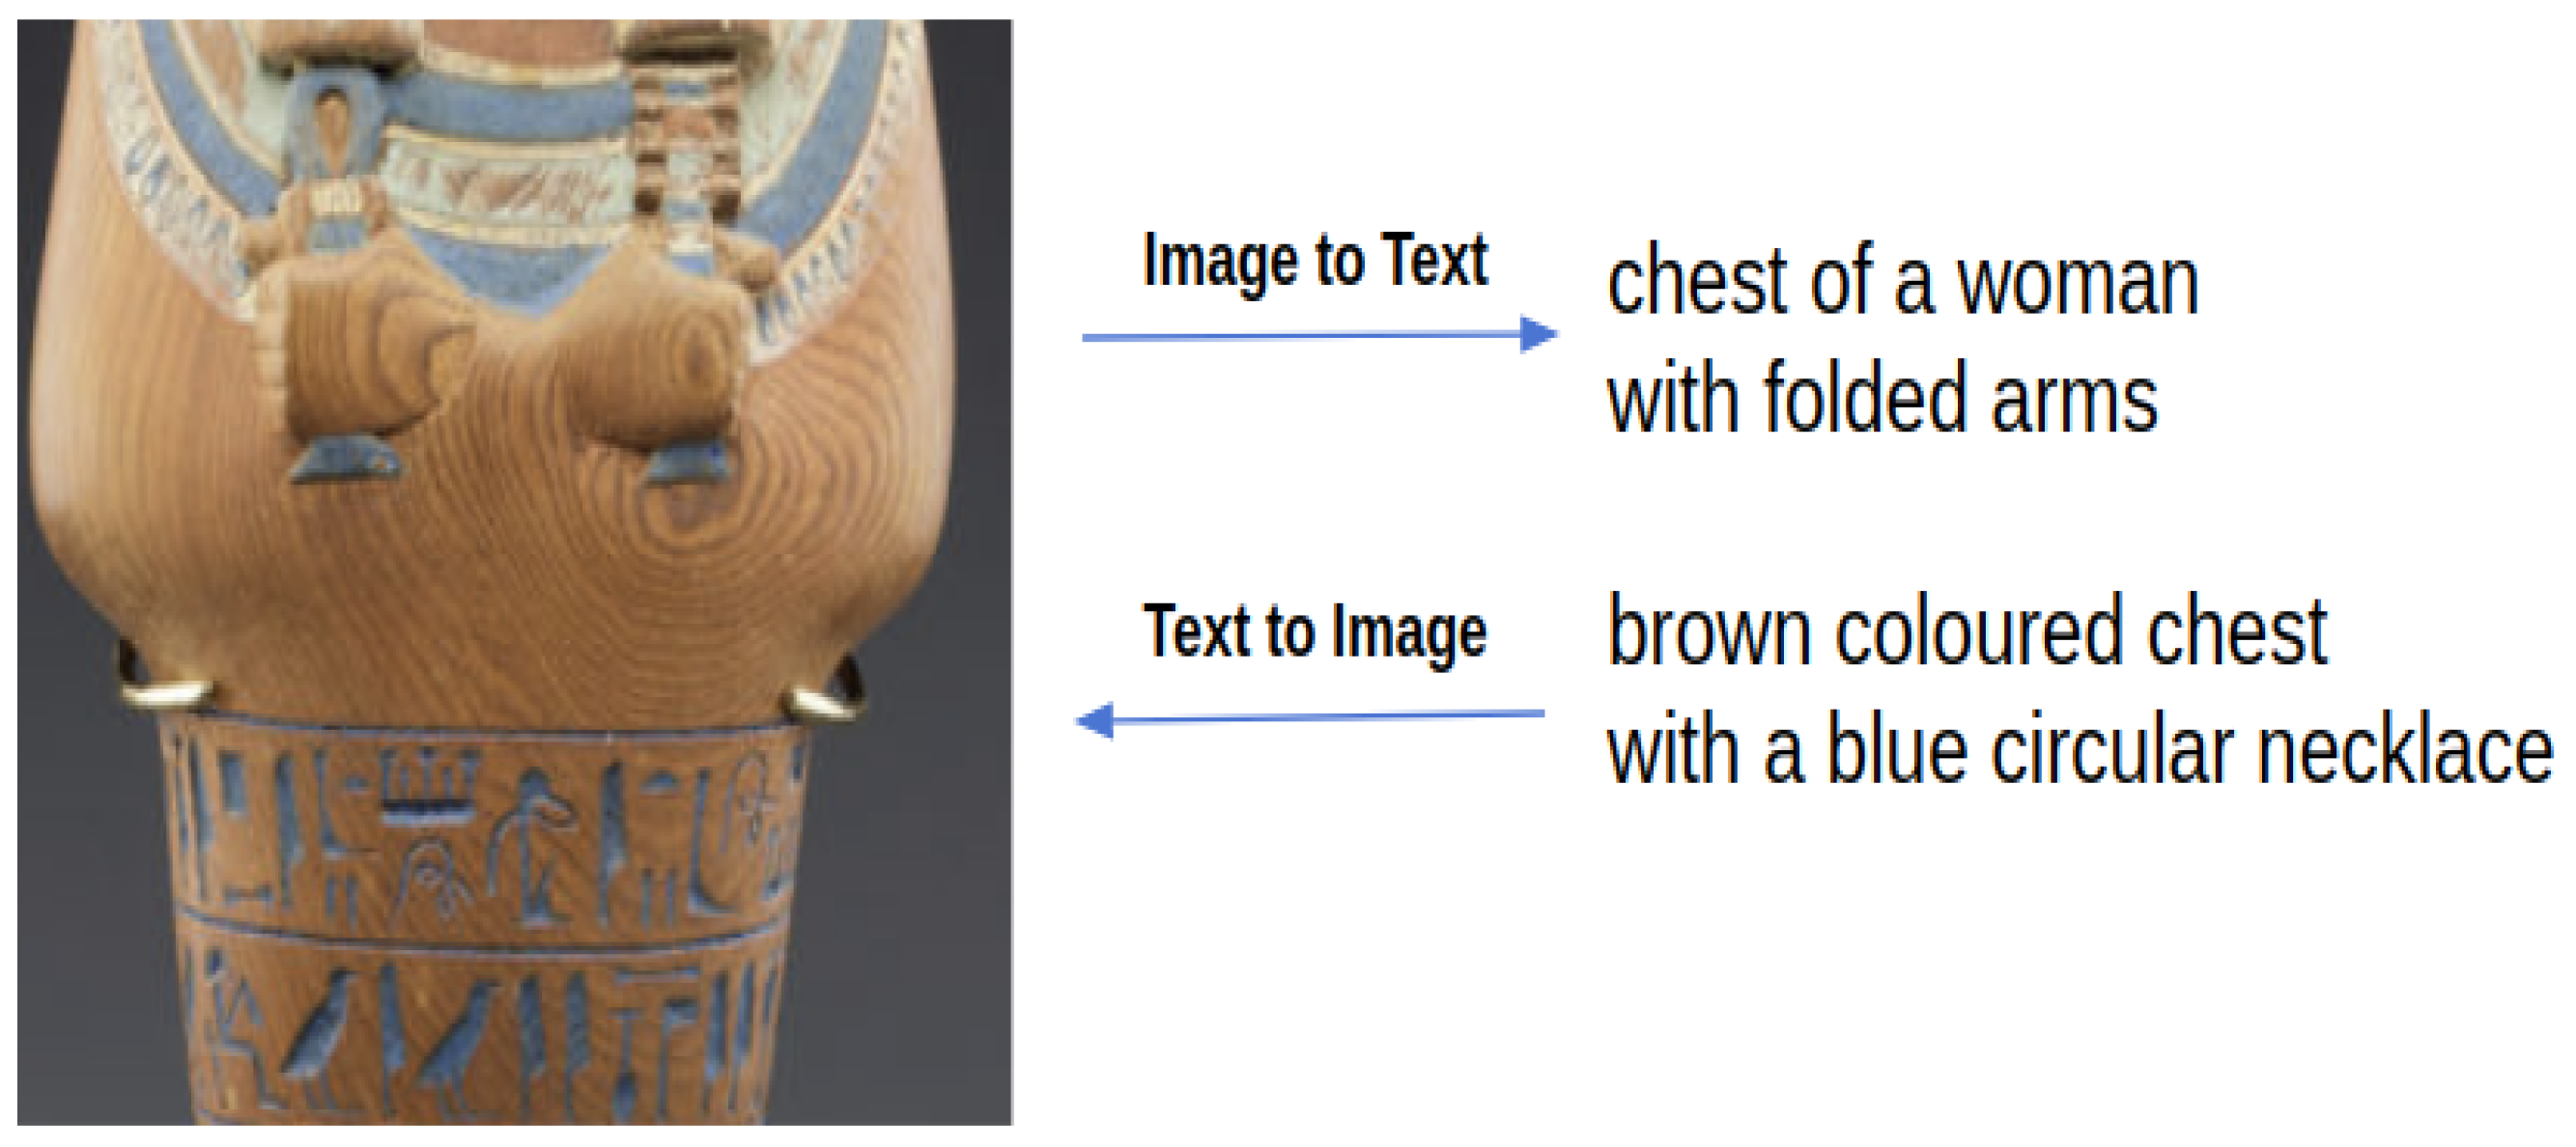
With the rapid progress of digitization, millions of cultural items have been featured on websites such as Europeana (https://www.europeana.eu/en Accessed 20 July 2020) and the online source of the Metropolitan Museum of Art (https://www.metmuseum.org/ Accessed 20 July 2020). In this scenario, the cross-modal search of artwork plays an important role in facilitating the interaction between online art users and cultural objects. In this paper, we focus on the tasks of fine-grained image–text alignment and cross-modal retrieval in the cultural heritage domain. Cross-modal retrieval takes one type of data as the query to retrieve relevant data of another type. Hence, it comprises two tasks: (1) image annotation: given an image fragment of an artwork, we retrieve the relative noun phrases that describe it; (2) image search: given a noun phrase artifact attribute, we retrieve the corresponding image region it specifies. An example is given in Figure 1 to make our tasks more intuitive. Previous works on the cross-modal retrieval of artwork items [1,2,3,4,5] focus on the coarse-grained full-image and text levels, while this work pushes cross-modal retrieval further to the fine-grained fragment level to make it easier for online art users to obtain detailed information on cultural objects. In addition to the benefits for online art users, our research could also assist offline visitors in physical museums by searching the related noun phrases for a picture of an artwork fragment and vice versa. From a technical perspective, the task here also provides an easy way to quantitatively evaluate region-wise alignment for visual and textual data. We can evaluate the alignment performance by performing a fragment-level cross-modal search instead of visualizing the image–text fragment correspondence with attention maps for a small number of examples. We alternately refer to the noun phrases mentioned in this paragraph as textual fragments in the following sections.
Fine-grained cross-modal retrieval for cultural items presents three key domain-specific difficulties that tend to be more challenging than in cases of cross-modal retrieval of natural images [6,7]. First, there are large visual variations in shape, texture, and style among artworks because they tend to have unique meanings. Second, the image fragments in this domain are not as well annotated as the popular Visual Genome dataset [8] that has been frequently used for similar tasks for natural images. Their textual attributes often provide only partial information for an image fragment, leading to information asymmetry between the two modalities. For example, the noun phrases that describe a human face often do not provide full detailed information on the eyes, cheek, ears, etc. This makes it difficult to identify the actual corresponding area between the visual and textual fragments. Last, the text in this domain often involves content inferring historical background or the meaning of an abstract item. This cannot be regarded as directly relevant to the visual patterns in the image fragments.
In this work, we develop a weakly supervised model for the cross-modal retrieval task. During training, we know the ground truth unit-level correspondence but the ground truth fragment-level correspondence is unknown. In other words, we know which set of image fragments and which set of text fragments refer to the same artwork, but within these sets of image fragments and text fragments it is not known which image fragment corresponds with exactly which text fragment. For the purpose of fine-tuning and evaluation, the ground truth fragment-level correspondence between the textual and visual fragments is annotated beforehand for a small set of artworks. We further refer to this small annotated set as the golden set. During training, the input to our model are visual and textual fragment units and the visual and textual fragment units that refer to the same artwork are treated as a positive pair. Technically, the model first represents the visual and textual fragment units as continuous vectors, and then projects them into a shared semantic common space during training. In this shared semantic space, items from the two modalities hold representations with the same dimension and are trained to have similar semantic meanings. We train the model by making the similarity of the positive pair larger in the common space. Later, the model is finetuned on the golden set. The outcome from training is the projection parameters to project new data representations into this common space. In the test phase, we project new fragment vectors to the common space using the learned parameters from training, and then rank the image fragments and noun phrases by their intermodal similarity. To alleviate the difficulties introduced above, we use the attention mechanisms presented in [9] to indicate the importance of a fragment in one modality to the fragments in the other modality when computing the global image–text similarity during training. With this attention-based approach, fragments relevant to the shared semantic space obtain more attention; otherwise they gain less. To further boost the model performance, we propose a simple yet effective indicator function in the text-to-image attention paradigm to remove irrelevant image fragments that might disturb the training process. This indicator function is based on the number of key points extracted from the image fragments using scale-invariant feature transform (SIFT) features, as SIFT is capable of detecting high-contrast points in an image. In addition, we compare and combine our proposed indicator function with the one introduced in [10] to make the study more comprehensive. We also notice that the use of only the fragment-level representation may result in the loss of the context information of a fragment. Therefore, hierarchical encodings are built for the inputs of our model, including encodings for both the visual and textual fragments and for the full images and text. These hierarchical encodings provide an extra optimization to our model. Due to the limited amount of training data, we additionally investigated which augmentation technique from the visual and textual sides could help boost the retrieval performance. Visual augmentation is realized by image fragment transformation, and textual augmentation is conducted based on the synthetic relevance between textual fragments. It is worth noting that although this work focuses on the cultural heritage domain, the proposed techniques are valuable for processing other data such as fashion e-commerce items, food products, etc., where data consist of pairs of images and text that describes item properties that are either shown in the corresponding image or can be inferred from it. In addition, the fragment-oriented cross-modal retrieval techniques in this work would provide more detailed visual/textual data to users in fashion and food domains compared with full image–text retrieval.
Overall, the main contributions of this work are as follows:
- Our approach focuses on the fine-grained cross-modal alignment and retrieval of visual and textual fragments, while previous approaches on artwork item retrieval focus on a coarse level of full images and text.
- We propose a novel indicator function on top of the current text-to-image attention function to remove irrelevant image features when computing image–text similarities. This approach significantly improves the retrieval performance for image annotation.
- We encode the inputs of our alignment model with hierarchical encodings to provide both local information and global context to the model during training. This approach enhances the retrieval ability in both the image search and annotation.
- We investigate multiple visual and textual augmentation techniques and determine the one that is most helpful for our task.
- The proposed alignment and retrieval models are compared with three baseline models. Two of them are state-of-art methods adapted to the fine-grained cross-modal retrieval of cultural items. An extensive analysis of our proposed models and the baseline models is given to guide future research.
2. Related Work
Several studies have contributed to coarse-grained image–text alignment and cross-modal retrieval in the cultural heritage domain [1,2,3,4,5]. These works seek to learn the image–text alignment of artworks by first projecting both the image and text into a common space and then training the models with a semisupervised or supervised approach. In the semisupervised approach, the image–text pairs from a particular source domain, e.g., MSCOCO [11] and Flickr30K [12], are used to train the alignment models with a maximum mean discrepancy (MMD) loss to compare image and text distributions [1,2,3]. Then, the image and text similarity are compared in the target domain in the common space learned from the source domain. In contrast, in the supervised approach, the image–text pairs in the target domain are directly used to train the image–text alignment. The authors of [1] compared two alignment models, one implemented with a supervised approach and the other with a semisupervised approach and determined that the supervised approach was superior. Ref. [4] compared a canonical correlation analysis (CCA) model with a deep learning-based approach to induce a common space and demonstrated that the deep learning-based approach was more effective than the CCA model. No attention mechanisms were applied in the above works. The authors of [5] introduced a new visual-semantic dataset in the cultural heritage domain named ArtPedia, where the sentences are provided with their context. They also built a supervised model on top of the stacked crossed attention image–text matching model (SCAN) proposed in [9] to find word-image correlations using two attention schemes. Based on this pioneering research on image–text alignment for cultural heritage, we adopt a deep learning-based approach to induce the shared common space, but in contrast to previous works, focus on cross-modal retrieval at a fine-grained fragment level.
The authors of [13] built an alignment model using fragment embeddings and aimed to find the latent alignment between the visual and textual fragments. However, they encoded the fragment-level alignment with a multiple-instance learning approach with many statistical constraints and they did not evaluate the retrieval performance on a fragment level; in contrast, we implement attention schemes to model the fragment-level alignment, and our model is graded on visual and textual fragments. The SIFT-based approach, designed to remove irrelevant image fragments in this study, is mainly inspired by the bidirectional focal attention network (BFAN)-based image–text matching model introduced in [10], where the authors proposed removing unrelated visual and textual fragments since these items would disturb the learning process. Their method is based on intramodal similarity and removes the image fragments that are dissimilar to the highly relevant image fragments for a given text. However, this approach could delete useful image fragments when all image fragments of an artwork are relevant to the textual fragments. We therefore propose a SIFT filter approach to remove obviously unrelated image fragments with few high-contrast key points. The hierarchical representation approach that encodes both local and context information of the image and text is derived from the hierarchical question-image coattention model presented in [14], where hierarchical encodings were shown to be helpful in visual question answering (VQA). Different from the hierarchical encodings that are only applied to the textual questions in [14], we create hierarchical representations for both the image and text and use a different approach to produce the text hierarchy.
3. Datasets
The two datasets we use are adapted from the ancient Egyptian and Chinese art image captioning datasets introduced in [15] and we call the adapted datasets Egyptian art alignment dataset and Chinese art alignment dataset further in this paper. For the training and validation sets in our alignment datasets, an image–text pair refers to the visual and textual data on the same artwork. The visual data in this pair are a unit consisting of both the full image of an artwork and the image fragments extracted from this full image. The textual data for an artwork are a unit composed of textual fragments that are either noun phrases or tokens or noun tokens extracted from the original captions in the captioning datasets. The correspondence between the visual and textual fragments in an image–text pair is not known in the two sets. Therefore, we have also built a golden set consisting of image–text fragment pairs for each alignment dataset. The image–text fragment pairs in the golden sets are used to fine-tune and evaluate the models trained on the image–text pairs in the training sets with a 4-fold cross-validation. The textual fragments in a golden set are noun phrases and the image fragments in this set are obtained by manually marking the regions with objects for part of the custom captioning test images. These image fragments correspond to different numbers of manually created ground-truth noun phrases but a noun phrase has only one specified image fragment. A noun phrase refers to only one image fragment because the phrases in the golden set are specific, i.e., a phrase tries to describe all the details of an image fragment and different phrases therefore describe distinct image fragments. Another reason is that our golden set is not large, a noun phrase has higher chance to have multiple corresponding image fragments in a larger dataset.
Table 1 provides statistical information about our training, validation and golden datasets. Table 2 gives statistical information on the textual data regarding three variants in the training sets. The average noun phrase frequency is around 2 for both alignment datasets, which is extremely low. This proves the challenge of our task: learning shared semantics from such data with each noun phrase holding few training examples. The textual descriptions in the Chinese art alignment dataset on average are longer than these in the Egyptian art alignment dataset as we can see in Table 2.
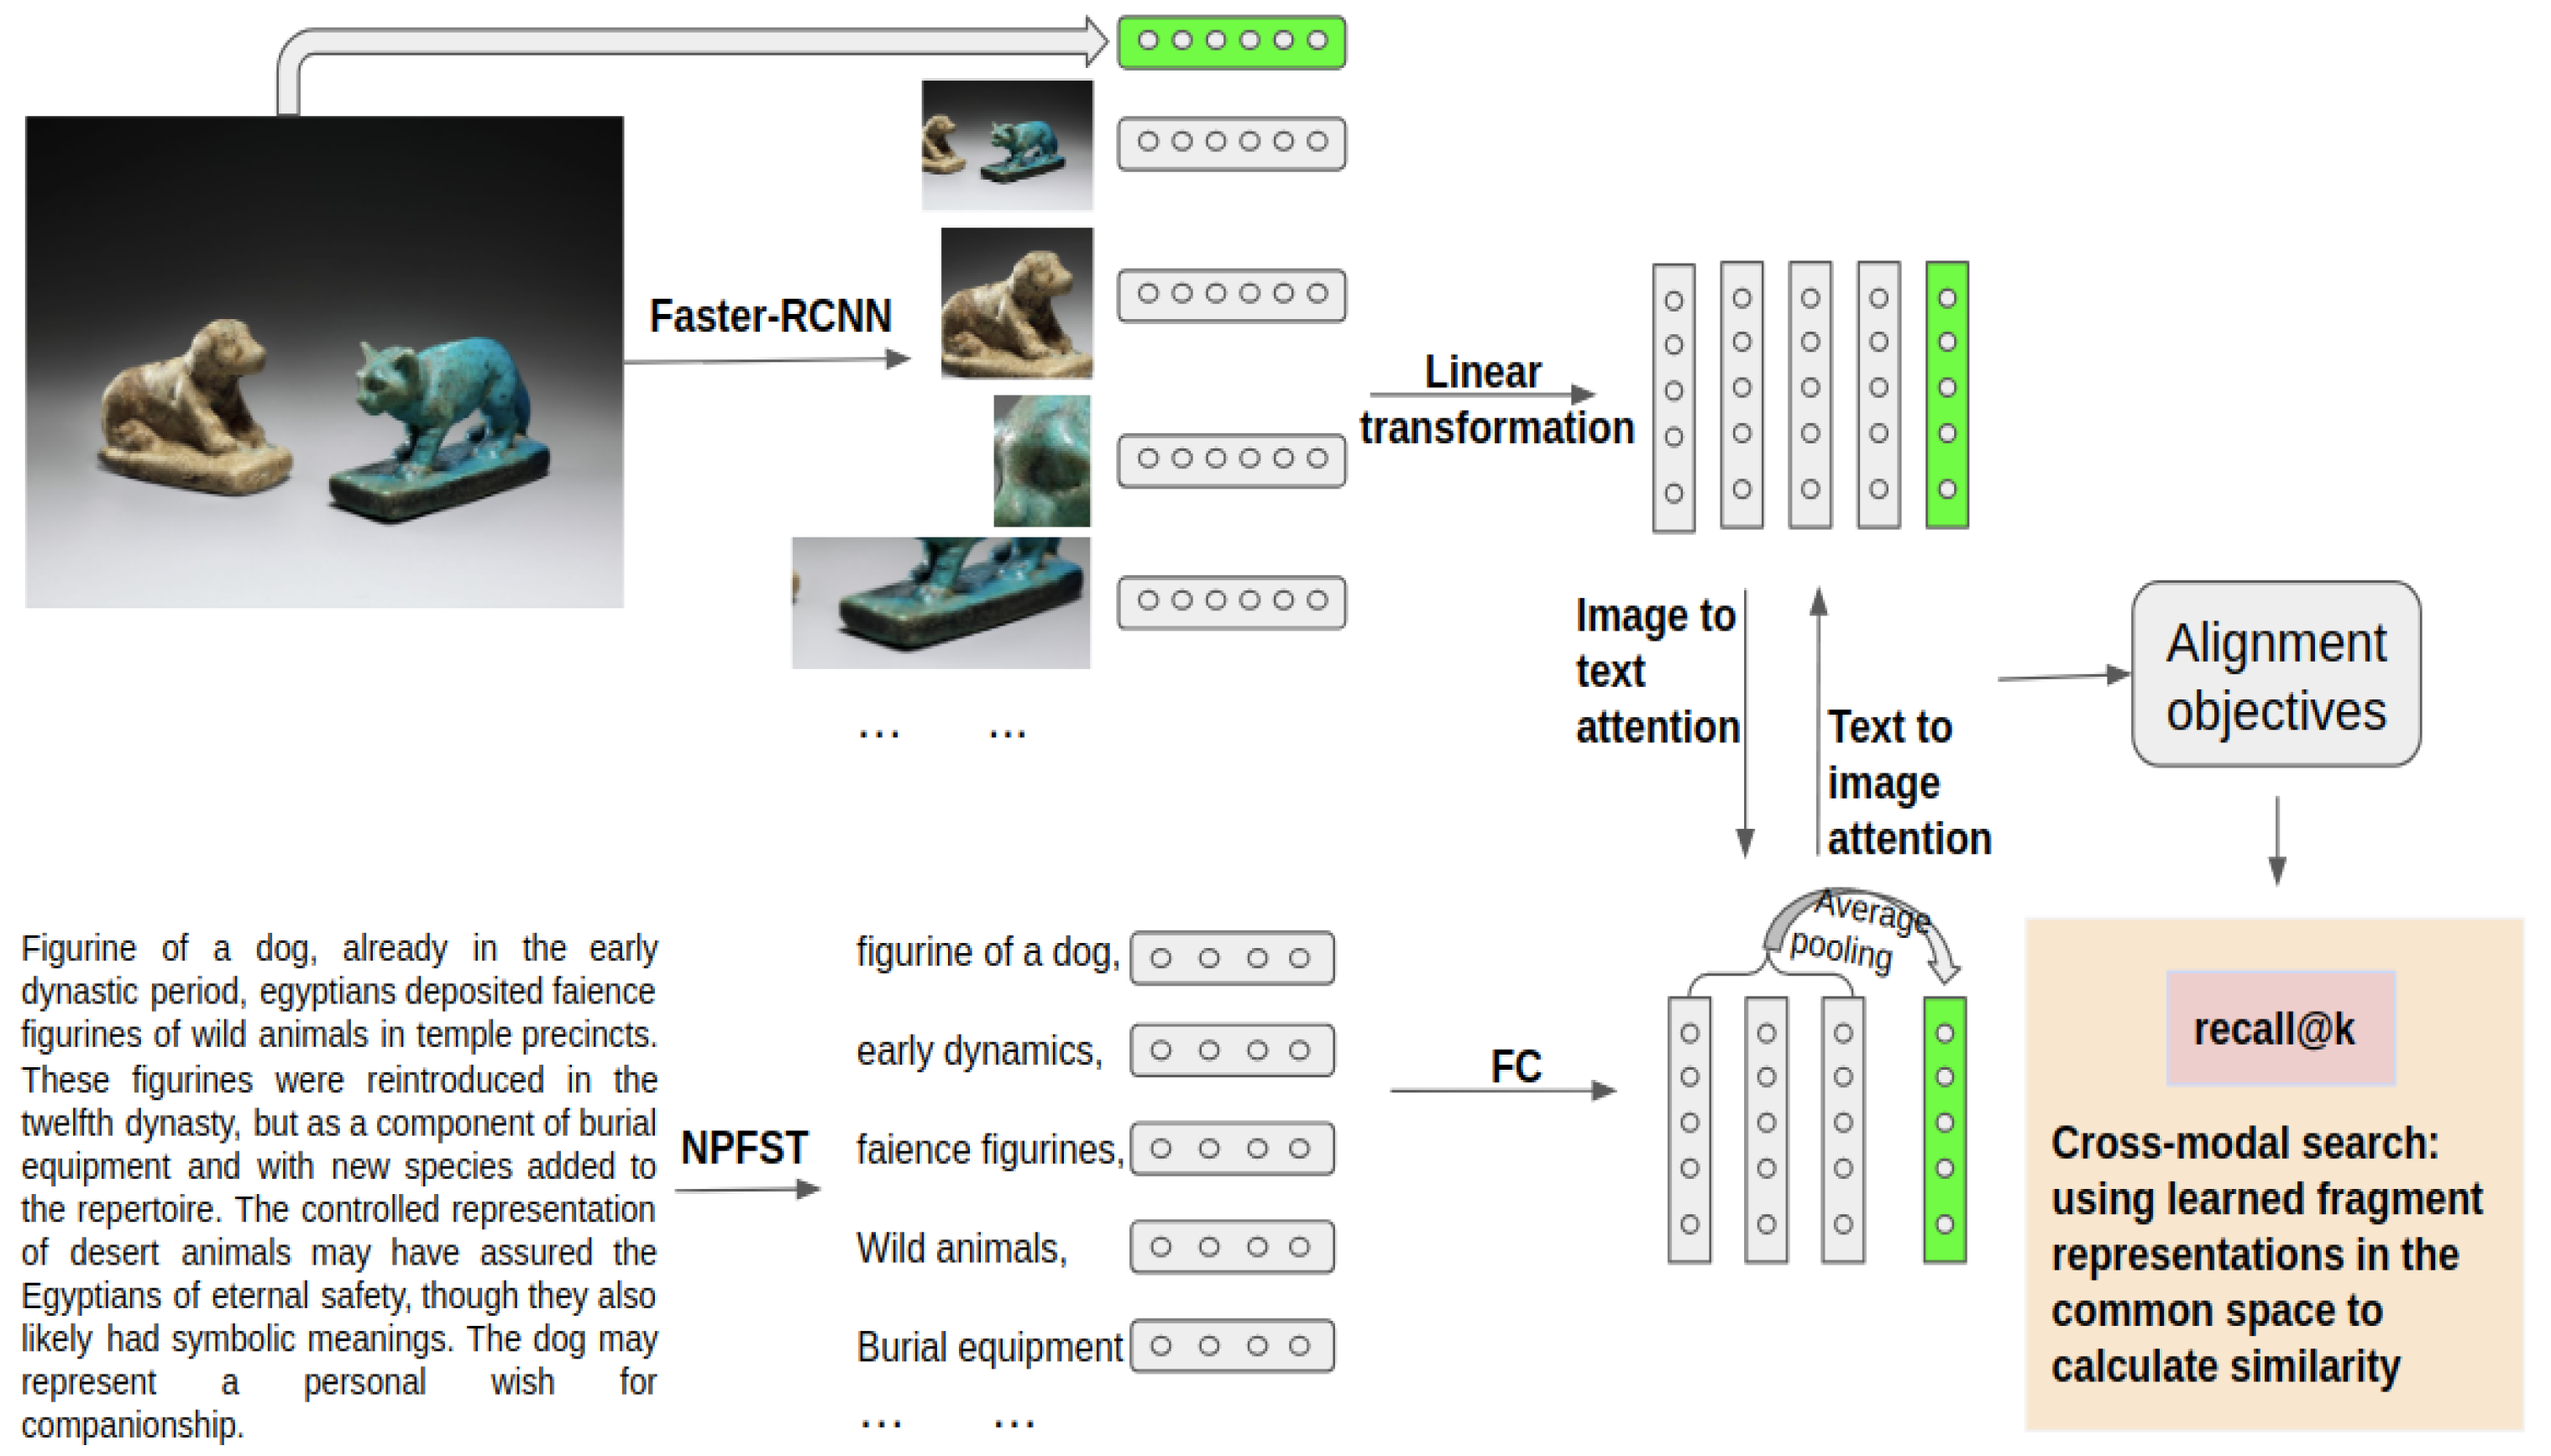
4. Methodology
The training of our alignment model is split into two phases. In the first phase, the model is trained on the image–text pairs in the training set introduced in Section 3, and in the second phase, it is fine-tuned by the image–text fragment pairs in the golden set that is not part of the test set. In this section, we first introduce all the details about the first phase of our model, including how we extract image fragments from an artwork image and the approach used to produce hierarchical representations for the artwork images, the textual fragment extraction methods and the process used to develop hierarchical encodings for the text, and the objectives to align the image–text pairs. We then present the differences between the second and first training phases of the model. Finally, the baseline alignment methods and the cross-modal fragment search method for all the models are described. The model inputs in the first training phase are image–text pairs where both the visual and textual data are represented at two levels. The global level representation encodes the original full image for the visual data and the full textual fragment unit for the textual data. The fragment-level encodings represent the visual and textual fragments as a set of vectors with each vector encoding one fragment. Figure 2 gives an overview of our model framework using noun phrases as the textual fragments in the training set. Symbols used to denote important concepts are summarized in Table 3.
4.1. Image Region Extraction and Representation
We use Faster R-CNN [16] in conjunction with ResNet-101 [17] pretrained on Visual Genome [8] to extract and represent the image fragments in an artwork image following the approach introduced in [18]. Faster R-CNN is a two-stage object detection framework. In the first stage, a grid of anchors tiled in space, scale, and aspect ratio are used to generate bounding boxes, or regions of interest (ROIs), with high objectness scores. The step size for the bounding box generation is 16 pixels in this process. In the second stage, the representations of the ROIs are pooled from the intermediate convolution feature map for region-wise classification and bounding box regression. The multitask loss considering both classification and localization is minimized in both stages. To learn feature representations with rich semantic meaning, the model in [18] predicts attribute classes and instance classes instead of object classes. The instance classes contain objects and other salient information that is difficult to localize, e.g., ‘sky’, ‘grass’, and attributes such as ‘furry’.
Given an artwork image I, its hierarchical representations are , which encode its image fragments, and , which encodes the full original image. and u is the number of image fragments extracted from I. The fragment-level representations ∼ in the training and validation sets are produced by the Faster-RCNN approach introduced above. However, the global-level visual representation is obtained by skipping the first stage and feeding the full image into the second stage because it does not need the bounding box generation portion of the Faster-RCNN approach. We project both representations into a shared common space S of dimension h, i.e.,
with the image projection to the common space.
We additionally explore whether performing visual fragment augmentation with color jitter and Gaussian blur would be beneficial for this task through two approaches: the addition of image fragments transformed from those extracted by Faster-RCNN to the visual data, and the representation of an image fragment and its augmented counterparts as a single representation with average pooling.
4.2. Textual Fragment Extraction and Representation
Given an artwork image caption, we extract the textual fragments in three formats: (1) an ordered sequence of noun phrases; (2) an ordered sequence of tokens without stop words; and (3) an ordered sequence of noun tokens. The NPFST scheme proposed in [19] is adopted to extract noun phrases from the image captions. This approach first uses a part-of-speech tagger to identify the token taggers, and then a finite state transducer is created to extract multiword phrases according to a set of self-defined noun-phrase grammar rules. The approach performs well without configuration on many different kinds of English text. The token set is obtained with tokenization, and the noun tokens are collected with the part-of-speech tagger. We use noun-phrase textual fragments as an example to illustrate our approach further in this paper.
The resulting text for an image description is a sequence T consisting of noun phrases. is the fragment-level representation for T, represents the j-th phrase in T and r is the number of noun phrases in T. ∼ are obtained from the second-to-last hidden layer of the BERT-base model [20] pretrained on Wikipedia data. We project this representation into the common space S using a fully connected layer as follows:
with indicating the phrase projection to the common space. The rectified linear unit (ReLU) in Equation (3) performs the operation . The global-level representation for T in the common space is produced by an average pooling of its phrase representations, as shown in Equation (4).
It is worth noting that the NPFST scheme extracts noun phrases with shared tokens for most captions. For example, for the text Porcelain straight-sided bowl with underglaze blue and overglaze enamels in ‘doucai’ style, NPFST produces the noun phrase set {straight-sided bowl, straight-sided bowl with underglaze blue, bowl with underglaze blue, underglaze blue, overglaze enamels, overglaze enamels in ‘doucai’, enamels in ‘doucai’}, in which different phrases have overlapping tokens. This augments the textual fragment data and can be treated as a similar measure to the image fragment data augmentation performed in the first approach. Similar to the second data augmentation approach performed in the visual part, we also investigate the effect of augmenting the textual data by representing the synthetic relevant phrases introduced above as a single representation. This is realized in two steps: first, we use an unsupervised string kernel method [21] to find a cluster of synthetic relevant noun phrases for T; second, we represent the cluster as an average pooling of its element encodings. We also explore approaches to represent a cluster with the vector encoding of its longest noun phrase.
4.3. Alignment Objectives
With the approaches described in the above two sections, we obtain two levels of representation for an image–text pair from the datasets: global representations and for the image I and text T, respectively; and fragment-level representations for the image I and for the text T in the shared common space. m and n denote the number of visual and textual fragments per artwork in the common space, they have the same values with u and r for the approach without data augmentation. To find the intermodal correspondences, a triplet loss function is created for a custom-level representation as expressed in Equations (5) and (6). The final loss for the neural network is the sum of the two individual losses.
The image–text similarity in the global-level loss function is computed simply by a cosine function, i.e., . In the fragment-level loss function , we adopt two attention schemes to indicate the cross-modal fragment importance when calculating the image–text similarity : image-to-text attention and text-to-image attention. A triplet loss function ensures that the similarity between the image and text referring to the same artworks is larger than that referring to different artworks by a margin . However, instead of considering all the negative text for a given image I, here and consider only the most difficult negative text encoded by and , respectively, in a mini-batch, where = in . Likewise, given a text T, we only consider the most difficult negative image in a mini-batch, which is obtained by = in . and in are derived with the same approach as and , respectively. N in Equations (5) and (6) denotes the number of image–text pairs in the training set, and computes .
4.3.1. Text-to-Image Attention
The text-to-image attention paradigm recomputes the fragment-level image representation for an image I as by attending the importance of the j-th textual fragment in its text into . Specifically, the attended image encoding for an artwork image is a weighted combination of the fragment vectors in as represented in Equation (8). The weight factor indicates the importance of the j-th textual fragment in a text to the i-th image fragment. It is computed in three steps as follows.
- Step one We follow the SCAN model [9] to assign the weights by the approaches expressed in Equations (9) and (10). Equation (9) introduces an adapted softmax function that compares the relevance of text fragment to image fragment with its correlation to all image fragments in the image. This equation is also called the partition function or energy function in some works. Here, is the inversed temperature of the softmax function, and the correlation between and is computed by the approach given in Equation (10), in which is their cosine similarity. It is beneficial to threshold the similarity function score to zero and normalize it with , as described in [9].
- Step two The weights computed in step one consider all image fragments in an image. This is problematic because irrelevant image fragments carrying no information are also incorporated into the computation; these image fragments can mislead the training process and thus decrease the model’s learning performance. Figure 3 gives some examples of image fragments unrelated to any noun phrases. These images either have a uniform color, are very blurred or contain object fragments that are too fine-grained to be expressed. We propose a novel indicator function to remove irrelevant image fragments from the SIFT-based weight computation. Specifically, rather than use SIFT to represent an image fragment as is tradition, we instead use SIFT to build our indicator function according to the number of key points extracted from an image fragment. An image fragment is considered relevant when the number of key points is greater than a threshold z. We define the indicator function for image fragment as in Equation (11). The weight factor obtained from step one is then reassigned by an elementwise product with the indicator function as defined in Equation (12). With this equation, irrelevant regions will not contribute to the representation computation, as their attention score is zero. We call this approach the SIFT filter in the remainder of this paper.
- Step three If application of the SIFT filter is sufficient to remove unrelated image fragments, we simply renormalize the weight obtained from Equation (12) as the final weight for , i.e., . However, if the SIFT filter only removes obviously defective image fragments, we also follow the BFAN model [10] to further clean the image representation computation according to the intramodal similarities between the fragments of an artwork. The intuition behind this idea is that irrelevant fragments always obtain lower importance to the shared semantic meanings than other relevant fragments. The scoring function that evaluates this fragment importance is:where comprises a pairwise function that computes the importance of the target image fragment relative to that of another image fragment for an artwork. is the confidence score for the image fragment being compared. The summation operation compares with all other image fragments for an artwork. We define the pairwise function as and the confidence score as .
Consequently, a fragment evaluated by the scoring function to have high importance is retained for the image representation computation and is otherwise discarded. This yields another indicator function shown in Equation (14). The final weight for is then computed as given in Equation (15):
With the attended image vector for image I computed in Equation (8), we measure its relevance to the j-th text fragment by their cosine similarity, denoted by . Then, the similarity between the image and text to which the textual fragment belongs is calculated by the log-sum function expressed in Equation (16):
where is a factor that magnifies the importance of the most relevant pairs of text phrases and attended image vector .
4.3.2. Image-to-Text Attention
The image-to-text attention paradigm recomputes the fragment-level textual representation of a text as by attending the importance weight of the i-th image fragment in its corresponding image into . More precisely, is a weighted sum of the textual fragment vectors in the fragment representation unit , i.e., , where represents the importance of the i-th image fragment in an image to the j-th noun phrase. is obtained in two steps, where the first is similar to step one in the text-to-image attention subsection. The difference between the steps lies in the normalization approach given in Equation (10). Here, the cosine similarity between an image fragment and a textual fragment is normalized by all image fragments for an artwork. We skip the step to remove obviously defective textual fragments because the noun phrase extraction approach introduced in Section 4.2 is a data cleaning process and helps remove irrelevant textual content. Quantitatively, this process filters out approximately 50% of the tokens in the original captions for the Chinese alignment dataset. Similar to step three in the text-to-image attention paradigm, we further remove the latent unrelated textual fragments based on intramodal similarity by comparing the textual fragments for an artwork.
Given the attended text vector for sequence T, we measure its correlation with the i-th image fragment via their cosine similarity . The similarity between and the image to which belongs is calculated with the following log-sum equation:
4.4. Training Parameters and Model Fine-Tuning
The training parameters in our alignment model are , , , and , introduced in Section 4.1 and Section 4.2. Our model is based on the SCAN or BFAN model but adds global representation and the corresponding objective. We also propose removal of irrelevant image fragments in the text-to-image attention mechanism with the SIFT filter. Since we have tried different combinations of additional approaches, we call our model SCAN_SF_GB if we use both the global representation approach and the SIFT filter on top of SCAN. Likewise, if we use only the global representation method without the SIFT filter, we call our model SCAN_GB, and the model is named SCAN_SF if we use only the SIFT filter and leave out the global representation method. Similar rules are applied to name our models with additional approaches built upon the BFAN model.
We fine-tune and evaluate our alignment models with the image–text fragment pairs in the small golden set with a 4-fold cross-validation. The difference between the fine-tuning and the first training phase is that in the fine-tuning phase, both the visual and textual fragments are manually annotated, while in the first training phase they are extracted with Faster-RCNN and NPFST. The visual fragments in the fine-tuning phase are represented with the approach expressed for the global visual representation in the first phase.
4.5. Baseline Alignment Approaches
We experiment with three baseline image–text alignment approaches adjusted from three existing image–text matching models.
- (1)
- The DeepFrag [13] model consists of a fragment alignment objective and a global ranking objective. The fragment objective adopts a multiple-instance learning method and encourages that the inner product of and is greater than 1 if they are semantically correlated and below −1 otherwise. The global ranking objective is similar to the loss function introduced in Section 4.3, but it sums over the loss between the image/text and all its negative examples instead of only the most difficult negative one. In addition, it considers the image–text similarity as a normalized sum of its fragment similarities calculated by the inner product, and no attention is involved in the objectives. Please refer to [6] for more details.
- (2)
- The SCAN model [9] is different from our approach in two ways, as mentioned in Section 4.3: (1) It utilizes a single-level representation for both the image and the text in an image–text pair and therefore has one corresponding loss function. (2) For the attention schemes introduced in Section 4.3.1, it employs only step one to calculate text-to-image attention and does not filter out irrelevant image fragments.
- (3)
- The BFAN model [10] does not have global-level representations or a SIFT filter to remove irrelevant image fragments.
4.6. Cross-Modal Search
For both the baseline alignment models and our proposed models, we use the inferred intermodal representations obtained from the alignment model for fragment-level image annotation and search. In image annotation, given a query in the form of an image fragment, the models return the p noun phrases that obtain the highest relevance scores with respect to the given image fragment in the learned common space. This is realized by computing the similarities between and all P textual fragments and returning the ones with the top p scores. In image search, we calculate the similarity between a textual fragment and all Q image fragments, and the q image fragments having the highest similarity scores to the given noun phrase are retrieved. There are b different ground-truth noun phrases to an image fragment query, but only one relevant image fragment exists for a given noun phrase query. The relevance between the fragments across modalities in this section is computed with the inner product, as this approach was used to compute the similarity in our first baseline model [13].
5. Experimental Set-Up
The experiments are implemented in Pytorch [22], a widely adopted deep-learning framework. The dimension of the image feature vector is 2048, and the word embedding dimension is 768. This is decided by the neural network structure we use to represent the visual and textual data. The threshold value z of the SIFT filter is 2 in which case most irrelevant image fragments are removed for a random sample set with 200 full images. For the common space representation dimension, we experiment with h = 500, 800, 1000, 1200 and 2000 for model BFAN_SF, and h = 1000 works best. and in the text-to-image and image-to-text attention paradigms are selected with a validation dataset: = 9 and = 6. The Adam optimizer [23] is adopted in the back-propagation process with a learning rate of 0.0002, and no drop out is involved. In the Faster-RCNN model introduced in Section 4.1, we retain the image fragments with the top 10 objectness scores for each artwork image, i.e., . The models are trained on the global image–text pairs in the training sets for 50 epochs and then fine-tuned with the image–text fragment pairs in the golden sets for 20 epochs. The word embeddings are obtained using the bert-as-a-service library (https://github.com/hanxiao/bert-as-service Accessed 4 May 2020), and the image fragments are extracted and represented with Detectron2 (https://github.com/facebookresearch/detectron2 Accessed 6 May 2020), released by Facebook AI Research.
6. Results and Discussion
6.1. Quantitative Results
We use the two golden datasets introduced in Section 3 to evaluate all the models. Since 4-fold cross-validation is applied to make the evaluation, the results showed in this section are averaged ones from the four folds in each alignment dataset. We can see in Table 4 that our proposed alignment and retrieval models outperform all baseline models in both the image annotation and image search tasks. Overall, the models perform better on the Chinese art alignment dataset than on the Egyptian art alignment dataset, which conforms with the captioning models’ behavior when conducted on the two datasets [15] from which our alignment datasets are adapted. This again confirms the conclusion that the annotation data for the Chinese art images are better than those for the Egyptian art images. More concretely, the annotations in the Chinese art alignment dataset are less noisy and contains more detailed and accurate phrases for the artwork images.
6.1.1. Image Annotation
In this task, the BFAN_SF_GB (ens) model is superior to all other models for the Chinese art alignment dataset for most evaluation metrics. It improves the best baseline model BFAN (ens) significantly by 5.7% for recall@10 and by 1.6% for recall@1, which is also promising. For the Egyptian art alignment dataset, the BFAN model with the additional SIFT filter approach, i.e., the BFAN_SF (ens) model, works best. It surpasses the best baseline model, BFAN (ens), by 5.9% for recall@10 and by 1.9% for recall@1. Since the results above indicate an average performance achieved by the four folds in the golden test sets, we conduct the F-test (ANOVA) [24] with a significance level of 0.05 to compare the models’ performance variance for the four folds. In this test, the null hypothesis is that the best working model we propose has the same performance variance on the four folds with regard to the best baseline model, i.e., model BFAN_SF_GB versus model BFAN for the Chinese golden test set, and model BFAN_SF versus model BFAN for the Egyptian golden test set. One model works significantly better than another if its average performance is higher and when there is no obvious performance variance difference between them. Table 5 shows the p-values obtained by the F-test experiments. We can see that none of the p-values are under the significance level of 0.05. This means there is no reason to reject the null hypothesis and we can conclude that for both datasets the best working model performs significantly better than the best baseline model on image annotation. We have also further checked the models’ performance variance listed in the table for the 4-fold cross-validation, and our proposed models have smaller performance variance on most evaluation metrics. Therefore, we argue that the best working models proposed in this paper are more robust than the baseline models.
- (1)
- Comparison of the use of different variants as textual fragment data. Table 6 shows the results achieved by the BFAN_SF (ens) model when different textual formats are used as training data. The performances obtained for the ‘tokens’ and ‘nouns’ variants are very poor. We assume this is the result of the large syntactic gap between the training and test data.
- (2)
- Efficiency of using attention. The results obtained by the model DeepFrag using no attention are lower than all other models with attention to both datasets, as shown in Table 4. This proves the power of the attention schemes in calculating fragment importance. The improvements in recall@1 for the Chinese and Egyptian alignment datasets are 4.1% and 2.1%, respectively.
- (3)
- Effect of the SIFT filter. We check the effect of the SIFT filter by comparing the results obtained by model SCAN_SF (t2i) and the baseline models conducted with the same settings except for the SIFT filter in Table 7. These results show that the SCAN_SF (t2i) model yields better performance on most evaluation metrics for the image annotation task on both datasets. Compared with the best SCAN baseline model (t2i), the SIFT-enhanced model gains 1.2% improvement for the Chinese art alignment dataset and competitive results for the Egyptian art alignment dataset in terms of recall@1. This improvement is more distinct for recall@10, with the largest achievement gain of 2.9% for the Egyptian art alignment dataset. The baseline BFAN (t2i) model also removes irrelevant image fragments in the text-to-image attention mechanism but in a different way, i.e., based on intramodal similarity. It does not have improved performance over SCAN (t2i) but does decrease the recall scores in all rank cut-offs. This implies the difficulty in pursuing a performance increase by filtering out irrelevant image fragments and verifies the excellence of our SIFT filter approach. However, when we combine model SCAN_SF (t2i) and model SCAN (i2t) into the ensemble model SCAN_SF (ens), the advantage of using the SIFT filter approach over the SCAN (ens) approach disappears, as we can see from Table 4. This phenomenon suggests that using a weighted sum for multiple loss functions as expressed in Equation (7) is not optimal when using a fixed weight value for a certain loss. It is very rigid because the weight is the same for all the batches/training samples. However, finding appropriate custom weights for a certain loss with respect to different batches/training samples is very challenging. The SIFT filter also helps when we combine it with the BFAN model, as shown by a comparison of the results obtained by models BFAN_SF (ens) and BFAN (ens) in Table 4.
- (4)
- Effect of the global representation approach. We can compare the models with and without GB in their model names in Table 4 to see the effect of utilizing global image and text representations: model SCAN_GB (ens) versus model SCAN (ens), model SCAN_SF_GB (ens) versus model SCAN_SF (ens), and model BFAN_SF_GB (ens) versus model BFAN_SF (ens). The conclusion for this comparison is that the global representation approach yields performance improvements either on recall@1 or on all evaluation metrics for the Chinese art alignment dataset. However, this is not true for the Egyptian art alignment dataset, probably because the annotation data for Egyptian artwork images are not as good as those of the Chinese artwork images and therefore adding context information using the global representation method could introduce noise into the alignment.
- (5)
- Effect of augmenting the data. Among all the data augmentation approaches we attempted, the image annotation performance was improved only by adding synthetic relevant textual data, i.e., using the textual data extracted from NPFST. This conclusion is derived from the fact that the model using textual fragments obtained from NPFST performs better than that using the longest phrase that represents a cluster of similar phrases obtained with NPFST (see Table 8). Visual augmentation did not improve performance, likely because the augmented fragments did not align with the text any more and thus mislead the training of our model.
6.1.2. Image Search
For this task, our proposed model SCAN_GB outperforms all baseline approaches on most evaluation metrics, but the performance boost is limited. The best performance gains are 0.6% for the Chinese art alignment dataset for recall@10 and 0.6% for the Egyptian art alignment dataset for recall@5 over the corresponding best baseline approach. The improvement for recall@1 is 0.3% for both datasets in this task. This means that only approximately 7 and 8 more textual fragment queries yield correct image fragments for the Chinese art alignment dataset and Egyptian art alignment dataset, respectively, when using our SCAN_GB model than when using the best baseline SCAN model. We conduct the F-test for the proposed best working model versus the best baseline, i.e., model SCAN_GB versus SCAN for both datasets in this task. We take the same approach as in the image annotation task and the resulting p-values are shown in Table 5. The p-value obtained for the Chinese art golden set on recall@10 is marked in bold because it is under the significance level of 0.05. The null hypothesis is rejected in this case and the performance variance difference for model SCAN_GB and SCAN is huge on the four folds in the golden set. Further observation is that the variance value for our model SCAN_GB is 0.7 while for model SCAN, the value is 8.0. Therefore, the proposed best working model in this paper is more stable than the baseline model although the improvement is not large. We can see from Table 7 that model SCAN_SF (t2i) surpasses SCAN (t2i) for the Chinese art alignment dataset by 3.5% for recall @10, while its improvement for the Egyptian art alignment dataset is not obvious, as shown in Table 7. Therefore, the SIFT filter approach is not robust for image search. For the global representation approach, model SCAN_GB (ens) optimizes model SCAN (ens), but model SCAN_SF_GB (ens) cannot compete with model SCAN (ens). Therefore, it is the interplay between the SIFT filter approach and the global representation method in model SCAN_SF_GB (ens) that causes the performance to decrease for the image search task. An empirical assumption regarding the reason why our models were not noticably helpful in the image search task is given in the last paragraph of Section 6.2.
Table 9 gives the evaluation results of the BFAN (i2t) model, which further removes irrelevant texts in the image-to-text attention approach based on intramodal similarity. This approach shows promising improvement in the image annotation task for the Chinese art alignment dataset based on the 2.3% gains in recall@10, but it is not as useful in the image search task for the same dataset. In addition, it does not show any advantage for the Egytian art alignment dataset in either task. We therefore can conclude that the approach utilizing the intramodal similarity to remove irrelevant text and image fragments is not sufficiently robust to optimize the SCAN model with respect to our art data. However, the combination of this approach and our SIFT filter significantly enhances the text retrieval ability of our system for the two alignment datasets, as we can see from the results for model BFAN_SF (ens) in Table 4.
Overall, the scores achieved by our proposed models are impressive given the difficulty of the task. It is also worth noting that recall computed at the cutoff of K items regards a very strict evaluation. Because this evaluation relies on incomplete artwork captions, it might be that we retrieve a noun phrase for an image that is not present in the current incomplete ground-truth reference collection but is actually relevant. The BLEU@N scores [25] compute the n-gram overlaps between two compared texts. The BLEU@N scores obtained by the BFAN_SF model are given in Table 10; the BLEU-1 and BLEU-2 scores are much higher than the recall@1 scores in the image annotation task.
6.2. Qualitative Results
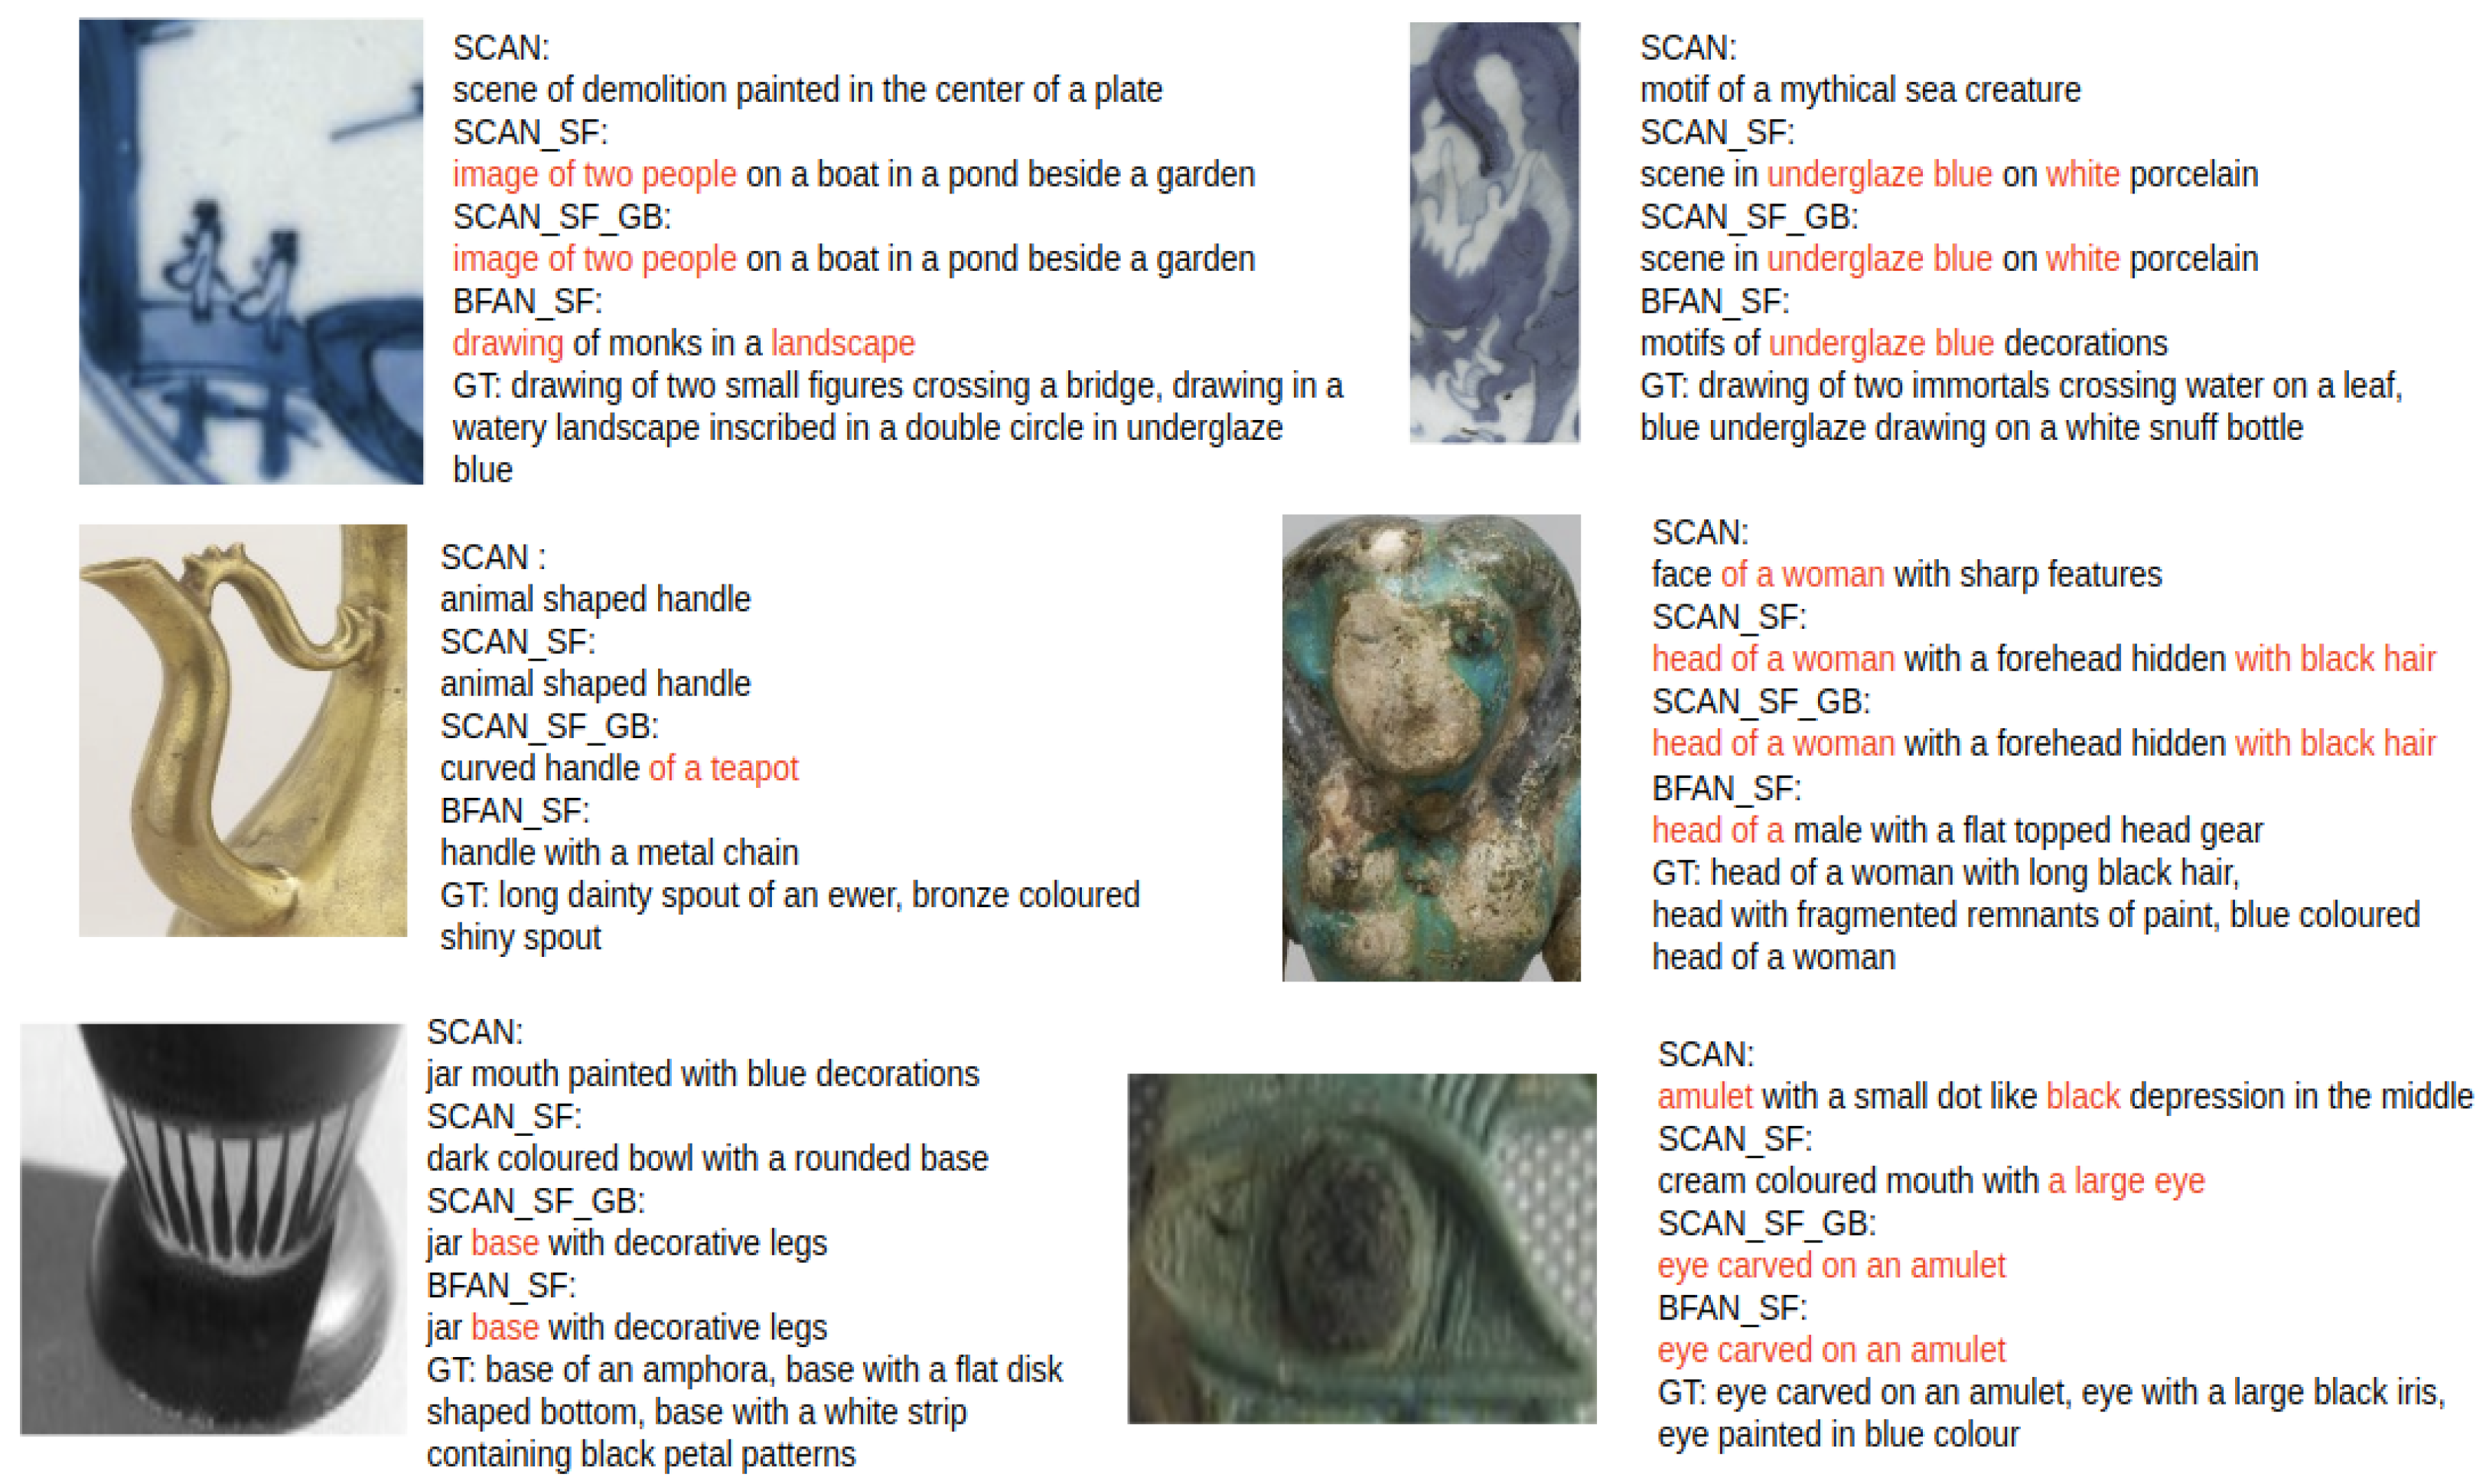
Image annotation. Figure 4 gives the top-1-ranked noun phrases returned by four different models for six images in the image annotation task. The first three images come from the Chinese art alignment dataset, and the last three images are from the Egyptian art alignment dataset. The text in red indicates the shared tokens between the phrases retrieved by the corresponding model and the ground-truth noun phrase expressions. In the first image, the SCAN model retrieves unrelated noun phrases, while the SCAN_SF and SCAN_SF_GB models correctly retrieve the subject of the noun phrase illustrating the image, i.e., ‘two people’. Although the text ‘in a pond besides a garden’ in this example is absent among the ground-truth noun phrase expressions, it seems to correctly describe the image. The BFAN_SF model successfully identifies the first image as a drawing of a landscape. The second picture in the first row shows a similar case to the first image. The noun phrases obtained by our proposed models in this example are actually nice. They might not be accurate enough to illustrate the details of the image, but the content retrieved by models SCAN_SF and SCAN_SF_GB are completely correct. The noun phrases accompanying the remaining four images indicate that our SIFT filter approach helps to identify the noun phrases with an appropriate subject for an image. Regarding the influence of the global representation approach, we can check its effects by examining the first example in the second row and the last two examples. For the first image in the second row, all four models retrieved the token ‘handle’ due to the similar shape between a handle and the spout, but the SCAN_SF_GB model also provides a description of the full picture to some extent, mentioning that the handle is that of a teapot. We can also detect this effect of the global representation approach from the noun phrases retrieved for the last image. The noun phrase retrieved by model SCAN_SF correctly identifies the subject ‘eye’ for the image query, unlike model SCAN. The SCAN_SF_GB model further improves over SCAN and detects that the eye is carved on an amulet. Overall, these examples show the qualitative improvements made by our proposed model. It should be noted that the actual evaluation results for the image annotation might be higher than those reported in Section 6.1.
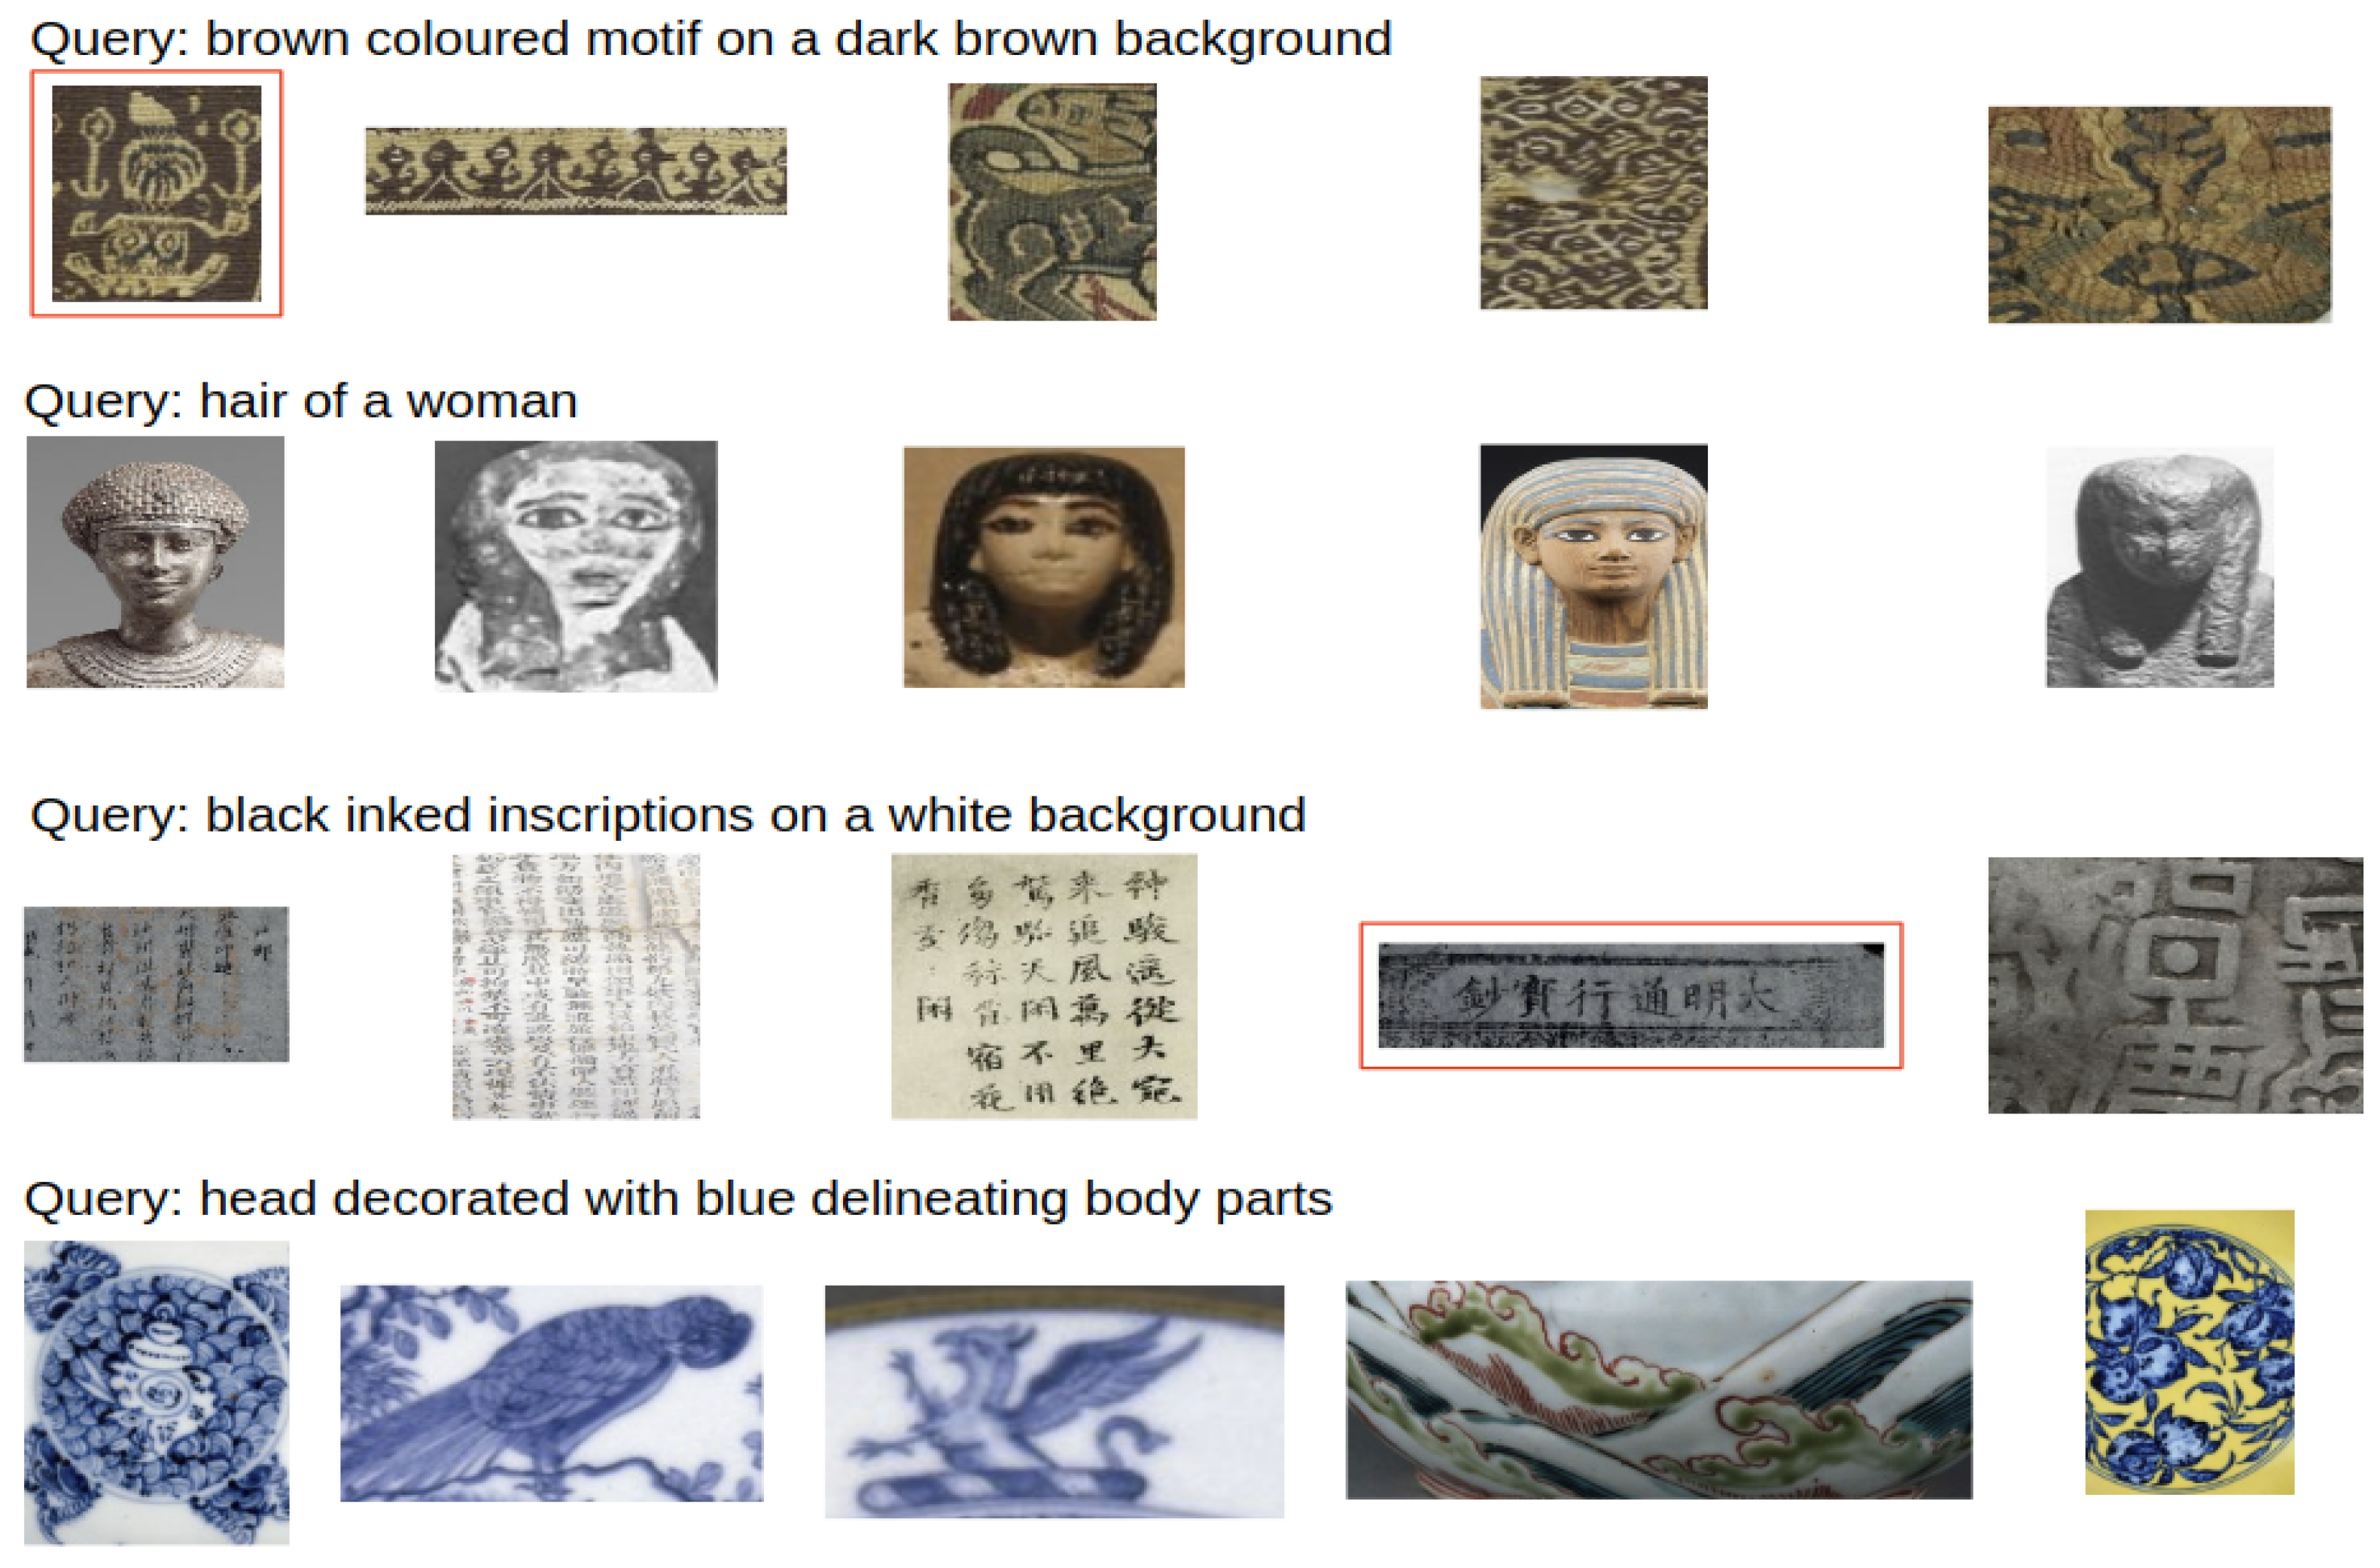
Image search. Figure 5 shows four text queries and their top-5-ranked images found by our proposed SCAN_GB model in the image search task. The first two images come from the Egyptian art alignment dataset, and the remaining two images are from the Chinese art alignment dataset. The rectangular box in red indicates the ground-truth image for a noun phrase expression. In the first example, we can see that the ground-truth image is ranked first, while the remaining four images have similar colors as those of the ground-truth image. For the second text query ‘hair of a woman’, none of the retrieved images is among the ground-truth images, but they all have the hair of a woman no matter the color of the hair. The fourth image for the third query ‘black inked inscriptions on a white background’ is the ground-truth, but we argue that the top-3-ranked images are also correct if we consider only the query. For the last query ‘head decorated with blue delineating body parts’, our model does not manage to retrieve the appropriate image, but most of the retrieved images correctly display the color asked by the query. Therefore, it is possible that the evaluation results reported for the image search might be below the actual performance.
We also manually checked 30 examples for which the performance of model SCAN_GB surpasses that of model SCAN_SF_GB in the image search task. The goal is to determine why the interplay of the SIFT filter and the global representation method decreases the performance of model SCAN, as mentioned in Section 6.1.2. One clue we found is that the images that are incorrectly ranked at the top of the answer list from model SCAN_SF_GB have overlapping word tokens in their noun phrases with respect to the query text. Therefore, compared with model SCAN, model SCAN_SF_GB is unable to distinguish images with shared tokens. With the SIFT filter, the model discards irrelevant image fragments, i.e., noise, and then the global representation approach provides the context of a noun phrase. In such circumstances, it is more confusing for the model to identify the correct image fragment related to a given text query. For example, finding the alignment between the textual phrase ‘a large eye’ as a local noun phrase and its image fragment is much easier than adding the phrase ‘an eye carved on an amulet’ because the extra text ‘on an amulet’ could induce more clean and partially relevant image fragments. This might also be the reason why the performance improvement obtained by our model for the image search task is not as obvious as in the image annotation task.
7. Conclusions
In this paper, we introduced a weakly supervised image–text alignment and retrieval model in the cultural heritage domain. In this model, we adopted different indicator functions to remove irrelevant image features when computing image–text similarity: an existing intramodal similarity-based indicator function and a novel SIFT-based indicator function. We also performed experiments with the intramodal similarity-based indicator function to remove unrelated text during image–text similarity calculation. Different from previous cross-modal retrieval methods using a single global- or fragment-level representation, we integrated hierarchical encodings representing local and context information for both image and text into our models. Experiments demonstrated that the proposed alignment and retrieval models outperform state-of-the-art models adapted to this image annotation task. The image search results can be further improved, which will be the focus of our future work. We can additionally expand our model to a joint multitask learning model [26] with image captioning and explore the captioning of image fragments in the cultural heritage domain.
Author Contributions
Conceptualization, S.S. and M.-F.M.; methodology, S.S. and K.L.; software, S.S.; validation, S.S.; formal analysis, S.S.; investigation, S.S. and K.L.; resources, S.S.; data curation, S.S.; writing—original draft preparation, S.S.; writing—review and editing, K.L., L.V.G. and M.-F.M.; visualization, S.S.; supervision, M.-F.M. and L.V.G.; project administration, M.-F.M.; funding acquisition, M.-F.M. All authors have read and agreed to the published version of the manuscript.
Funding
This research was funded by the project MARVEL (Mobile Augmented Reality and Vocal Explanations for Landmarks and visual arts—RUN Financing KU Leuven). The second author is supported by a grant of the Research Foundation—Flanders (FWO) no. 1S55420N.
Institutional Review Board Statement
Not applicable.
Informed Consent Statement
Not applicable.
Data Availability Statement
Data is contained within the article.
Conflicts of Interest
The authors declare no conflict of interest.
References
- Baraldi, L.; Cornia, M.; Grana, C.; Cucchiara, R. Aligning text and document illustrations: Towards visually explainable digital humanities. In Proceedings of the 24th International Conference on Pattern Recognition, Beijing, China, 20–24 August 2018; pp. 1097–1102. [Google Scholar]
- Carraggi, A.; Cornia, M.; Baraldi, L.; Cucchiara, R. Visual-Semantic Alignment Across Domains Using a Semi-Supervised Approach. In Proceedings of the European Conference on Computer Vision Workshops, Munich, Germany, 8–14 September 2018; pp. 625–640. [Google Scholar]
- Cornia, M.; Stefanini, M.; Baraldi, L.; Corsini, M.; Cucchiara, R. Explaining digital humanities by aligning images and textual descriptions. Pattern Recognit. Lett. 2020, 129, 166–172. [Google Scholar] [CrossRef]
- Garcia, N.; Vogiatzis, G. How to read paintings: Semantic art understanding with multi-modal retrieval. In Proceedings of the European Conference in Computer Vision Workshops, Munich, Germany, 8–14 September 2018; pp. 676–691. [Google Scholar]
- Stefanini, M.; Cornia, M.; Baraldi, L.; Corsini, M.; Cucchiara, R. Artpedia: A new visual-semantic dataset with visual and contextual sentences in the artistic domain. In Proceedings of the International Conference on Image Analysis and Processing, Trento, Italy, 9–13 September 2019; pp. 729–740. [Google Scholar]
- Karpathy, A.; Fei-Fei, L. Deep visual-semantic alignments for generating image descriptions. In Proceedings of the IEEE Conference on Computer Vision and Pattern Recognition, Boston, MA, USA, 7–12 June 2015; pp. 3128–3137. [Google Scholar]
- Zhen, L.; Hu, P.; Wang, X.; Peng, D. Deep supervised cross-modal retrieval. In Proceedings of the IEEE Conference on Computer Vision and Pattern Recognition, Long Beach, CA, USA, 15–20 June 2019; pp. 10394–10403. [Google Scholar]
- Krishna, R.; Zhu, Y.; Groth, O.; Johnson, J.; Hata, K.; Kravitz, J.; Chen, S.; Kalantidis, Y.; Li, L.J.; Shamma, D.A.; et al. Visual Genome: Connecting language and vision using crowdsourced dense image annotations. Int. J. Comput. Vis. 2017, 123, 32–73. [Google Scholar] [CrossRef] [Green Version]
- Lee, K.H.; Chen, X.; Hua, G.; Hu, H.; He, X. Stacked cross attention for image–text matching. In Proceedings of the European Conference on Computer Vision, Munich, Germany, 8–14 September 2018; pp. 201–216. [Google Scholar]
- Liu, C.; Mao, Z.; Liu, A.A.; Zhang, T.; Wang, B.; Zhang, Y. Focus Your Attention: A Bidirectional Focal Attention Network for image–text Matching. In Proceedings of the 27th ACM International Conference on Multimedia, Nice, France, 21–25 October 2019; pp. 3–11. [Google Scholar]
- Lin, T.Y.; Maire, M.; Belongie, S.; Hays, J.; Perona, P.; Ramanan, D.; Dollár, P.; Zitnick, C.L. Microsoft COCO: Common objects in context. In Proceedings of the European Conference on Computer Vision, Zurich, Switzerland, 6–12 September 2014; pp. 740–755. [Google Scholar]
- Young, P.; Lai, A.; Hodosh, M.; Hockenmaier, J. From image descriptions to visual denotations: New similarity metrics for semantic inference over event descriptions. Trans. Assoc. Comput. Linguist. 2014, 2, 67–78. [Google Scholar] [CrossRef]
- Karpathy, A.; Joulin, A.; Fei-Fei, L.F. Deep fragment embeddings for bidirectional image sentence mapping. In Proceedings of the Advances in Neural Information Processing Systems, Montreal, QC, USA, 8–13 December 2014; pp. 1889–1897. [Google Scholar]
- Lu, J.; Yang, J.; Batra, D.; Parikh, D. Hierarchical Question-Image Co-Attention for Visual Question Answering. In Proceedings of the Advances in Neural Information Processing Systems, Barcelona, Spain, 5–10 December 2016; pp. 289–297. [Google Scholar]
- Sheng, S.; Moens, M.F. Generating captions for images of ancient artworks. In Proceedings of the 27th ACM International Conference on Multimedia, Nice, France, 21–25 October 2019. [Google Scholar]
- Ren, S.; He, K.; Girshick, R.; Sun, J. Faster R-CNN: Towards real-time object detection with region proposal networks. In Proceedings of the Advances in Neural Information Processing Systems, Montreal, QC, USA, 7–12 December 2015; pp. 91–99. [Google Scholar]
- He, K.; Zhang, X.; Ren, S.; Sun, J. Deep residual learning for image recognition. In Proceedings of the IEEE Conference on Computer Vision and Pattern Recognition, Las Vegas, NV, USA, 27–30 June 2016; pp. 770–778. [Google Scholar]
- Anderson, P.; He, X.; Buehler, C.; Teney, D.; Johnson, M.; Gould, S.; Zhang, L. Bottom-up and top-down attention for image captioning and visual question answering. In Proceedings of the IEEE Conference on Computer Vision and Pattern Recognition, Salt Lake City, UT, USA, 18–23 June 2018; pp. 6077–6086. [Google Scholar]
- Handler, A.; Denny, M.; Wallach, H.; O’Connor, B. Bag of what? simple noun phrase extraction for text analysis. In Proceedings of the First Workshop on NLP and Computational Social Science, Austin, TX, USA, 1–5 November 2016; pp. 114–124. [Google Scholar]
- Devlin, J.; Chang, M.W.; Lee, K.; Toutanova, K. BERT: Pre-training of deep bidirectional transformers for language understanding. arXiv 2018, arXiv:1810.04805. [Google Scholar]
- Lodhi, H.; Saunders, C.; Shawe-Taylor, J.; Cristianini, N.; Watkins, C. Text classification using string kernels. J. Mach. Learn. Res. 2002, 2, 419–444. [Google Scholar]
- Ketkar, N. Introduction to pytorch. In Deep Learning with Python; Apress: New York, NY, USA, 2017; pp. 195–208. [Google Scholar]
- Kingma, D.P.; Ba, J. Adam: A method for stochastic optimization. arXiv 2014, arXiv:1412.6980. [Google Scholar]
- Cuevas, A.; Febrero, M.; Fraiman, R. An anova test for functional data. Comput. Stat. Data Anal. 2004, 47, 111–122. [Google Scholar] [CrossRef]
- Papineni, K.; Roukos, S.; Ward, T.; Zhu, W.J. BLEU: A method for automatic evaluation of machine translation. In Proceedings of the 40th Annual Meeting on Association for Computational Linguistics, Philadelphia, PA, USA, 7–12 July 2002; pp. 311–318. [Google Scholar]
- Ruder, S. An overview of multi-task learning in deep neural networks. arXiv 2017, arXiv:1706.05098. [Google Scholar]
Figure 1.
Our system performs two cross-modal tasks: image annotation and image search.

Figure 2.
Overview of the model framework using noun phrases as the textual fragment training data. The vectors in gray are representations that encode the image and text fragments, and those in green are global representations that encode full images and text.
Figure 2.
Overview of the model framework using noun phrases as the textual fragment training data. The vectors in gray are representations that encode the image and text fragments, and those in green are global representations that encode full images and text.

Figure 3.
Four exemplary non-informative image fragments from the training set obtained by the Faster-RCNN approach.
Figure 3.
Four exemplary non-informative image fragments from the training set obtained by the Faster-RCNN approach.

Figure 4.
Top-1 ranked noun phrases for six images returned by four different models.

Figure 5.
Top-5 ranked images for four noun phrases returned by model SCAN_GB.


Table 1.
Statistics of the alignment datasets: Num.atks (number of artworks), Num.frags (number of image fragments), Num.phrs (number of unique phrases extracted from the captions), Num.tks (number of tokens extracted from the captions) and Num.nns (number of nouns extracted from the captions). ‘-’ means calculation not applicable.
| Split | Num.atks | Num.frags | Num.phrs | Num.tks | Num.nns |
|---|---|---|---|---|---|
| Chinese art alignment dataset | |||||
| Train | 6086 | 6086 × 10 | 43,212 | 8592 | 4765 |
| Val | 761 | 761 × 10 | 7095 | 2855 | 1555 |
| Golden | 500 | 1134 | 2234 | - | - |
| Egyptian art alignment dataset | |||||
| Train | 14,352 | 14,352 × 10 | 60,805 | 13,420 | 7598 |
| Val | 1795 | 1795 × 10 | 11,105 | 5246 | 2890 |
| Golden | 536 | 1225 | 2724 | - | - |
Table 2.
Statistics of the textual fragments in the training set with respect to three variants: Aver.frq (average frequency), Aver.snt.len (the average text length measured by number of tokens per text in the training set), Std.snt.len (standard deviation of the text length), Frq ≥ 10 (percentage of the occurrence more than or equals 10 times), and Frq ≥ 5 (ratio of the appearance more than or equals 5 times).
| Variants | Aver.frq | Aver.snt.len | Std.snt.len | Frq ≥ 10 | Frq ≥ 5 |
|---|---|---|---|---|---|
| Chinese art alignment dataset | |||||
| Phrases | 1.9 | 13.2 | 13.7 | 1.6% | 3.9% |
| Tokens | 13.1 | 18.5 | 17.0 | 15.8% | 26.2% |
| Nouns | 11.2 | 8.7 | 7.0 | 14.6% | 25.1% |
| Egyptian art alignment dataset | |||||
| Phrases | 2.1 | 8.7 | 15.1 | 2.2% | 6.6% |
| Tokens | 14.2 | 13.3 | 23.8 | 21.5% | 33.8% |
| Nouns | 12.1 | 6.4 | 9.8 | 19.5% | 31.9% |
Table 3.
Symbol table in alphabetic order.
| Dimension of the visual input space | |
| h | Dimension of the common space |
| Dimension of the textual input space | |
| Vector representation of a textual fragment | |
| A matrix of n textual fragment vector representations | |
| Vector representation of a textual fragment in the common space | |
| Attended vector representation of a textual fragment | |
| Vector representation of a textual fragment unit in the common space | |
| A matrix of n textual embeddings in the common space | |
| Vector representation of an artwork image fragment | |
| A matrix of m image fragment vector representations | |
| Vector representation of a full artwork image | |
| Vector representation of an artwork image fragment in the common space | |
| Attended vector representation of an artwork image fragment | |
| Vector representation of a full artwork image in the common space | |
| A matrix of m image embeddings in the common space | |
| A weight matrix that projects a visual input vector to the common space | |
| A weight matrix that projects a textual input vector to the common space |
Table 4.
Evaluation results obtained from testing models with the two alignment datasets using noun phrases as textual fragments in the training set. (ens) means that the model used both the image-to-text and text-to-image attentions. r@k stands for recall@k.
Table 4.
Evaluation results obtained from testing models with the two alignment datasets using noun phrases as textual fragments in the training set. (ens) means that the model used both the image-to-text and text-to-image attentions. r@k stands for recall@k.
| Model | Image Annotation | Image Search | ||||
|---|---|---|---|---|---|---|
| r@1 | r@5 | r@10 | r@1 | r@5 | r@10 | |
| Chinese art alignment dataset | ||||||
| DeepFrag [13] | 5.0 | 23.1 | 36.2 | 6.0 | 20.3 | 34.0 |
| SCAN [9] (ens) | 6.8 | 28.0 | 41.4 | 8.6 | 29.2 | 43.5 |
| BFAN [10] (ens) | 7.5 | 26.6 | 43.3 | 7.2 | 23.9 | 38.5 |
| SCAN_SF (ens) | 7.0 | 24.1 | 38.2 | 8.1 | 28.2 | 43.6 |
| SCAN_GB (ens) | 7.4 | 26.7 | 41.7 | 8.9 | 29.6 | 44.2 |
| SCAN_SF_GB (ens) | 8.3 | 28.4 | 45.1 | 8.1 | 26.7 | 41.4 |
| BFAN_SF (ens) | 9.1 | 31.0 | 47.8 | 7.6 | 27.8 | 43.0 |
| BFAN_SF_GB (ens) | 9.0 | 31.7 | 49.0 | 8.6 | 27.3 | 42.7 |
| Egyptian art alignment dataset | ||||||
| DeepFrag [13] | 5.2 | 16.6 | 29.0 | 3.6 | 13.2 | 22.0 |
| SCAN [9] (ens) | 5.0 | 18.2 | 30.5 | 6.1 | 21.2 | 33.7 |
| BFAN [10] (ens) | 5.4 | 20.5 | 33.7 | 5.4 | 19.2 | 30.7 |
| SCAN_SF (ens) | 5.2 | 18.2 | 30.5 | 6.3 | 21.5 | 32.9 |
| SCAN_GB (ens) | 5.2 | 17.9 | 30.2 | 6.4 | 21.8 | 33.7 |
| SCAN_SF_GB (ens) | 4.8 | 18.3 | 31.1 | 6.0 | 20.6 | 33.1 |
| BFAN_SF (ens) | 7.3 | 25.1 | 39.6 | 6.2 | 21.3 | 33.2 |
| BFAN_SF_GB (ens) | 5.4 | 20.6 | 34.6 | 5.2 | 19.3 | 30.9 |
Table 5.
p-values obtained by the F-test regarding different model comparisons. From left to right in a row, the p-values correspond to r@1, r@5 and r@10 respectively for a certain task.
Table 5.
p-values obtained by the F-test regarding different model comparisons. From left to right in a row, the p-values correspond to r@1, r@5 and r@10 respectively for a certain task.
| Model Comparison | Image Annotation | Image Search | ||||
|---|---|---|---|---|---|---|
| Chinese art dataset | BFAN vs. BFAN_SF_GB | SCAN vs. SCAN_GB | ||||
| 0.70 | 0.06 | 0.07 | 0.74 | 0.19 | 0.03 | |
| Egyptian art dataset | BFAN vs. BFAN_SF | SCAN vs. SCAN_GB | ||||
| 0.89 | 0.63 | 0.35 | 0.39 | 0.37 | 0.85 | |
Table 6.
Comparison of the model results obtained using different variants as textual fragment data for the BFAN_SF (ens) model tested with the Chinese art alignment dataset.
Table 6.
Comparison of the model results obtained using different variants as textual fragment data for the BFAN_SF (ens) model tested with the Chinese art alignment dataset.
| Variants | Image Annotation | Image Search | ||||
|---|---|---|---|---|---|---|
| r@1 | r@5 | r@10 | r@1 | r@5 | r@10 | |
| Tokens | 0.3 | 1.7 | 2.7 | 0.3 | 1.8 | 3.5 |
| Nouns | 0.5 | 2.4 | 3.5 | 0.4 | 1.7 | 3.4 |
| Phrases | 9.1 | 31.0 | 47.8 | 7.6 | 27.8 | 43.0 |
Table 7.
Evaluation results for the *(t2i) models.
| Model | Image Annotation | Image Search | ||||
|---|---|---|---|---|---|---|
| r@1 | r@5 | r@10 | r@1 | r@5 | r@10 | |
| Chinese art alignment dataset | ||||||
| SCAN [9] (t2i) | 6.0 | 24.6 | 41.2 | 6.9 | 25.0 | 38.4 |
| BFAN [10] (t2i) | 4.6 | 17.6 | 28.4 | 4.5 | 17.0 | 27.4 |
| SCAN_SF (t2i) | 7.2 | 25.2 | 40.1 | 8.1 | 28.5 | 43.2 |
| Egyptian art alignment dataset | ||||||
| SCAN [9] (t2i) | 5.0 | 19.2 | 30.4 | 5.6 | 20.1 | 32.1 |
| BFAN [10] (t2i) | 3.1 | 13.4 | 20.8 | 3.0 | 11.3 | 18.9 |
| SCAN_SF (t2i) | 5.0 | 20.1 | 33.3 | 6.0 | 19.6 | 32.3 |
Table 8.
Evaluation of the BFAN_SF (ens) model tested with the Chinese alignment dataset when using the text data obtained from NPFST versus the longest phrase in a cluster of similar phrases obtained with NPFST.
Table 8.
Evaluation of the BFAN_SF (ens) model tested with the Chinese alignment dataset when using the text data obtained from NPFST versus the longest phrase in a cluster of similar phrases obtained with NPFST.
| Text Data | Image Annotation | Image Search | ||||
|---|---|---|---|---|---|---|
| r@1 | r@5 | r@10 | r@1 | r@5 | r@10 | |
| Longest | 8.6 | 27.5 | 44.1 | 7.6 | 24.7 | 38.7 |
| NPFST | 9.1 | 31.0 | 47.8 | 7.6 | 27.8 | 43.0 |
Table 9.
Evaluation of the *(i2t) models.
| Model | Image Annotation | Image Search | ||||
|---|---|---|---|---|---|---|
| r@1 | r@5 | r@10 | r@1 | r@5 | r@10 | |
| Chinese Art Alignment Dataset | ||||||
| SCAN [9] (i2t) | 6.9 | 23.4 | 37.2 | 8.5 | 26.2 | 40.6 |
| BFAN [10] (i2t) | 7.1 | 25.4 | 39.5 | 6.8 | 23.6 | 37.0 |
| Egyptian art alignment dataset | ||||||
| SCAN [9] (i2t) | 6.1 | 20.9 | 33.6 | 5.7 | 18.7 | 27.1 |
| BFAN [10] (i2t) | 5.1 | 18.8 | 31.2 | 4.5 | 17.1 | 27.2 |
Table 10.
BLEU scores obtained by model BFAN_SF (ens) in the image annotation task.
| BLEU-1 | BLEU-2 | BLEU-3 | BLEU-4 |
|---|---|---|---|
| Chinese art alignment dataset | |||
| 40.1 | 21.1 | 12.9 | 10.4 |
| Egyptian art alignment dataset | |||
| 37.1 | 18.9 | 11.1 | 8.0 |
Publisher’s Note: MDPI stays neutral with regard to jurisdictional claims in published maps and institutional affiliations. |
© 2021 by the authors. Licensee MDPI, Basel, Switzerland. This article is an open access article distributed under the terms and conditions of the Creative Commons Attribution (CC BY) license (https://creativecommons.org/licenses/by/4.0/).
Share and Cite
MDPI and ACS Style
Sheng, S.; Laenen, K.; Van Gool, L.; Moens, M.-F. Fine-Grained Cross-Modal Retrieval for Cultural Items with Focal Attention and Hierarchical Encodings. Computers 2021, 10, 105. https://0-doi-org.brum.beds.ac.uk/10.3390/computers10090105
AMA Style
Sheng S, Laenen K, Van Gool L, Moens M-F. Fine-Grained Cross-Modal Retrieval for Cultural Items with Focal Attention and Hierarchical Encodings. Computers. 2021; 10(9):105. https://0-doi-org.brum.beds.ac.uk/10.3390/computers10090105
Chicago/Turabian StyleSheng, Shurong, Katrien Laenen, Luc Van Gool, and Marie-Francine Moens. 2021. "Fine-Grained Cross-Modal Retrieval for Cultural Items with Focal Attention and Hierarchical Encodings" Computers 10, no. 9: 105. https://0-doi-org.brum.beds.ac.uk/10.3390/computers10090105
Note that from the first issue of 2016, this journal uses article numbers instead of page numbers. See further details here.