
Classification of Contaminated Insulators Using k-Nearest Neighbors Based on Computer Vision

 , ,
, ,  ,
,  , and
, and 
Abstract
: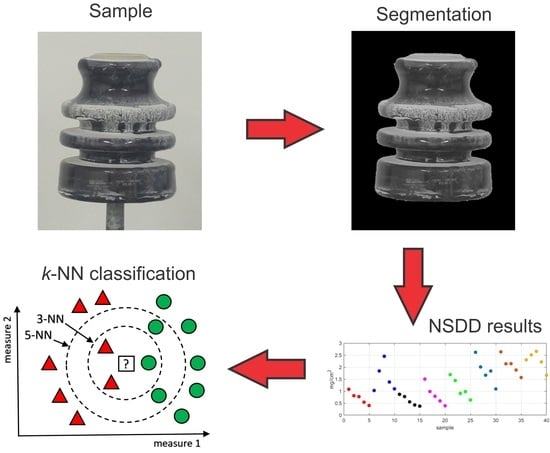
1. Introduction
- The first contribution of this work is related to the improvement in the diagnosis of contaminated insulators through an artificial intelligence model, which can be used for several applications and shows high efficiency.
- The second contribution is related to computational vision analysis of insulators using non-soluble deposit density. This is an innovative contamination analysis using this measure for electrical power system insulators.
- The third contribution is that the k-nearest neighbors model is superior to the decision tree, ensemble, support vector machine, and multilayer perceptron models for this application.
2. Insulator Contamination
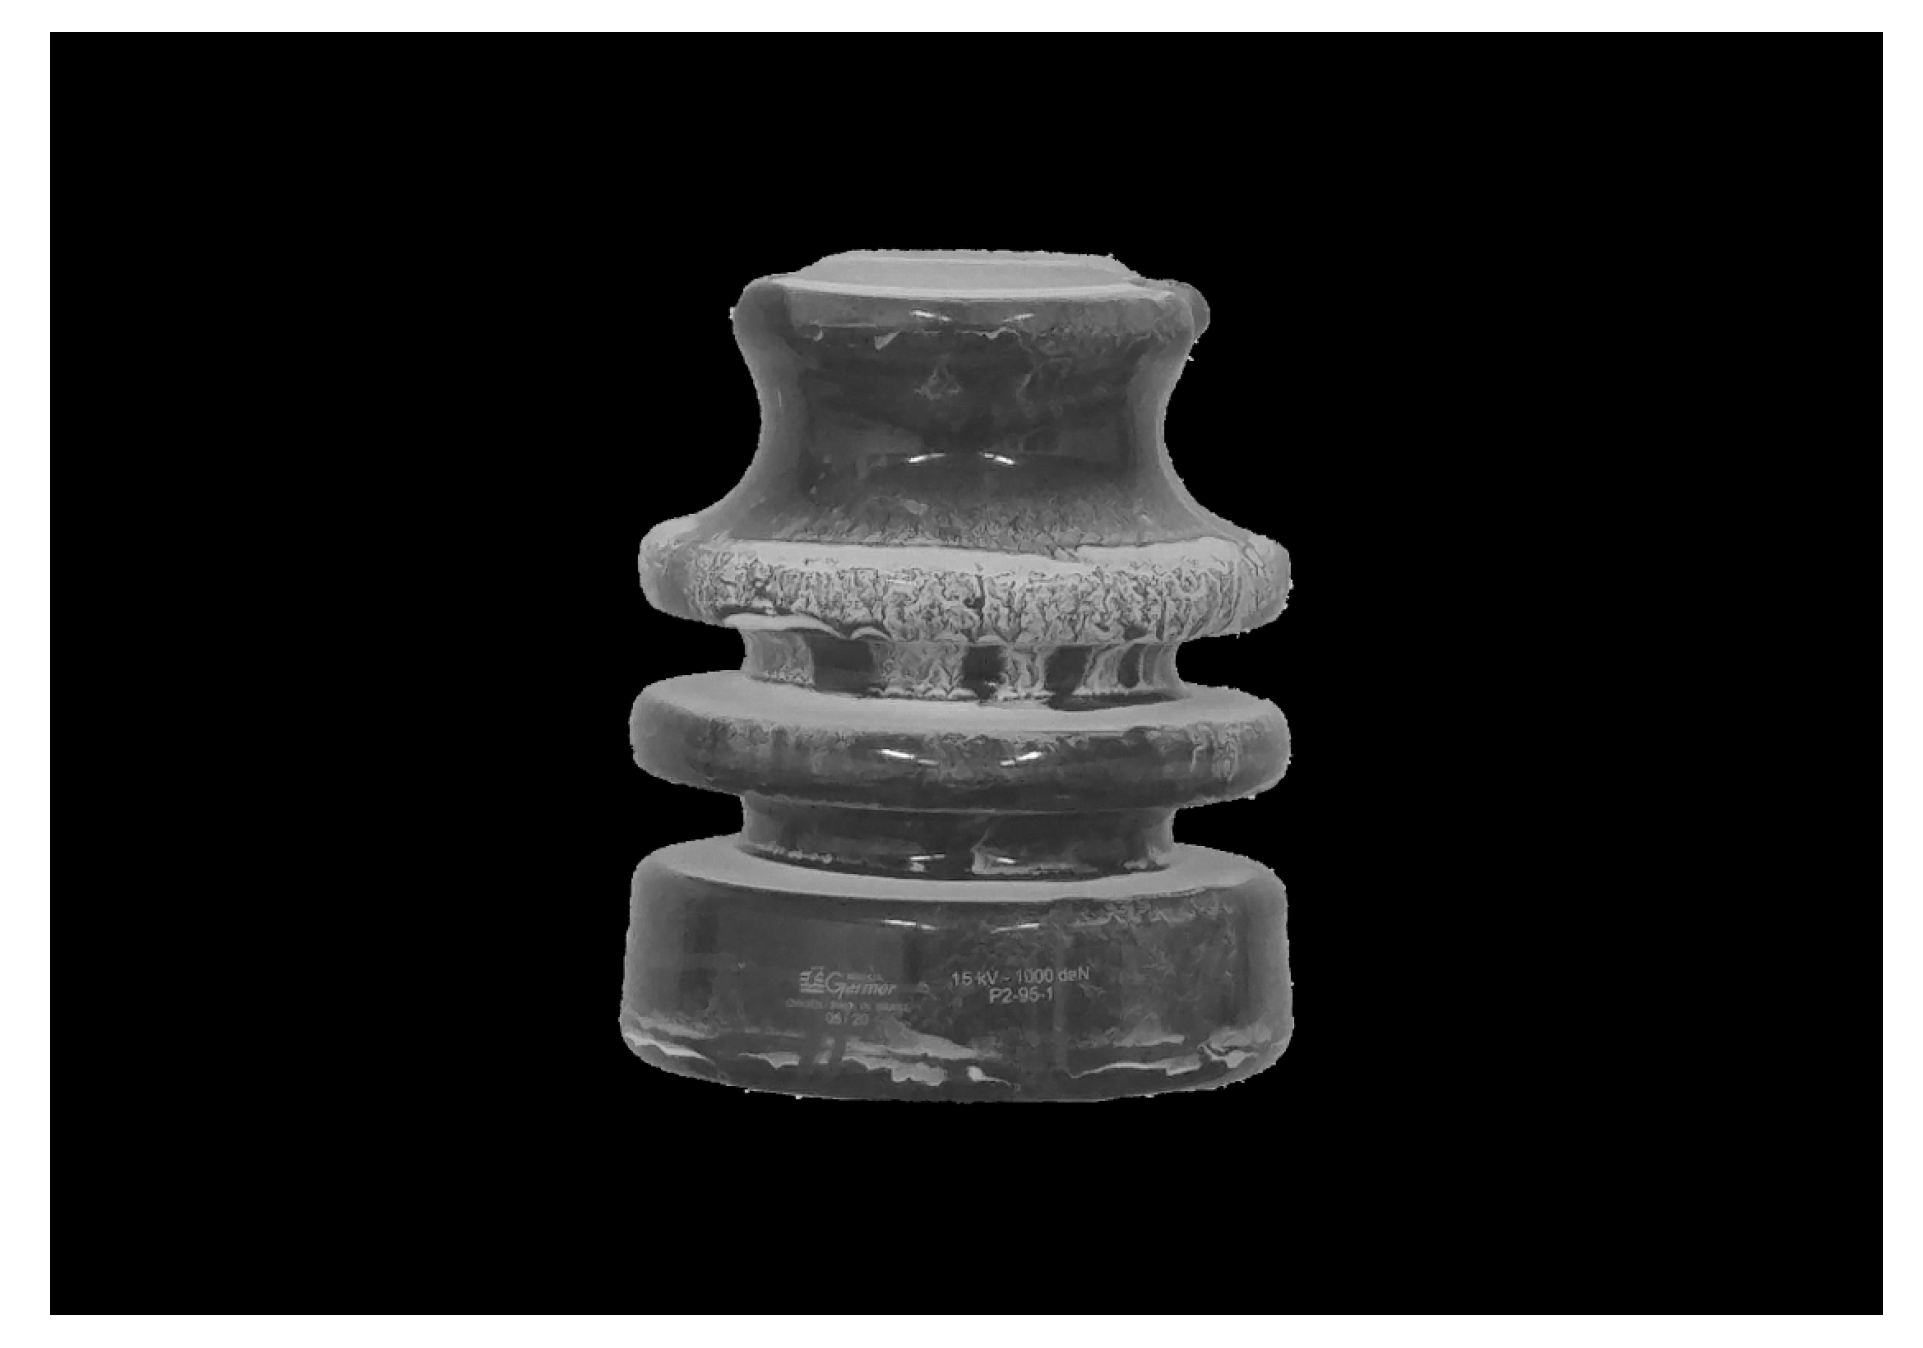
2.1. Contaminated Insulator Samples
2.2. Image Preprocessing
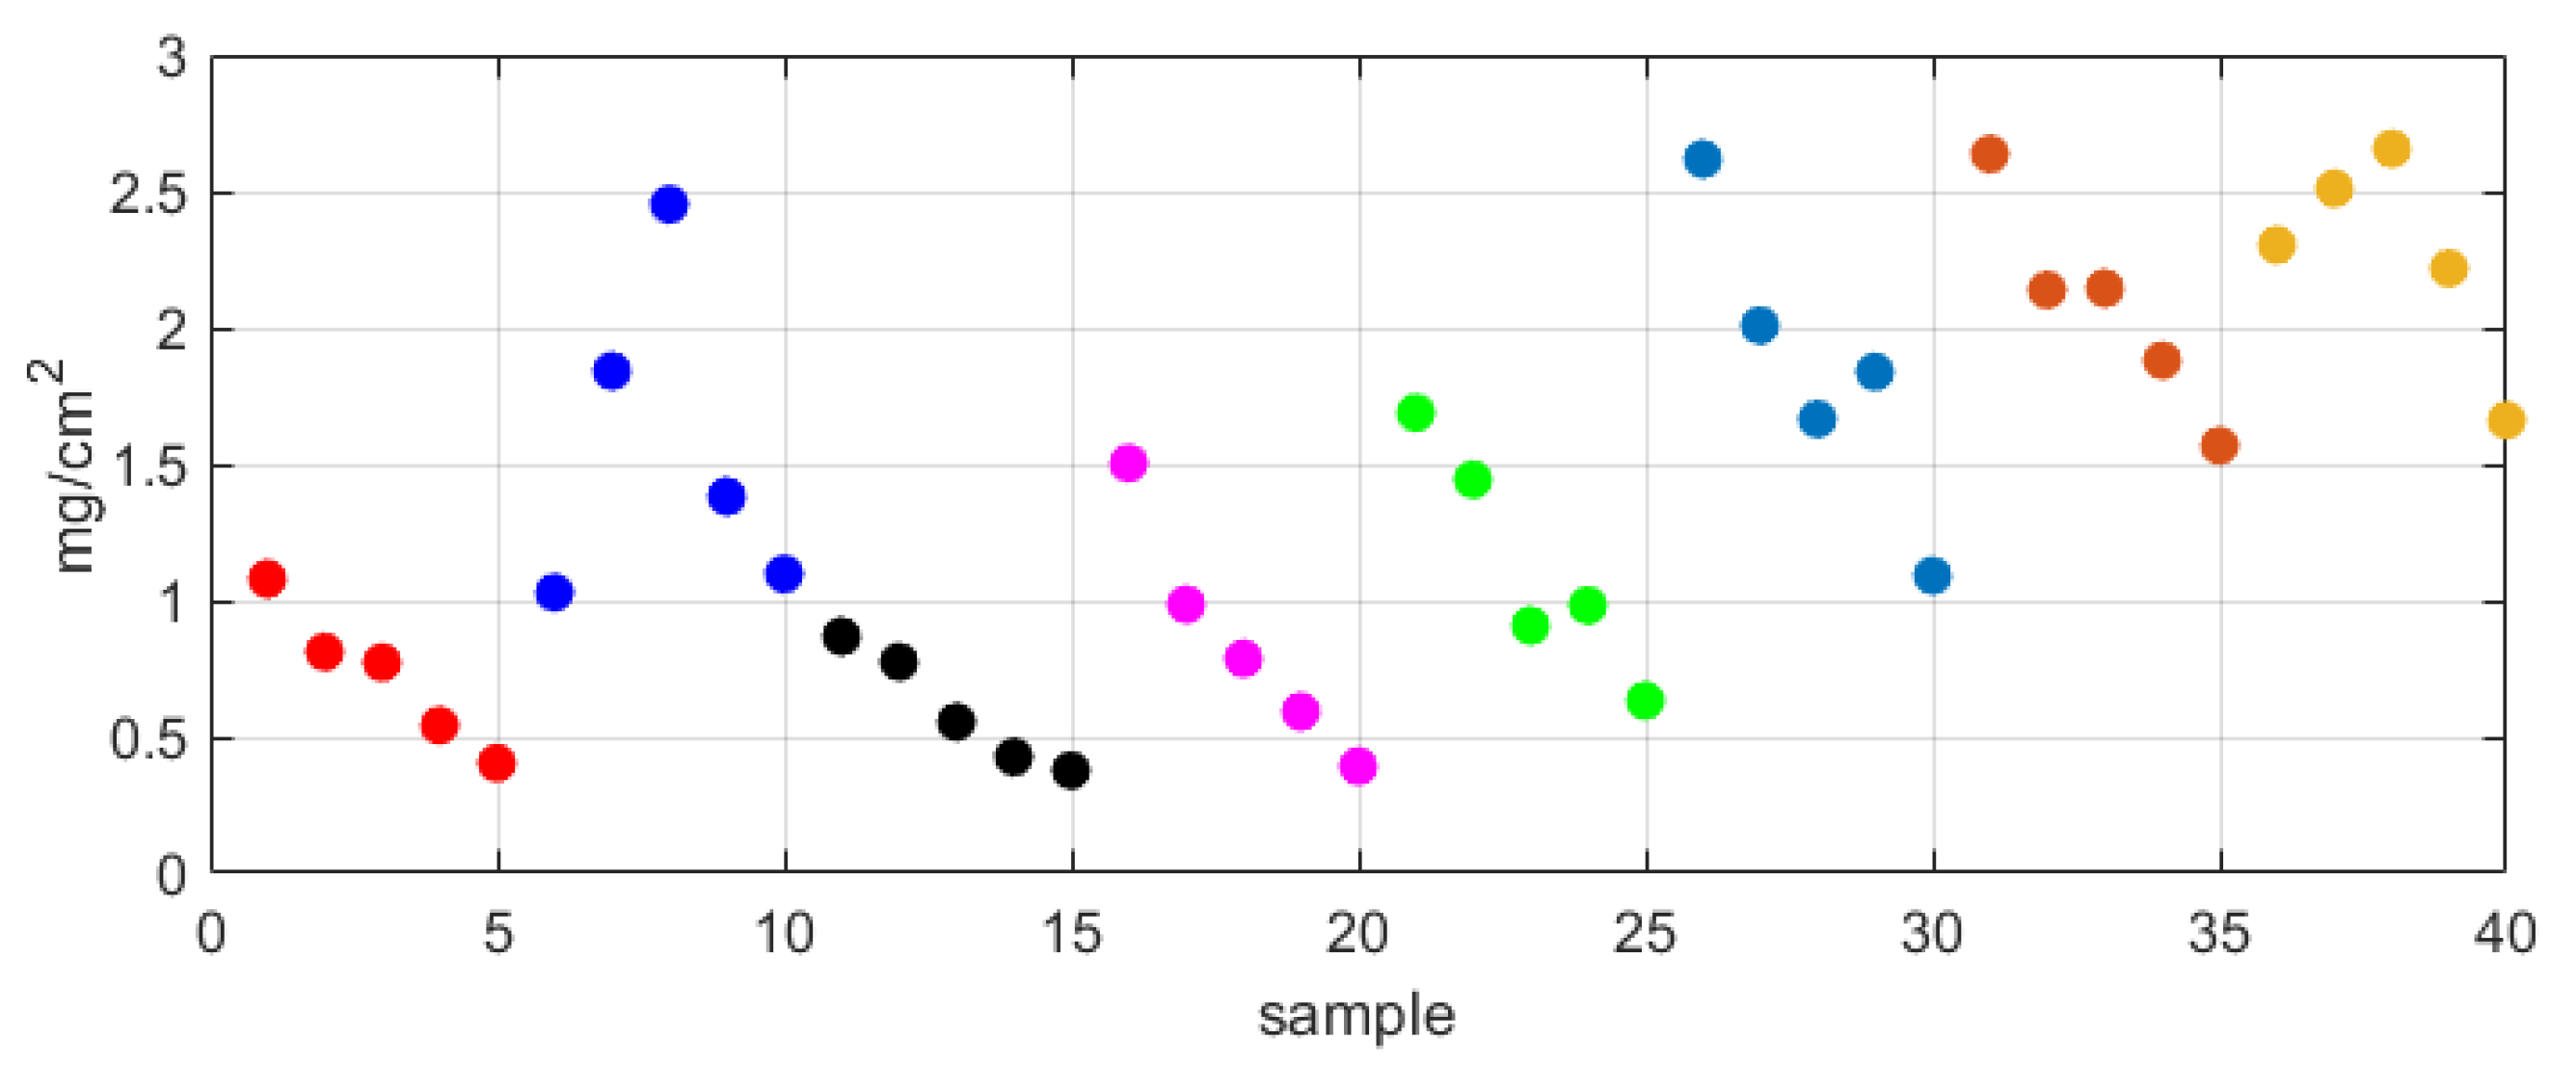
2.3. Feature Extraction
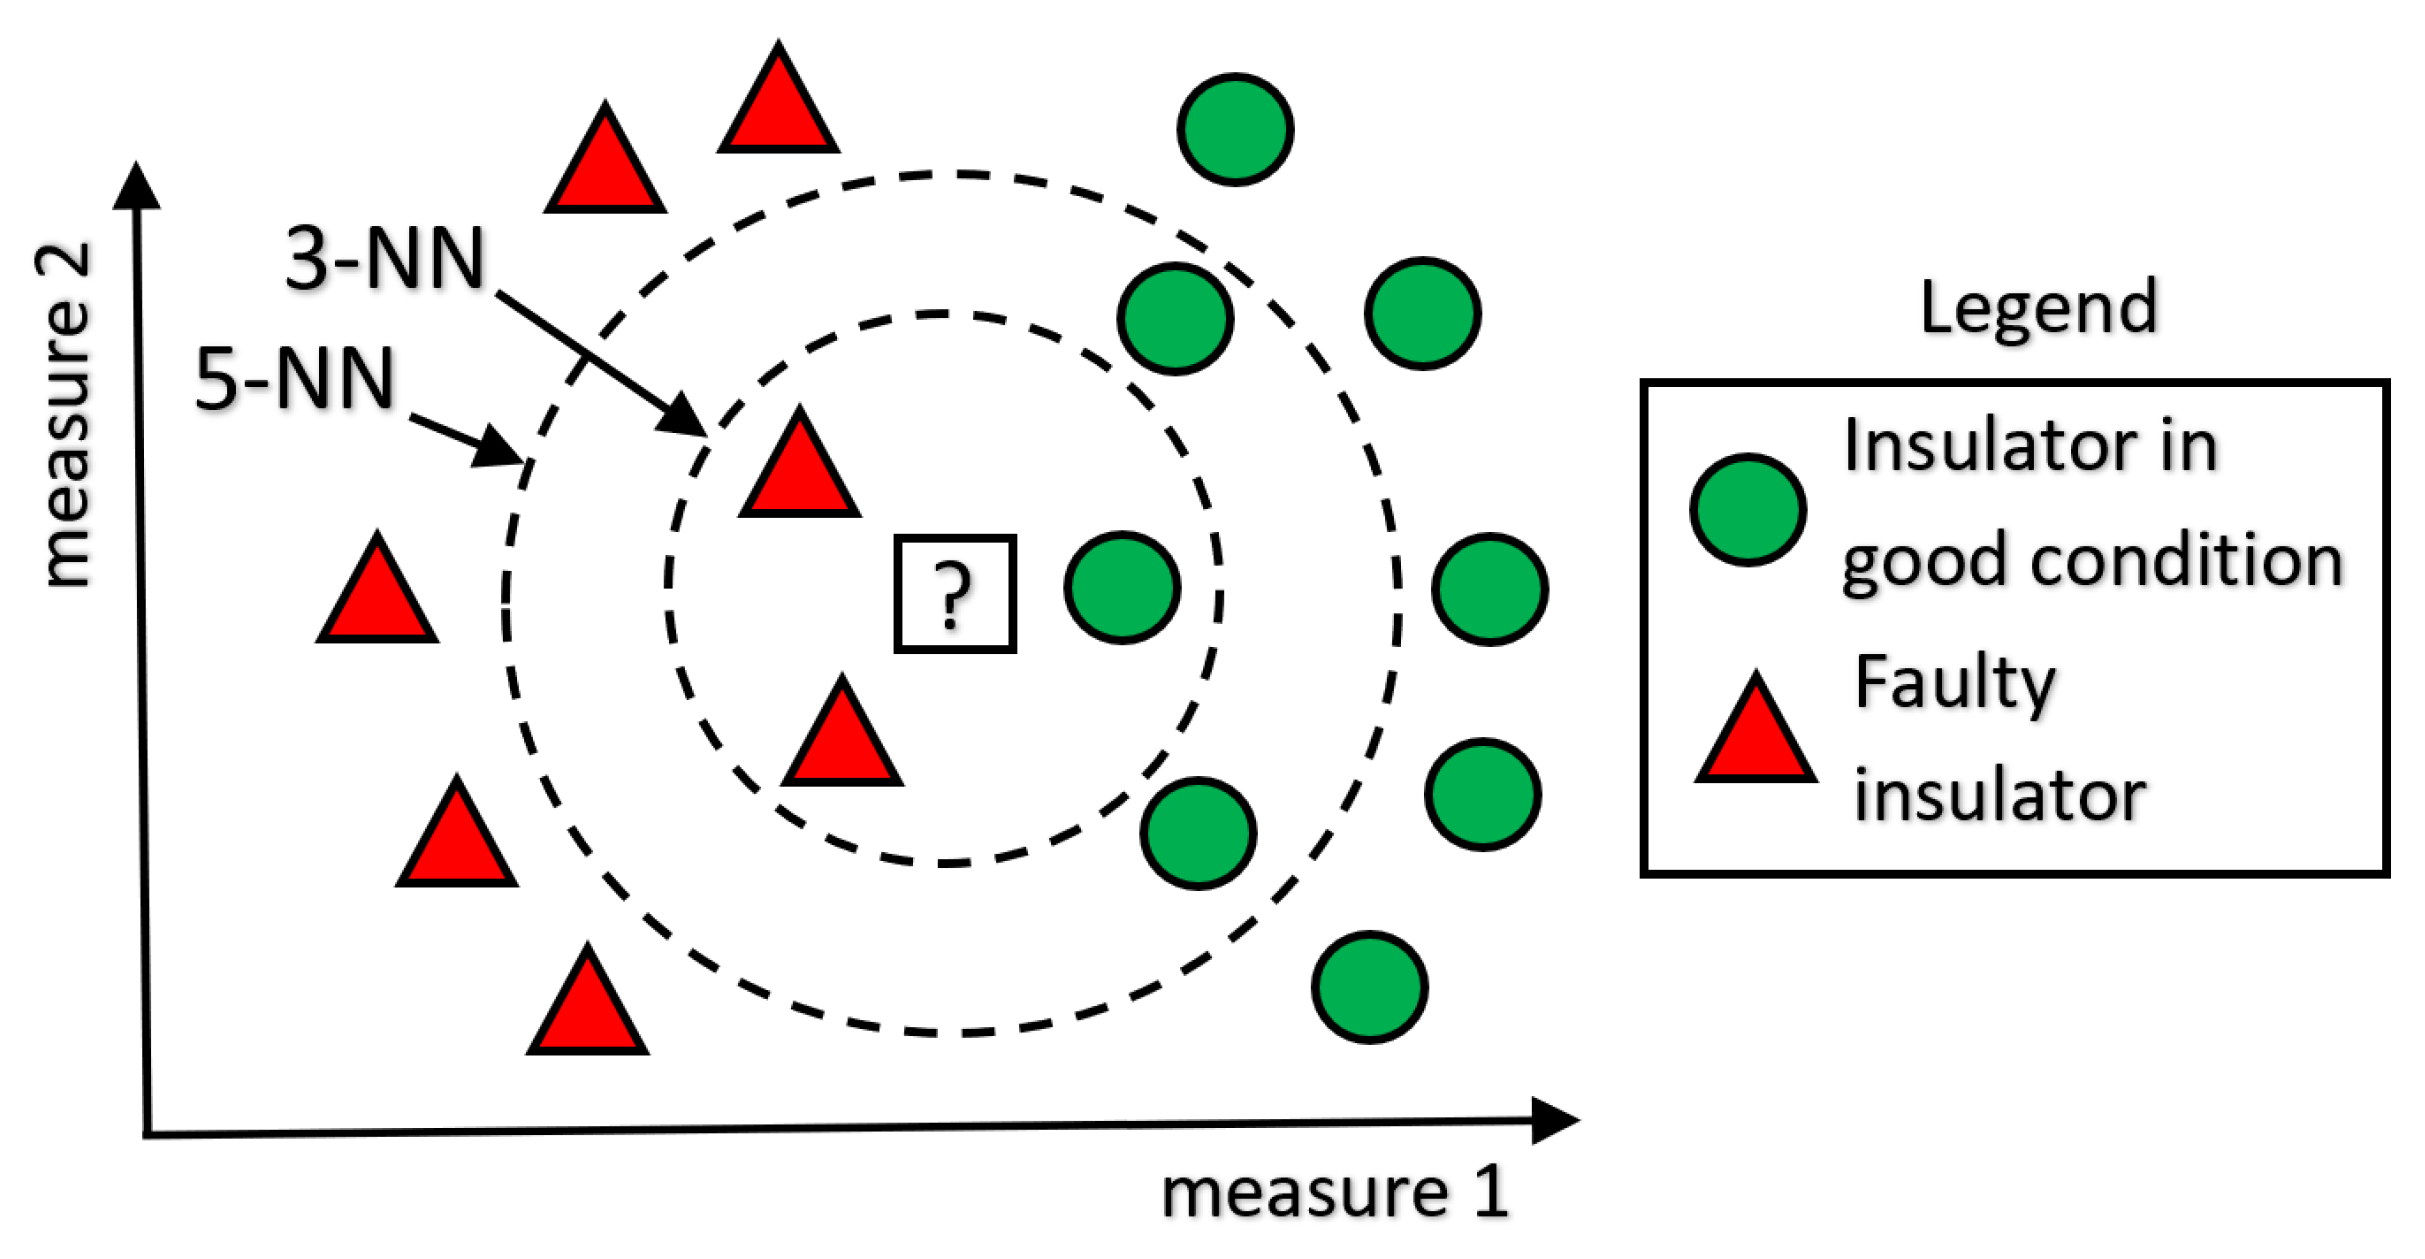
3. Nearest Neighbors Method
3.1. Model Architecture
- e = optimal Bayes classifier error;
- : error of 1-NN;
- : error of k-NN.
- ;
- .
3.2. Neighbor Distance Method
3.3. Holdout
3.4. Cross-Validation
3.5. Benchmarking
4. Analysis of Results
Benchmarking
5. Conclusions
Author Contributions
Funding
Institutional Review Board Statement
Informed Consent Statement
Data Availability Statement
Acknowledgments
Conflicts of Interest
Abbreviations
| ANFIS | adaptive neuro-fuzzy inference system |
| ANN | artificial neural network |
| CAPES | Coordination for the Improvement of Higher Education Personnel |
| CBIE | Canadian Bureau for International Education |
| CNN | convolutional neural network |
| ELAP | Emerging Leaders in the Americas Program |
| ESDD | equivalent salt deposit density |
| GMDH | group method of data handling |
| k-NN | k-nearest neighbors |
| LSTM | long short term memory |
| NSDD | non-soluble deposit density |
| SVM | support vector machine |
References
- Stefenon, S.F.; Silva, M.C.; Bertol, D.W.; Meyer, L.H.; Nied, A. Fault diagnosis of insulators from ultrasound detection using neural networks. J. Intell. Fuzzy Syst. 2019, 37, 6655–6664. [Google Scholar] [CrossRef]
- Ribeiro, M.H.D.M.; Stefenon, S.F.; Lima, J.D.; Nied, A.; Marini, V.C.; Coelho, L.S. Electricity price forecasting based on self-adaptive decomposition and heterogeneous ensemble learning. Energies 2020, 13, 5190. [Google Scholar] [CrossRef]
- Vega Martinez, S.; Filho, E.M.; Seman, L.O.; Bezerra, E.A.; Nicolau, V.d.P.; Ovejero, R.G.; Leithardt, V.R.Q. An Integrated Thermal-Electrical Model for Simulations of Battery Behavior in CubeSats. Appl. Sci. 2021, 11, 1554. [Google Scholar] [CrossRef]
- Itajiba, J.A.; Varnier, C.A.C.; Cabral, S.H.L.; Stefenon, S.F.; Leithardt, V.R.Q.; Ovejero, R.G.; Nied, A.; Yow, K.C. Experimental Comparison of Preferential vs. Common Delta Connections for the Star-Delta Starting of Induction Motors. Energies 2021, 14, 1318. [Google Scholar] [CrossRef]
- Corso, M.P.; Stefenon, S.F.; Couto, V.F.; Cabral, S.H.L.; Nied, A. Evaluation of Methods for Electric Field Calculation in Transmission Lines. IEEE Lat. Am. Trans. 2018, 16, 2970–2976. [Google Scholar] [CrossRef]
- Stefenon, S.F.; Branco, N.W.; Nied, A.; Bertol, D.W.; Finardi, E.C.; Sartori, A.; Meyer, L.H.; Grebogi, R.B. Analysis of training techniques of ANN for classification of insulators in electrical power systems. IET Gener. Transm. Distrib. 2020, 14, 1591–1597. [Google Scholar] [CrossRef]
- Khafaf, N.; El-Hag, A. Bayesian regularization of neural network to predict leakage current in a salt fog environment. IEEE Trans. Dielectr. Electr. Insul. 2018, 25, 686–693. [Google Scholar] [CrossRef]
- Stefenon, S.F.; Seman, L.O.; Sopelsa Neto, N.F.; Meyer, L.H.; Nied, A.; Yow, K.C. Echo state network applied for classification of medium voltage insulators. Int. J. Electr. Power Energy Syst. 2022, 134, 107336. [Google Scholar] [CrossRef]
- Abouzeid, A.; El-Hag, A.; Assaleh, K. Equivalent Salt Deposit Density Prediction of Silicone Rubber Insulators Under Simulated Pollution Conditions. Electr. Power Compos. Syst. 2018, 46, 1123–1133. [Google Scholar] [CrossRef]
- Soltani, A.; El-Hag, A. Denoising of Radio Frequency Partial Discharge Signals Using Artificial Neural Network. Energies 2019, 12, 3485. [Google Scholar] [CrossRef] [Green Version]
- Polisetty, S.; El-Hag, A.; Jayram, S. Classification of common discharges in outdoor insulation using acoustic signals and artificial neural network. High Volt. 2019, 4, 333–338. [Google Scholar] [CrossRef]
- Anjum, S.; Jayaram, S.; El-Hag, A.; Jahromi, A. Detection and classification of defects in ceramic insulators using RF antenna. IEEE Trans. Dielectr. Electr. Insul. 2017, 24, 183–190. [Google Scholar] [CrossRef]
- Cabral, S.H.L.; Bertoli, S.L.; Medeiros, A.; Hillesheim, C.R.; De Souza, C.K.; Stefenon, S.F.; Nied, A.; Leithardt, V.R.Q.; González, G.V. Practical Aspects of the Skin Effect in Low Frequencies in Rectangular Conductors. IEEE Access 2021, 9, 49424–49433. [Google Scholar] [CrossRef]
- Leithardt, V.; Santos, D.; Silva, L.; Viel, F.; Zeferino, C.; Silva, J. A Solution for Dynamic Management of User Profiles in IoT Environments. IEEE Lat. Am. Trans. 2020, 18, 1193–1199. [Google Scholar] [CrossRef]
- Stefenon, S.F.; Freire, R.Z.; Coelho, L.S.; Meyer, L.H.; Grebogi, R.B.; Buratto, W.G.; Nied, A. Electrical Insulator Fault Forecasting Based on a Wavelet Neuro-Fuzzy System. Energies 2020, 13, 484. [Google Scholar] [CrossRef] [Green Version]
- Li, W.; Chen, J.; Li, J.; Xia, K. Derivative and enhanced discrete analytic wavelet algorithm for rolling bearing fault diagnosis. Microprocess. Microsyst. 2021, 82, 103872. [Google Scholar] [CrossRef]
- Stefenon, S.F.; Ribeiro, M.H.D.M.; Nied, A.; Mariani, V.C.; Coelho, L.S.; da Rocha, D.F.M.; Grebogi, R.B.; Ruano, A.E.B. Wavelet group method of data handling for fault prediction in electrical power insulators. Int. J. Electr. Power Energy Syst. 2020, 123, 106269. [Google Scholar] [CrossRef]
- Kasburg, C.; Stefenon, S.F. Deep Learning for Photovoltaic Generation Forecast in Active Solar Trackers. IEEE Lat. Am. Trans. 2019, 17, 2013–2019. [Google Scholar] [CrossRef]
- Stefenon, S.F.; Kasburg, C.; Freire, R.Z.; Silva Ferreira, F.C.; Bertol, D.W.; Nied, A. Photovoltaic power forecasting using wavelet Neuro-Fuzzy for active solar trackers. J. Intell. Fuzzy Syst. 2021, 40, 1083–1096. [Google Scholar] [CrossRef]
- Nguyen, V.N.; Jenssen, R.; Roverso, D. Automatic autonomous vision-based power line inspection: A review of current status and the potential role of deep learning. Int. J. Electr. Power Energy Syst. 2018, 99, 107–120. [Google Scholar] [CrossRef] [Green Version]
- Manninen, H.; Ramlal, C.J.; Singh, A.; Rocke, S.; Kilter, J.; Landsberg, M. Toward automatic condition assessment of high-voltage transmission infrastructure using deep learning techniques. Int. J. Electr. Power Energy Syst. 2021, 128, 106726. [Google Scholar] [CrossRef]
- Shi, C.; Huang, Y. Cap-Count Guided Weakly Supervised Insulator Cap Missing Detection in Aerial Images. IEEE Sensors J. 2021, 21, 685–691. [Google Scholar] [CrossRef]
- Sampedro, C.; Rodriguez-Vazquez, J.; Rodriguez-Ramos, A.; Carrio, A.; Campoy, P. Deep Learning-Based System for Automatic Recognition and Diagnosis of Electrical Insulator Strings. IEEE Access 2019, 7, 101283–101308. [Google Scholar] [CrossRef]
- Tao, X.; Zhang, D.; Wang, Z.; Liu, X.; Zhang, H.; Xu, D. Detection of Power Line Insulator Defects Using Aerial Images Analyzed With Convolutional Neural Networks. IEEE Trans. Syst. Man Cybern. Syst. 2020, 50, 1486–1498. [Google Scholar] [CrossRef]
- Ibrahim, A.; Dalbah, A.; Abualsaud, A.; Tariq, U.; El-Hag, A. Application of Machine Learning to Evaluate Insulator Surface Erosion. IEEE Trans. Instrum. Meas. 2020, 69, 314–316. [Google Scholar] [CrossRef]
- Kang, G.; Gao, S.; Yu, L.; Zhang, D. Deep Architecture for High-Speed Railway Insulator Surface Defect Detection: Denoising Autoencoder With Multitask Learning. IEEE Trans. Instrum. Meas. 2019, 68, 2679–2690. [Google Scholar] [CrossRef]
- Han, Y.; Liu, Z.; Lee, D.; Liu, W.; Chen, J.; Han, Z. Computer vision–based automatic rod-insulator defect detection in high-speed railway catenary system. Int. J. Adv. Robot. Syst. 2018, 15, 1–15. [Google Scholar] [CrossRef] [Green Version]
- Yin, J.; Lu, Y.; Gong, Z.; Jiang, Y.; Yao, J. Edge Detection of High-Voltage Porcelain Insulators in Infrared Image Using Dual Parity Morphological Gradients. IEEE Access 2019, 7, 32728–32734. [Google Scholar] [CrossRef]
- Kokalis, C.C.A.; Tasakos, T.; Kontargyri, V.T.; Siolas, G.; Gonos, I.F. Hydrophobicity classification of composite insulators based on convolutional neural networks. Eng. Appl. Artif. Intell. 2020, 91, 103613. [Google Scholar] [CrossRef]
- Wen, Q.; Luo, Z.; Chen, R.; Yang, Y.; Li, G. Deep Learning Approaches on Defect Detection in High Resolution Aerial Images of Insulators. Sensors 2021, 21, 1033. [Google Scholar] [CrossRef]
- Ma, Y.; Li, Q.; Chu, L.; Zhou, Y.; Xu, C. Real-Time Detection and Spatial Localization of Insulators for UAV Inspection Based on Binocular Stereo Vision. Remote Sens. 2021, 13, 230. [Google Scholar] [CrossRef]
- Wang, S.; Liu, Y.; Qing, Y.; Wang, C.; Lan, T.; Yao, R. Detection of Insulator Defects With Improved ResNeSt and Region Proposal Network. IEEE Access 2020, 8, 184841–184850. [Google Scholar] [CrossRef]
- Waleed, D.; Mukhopadhyay, S.; Tariq, U.; El-Hag, A.H. Drone-Based Ceramic Insulators Condition Monitoring. IEEE Trans. Instrum. Meas. 2021, 70, 1–12. [Google Scholar] [CrossRef]
- Dong, Y.; Ma, X.; Fu, T. Electrical load forecasting: A deep learning approach based on K-nearest neighbors. Appl. Soft Comput. 2021, 99, 106900. [Google Scholar] [CrossRef]
- Mailagaha Kumbure, M.; Luukka, P.; Collan, M. A new fuzzy k-nearest neighbor classifier based on the Bonferroni mean. Pattern Recognit. Lett. 2020, 140, 172–178. [Google Scholar] [CrossRef]
- González, S.; García, S.; Li, S.T.; John, R.; Herrera, F. Fuzzy k-nearest neighbors with monotonicity constraints: Moving towards the robustness of monotonic noise. Neurocomputing 2021, 439, 106–121. [Google Scholar] [CrossRef]
- Sharma, K.K.; Seal, A. Spectral embedded generalized mean based k-nearest neighbors clustering with S-distance. Expert Syst. Appl. 2021, 169, 114326. [Google Scholar] [CrossRef]
- Stefenon, S.F.; Freire, R.Z.; Meyer, L.H.; Corso, M.P.; Sartori, A.; Nied, A.; Klaar, A.C.R.; Yow, K.C. Fault detection in insulators based on ultrasonic signal processing using a hybrid deep learning technique. IET Sci. Meas. Technol. 2020, 14, 953–961. [Google Scholar] [CrossRef]
- Sopelsa Neto, N.F.; Stefenon, S.F.; Meyer, L.H.; Bruns, R.; Nied, A.; Seman, L.O.; Gonzalez, G.V.; Leithardt, V.R.Q.; Yow, K.C. A Study of Multilayer Perceptron Networks Applied to Classification of Ceramic Insulators Using Ultrasound. Appl. Sci. 2021, 11, 1592. [Google Scholar] [CrossRef]
- Stefenon, S.F.; Americo, J.P.; Meyer, L.H.; Grebogi, R.B.; Nied, A. Analysis of the Electric Field in Porcelain Pin-Type Insulators via Finite Elements Software. IEEE Lat. Am. Trans. 2018, 16, 2505–2512. [Google Scholar] [CrossRef]
- Stefenon, S.F.; Furtado Neto, C.S.; Coelho, T.S.; Nied, A.; Yamaguchi, C.K.; Yow, K.C. Particle swarm optimization for design of insulators of distribution power system based on finite element method. Electr. Eng. 2021. preprint. [Google Scholar] [CrossRef]
- Stefenon, S.F.; Ribeiro, M.H.D.M.; Nied, A.; Mariani, V.C.; Coelho, L.D.S.; Leithardt, V.R.Q.; Silva, L.A.; Seman, L.O. Hybrid Wavelet Stacking Ensemble Model for Insulators Contamination Forecasting. IEEE Access 2021, 9, 66387–66397. [Google Scholar] [CrossRef]
- Maadjoudj, D.; Mekhaldi, A.; Teguar, M. Flashover process and leakage current characteristics of insulator model under desert pollution. IEEE Trans. Dielectr. Electr. Insul. 2018, 25, 2296–2304. [Google Scholar] [CrossRef]
- Wardman, J.; Wilson, T.; Bodger, P. Volcanic ash contamination: Limitations of the standard ESDD method for classifying pollution severity. IEEE Trans. Dielectr. Electr. Insul. 2013, 20, 414–420. [Google Scholar] [CrossRef]
- Maraaba, L.S.; Soufi, K.Y.A.; Alhems, L.M.; Hassan, M.A. Performance Evaluation of 230 kV Polymer Insulators in the Coastal Area of Saudi Arabia. IEEE Access 2020, 8, 164292–164303. [Google Scholar] [CrossRef]
- Su, H.; Jia, Z.; Guan, Z.; Li, L. Mechanism of contaminant accumulation and flashover of insulator in heavily polluted coastal area. IEEE Trans. Dielectr. Electr. Insul. 2010, 17, 1635–1641. [Google Scholar] [CrossRef]
- Salem, A.A.; Abd-Rahman, R.; Al-Gailani, S.A.; Salam, Z.; Kamarudin, M.S.; Zainuddin, H.; Yousof, M.F.M. Risk Assessment of Polluted Glass Insulator Using Leakage Current Index Under Different Operating Conditions. IEEE Access 2020, 8, 175827–175839. [Google Scholar] [CrossRef]
- Matsuoka, R.; Kondo, K.; Naito, K.; Ishii, M. Influence of nonsoluble contaminants on the flashover voltages of artificially contaminated insulators. IEEE Trans. Power Deliv. 1996, 11, 420–430. [Google Scholar] [CrossRef]
- Jiang, X.; Yuan, J.; Zhang, Z.; Hu, J.; Sun, C. Study on AC Artificial-Contaminated Flashover Performance of Various Types of Insulators. IEEE Trans. Power Deliv. 2007, 22, 2567–2574. [Google Scholar] [CrossRef]
- IEC 60383. Insulators for overhead lines with a nominal voltage above 1000 V—Part 1: Ceramic or glass insulator units for a.c. systems—Definitions, test methods and acceptance criteria. Int. Stand. 1993, 1, 1–111. [Google Scholar]
- IEC 60507. Artificial pollution tests on high-voltage ceramic and glass insulators to be used on a.c. systems. Int. Stand. 2013, 1, 1–77. [Google Scholar]
- IEC 60815. Selection and dimensioning of high-voltage insulators intended for use in polluted conditions: Definitions, information and general principles. Int. Stand. 2008, 1, 1–53. [Google Scholar]
- Siriapisith, T.; Kusakunniran, W.; Haddawy, P. Pyramid graph cut: Integrating intensity and gradient information for grayscale medical image segmentation. Comput. Biol. Med. 2020, 126, 103997. [Google Scholar] [CrossRef]
- Al-Musawi, A.K.; Anayi, F.; Packianather, M. Three-phase induction motor fault detection based on thermal image segmentation. Infrared Phys. Technol. 2020, 104, 103140. [Google Scholar] [CrossRef]
- Zhang, Q.; Lin, C.; Li, F. Application of binocular disparity and receptive field dynamics: A biologically-inspired model for contour detection. Pattern Recognit. 2021, 110, 107657. [Google Scholar] [CrossRef]
- Wang, Z.; Li, Y.; Li, D.; Zhu, Z.; Du, W. Entropy and gravitation based dynamic radius nearest neighbor classification for imbalanced problem. Knowl.-Based Syst. 2020, 193, 105474. [Google Scholar] [CrossRef]
- Kahraman, H.T. A novel and powerful hybrid classifier method: Development and testing of heuristic k-NN algorithm with fuzzy distance metric. Data Knowl. Eng. 2016, 103, 44–59. [Google Scholar] [CrossRef]
- Tripoppoom, S.; Ma, X.; Yong, R.; Wu, J.; Yu, W.; Sepehrnoori, K.; Miao, J.; Li, N. Assisted history matching in shale gas well using multiple-proxy-based Markov chain Monte Carlo algorithm: The comparison of K-nearest neighbors and neural networks as proxy model. Fuel 2020, 262, 116563. [Google Scholar] [CrossRef]
- Zhang, S.; Li, X.; Zong, M.; Zhu, X.; Wang, R. Efficient k-NN Classification With Different Numbers of Nearest Neighbors. IEEE Trans. Neural Netw. Learn. Syst. 2018, 29, 1774–1785. [Google Scholar] [CrossRef] [PubMed]
- Rahmatian, M.; Vahidi, B.; Ghanizadeh, A.; Gharehpetian, G.; Alehosseini, H. Insulation failure detection in transformer winding using cross-correlation technique with ANN and k-NN regression method during impulse test. Int. J. Electr. Power Energy Syst. 2013, 53, 209–218. [Google Scholar] [CrossRef]
- Liu, Z.G.; Zhang, Z.; Liu, Y.; Dezert, J.; Pan, Q. A new pattern classification improvement method with local quality matrix based on k-NN. Knowl.-Based Syst. 2019, 164, 336–347. [Google Scholar] [CrossRef]
- Čech, P.; Lokoč, J.; Silva, Y.N. Pivot-based approximate k-NN similarity joins for big high-dimensional data. Inf. Syst. 2020, 87, 101410. [Google Scholar] [CrossRef]
- Abu Alfeilat, H.A.; Hassanat, A.B.; Lasassmeh, O.; Tarawneh, A.S.; Alhasanat, M.B.; Eyal Salman, H.S.; Prasath, V.S. Effects of distance measure choice on k-nearest neighbor classifier performance: A review. Big Data 2019, 7, 221–248. [Google Scholar] [CrossRef] [Green Version]
- Song, B.; Tan, S.; Shi, H.; Zhao, B. Fault detection and diagnosis via standardized k nearest neighbor for multimode process. J. Taiwan Inst. Chem. Eng. 2020, 106, 1–8. [Google Scholar] [CrossRef]
- Lee, L.C.; Liong, C.Y.; Jemain, A.A. Validity of the best practice in splitting data for hold-out validation strategy as performed on the ink strokes in the context of forensic science. Microchem. J. 2018, 139, 125–133. [Google Scholar] [CrossRef]
- Wong, T.; Yeh, P. Reliable Accuracy Estimates from k-Fold Cross Validation. IEEE Trans. Knowl. Data Eng. 2020, 32, 1586–1594. [Google Scholar] [CrossRef]
- Saud, S.; Jamil, B.; Upadhyay, Y.; Irshad, K. Performance improvement of empirical models for estimation of global solar radiation in India: A k-fold cross-validation approach. Sustain. Energy Technol. Assess. 2020, 40, 100768. [Google Scholar] [CrossRef]
- Biedrzycki, J.; Burduk, R. Weighted Scoring in Geometric Space for Decision Tree Ensemble. IEEE Access 2020, 8, 82100–82107. [Google Scholar] [CrossRef]
- Zhang, Y.; Chen, H.C.; Du, Y.; Chen, M.; Liang, J.; Li, J.; Fan, X.; Yao, X. Power transformer fault diagnosis considering data imbalance and data set fusion. High Volt. 2021, 6, 543–554. [Google Scholar] [CrossRef]
- Yin, C.; Xiao, Z.; Guo, Y.; Shi, C.; Zhang, X.; Wu, G. Method for detecting the pollution degree of naturally contaminated insulator based on hyperspectral characteristics. High Volt. 2021. [Google Scholar] [CrossRef]
- Stefenon, S.F.; Grebogi, R.B.; Freire, R.Z.; Nied, A.; Meyer, L.H. Optimized Ensemble Extreme Learning Machine for Classification of Electrical Insulators Conditions. IEEE Trans. Ind. Electron. 2020, 67, 5170–5178. [Google Scholar] [CrossRef]
- Mao, X.; Wang, Z.; Crossley, P.; Jarman, P.; Fieldsend-Roxborough, A.; Wilson, G. Transformer winding type recognition based on FRA data and a support vector machine model. High Volt. 2020, 5, 704–715. [Google Scholar] [CrossRef]
- Zang, Y.; Qian, Y.; Wang, H.; Xu, A.; Sheng, G.; Jiang, X. Method of GIL partial discharge localization based on natural neighbour interpolation and ECOC-MLP-SVM using optical simulation technology. High Volt. 2021, 6, 514–524. [Google Scholar] [CrossRef]
- Sun, J.; Zhang, H.; Li, Q.; Liu, H.; Lu, X.; Hou, K. Contamination degree prediction of insulator surface based on exploratory factor analysis-least square support vector machine combined model. High Volt. 2021, 6, 264–277. [Google Scholar] [CrossRef]
- Montagna, F.; Buiatti, M.; Benatti, S.; Rossi, D.; Farella, E.; Benini, L. A machine learning approach for automated wide-range frequency tagging analysis in embedded neuromonitoring systems. Methods 2017, 129, 96–107. [Google Scholar] [CrossRef] [Green Version]
- Pinto, H.S.; Américo, J.P.; Leal, O.E.S.; Stefenon, S.F. Development of Measurement Device and Data Acquisition for Electric Vehicle. Rev. GEINTEC 2021, 11, 5809–5822. [Google Scholar] [CrossRef]
- Cerutti, G.; Prasad, R.; Brutti, A.; Farella, E. Compact Recurrent Neural Networks for Acoustic Event Detection on Low-Energy Low-Complexity Platforms. IEEE J. Sel. Top. Signal Process. 2020, 14, 654–664. [Google Scholar] [CrossRef] [Green Version]
- Stefenon, S.F.; Kasburg, C.; Nied, A.; Klaar, A.C.R.; Ferreira, F.C.S.; Branco, N.W. Hybrid deep learning for power generation forecasting in active solar trackers. IET Gener. Transm. Distrib. 2020, 14, 5667–5674. [Google Scholar] [CrossRef]


| Kaolin () | 6 | 8 | 10 | 16 | 20 | 25 |
|---|---|---|---|---|---|---|
| Max. | 2.778 | 3.279 | 3.483 | 4.297 | 4.201 | 4.485 |
| Min. | 2.408 | 2.542 | 2.615 | 2.946 | 3.580 | 3.956 |
| Max. | 2.226 | 2.415 | 2.204 | 2.522 | 2.385 | 2.461 |
| Min. | 2.121 | 2.134 | 2.088 | 2.123 | 2.088 | 2.145 |
| Max. NSDD | 0.868 | 1.503 | 1.688 | 2.618 | 2.637 | 2.656 |
| Min. NSDD | 0.377 | 0.393 | 0.633 | 1.029 | 1.568 | 1.661 |
| Kaolin (g/l) | NSDD < 1.0 (mg/cm) | 1.0 < NSDD < 2.0 (mg/cm) | NSDD > 2.0 (mg/cm) |
|---|---|---|---|
| 6 | 100% | 0% | 0% |
| 8 | 80% | 20% | 0% |
| 10 | 60% | 40% | 0% |
| 16 | 0% | 40% | 60% |
| 20 | 0% | 40% | 60% |
| 25 | 0% | 20% | 80% |
| Distance Weight | Accuracy (%) | |||||
|---|---|---|---|---|---|---|
| 5-Fold | 6-Fold | 7-Fold | 8-Fold | 9-Fold | 10-Fold | |
| Equal | 82.85 | 81.69 | 82.85 | 81.69 | 82.85 | 79.94 |
| Inverse | 79.36 | 81.98 | 82.85 | 80.52 | 84.59 | 81.69 |
| Sq. Inver. | 81.69 | 84.30 | 82.85 | 83.14 | 84.58 | 83.14 |
| Distance Weight | Accuracy (%) | Std. Dev. | ||
|---|---|---|---|---|
| Max. | Min. | Mean | ||
| Equal | 85.17 | 79.65 | 82.39 | 8.70 × 10 |
| Inverse | 85.17 | 77.91 | 82.26 | 1.11 × 10 |
| Sq. Inverse | 84.88 | 79.36 | 82.23 | 9.6 × 10 |
| Method | Accuracy (%) | Std. Dev. | ||
|---|---|---|---|---|
| Max. | Min. | Mean | ||
| Decision Tree (gdi) | 56.98 | 47.09 | 52.92 | 1.26 × 10 |
| Decision Tree (deviance) | 61.63 | 56.40 | 60.02 | 7.43 × 10 |
| Ensemble (subspace) | 67.44 | 63.95 | 65.53 | 6.42 × 10 |
| SVM (onevsone) | 47.67 | 43.31 | 45.51 | 6.34 × 10 |
| SVM (allpairs) | 47.38 | 42.73 | 45.40 | 7.84 × 10 |
| Multilayer perceptron | 76.25 | 66.25 | 70.87 | 2.27 × 10 |
Publisher’s Note: MDPI stays neutral with regard to jurisdictional claims in published maps and institutional affiliations. |
© 2021 by the authors. Licensee MDPI, Basel, Switzerland. This article is an open access article distributed under the terms and conditions of the Creative Commons Attribution (CC BY) license (https://creativecommons.org/licenses/by/4.0/).
Share and Cite
Corso, M.P.; Perez, F.L.; Stefenon, S.F.; Yow, K.-C.; García Ovejero, R.; Leithardt, V.R.Q. Classification of Contaminated Insulators Using k-Nearest Neighbors Based on Computer Vision. Computers 2021, 10, 112. https://0-doi-org.brum.beds.ac.uk/10.3390/computers10090112
Corso MP, Perez FL, Stefenon SF, Yow K-C, García Ovejero R, Leithardt VRQ. Classification of Contaminated Insulators Using k-Nearest Neighbors Based on Computer Vision. Computers. 2021; 10(9):112. https://0-doi-org.brum.beds.ac.uk/10.3390/computers10090112
Chicago/Turabian StyleCorso, Marcelo Picolotto, Fabio Luis Perez, Stéfano Frizzo Stefenon, Kin-Choong Yow, Raúl García Ovejero, and Valderi Reis Quietinho Leithardt. 2021. "Classification of Contaminated Insulators Using k-Nearest Neighbors Based on Computer Vision" Computers 10, no. 9: 112. https://0-doi-org.brum.beds.ac.uk/10.3390/computers10090112