
Active Learning Activities in a Collaborative Teacher Setting in Colours, Design and Visualisation


School of Computer Science and Electronic Engineering, Bangor University, Bangor LL57 2DG , UK
Computers 2022, 11(5), 68; https://0-doi-org.brum.beds.ac.uk/10.3390/computers11050068
Submission received: 31 January 2022
/
Revised: 7 April 2022
/
Accepted: 13 April 2022
/
Published: 29 April 2022
(This article belongs to the Special Issue Selected Papers from Computer Graphics & Visual Computing (CGVC 2021))
Abstract
:We present our experience with developing active learning activities in a collaborative teacher setting, along with guidelines for teachers to create them. We focus on developing learner skills in colours, design, and visualisation. Typically, teachers create content before considering learning tasks. In contrast, we develop them concurrently. In addition, teaching in a collaborative setting (where many teachers deliver or produce content) brings its own set of challenges. We developed and used a set of processes to help guide teachers to deliver appropriate learning activities within a theme that appear similarly structured and can be categorised and searched in a consistent way. Our presentation and experience of using these guidelines can act as a blueprint for others to follow and apply. We describe many of the learning activities we created and discuss how we delivered them in a bilingual (English, Welsh) setting. Delivering the learning activities within a theme (in our case, colours) means that it is possible to integrate a range of learning outcomes. Lessons can focus on, for instance, skill development in mathematics, physics, computer graphics, art, design, computer programming, and critical thought. Furthermore, colour is a topic that can motivate: it sparks curiosity and creativity, and people can learn to create their own colourful pictures, while learning and developing computing skills.

1. Introduction
Everyday, we are captivated by colours in nature: bright yellows to deep greens of luscious grasses, radiant browns of the leaves in autumn, colourful birds, and beautiful delicate flowers. Colours also abound in our manufactured world: from the clothes we wear, cars we drive and images we make and see on our computer screens. Using coloured pens and paints can help us relax and are used in therapy, while the science of colour, optics and measurement, quantification, and recording of colours can be studied and analysed. Therefore, the study and use of colours can help motivate a wide range of scientific topics, stimulating a range of learning, skill development, knowledge, and understanding.
In addition, beyond the unequivocal scientific knowledge of light mixing, colour frequencies, and so on, there are many other complexities, ambiguities, and possibilities. These produce opportunities that can help motivate creative thought, critical thinking, decision-making, and other high-level thoughts. For example, naming colours, choosing colours for design work, and finding the right shade are all challenging tasks with uncertain outcomes [1]. Subsequently, working through design guidelines, discussing choices, and investigating possible decisions can lead to more open-ended discussions of design, ethics, perception, visualisation, and broader understanding of the world we live in, all essential skills for the learner to develop. In fact, human perception of colour is individual—what people see is different from other people—and colours are perceived relative to other colours, lights, and shade. Consequently, there are many colour models that have been invented, which attempt to simplify colour spaces and different ways to encode them on a computer. Thus, all these complexities can help engender deep thought in the learner, provide a range of topics that will interest him/her, and help develop his/her skills. Essentially, there are different levels of understanding: from the colourful rainbows a beginner would understand, to more complex issues of colour perception. We reflect this breadth of skills by classifying the lessons as beginner, intermediate to advanced.
In this paper, we describe the structure of our course around the theme of colours, design, and visualisation, which is underpinned by active learning activities. The learning material is divided into a set of smaller lessons, each having one or more learning activities. In other words, it is not a matter for the teacher to merely explain the point or describe the concept; instead, the teacher needs to create an activity that the learner reads and follows. The activities structure the learning process, propelling the learner through the material. Furthermore, our infrastructure enables different teachers to create the learning sessions and is presented bilingually (English and Welsh), and our guidelines help to keep the activities consistent in structure and appearance. Other researchers will be able to take these structures and apply them to their own topics and lessons. Through the variety of activities, learners develop a broad range of skills and knowledge through following activities around the topic of colour. Throughout the paper, we highlight specific points that we want learners to understand and skills that we want them to develop. These include to critically think about the work before coding (and not to just jump into programming); to learn more about colours; to develop basic computer graphics skills (such as using layers in graphics and coding colours [2]); to develop basic design and visualisation skills and learn and improve computer coding skills; and above all, to have fun with STEM activities around colours, design, visualisation, and graphics.
We contribute a careful structure of active learning activities and principles, which can be followed by other people who wish to develop learning materials online. We also contribute a set of lessons around colours, design, and visualisation, which learners may wish to follow or teachers use in their own lesson planning. We organised the paper into three parts. First, we describe the background and related work (Section 2 and Section 3). Second, we explain how we developed the infrastructure and describe the guidelines to structure and publish each learning activity (Section 4). Third, we describe some of our activities. These include: introduction to colours, critical thought and design thinking, setting up a coding environment (which we use for several activities), colour basics, visualisation, colour effects, and more advanced activities (Section 5, Section 6, Section 7, Section 8 and Section 9).
2. Background
Teachers have long adopted new technologies and have incorporated and explored novel teaching strategies. This is especially true of the coronavirus pandemic, which engendered much innovation in teaching, where academics and teachers had to change, and adapt their teaching, to online delivery. Likewise—as academics in computing and engineering, who teach computer graphics [3], programming, optics, engineering, and so on—we wanted to help students learn whether they were (or not) part of our University. In particular, at the start of the pandemic, there were many students who wanted to learn, but were not sure what material they should follow. This need spurred us to create a series of learning activities for the public.
Especially seeing the many rainbows that appeared in people’s front windows, in celebration of the workers of the National Health Service, we were enthused to consider that we could create a set of learning activities around colours, rainbows, design, and visualisation. Our vision was to create a range of activities that would excite and encourage people to learn about colours and develop basic programming skills, critical thought, and so on, to more complex skills of critical thought, design, visualisation, decision-making, and ethics. Pulling together interested volunteers and calling the work “Project Rainbow” [4,5], we started to develop the content. Our focus was to develop material that was themed around colours, for people who wished to learn computer programming, creative, and visual computing skills. We would direct the material to students at secondary school, college, or universities who wished to follow an introductory to coding course. We had two priorities for the infrastructure:
Our first priority was to insist that every lesson had one or more learning activities. Learners are more likely to retain the information and understand it in a deep way if they can interact with the material in some way. Students who wish to learn need to engage with the content and try it out for themselves. Shuell [6] writes “Without taking away from the important role played by the teacher, it is helpful to remember that what the student does is actually more important in determining what is learned than what the teacher does”. With active learning, the students take an active role in the learning process [7]. They are not, merely, listening or reading about a topic; instead, they are trying, practising, or even failing at tasks. They are “learning by doing” [8] and applying their knowledge to solve problems and tackle challenges.
Many people on the team had experience with developing learning activities, Project-Based Learning (PBL) styles [9] and authentic learning strategies. These include, for instance, the Five Design-Sheet method (FdS) [10], which divides the design challenge into a subset of individual design tasks, and the Explanatory Visualisation Framework (EVF) [11], which pivots the learning course around an authentic learning task. However, active learning activities are not familiar to everyone. Focusing on the learning activity, rather than the content, requires the teacher to rethink and re-organise how the material is created and presented. It is not a matter of writing the material, organising the lectures, and then, finally, contemplating what assessment or task could be asked of the learner. On the contrary, the teacher needs to realise the outcome and purpose of the learning, followed closely by the activity. We insisted that every lesson was built around a learning activity. A variety of activities could be imagined, such as building something out of cardboard, answering questions, performing research, following an example in code, extending the code, and so on. We encouraged teachers to explore different activities, but whatever task was chosen, it should be clear what the activity was to achieve, would develop skills, be appropriate in the colour theme, and be useful to the learner.
Our second priority was to organise the material into one coherent course, themed around colours. Ours is a constructivist approach [12], where we set up the infrastructure and the students solved the problems to learn the material, without teacher intervention. We wanted several academics to get involved and develop content, because there was a broad range of skills in the school, and people had volunteered their skills and time. Thus, we needed to develop an infrastructure that would allow teachers to publish content when they had time to do so. When one person creates and delivers all the material, it is more straightforward to be consistent. They can hold, in their mind, tacit knowledge of the course structure and how it will be delivered. When working collaboratively, it is much more difficult to keep the delivery of the material consistent and focused. Probably, when working collaboratively, a detailed plan needs to be created, and people develop specific parts of the course; however, we did not wish to create a detailed plan, and instead wanted to encourage a range of lessons to be delivered, based on the theme. However, there are advantages in working as a group, because people can check each other’s work for accuracy and clarity. We wanted to have the best of both worlds: make a consistent structure, with material that looked like it was of a coherent and well-planned course, but be able to adapt and expand as and when people had time and ideas about materials they could add. Consequently, we needed to develop an infrastructure that would support people to present lesson content, allow the work to be peer-moderated before final publication, and look consistent. Subsequently, we developed an infrastructure using WordPress and established guidelines such that the material followed a similar structure, were tagged appropriately (so that they can be searched), and had a similar appearance.
3. Related Work
We focus on three areas of related work: first, the aspects of pedagogy, second, the activities and content, and third, the specific details about colour, design, and visualisation.
3.1. Pedagogy and Structure
There are many styles and strategies to help people learn, from more traditional chalk and talk lectures, flipped learning to blended learning. These have been successfully applied to a wide variety of disciplines. Whatever the style of learning is used, the aim is the same: to help people develop skills and knowledge in a particular area. We are proponents of active learning strategies, where learners take an active role in their learning, try out and test their ideas, and take responsibility for their own learning. The concept of activity in learning is not new [13], being central to John Dewey’s pedagogy [14] and Gibbs [15]. However, active learning is more than merely creating a set of activities for the learners to achieve [13]; instead, the strategy aims are to encourage participation with the material, build inventiveness and creativity, and develop students’ enthusiasm for the topic. Certainly, the material should allow learners to create something, but also place the new information into context with other knowledge, encourage learners to look further, help them develop a range of skills, and reflect on what they are learning [16].
To foster the next generation of skilled scientists and engineers, and people in STEM, it is not a matter of solely teaching one subject (such as computer programming), but rather, developing a suite of skills, emphasising logical, creative thinking, and problem-solving skills. The colour theme is ideal for this purpose. It is visual, affords creative activities, draws on a wide range of knowledge and skills in science, technology, engineering, and mathematics, and hopefully, is a topic that interests a broad range of people. Different lessons would help students develop different skills. Consequently, in Project Rainbow, we decided to encourage a sequential approach, where the material is split into several smaller lessons. In each lesson, a learner works through a series of activities. The lessons integrate background material and theoretical information, with practical skills. Each activity is designed to help learners analyse and synthesise the material, and then reflect on their work [17].
Being a reflective learner is important. It is important for the learner to realise what he/she has achieved and start to consider how it could be applied to other problems. Gibbs [15] writes “It is not sufficient simply to have an experience in order to learn. Without reflecting upon this experience it may quickly be forgotten, or its learning potential lost”. Not only do we instruct learners to follow the activities, but the lessons include questions, further tasks, and external links and references to additional relevant information, such as research papers and books. In some parts, we add commentary in the lesson, to explain or highlight standard and typical approaches, and add “top tips” in the margins and questions in the lesson, to help learners reflect on and question the material. In this way, we hope to develop not only intellectual knowledge, but also allow learners to practice that knowledge [18]. We are also keen to encourage experiential learning [8], where the learner can develop his/her own skills in design, creative thinking, and crafting of computer graphics pictures [11]. With our goal of putting the learning material online, we encourage the learner to follow the material on their own. This means that there is less teacher and peer interaction. The responsibility for learning is shifted from the teacher to the student.
To organise this material, there are several different structures and frameworks that we could follow. For instance, the decision processing model by Simon [19] suggests splitting the work into Intelligence, Design, Choice, Implementation, and Review. However, we wanted to make each lesson stand-alone, and this model relies on teachers explaining much background information first. We could follow our Explanatory Visualisation Framework (EVF) [11] process, which encourages students to perform their own research on a topic, create a report, make a design, plan, develop, and then reflect. However, the EVF structure also requires that the teacher intervenes at specific parts, to evaluate the research report, design document, and so on, which did not seem appropriate for our goals. However, the structure of the EVF and those by Munzner [20], McKenna et al. [21], and Sedlmair et al. [22] have similar traits. Each elaborates four key stages: performing research, design, development, and reflection. We chose to adopt this structure. However, rather than asking learners to perform their own research on the topic, we instead explain the background and reference material, which they act upon in the activity. We include references to material on the web, for them to follow and reference, so that they can perform their own research. Students learn about the ideas (research), consider and envision what the visual output would look like (design), achieve the activity (development), and finally, reflect on what they have done. The order by which these parts come may differ depending on the task. For instance, often, both the development activity and reflection stages are integrated throughout the lesson, where the learner is asked to design something, create, and reflect on it, then create something else or an extension, reflecting on the new output.
3.2. Content and Activities
The breadth of possible content that we could include, around the theme of colours, design, and visualisation, is wide. We could get learners to think and learn about the physical properties of light, frequencies, spectra, to aspects of human biology and how the human eye works, to design thinking and creative coding. Indeed, this is exactly why this topic works well. Colour not only provides variety in the type of material that can be learned, but also supports a wide range of problems to be explored, which in turn help students develop flexible knowledge, their individual problem-solving skills, and because it is a creative topic where they build something, it hopefully intrinsically motivates them to learn [23]. We wanted to allow academics freedom to explore different topics and skills to learn; however, there were some important topics and skills that we knew we wished to cover, from basic colours, critical thinking, envisaging the outcome of the activity, and exploring alternatives.
First, we needed to include some introductory material that presented the basic ideas around colours and rainbows. This was important, because it would act as reference material on which other lessons can build. However, it can be challenging to develop learning activities for introductory topics [24], in particular because students would not be able to apply the knowledge of the material. However, because we are delivering the course to secondary school children, or those at university, we decided to create introductory activities that relied on prior skills, such as sketching, painting, and thinking about colours.
Second, we believe strongly that critical thinking [25] and planning are core skills that we want students to develop and apply. Facione [26] writes that critical thinking is “purposeful, self-regulatory, judgement with results in interpretation, analysis, evaluation and inference”. We want students to think about the material, achieve the tasks, and think critically about their work. Indeed, being able to envision how a task may turn out and critically consider different possibilities are important skills. We want the learners to work through the tasks in a mindful way. Learners apply their knowledge, understanding of the topic, previous experience with performing similar tasks, and so on. The lessons are therefore multi-staged and goal-oriented. Dewey’s [14] process on thinking and reflection explains that people need to recognise the problem and want to set out to complete the task and find a solution, define it, and suggest and reason about possible solutions, before experimenting, accepting, or rejecting the solution. Therefore, we required academics to make it clear what the goal of the task is, what the students will achieve, and how they will get there. To enact this goal, we had teachers include a summary of the goal and task of the lesson; every lesson included an indicative image, and each lesson had a “go further” part.
Third, envisioning a potential outcome is an important skill. Students need to have a clear understanding of what they will achieve and what the outcome could look like, which gives them a target and clear realisation when they have fulfilled the task [27]. We believe that having a clear visual picture of the goal is especially important when students are learning to code. When learners make plans, or at least have a clear vision, in their mind, of what they want to create, they make less mistakes. However, from our experience with teaching computer programming, we have observed that learners have a tendency to jump straight into coding, without really thinking or planning what they are doing [28]. Consequently, there is much worth in getting learners to first reflect and think critically on what they are about to do [29]. We do not want students to write all their code on paper; however, we do want them to understand what they want to achieve with their code. Drawing on our previous experience in this area, we could ask the learners to perform a Five Design-Sheet (FdS) study of their ideas [10,29]. However, the full FdS sketched design study can take students over two hours to complete, and therefore, we felt that it would be too time consuming and that the early learners could either not complete it or perhaps be discouraged through trying to achieve it. In addition, we wanted learners to critically consider what they were going to achieve and consider the best course of action. We want learners to think about the activity, understand the goal, even envision the final output, have an understanding of the tasks required to perform the solution, and then, work through the stages. Subsequently, we decided to integrate the Critical Thinking Sheet method (CTS) [30,31] at the start of many activities. People sketch, plan, and write about the solution on a single sheet of paper. This strategy is quick to perform, as learners only need to complete one page, and it provides a picture of what they will create.
Fourth, we want to encourage people to explore alternative solutions [32], produce multiple views [33], and above all, enjoy the learning experience. Therefore, while sometimes, the activities include a strict set of commands, in other places, we are deliberate to encourage freedom of expression and creative thinking [34]. Colour is a topic that evokes creativity. For instance, just performing an Internet search on colour, painting, and colour design returns hundreds of imaginative and colourful pictures and artworks. Some activities can encourage serendipity in creative design [35], where different pictures are created through changing variable values or by adding random numbers.
We wanted to include a wide variety of activities. We acknowledge that there are many activities that we could have included, such as brainstorming using cards (e.g., vizitcards [36]), construction by using tokens [37], getting the students to do some informal sketching [38], or perhaps perform their own research and make a table of tools [39], which we could adapt to be a table of colour tools. However, we chose to develop a new set of activities. We wanted the activities to directly relate to each lesson, be focused on rainbows and colours, and address particular learning goals of that activity. Additionally, to break up the coding challenges, we decided to also add some crafting activities and encourage learners to craft something [40], without the need or a computer, as per the principles of the CS unplugged initiative [41].
3.3. Colours and Colouring
There are many lessons about colour on the Internet. However, most revolve around basic computing skills or painting and design. For instance, lessons cover: colour coding on a computer, colour choices, colour models including Red Green Blue and HSV [2], understanding colour depth (such as 8 or 24 bit colours), the resolution of images, and so on. There are resources that help teach colour mixing for painting [42] and colour perception and design [1] and describe colour use in art and history [43]. Many computer graphics books cover colour and are used as textbooks at the university level, such as Foley et al. [2] or Hearn and Baker [44]. However, there are few resources that focus on colour activities. There are some exceptions. Simple activities exist, such as name colours, remembering colour codes (white, black, blue, purple, for example); websites such as http://processing.org (accessed on 30 January 2022) have some tutorials around colours, and Josef Albers’ book [45] and mobile app https://albersfoundation.org/teaching/josef-albers/interaction-of-color/ipad-app/ (accessed on 30 January 2022) on the interaction of colour include many activities demonstrating the effects of light and how the appearance of colours changes depending on where they are displayed.
Colour perception is a well-researched topic [46], and data visualisation developers use colour to depict data. However, while rainbows are definitely colourful and can be used to create interesting computer graphics pictures, there can be several challenges when using the rainbow colour map. These issues manifest when using rainbow colours to display data, represent information, or present information consistently across devices. One challenge is that the rainbow colour map is not continuous in illuminance [46]. Therefore, data displayed in a rainbow colour map can mislead users [47]. Another challenge is that, sometimes, low and high values are mapped to dark colours (at the extremes of the rainbow hue), which can lead to people misunderstanding data. In fact, many researchers have campaigned for people to not use the rainbow colour map. Rogowitz and Treinish call for “the end of the rainbow” [48,49]; Borland and Taylor suggest that the rainbow colour map is still harmful [50], while Crameri et al. [51] explain wider issues of colour in science communication. We acknowledge these challenges when using the rainbow colour map in a few activities and reference further reading materials. However, our goals are broad, wider than focusing on specific issues of the rainbow colour map: we wish to create a series of interesting learning activities around colours that motivate people to be creative and to develop creative skills.
4. Developing the Activity Structure and Learning Pathways
To develop the site, we decided to use WordPress (WP). We made this decision because we wanted to allow different people to edit specific parts of the site, and it would be mobile ready, accessible, and available on different platforms. We created three parts to the learning site: (1) landing page and information, (2) activities, and (3) study guide. The landing information is a WP page; activities are WP posts; the study guide is a dynamic page built from categories and tags.
4.1. Landing Page
We decided on a visual landing page with a simple design (shown in Figure 1) and kept minimal information on the front page. We included a brief explanation that these are “STEM activities focusing on colours, light and optical effects”, included the list of activities, and provided a search for interesting activities. We did not want to have a long explanation of colours or describe information about the project, because we want learners to get going with the activities. Scrolling down the landing page gives direct access to the activities. Only specific authors have permission to edit these high-level pages. WordPress also allows different plugins to extend its main functionality. We used two additional plugins: First was a translation plugin to allow us to have dual language support (English and Welsh). Most academics started writing their activity in English, which was translated into Welsh by themselves or translated by another Welsh speaker. Second, we wanted to keep logs of activities to understand how the site was being used, and so needed to use cookies. Subsequently, we developed a privacy notice and cookie policy and allowed users to accept or reject our use of cookies.
4.2. Guidelines to Create Learning-Activities
Using WP meant that we could create individual activities as blog posts and post them to the site when they were available. Using the permissions and editing capability of WP meant that several academics could create the activities and not have access to the wider setup of the site. We also developed a set of written guidelines of how to write, create, categorise, and tag each post. The guidelines define the structure of each post, create categories, which are used to organise the site content, and the type of tags that would be useful for the site, which allow search engines to find individual activities.
Our guidelines for the activity structure needed to be well-defined, such that posts from different people were similarly structured, focused on an activity, and appeared visually similar, but also that they were not to restrictive as to constrain the type of activities included. Therefore, we decided to suggest the features of each activity, rather than any specific content or wording:
- Each activity needs a descriptive title. The title needs to be short and explain what was to be done by the activity.
- Introduce the activity and the material. Include necessary background information with links to external sources. Explain the activity with enough detail to allow the student to imagine the output or result.
- The activity should be central to the lesson. There can be several stages to the activity, or several activities could be included in the lesson. Whatever strategy is followed, it is imperative that several steps are included and each step is ordered appropriately and clearly numbered. The steps can be interwoven with descriptive and explanatory information. However the activity is explained, what is imperative is that the instructions, purpose, and steps required are clearly presented. It is also important to consider the learner, his/her skills, abilities, background, and any colour vision impairment [52], for instance incorporating principles of colour-blind-safe colours [53].
- Images or photographs should be used within the lesson. They must include a caption and relevant accessibility text descriptions (alt text) to improve website accessibility and search engine optimisation.
- Several “top tip” summary boxes should be added. They should be formatted in the same way and be used to highlight something to remember or a skill to learn.
- The lesson is created as a post in WP and must also include a summary description and have an associated indicative picture, which will be used in the learning pathway section. While the activity should be understandable in itself, it could link to other prerequisite activities.
- Somewhere in the lesson, there should be questions to help students consider the material in a deep way. This could be achieved by including a set of instructions to help students “go further” or instructions or questions that encourage learners to perform additional exercises.
- Any code used should follow the defined coding style (which is defined in CSS and added to WordPress). The style includes line numbers, consistent colouring, and highlights keywords. Following a code style means that every code fragment is formatted in a similar way.
We wanted to have a simple way to organise the activities. We used the categories mechanism in WordPress. Three examples are shown in Table 1. This allowed us to organise the material through the WordPress mechanisms. Consequently, we needed to define a set of categories, such that different academics would know how to label their activities.
The first category we required academics to include was one to define the level. There are several mechanisms we could have employed. We could grade the activities by level (e.g., secondary school, university), classify them by defining a difficulty grade (e.g., between one and five), or label them by a general name (such as beginner or advanced). Indeed, as a group of academics, we deliberated over these different mechanisms. Each of these classifications have their challenges, in particular because we do not know the attainment level of the learner. Potentially, we could have implemented an entry quiz to define the learner ability, but this would be more time-consuming and challenging to implement: it could provide another barrier of entry and would definitely delay when the students start the activities. Consequently, we decided to choose three simple labels: beginner, intermediate, or advanced. This convenient labelling scheme provides a mechanism for people to self-select their ability. Beginner we describe as new to programming and do not know much about colour. Intermediate activities develop skills for students who have coded before and know something about colour. The categories labelled advanced are for those who have done a lot of programming already. Additionally, we insisted that the posts were categorised with three additional high-level labels: “project rainbow”, “colours”, and (if a programming exercise) a computer language, e.g., “Java”. We used these WordPress categories to help organise the site and allow people to better navigate the site.
We also needed a way to organise the material in a more descriptive way that was specific to a lesson. This would also allow people to search for and locate specific topics of interest. For this purpose, we used the tags mechanism in WordPress. We allowed teachers to choose their own tags, but encouraged them to select words that described the whole activity or individual parts of the activity. We proposed that the best way to achieve this was that teachers think through each step in the lesson and provide a tag name for each part. For example, with the coding tasks, the tags would describe different aspects of the code, such as colour, grid, for loop, array, and so on. They will be used to organise the activities and allow search engines to match learners to the best learning activity.
Creating the guidelines for the creation of each lesson post is useful. Not only do they provide a standard way of creating the posts, but the act of creating the guidelines helps to confirm what is important. Therefore, to create a lesson, teachers should:
- Follow the eight-stage activity structure, including title, lesson introduction, background information (with links to external sources), central activity or several activities, images/photographs, and several top tips. Any code should follow the coding style.
- Define categories. Authors need to categorise each post as “Project Rainbow” and label each as one of beginner, intermediate, or advanced.
- Add tags. Authors should add five or more tags. The tags must describe different parts of the activity. We encourage adding common tags such as colour, critical thinking, HSB, others that describe the programming language (e.g., Java, JavaScript, Processing.org), and those specific to individual parts of the activity. These tags help to describe the activity, can be used in search engines, and together offer insight into the type of activity that is asked of the learner.
- Create a summary description. Include a summary description of the activity, focusing on the task that the student will achieve. This will appear in the learning pathway section.
- Translate. Authors need to organise the translation into Welsh, or vice versa.
- Peer review and publish. When completed, each activity is peer-reviewed by a colleague, for its accurateness, quality of post, clarity of instruction, and appropriateness for Project Rainbow. Academics could nominate another user of the system to act as their reviewer.
4.3. Study Guide
The final section to the site is the study guide. Screenshots of different activities are shown in Figure 2. While all learning is a personal experience [54] and some students will find their own learning strategies [55], we wanted to publish a suggested way to navigate the material. Our suggested learning pathway organises the lessons in order of beginner, intermediate, and advanced. We provide a suitable structure to linearly progress from one activity to the next. Students can use this list as an index into the material. Our learning pathway mixes types of activities. Some are practical activities that move the student away from a computer (sketching, using a laser pointer, etc.), while others are programming activities. Many of the activities use the http://processing.org (accessed on 30 January 2022) library, while others use JavaScript or CSS. We chose processing.org [56] because it was developed to create visual images and has been used with learners with wide abilities. If someone wishes to follow the activities in a different order, then they can search for specific topics. This is possible because the posts are tagged and classified in a consistent way. Students can search the Project Rainbow site for specific keywords or select only (for example) beginner exercises.
5. Introductory Activities—Learning about Colours
We included several introductory activities and explain four here. Our aim was that through these activities, the learner will learn something new about colours and develop his/her knowledge in an accessible and interesting way. When developing introductory learning materials, it can be challenging to know the level and writing style. We did not want to patronise, but we did want to cover basic concepts, which would become the foundation that other activities could reference. Consequently, we mixed basic knowledge with information that people may not know. For instance, when introducing colours, we obviously made reference to the colours of the rainbow (Red, Orange, Yellow, Green, Blue, Indigo, and Violet) and made reference to the mnemonic Roy G. Biv. This is a useful mnemonic because it highlights the main three primary colours Red, Green, and Blue, which helps us lead onto the RGB colours that are used on computers [2].
The first activity gets students to create a colour spinner. We include step-by-step instructions for how to create and use one and a downloadable template that can be printed and cut out. We use this activity to help discuss basic concepts in rainbows in nature and light (see Figure 3). We explain how rainbows in nature are formed and that the second arc of a double rainbow is reversed. We discuss different aspects of colour, such as the colours of a rainbow, as seven distinct colours, are attributed to Aristotle (384–322 BC), but they may have been developed by Aristotle’s successors Theophrastus or Strato. We explain that Newton, with his colour circle, described how coloured lights can be mixed together and that he only used five colours, but adding orange and then indigo to match with the seven notes in a major scale. This information helps to get people to critically think about colours and understand that the seven colours in a rainbow are artificially named. We link to external sites, such as Wikipedia pages, to allow people to read about the topic, discuss mixing paints versus mixing lights (subtractive and additive colour mixing), and define terms such as colour hues.
The second activity focuses on coding colours using the RGB model, finding and naming colours. We discussed, as a team, if we should teach RGB or Hue–Saturation–Value (HSV) colour spaces first. HSV has the advantage that the colours are ordered by the rainbow hue; however, after deliberation, we decided that it was important that learners understand RGB colour coding. Manipulating RGB colour spaces can be confusing, and we thought that it would make a good activity. We added a further post at a later time, on the topic of colour spaces. We were careful in our wording about the RGB colour model and defined technical terms when needed. We used a colour picker that we embedded into the WordPress post. There are many colour pickers that could have been used, such as Google’s colour picker or the W3Schools HTML colour picker. While each has its advantages, we decided to embed our own colour application into the page (created with p5.js), shown in Figure 4b. The embedded colour picker meant that learners could stay on the page while exploring the activities. If people wished to look at more advanced colour pickers, they could visit the external sites. In addition, it would have been possible to perform a similar activity in processing.org, edit p5.js, or in HTML, and we had plans to create activities around these different pickers. However, at this stage, we wanted to focus on basic principles and not rely on coding knowledge, so chose to use the embedded colour picker code and focus on the colours themselves, not any specific picking tool.
The third activity gets students to bend laser light in a glass of water (Figure 5), and the fourth gets students to add a rainbow to an image. Integrating a broad range of different activities into Project Rainbow was useful. While some activities needed computers, other activities encouraged students to move away from their computers. Hopefully, people will have a laser pointer (such as from a cat toy). We list the materials (pint glass, washing liquid, laser pointer) and provide the instructions in a YouTube video. While for the fourth activity, we give instructions using Photoshop, we explain the process such that people could use another editor, including: load an image, create a rectangle, change the gradient fill, rasterise, change opacity and blur. In fact, we used this image as the memorable image for the whole site (see Figure 1).
6. Planning Activities—Critically Thinking and Sketching Proposed Solutions
There is an advised order for some activities. We explain at the start of an activity if it would be advisable to take another before. For instance, introduction to colours and RGB colour coding are important to understand, but the laser pointer and Photoshop activities could be taken later. Notably, many activities rely on the next four activities. First, it is important that students download the http://processing.org (accessed on 30 January 2022) sketch environment and understand how to us it. Second, the Critical Thinking Sheets (CTSs) are used in several activities. Third, understanding some basic computer graphics principles will substantially help learners be able to develop graphical code more easily. Finally, understanding the Hue–Saturation–Value (HSB) colour space is important and heavily relied upon in later activities.
Subsequently, the introduction to the processing.org [56] environment is important. We make it interesting by directing the activity around creating randomly positioned, RGB coloured lines (see Figure 6). When taught at the degree level (in our introduction to computer graphics unit), we add much more detail. We discuss different coordinate spaces (right-handed and left-handed coordinate systems [2]) and different ways to express lines, for example: in processing line(x1,y1,x2,y2); path descriptions in SVG <path d="M 100 100 L 300 100 z" stroke="blue"/> to move the turtle in Logo graphics forward 100. However, we decided to keep the activity focused on setting up the environment and included basic computer graphics concepts. At this stage, we use static sketches in processing.org which keeps the programs simple by creating a single image, without animation or interaction.
Understanding the structure and use of the Critical Thinking Sheets (CTSs) [10,11] is another important goal, as the method is used in many activities. The activity gets students to contemplate and reflect on their task and make plans and strategise appropriate solutions—skills that are often omitted [25]. Understanding and envisioning the goals of the tasks is important, especially with coding. We do not want learners to rush straight into coding. Instead, we want them to critically think about their problem, make a sketch, and write some ideas about how they could solve it. Through this strategy, bad ideas or misunderstandings can be thrown out. Especially when programming computer graphics, learners often jump into code too soon. They write some code, try out values, see the response, and try some more. This trial and error process takes time and can be reduced with some thought and planning, which we achieve through the CTS method.
The Critical thinking Sheet (CTS) method [30,31] gets learners to think about their challenge from five complementary angles. Figure 7 (left) shows the layout of the CTS sheet and labels the five parts. First, the learner needs to ➀ explain the challenge in about two short sentences. Then, they ➁ sketch a picture of what the outcome could look like; labels can be added to help explain the parts. In Panel ➂ the main components, facets, or parts of the idea are considered. Panel ➃ allows the student to think about the process and the individual algorithmic steps that are required to implement the design. Finally, in Panel ➄, people can consider what they need to do next to implement it.
We encourage students to complete the CTS by hand. We provide a PDF of the sheet, such that students can print it out and sketch the solution in pen or pencil. We encourage the use of pen and pencil from our positive experiences with sketching on paper for design ideation, when people use the Five Design-Sheet design study [10]. Indeed, from our experience, students who have used the CTS through tablet PC interfaces have performed less well than those using traditional pen and paper [30,31]. It is much easier for people to complete the sheets by hand and quicker for them to make sketches. Students readily know how to use a pen and quickly complete the sheet. However, it takes them much longer and the outcome is not as clear or expressive if done on a touchscreen or computer. It seems that students get distracted by technology (deleting, editing, resizing, colouring, aligning, and so on) rather than focusing on the main ideas and contemplating appropriate solutions. We acknowledge that the situation may change in the future. Tablet interfaces are getting more prevalent (with many students having ready access to smart phones, tablets, or touchscreen PCs), but their skills (currently) are still less refined than with pen and paper.
Completing all five steps of the CTS is important. When learners have to explain the challenge and write it down in a small space, they are forced to think hard and critically about the core ideas. Making a sketch helps learners externalise their vision. The drawing not only provides a record of the idea, but when they start coding, they can use this picture as a measure of how far through the project they are. They have a picture to help them know when they have completed it. When people summarise the problem into “parts”, they need to imagine and break the problem into individual parts (analysis). Plus, they need to put similar ideas together into overarching categories (synthesis). The importance of Panel 3—breaking the idea into individual parts—cannot be understated. The ideas here can be used to help the student break the idea into separate parts—strategies often used in computing. For instance, Dijkstra [57] suggests to consider a “separation of concerns”, where different functions achieve separate tasks. One such separation is exemplified by the Model, View, Controller pattern [58] (where the View reflects the Model and the Controller updates the model). This type of thinking helps to prepare the learner for concepts that will be used in the future, in preparation for using constructs such as MVC, classes and objects and other structures if later they build an object oriented solution and, in our case (in Figure 7), primitives and attributes. In panel ➃ they are thinking about the algorithmic steps and the important stages of the algorithm. Finally, the fifth panel forces them to reflect on all of the ideas that they have contemplated and consider what they will do next to move forward from ideas to practice.
To achieve the lesson, we chose to create a rainbow scene, with a tree and some grass. An example of a completed sheet for the rainbow scene is shown in Figure 7. In this case, Panels ➀ and ➁ are relatively straightforward. However, Panel ➂, which gets learners to summarise the system into parts (consider different facets of the system), is more time-consuming. In addition, we want students to learn some basic computer graphics terminology (such as graphics primitives and attributes). In fact, this scene can be made by using simple graphics primitives of coloured circles and rectangles. We explain what each of these are and provide examples. Circle primitives can be used for the rainbow, rectangles and circles for the tree, and rectangles again for the grass. Attributes for the rainbow (red, orange, yellow, green, blue, indigo, violet), trunk colour (brown), and leaf colour (green)and shown in the middle-right panel on the CTS Completed sheet, in Figure 7.
To understand the graphics drawing process, we created a physical mockup of the scene; see Figure 7 (right). This process will help the learner consider the steps needed to create the picture, using layering effects in computer graphics [2], where the rainbow parts are made from circles and they are positioned at the back. Subsequent circles partially occlude earlier circles. Then, the grass is added, which occludes part of the coloured circles, allowing them to appear as semi-circles to make up the rainbow shape. Finally, the tree is added, with the leaf circles on top, as they are the closest to the observer. Using this physical mockup, it is easy to explain how the visual illusion turns the rainbow-coloured circles into arc-like visuals. We could have used arc primitives for each rainbow part, but this would not necessarily describe the graphics principle of layering objects.
7. Colour Coding Activities—Colour on a Grid Pattern
We developed a suite of activities that taught aspects of placement and position in computer graphics. When creating computer graphics pictures, it is often useful to separate concerns. For instance, positions (such as positions on a chessboard) can be considered separate from locations (x, y coordinates). In terms of coding, this means that the iterator controls the positions and the multiplier controls the actual location, which scales the position to gain the actual location on the plot. Understanding this abstraction is extremely useful in computer graphics. Consequently, we use the CTS to imagine the loop structure and ascertain the multipliers for the scaling of the position. Figure 8 shows one of our visual explanations of the loops, where we use a for or while loop to control the grid position and multiply against the width (or height) of the rectangle to calculate the exact location in the coordinate space. The first and second activities use a single while loop to control the x value (and a random value to calculate the y position). The second and third activities use two for loops, to control the position, and then, a multiplier to calculate the location. We get the students to use the HSB colour space, explore how to add in the rainbow colours (as a percentage of the x position), jittering the location (by adding or subtracting random values), size change, and altering the transparency and size of the objects on the grid (see Figure 9).
8. Activities on Colour Use and Colour Effects
Colours can seem complex to understand at times. One issue is that our perception of colour is effected by surrounding ones. Johannes Itten names this the “colour effect” [1]. We developed several activities that explored colour effects and show how colours can be used. One activity gets students to name colours, print out blocks of colour (printing the pages in a pdf), and place them next to each other for the simultaneous-contrast effect (Figure 10 (left))—a similar activity to that of Josef Albers [45]. In another activity, we get students to explore value and allocate numbers to colours (from arrays). The activity therefore starts to introduce the principles of colour maps, linear mappings, and stored data. A further activity explores colour combinations and uses the 12-part colour wheel. Students create colourful artwork, inspired by Josef Albers’ blue- and red-coloured squares (Figure 10 (right)). Another activity looks at colour effects through line placement and transparency—creating line-art inspired designs.
9. Activities in Virtual Reality and CSS
Our goals with the advanced set of activities were to cover subjects that learners may not have done and to focus on areas that were associated with computer graphics research that is being undertaken by researchers at our University [3]. These include using virtual reality, augmented reality, and visualisation tools (such as the D3.js library). For instance, we developed some rainbow activities in WebXR using A-Frame (Figure 11a) and also augmented reality rainbows (Figure 11b). Colleagues have been researching methods to move beyond traditional desktop interfaces [59] and develop interfaces to help people become immersed in their data [60]. In other work, researchers have been creating novel visualisation tools, such as to visualise and explain paths of redress in law and administrative justice [61], visualising student journeys [62], or multiple views [33,63,64]. Subsequently, we wrote an activity using the D3.js library, which is a JavaScript library to help developers manipulate documents based on data [65]. The D3.js activity was used to develop code to “sing” the colours of the rainbow. Finally, we created an activity that led learners through the steps to create a rainbow in pure CSS code (Figure 11c).
10. Discussion
We believe the colour theme was successful. Certainly, colour is a topic that enables many skills to be developed and explored and enthuses people to learn. It provides an underpinning focus that connects all the activities together, and definitely, there are many different lessons that can be taught within this theme. Colour and creativity go hand in hand. Colouring books are often used to help people relax, and creative computing is certainly fun for many people [66]. Different types of creative development, such as designing webpages, games, and programming, are all tasks that inspire young people [67]. However, there are many challenges when using colour.
First, people find it a difficult topic to understand, from comprehending how colours interact [45], the intensity and range of colours [68], how they can be used to communicate effective information [47], to how colour affects the perception of objects [69]. When creating activities in colour, we tried to keep the instructions clear and to lead readers step by step. However, teachers need to be careful that they are teaching the correct information in a way that does not mislead. The guidelines that we employed along with our peer-review strategy all helped to create suitable teaching material. In addition, there are many more topics that we could have covered and activities to invent. For instance, it would be good to add a colour activity on mixing, using different lights and filters [68]. It would be exciting to see if it were possible to create more activities using objects that people would find around their home.
Second, colour vision deficiency can impinge on people using the activities. Indeed, many of our activities use the rainbow colour map. While this is easy to use, colourful, and creates interesting pictures, the created pictures are not colour safe. Colour vision deficiency is common, affecting about 8% of men and % women [70]. It can impinge on every-day activities, from choosing clothes to wear and understanding signage [71]. There is a huge opportunity to develop a range of active learning activities focusing on good practice in colour. Such material would help readers understand how to create colour-safe pictures, data visualisations, or patterns. Individual researchers have developed specific solutions. For instance, Borkin et al. [47] investigated best practices in communicating medical visualisations through colour-safe colour maps. In addition, tools, such as ColorBrewer [53], incorporate colour-safe colour combinations. While each of these instructions are useful, there is no one set of learning materials that is accessible for the public. Furthermore, there are few recorded active learning activities that provide guidance to use colour effectively. Subsequently, it would be interesting and exciting to have access to a wider set of guidelines that are focused on learners and include a range of activities of good practices in colour. It would be a resource that could be used by designers, visualisation educators, and many other people.
The guidelines that we developed provide a structure that other people can follow. These have been useful to help create consistent-looking and structured activities, with a clear set of tasks. The peer review process has helped to improve the lessons. We include some accessible guidelines so as to have clear titles, labels, alternative descriptions on images, descriptive summaries, clear goals in the tasks, and so on. Making the lessons accessible is important. Our academics are familiar with making images with high colour contrast, large fonts, well-structured slides, and so forth, and we have experience using Ally and other tools [72]. However, our guidelines do not address colour deficiencies or all possible accessible issues. We could run automatic checks on the lessons and report on their accessibility. However, we instead left these decisions to the teacher and creator of the activity. Any queries or questions can come through the reply mechanism, where the teacher can answer the questions and correspond with the learner.
We created a wide range of activities motivated by colour, from editing photos, coding colourful patterns to sketching designs. However, there are many more activities that we could create. For example, in other courses, we have taught fractals, picture generation by transparent designs and other effects, and more aspects of lights, optics, and other scientific topics. However, teachers could always do more. With the Project Rainbow structure, it is possible to create the activity and publish it when it is created. This means that people can start doing the work as soon as it is online. It also means that the quantity of activities can grow over time, and perhaps over time, the less popular ones will be removed from the system—in this way, refining and improving the learning material.
While also most of the activities involve computer programming, we included several crafting and sketching tasks. These allow people to move away from the computer. We are strong advocates for using a wide range of activity types in the teaching. We believe it helps to keep the learners interested, and people get to try out different techniques. However, it is clear that some learners do not enjoy doing different activities [29]. We found that some students (especially those studying for a software engineering degree) have expressed that they did not like the non-computer programming activities. They are a minority voice, and seem to be students who just want to code. The views appear to be from people who have more coding experience, in comparison to their peers. Perhaps, they are visualising and thinking through their code in their mind and, perhaps, have implicitly considered the issues already. However, anecdotally, we have seen the very same students perform less well in project modules, suggesting that they are missing out on the richness of developing their broader, critical thinking skills.
One of the main challenges, however, is that the activities take time and effort to create, especially to make them suitable for public delivery. Academics are busy people performing teaching and research, and it is challenging to find additional time to create these activities. Furthermore, care and attention are required to guarantee that the information is correct, clear, and can be followed by people. Stand-alone lessons need to have additional explanation, clear diagrams that explain, code examples, and so forth, to make them clear and easy to follow. Therefore, images need to be designed, created, edited, saved as a small file (for quick remote download), copyright free, and uploaded to the WordPress store along with an alternative description. Like any form of publishing, developing the content of each activity takes time and effort. In fact, we know that the activities went through many versions before being published. They were created, edited, refined, and reorganised many times before being peer reviewed, translated into Welsh, and published. Additionally, while this is now a bilingual resource, it definitely takes more time and effort to develop activities in two languages. The WordPress translation plugin was extremely helpful when creating this resource.
11. Summary and Conclusions
Developing Project Rainbow has been a rewarding experience, and we have had positive feedback from participants saying thanks and expressing that they have found it interesting and rewarding to follow. It is interesting to look at the statistics on the site. Some activities have been more popular; the activities on creating a coloured grid in processing, pure CSS rainbows, a rainbow in code, and learning the Hue, Saturation, and Value (HSV) color space were the most popular, with participants coming from the top five countries of Australia, the United States, the U.K., India, and Canada, respectively. Most referrals came from Facebook and Twitter. This seems sensible, because they were our two primary sources of advertisement.
We set out to create a set of activities focused on colour and rainbows; we achieved these goals and created a structure and ideology that other people can follow. Looking back, we now see much worth in the early discussions, when we deliberated how to set up the site. Making each of the activities a WordPress post enabled many academics to get involved with the project and to create activities. Developing guidelines of how to structure the lessons helped to make a consistent site and has started to influence how other taught modules are run at the University. At the start of the project, we were keen to develop learning activities, with the knowledge that they were useful. Upon reflection, we now have a stronger view that learning activities are necessary. We have since taken ideas that we have learned in this project and applied them to our own degree teaching. First, we re-used the materials in several classes and workshops, in particular, we used the Welsh versions of the ten http://processing.org (accessed on 30 January 2022) programming activities in the https://eisteddfod.wales/ (accessed on 30 January 2022) of Wales. Second, we re-organised some of the material and used them in our creative computing, storytelling, and design module unit. We followed the research, design, development, and reflection structure and ran a different activity each week to support the lecture material. We developed videos of the activities, wrote guidance material, and set a series of tasks for the students to perform.
Project Rainbow has been a success. It has enabled us, as academics, to create a range of public-facing activities. Members of the public and those at the National Welsh Eisteddfod have followed them in both Welsh and English, and we have learned and applied the structure to other projects and courses. The guidelines have helped us create a consistent site and allow different teachers to create content.
Funding
This research received no external funding.
Institutional Review Board Statement
The study was conducted according to the research code of conduct of Bangor University.
Informed Consent Statement
Not applicable.
Data Availability Statement
Data is contained within the article.
Acknowledgments
I acknowledge the staff of the School of Computer Science and Electronic Engineering for supporting this project. In particular, I acknowledge the many colleagues who helped to deliver the material, without which this project would not have been completed. Panagiotis Ritsos for the virtual reality and augmented reality activities, Peter Butcher for the CSS activity, Daniel Roberts for the laser activity and Welsh translations, Joseph Mearman for help with the website design, and Cameron Gray for help with setting up the website, web policies, and writing the D3.js activity are all acknowledged.
Conflicts of Interest
The author declares no conflict of interest.
Abbreviations
References
- Itten, J. The Elements of Color: A Treatise on the Color System of Johannes Itten; John Wiley & Sons: Hoboken, NJ, USA, 1970. [Google Scholar]
- Foley, J.D.; Van, F.D.; Van Dam, A.; Feiner, S.K.; Hughes, J.F.; Angel, E.; Hughes, J. Computer Graphics: Principles and Practice; Addison-Wesley Professional: Boston, MA, USA, 1996; Volume 12110. [Google Scholar]
- Roberts, J.C.; Ritsos, P.D.; Kuncheva, L.; Vidal, F.; Lim, I.S.; Ap Cenydd, L.; Teahan, W.; Mansoor, S.; Gray, C.; Perkins, D. Visualisation Data Modelling Graphics (VDMG) at Bangor. In Proceedings of the Research Labs and Projects: Eurographics 2021: The 42nd Annual Conference of the European Association for Computer Graphics, Vienna, Austria, 3–7 May 2021. [Google Scholar]
- Roberts, J.C. Project Rainbow—STEM Activities Focusing on Colours, Light and Optical Effects. 2021. Available online: https://csee.bangor.ac.uk/ (accessed on 30 January 2022).
- Roberts, J.C. Learning Activities in Colours and Rainbows for Programming Skill Development. In EG UK Computer Graphics & Visual Computing (CGVC); Xu, K., Turner, M., Eds.; The Eurographics Association: Vienna, Austria, 2021. [Google Scholar]
- Shuell, T.J. Cognitive Conceptions of Learning. Rev. Educ. Res. 1986, 56, 411–436. [Google Scholar] [CrossRef]
- Meyers, C.; Jones, T.B. Promoting Active Learning. Strategies for the College Classroom; ERIC: ED358757; Jossey-Bass Inc.: San Francisco, CA, USA, 1993. [Google Scholar]
- Kolb, A.Y.; Kolb, D.A. Learning Styles and Learning Spaces: Enhancing Experiential Learning in Higher Education. Acad. Manag. Learn. Educ. 2005, 4, 193–212. [Google Scholar] [CrossRef] [Green Version]
- Kokotsaki, D.; Menzies, V.; Wiggins, A. Project-based learning: A review of the literature. Improv. Sch. 2016, 19, 267–277. [Google Scholar] [CrossRef]
- Roberts, J.C.; Headleand, C.; Ritsos, P.D. Sketching Designs Using the Five Design-Sheet Methodology. IEEE Trans. Vis. Comput. Graph. 2016, 22, 419–428. [Google Scholar] [CrossRef] [PubMed] [Green Version]
- Roberts, J.C.; Ritsos, P.D.; Jackson, J.R.; Headleand, C. The Explanatory Visualization Framework: An Active Learning Framework for Teaching Creative Computing Using Explanatory Visualizations. IEEE Trans. Vis. Comput. Graph. 2018, 24, 791–801. [Google Scholar] [CrossRef] [PubMed] [Green Version]
- Kolb, D. Experiential Learning: Experience as the Source of Learning and Development; Prentice Hall: Englewood Cliffs, NJ, USA, 1984. [Google Scholar]
- Drew, V.; Mackie, L. Extending the constructs of active learning: Implications for teachers’ pedagogy and practice. Curric. J. 2011, 22, 451–467. [Google Scholar] [CrossRef]
- Dewey, J. How We Think; D. C. Heath & Co.: Boston, MA, USA; New York, NY, USA; Chicago, IL, USA, 1910. [Google Scholar]
- Gibbs, G. Learning by Doing: A Guide to Teaching and Learning Methods; Further Education Unit: London, UK, 1988. [Google Scholar]
- Bonwell, C.C.; Eison, J.A. Active Learning: Creating Excitement in the Classroom. 1991 ASHE-ERIC Higher Education Reports; ERIC Number: ED336049; ERIC Clearinghouse on Higher Education, The George Washington University: Washington, DC, USA, 1991. [Google Scholar]
- Krathwohl, D.R. A revision of Bloom’s taxonomy: An overview. Theory Pract. 2002, 41, 212–218. [Google Scholar] [CrossRef]
- Kennedy, M.M. The role of preservice teacher education. In Teaching as the Learning Profession: Handbook of Policy and Practice; Darling-Hammond, L., Sykes, G., Eds.; Jossey Bass: San Francisco, CA, USA, 1999; pp. 54–86. [Google Scholar]
- Simon, H.A. The structure of ill structured problems. Artif. Intell. 1973, 4, 181–201. [Google Scholar] [CrossRef]
- Munzner, T. A Nested Process Model for Visualization Design and Validation. IEEE Trans. Vis. Comput. Graph. 2009, 15, 921–928. [Google Scholar] [CrossRef] [Green Version]
- McKenna, S.; Mazur, D.; Agutter, J.; Meyer, M. Design Activity Framework for Visualization Design. IEEE Trans. Vis. Comput. Graph. 2014, 20, 2191–2200. [Google Scholar] [CrossRef]
- Sedlmair, M.; Meyer, M.; Munzner, T. Design Study Methodology: Reflections from the Trenches and the Stacks. IEEE Trans. Vis. Comput. Graph. 2012, 18, 2431–2440. [Google Scholar] [CrossRef] [Green Version]
- Hmelo-Silver, C.E. Problem-Based Learning: What and How Do Students Learn? Educ. Psychol. Rev. 2004, 16, 235–266. [Google Scholar] [CrossRef]
- Steinhorst, R.K.; Keeler, C.M. Developing material for introductory statistics courses from a conceptual, active learning viewpoint. J. Stat. Educ. 1995, 3. [Google Scholar] [CrossRef]
- Alsaleh, N.J. Teaching Critical Thinking Skills: Literature Review. Turk. Online J. Educ. Technol.-TOJET 2020, 19, 21–39. [Google Scholar]
- Facione, P.A. Critical Thinking: A Statement of Expert Consensus for Purposes of Educational Assessment and Instruction. Research Findings and Recommendations; ERIC: ED315423; American Philosophical Association: Newark, DJ, USA, 1990. [Google Scholar]
- Duncker, K.; Lees, L.S. On problem-solving. Psychol. Monogr. 1945, 58, i. [Google Scholar] [CrossRef]
- Roberts, J.C.; Ritsos, P.D.; Headleand, C. Experience and Guidance for the use of Sketching and low-fidelity Visualisation-design in teaching. In Pedagogy of Data Visualization Workshop, Proceedings of the IEEE Conference on Visualization (VIS), Phoenix, AZ, USA, 1–6 October 2017; Joshi, A., Adar, E., Bertini, E., Engle, S., Hearst, M., Keefe, D., Eds.; IEEE: Piscataway, NJ, USA, 2017. [Google Scholar]
- Roberts, J.C.; Headleand, C.J.; Ritsos, P.D. Five Design-Sheets—Creative Design and Sketching in Computing and Visualization; Springer International Publishing: Berlin/Heidelberg, Germany, 2017. [Google Scholar] [CrossRef]
- Roberts, J.C.; Ritsos, P.D. Critical Thinking Sheets: Encouraging critical thought and sketched implementation design. In Proceedings of the EduCHI 2019 Symposium: Global Perspectives on HCI Education, CHI Conference on Human Factors in Computing Systems (ACM CHI 2019), Glasgow, UK, 4 May 2019. [Google Scholar]
- Roberts, J.C.; Ritsos, P.D. Critical Thinking Sheet (CTS) for Design Thinking in Programming Courses. In Eurographics 2020-Education Papers; Romero, M., Sousa Santos, B., Eds.; The Eurographics Association: Vienna, Austria, 2020; pp. 17–23. [Google Scholar] [CrossRef]
- Gaver, B.; Martin, H. Alternatives: Exploring information appliances through conceptual design proposals. In Proceedings of the SIGCHI Conference on Human Factors in Computing Systems; The Hague, The Netherlands, 1–6 April 2000, ACM: New York, NY, USA, 2000; pp. 209–216. [Google Scholar] [CrossRef]
- Al-Maneea, H.; Roberts, J. A tool to help lay out Multiple View Visualisations guided by view analysis. In Proceedings of the Posters EuroVis 2020, Norrköping, Sweden, 25–29 May 2020. [Google Scholar]
- Gilhooly, K.J. Thinking: Directed, Undirected and Creative; Academic Press: Cambridge, MA, USA, 1988. [Google Scholar]
- Foster, A.; Ford, N. Serendipity and information seeking: An empirical study. J. Doc. 2003, 59, 321–340. [Google Scholar] [CrossRef] [Green Version]
- He, S.; Adar, E. VizItCards: A Card-Based Toolkit for Infovis Design Education. IEEE Trans. Vis. Comput. Graph. 2017, 23, 561–570. [Google Scholar] [CrossRef]
- Huron, S.; Carpendale, S.; Thudt, A.; Tang, A.; Mauerer, M. Constructive Visualization. In Proceedings of the ACM Conference on Designing Interactive Systems (DIS), Vancouver, BC, Canada, 21–25 June 2014; ACM: New York, NY, USA, 2014; pp. 433–442. [Google Scholar] [CrossRef]
- Buxton, B. Sketching User Experiences: Getting the Design Right and the Right Design; Morgan Kaufmann: Burlington, MA, USA, 2010. [Google Scholar]
- Ridley, A.; Schöttler, S.; Dadzie, A.S.; Bach, B. The VisTools Marketplace: An Activity to Understand the Landscape of Visualisation Tools. In Proceedings of the VisActivities: IEEE VIS Workshop on Data Vis Activities to Facilitate Learning, Reflecting, Discussing, and Designing, Salt Lake City, UT, USA, 26 October 2020. [Google Scholar]
- Löwgren, J. On the Significance of Making in Interaction Design Research. Interactions 2016, 23, 26–33. [Google Scholar] [CrossRef]
- Bell, T.; Vahrenhold, J. CS unplugged—How is it used, and does it work?. In Adventures between Lower Bounds and Higher Altitudes; Springer: Berlin/Heidelberg, Germany, 2018; pp. 497–521. [Google Scholar]
- Edwards, B. Color: A Course in Mastering the Art of Mixing Colors; TarcherPerigee: New York, NY, USA, 2004. [Google Scholar]
- Finlay, V. Color: A Natural History of the Palette; Random House: New York, NY, USA, 2003. [Google Scholar]
- Hearn, D.; Baker, M.P. Computer Graphics with OpenGL, 3rd ed.; Pearson Education: New York, NY, USA, 2004. [Google Scholar]
- Albers, J. Interaction of Color; Yale University Press: New Haven, CT, USA, 1970. [Google Scholar]
- Ware, C. Information Visualization: Perception for Design, 3rd ed.; Morgan Kaufmann Series in Interactive Technologies; Morgan Kaufmann: Amsterdam, The Netherlands, 2012. [Google Scholar]
- Borkin, M.; Gajos, K.; Peters, A.; Mitsouras, D.; Melchionna, S.; Rybicki, F.; Feldman, C.; Pfister, H. Evaluation of Artery Visualizations for Heart Disease Diagnosis. IEEE Trans. Vis. Comput. Graph. 2011, 17, 2479–2488. [Google Scholar] [CrossRef] [Green Version]
- Rogowitz, B.; Treinish, L. Data visualization: The end of the rainbow. IEEE Spectr. 1998, 35, 52–59. [Google Scholar] [CrossRef]
- Rogowitz, B.; Kalvin, A. The “Which Blair project”: A quick visual method for evaluating perceptual color maps. In Proceedings of the Visualization (VIS’01), San Diego, CA, USA, 21–26 October 2001; pp. 183–556. [Google Scholar] [CrossRef]
- Borland, D.; Taylor Ii, R.M. Rainbow Color Map (Still) Considered Harmful. IEEE Comput. Graph. Appl. 2007, 27, 14–17. [Google Scholar] [CrossRef] [PubMed]
- Crameri, F.; Shephard, G.; Heron, P. The misuse of colour in science communication. Nat. Commun. 2020, 11, 1–10. [Google Scholar] [CrossRef] [PubMed]
- Jenny, B.; Kelso, N.V. Color Design for the Color Vision Impaired. Cartogr. Perspect. 2007, 58, 61–67. [Google Scholar] [CrossRef]
- Brewer, C.A. A Transition in Improving Maps: The ColorBrewer Example. Cartogr. Geogr. Inf. Sci. 2003, 30, 159–162. [Google Scholar] [CrossRef]
- Tobin, D.R. All Learning Is Self-Directed: How Organizations Can Support and Encourage Independent Learning; American Society for Training and Development: Alexandria, VA, USA, 2000. [Google Scholar]
- Keppell, M. Personalised learning strategies for higher education. In The Future of Learning and Teaching in Next Generation Learning Spaces (International Perspectives on Higher Education Research, Volume 12); Emerald Group Publishing Limited: Bingley, UK, 2014; pp. 3–21. [Google Scholar] [CrossRef]
- Reas, C.; Fry, B. Processing: A Programming Handbook for Visual Designers and Artists; MIT Press: Cambridge, MA, USA, 2007. [Google Scholar]
- Dijkstra, E. On the role of scientific thought. In Selected Writings on Computing: A Personal Perspective; Springer: New York, NY, USA, 1982; pp. 60–66. [Google Scholar]
- Krasner, G.E.; Pope, S.T. A description of the model-view-controller user interface paradigm in the smalltalk-80 system. J. Object Oriented Program. 1988, 1, 26–49. [Google Scholar]
- Roberts, J.C.; Ritsos, P.D.; Badam, S.K.; Brodbeck, D.; Kennedy, J.; Elmqvist, N. Visualization Beyond the Desktop—The next big thing. IEEE Comput. Graph. Appl. 2014, 34, 26–34. [Google Scholar] [CrossRef] [Green Version]
- Butcher, P.W.; John, N.W.; Ritsos, P.D. VRIA: A Web-based Framework for Creating Immersive Analytics Experiences. IEEE Trans. Vis. Comput. Graph. 2021, 27, 3213–3225. [Google Scholar] [CrossRef] [Green Version]
- Roberts, J.C.; Butcher, P.; Sherlock, A.; Nason, S. Explanatory Journeys: Visualising to Understand and Explain Administrative Justice Paths of Redress. IEEE Trans. Vis. Comput. Graph. 2022, 28, 518–528. [Google Scholar] [CrossRef]
- Gray, C.C.; Perkins, D.; Ritsos, P.D. Degree Pictures: Visualizing the university student journey. Assess. Eval. High. Educ. 2020, 20, 568–578. [Google Scholar] [CrossRef]
- Chen, X.; Zeng, W.; Lin, Y.; AI-maneea, H.M.; Roberts, J.; Chang, R. Composition and Configuration Patterns in Multiple-View Visualizations. IEEE Trans. Vis. Comput. Graph. 2021, 27, 1514–1524. [Google Scholar] [CrossRef]
- Roberts, J.C.; Al-maneea, H.; Butcher, P.W.S.; Lew, R.; Rees, G.; Sharma, N.; Frankenberg-Garcia, A. Multiple Views: Different meanings and collocated words. Comput. Graph. Forum 2019, 38, 79–93. [Google Scholar] [CrossRef]
- Bostock, M.; Ogievetsky, V.; Heer, J. D3 Data-Driven Documents. IEEE Trans. Vis. Comput. Graph. 2011, 17, 2301–2309. [Google Scholar] [CrossRef] [PubMed]
- Barron, B.; Walter, S.E.; Martin, C.K.; Schatz, C. Predictors of creative computing participation and profiles of experience in two Silicon Valley middle schools. Comput. Educ. 2010, 54, 178–189. [Google Scholar] [CrossRef]
- Barron, B. Interest and self-sustained learning as catalysts of development: A learning ecology perspective. Hum. Dev. 2006, 49, 193–224. [Google Scholar] [CrossRef]
- Viennot, L.; de Hosson, C. Beyond a Dichotomic Approach, The Case of Colour Phenomena. Int. J. Sci. Educ. 2012, 34, 1315–1336. [Google Scholar] [CrossRef]
- Bloj, M.G.; Kersten, D.; Hurlbert, A.C. Perception of three-dimensional shape influences colour perception through mutual illumination. Nature 1999, 402, 877–879. [Google Scholar] [CrossRef]
- Barry, J.A.; Mollan, S.; Burdon, M.A.; Jenkins, M.; Denniston, A.K. Development and validation of a questionnaire assessing the quality of life impact of Colour Blindness (CBQoL). BMC Ophthalmol. 2017, 17, 179. [Google Scholar] [CrossRef] [Green Version]
- Cole, B.L. The handicap of abnormal colour vision. Clin. Exp. Optom. 2004, 87, 258–275. [Google Scholar] [CrossRef]
- Sandoval, M.; Muñoz, Y.; Márquez, C. Supporting schools in their journey to inclusive education: Review of guides and tools. Support Learn. 2021, 36, 20–42. [Google Scholar] [CrossRef]
Figure 1.
English and Welsh landing page of Project Rainbow [4]. Created in WordPress and showing the identifying image, brief welcome message, privacy and cookies policy, menu to change between English and Welsh, and direct links to activities.
Figure 1.
English and Welsh landing page of Project Rainbow [4]. Created in WordPress and showing the identifying image, brief welcome message, privacy and cookies policy, menu to change between English and Welsh, and direct links to activities.

Figure 2.
We created many lessons. Each of the lessons have an indicative image and short description of the activity. For the learning pathway, we place the lessons in a suggested order, starting with beginner activities covering basic colours, through colour models, then coding colours and using colours to create different patterns. We also have some intermediate lessons, including one to create a VR rainbow and another that creates a rainbow in CSS.

Figure 3.
We used the colour spinner activity to introduce colours. Creating a successful spinner is not easy: it requires time and careful crafting and is a fun activity to start learning about colour.
Figure 3.
We used the colour spinner activity to introduce colours. Creating a successful spinner is not easy: it requires time and careful crafting and is a fun activity to start learning about colour.

Figure 4.
The RGB model (a) along with four pictures of the colour picker in p5.js, showing magenta (b) and that it turns whiter when green (the opposite colour) is increased (c–e).
Figure 4.
The RGB model (a) along with four pictures of the colour picker in p5.js, showing magenta (b) and that it turns whiter when green (the opposite colour) is increased (c–e).

Figure 5.
In this activity, people can shine laser light in a glass of water (with some washing liquid) to see how it reflects in the glass.
Figure 5.
In this activity, people can shine laser light in a glass of water (with some washing liquid) to see how it reflects in the glass.

Figure 6.
The introduction to the http://processing.org (accessed on 30 January 2022) activity gets people using the sketch environment, exploring the coordinate space, and creating randomly positioned lines.
Figure 6.
The introduction to the http://processing.org (accessed on 30 January 2022) activity gets people using the sketch environment, exploring the coordinate space, and creating randomly positioned lines.

Figure 7.
The critical thinking sheet [30,31] (left) with the rainbow scene sketched (middle) and the physical mockup (right), which helps to explain the ordering for the placement of the graphics primitives in the scene.

Figure 8.
One important concept is to abstract position from location: the relative neighbouring position of the item and its actual coordinate value. In this example, we use a for loop to index position and multiply it by the object width to locate the rectangle.
Figure 8.
One important concept is to abstract position from location: the relative neighbouring position of the item and its actual coordinate value. In this example, we use a for loop to index position and multiply it by the object width to locate the rectangle.

Figure 9.
The abstraction of position and location is useful to learn. The grid x position is controlled by a single while loop to determine the order; the y value is a random number. The activity encourages learners to create a CTS [30,31] (a), then develop from a line of rectangles (b) into the grid (c), and finally, change its appearance (d,e).

Figure 10.
An example of the simultaneous-contrast effect (left), where objects appear brighter if they are against a dark background, and vice versa. Blue- and red-coloured squares, after Josef Albers (right).
Figure 10.
An example of the simultaneous-contrast effect (left), where objects appear brighter if they are against a dark background, and vice versa. Blue- and red-coloured squares, after Josef Albers (right).

Figure 11.
We developed a set of activities that got people to create virtual reality rainbows using A-Frame (a), projected onto virtual markers, such as the Hiro marker (b), and explored rainbows and colours in other languages, including CSS (c).
Figure 11.
We developed a set of activities that got people to create virtual reality rainbows using A-Frame (a), projected onto virtual markers, such as the Hiro marker (b), and explored rainbows and colours in other languages, including CSS (c).


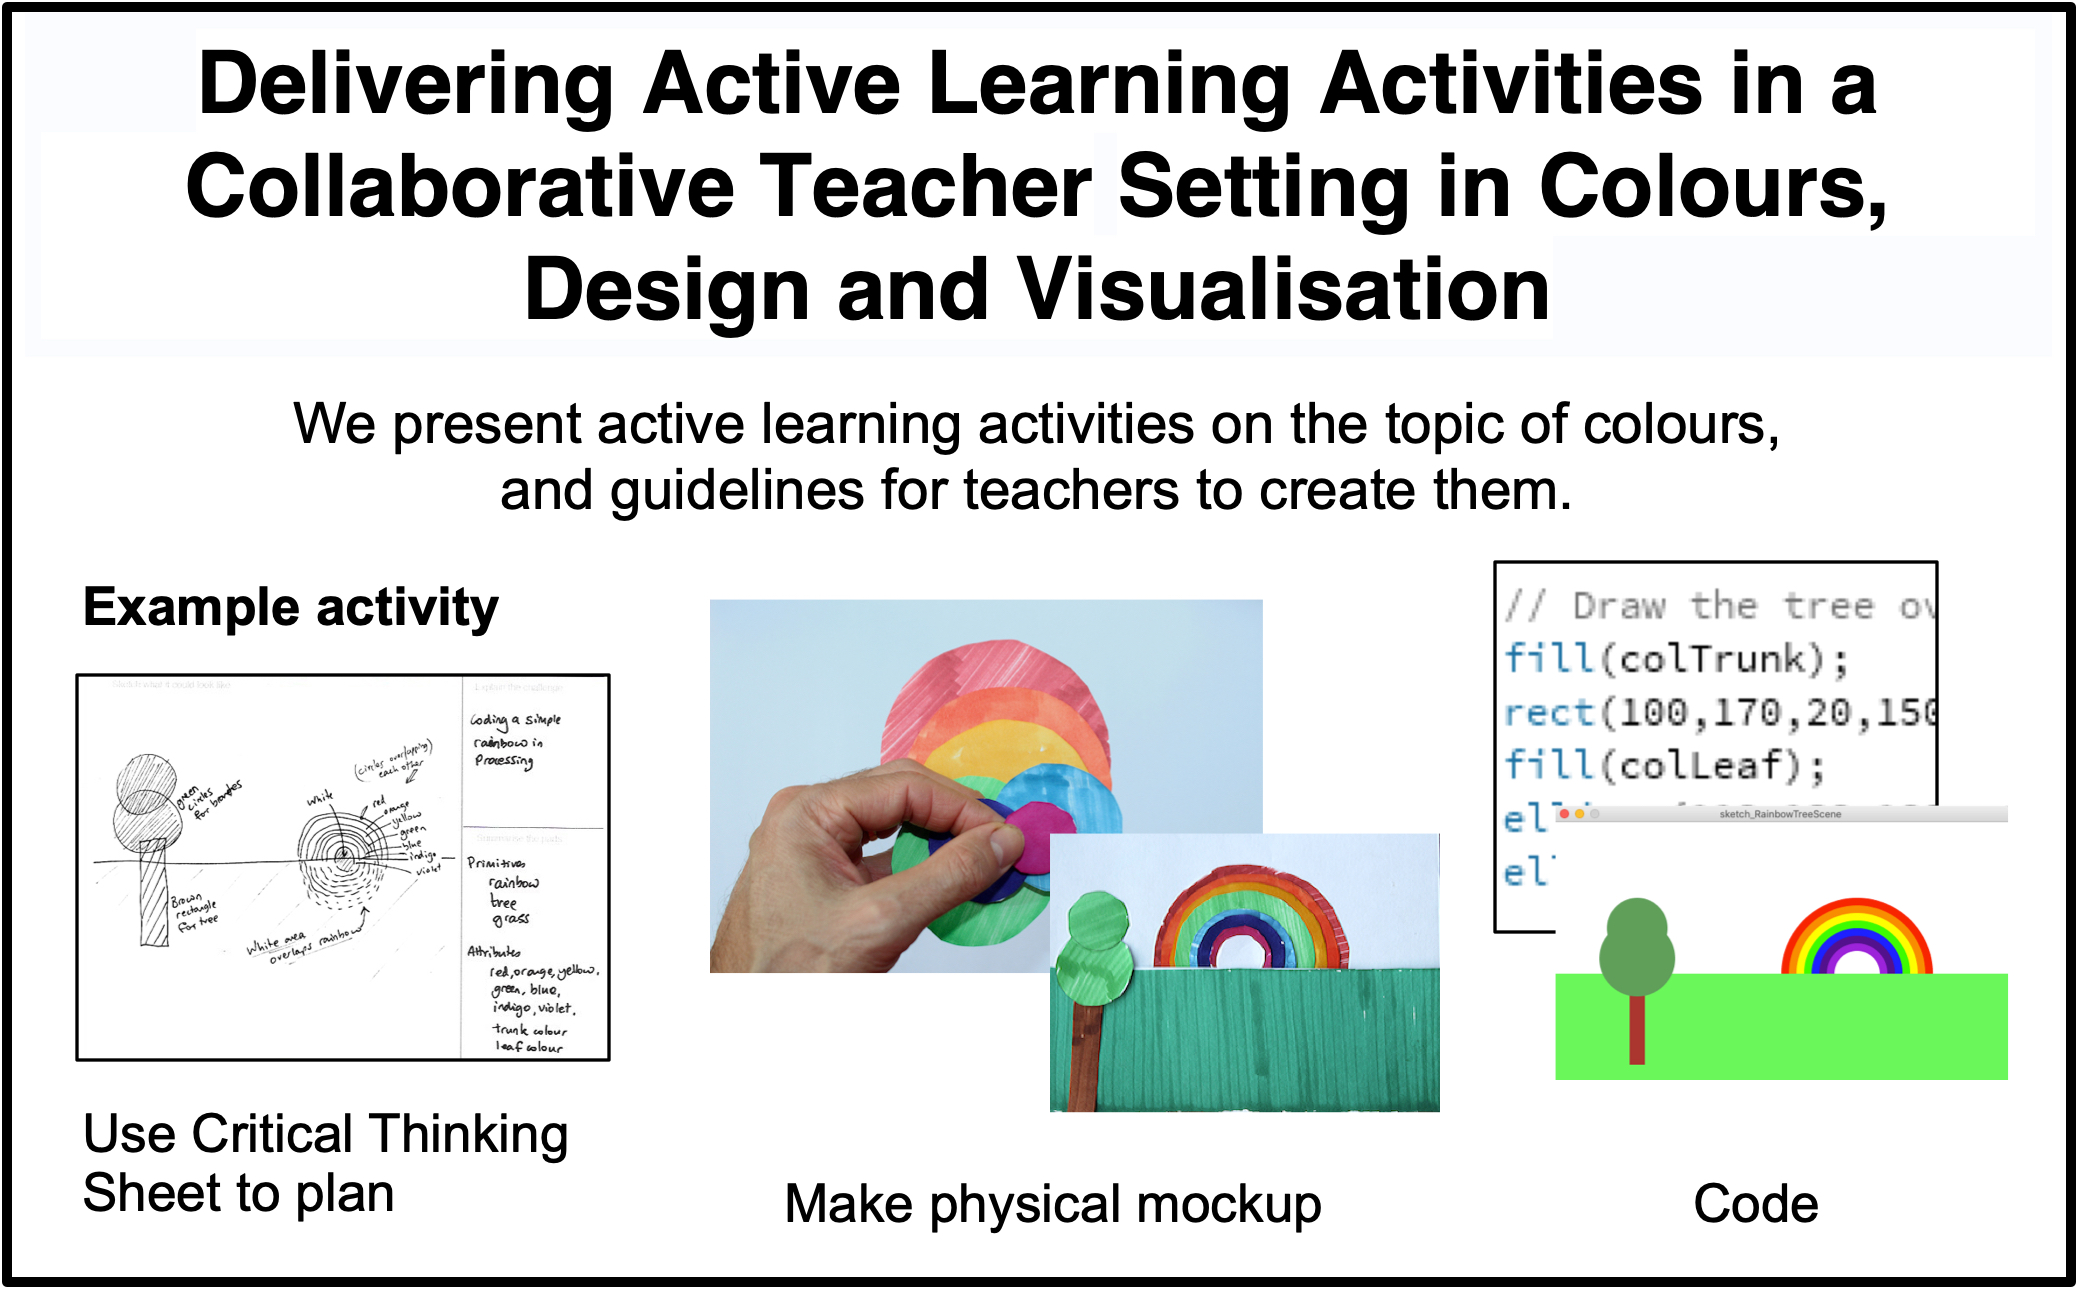
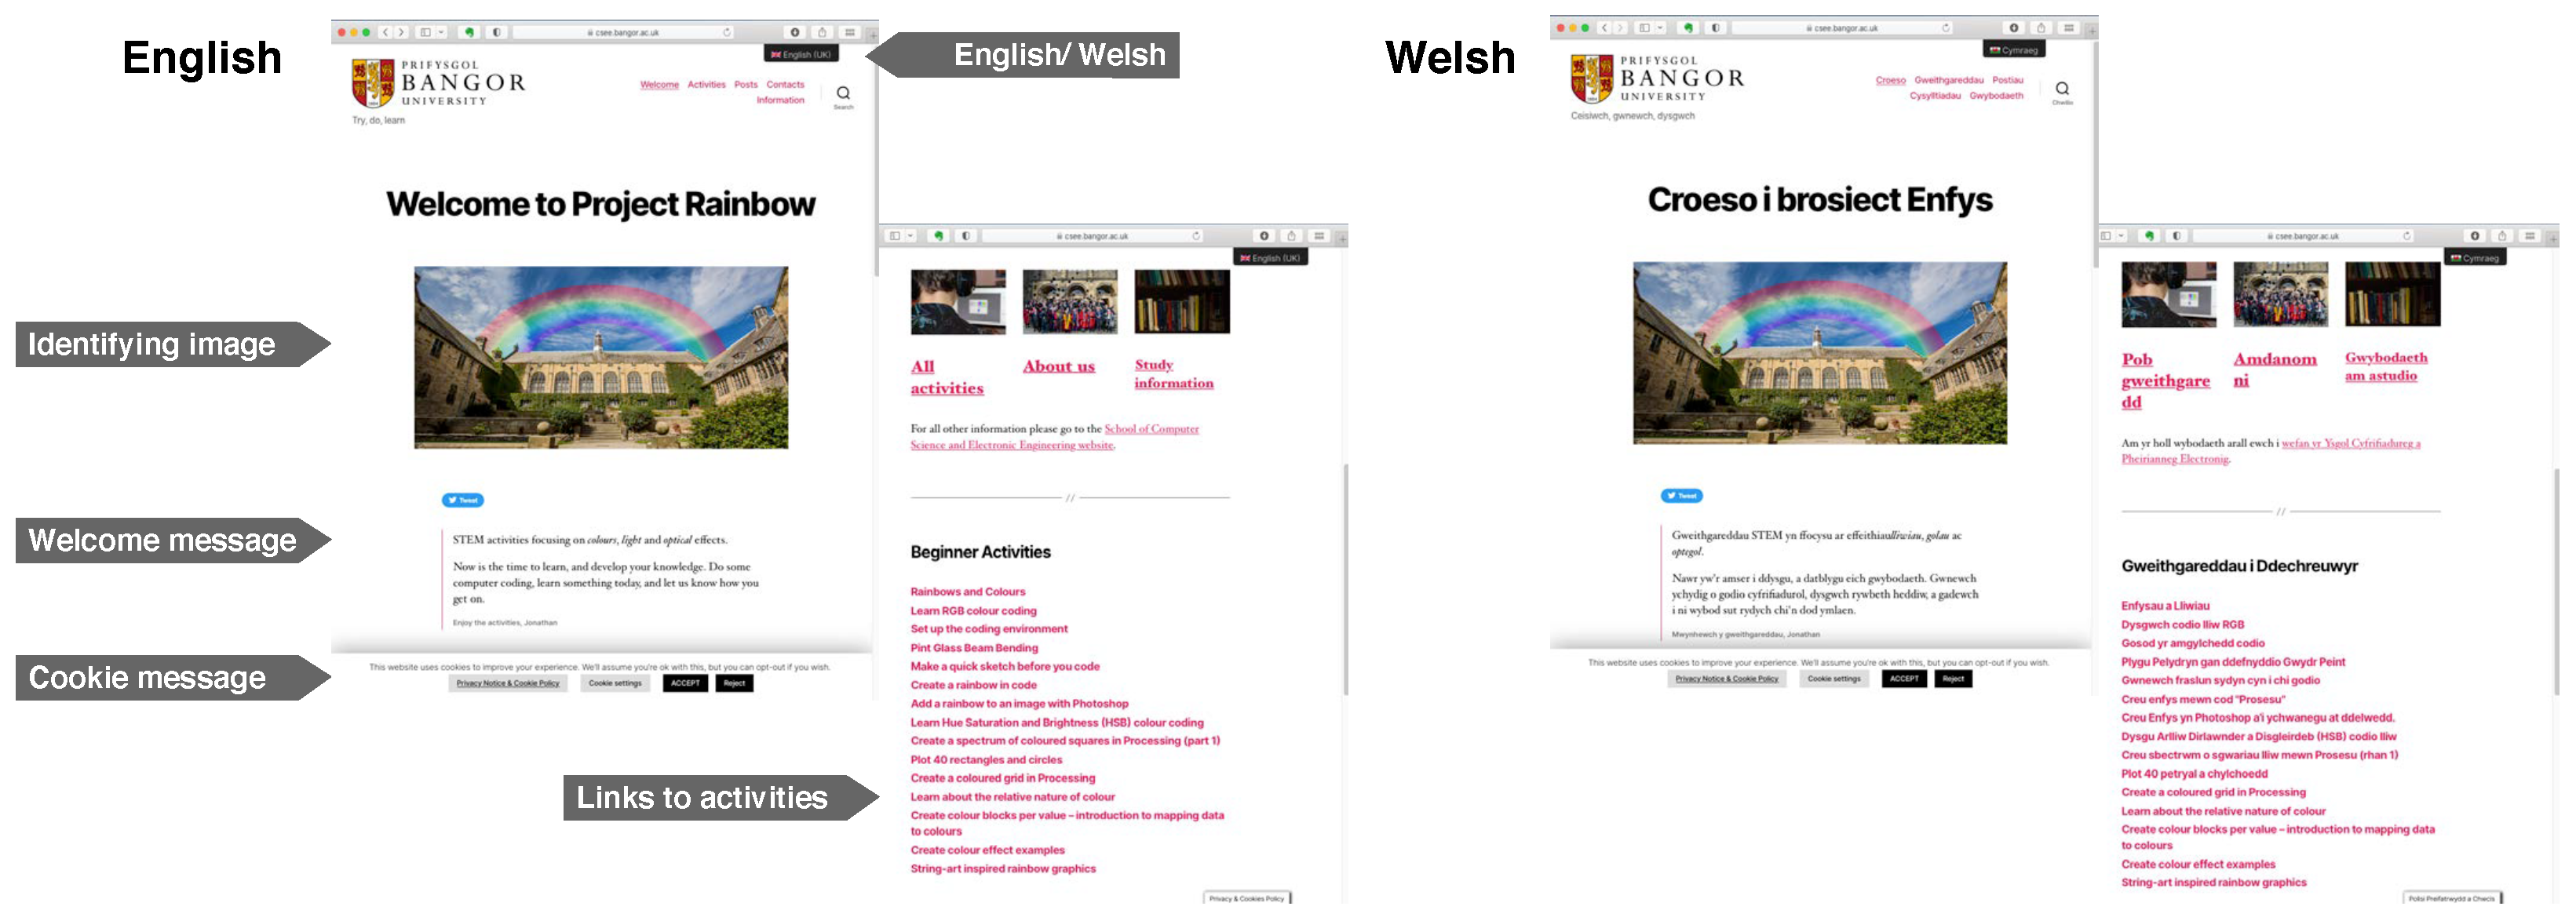
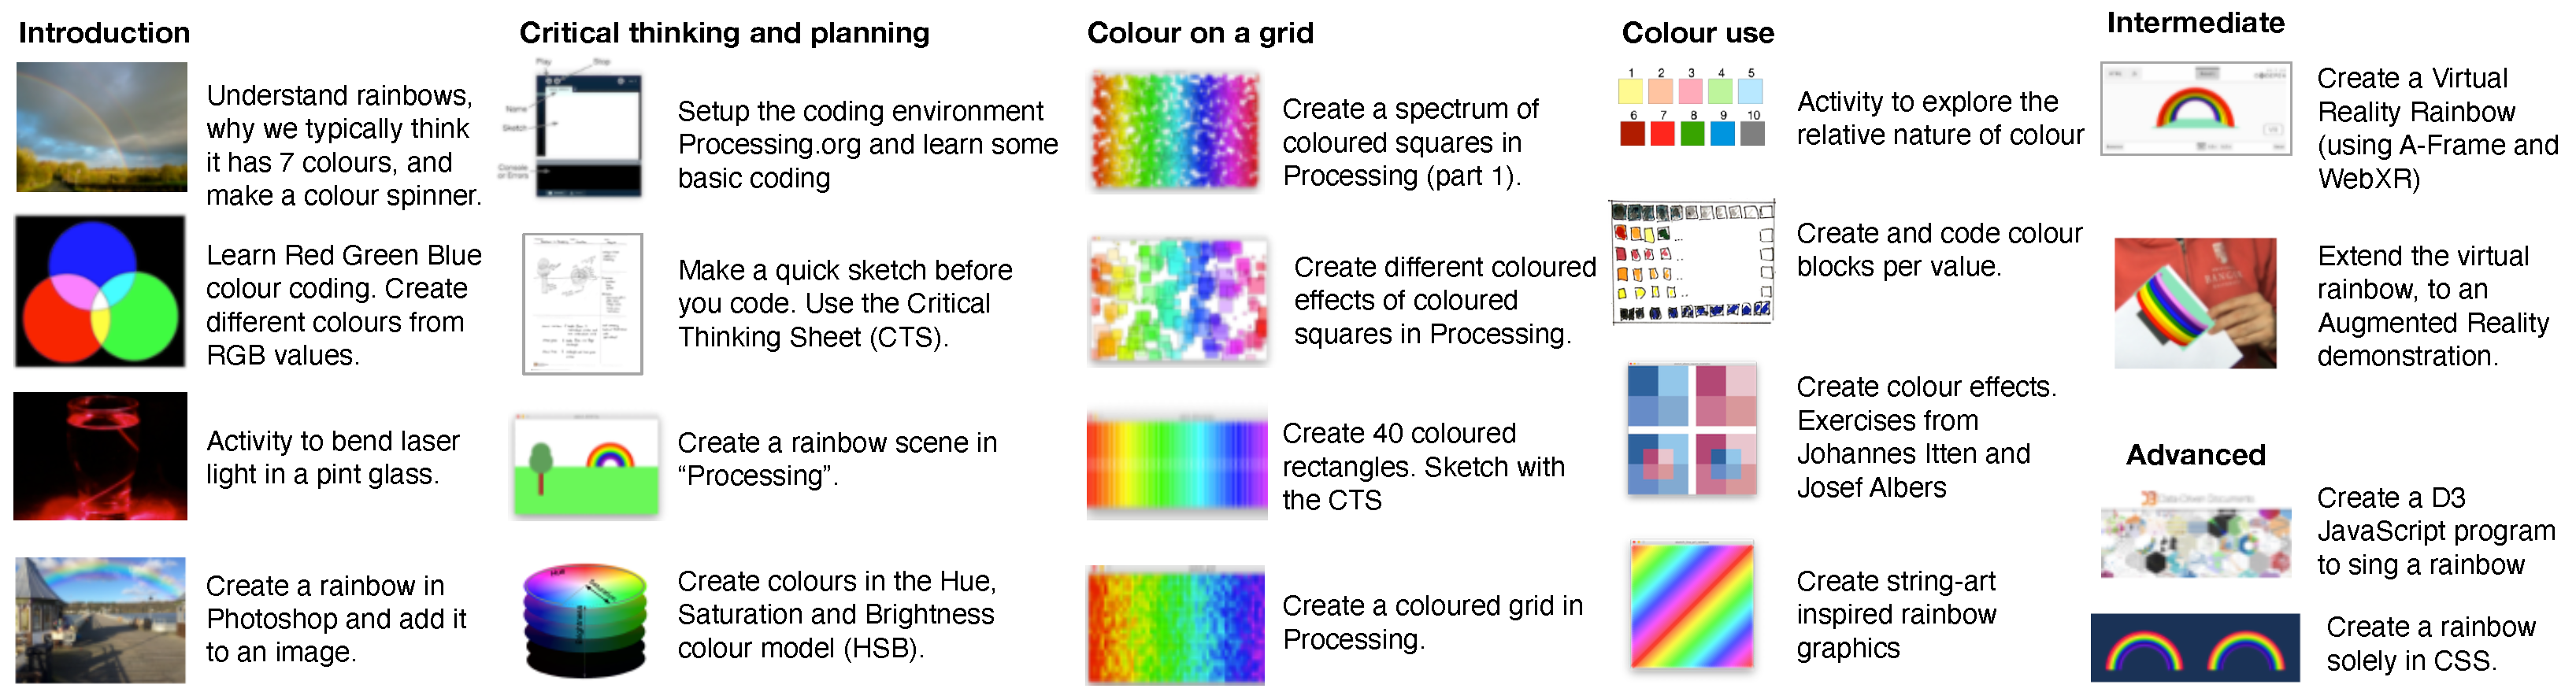
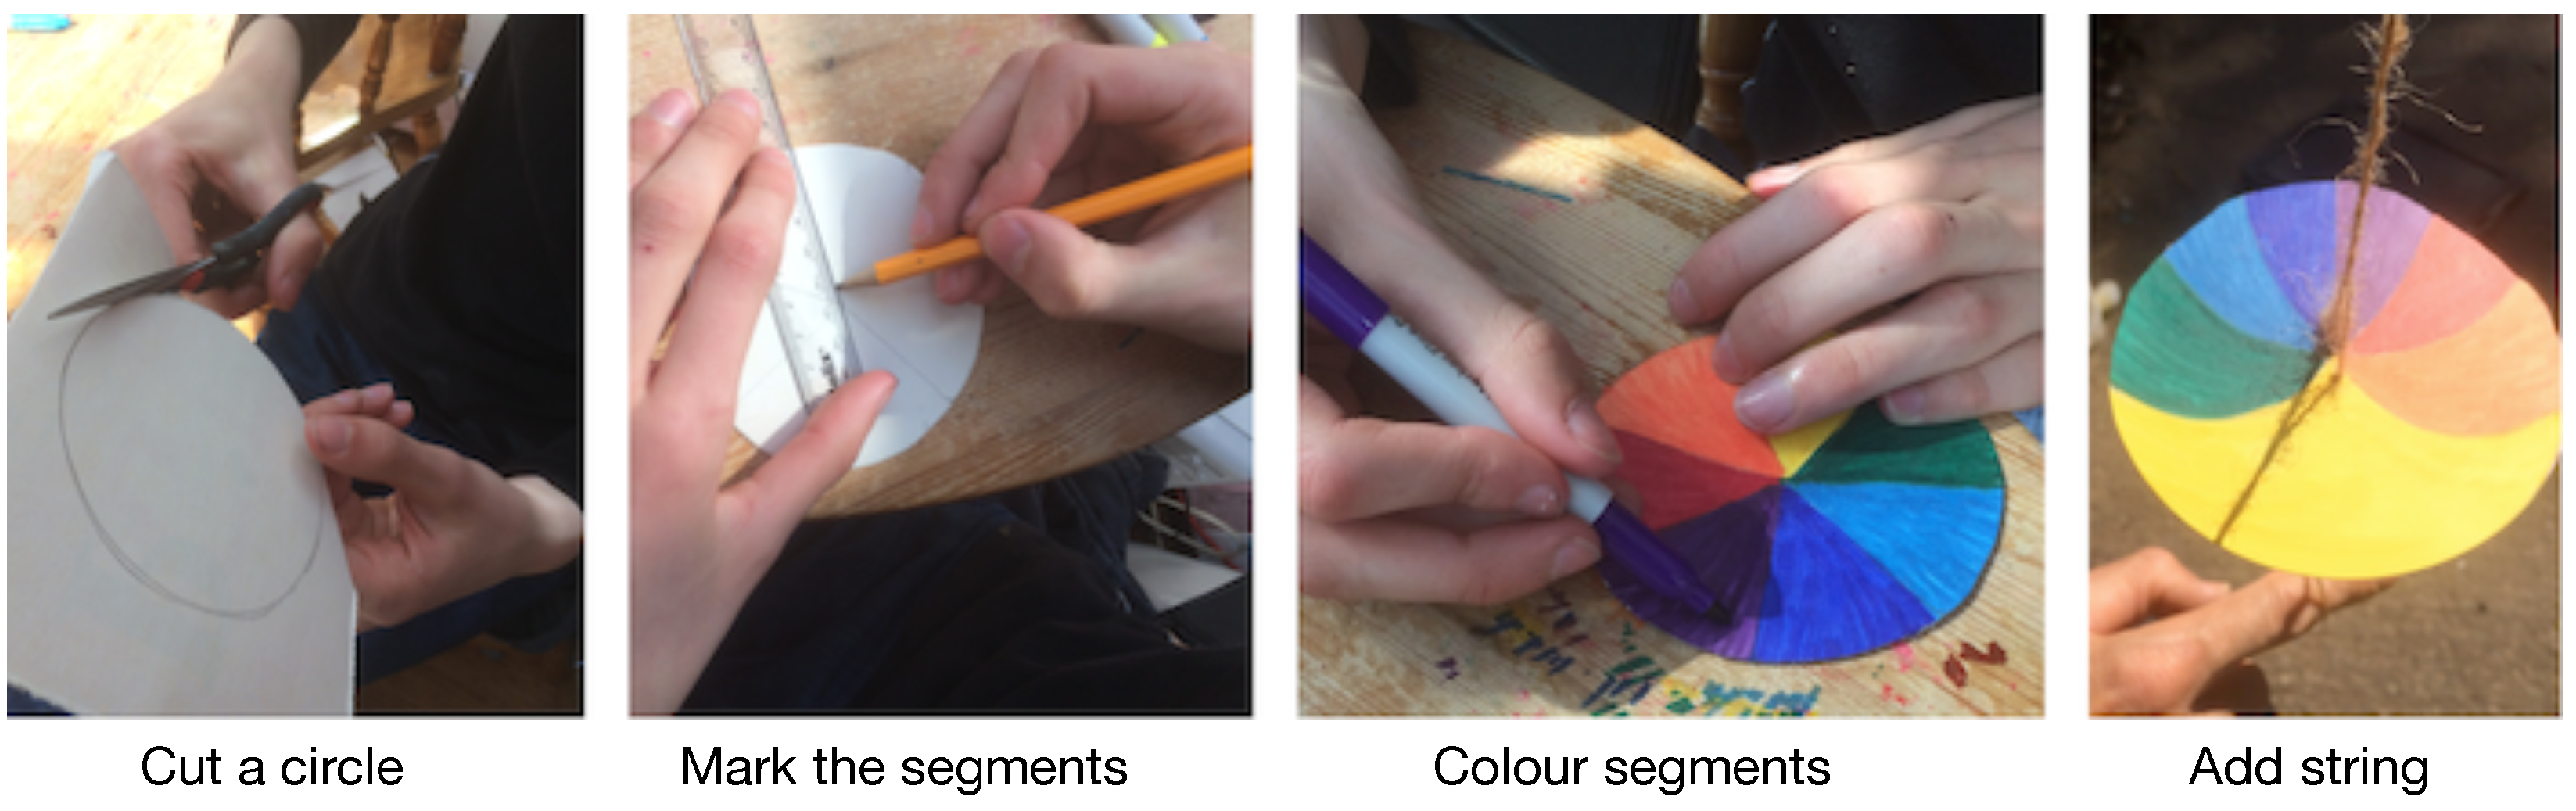
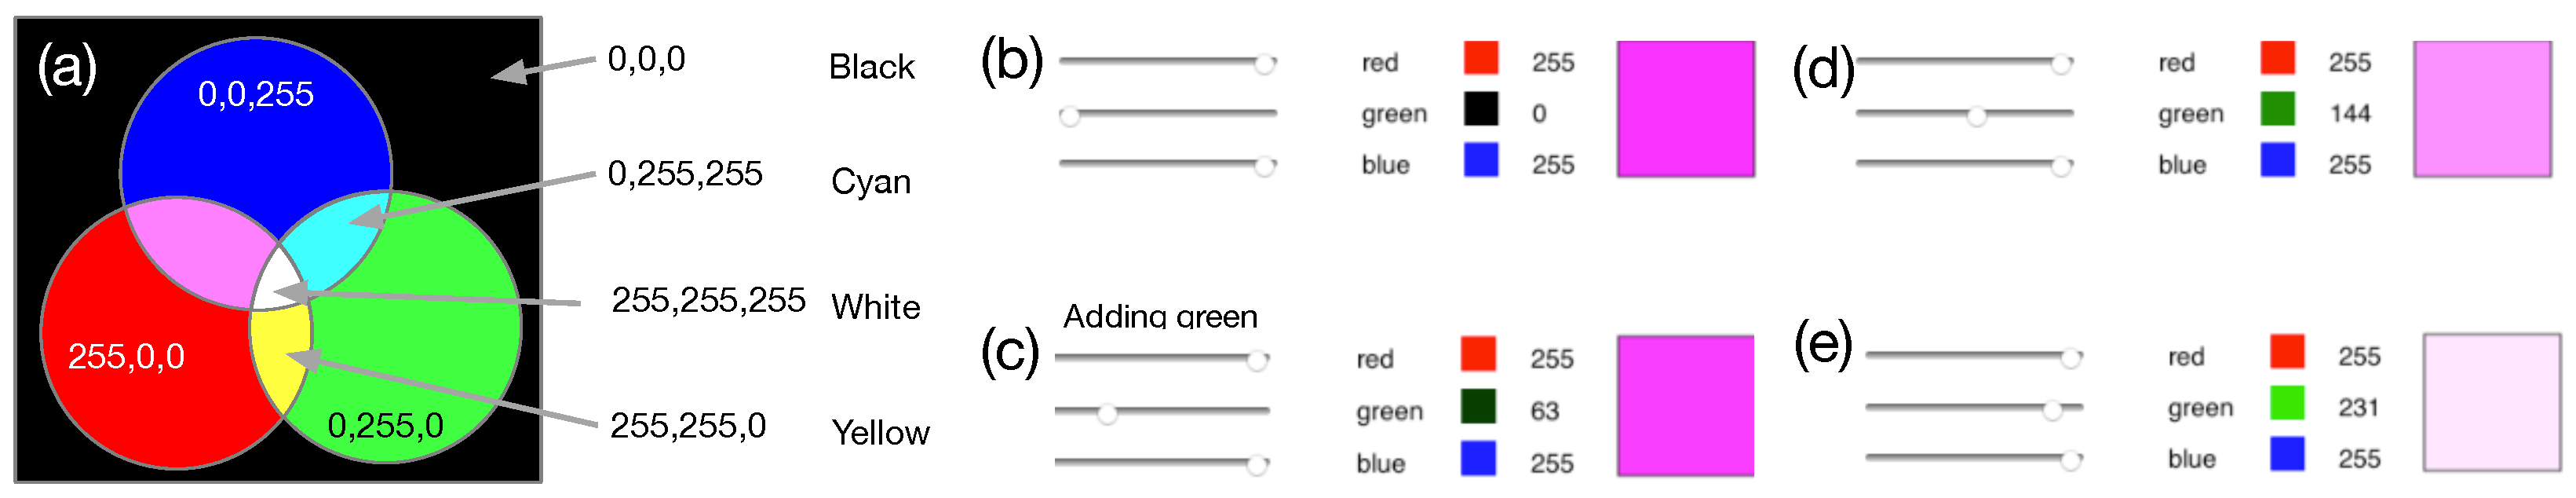
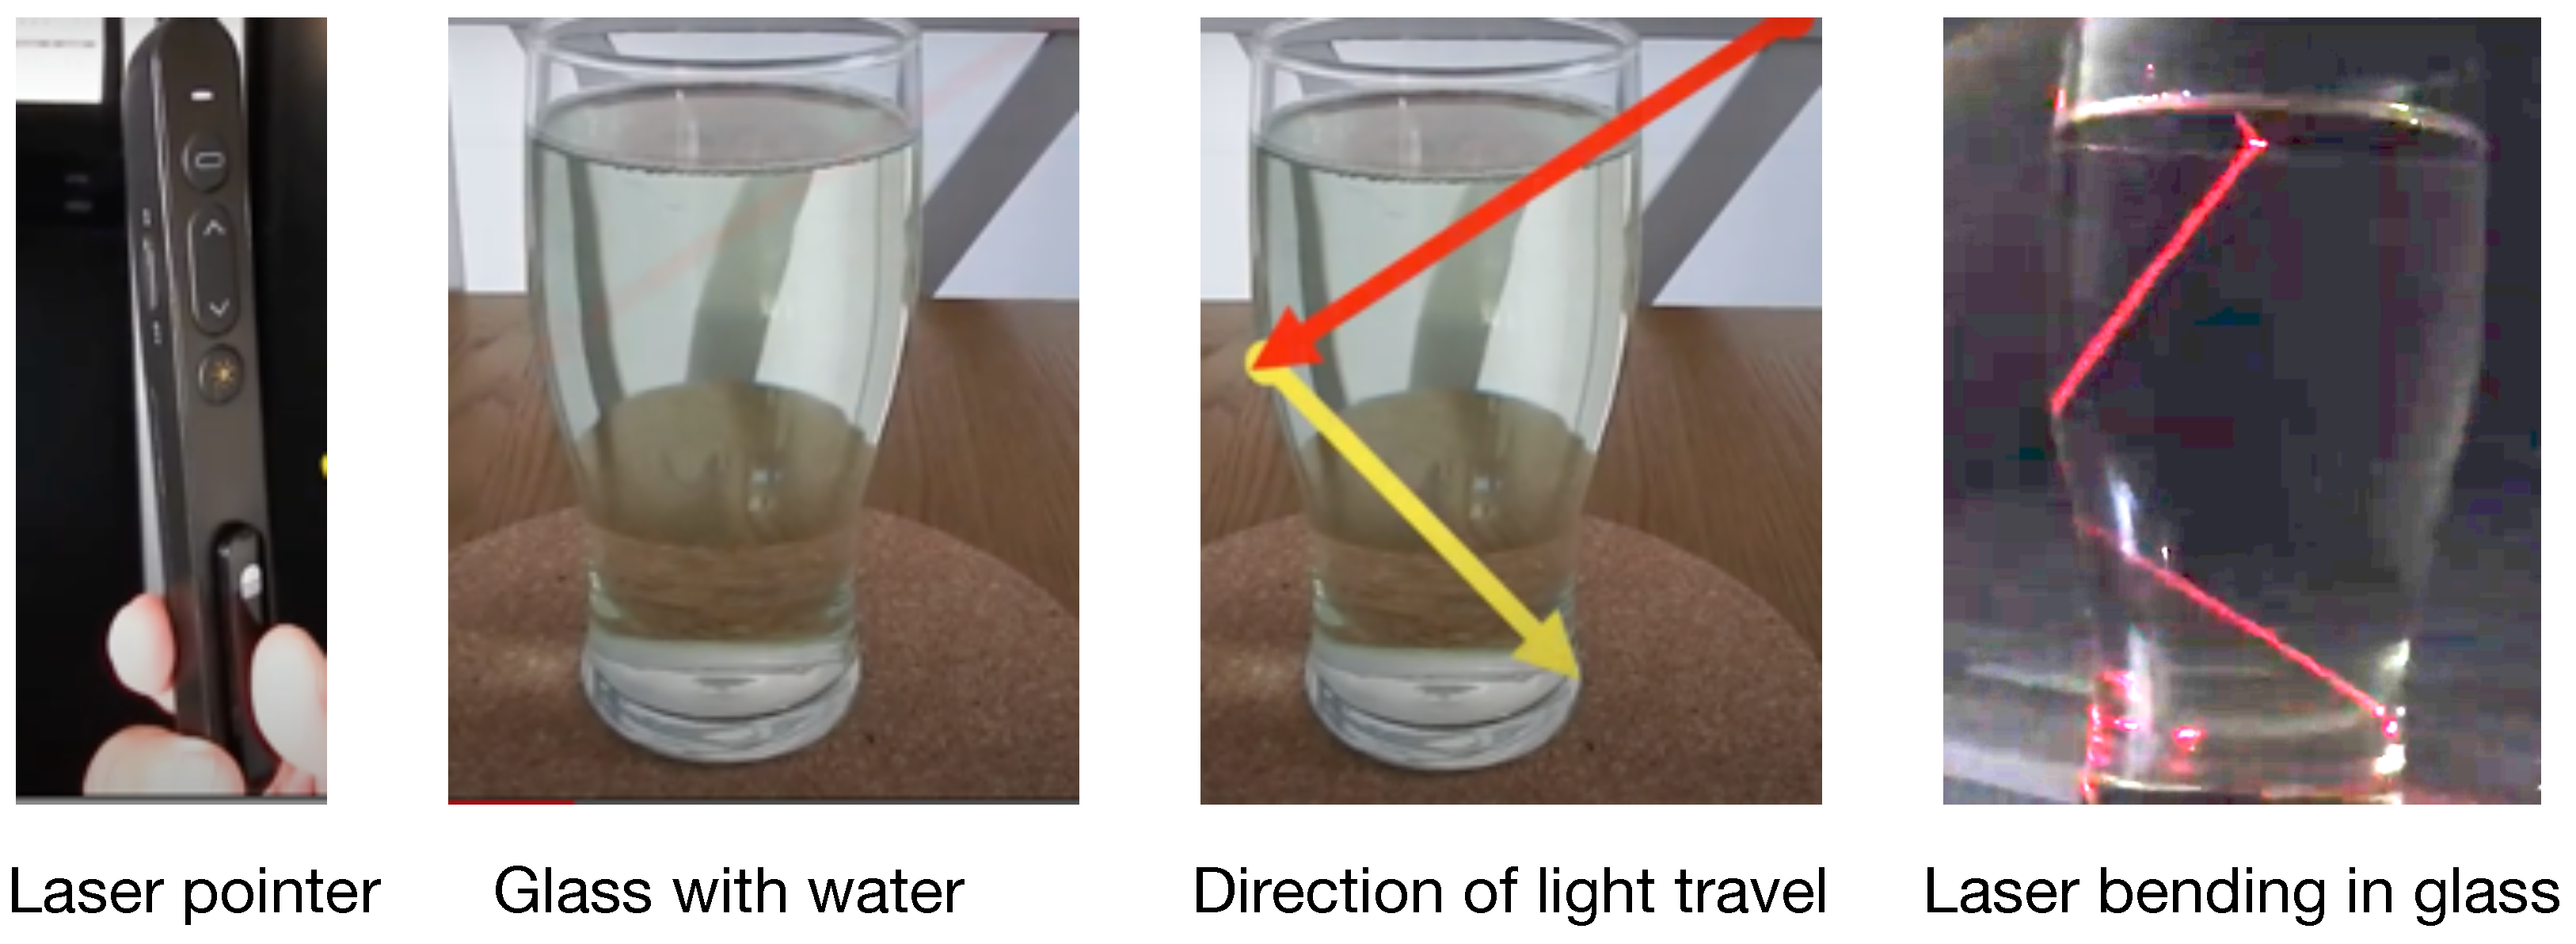
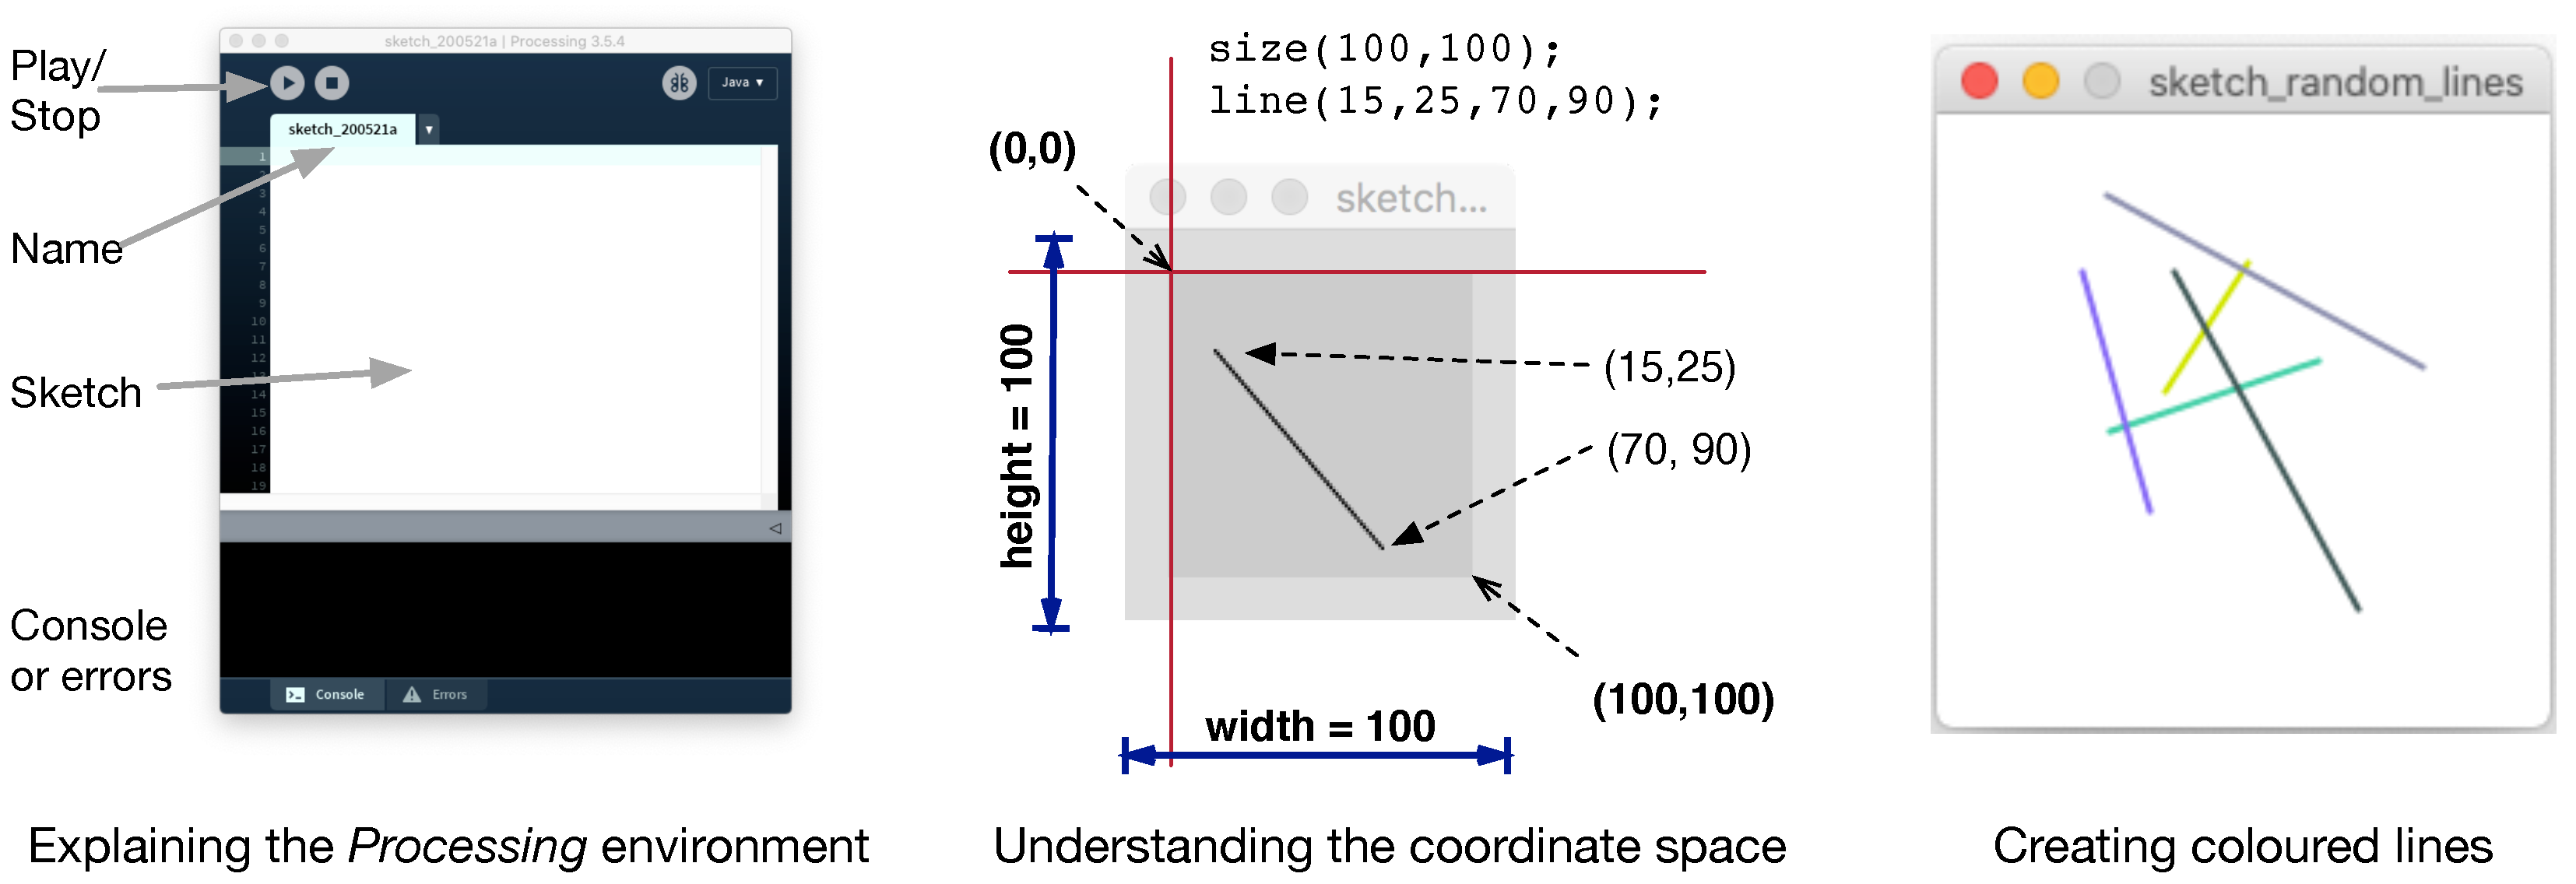
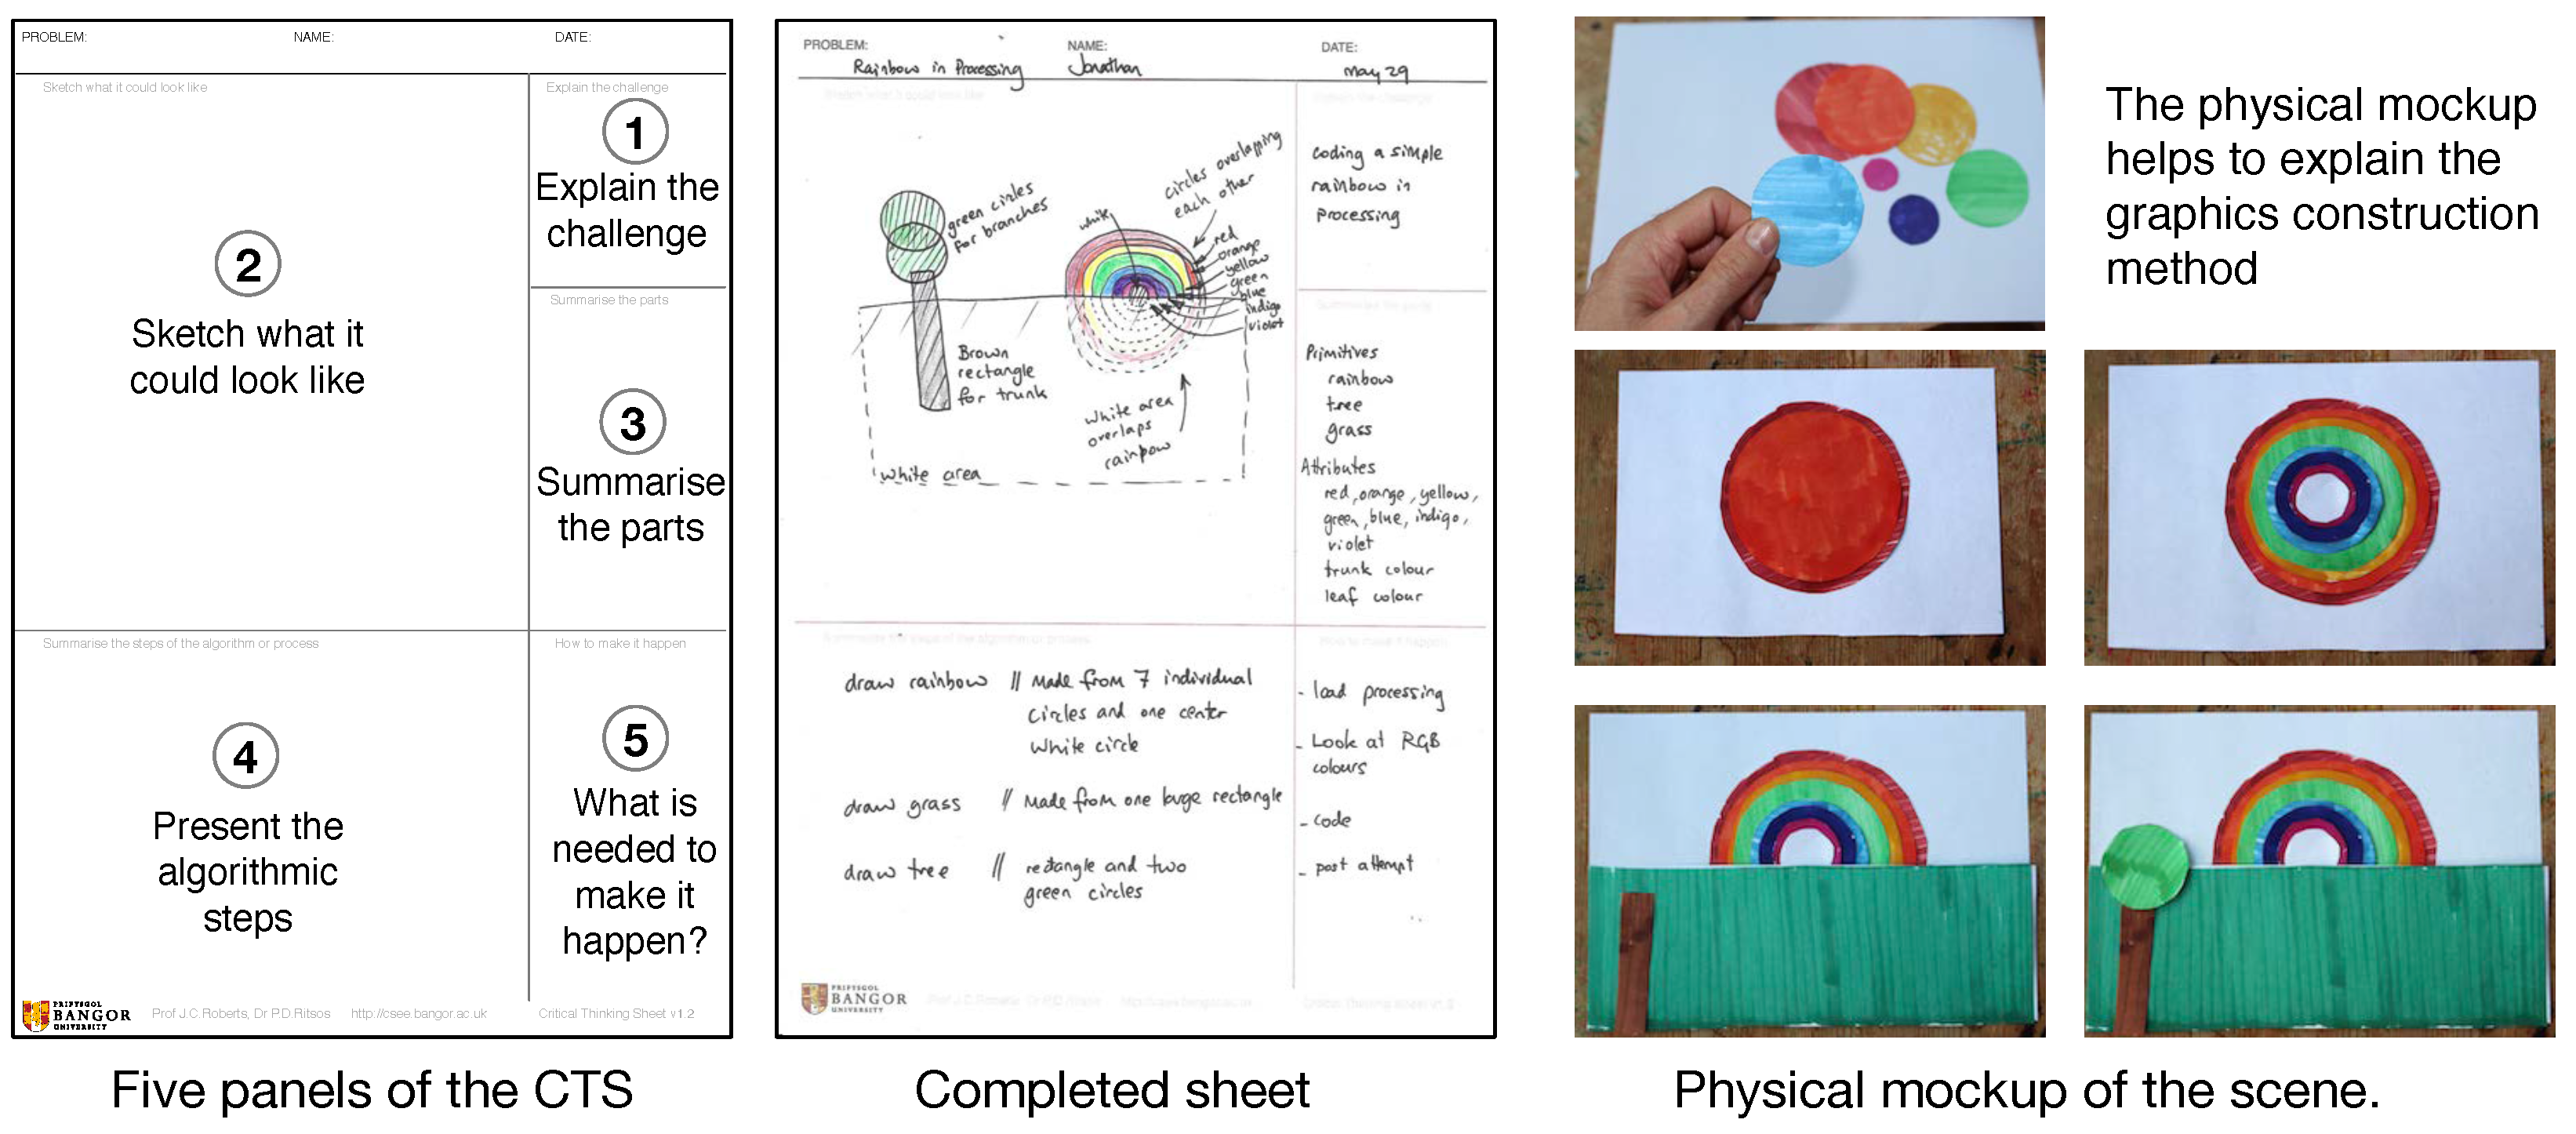
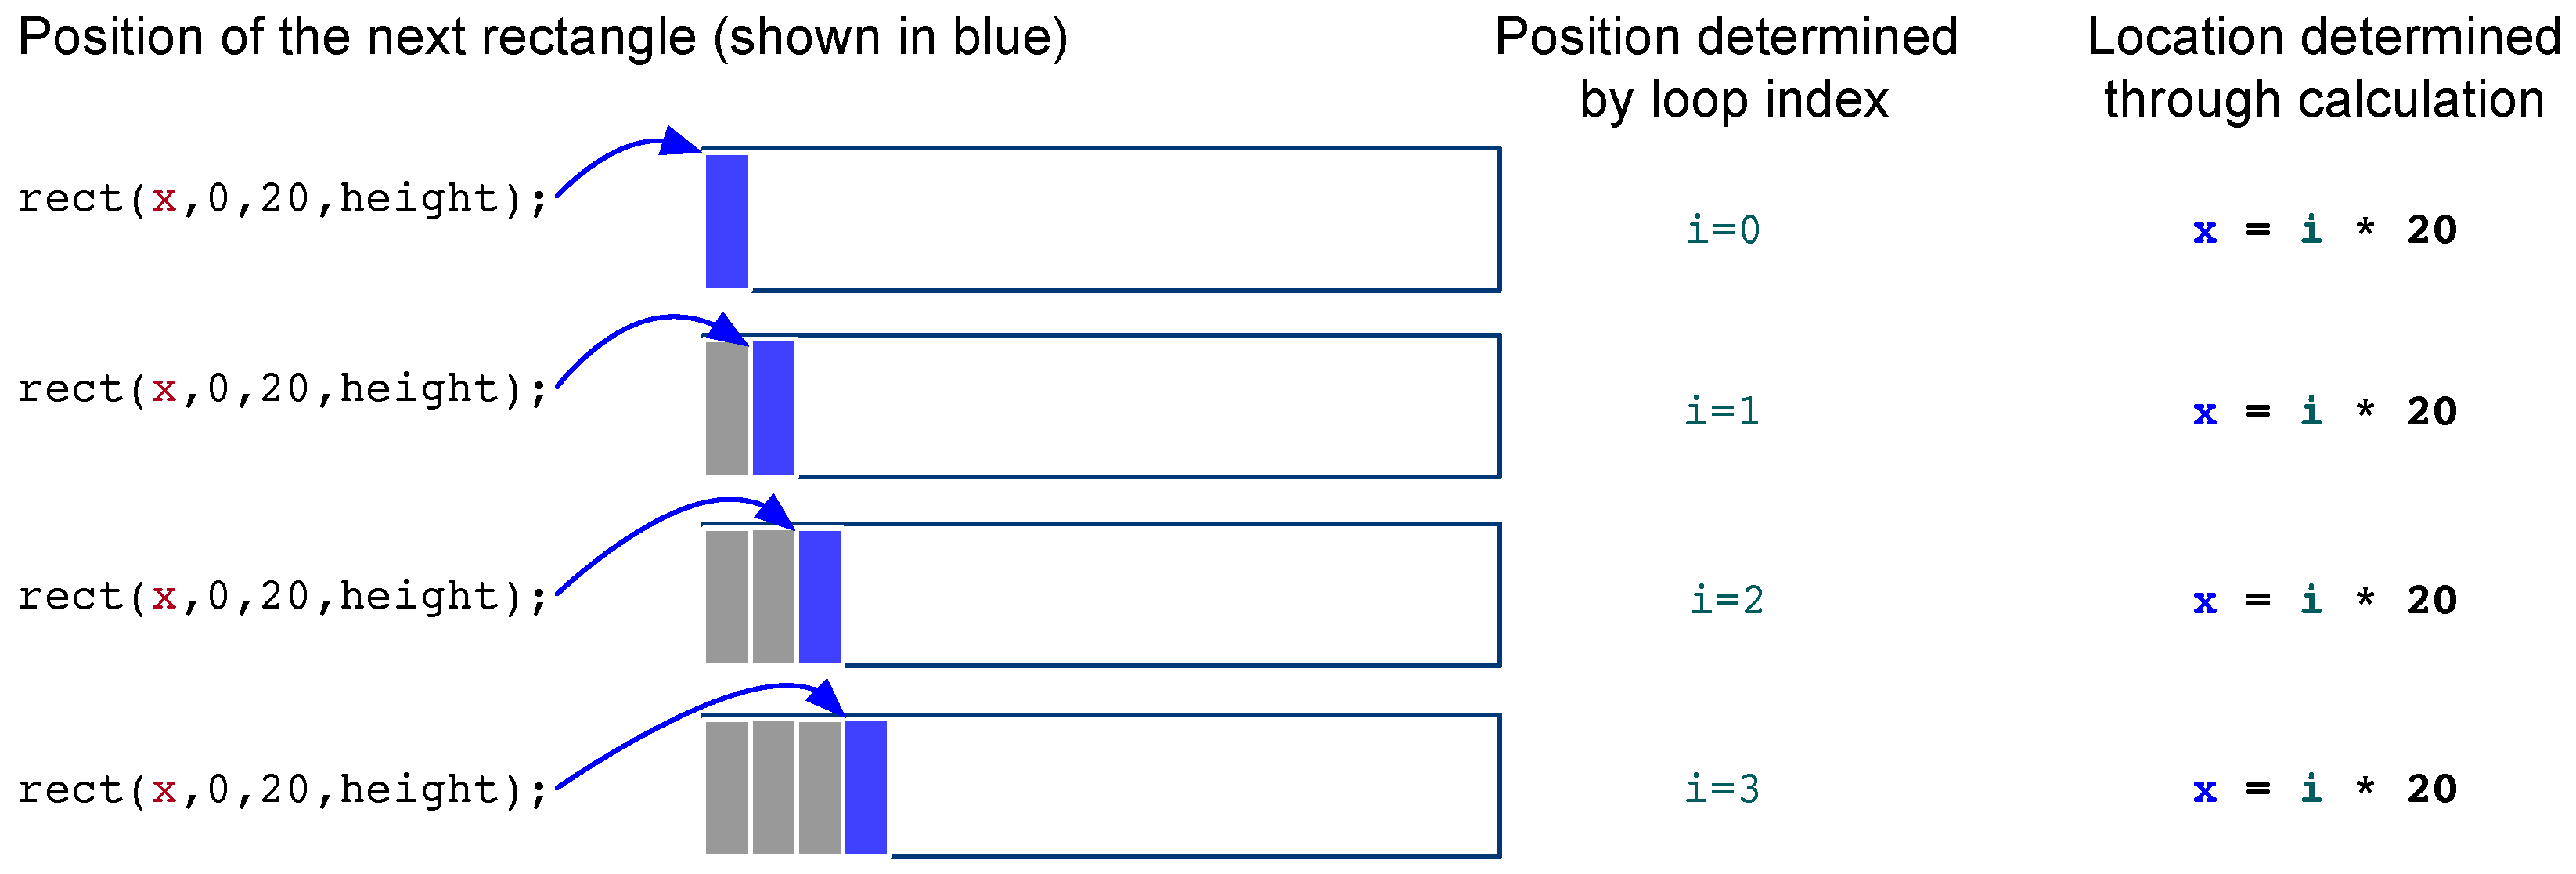
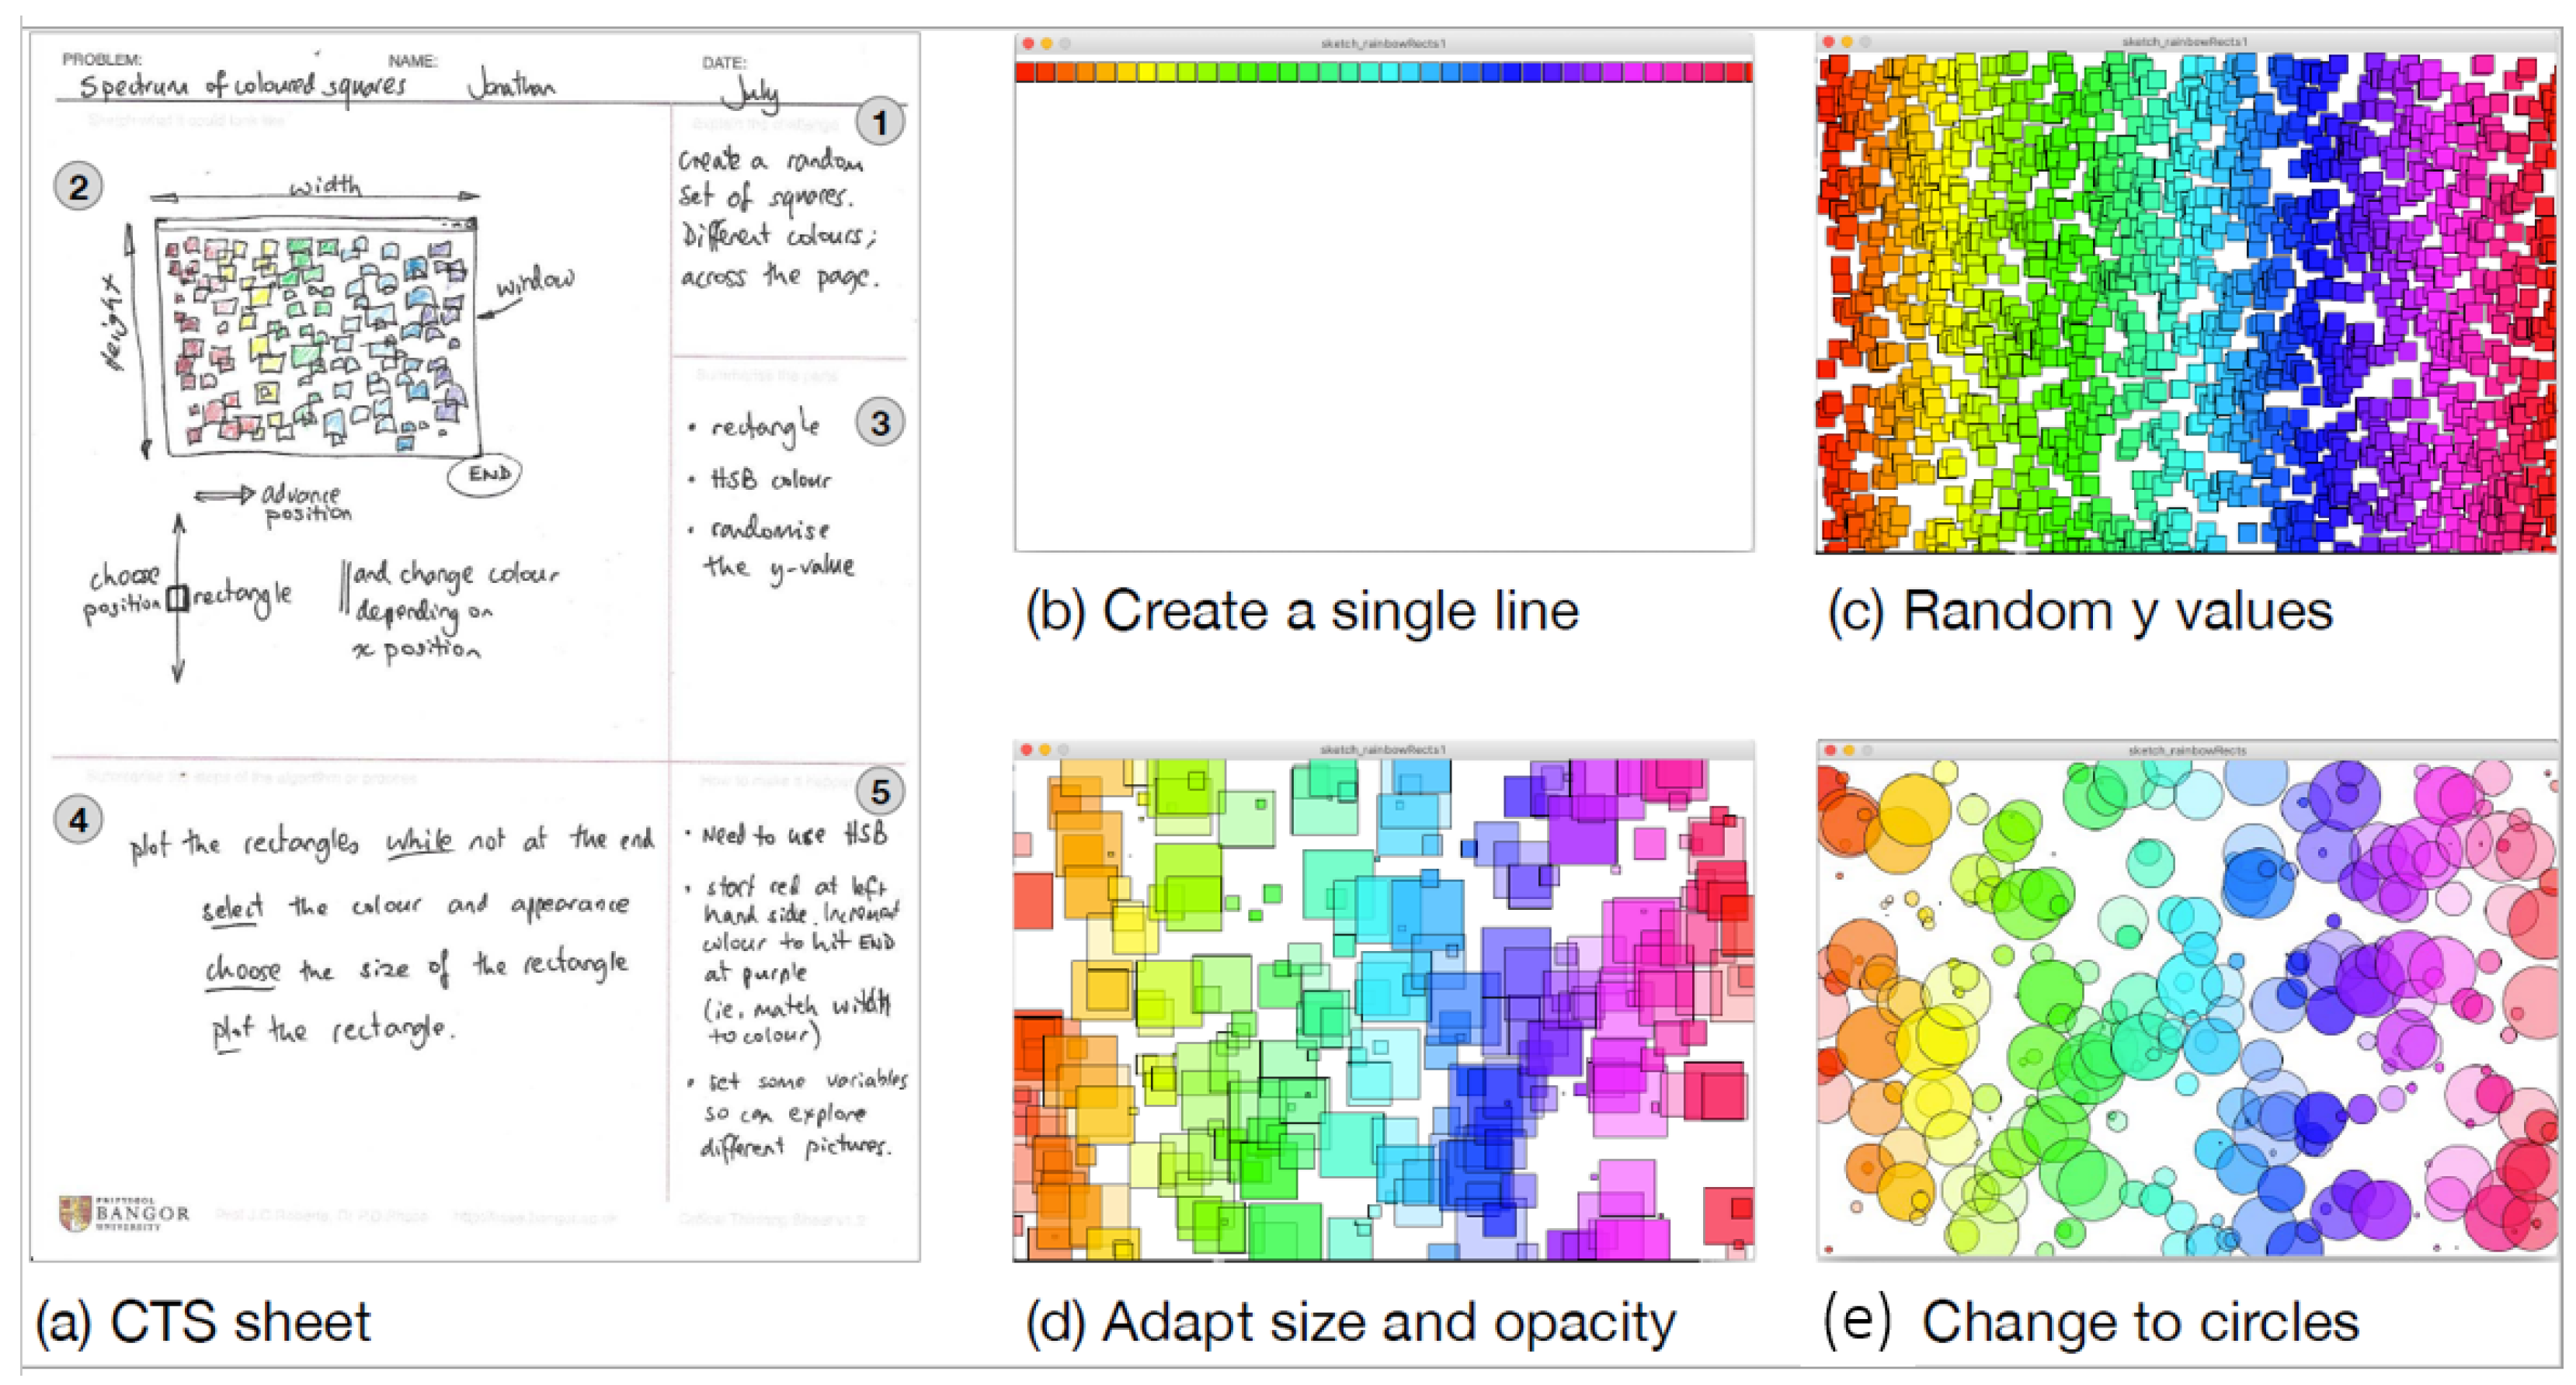
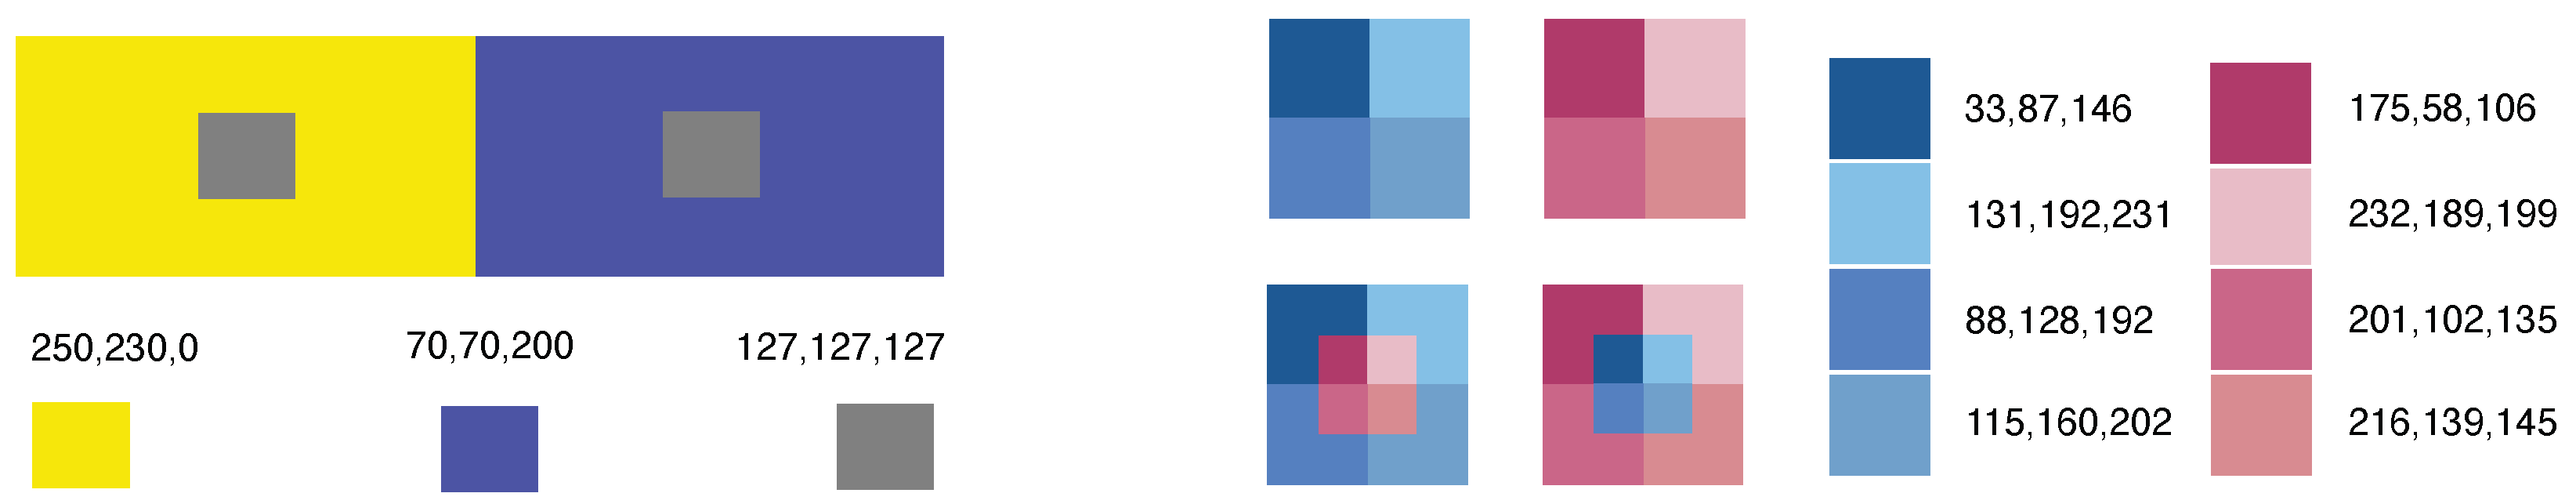
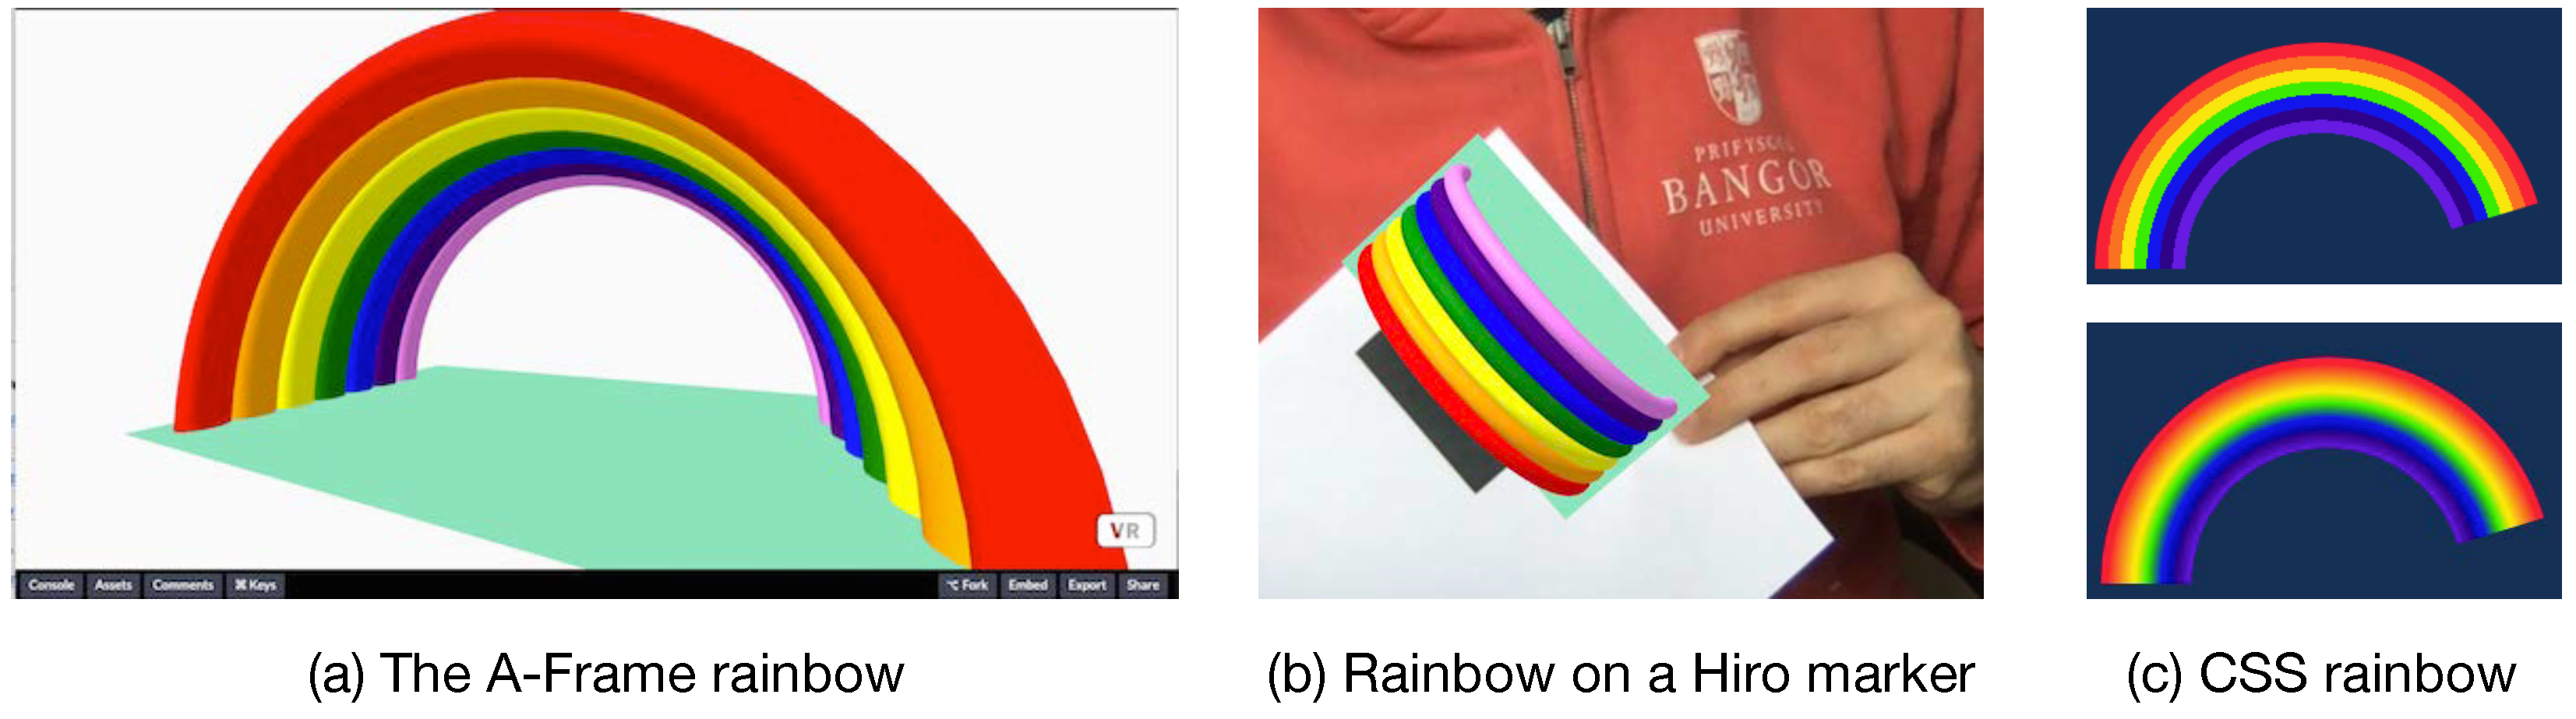
Table 1.
Three example activities with title, categories, and tags. We gave guidelines to academics to create appropriate descriptive titles, add categories and especially the level of beginner, intermediate, or advanced, and how to write the descriptive tags.
Table 1.
Three example activities with title, categories, and tags. We gave guidelines to academics to create appropriate descriptive titles, add categories and especially the level of beginner, intermediate, or advanced, and how to write the descriptive tags.
| Title | Categories | Tags |
|---|---|---|
| Create a coloured grid in Processing | Beginner, Colours, Java, Processing, Project Rainbow | cell, colour, for loop, grid, hsb, hue, index, jitter, random, saturation, value |
| Plot 40 rectangles and circles | Beginner, Colours, Processing, Project Rainbow | colour, critical thinking sheet, sheet, ellipse, hsb, hue, java, rectangles, refactor, saturation, value |
| Learn Hue, Saturation, and Brightness (HSB) colour coding | Beginner, Colours, Project Rainbow | brightness, colour, colour coding, colour picker, hsb, hue, project rainbow, rgb, saturation, value |
Publisher’s Note: MDPI stays neutral with regard to jurisdictional claims in published maps and institutional affiliations. |
© 2022 by the author. Licensee MDPI, Basel, Switzerland. This article is an open access article distributed under the terms and conditions of the Creative Commons Attribution (CC BY) license (https://creativecommons.org/licenses/by/4.0/).
Share and Cite
MDPI and ACS Style
Roberts, J.C. Active Learning Activities in a Collaborative Teacher Setting in Colours, Design and Visualisation. Computers 2022, 11, 68. https://0-doi-org.brum.beds.ac.uk/10.3390/computers11050068
AMA Style
Roberts JC. Active Learning Activities in a Collaborative Teacher Setting in Colours, Design and Visualisation. Computers. 2022; 11(5):68. https://0-doi-org.brum.beds.ac.uk/10.3390/computers11050068
Chicago/Turabian StyleRoberts, Jonathan C. 2022. "Active Learning Activities in a Collaborative Teacher Setting in Colours, Design and Visualisation" Computers 11, no. 5: 68. https://0-doi-org.brum.beds.ac.uk/10.3390/computers11050068
Note that from the first issue of 2016, this journal uses article numbers instead of page numbers. See further details here.