Article

Comparison of Statistical and Machine-Learning Models on Road Traffic Accident Severity Classification

1
CIMA, IIFA, University of Évora, 7000-671 Évora, Portugal
2
Department of Matematics, ECT, University of Évora, 7000-671 Évora, Portugal
3
Algoritmi Research Centre, University of Évora, 7000-671 Évora, Portugal
4
Department of Informatics, ECT, University of Évora, 7000-671 Évora, Portugal
5
ICT, IIFA, University of Évora, 7000-671 Évora, Portugal
6
Department of Geosciences, University of Évora, 7000-671 Évora, Portugal
7
CICS.NOVA.UEVORA, IIFA, University of Évora, 7000-208 Évora, Portugal
8
Department of Sociology, ECS, University of Évora, 7000-803 Évora, Portugal
9
Department of Visual Arts and Design, EA, University of Évora, 7000-208 Évora, Portugal
*
Authors to whom correspondence should be addressed.
These authors contributed equally to this work.
Submission received: 21 April 2022 / Revised: 11 May 2022 / Accepted: 12 May 2022 / Published: 16 May 2022
(This article belongs to the Special Issue Feature Paper in Computers)

Abstract

:
Portugal has the sixth highest road fatality rate among European Union members. This is a problem of different dimensions with serious consequences in people’s lives. This study analyses daily data from police and government authorities on road traffic accidents that occurred between 2016 and 2019 in a district of Portugal. This paper looks for the determinants that contribute to the existence of victims in road traffic accidents, as well as the determinants for fatalities and/or serious injuries in accidents with victims. We use logistic regression models, and the results are compared to the machine-learning model results. For the severity model, where the response variable indicates whether only property damage or casualties resulted in the traffic accident, we used a large sample with a small imbalance. For the serious injuries model, where the response variable indicates whether or not there were victims with serious injuries and/or fatalities in the traffic accident with victims, we used a small sample with very imbalanced data. Empirical analysis supports the conclusion that, with a small sample of imbalanced data, machine-learning models generally do not perform better than statistical models; however, they perform similarly when the sample is large and has a small imbalance.

Graphical Abstract

1. Introduction

In recent years, there has been a growing demand for public and freight transportation across the world, leading to an increase in the volume of road traffic. Studies on this matter also provide some valuable insights into the reasons for traffic accidents in many countries [1]. Road traffic crashes are one of the major social problems of modern societies not only because of the high number of victims but also due to the high costs associated.
In 2016, road traffic injuries were the eighth world-leading cause of death and are predicted to become the seventh leading cause of death by 2030 [2]. Moreover, road traffic costs represent about 1–3% of gross domestic product (GDP) worldwide [2]. In 2019, Portugal recorded the sixth highest rate of road fatalities among the 27 members of the European Union (EU), with more 16 fatalities per million inhabitants than the EU as a whole [3].
Beyond the impact caused by fatalities, in Portugal road traffic accidents have an economic and social impact equivalent to 1.2% of GDP, i.e., EUR 2.3 billion [4]. A better understanding of factors affecting the injury severity is fundamental to implementing appropriate strategies to improve road safety. In recent years, several methodological approaches have been used to analyse road traffic accident data.
Some of the statistical models that have been proposed to study crash-injury severities include binary logit, binary probit, Bayesian ordered probit, Bayesian hierarchical binomial logit, generalized ordered logit, log-linear model, mixed generalized ordered logit, multinomial logit, multivariate probit, ordered logit and ordered probit [5,6]. Several authors indicated the limitations to statistical modelling since the models make assumptions about the distribution of data and predefine the relationship between the dependent variable and the explanatory variables [7,8].
With the advances in computing methods, machine-learning-based models have emerged as promising tools in road safety research to overcome the limitations of statistical methods [9], namely, having higher adaptability to process not only outliers but also noisy and absent data. Machine-learning methods are mostly used as prediction tools, while statistical models are more frequently used in crash severity modelling as explanatory models [10].
To overcome the disadvantage of not providing an explicit relation between dependent variables and the explanatory ones, machine-learning typically adopts feature-based sensitivity analysis. Several studies revealed that crash injury severity is influenced by the driver attributes, vehicle features, crash characteristics, circumstances, etc. [6,11,12,13,14,15].
This paper analyses the daily data from the Statistical Bulletin of Road Traffic Accidents (BEAV) about accidents that occurred between 1 January 2016 and 31 December 2019, in the district of Setúbal (Portugal) in the areas of jurisdiction of the Territorial Command of the Guarda Nacional Republicana (CT-GNR) of Setúbal. The data was collected and validated by the CT-GNR of Setúbal, complemented by Autoridade Nacional de Segurança Rodoviária (ANSR) for 30-day victims, by Infraestuturas de Portugal for road characteristics and by Instituto Português do Mar e da Atmosfera (IPMA) for meteorological data.
This paper is organized as follows. Section 2 presents the study area, data description and the statistical methods used in the paper. Section 3 presents the results of the logistic regression and machine-learning methods, for severity and serious injury models. Section 4 discusses the results obtained, and the main conclusions of the paper are presented in Section 5.

2. Materials and Methods
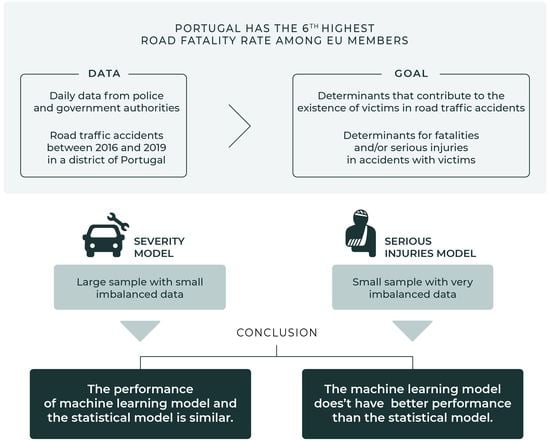
2.1. Study Area

Setúbal is the eighth largest district in Portugal with a land area of 5064 km2 divided into 13 municipalities and six protected natural areas. It houses many residents who commute daily to Lisbon, creating a high-density population with high traffic flow, concentrated mainly in the upper part of the district, which contrasts with the rest of the district with more agricultural areas, lower population density and rural roads with low traffic flow. The district is crossed by important access roads to Lisbon, Algarve (South of Portugal) and the Alentejo coast, in addition to containing important tourist spots, such as Sesimbra and Costa da Caparica, which increase the traffic flow during the summer holidays and weekends.
This district contains approximately 293 km of National Road (EN—Estrada Nacional), 219 km of Highway (AE—Autoestrada), 19 km of Principal Itinerary (IP—Itinerário Principal), 90 km of Complementary Itinerary (IC—Itinerário Complementar) and the bridges Vasco da Gama and 25 de Abril that cross the Tagus River in Lisbon, the capital of Portugal. The TC-GNR Setúbal has a jurisdiction area of approximately 96 % of this territory, including responsibility for the Vasco da Gama Bridge.
Between 2016 and 2019, the district of Setúbal is one of the Portuguese districts with the highest number of fatalities as a consequence of road traffic accidents but was not among the ones with the highest number of road traffic accidents.

2.2. Data

In Portugal, whenever the police entities GNR and Public Security Police (PSP) became aware of the occurrence of a traffic accident, these entities fill out the BEAV. This is a statistical notation instrument that aims to characterize, as faithfully as possible, the circumstances in which the road traffic accidents occurred, as well as the people and vehicles involved in the accident [16].
The BEAV is divided into two distinct parts [16]: (1) to be filled in all accidents and (2) to be filled only in accidents with victims. The first part contains the essential elements to identify the road traffic accident and general information about vehicles, drivers and the number of victims. When a road traffic accident with only material damage occurs, only this part of the BEAV is filled in. The second part aims to describe the surroundings of road traffic accidents with victims, collecting detailed information on the nature of the accident, vehicles, drivers and people involved in the accident.
ANSR updates the information about the injuries of the victims 30 days after the road traffic accident. The severity of injuries of the victims, within 30 days of the occurrence of the accident, is classified as [16]:
  • Fatal: victim who dies.
  • Serious injury: victim whose bodily injury requires hospitalization for more than 24 h and who does not die within 30 days of the accident.
  • Minor injury: victim whose bodily injury does not require hospitalization, or whose hospitalization is less than 24 h and who does not die within 30 days of the accident.
Through IPMA, it was possible to obtain meteorological information at the time and place of the accident, namely the temperature, wind velocity, precipitation volume, humidity and temperature measured at the meteorological station closest to the accident. The weather information was collected by the project team in the hour before and after the accident.
A database was created with the 2016–2019 reported 28,103 road traffic accidents that occurred in the municipality of Setúbal. These accidents involved 50,726 vehicles, 49,747 drivers and 8273 victims with injuries. The worst injury severity observed in the accident is distributed as follows: no injury (78.63%), minor injury (19.34%); serious injury (1.45%); and fatal injury (0.58%). The database contains different types of variables that were dispersed in the several data sources and are related to:
  • Accidents: county, accident location, type of accident, type and name of the road, type of roadside, type of lane, road conservation state, the existence of works on the road, the existence of light signals, the existence of pavement marks, the existence and type of damage on the road, existence of nearby health facilities, total and type of victims, driver escaping from the location of the accident, causes of the accident and date and time of the accident.
  • Vehicles: type of vehicle, class and category of vehicle, a vehicle with or without a trailer, if the vehicle burned, tire conditions, the existence of insurance and number of occupants.
  • Drivers: gender, date of birth, alcohol and drugs control, existence and year of driving license, driving time, the occurrence of driving manoeuvres and use of safety accessories.
  • Victims: type of victim, use of safety accessories, injury severity of the victim within 30 days and if the victim is a pedestrian in circulation.
  • Atmospheric conditions: precipitation, temperature, humidity, wind speed, the occurrence of hail and the existence of fog or smoke clouds.
The description of the accident location was checked against GPS coordinates. In the cases where differences were detected, the CT-GNR validated the information. In a few cases, the date of birth of the drivers and victims and the year of registration of the vehicles were incorrectly recorded. Whenever possible the information was corrected, for example, in cases where the year was registered with only two digits instead of four, and in the remaining cases, it was considered NA. No imputation was made in the missing values.
In the data processing stage, the data is cleaned and prepared so that it can be adequately used by the machine-learning algorithms. Such a stage involves handling null values, encoding values and assigning types to variables among other standard techniques.

2.3. Statistical and Machine-Learning Models

Facing a large dataset, not only in the number of road traffic accidents but also in the number of variables used, the first spatial analysis of the accidents was performed. The objective was to categorize the municipalities with the same vulnerability for the occurrence of a road traffic accident, thereby, reducing the number of municipalities from the initial 13 municipalities. This spatial analysis was incorporated in the statistical models, reducing the number of coefficients needed for the model fitting.
Logistic regression was used to identify some determinants for the existence of: (i) injured victims, within 30 days, in road traffic accidents (severity model) and (ii) fatalities and/or serious injuries (ignores lightly injured), within 30 days, in road traffic accidents with victims (serious injuries model), in the district of Setúbal.
For the severity model, the response variable was defined as y = 1 if the road traffic accident had victims, and y = 0 if the road accident had only property damage. For the serious injuries model, the response variable was defined as y = 1 if the road traffic accident had victims with serious or fatal injuries, and y = 0 if the road accident had victims with minor injuries. The logistic regression models were fitted according to the approach suggested by Hosmer and Lemeshow [17].
The explanatory variables considered were those defined in the previous section. To obtain a parsimonious multivariate model only the variables that were significant at 0.05 in the univariate analysis were considered and the interactions were considered significant at a 0.001 significance level (in order to obtain a simpler model and to avoid too many scenarios that are difficult to interpret and to understand).
In addition, we conducted an evaluation of the functional form of continuous variables through the LOWESS method and fractional polynomials, a residual analysis to search for influential observations and outliers and model validation through bootstrap. The goodness of fit was tested using the Cessie–van Houwelingen and the Hosmer–Lemeshow tests.
Machine-learning techniques have been used for the same response and explanatory variables used in logistic regression. The following supervised learning algorithms were used: random forest, Naive Bayes, Support Vector Machine, K-Nearest Neighbors and decision trees with the C5.0 algorithm. Random forest is one of the most-used classification and regression methods, operating by building decision trees on different samples and collecting the majority voting to provide the final prediction for classification problems. Naive Bayes is a simple classification algorithm based on Bayes’ Theorem and assumes that the predictors are independent.
Support Vector Machine (SVM) is another supervised learning algorithm that finds a hyperplane with dimensions equal to the number of features that separate the two classes of data points with the maximum distance between points. K-Nearest Neighbour (KNN) is one of the simplest machine-learning algorithms that classifies a new case based on the similarity between it and the available categories. C5.0 is a decision tree algorithm that uses information entropy to determine the best rule to split the data at that node; C5.0 is an evolution of the popular C4.5 algorithm developed by Ross Quinlan [18,19].
The data was pre-processed to be used in the machine-learning models using normalization of the variables. Some observations were deleted due to missing values. No missing values imputation was made. For each model, a random sample of 67% of observations was selected for the training data and 33% of the remaining data was used for validation. For the severity model, 18,791 observations were used for training and 9211 for testing, with a total of 25 variables.
For the serious injuries model, model 3712 observations were used for training and 1885 for testing, with a total of 40 variables. Some variables were initially categorized in the univariate phase of the logistic regression models; however, others were included without any further categories merging. Since the machine-learning models assume that all the data are numeric, factors need to be converted into dummy variables, resulting in a total of 44 predictors for the severity model and 112 predictors for the serious injuries model.
For the random forest model, the number of variables randomly collected to be sampled at each split time was 2 for the severity model and 23 for the serious injuries model, with a Gini impurity split rule (usually used in classification and regression tree algorithms) and a minimum node size of 1. For the C5.0 algorithm, results were obtained using a tree model and 20 trials. For the KNN, the final model used k = 9 . The SVM used a linear kernel with C = 1 . All algorithms used 25 bootstrap repetitions. The Naive Bayes classifier used the Laplace smoother and 10-fold cross-validation.
To compare the logistic regression model and the machine-learning models, the performance of each model was evaluated by its discrimination ability: accuracy, sensitivity, specificity and positive and negative predictive values. Sensitivity (also called recall) is the ability of the model to detect a true positive case, and specificity is the ability of the model to detect a true negative case.
The positive and negative predictive values are the proportions of positive and negative outcomes that are true positive and true negative values, respectively. The accuracy is then the proportion of model correct predictions. According to [20], for imbalanced data, the sensitivity is more interesting than the specificity; however, they can be combined into a single score balancing both measures, called the geometric mean or G-Mean.
Another popular classification metric for imbalanced data is the F-score or the F-measure, which combines, into a single measure, the balance between positive predictive values and sensitivity. Matthew’s correlation coefficient (MCC) is used as a measure of the quality of binary classifications and is one of the best measures to use when the data is very imbalanced or in cases where the minority class is set as the positive class.
The ROC curve (a graph showing the performance of a classification model at all classification thresholds) and the AUC (the area under the ROC curve) can also be obtained. For all models, the cut points used were selected in order to maximize both the sensitivity and specificity.
For the logistic regression model, the discrimination ability can also be assessed. The logistic regression model also has the advantage to give additional information about the significant variables and non-significant variables and allows measuring the size of effects in the response variable. Using the odds ratio also allows measuring the strength of that relationship and if those variables contribute to an increase or decrease in the probability of the occurrence of the event of interest (occurrence of a road traffic accident or severity of the road traffic accident). All statistical analyses were conducted using R version 4.0.4 [21].

3. Results

The main objective was to evaluate the performance of two different approaches to classify the severity of road traffic accidents. From the dataset available, two different response variables were considered that differ in the number of cases and also in the ratio of the imbalanced data.
First, the severity model was fitted, with the response variable being a road traffic accident resulting in property damage only (negative class) and a road traffic accident with victims (positive class). For these models, there were 22,097 road traffic accidents with property damage and 6006 accidents with victims. This is the case where we have a large sample of road accidents with victims and a slightly higher number of road accidents with property damage, resulting in an imbalance ratio of 4.7:1.
For the serious injuries model, the response variable is a road traffic accident resulting in victims with minor injuries (negative class) and a road traffic accident with victims with serious injuries and/or deaths (positive class). For these models, there are 5436 road traffic accidents with victims with minor injuries and 570 accidents with victims with serious injuries and/or deaths. This is the case where we have a small sample of road accidents with serious injuries and/or deaths and a considerably higher number of road accidents with victims with minor injuries, resulting in an imbalance ratio of 10:1.

3.1. Severity Model

Using the spatial analysis, the 13 municipalities of the Setúbal district were categorized and clustered according to the severity of the accident: one cluster is composed of the municipalities of Alcochete, Almada, Barreiro, Montijo, Setúbal and Sines; and another cluster composed of the municipalities of Alcácer do Sal, Grândola, Moita, Palmela, Santiago do Cacém, Seixal and Sesimbra. Therefore, this spatial analysis allowed us to reduce the number of categories of the variable Municipality, and these categories were used from the beginning of the fitting of the logistic regression model.
For the other variables, their categories were merged, and the likelihood ratio test was used to evaluate the simplified model against the model where the categories were separated. The final model (Table 1) presents the coefficients of the logistic regression model, as well as the corresponding standard deviation values and the p-values obtained from the Wald statistic.
In the final model, two continuous (or modelled as continuous) variables needed to be transformed in order to verify the assumption of the linearity with the logit. The variable total number of drivers was transformed in its squared root (called transf. in Table 1). For the maximum age of the drivers, the model needed two transformations: one given by the cubic value of the maximum age of the drivers (called transf. 1 in Table 1) and another by the cubic value of the maximum age of the drivers multiplied by 1 plus the logarithm of the maximum age of drivers (called transf. 2 in Table 1). The goodness of fit test for the multiple regression model had a p-value of 0.09 for the Hosmer–Lemeshow test, a Nagelkerke R 2 = 0.34 and an AUC of 0.813 ( O R 95 % = (0.806; 0.819)), asserting the goodness of fit of the model to the given data.
The adjusted severity model is presented in Table 1. Positive coefficients are associated with variables/categories with higher odds of an accident with victims with injuries (minor, serious and/or fatality), while negative coefficients are associated with lower odds. From the interpretation of the odds ratios, it can be concluded that the odds of existence of victims in road traffic accidents are higher when:
  • Temporal factors: accidents occur in the months of June to October; between Friday and Sunday; between 11 p.m. to 1 a.m. and between 6 a.m. to 7 a.m. (when compared with the ones between 1 a.m. to 4 a.m.), or between 7 a.m. to 11 p.m. (when compared with the ones between 5 a.m. and 6 a.m.), or between 4 a.m. and 5 a.m. (when compared with the ones between 11 p.m. and 1 a.m. and between 6 a.m. and 7 a.m.);
  • Weather factors: the wind speed decreases;
  • Driver and vehicle factors: accidents do not involve light vehicles (when compared with the ones involving light vehicles); accidents do not involve heavy vehicles (when compared with the ones involving heavy vehicles); accidents involve motorcycles (when compared with the ones not involving motorcycles); the age of the vehicles involved increases; and the maximum age of the drivers involved increases until 46 years and decreases when the maximum age of the drivers involved in the accidents is over 62 years old (when compared with an accident where the maximum age of drivers is 20 years);
  • Geographical factors: accidents occur in the municipality of Alcácer do Sal, Grândola, Moita, Palmela, Santiago do Cacém, Seixal and Sesimbra; accidents occur on national roads (EN), due to crashes (when compared with the ones that occur by collision); and accidents involve a pedestrian that occurs on other roads (when compared with the ones that occur on a highway/bridges); and
  • Accident-related factors: accidents where there was no escape; and the number of drivers increases.
The detailed results of the performance of several methods are presented in Table 2. The C5.0 algorithm was unable to correctly classify any of the minority class observations (PPV) and also had a weak predictive capacity over the majority class (NPV). All other methods had a weak predictive capacity over the minority class (PPV) and high predictive accuracy over the majority class (NPV), with the logistic regression model performing better than the other models. The KNN algorithm presented the worst performance in all measures.

3.2. Serious Injuries Model

Using the spatial analysis, the 13 municipalities of Setúbal district were categorized according to the severity of the accidents resulting in three clusters composed of the municipalities: (1) Alcácer do Sal, Alcochete and Palmela; (2) Almada, Moita, Montijo, Sesimbra and Setúbal; and (3) Barreiro, Grândola, Santiago do Cacém, Seixal and Sines. Therefore, this spatial analysis allowed us to reduce the number of categories of the variable Municipality, and these categories were used in the fitting of the logistic regression model.
Table 3 presents significant variables in the multiple logistic model for serious injuries and/or deaths in road traffic accidents with victims. Variables/categories with positive coefficients are associated with higher odds of an accident having fatalities and/or victims with serious injuries, while negative coefficients are linked to variables/categories with lower odds. The goodness of fit test for the multiple regression model had a p-value of 0.549 for the Cessie van Houwelingen test, a Nagelkerke R 2 = 0.15 and an AUC of 0.682 ( O R 95 % = (0.648; 0.717)), asserting the goodness of fit of the model to the given data.
The odds for the existence of serious injuries and/or fatalities in road traffic accidents with victims are higher when:
  • Geographical factors: the accidents occur in the municipalities of Alcochete, Alcácer do Sal and Palmela;
  • Temporal factors: the accidents occur between Thursday and Monday; between 2 a.m. to 5 a.m. and between 6 a.m. to 7 a.m. or between 8 p.m. to 2 a.m., 5 a.m. to 6 a.m. and 7 a.m. to 8 a.m. (when compared to the ones that occur between 8 a.m. to 8 p.m.);
  • Road characteristics: the accidents occurred on an IC/IP or on an EN; the accidents occurred on a road where the lanes do not have a central separator; the accidents occur inside urban areas when the roadside is not paved; and the accidents occur on a road with a paved roadside outside an urban area;
  • Driver characteristics: the majority of drivers involved are male; and the age of the youngest driver involved in the accident increases;
  • Victim characteristics: the age of the oldest victim involved in the accident increases; and
  • Vehicle features: the median age of the vehicles involved in the accident increases; in collision accidents, those involving heavy vehicles and those not involving heavy vehicles but involving motorbikes (when compared to the ones involving only light vehicles); and in accidents involving only light vehicles, those that occur by pedestrian running over and those by crashing (when compared to those that occur by collision).
The detailed results of the performance of the several methods are presented in Table 4. For this model, there are a much larger number of predictors than for the severity model, since, when a road traffic accident with victims occurs, more information is collected, and more variables can be used in the analysis. All methods presented similar values in the performance measures; however, logistic regression presented the highest G-mean and F-score values.

4. Discussion

We analysed data from road traffic accidents in a district of Portugal under the jurisdiction of the GNR-CT Setúbal. The initial challenge was to clean the original dataset and then add data from additional sources with different data structures and with information regarding the vehicles, drivers and victims of a given accident. It was possible to create a unified dataset with variables about the road traffic accident, vehicle, driver, victims, weather and road conditions. However, some of this information was only available in road traffic accidents with victims.
The main objective of the paper was to compare the performance of a statistical method and some machine-learning models for road traffic accident severity, mostly because severity is usually imbalanced. We analysed a severity model where the response variable was not so imbalanced and where there existed a large number of observations in the minority class. For a dataset with these characteristics, the accuracy (for the overall classification measure), the sensitivity and the predictive value—for the ability of the model to correctly classify the highest road traffic accident severity—are recommended.
Observing the results, it is possible to conclude that the C5.0 was unable to correctly classify any of the minority class observations and that the random forest presented a very poor classification ratio of this class as shown in Table 2. The Naive Bayes performed better in this requirement but with very low accuracy. The logistic regression model outperformed all the models in the G-mean, F-score and the overall measures, giving more information by indicating the variables with higher odds of having an accident with fatalities and/or victims with serious injuries.
For the serious injuries model, we had a small sample of positive cases with the most imbalanced data. In these scenarios, the sensitivity was more interesting than the accuracy; however, it is recommended to use measures, such as the G-mean or F-score. Observing these measures, the C5.0 algorithm and random forest had similar performance to the logistic regression model, which had higher performance than the Naive Bayes, the SVM and the KNN as shown in Table 4.
However, since the models have equivalent performance, the fact that the logistic regression model allows a researcher to know what are the significant and non-significant variables, and through the odds ratio, it also measures the increase or decreases risk of the road traffic accident severity of a given variable, one should not discard the statistical method on such analyses.

5. Conclusions

In general, we conclude that, for road traffic accident datasets with very imbalanced data and a small sample size (the most severe road traffic accidents), machine-learning models are not very suitable because they require many observations for training. This result has already been highlighted in previous studies [22]. For the case of a dataset with a larger sample of the class with the highest severity and more balanced datasets, the machine-learning models presented very good performance.
Nevertheless, the statistical logistic regression model was able to achieve similar performance with the additional gain of having more information about the importance of the variables in explaining the risk factors. To better support and generalise our conclusions, we intend to extend and apply this study to other datasets. We will apply this methodology to data from other regions in Portugal and, in this way, strongly validate the conclusions obtained from this set of experiences.
For future work, we plan to study the impact of choosing different fractions of data for training and testing and different approaches to lead with imbalanced data. More specifically, we intend to explore the use of machine-learning algorithms for the detection of rare events. We also intend to apply and evaluate the use of neural network architectures—in particular, the use of deep-learning methodologies to identify outliers in time-series data.

Author Contributions

Conceptualization P.I., G.J., A.A., L.R., V.N., P.Q., J.S., D.S., P.N., M.S., R.P.C., P.G. and P.R.M., methodology, P.I., G.J., A.A., V.N., P.Q., J.S. and P.N.; software, P.I., G.J., A.A., L.R., V.N., P.Q., J.S., D.S., P.N. and M.S.; validation, P.I., G.J., A.A., V.N., P.Q. and J.S.; formal analysis, P.I., G.J., A.A., L.R., V.N., P.Q. and J.S.; investigation, all authors; resources, all authors; data curation, A.A., V.N., P.Q., J.S. and D.S.; writing—original draft preparation, P.I., G.J., A.A., L.R., V.N., P.Q. and J.S.; writing—review and editing, all authors; visualization, all authors; supervision, P.I.; project administration, P.I. and V.N.; funding acquisition, all authors. All authors have read and agreed to the published version of the manuscript.

Funding

This research was funded by the Portuguese funding agency, FCT—Fundação para a Ciência e a Tecnologia, grant number FCT DSAIPA/DS/0090/2018, “MOPREVIS—Modelação e Predição de Acidentes de Viação no Distrito de Setúbal”, within the scope of the National Initiative on Digital Skills e.2030, Portugal INCoDe.2030.

Institutional Review Board Statement

Not applicable.

Informed Consent Statement

Not applicable.

Data Availability Statement

Restrictions apply to the availability of these data. Data was obtained from the Portuguese GNR in the context of the MOPREVIS project.

Acknowledgments

The authors are grateful for the data support given by ANSR, Infraestruturas de Portugal and IPMA.

Conflicts of Interest

The authors declare no conflict of interest.

Abbreviations

The following abbreviations are used in this manuscript:
AEHighway
ANSRAutoridade Nacional de Segurança Rodoviária (National Road Safety Authority)
BEAVStatistical Bulletin of Road Traffic Accidents
CT-GNRTerritorial Command of the GNR
ENNational Road
GNRGuarda Nacional Republicana (National Republican Guard)
ICComplementary Itinerary
IPPrincipal Itinerary
IPMAInstituto Português do Mar e da Atmosfera (Portuguese Institute for Sea and Atmosphere)
KNNK-Nearest Neighbour
MOPREVISModeling and Prediction of Road Traffic Accidents in the District of Setúbal
PSPPolícia de Segurança Pública (Public Security Police)
SVMSupport Vector Machine

References

  1. Belokurov, V.; Spodarev, R.; Belokurov, S. Determining passenger traffic as important factor in urban public transport system. Transp. Res. Procedia 2020, 50, 52–58. [Google Scholar] [CrossRef]
  2. World Health Organization. Global Status Report on Road Safety 2018. 2018. Available online: https://apps.who.int/iris/bitstream/handle/10665/276462/9789241565684-eng.pdf?sequence=1&isAllowed=y (accessed on 25 January 2022).
  3. Eurostat. Road Accidents: Number of Fatalities Continues Falling. 2021. Available online: https://ec.europa.eu/eurostat/en/web/products-eurostat-news/-/ddn-20210624-1 (accessed on 25 January 2022).
  4. Lusa. Sinistralidade Rodoviária tem Impacto Económico e Social Negativo de 1.2% do PIB-Governo. 2018. Available online: https://www.rtp.pt/noticias/pais/sinistralidade-rodoviaria-tem-impacto-economico-e-social-negativo-de-12-do-pib-governo_n1112193 (accessed on 25 January 2022).
  5. Savolainen, P.T.; Mannering, F.L.; Lord, D.; Quddus, M.A. The statistical analysis of highway crash-injury severities: A review and assessment of methodological alternatives. Accid. Anal. Prev. 2011, 43, 1666–1676. [Google Scholar] [CrossRef] [PubMed] [Green Version]
  6. Garrido, R.; Bastos, A.; de Almeida, A.; Elvas, J.P. Prediction of road accident severity using the ordered probit model. Transp. Res. Procedia 2014, 3, 214–223. [Google Scholar] [CrossRef] [Green Version]
  7. Zhang, J.; Li, Z.; Pu, Z.; Xu, C. Comparing prediction performance for crash injury severity among various machine learning and statistical methods. IEEE Access 2018, 6, 60079–60087. [Google Scholar] [CrossRef]
  8. Silva, P.B.; Andrade, M.; Ferreira, S. Machine learning applied to road safety modeling: A systematic literature review. J. Traffic Transp. Eng. (Engl. Ed.) 2020, 7, 775–790. [Google Scholar] [CrossRef]
  9. Jamal, A.; Zahid, M.; Tauhidur Rahman, M.; Al-Ahmadi, H.M.; Almoshaogeh, M.; Farooq, D.; Ahmad, M. Injury severity prediction of traffic crashes with ensemble machine learning techniques: A comparative study. Int. J. Inj. Control Saf. Promot. 2021, 28, 408–427. [Google Scholar] [CrossRef] [PubMed]
  10. Iranitalab, A.; Khattak, A. Comparison of four statistical and machine learning methods for crash severity prediction. Accid. Anal. Prev. 2017, 108, 27–36. [Google Scholar] [CrossRef] [PubMed]
  11. Li, Y.; Liu, C.; Ding, L. Impact of pavement conditions on crash severity. Accid. Anal. Prev. 2013, 59, 399–406. [Google Scholar] [CrossRef] [PubMed]
  12. Martensen, H.; Dupont, E. Comparing single vehicle and multivehicle fatal road crashes: A joint analysis of road conditions, time variables and driver characteristics. Accid. Anal. Prev. 2013, 60, 466–471. [Google Scholar] [CrossRef] [PubMed]
  13. Hosseinpour, M.; Yahaya, A.S.; Sadullah, A.F. Exploring the effects of roadway characteristics on the frequency and severity of head-on crashes: Case studies from Malaysian Federal Roads. Accid. Anal. Prev. 2014, 62, 209–222. [Google Scholar] [CrossRef] [PubMed]
  14. Yasmin, S.; Eluru, N.; Bhat, C.R.; Tay, R. A latent segmentation based generalized ordered logit model to examine factors influencing driver injury severity. Anal. Methods Accid. Res. 2014, 1, 23–38. [Google Scholar] [CrossRef]
  15. Rezapour, M.; Moomen, M.; Ksaibati, K. Ordered logistic models of influencing factors on crash injury severity of single and multiple-vehicle downgrade crashes: A case study in Wyoming. J. Saf. Res. 2019, 68, 107–118. [Google Scholar] [CrossRef] [PubMed]
  16. ANSR. Manual de Prenchimento. Boletim Estatístico de Acidente de Viação. 2013. Available online: http://www.ansr.pt/Estatisticas/BEAV/Documents/MANUALPREENCHIMENTOBEAV.pdf (accessed on 25 January 2022).
  17. Hosmer, D.W., Jr.; Lemeshow, S.; Sturdivant, R.X. Applied Logistic Regression; John Wiley & Sons: Hoboken, NJ, USA, 2013; Volume 398. [Google Scholar]
  18. Quinlan, J.R. C4.5: Programs for Machine Learning; Morgan Kaufmann Publishers: San Francisco, CA, USA, 1993. [Google Scholar]
  19. Research, R. Is See5/C5.0 Better Than C4.5? 2017. Available online: https://rulequest.com/see5-comparison.html (accessed on 25 January 2022).
  20. He, H.; Garcia, E.A. Learning from Imbalanced Data. IEEE Trans. Knowl. Data Eng. 2009, 21, 1263–1284. [Google Scholar] [CrossRef]
  21. R Core Team. R: A Language and Environment for Statistical Computing; R Foundation for Statistical Computing: Vienna, Austria, 2021. [Google Scholar]
  22. Fiorentini, N.; Losa, M. Handling Imbalanced Data in Road Crash Severity Prediction by Machine Learning Algorithms. Infrastructures 2020, 5, 61. [Google Scholar] [CrossRef]
Table 1. Logistic regression model for road traffic accident severity. In the table, we present the significant variables of the final multiple regression model, with a complete description of their categories. The coefficients of the model, the standard deviations and the p-values obtained from the Wald statistic are presented.
VariableCoefficientStd. Errorp-Value
Constant−4.300.20<0.001
Municipality (ref: Alcochete/Almada/Barreiro/Montijo/Setúbal/Sines)
 Alcácer do Sal/Grândola/Moita/Palmela/Santiago do Cacém/Sesimbra/Seixal0.180.04<0.01
Accident location (ref: Inside urban area)
 Outside urban area0.370.05<0.001
Type of accident (ref: Collision)
 Pedestrian running over−0.780.430.068
 Crash1.000.12<0.001
Type of road (ref: AE/bridge)
 EN−0.100.080.220
 IC/IP−0.100.100.293
 Other−0.740.09<0.001
Accident escape (ref: No)
 Yes−1.440.100.001
Wind velocity m/s−0.060.020.001
Month (ref: November to May)
 June to October0.140.04<0.001
Day of the Week (ref: Monday to Thursday)
 Friday to Sunday0.070.040.045
Hour of the day (ref: 11 p.m.–1 a.m. and 6 a.m.–7 a.m.)
 1 a.m.–4 a.m. and 7 a.m.–11 p.m.−0.290.07<0.001
 4 a.m.–5 a.m.0.390.200.0452
 5 a.m.–6 a.m.−0.750.220.001
Type of vehicle (ref: Light passenger vehicles)
 Motorbikes but not heavy vehicles2.680.05<0.001
 Heavy vehicles0.050.010.460
% of male drivers (ref: <50%)
 ≥50%−0.230.05<0.001
Median age of vehicle0.03<0.01<0.001
Total number of drivers (transf.)2.050.11<0.001
Maximum age of drivers (transf. 1)4.590.99<0.001
Maximum age of drivers (transf. 2)2.020.24<0.001
Type of accident × Type of road
 Pedestrian running over × EN2.830.46<0.001
 Crash × EN0.650.13<0.001
 Pedestrian running over × IC/IP1.890.53<0.001
 Crash × IC/IP0.260.170.132
 Pedestrian running over × Others5.200.44<0.001
 Crash × Others0.870.12<0.001
Table 2. Performance measures for the statistic logistic regression model and the machine-learning models for road traffic accident severity.
MeasureLogistic RegressionMachine-Learning Algorithms
Random ForestNaive BayesC5.0SVMKNN
Accuracy0.6520.5020.5000.0940.5120.420
Sensitivity0.7320.6950.6380.0000.6050.638
Specificity0.6450.4820.4861.0000.5020.398
PPV 10.1710.1220.114-0.1120.099
NPV 20.9600.9380.9280.0940.9250.914
G-mean0.6870.5790.5570.0000.5510.504
F-score0.2770.2080.193-0.1890.171
MCC0.2220.1030.073-0.0620.021
1 PPV—Positive predictive value. 2 NPV—Negative predictive value.
Table 3. Logistic regression model for severe injuries and/or deaths in road traffic accidents with victims. In the table, we present the significant variables of the final multiple regression model, with a complete description of their categories. The coefficients of the model, the standard deviations and the p-values obtained from the Wald statistic are presented.
VariableCoefficientStd. Errorp-Value
Constant−4.950.30<0.001
Municipality (ref: Alcácer do Sal/Alcochete/Palmela)
 Almada/Moita/Montijo/Sesimbra/Setúbal−0.670.12<0.001
 Barreiro/Grândola/Santiago do Cacém/Seixal/Sines−0.230.120.044
Accident location (ref: Inside urban area)
 Outside urban area1.090.20<0.001
Type of accident (ref: Collision)
 Pedestrian running over1.610.19<0.001
 Crash0.800.16<0.001
Type of roadside (ref: Paved)
 Unpaved or non-existent0.610.16<0.001
Type of road (ref: AE/bridge or other)
 IC/IP or EN0.500.11<0.001
Type of lane (ref: Without central separator)
 With central separator−0.520.160.001
Day of the week (ref: Thursday to Monday)
 Tuesday and Wednesday−0.250.110.024
Hour of the day (ref: 8 a.m.–8 p.m.)
 8 p.m.–2 a.m., 5 a.m.–6 a.m., 7 a.m.–8 a.m.0.610.11<0.001
 2 a.m.–5 a.m., 6 a.m.–7 a.m.1.110.19<0.001
Type of vehicle (ref: Light passenger vehicles)
 Motorbikes but not heavy vehicles1.260.14<0.001
 Heavy vehicles1.390.20<0.001
% of male drivers (ref: <50%)
 ≥50%0.840.17<0.001
Median age of vehicle0.020.010.009
Maximum victims age0.020.00<0.001
Age of the youngest driver−0.010.00<0.001
Type of accident × Type of vehicle
 Pedestrian running over × motorbikes but not heavy vehicles−1.450.610.017
 Crash × motorbikes but not heavy vehicles−1.080.23<0.001
 Pedestrian running over × heavy vehicles−0.250.570.653
 Crash × heavy vehicles−1.860.570.001
Type of roadside × Accident location
 Unpaved or non-existent × outside urban area−0.700.220.001
Table 4. Performance measures for the statistic logistic regression model and the machine-learning models for severe injuries and/or deaths in road traffic accidents with victims.
MeasureLogistic RegressionMachine-Learning Algorithms
Random ForestNaive BayesC5.0SVMKNN
Accuracy0.6260.6260.6530.6100.6490.644
Sensitivity0.8640.8500.7680.8880.7720.719
Specificity0.5570.5600.6190.5280.6120.622
PPV 10.3630.3620.3720.3560.3690.358
NPV 20.9330.9270.9010.9410.9020.883
G-mean0.6940.6900.6900.6850.6880.669
F-score0.5110.5080.5010.5080.4990.478
MCC0.3530.3440.3250.3510.3220.289
1 PPV—Positive predictive value. 2 NPV—Negative predictive value.
Publisher’s Note: MDPI stays neutral with regard to jurisdictional claims in published maps and institutional affiliations.

