
Energy Efficiency of IoT Networks for Environmental Parameters of Bulgarian Cities


1
Faculty of Technics and Technologies, Trakia University, 38 Graf Ignatiev Str., Yambol, 8602 Stara Zagora, Bulgaria
2
Department of Automatics and Mechatronics, Ruse University, “Angel Kanchev” Ruse 8 Studentska Str., 7017 Ruse, Bulgaria
*
Author to whom correspondence should be addressed.
Computers 2022, 11(5), 81; https://0-doi-org.brum.beds.ac.uk/10.3390/computers11050081
Submission received: 24 April 2022
/
Revised: 12 May 2022
/
Accepted: 13 May 2022
/
Published: 17 May 2022
(This article belongs to the Special Issue The Internet of Things—Current Trends, Applications and Future Challenges)
Abstract
:Building modern Internet of Things (IoT) systems is associated with a number of challenges. One of the most significant among them is the need for wireless technology, which will serve to build connectivity between the individual components of this technology. In the larger cities of Bulgaria, measures to ensure low levels of harmful emissions, reduce noise levels, and ensure comfort in urban environments have been taken. LoRa technology shows more advantages in transmission distance and low energy consumption compared to other technologies. That is why this technology was chosen for the design of wireless sensor networks (WSN) for six cities in Bulgaria. These networks have the potential to be used in IoT configurations. Appropriate modules and devices for building WSN for cities in Bulgaria have been selected. It has been found that the greater number of nodes in the WSN leads to an increase in the average power consumed in the network. On the other hand, depending on the location of these nodes, the energy consumed may decrease. The performance of wireless sensor networks can be optimized by applying appropriate routing protocols, which are proposed in the available literature. The methodology for energy efficiency analysis of WSN can be used in the design of wireless sensor networks to determine the parameters of the environment, with the possibility of application in IoT.
1. Introduction
The need for networking of non-complex sensor devices is increasing worldwide [1] in connection with the application of the Internet of Things, which is based on technologies designed for networking, low-cost, low-power consumption, and low data transfer capacity.
When creating a WSN to monitor the parameters of the urban environment, we are not looking for direct profit, but to improve people’s living conditions. Using sensor data, it is possible to assess what needs to be changed and where, for example by regulating and controlling car traffic so that we can breathe cleaner air. Funding comes from the state (represented by municipal authorities). One of their duties is to take care of people’s health. In the same way, funds from European environmental programs and projects can be used.
In automating the processes of measuring, transmitting, storing and processing data on the state of the environment in urban conditions, IoT technology is used in [2]: monitoring of environmental pollutants such as vehicles, industrial enterprises; climate change; disaster and accident warnings; assistance to people with disabilities; detection of aging and defects in machinery and equipment; advertising and media; evaluation of products and services; public safety in the city.
As a result of the measurements and analysis of the data received from the measuring stations, the governing bodies in the city organize activities to improve the health of the environment in cities. Such activities include a change in the organization of road transport in the city in order to reduce noise and the amount of harmful substances. In the same way, recommendations can be generated for production enterprises in the city to reduce harmful emissions and waste products resulting from the production they perform. The ultimate goal to be achieved is to create healthy living conditions for the population and protect the environment by developing and implementing an integrated approach and measures to avoid air and water pollutants and high noise levels by preventing or reducing these harmful effects.
In recent years, measures have been adopted in Bulgaria to measure the levels of harmful emissions, noise and pollutants from transport and industrial enterprises in urban environments. These measures are in line with the requirements of the European Union to ensure a healthy living environment in cities. The potential applications of IoT in this regard are diverse. The European Commission’s IoT documents include the so-called smart city, defined as “a place where traditional networks and services become more efficient by using digital and telecommunications technologies for the benefit of residents and businesses” [3].
Updating the map for noise in settlements in Bulgaria is related to the fulfillment of the requirements of the Environmental Noise Protection Act (EPAA) (Promulgated, SG No. 74 of 13 September 2005) and Directive 2002/49/EC for the assessment and management of environmental noise. According to these requirements, it is the duty of every agglomeration with a population of over 100,000 inhabitants to update its noise map.
In the larger cities of the Republic of Bulgaria such measures to ensure low levels of harmful emissions, reduce noise levels, and ensure comfort in urban environments have been taken [4]. The measures are also supported by companies offering mobile services [5,6]. The following are provided [5]: intelligent parking systems, which show drivers the nearest free parking space and navigate them to it; intelligent lighting, providing greater security for citizens as well as saving on electricity costs for municipalities; air quality control; effective management of garbage containers; remote and intelligent metering of water meters, electricity meters and other measuring devices for households.
Measurements are based on automatic specialized stations, as well as by measuring with portable measuring instruments. The trend is to expand networks for automatic measurement and storage. For this purpose, it is necessary to select the appropriate technology for the wireless transmission of sensor data.
A review of the available literature sources [1,4,6] shows that in Bulgaria there is a need to create new and expand existing wireless sensor networks to measure the levels of pollutants in the environment. There is little research on the energy efficiency of this type of network.
Building modern systems based on IoT is associated with a number of challenges. One of the most important among them is the need for wireless technology, which will serve to build connectivity between the individual components of a new technology. There are various standards for wireless communication. Several of them are widely used and applicable to objects and devices with extremely low power. They can be IP-compatible or non-IP-compliant. Most of the wireless standards applicable to low-power devices are characterized by having a short range [7,8]. These standards are suitable for use in the construction of WSN, of course, taking into account their advantages and limitations.
The simulation analyses presented in some of the available literature [9,10] sources are related to “hypothetical” WSNs, which have a certain radius of availability and operating parameters. It is necessary to make studies which take into account the working conditions, geographical location, and number of nodes in the WSN.
Table 1 provides a comparative analysis of the performance of four commonly used wireless communication technologies that are suitable for use in sensor networks. The difference in bandwidth between the compared wireless communication technologies is not large. Baker [9] points out that the ZigBee over 802.15.4 protocol has more application capabilities than Bluetooth due to its long battery life, greater usable range, dimensional flexibility, and reliability of the network architecture. According to Lee et al. [10], the effective use of network protocols depends to a large extent on specific practical applications, as well as network reliability, roaming capability, recovery mechanism, hardware cost and network installation and maintenance costs. LoRa technology shows more advantages in transmission distance and a lower power consumption than other technologies. Due to the potentially complex environment in which the sensor devices will operate, problems also arise when using LoRa technology. In an urban environment, these are the presence of buildings, trees, and features of the terrain that prevent the transmission of signals in wireless networks [11].
The LoRaWAN protocol (https://www.thethingsnetwork.org, accessed on 1 April 2022) is built on LoRa technology. LoRa provides the physical layer that allows for long-distance bonding. LoRaWAN defines the communication protocol and system architecture. Protocol and network architecture have the greatest impact on battery life at a node, network capacity, quality of service, security, and the variety of applications served by the network. If the sensors need to be used as portable devices, this requires a communication protocol for dynamic LoRa sensor networks. This protocol is “multi-hop”. An advantage of this transmission method is that restrictions on the maximum distances at which WSN data are received/transmitted can be avoided. The limitations of multi-hop are that it has high latency and low reliability.
When setting up communication in a LoRa network, the following key characteristics need to be taken into account [12]: Transmission Power (TP), which varies in the range [−4, 20 dBm], but due to some restrictions can be used in the range 2–20 dBm; Carrier Frequency (CF), which changes in steps of 61 Hz, in the range 137–1020 MHz, for which the scope depends on the scheme used and the region in which it is used; Spreading Factor (SF), which represents the ratio between the symbol rate and the chip rate and varies in the range of 6–12. High levels of this factor increase the signal-to-noise ratio (SNR), as well as increase the rate of transmission and time to transfer data packets; Bandwidth (BW), which represents the bandwidth of the transmission band. At higher BW values, more data are transmitted simultaneously, but at the expense of lower sensitivity and noise overlay in the signal. It is commonly used at frequencies of 125, 250 and 500 kHz; Code Rate (CR), which is a method of error correction. Higher CR levels allow for better noise reduction but reduce data rates. The default is 4/8, but it can have values of 4/5, 4/6, 4/7, or 4/8.
The aim of this paper is to clarify the technical challenges related to the energy efficiency of using LoRa networks in six cities in Bulgaria.
The main contributions that can be summarized are: a comparative analysis of WSN for six cities in Bulgaria; when designing a WSN, it is necessary to take into account the number of nodes, their location and the size of the network as a whole; the performance of wireless sensor networks can be optimized by applying appropriate routing protocols, which are proposed in the available literature; the proposed analyses of wireless sensor networks can be used for IoT scenarios to determine environmental parameters.
The article is structured as follows: An analysis of available literature sources has been made (Section 2). Six cities in Bulgaria have been selected (Section 3). WSN topologies have been created, depending on the regulations for each city. A numerical analysis of wireless sensor networks in terms of their energy efficiency was performed, and the obtained results are compared with those of the available literature (Section 4). Summaries and conclusions have been made (Section 5).
2. Related Works
The parameters BW, SF, different loads and modulation methods in LoRa were used by Aref et al. [13]. The authors study the influence of the data obtained from environmental parameters on the indicated characteristics of the wireless network. According to Rida et al. [14], the communication setup parameters in LoRa have a significant impact on the performance of the wireless sensor network. Such is the power of the transmitter, BW, SF, and the number of measuring points. The choice of an appropriate method of communication depends on its application and requirements. The way data are transmitted is also an important factor in communication, as Kim et al. [15] described. These authors offer a LoRa-based network with 3000 end devices. A real test for LoRa was performed and experiments were performed to find a simplified model that reduces data loss in LoRa. The authors found that the radio signal can reach distances above 1344 m with different values of SF in a combined indoor and outdoor communication environment.
Mikhaylov [16] points out that the European 868 MHz Industrial, Scientific and Medical (ISM) band is an appropriate frequency band due to the use of low frequencies for data transmission over LoRa wireless networks in European countries. The study in this article was carried out in Bulgaria and such a permitted frequency range was used.
Lukas et al. [17] offer a system for monitoring the parameters of the environment. It is based on IoT and LoRa. The main purpose of this system is to determine the characteristics of water. When using wireless sensor networks, it is necessary to take into account exactly which environmental parameters will be measured. For example, the measurement of water characteristics differs, for example, from that of air or noise in an urban environment.
Energy consumption is of great importance when using LoRa in IoT applications. According to Liang et al. [2], the closer they are to the gateway, the less energy the wireless sensor devices consume. The sensor devices are designed to use a battery or solar panels. Reducing the energy consumed will increase the life of the device and the frequency of transmission of measurement data.
The topology of the network also needs to be taken into account [18]. The “star” topology used in LoRa, in addition to its advantages, also has some limitations related to the high load on the central node, especially in networks with multiple wireless measuring stations.
According to Fernandez-Prieto et al. [19], a complete wireless sensor data collection system covers the design of the network topology, the hardware and software of the sensor nodes, the protocols and the cloud web server platform. The authors propose a comprehensive project of the IoT network for the assessment of environmental parameters in urban conditions. The stages of network design and performance evaluation can be used in the present work.
The design of a sensor network using LoRa technology is proposed by Hristov et al. [20]. The authors design the network on three levels and offer a sensor measurement system, as well as a methodology for designing wireless sensor networks in IoT. A disadvantage of this project is that the proposed methods and tools have not been tested in a real environment.
From the review of the available literature, it can be concluded that the simulation studies of LoRa wireless sensor networks are carried out “in principle”, without taking into account the influence of the environment in which they are used and the exact location of sensor devices. The evaluation of actually created networks is performed after their installation. This leads to inefficient use and detection of deficiencies once the network is installed. For this reason, the shortcomings of creating a wireless sensor network are difficult to overcome. Further research is needed on the simulation analysis of wireless sensor networks suitable for use in IoT. This analysis must take into account both the characteristics and setup of the devices with network communication and the environmental factors of the space in which they will operate.
3. Material and Methods
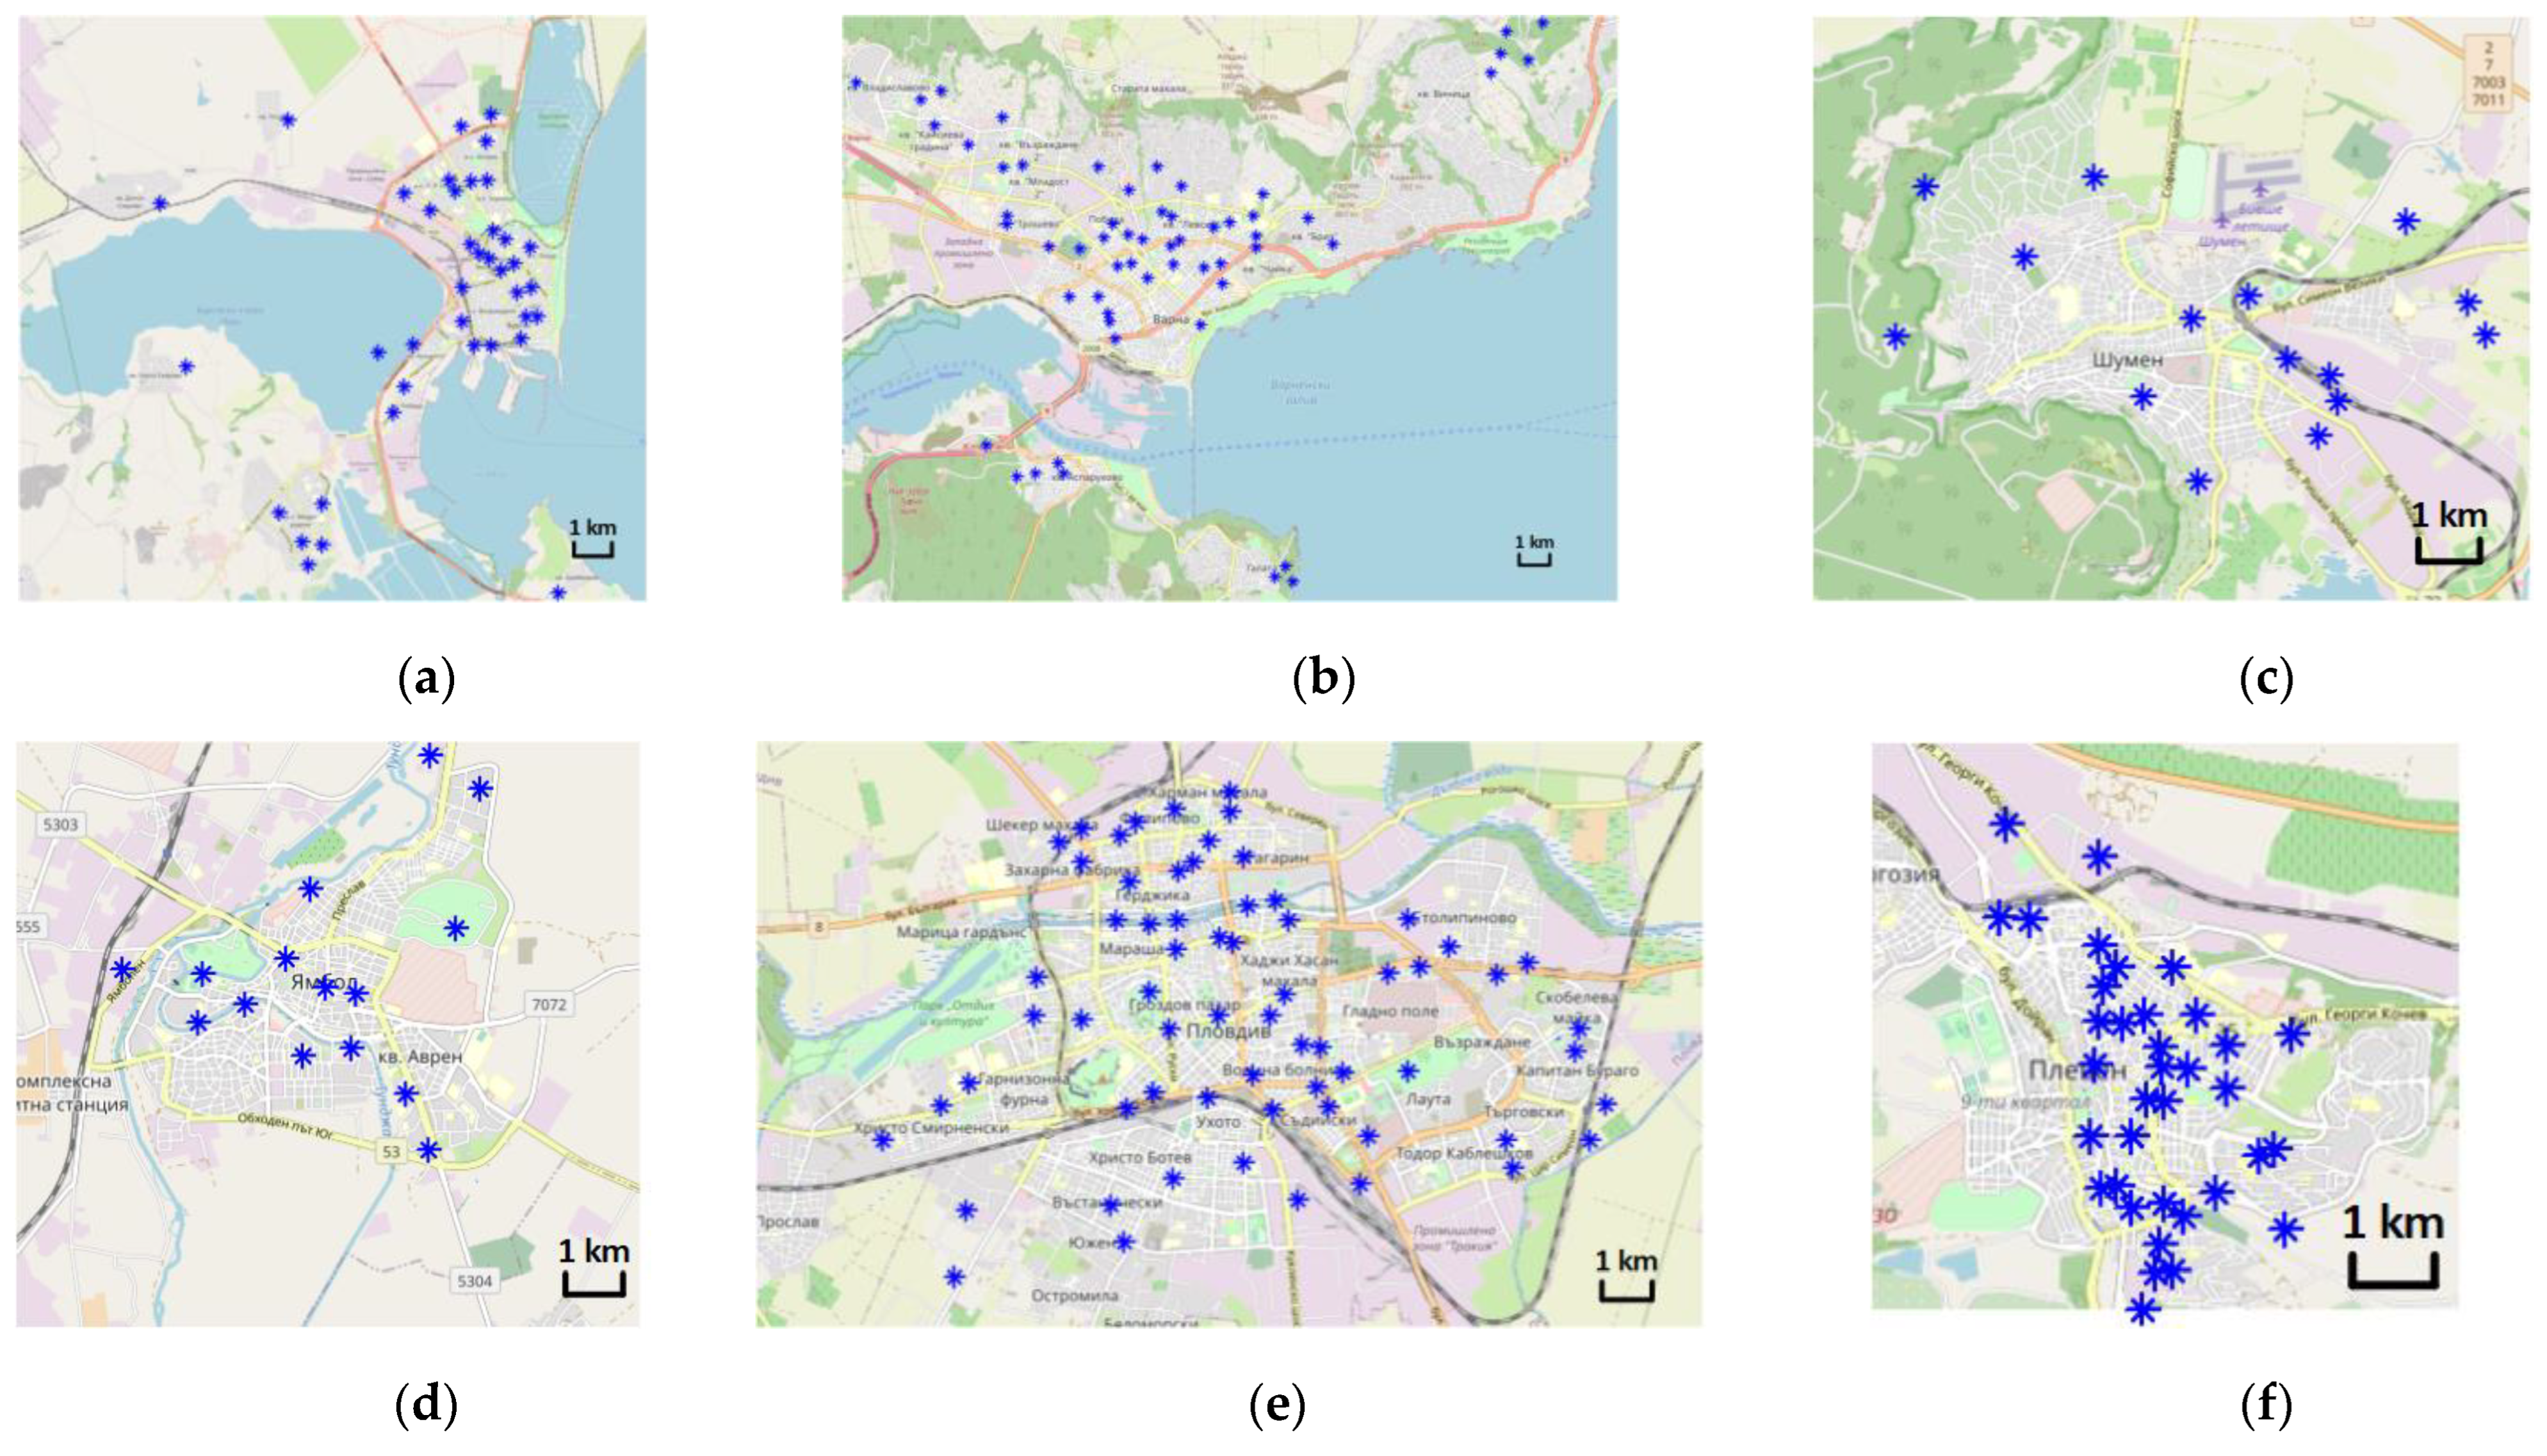
Data for six cities in the Republic of Bulgaria were used. The data for the location of the measuring points were provided by the municipal administration of the respective city. Table 2 shows data on cities with their geographical coordinates and the number of points for measuring environmental parameters. The geographical coordinates are those of the administrative building of the respective city, which is assumed to be the location of the base station in the wireless sensor network. The cities of Shumen and Yambol have the lowest number of measuring points, and the most are in the city of Plovdiv. The distances between nodes and base station were calculated by the Euclidean distance method. The maximum distance of nodes or the radius of the wireless sensor network is specified. The shortest distance is in Burgas, and the longest distances are in Varna and Plovdiv. The average distances to the nodes are indicated. The largest is for T6 (Plowdiv) and the smallest in T1 (Burgas). The number of nodes that are close to the base station is also important. Most are in T1 (9), while in other cities there are only 1. Nearby nodes communicate more often with the base station and therefore their energy consumption is higher than that of others in the network. This increases the overall consumption of the network as a whole.
Figure 1 shows maps in scale 1:75,000 and scale of 1 km of the cities in Bulgaria and the location of the measuring points (in blue). Open Street Map maps (https://www.openstreetmap.org, accessed on 1 April 2022) were used. Cities with a population of over 100,000 people were selected—Varna, Burgas, andPleven. In these cities, there are measuring networks with up to 5 points, and the other measurements were performed manually or by calculation. The smaller cities in terms of population are Shumen and Yambol. In them, the measurement of the environmental parameters was performed by manual measuring means or by calculation.
It is typical for the cities in Bulgaria to have established measuring points, regardless of the method by which the measurement data are obtained. These measurement points were used in the present work as a basis for the simulation of wireless sensor networks, with possibilities for application in IoT.
The distance for transmitting measurement data is described by the following mathematical dependence [21]:
where Pt is the transmitted power; Pr is the received power; Gt is the gain of the transmitting antenna; Gr is the gain of the receiving antenna; λ is the wavelength; d is the distance between the receiving and transmitting parties. Euclidean distance is taken into account. This model assumes that the power received is a function of the distance to transmit and receive wireless signals. When designing a WSN for a specific city, it is necessary to take into account factors such as geographical location, the presence of buildings, trees, and the capabilities of the sensor devices used.
The average energy consumption (EA) is determined on the basis of the arithmetic mean of the energies required for transmission, reception, sleep, and idle modes. It can be defined by the following formula:
where Ei is the energies required for transmission, reception, sleep, and idle modes of operation of the WSN; N is the number of reports for which this averaging is performed. In the present work, N is assumed to be 50 times as many as the number of rounds.
The consumed energy for 50 rounds is determined. During the operation of the sensor network, each sensor node periodically sends data to the base station. One round of the transmitted data represents the length of time it takes to send a unit of data (4000 bits) to the base station.
There is no description of all the functions of the used software product. Therefore, they are represented in the form y = f(x). The presented results of the work should be accepted within the described conditions and in those of the used software product.
Another factor that can increase the life of the network is the residual energy in each sensor node. It is calculated by a coefficient representing the current energy level of the individual sensor nodes. This remaining energy is calculated by the formula:
where E0 is the initial energies of each node; Em is the energies required for the operation of the nodes in the WSN.
The energy consumption of the whole network (E) through all rounds is determined.
where R is the number of rounds.
The number of received packets (Np) for all rounds is determined.
where R is the number of rounds.
Data for the LoRa Wan module operating at 868 MHz were used. The data for the base station corresponds to LoRa WAN Gateway, 868 MHz (Shenzhen Dragino technology development Co., Ltd., Shenzhen, China). Table 3 shows the main characteristics of the LoRa WAN devices.
The simulation study of the wireless sensor network was performed in the Matlab 2017 b software system (MathWorks Inc., Natick, MA, USA).
A software tool was used to evaluate the energy efficiency of wireless sensor networks [22]. The performance of the six WSNs was evaluated under the following conditions: All sensor nodes have the same initial energy (E0). The location of the nodes is in accordance with the measurement points provided in the normative documents for each city. Each node transmits/receives packets when it has enough energy to do so. Receiving packets from all nodes to the base station is considered one round.
A summary analysis of the obtained results was made with the method “Principal component analysis” (PCA) [23]. This is a method of reducing the amount of input data. The aim is to find and interpret the fundamental interdependencies between the characteristics in the data set. Features that are similar are combined and transformed into new features called principal components. Before being processed by this method, the data were normalized in the range [0, 1], depending on their minimum and maximum values.
4. Results and Discussion
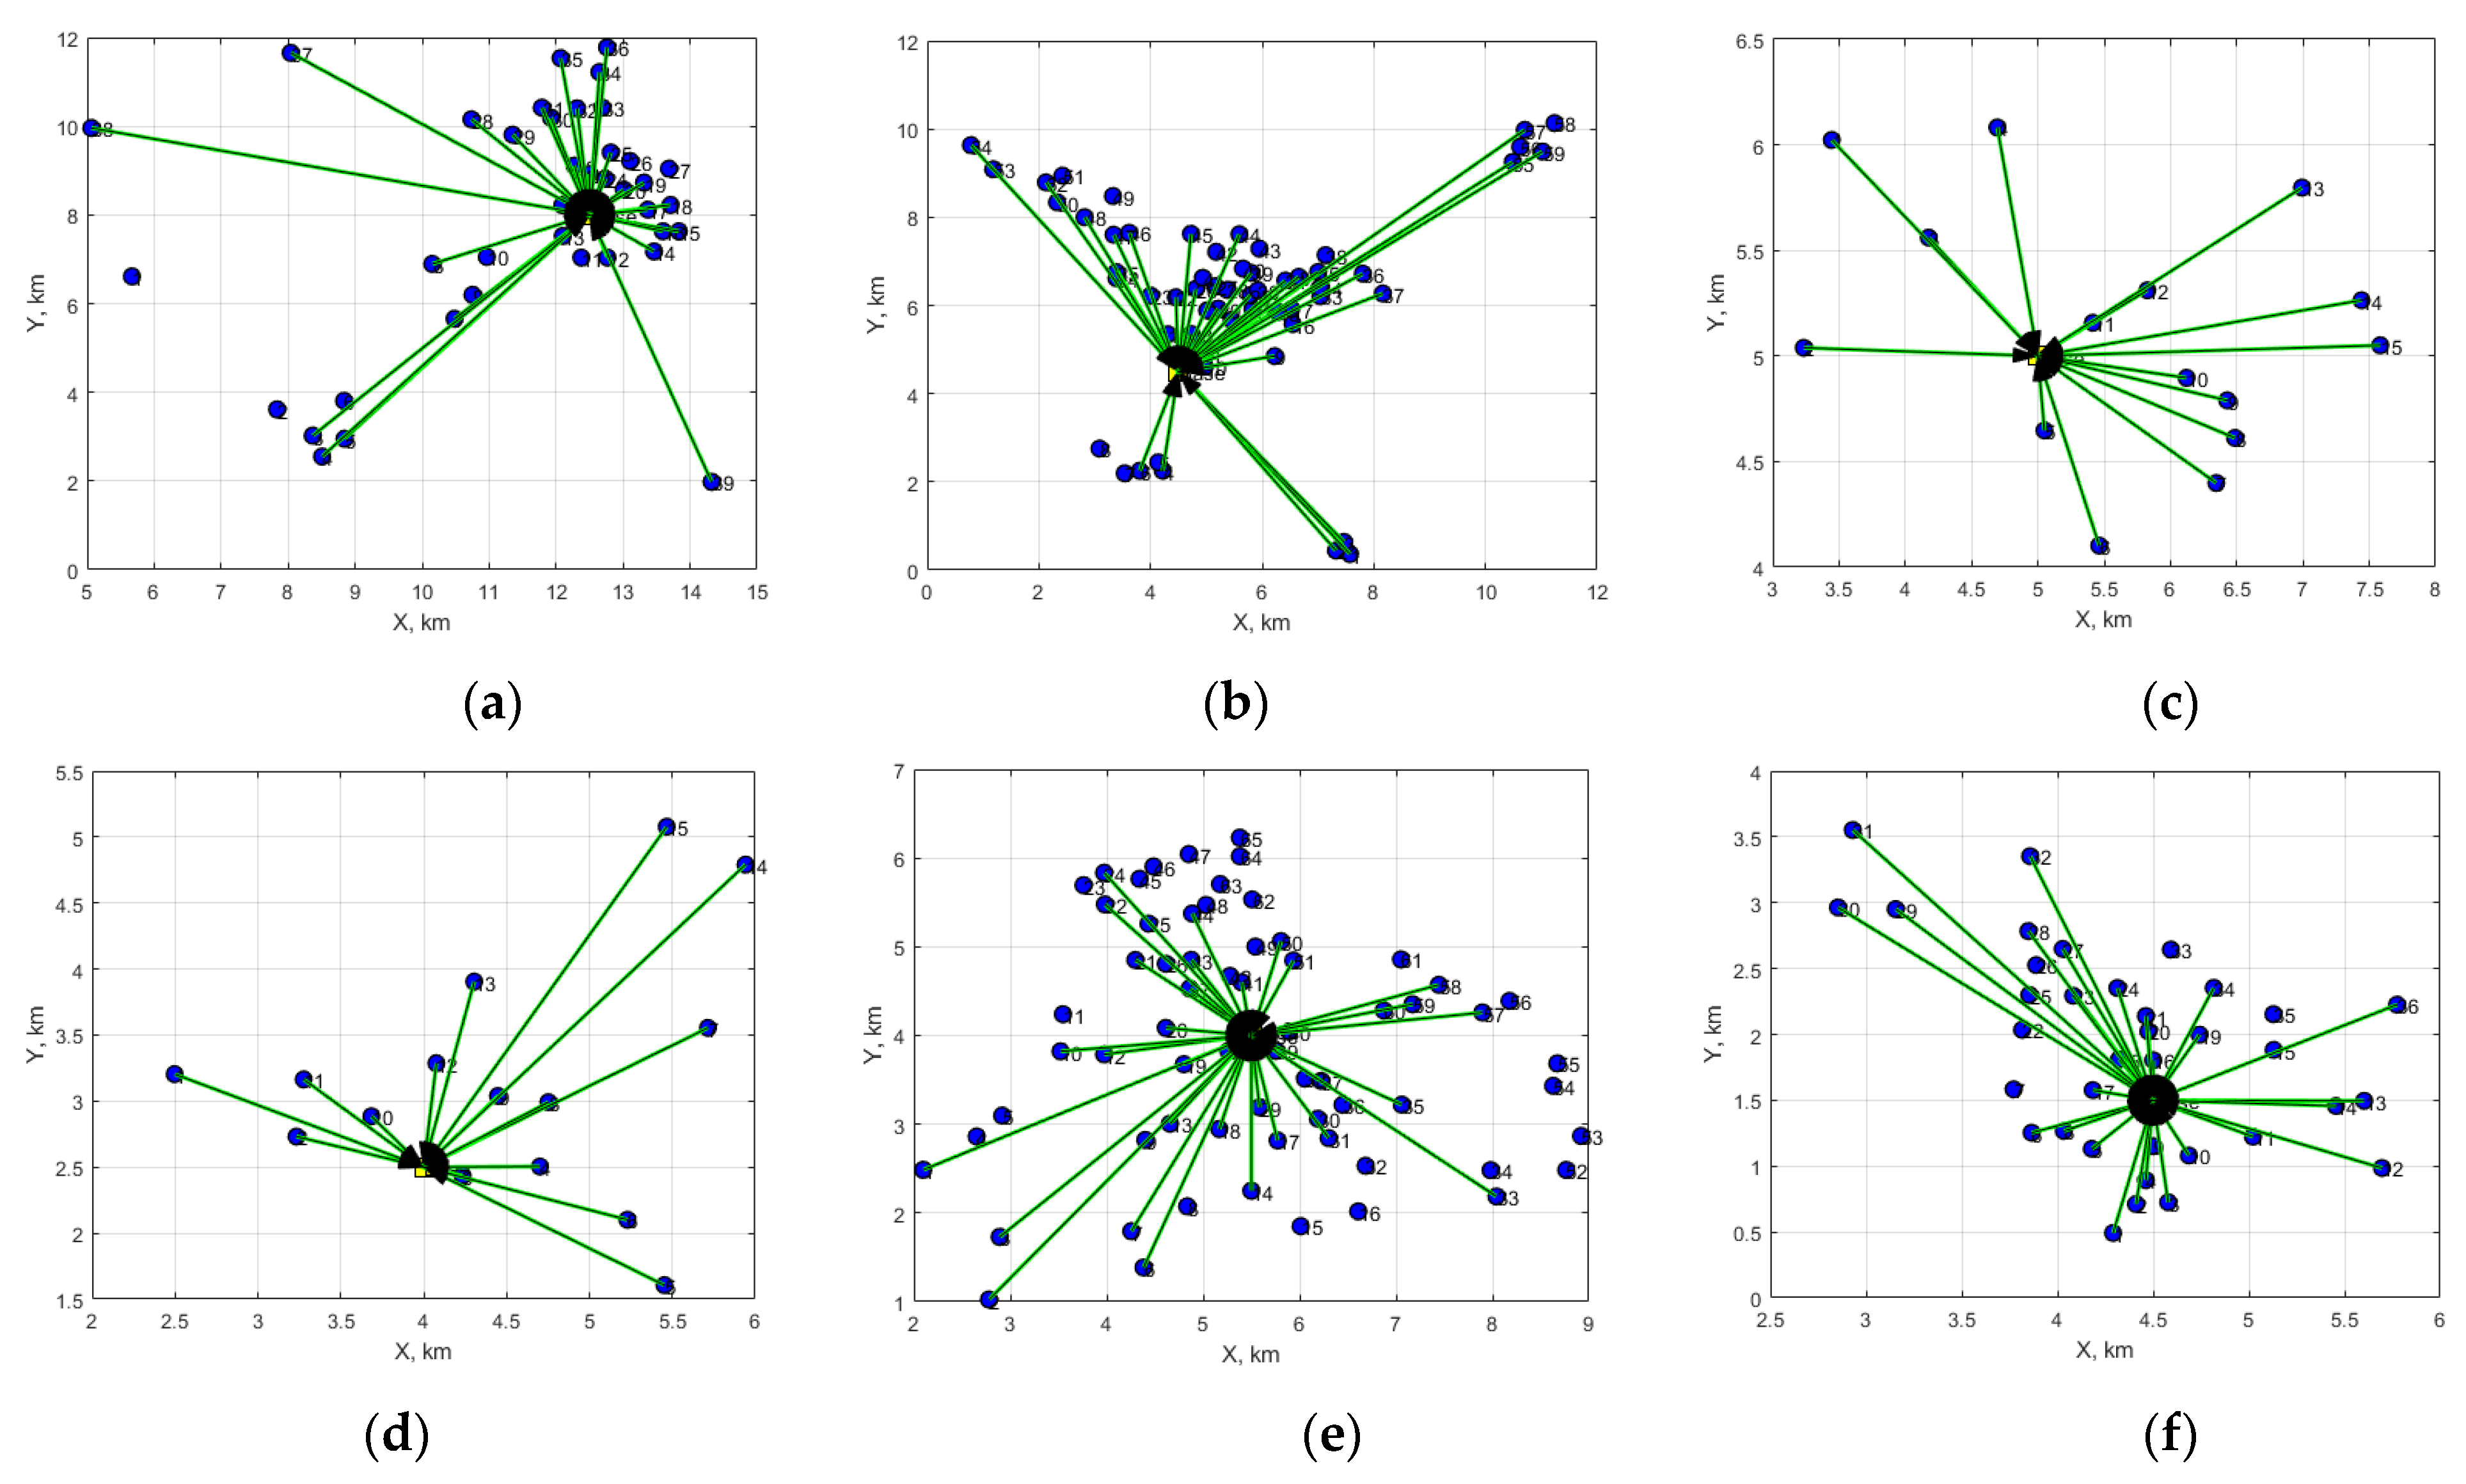
Figure 2 shows simulation diagrams of the WSN’s access to the measuring points for the six cities in Bulgaria. A star topology was used. Most nodes that are close to the base station (up to 2 km) are in cities T1, T2, T4 and T5. The nodes are presented with blue points and green lines show the two-way communication with the base station. Some of the green lines are not visualized by the used software, but there are calculations for the nodes.
Figure 3 shows a graph of maximum energy consumption in wireless sensor networks for different cities in Bulgaria. The maximum energy consumption for the entire WSN in every city is presented. The highest energy consumption is observed in the cities T1 and T3. In T1, this is due to the many nodes that are located near the base station. In T3, the characteristics of the geographical location of the sensor nodes with network communication have a significant impact and increase the energy consumption in the network. Similar conditions are observed for the T6 network. Although T2 and T5 are significantly larger cities than the others, their average energy consumption is significantly lower compared to the networks in other cities.
Joules are used as the measurement unit because Watts measure the rate of using energy, which is not useful for reporting the amount of energy that WSNs use. We must consider that Watts were used for such a long time, which would give a figure and was a convenient way to obtain measurements; however, the actual unit for an amount of consumed energy is the Coulomb, which is a small unit, so for WSN energy consumption measurement, we need of a bigger unit. That is why Joules is the preferred measurement unit in WSN.
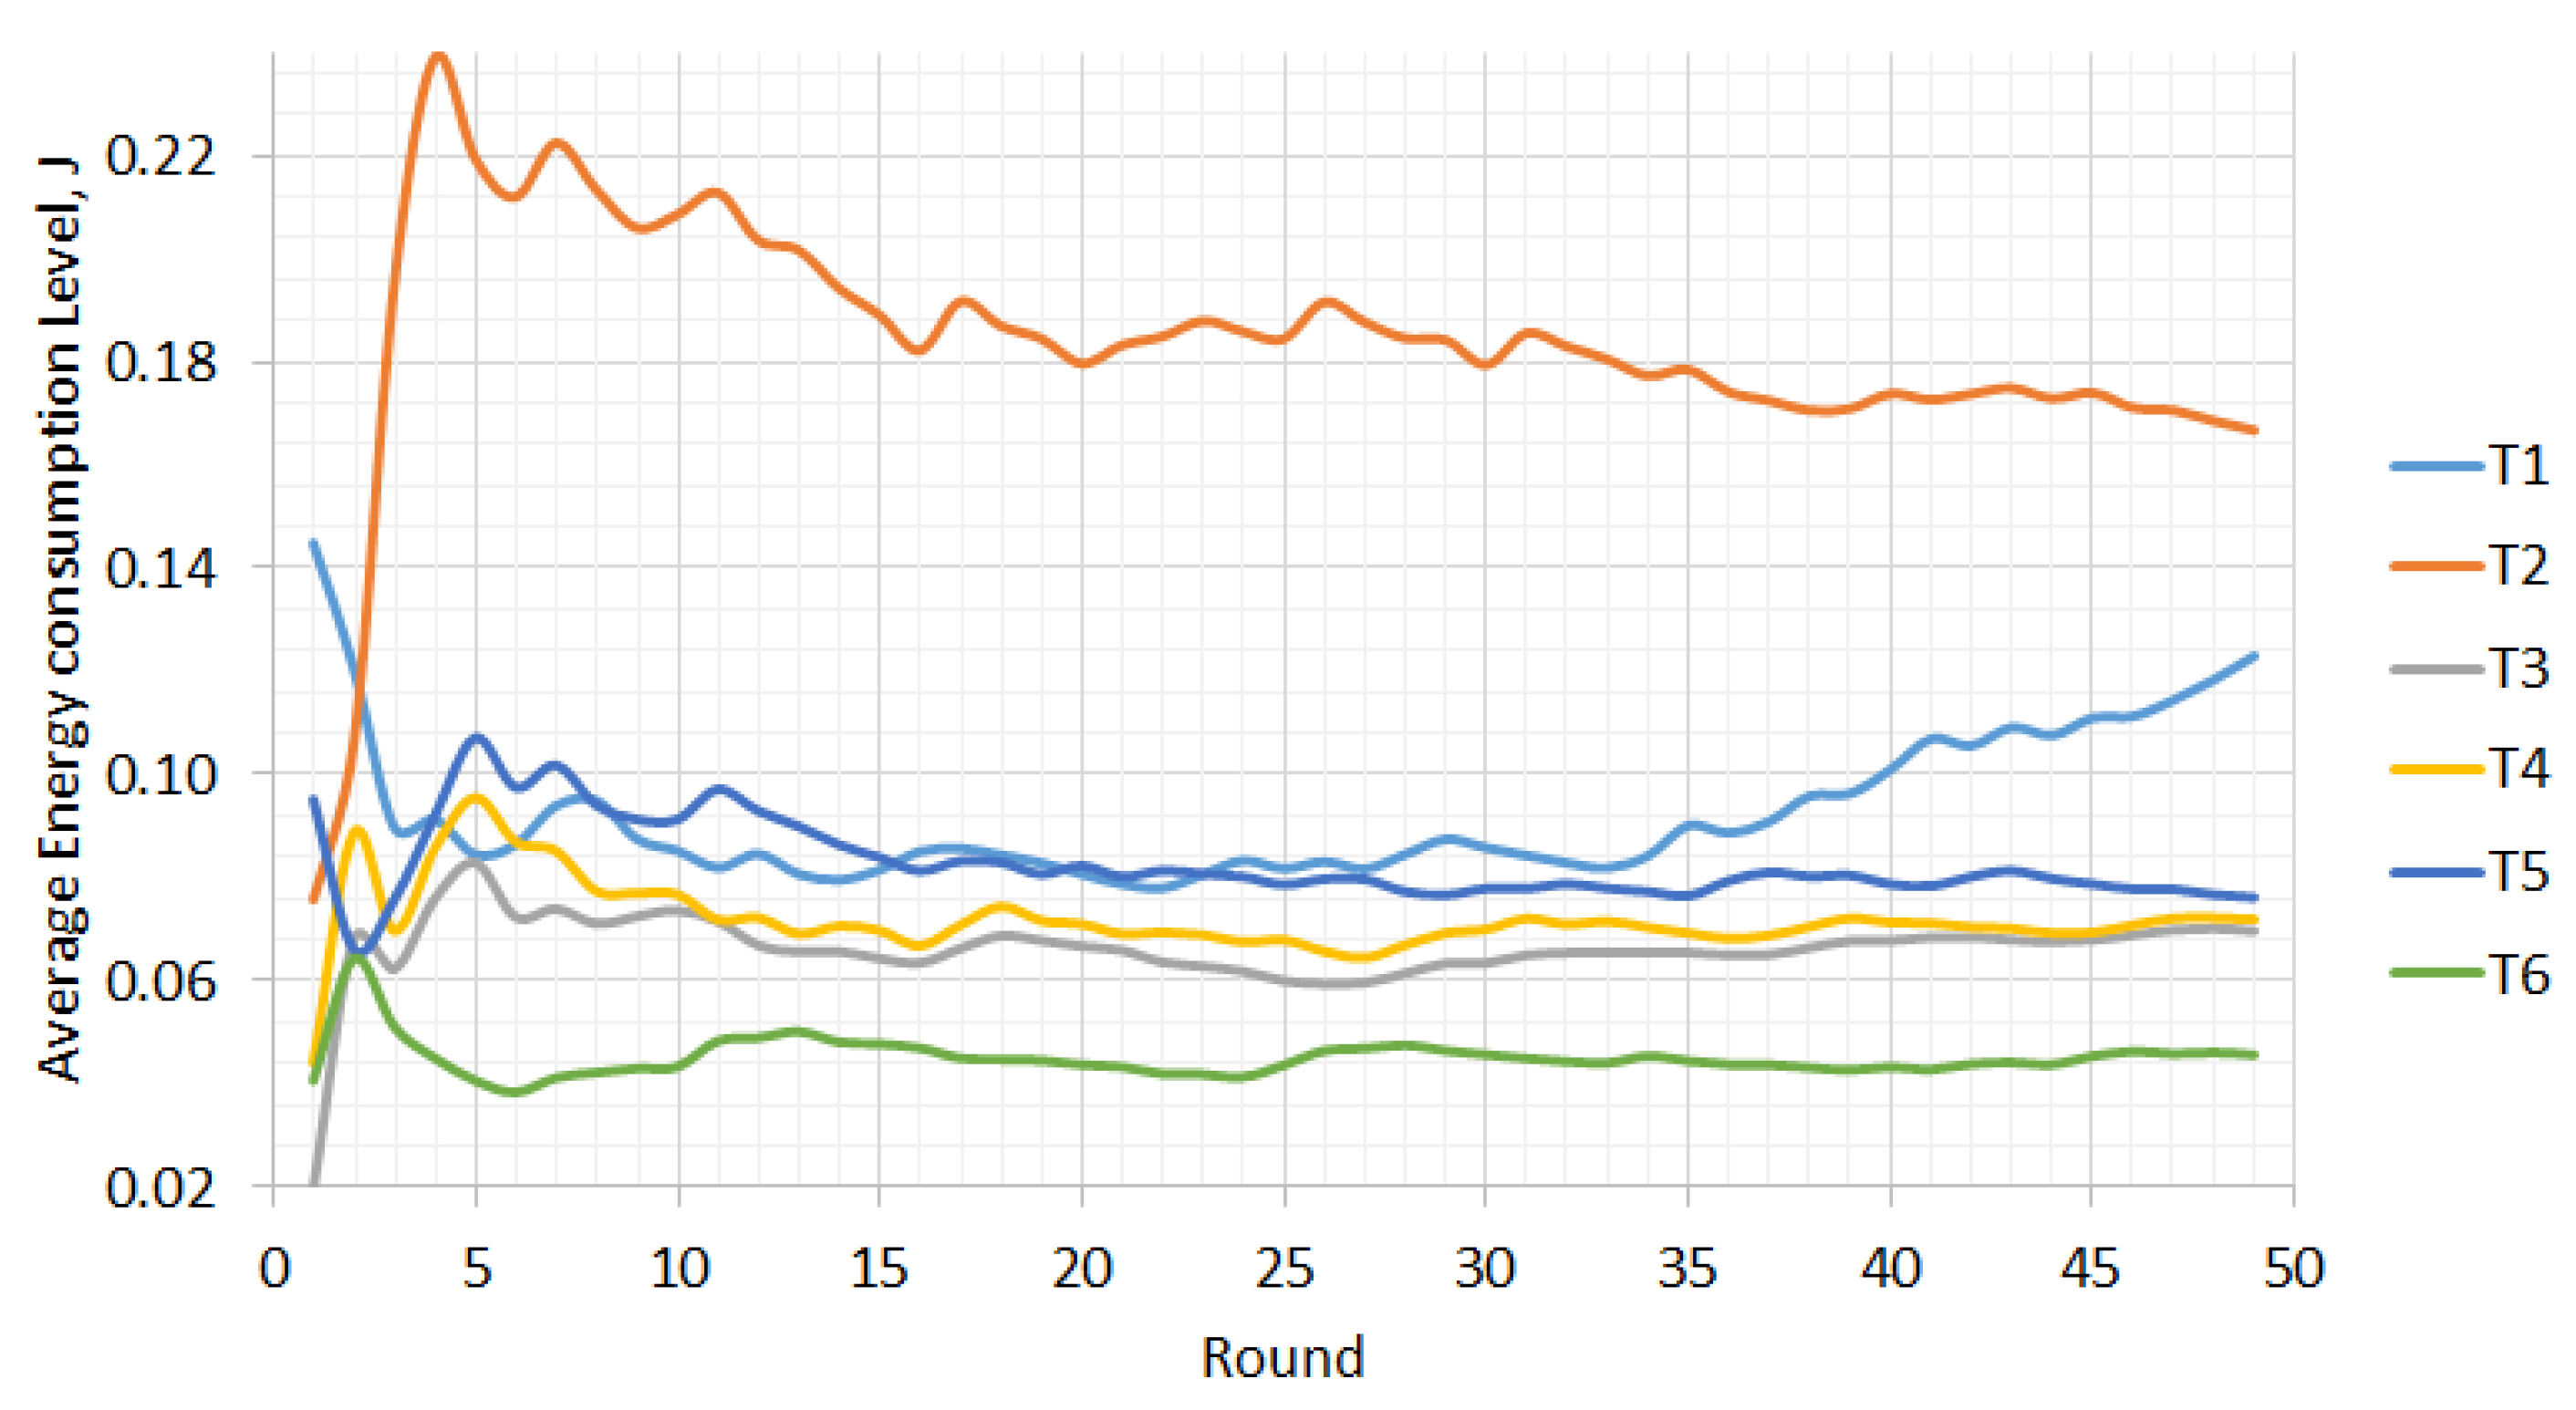
Figure 4 shows the average level of power consumption in wireless sensor networks, depending on the number of rounds. The results obtained during the continuous operation of the network show that in the city of T2, the distribution of nodes has a significant impact on average energy consumption. With T6, the lowest power consumption is observed, compared to other networks; this is because the nodes located close to the base station are significantly fewer and this generally reduces the energy consumption during the operation of the network. In other cases, for T1, T3, T4 and T5 networks, the average energy consumption is similar in value. Only in T1, due to the presence of a number of nodes near the base station, when transmitting more than 30 rounds, there is an increase in energy consumption. The nodes that are near the base station (less than 1 km) have greater energy consumption because they communicate more often with the station in comparison with other notes at greater distances.
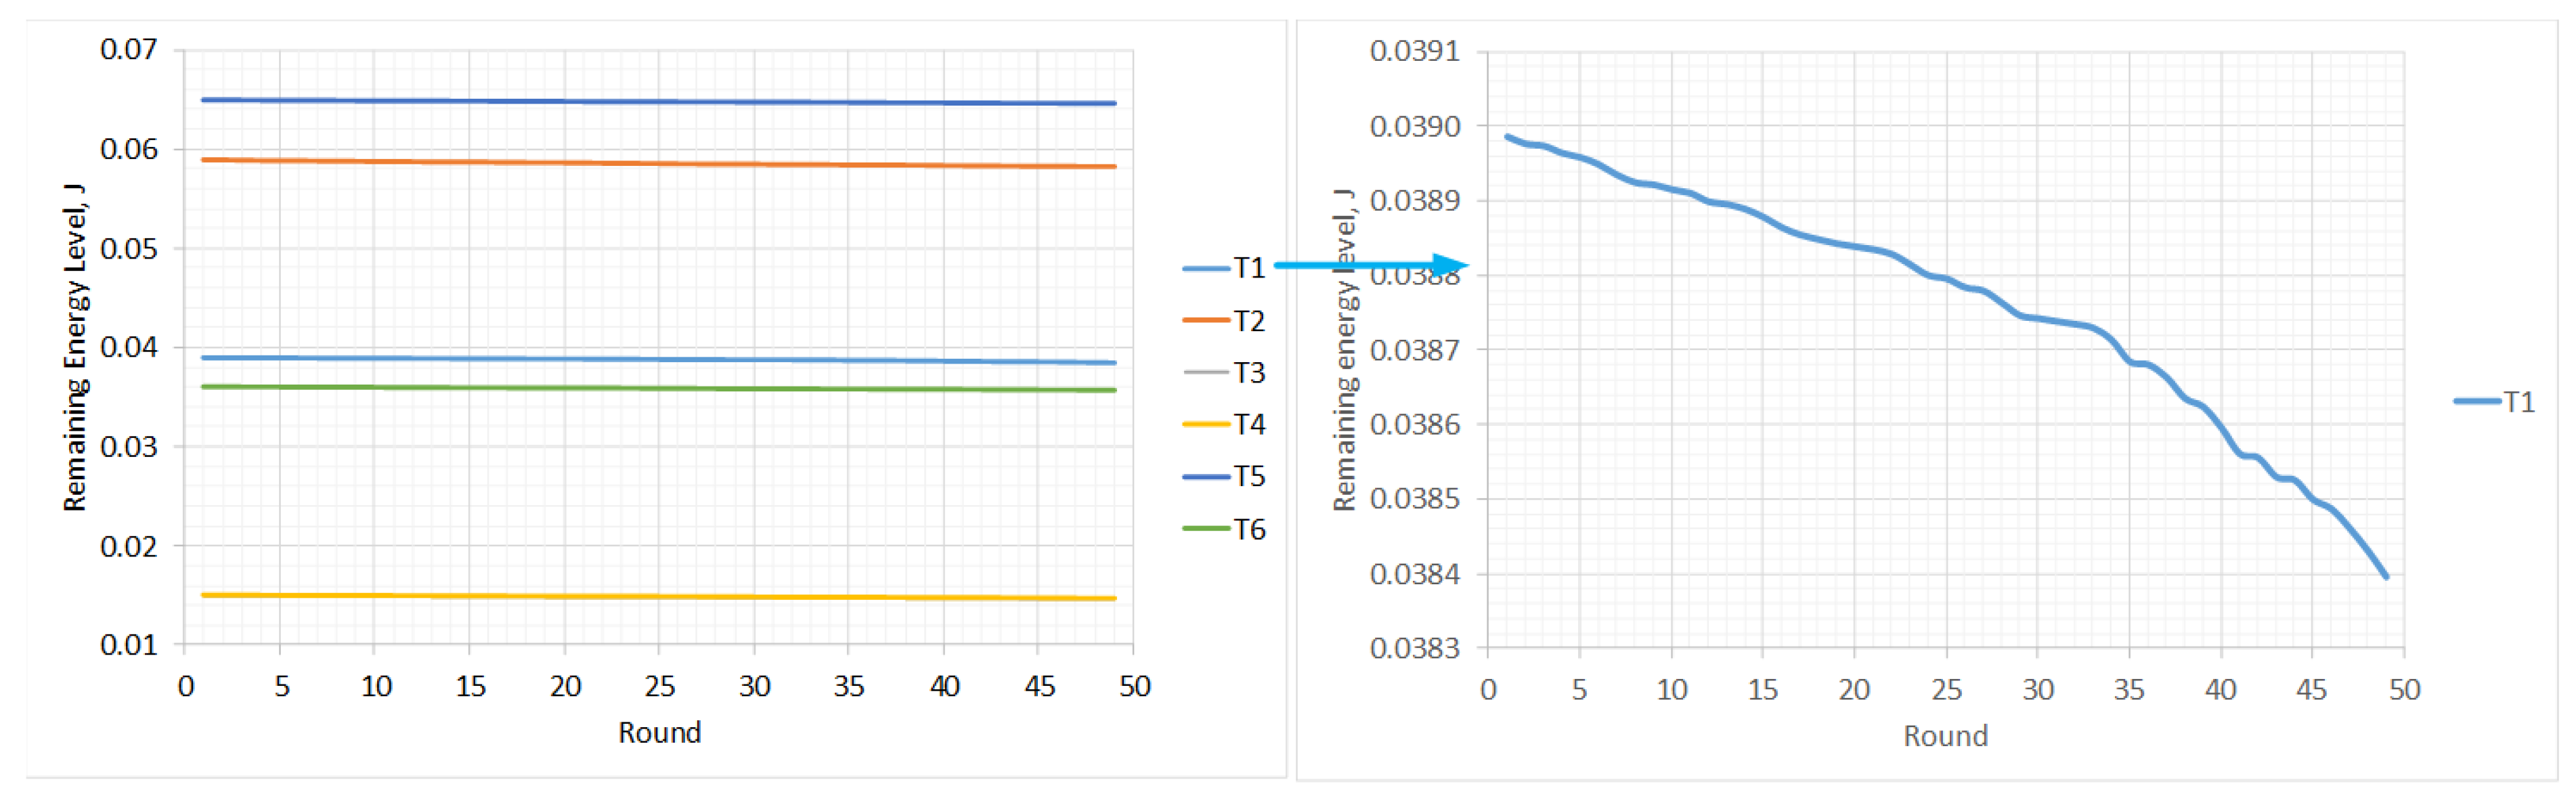
Figure 5 shows the remaining energy level in the wireless sensor networks, depending on the number of rounds. The highest levels of residual energy are observed in the T2 and T5 networks. As can be seen from the previous graphs, in these networks, the maximum and average levels of energy consumption are maintained during operation of the network. For this reason, these two networks operate more energy efficiently than the others. The lowest residual energy levels are observed in T4. Although there are fewer nodes, the distances in the city are not great (up to 4 km). This makes the location of the nodes close to the base station and therefore increases the amount of data exchanged between them. A zoomed example for T1 is given. The changes are in the range near 0.0006 J.
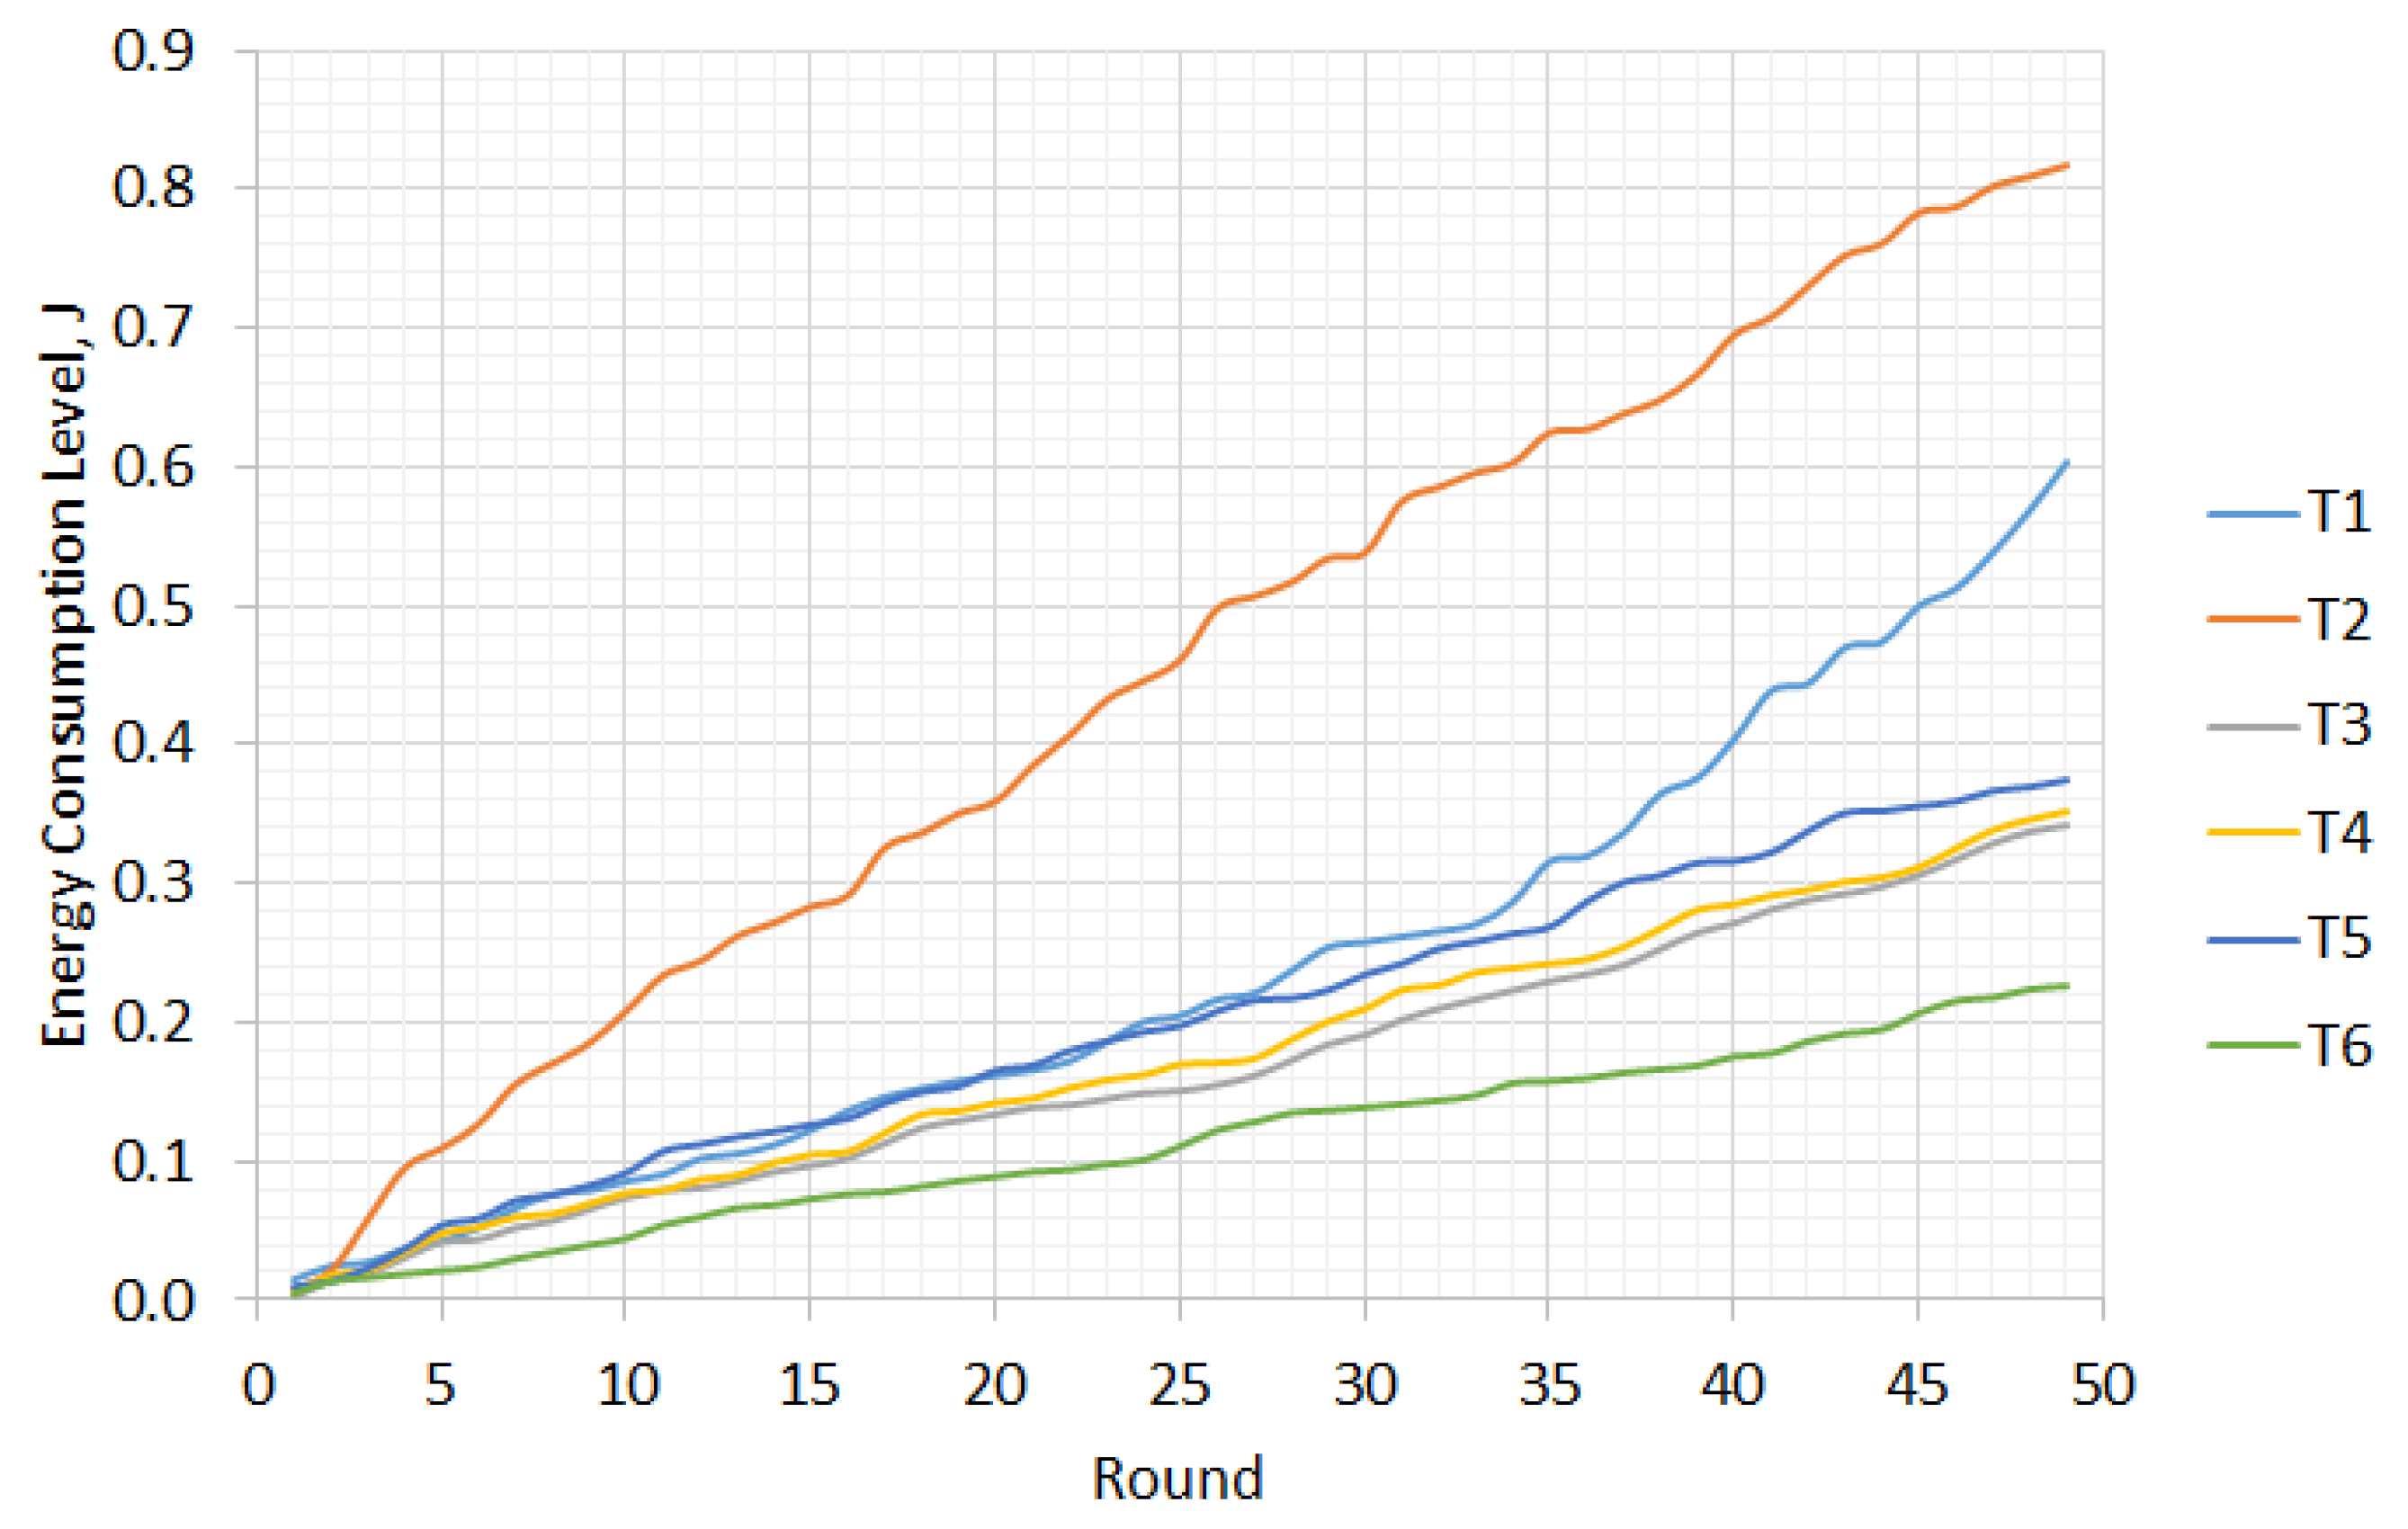
Figure 6 shows the level of power consumption in wireless sensor networks, depending on the number of rounds. The greater the number of nodes in the network, the greater the energy consumption. For example, T2 has 59 nodes and, compared to the others, has the highest values of energy consumption. Although some networks also have a large number of nodes, their energy consumption is lower due to the shorter transmission distances.
Figure 7 shows the number of packets received (Np) in the wireless sensor networks in relation to the number of rounds. As can be seen from the graph, the number of packets received increases as more rounds mean more data are transmitted to the base station. With the number of rounds, the number of received packets remains high enough. It can be seen that different plots are overlapped. The six curves are close to each other, showing that for the six WSNs, there is no clear trend showing that the number of packet losses on a long path is higher than that on a short path, otherwise the nodes should receive more packets with a smaller number of rounds.
An analysis of the principle components has been made. Table 4 shows the normed values (in the interval [0, 1]) of the WSN characteristics presented above. It can be seen that the normalized value of Np in all cases is Np = 0. This is because, as the graph shows, the six curves for this characteristic are close to each other. The number of columns is 6 and the number of rows is 5. By rows, the data can be reduced to a maximum of four principal components, and by columns to a maximum of five principal components.
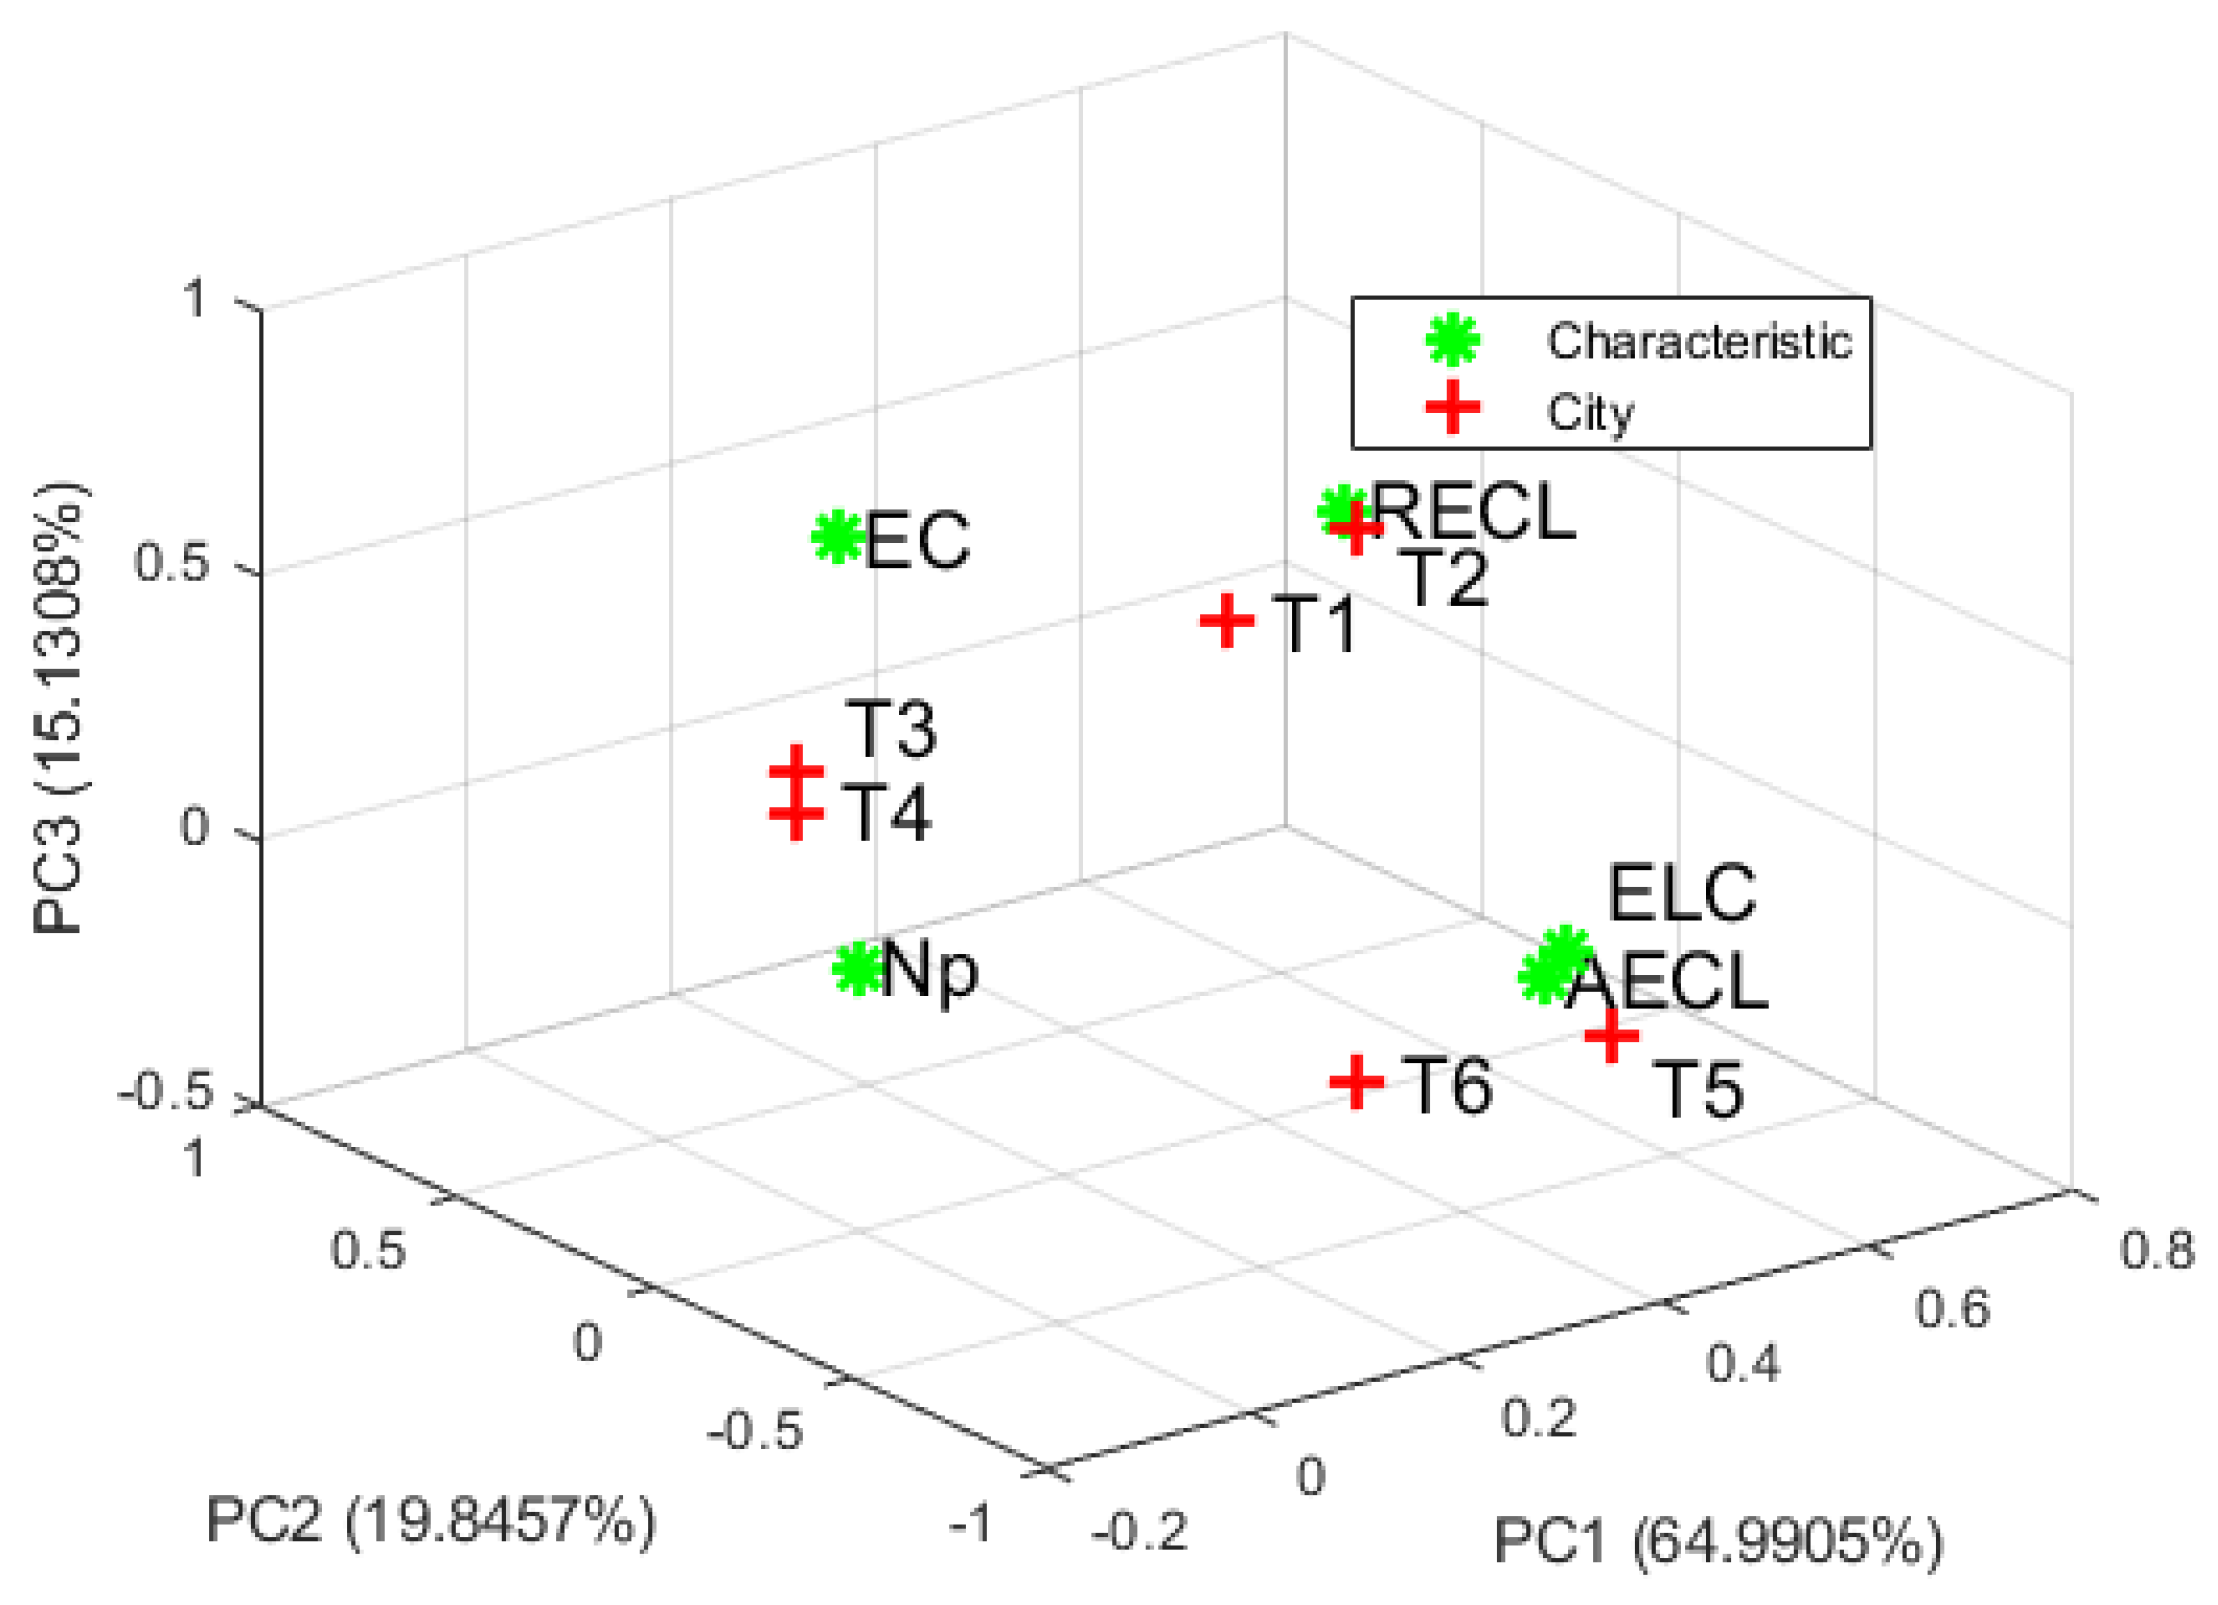
The first three principal components were chosen because they describe a variance in the data of over 95%. The results are shown in Figure 8. PCA analysis is used to show the cities, grouped by their specific WSN energy consumption parameters. There is a grouping of cities, depending on energy consumption in the WSN. The coastal cities T1 and T2 are in a common group, where the remaining energy level in the network has the highest values. The smaller cities T3 and T4 are in a common group and their total energy consumption is the best compared to other cities. Networks with approximately the same radii in cities T5 and T6 are in a common group and their average level of energy consumption has the best characteristics compared to other cities. The number of received packets remains in the center of the coordinate system, which shows that it is the same for all cities.
From the analysis of variants for wireless sensor networks for six cities in Bulgaria, it was found that at distances up to 2 km and a number of nodes over 30, higher values of energy consumption in the wireless sensor network are obtained. To reduce energy consumption, it is necessary to apply optimized routing protocols. Shah et al. [24] offer such a protocol/algorithm called distance-based dynamic duty-cycle allocation (DBDDCA). Through this protocol, nodes located at great distances from the base station transmit for shorter periods of time, which reduces the energy consumed in the network as a whole. Such a routing protocol would be appropriate in the cities of Burgas (T1) and Varna (T2), because due to the specifics of the location of cities along the coast. The distances between nodes and the base stations in T1 and T2 are greater than other cities.
Ivanov’s research [1] has been supplemented. It has been proven that the choice of communication modules and protocols for data transmission in wireless sensor networks depends on the specific conditions under which the measurement of environmental parameters will be performed. This thesis has been proven in six cities in Bulgaria. Machine Learning and Artificial Intelligence can be applied for that purpose [25]. A WSN data routing protocol is proposed by Arumugam et al. [26]. It depends on the optimal location of the base station. A limitation of this method is that multiple delays are available. Delays in data transmission are caused by a large number of operations in the algorithm. Software models [27] can be applied to make WSN more cost-effective.
5. Conclusions
As a result of the calculations and analyses of WSNs for six cities in Bulgaria, it was found that when designing WSNs, it is necessary to take into account the number of nodes, their location, and the size of the network as a whole.
It has been found that a greater number of nodes in the WSN leads to an increase in the average power consumed in the network. On the other hand, depending on the location of these nodes, the energy consumed may decrease.
The methodology proposed in the present paper for analysis of energy efficiency of WSN can be used in the design of wireless sensor networks for determining environmental parameters, with the possibility of application in IoT.
It can be stated that the proposed analyses of wireless sensor networks can be used for IoT scenarios. The use of results in IoT scenarios can be further improved. This should include the implementation of some security mechanisms for secure communication between the platform and the sensor nodes. Furthermore, the presented methods and tools can be used in the training of future specialists in the subject area.
Research can be continued with an analysis of the extent to which environmental measurement devices can be used in different mobile sensor network applications and how different types of transmitted data are affected by the location of sensor devices. It is also necessary to ensure the security of the transmission of measurement data. The performance of wireless sensor networks can be optimized by applying appropriate routing protocols, which are proposed in the available literature.
Author Contributions
Conceptualization, Z.Z. and T.G.; methodology, V.S.; software, Z.Z.; validation, A.T. and V.S.; formal analysis, T.G.; investigation, Z.Z. and A.T.; resources, Z.Z.; data curation, T.G.; writing—original draft preparation, Z.Z. and A.T.; writing—review and editing, V.S.; visualization, Z.Z.; supervision, T.G. All authors have read and agreed to the published version of the manuscript.
Funding
This research received no external funding.
Institutional Review Board Statement
Not applicable. (Original research of the authors).
Informed Consent Statement
Not applicable. (The research is not related to working with people).
Data Availability Statement
Data will be available on request.
Conflicts of Interest
The authors declare no conflict of interest.
References
- Ivanov, I. Simulation analysis of wireless sensor network for determination of environmental noise. J. Inform. Innov. Technol. (JIIT) 2022, 2, 26–30. [Google Scholar]
- Liang, R.; Zhao, L.; Wang, P. Performance Evaluations of LoRa Wireless Communication in Building Environments. Sensors 2020, 20, 3828. [Google Scholar] [CrossRef] [PubMed]
- Europen Comission. Smart Cities: Cities Using Technological Solutions to Improve the Management and Efficiency of the Urban Environment. Available online: https://ec.europa.eu/info/eu-regional-and-urban-development/topics/cities-and-urban-development/city-initiatives/smart-cities_en (accessed on 9 March 2022).
- Development of Updated Strategic Noise Maps for the Varna Agglomeration. SPECTRI. 2017. Available online: https://spectri.net (accessed on 24 April 2022). (In Bulgarian).
- Lopez-Ballester, J.; Pastor-Aparicio, A.; Felici-Castell, S.; Segura-Garcia, J.; Cobos, M. Enabling real-time computation of psycho-acoustic parameters in acoustic sensors using convolutional neural networks. IEEE Sens. J. 2020, 20, 11429–11438. [Google Scholar] [CrossRef]
- OFFNEWS. LoRa Is Already Operating in Sofia—A New Generation Network That Can Turn It into a Smart City. Available online: https://offnews.bg (accessed on 24 April 2022). (In Bulgarian).
- Saha, D.; Shinde, M.; Thadeshwar, S. IoT based air quality monitoring system using wireless sensors deployed in public bus services. In Proceedings of the Second International Conference on Internet of things, Data and Cloud Computing (ICC’17), Cambridge, UK, 22–23 March 2017; ACM: New York, NY, USA, 2017. Article 87. pp. 1–6. [Google Scholar] [CrossRef]
- Wang, T.; Zhang, Y.; Xiong, N.; Wan, S.; Shen, S.; Huang, S. An Effective Edge-Intelligent Service Placement Technology for 5G-and-Beyond Industrial IoT. IEEE Trans. Ind. Inform. 2022, 18, 4148–4157. [Google Scholar] [CrossRef]
- Baker, N. ZigBee and Bluetooth: Strengths and weaknesses for industrial applications. IEEE Comput. Control. Eng. 2005, 16, 20–25. [Google Scholar] [CrossRef]
- Lee, J.-S.; Su, Y.-W.; Shen, C.-C. A Comparative Study of Wireless Protocols: Bluetooth, UWB, ZigBee, and Wi-Fi. In Proceedings of the 33rd Annual Conference of the IEEE Industrial Electronics Society (IECON), Taipei, Taiwan, 5–8 November 2007; 8 November 2007. [Google Scholar]
- Blobel, J.; Menne, F.; Yu, D.; Cheng, X.; Dressler, F. Low-Power and Low-Delay WLAN Using Wake-Up Receivers. IEEE Trans. Mob. Comput. 2022, 21, 1739–1750. [Google Scholar] [CrossRef]
- Avila-Campos, P.; Astudillo-Salinas, F.; Vazquez-Rodas, A.; Araujo, A. Evaluation of LoRaWAN transmission range for wireless sensor networks in Riparian forests. In Proceedings of MSWiM’19, Session: LPWAN and Cellular Networks; Miami Beach, FL, USA, 25–29 November 2019, ACM digital library: New York, NY, USA, 2019; pp. 199–206. [Google Scholar]
- Aref, M.; Sikora, A. Free space range measurements with Semtech LoRa technology. In Wireless Systems within the Conferences on Intelligent Data Acquisition and Advanced Computing Systems: Technology and Applications (IDAACS-SWS), Proceedings of the 2014 2nd International Symposium on Wireless Systems within the Conferences on Intelligent Data Acquisition and Advanced Computing Systems, IDAACS-SWS, Odessa, Ukraine, 11-12 September 2014; IEEE: New York, NY, USA, 2014; pp. 19–23. [Google Scholar] [CrossRef]
- Rida, E.; Samer, L.; Melhem, E. LoRaWAN Network: Radio Propagation Models and Performance Evaluation in Various Environments in Lebanon. IEEE Internet Things J. 2019, 6, 2366–2378. [Google Scholar]
- Kim, D.-H.; Lee, E.-K.; Kim, J. Experiencing LoRa Network Establishment on a Smart Energy Campus Testbed. Sustainability 2019, 11, 1917. [Google Scholar] [CrossRef] [Green Version]
- Mikhaylov, K. On the Coverage of LPWANs: Range Evaluation and Channel Attenuation Model for LoRa Technology. In ITS Telecommunications (ITST), Proceedings of the 2015 14th International Conference, Copenhagen, Denmark, 2–4 December 2015; IEEE: New York, NY, USA, 2015; pp. 55–59. [Google Scholar]
- Lukas, W.; Tanumihardja, A.; Gunawan, E. On the application of IoT: Monitoring of troughs water level using WSN. In Proceedings of the 2015 IEEE Conference on Wireless Sensor, Melaka, Malaysia, 24–26 August 2016; IEEE: New York, NY, USA, 2016; pp. 58–62. [Google Scholar]
- Yick, J.; Mukherjee, B.; Ghosal, D. Wireless sensor network survey. Comput. Netw. 2008, 52, 2292–2330. [Google Scholar] [CrossRef]
- Fernandez-Prieto, J.-A.; Cañada-Bago, J.; Gadeo-Martos, M.-A. Wireless Acoustic Sensor Nodes for Noise Monitoring in the City of Linares (Jaén). Sensors 2020, 20, 124. [Google Scholar] [CrossRef] [PubMed] [Green Version]
- Hristov, G.; Zahariev, P.; Raychev, J.; Kinaneva, D.; Mihov, I. A methodology for environmental and air quality monitoring using LoRaWAN sensor platforms. Proc. Univ. Ruse 2018, 57, 73–82. [Google Scholar]
- LoRaWAN Part 1: How to Get 15 km Wireless and 10-Year Battery Life for IoT. Available online: https://www.digikey.com (accessed on 15 February 2022).
- WSNsimulatorMatlab. Available online: https://github.com (accessed on 15 February 2022).
- Mladenov, M. Model-based approach for assessment of freshness and safety of meat and dairy products using a simple method for hyperspectral analysis. J. Food Nutr. Res. 2020, 59, 8–119. [Google Scholar]
- Shah, I.; Maity, T.; Dohare, Y. Algorithm for energy consumption minimisation in wireless sensor network. IET Commun. 2020, 14, 1301–1310. [Google Scholar] [CrossRef]
- Brites, I.; da Silva, L.; Barbosa, J.; Rigo, S.; Correia, S.; Leithardt, V. Machine Learning and IoT Applied to Cardiovascular Diseases Identification through Heart Sounds: A Literature Review. Informatics 2021, 8, 73. [Google Scholar] [CrossRef]
- Arumugam, G. EE-LEACH: Development of energy-efficient LEACH Protocol for data gathering in WSN. EURASIP J. Wirel. Commun. Netw. 2015, 1, 1–9. [Google Scholar] [CrossRef]
- Pinheiro, E.; Correia, S. Software model for a low-cost, IoT oriented energy monitoring platform. SSRG Int. J. Comput. Sci. Eng. (SSRG-IJCSE) 2018, 5, 1–5. [Google Scholar] [CrossRef]
Figure 1.
Location of measuring points by cities in Bulgaria. (a) T1 Burgas; (b) T2 Varna; (c) T3 Shumen; (d) T4 Yambol; (e) T5 Plovdiv; (f) T6 Pleven.
Figure 1.
Location of measuring points by cities in Bulgaria. (a) T1 Burgas; (b) T2 Varna; (c) T3 Shumen; (d) T4 Yambol; (e) T5 Plovdiv; (f) T6 Pleven.

Figure 2.
Simulation schemes for cities in Bulgaria. (a) T1 Burgas; (b) T2 Varna; (c) T3 Shumen; (d) T4 Yambol; (e) T5 Plovdiv; (f) T6 Pleven.
Figure 2.
Simulation schemes for cities in Bulgaria. (a) T1 Burgas; (b) T2 Varna; (c) T3 Shumen; (d) T4 Yambol; (e) T5 Plovdiv; (f) T6 Pleven.

Figure 3.
Maximum energy consumption for WSN by cities.

Figure 4.
Average level of energy consumption for WSN by cities.

Figure 5.
Remaining energy levels for WSN by cities.

Figure 6.
Energy consumption levels for WSN by cities.

Figure 7.
Number received packets of WSN by cities.

Figure 8.
Principal component analysis of the WSN. EC-Energy consumption; RECL-Remaining energy consumption level; ECL-Energy consumption level; AECL-Average energy consumption level; Np-Number of received packets.
Figure 8.
Principal component analysis of the WSN. EC-Energy consumption; RECL-Remaining energy consumption level; ECL-Energy consumption level; AECL-Average energy consumption level; Np-Number of received packets.


Table 1.
Standards for wireless data transmission.
| Standard | Range | Topology | Frequency | Speed | Energy Consumption | Practical Implementation |
|---|---|---|---|---|---|---|
| IEEE 802.15.1 WPAN (Bluetooth) | 100 m | Star, Mesh | 2.4 GHz | 1–24 Mb/s | Low | Sensor data transfer |
| IEEE 802.15.4 LRWPAN (ZigBee) | 100 m | Star, Tree, Mesh | 2.4 GHz | 250 Kb/s | Low | Sensor data transfer |
| 2G/3G | 10 km | Star | Cellular network | 10 Mb/s | High | Mobile, Data transfer |
| 4G/5G | 10 km | Star | 5G–28 GHz; 4G-700- 2500 MHz | Up to 10 Gb/s | High | Mobile, IoT |
| Sigfox (0G) | 10 km | Star | 868–869 MHz, 902–928 MHz | Up to 0.6 Kbit/s | Medium | Sensor data transfer |
| IEEE 802.11 WLAN (WiFi) | 1.5 km | Star | 2.4, 3.6, 4.9, 5 GHz | 11 Mb/s–1 Gb/s | Medium | Mobile, Data transfer |
| LoRa | 15 km | Star | 433, 868, 915 MHz | 27 Kb/s | Very low | Sensor data transfer, IoT |
Table 2.
Data for cities in Bulgaria.
| Designation | City | Geographical Coordinates in WGS84 | Number of Nodes | Maximum Distance, km | Average Distance, km | Nodes at d ≤ 2 km | |
|---|---|---|---|---|---|---|---|
| oN | oE | ||||||
| T1 | Burgas | 42.501981 | 27.467896 | 39 | 8 | 3 | 9 |
| T2 | Varna | 43.207884 | 27.906593 | 59 | 12 | 8 | 1 |
| T3 | Shumen | 43.270546 | 26.935378 | 15 | 10 | 8 | 1 |
| T4 | Yambol | 42.484188 | 26.508795 | 15 | 11 | 9 | 1 |
| T5 | Plovdiv | 42.144543 | 24.744737 | 65 | 12 | 8 | 1 |
| T6 | Pleven | 43.408031 | 24.619381 | 36 | 11 | 10 | 1 |
Table 3.
Data on LoRa WAN devices.
| Characteristic | LoRa WAN Gateway | LoRa Wan Module |
|---|---|---|
| Max Output Power, dBm | 27 | 20 |
| Sensitivity, dBm | −140 | −148 |
| Power Input, V | 12 | 5 |
| bit rate up to, kbps | 300 | 300 |
| Transmitting power, mW | 100 | 100 |
| Antenna gain (Transmit), dBm | 168 | 168 |
| Antenna gain (Receive), dBm | 27 | 27 |
| Frequency, MHz | 868 | 868 |
Table 4.
Normed data of WSN characteristics.
| City Characteristic | T1 | T2 | T3 | T4 | T5 | T6 |
|---|---|---|---|---|---|---|
| Np | 0.00 | 0.00 | 0.00 | 0.00 | 0.00 | 0.00 |
| ECL | 0.28 | 0.75 | 0.12 | 0.14 | 0.20 | 0.00 |
| Ar | 0.37 | 0.67 | 0.00 | 0.00 | 0.77 | 0.33 |
| Ea | 0.26 | 0.75 | 0.11 | 0.14 | 0.21 | 0.00 |
| MEC | 0.60 | 0.00 | 0.20 | 0.07 | 0.00 | 0.07 |
Np—number of received packets; ECL—energy consumption level; Ar—remaining energy levels; Ea—average energy consumption; MEC—maximum energy consumption.
Publisher’s Note: MDPI stays neutral with regard to jurisdictional claims in published maps and institutional affiliations. |
© 2022 by the authors. Licensee MDPI, Basel, Switzerland. This article is an open access article distributed under the terms and conditions of the Creative Commons Attribution (CC BY) license (https://creativecommons.org/licenses/by/4.0/).
Share and Cite
MDPI and ACS Style
Zlatev, Z.; Georgieva, T.; Todorov, A.; Stoykova, V. Energy Efficiency of IoT Networks for Environmental Parameters of Bulgarian Cities. Computers 2022, 11, 81. https://0-doi-org.brum.beds.ac.uk/10.3390/computers11050081
AMA Style
Zlatev Z, Georgieva T, Todorov A, Stoykova V. Energy Efficiency of IoT Networks for Environmental Parameters of Bulgarian Cities. Computers. 2022; 11(5):81. https://0-doi-org.brum.beds.ac.uk/10.3390/computers11050081
Chicago/Turabian StyleZlatev, Zlatin, Tsvetelina Georgieva, Apostol Todorov, and Vanya Stoykova. 2022. "Energy Efficiency of IoT Networks for Environmental Parameters of Bulgarian Cities" Computers 11, no. 5: 81. https://0-doi-org.brum.beds.ac.uk/10.3390/computers11050081
Note that from the first issue of 2016, this journal uses article numbers instead of page numbers. See further details here.