Article

Functional Data Analysis for Imaging Mean Function Estimation: Computing Times and Parameter Selection

by
Juan A. Arias-López
1,2,*,
Carmen Cadarso-Suárez
1,2 and
Pablo Aguiar-Fernández
3,4
1
Biostatistics and Biomedical Data Science Unit, Department of Statistics, Mathematical Analysis, and Operational Research, Universidade de Santiago de Compostela, 15705 Santiago de Compostela, Spain
2
CITMAga, 15782 Santiago de Compostela, Spain
3
Nuclear Medicine Department and Molecular Imaging Group, University Clinical Hospital (CHUS) and Health Research Institute of Santiago de Compostela (IDIS), 15705 Santiago de Compostela, Spain
4
Molecular Imaging Group, Department of Psychiatry, Radiology and Public Health, Faculty of Medicine, Universidade de Santiago de Compostela, 15705 Santiago de Compostela, Spain
*
Author to whom correspondence should be addressed.
Submission received: 6 April 2022 / Revised: 19 May 2022 / Accepted: 25 May 2022 / Published: 2 June 2022
(This article belongs to the Special Issue Selected Papers from ICCSA 2021)

Abstract

:
In the field of medical imaging, one of the most extended research setups consists of the comparison between two groups of images, a pathological set against a control set, in order to search for statistically significant differences in brain activity. Functional Data Analysis (FDA), a relatively new field of statistics dealing with data expressed in the form of functions, uses methodologies which can be easily extended to the study of imaging data. Examples of this have been proposed in previous publications where the authors settle the mathematical groundwork and properties of the proposed estimators. The methodology herein tested allows for the estimation of mean functions and simultaneous confidence corridors (SCC), also known as simultaneous confidence bands, for imaging data and for the difference between two groups of images. FDA applied to medical imaging presents at least two advantages compared to previous methodologies: it avoids loss of information in complex data structures and avoids the multiple comparison problem arising from traditional pixel-to-pixel comparisons. Nonetheless, computing times for this technique have only been explored in reduced and simulated setups. In the present article, we apply this procedure to a practical case with data extracted from open neuroimaging databases; then, we measure computing times for the construction of Delaunay triangulations and for the computation of mean function and SCC for one-group and two-group approaches. The results suggest that the previous researcher has been too conservative in parameter selection and that computing times for this methodology are reasonable, confirming that this method should be further studied and applied to the field of medical imaging.

1. Introduction

1.1. Functional Data Analysis

The field of statistics involved in the mathematical development of tools for the analysis of data in the form of functions is known as Functional Data Analysis (FDA). From an FDA scope, the minimum unit of data to be analyzed is not one data point itself but rather a function which, usually, corresponds to a single participant in a biomedical study or, in more complex scenarios, a series of functions assigned to each of the participants.
The area of FDA is still underdeveloped and much research with new applications appears every year in scientific journals. However, although a strict definition of the field is not established—nor appears desirable—there are a series of characteristics which appear to be inherent to functional data and which can be helpful to understand the methods and objectives within the scope of this field. First, functional data are continuously defined and, as such, single instances of functional data are considered mostly irrelevant and just as realizations of the underlying function with is the main object of analysis. This is a necessary constraint established in order to work with this data using the computational tools available. Second, the basic element of the analytical process performed in FDA is the whole function itself, and not the individual data elements of which it is composed. Finally, functional data usually appears associated to some sort of temporal variable and it is also assumed to have some regularity conditions [1].
Taken together, functional data usually consist of a sample of independent functions with values which are located in a compact and predefined grid or interval (I) and are, in most of the cases, assumed to exist in a Hilbert space ( L 2 ):
X 1 ( t ) , X 2 ( t ) , , X n ( t ) ; I = [ 0 , T ] L 2
In the last years, FDA has gained momentum evidenced by a rise in popularity in several applied research areas and the publication of multiple works including monographs [1] and review articles [2]. Now that this knowledge is available to the public and FDA’s theoretical basis and applications are beginning to be established, researchers are starting to consider the use of FDA tools for extended setups such as its application in the field of medical imaging.

1.2. Applicability of FDA to Imaging Data

In the context of biomedicine, there is great interest in medical imaging data such as the ones obtained from brain scanners: images of tumor tissues, among others [1]. Nevertheless, smoothing methods proposed in the scientific literature to date which are focused on imaging data (e.g., kernel smoothing, tensor product smoothing …) suffer from a severe problem of leakage for high-complexity data structures (i.e., poor estimation in difficult regions as a result of inappropriate smoothing on boundary regions), showing difficulties which result in inappropriate smoothing.
In addition, there are other problems aside from estimations of the value for a single point when analyzing medical imaging data with traditional methods. Another problem arises for the estimation of the associated uncertainty of that estimation (i.e., its confidence band)—a problem which becomes even more complicated when considered that also the spatial correlation has to be taken into account. So far, the predominant techniques for mean imaging data estimation and also for the computation of associated uncertainty have been the methodologies termed as mass univariate approaches. From this mass univariate approach, every pixel in an image is considered as independent; then, a pixel-to-pixel comparison is performed with classical methods such as t-tests. The associated multiple comparison problem is then solved applying popular approaches such as the Bonferroni correction or the application of random field theory [3], which are ad hoc corrections very dependent on the chosen threshold.
These problems associated with classical methods for mean estimation are avoided by the FDA technique proposed by Wang et al. [4]. In this article, the authors propose a way to avoid the problem of leakage on complex data structures using bivariate splines over Delaunay triangulations (see Section 2.2). In the same article, the authors prove that spline functions defined over a basis of Delaunay triangulations offer more flexibility and a varying amount of smoothness, which would allow for a better approximation of the underlying mean function. They study the asymptotic properties of the spline estimators using bivariate penalized splines and derive SCCs by means of the extreme value theory of Gaussian processes. The result is the approximation of mean functions with bivariate splines using, in this case, the BPST package for R [5]. The result is the preservation of the most complex and important details of imaging data structures.
The proposed methodology considers imaging data as an instance of functional data which is continuously defined (as explained in Section 1.1) but observed on a regularly defined grid. Given that the imaging data are treated as functional data, attention naturally moves from the pixel as the minimal analytic unit to the analysis of images as a whole. This allows not only for the calculation of the mean function of a group of images but also for the estimation of simultaneous confidence corridors (SCC; also known as simultaneous confidence bands), an approach which has been proven superior to conventional multiple comparison approaches [6]. Furthermore, Wang et al. [4] also describe the proposed bivariate spline estimators, test their asymptotic properties, describe the attributes of SCC based on these estimators, and extract coverage probability for the obtained mean function. The conclusion of the article is that the proposed SCC methodology accounts for the correct probability coverage both in one-group and two-group comparison setups.
However, although the proposed methodology accounts for the correct probability coverage, the computational resources necessary for its application are not addressed by the authors, and thus, its utility for a practical case is yet to be fully understood. Previous research [7] has tested this methodology in limited setups, concluding not only that the parameters proposed by the authors were too conservative but also that the amount of time to obtain results was in the tolerable range for modern computational capabilities. This suggests that moving toward a FDA setup in studies comparing groups of medical images might be a sensible thing to do; however, this study tested the herein studied FDA methodology with simulated data which was not very complex in its structure and was also estimated with predefined parameters. For these reasons, there is a necessity for testing the computing times of this method in a practical case with real imaging data and a higher number of patients.

1.3. Objectives

Given that the computational costs for this methodology are not fully explored and that the only available results—although promising—were only applied to simulated data [7], this article’s objective consists on testing the practical utility of this novel FDA methodology by studying the computational efforts necessary to implement it for a practical case with data obtained from open brain imaging databases transformed and normalized in order to assign bi-dimensional surfaces—slices of brain imaging data—to an FDA setup in which each slice corresponds to one function. This analysis is performed by evaluating computing times for the calculation of the polygonal domain of the Delaunay triangulations necessary to carry out this method and also evaluating computing times for the calculation of mean functions of a group of images (one-group setup) and for the comparison between two groups in order to highlight areas with differences in brain activity (two-group setup).

2. Materials and Methods

2.1. Imaging Data

There are different approaches to brain imaging, resulting in data with differential peculiarities. For this case, 18F-FDG Positron Emission Tomography (PET) data was chosen given its reliability [8] and extended use in clinical neuroscience. In this imaging technique, Fluorodeoxyglucose (18F-FDG), a radioisotope analogue of glucose, is used as a tracer to monitor brain metabolic rates. Positron emission rates by molecules of 18F-FDG trapped in brain tissues are used as an indirect measure of glucose consumption, which is then reconstructed producing 3D images for the position of this tracer in the brain.
Data were drawn from the Alzheimer’s Disease Neuroimaging Initiative [9], selecting 18F-FDG PET data for a control group (75 patients; 44 male; age: 75.56 ± 4.96 years) and a Alzheimer’s Disease (AD) group (51 patients; 30 male; age: 74.03 ± 7.25 years) summing 126 participants. A critical step in any neuroimaging study is the existence of a precise point-to-point correspondence when comparing scans from brains that present unique shape and size. For this reason, the entire dataset was pre-processed following a standard workflow for Statistical Parametric Mapping (SPM) software [10] in order to guarantee pixel-to-pixel correspondence before the application of the examined technique.
This process consisted of the realignment of brain images according to a fixed and predefined axis, unwrapping in order to correct deformations derived from subjects’ changes in position, co-registration with MRI data which provides the anatomical substratum for PET activity data, normalization in order to fit brain images into an idealized brain shape, mean proportional escalation in order to compensate mean brain activity levels between patients, and finally, a masking process in order to remove data which is assumed to fall outside brain boundaries. As a result, the data used for this study are treated following standard procedures for brain imaging research and have guaranteed pixel-to-pixel comparability between patients from different groups and also among the same group.

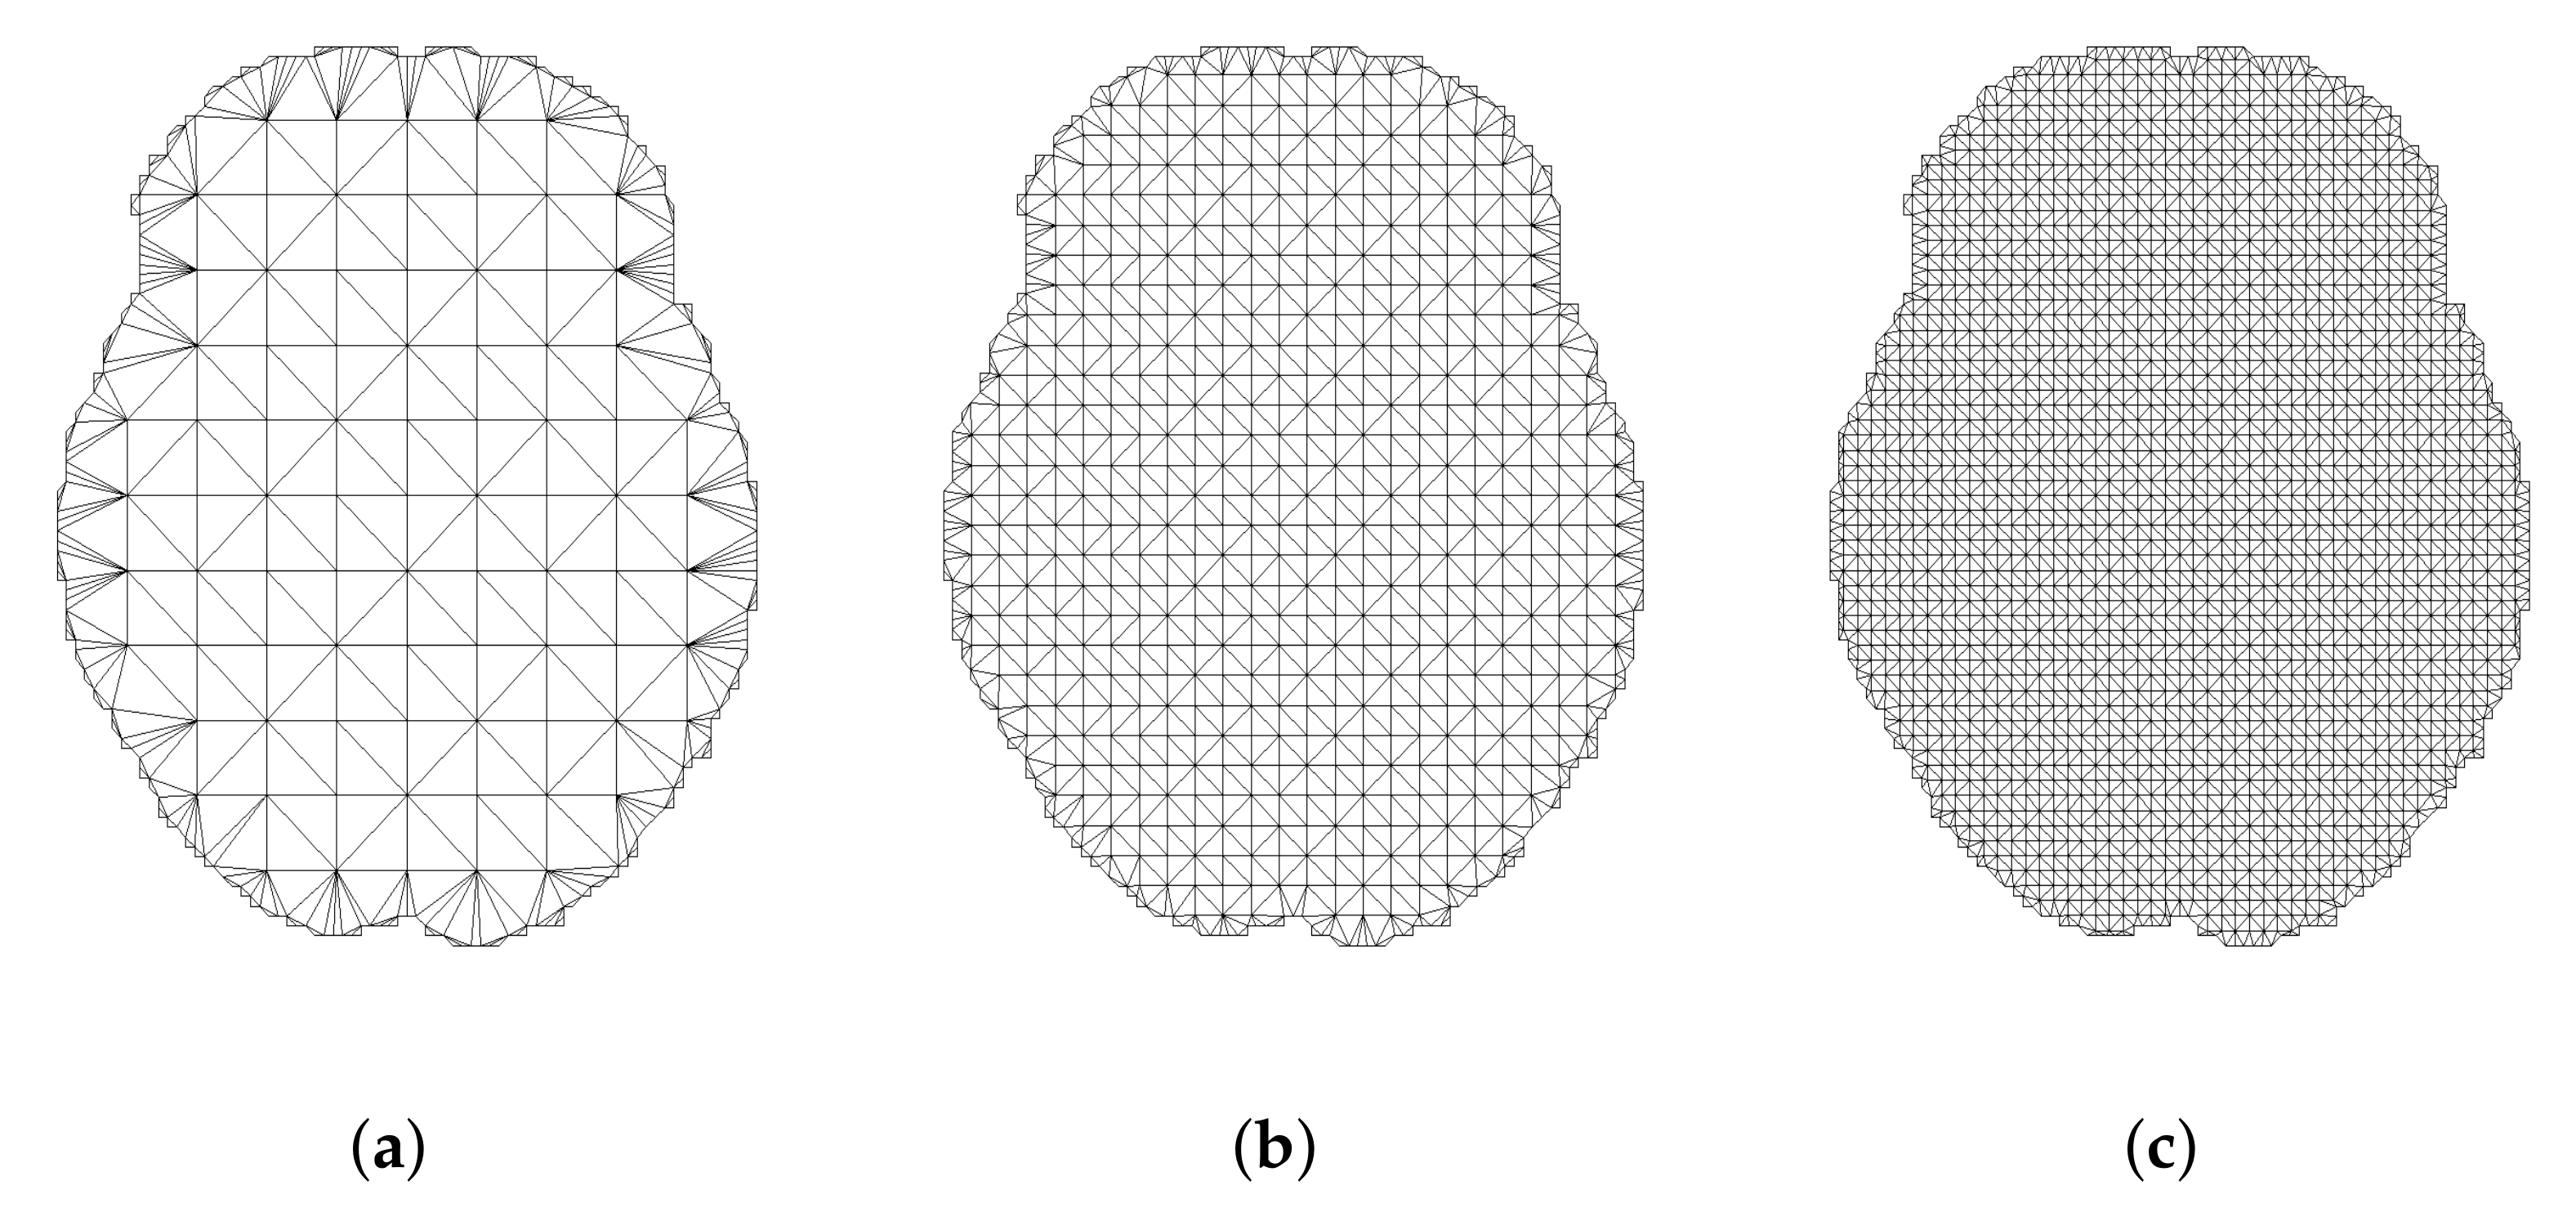
2.2. Delaunay Triangulations

Delaunay triangulations consist of multiple triangles created by the union of vertices in which no vertices falls inside the circumcircle of a given triangle. The FDA approach herein examined uses bivariate splines over a pre-existing grid of these triangulations specifically designed for the shape of the objective image to analyze. This approach reduces the loss of information in boundary regions and thus enhances the obtained results’ accuracy. In order to calculate these triangulations, the Triangulation R package [11] was applied on a slice of brain imaging data to test its computing costs for growing values of the triangulation fineness degree.
The imaging data used in order to obtain this triangulation basis are the PET data from previous sections, which was already pre-processed as per Section 2.1. As a result, a realistic triangulation grid was obtained, and as such, estimations were performed with specific parameters for this study and the particular structure of the available data. An example of these triangulations for a practical case can be seen in Figure 1, and computing times for growing values of fineness are analyzed in Section 3.1.

2.3. Mean Function and SCC for One-Group Setup

The proposed FDA methodology allows for two different calculations: the estimation of a group of images’ mean function and its associated SCC in the form of images, and the comparison between two groups of images in order to obtain the mean function for the difference between groups. These processes are possible only after a process of normalization which ensures pixel-to-pixel comparability between groups of images as described in Section 2.1. In this subsection, one-group mean functions are computed for a group of images together with its associated SCC for a given alpha (threshold for statistical significance) value with the help of functions implemented in ImageSCC R package [12]. Examples of the results obtained using this methodology can be found in Figure 2. Computing times for different triangulation fineness degrees are analyzed in Section 3.2.

2.4. Mean Function and SCC for Two-Group Setup

This technique can be extended to a two-sample setup in which the mean function for the difference between groups of images is obtained together with their SCC. Again, these groups of images are only comparable after a pre-processing workflow has been carried out, including a series of transformations, changes in scale, and normalization of brain activity data. In this example, two sets of images (control and pathological) are compared in the search for significant differences in brain activity. Using these sources of brain imaging data, it is possible to calculate which regions of the image present activity patterns falling outside expected values, suggesting a significant difference in activity for that region in one group compared to another. Results can be found in Figure 3 and computing times are analyzed in Section 3.3.

3. Results

In this section, the obtained results are summarized for the methodologies described in Section 2.2, Section 2.3 and Section 2.4 when applied to real neuroimaging data (see Section 2.1) using Delaunay triangulations with a growing degree of fineness (i.e., a growing number of points used for the triangulation), which seems to be the main tuning parameter for these approaches, as they indicate the degree of complexity for the grid upon which the data are analyzed.

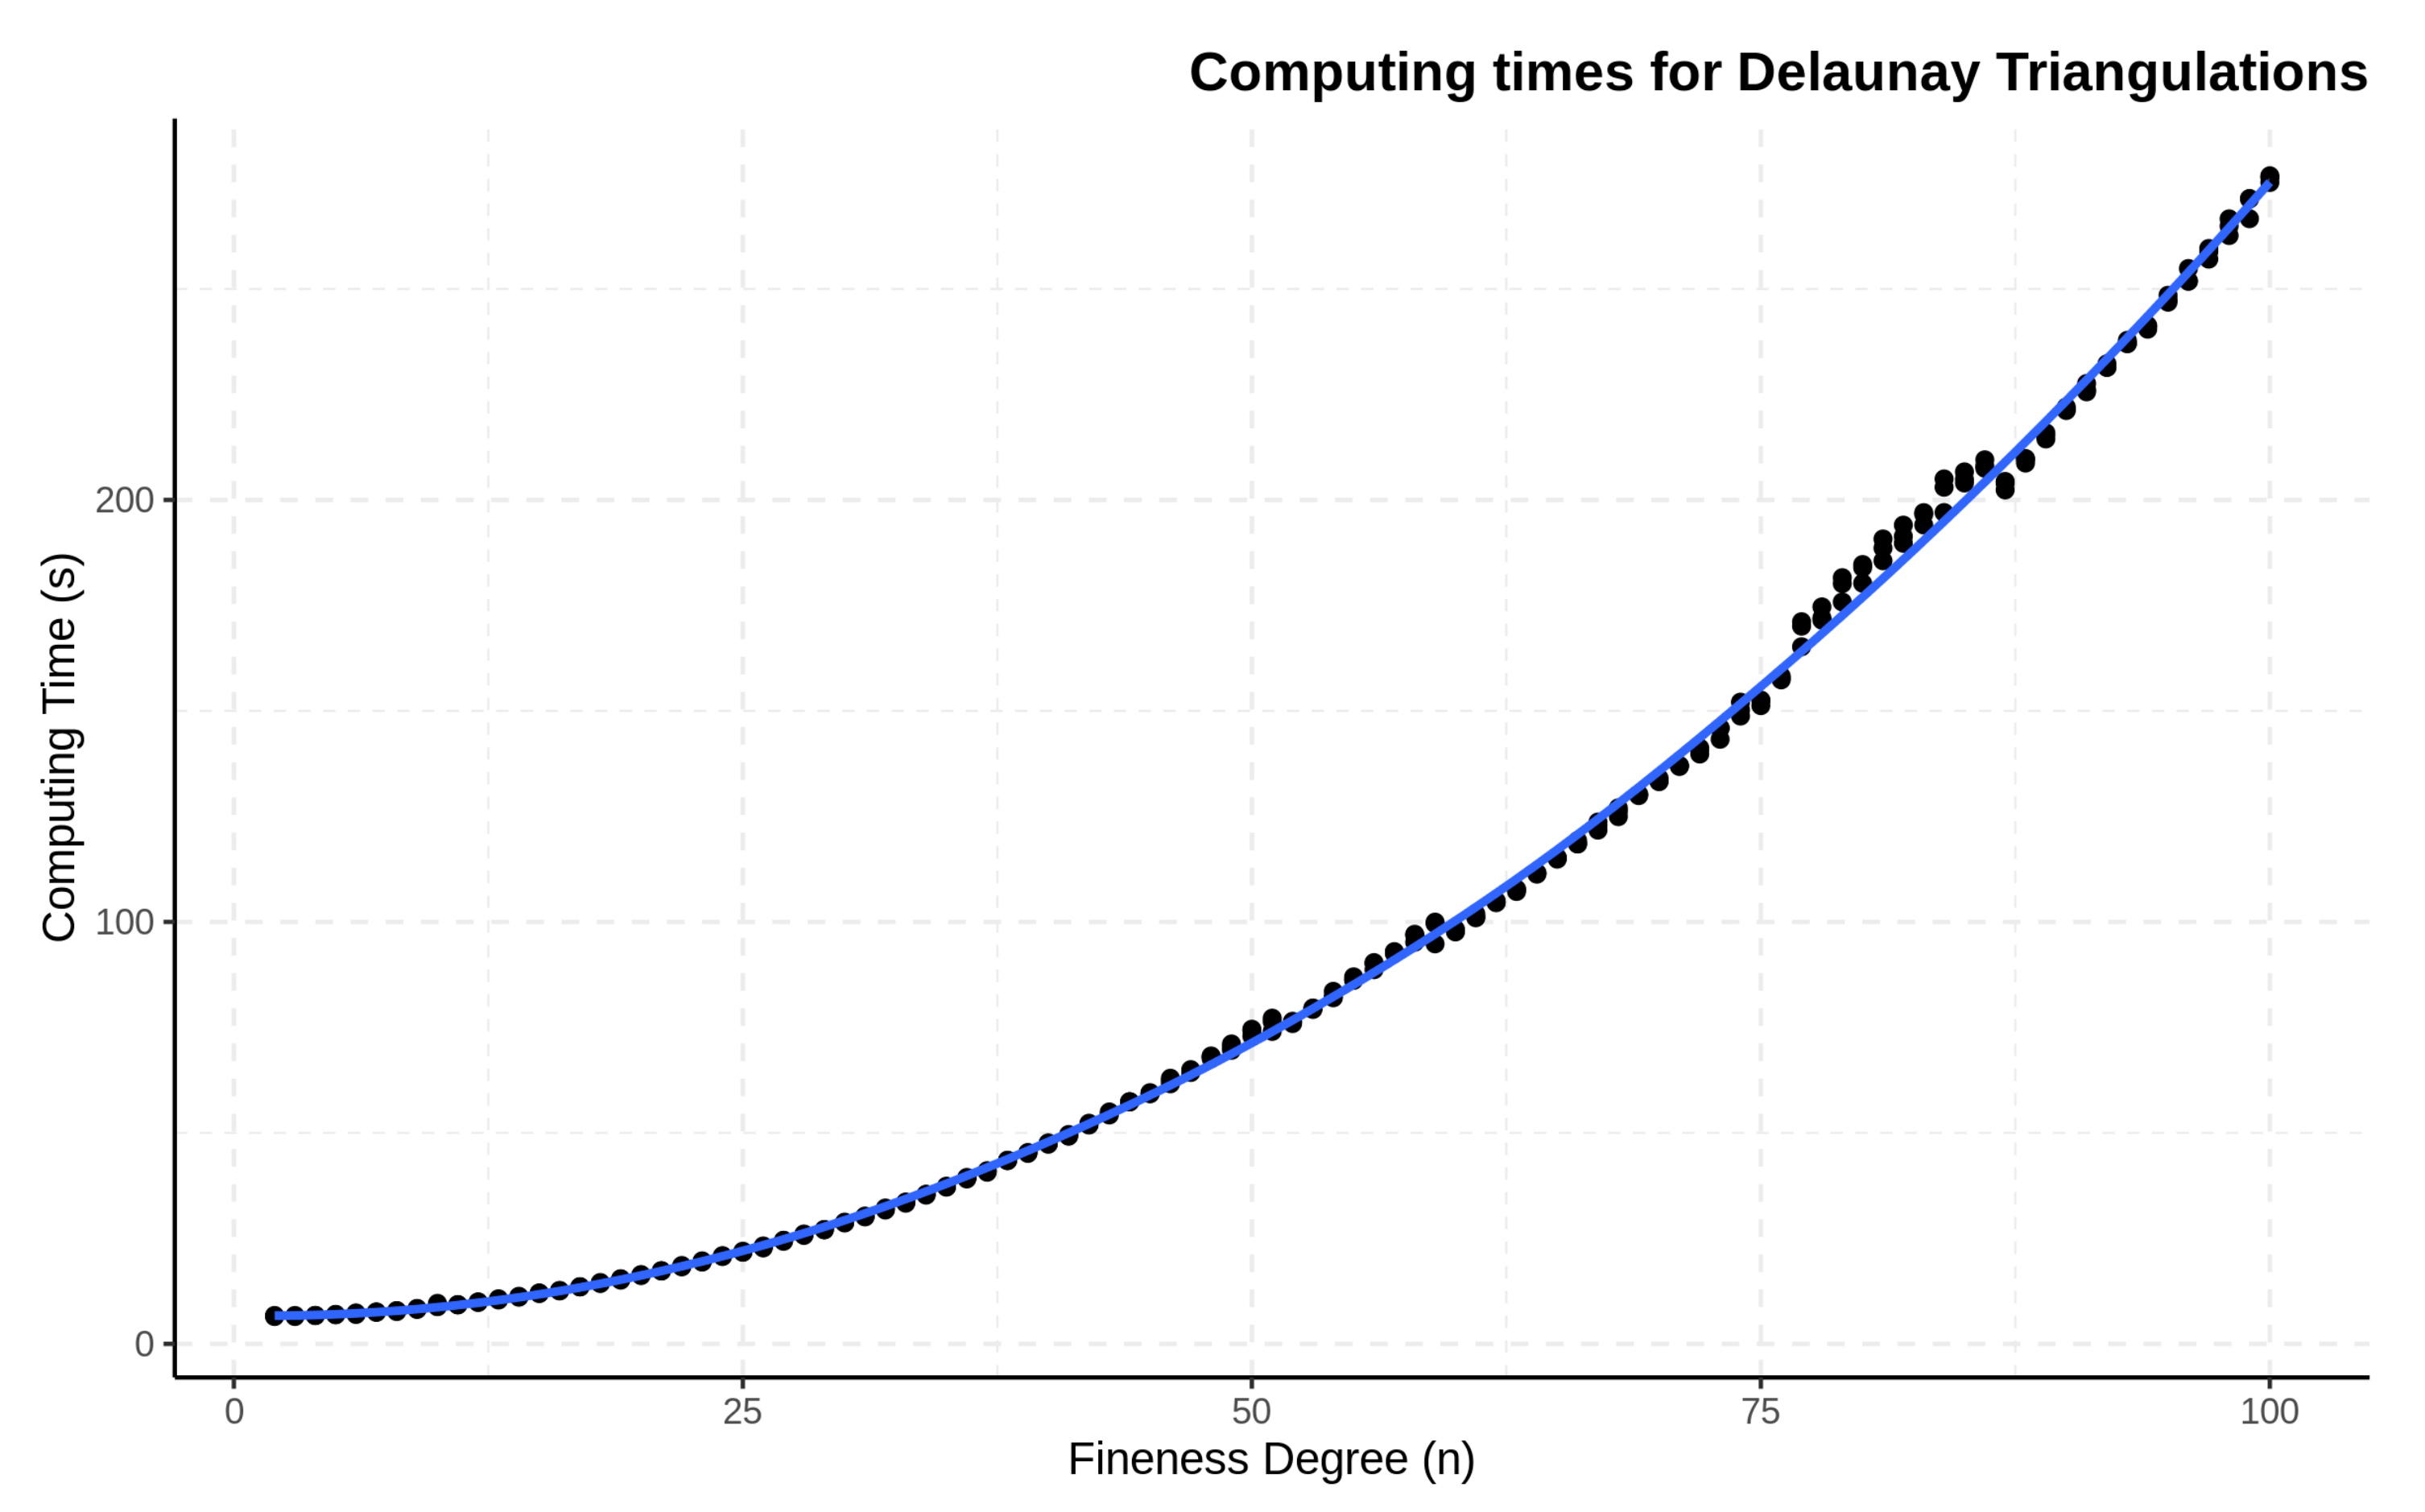
3.1. Delaunay Triangulations

In Figure 4, computing times are examined for the generation of a grid of Delaunay triangulations for highly-complex data structures such as the ones used in this case; these triangulations are the basis for imaging mean function and SCC estimation and will be used in the following sections to evaluate computing times for the two possible applications of this methodology. These results, together with previous findings using simulated data [7], suggest that the degree of triangulation fineness proposed in the scientific literature (N = 8) [4] is too conservative and that modern computers available to data science researchers can easily handle the computation of triangulation grids for N values of up to N = 25 and higher. However, as described in the following sections, the growing complexity of these grids causes an accumulative effect reflected in the computing times of mean functions for groups of images, which has to be taken into account.

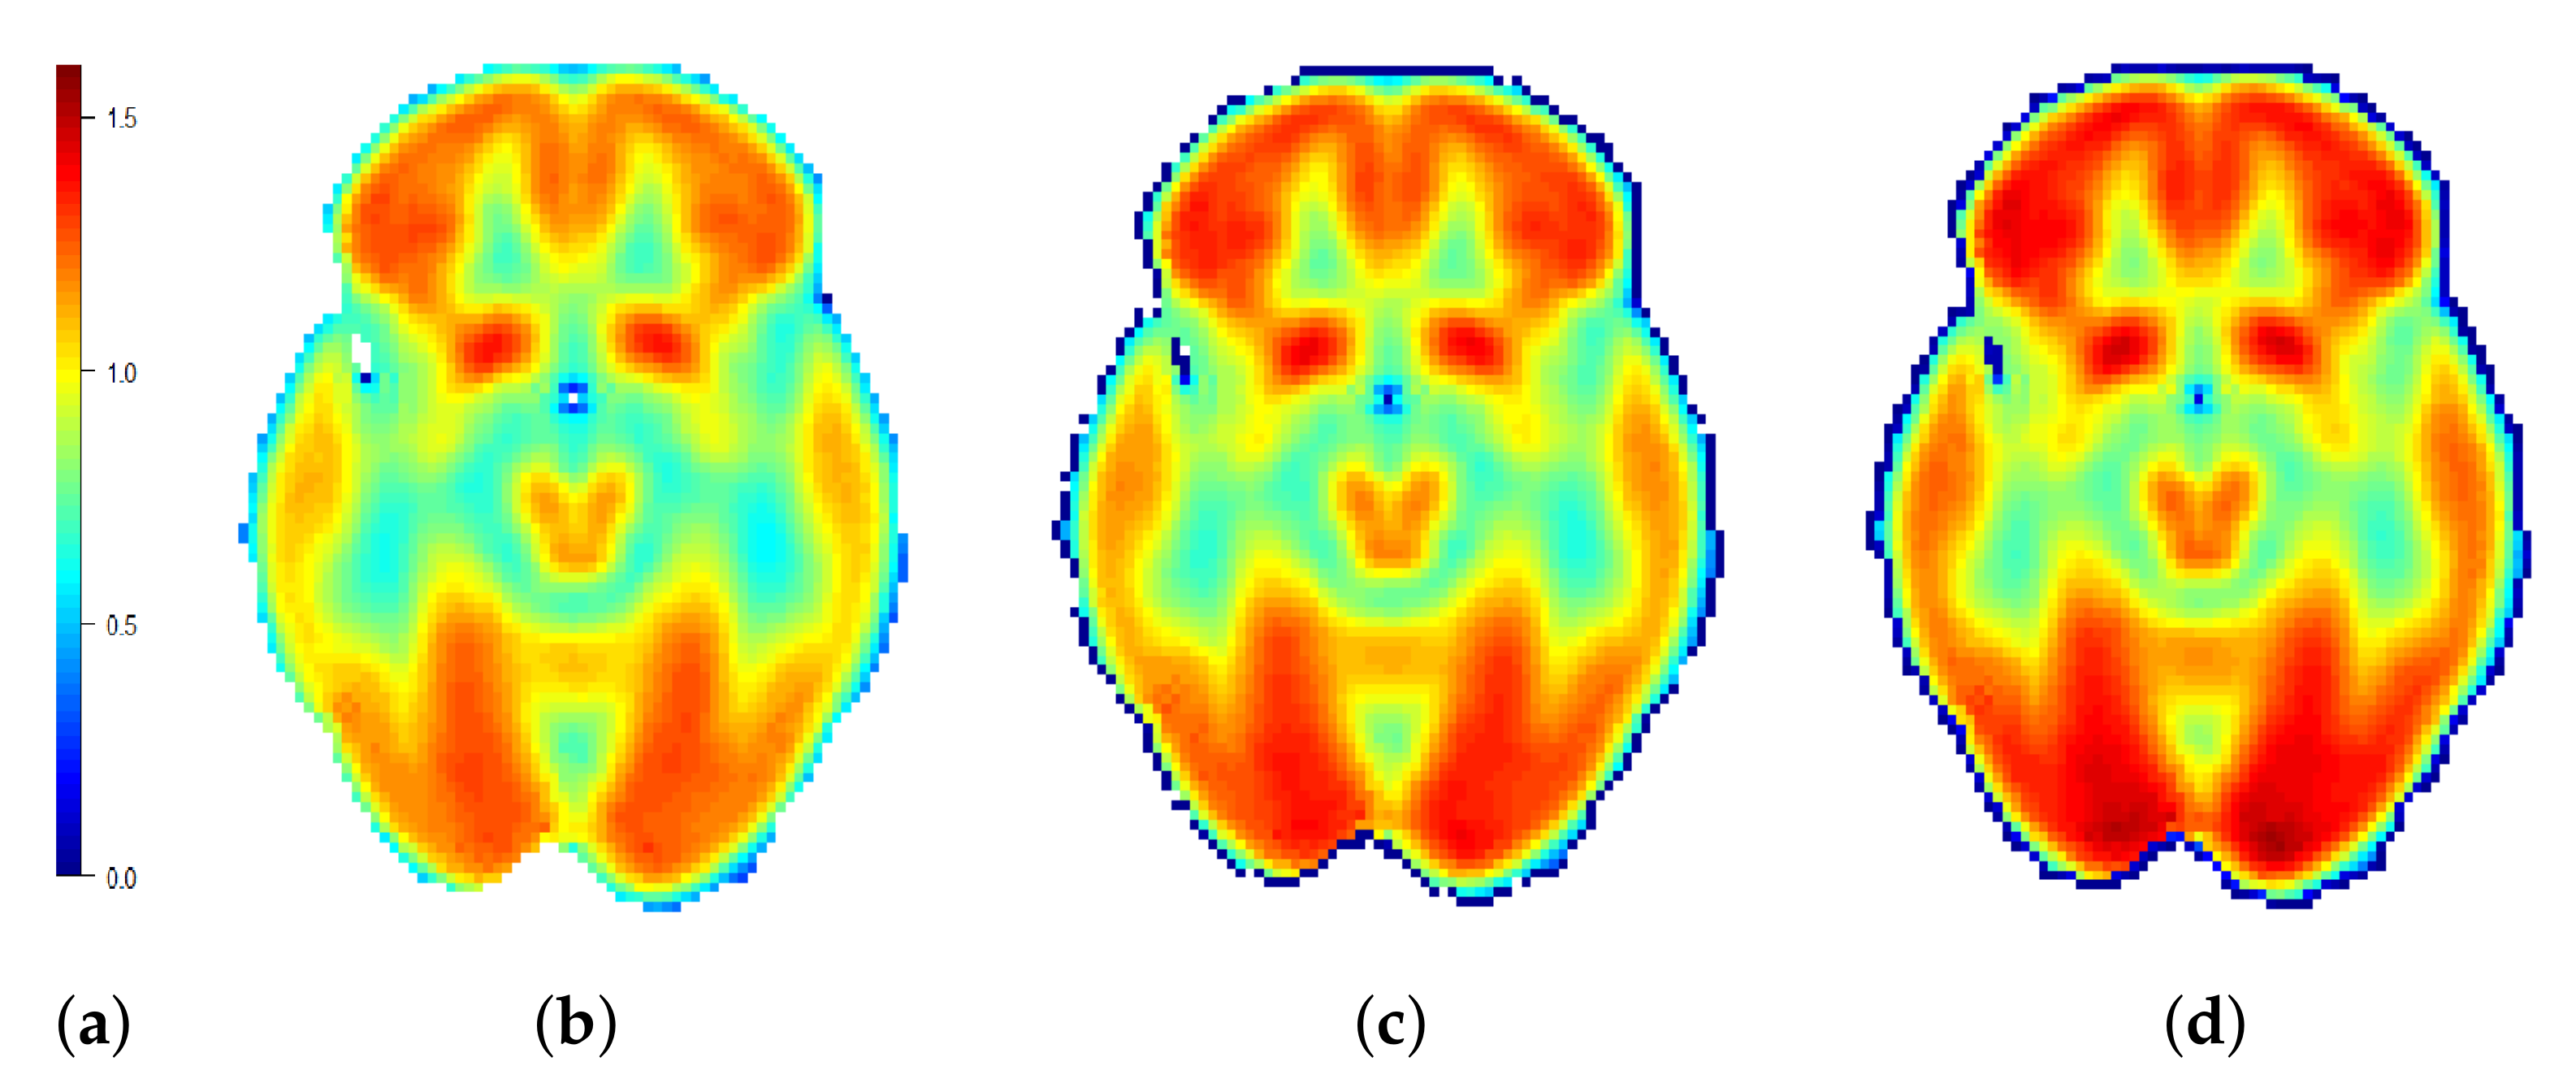
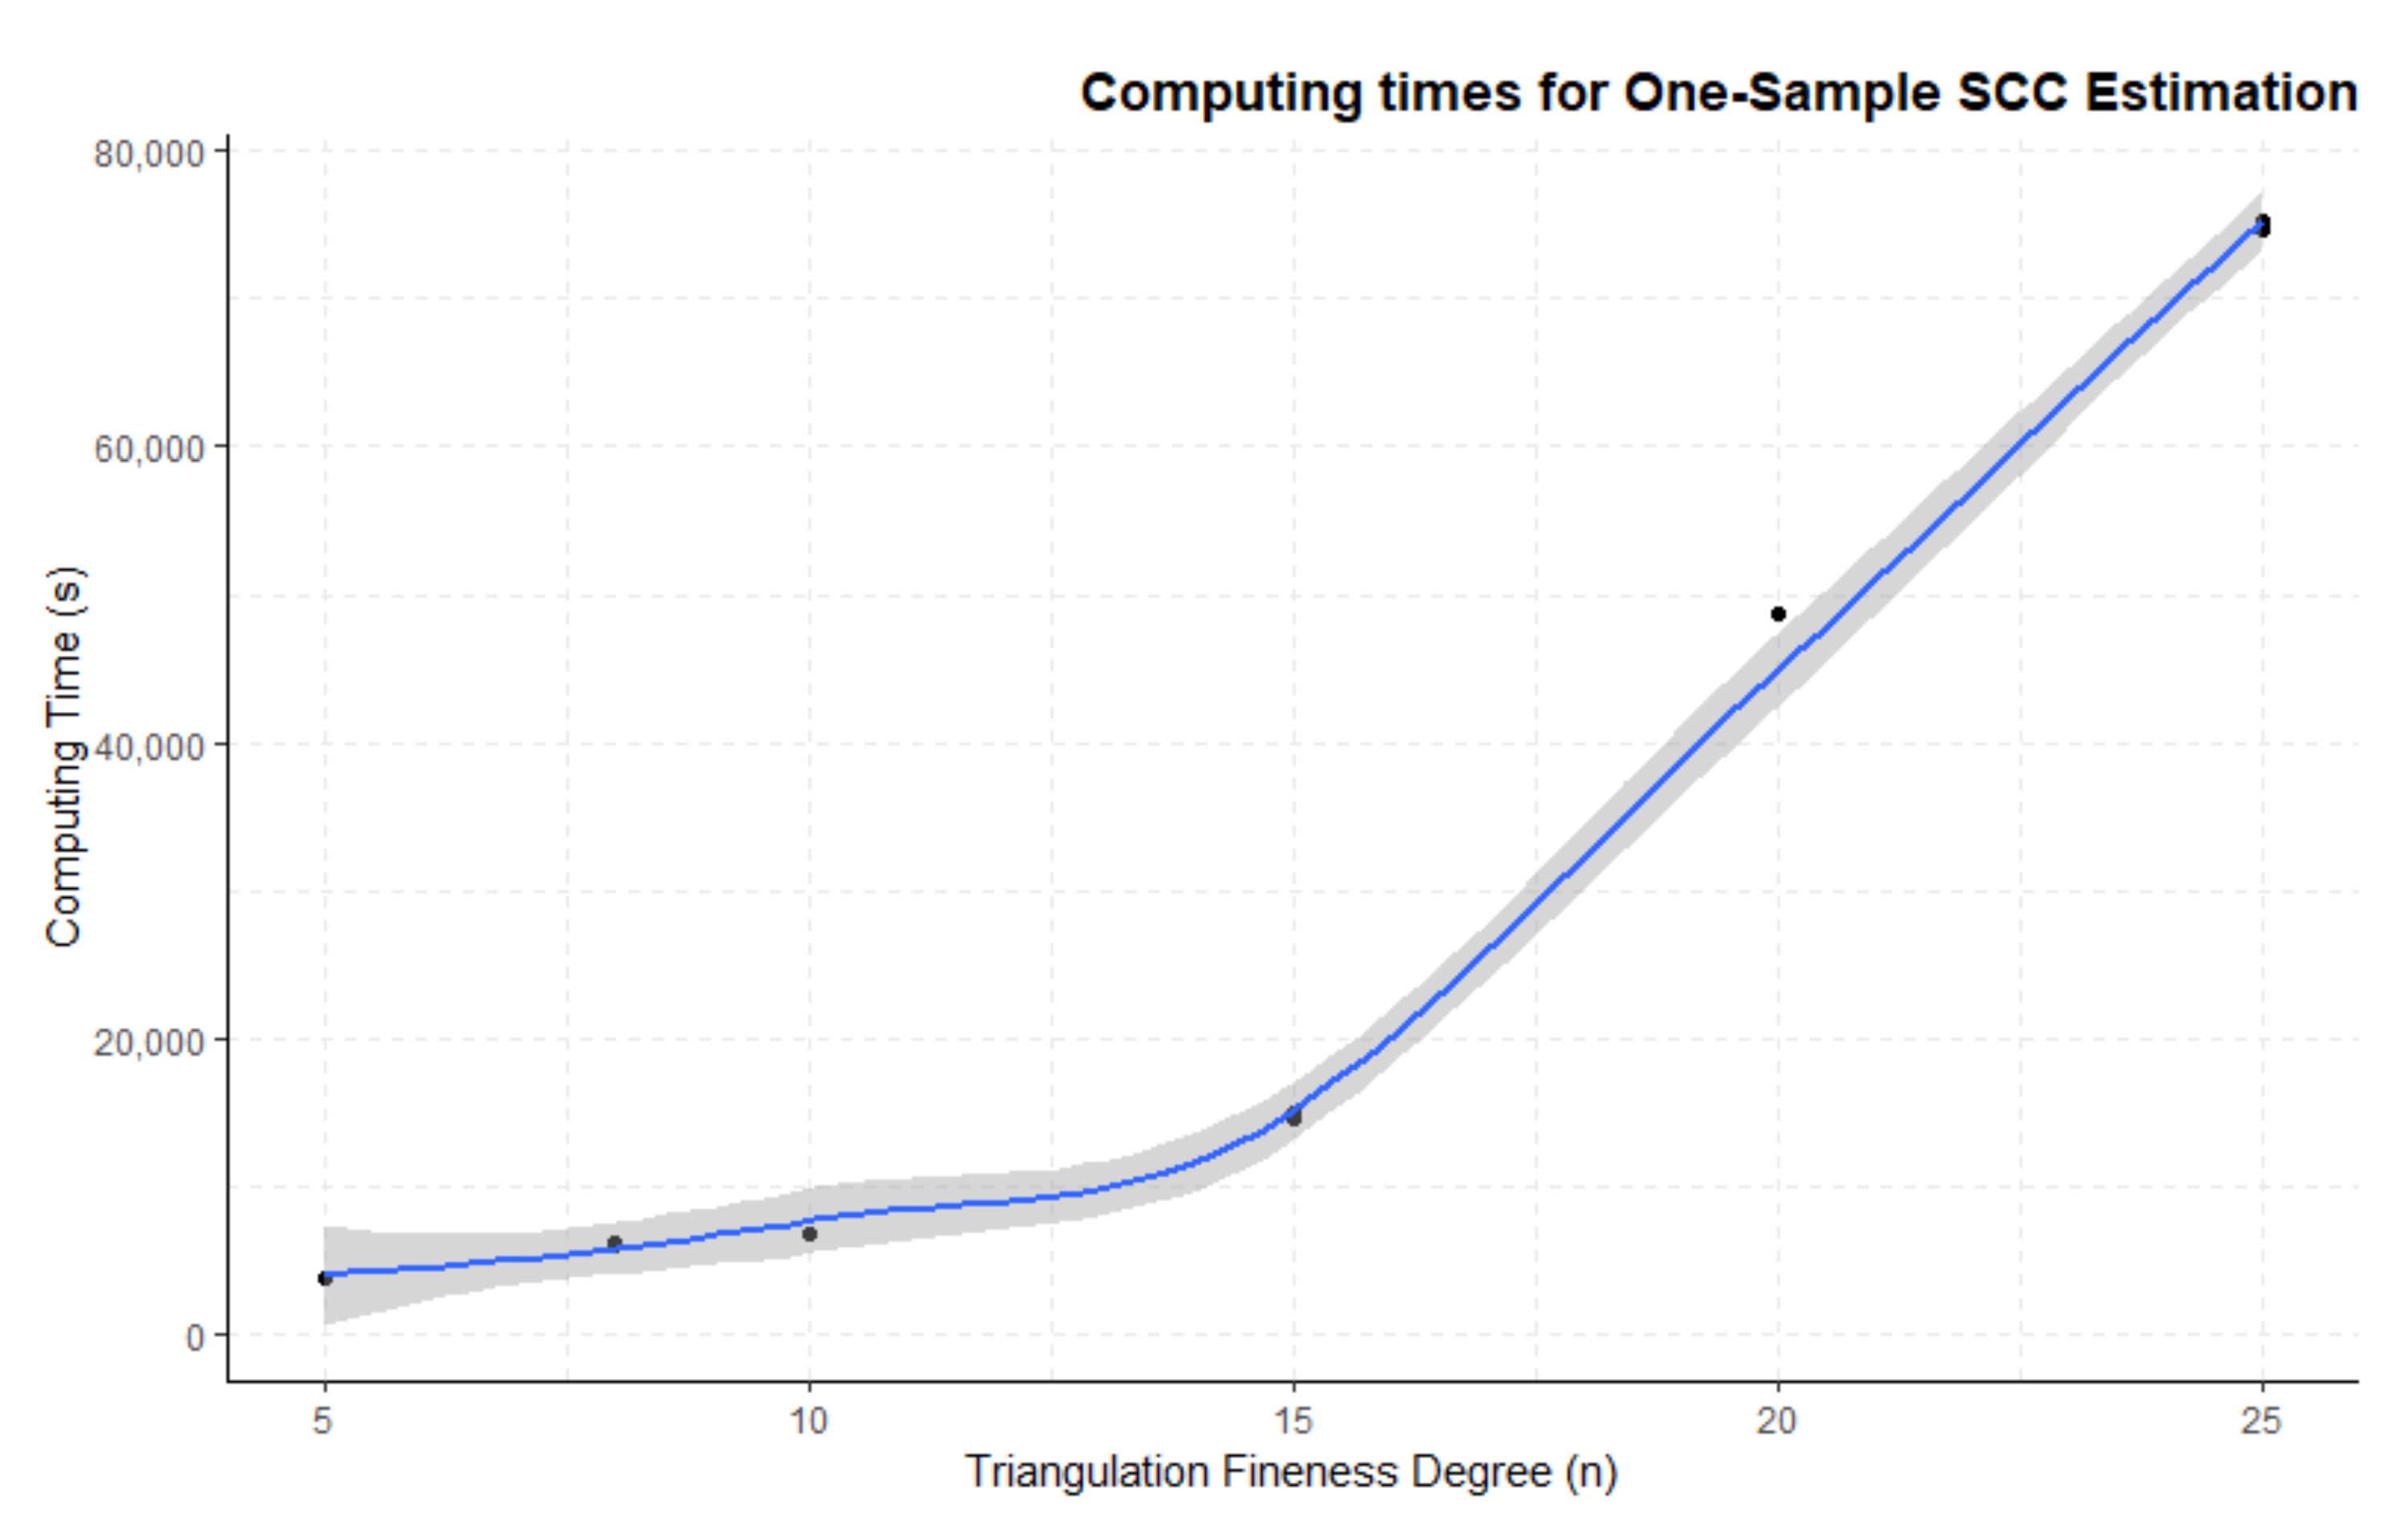
3.2. One-Group Mean Function and SCC Estimation

In Figure 5, a graphical summary of computing times to obtain a one-group mean function and associated SCC in the form of images (as shown in Figure 2) is provided. Aside from the triangulation degree of fineness, which grows in order to test to what extent the polygonal domain affects the costs of computation, estimated mean function and SCC were calculated using parameters recommended by Wang et al. [4], including: degree of bivariate spline for mean estimation d . e s t = 5 , degree of bivariate spline for construction of SCC d . b a n d = 2 , smoothness parameter r = 1 , and a vector of candidates for penalty parameter with values ranging from 10 6 to 10 3 .
It appears as evident that computing times for this process remain fairly stable in the range between one and five hours of processing for triangulations with a fineness degree below N = 15 . Above that value, computing times start to rise linearly, resulting in 22 h of processing for a triangulation’s fineness degrees of N = 25 . This is very relevant, as in previous sections (see Section 3.1), N = 25 was considered as sensible for the computation of Delauney triangulation parameters; however, the cumulative effect of increasing the grid’s complexity makes the application of this technique much more difficult and expensive in terms of time and computational power.

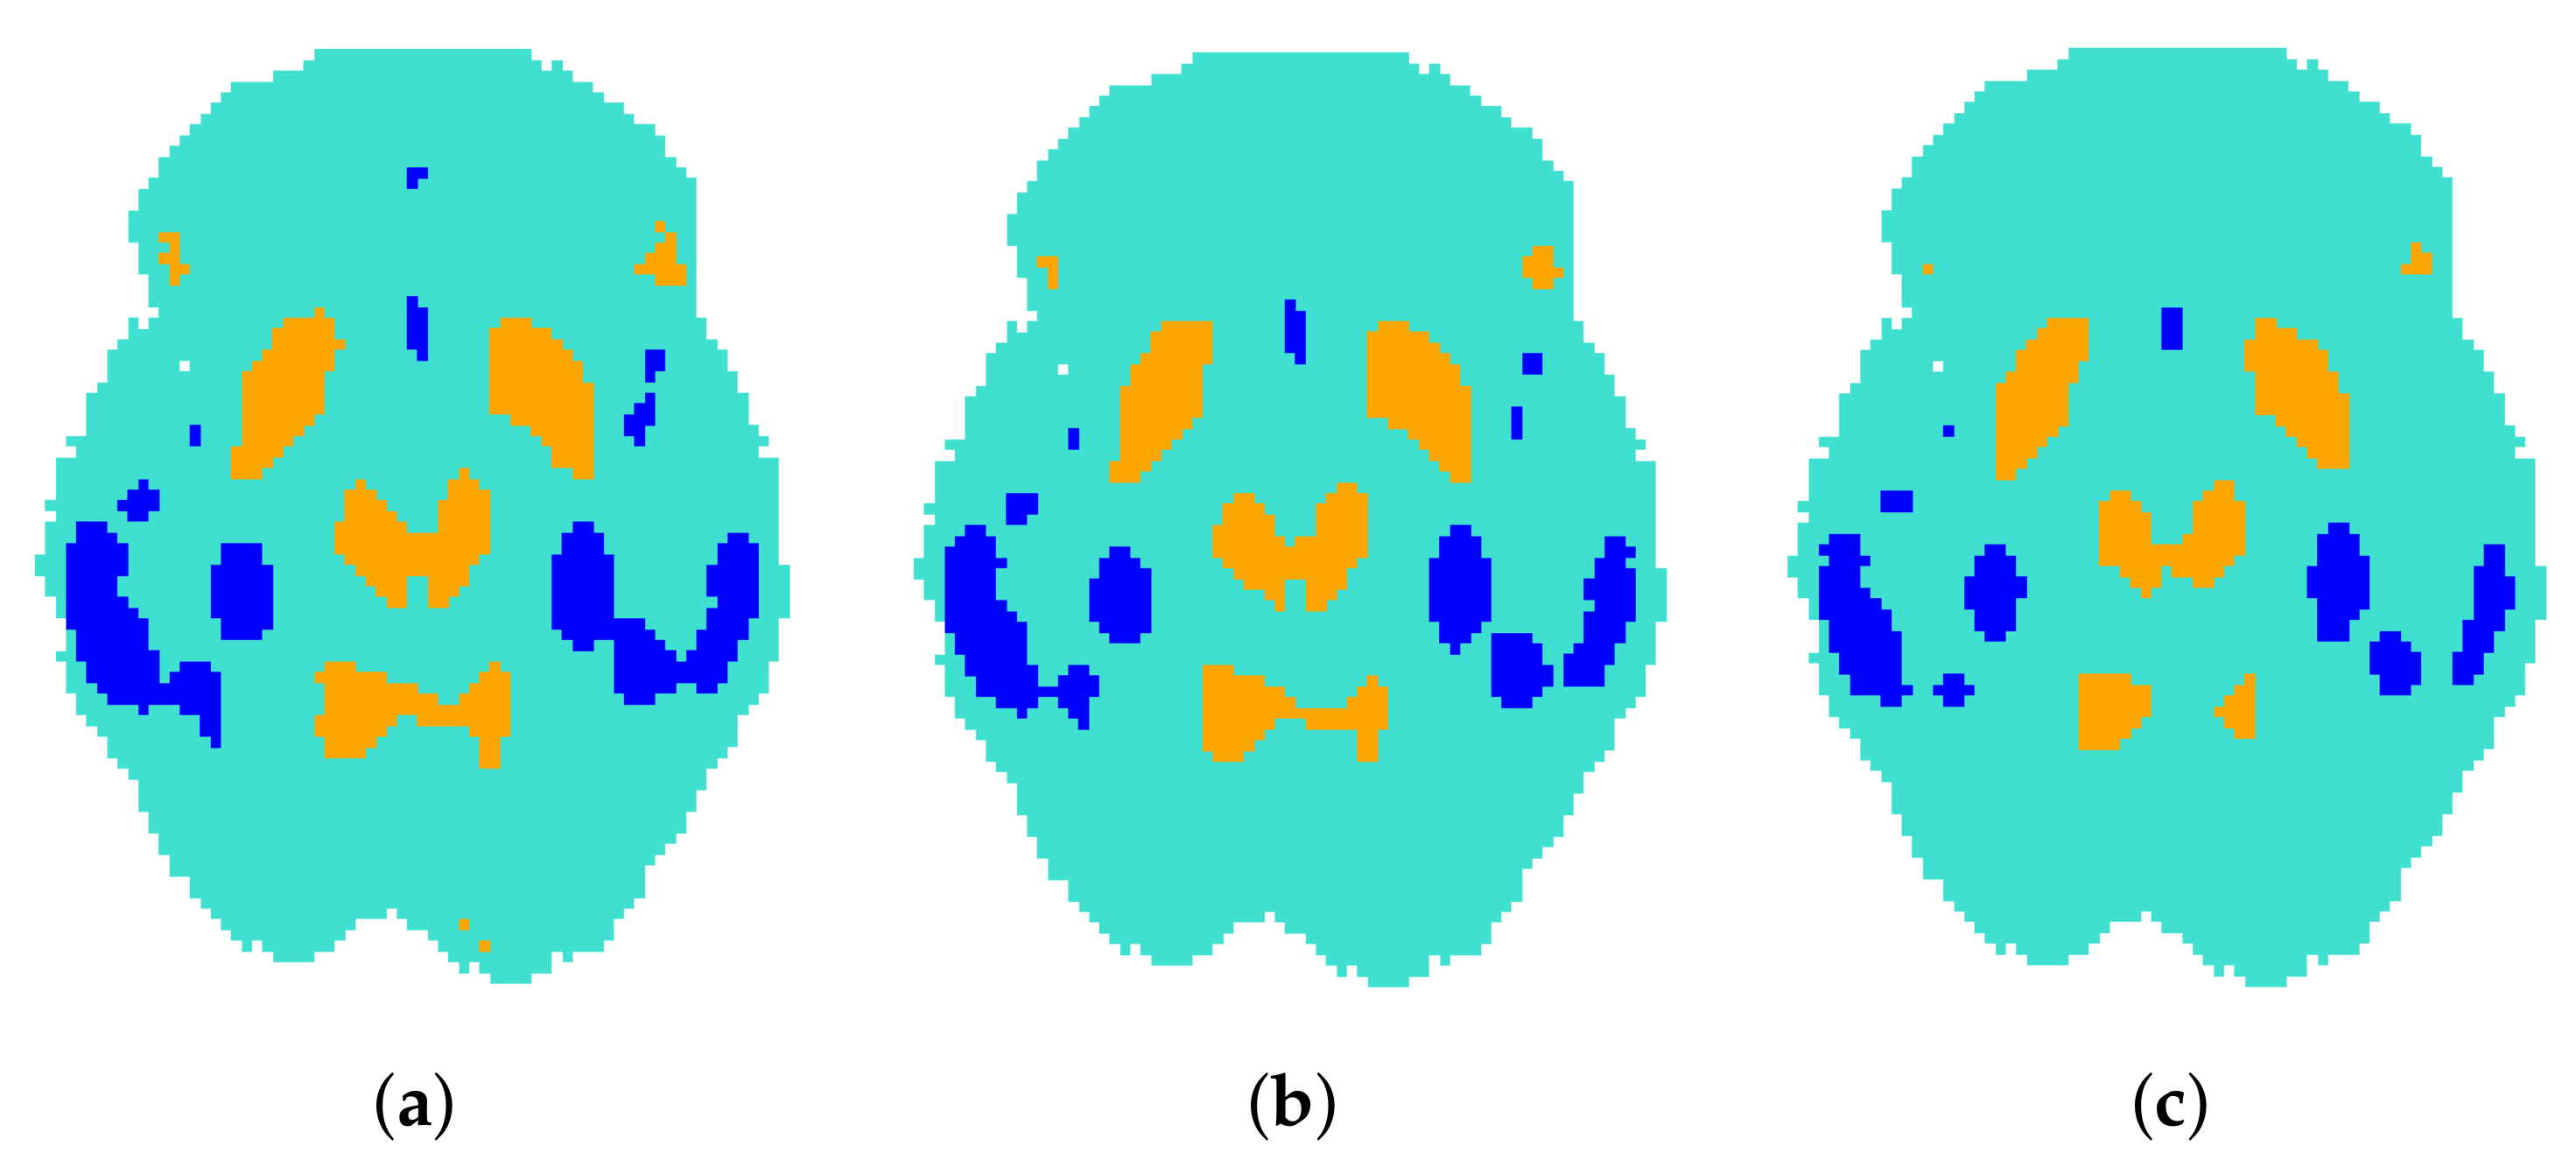
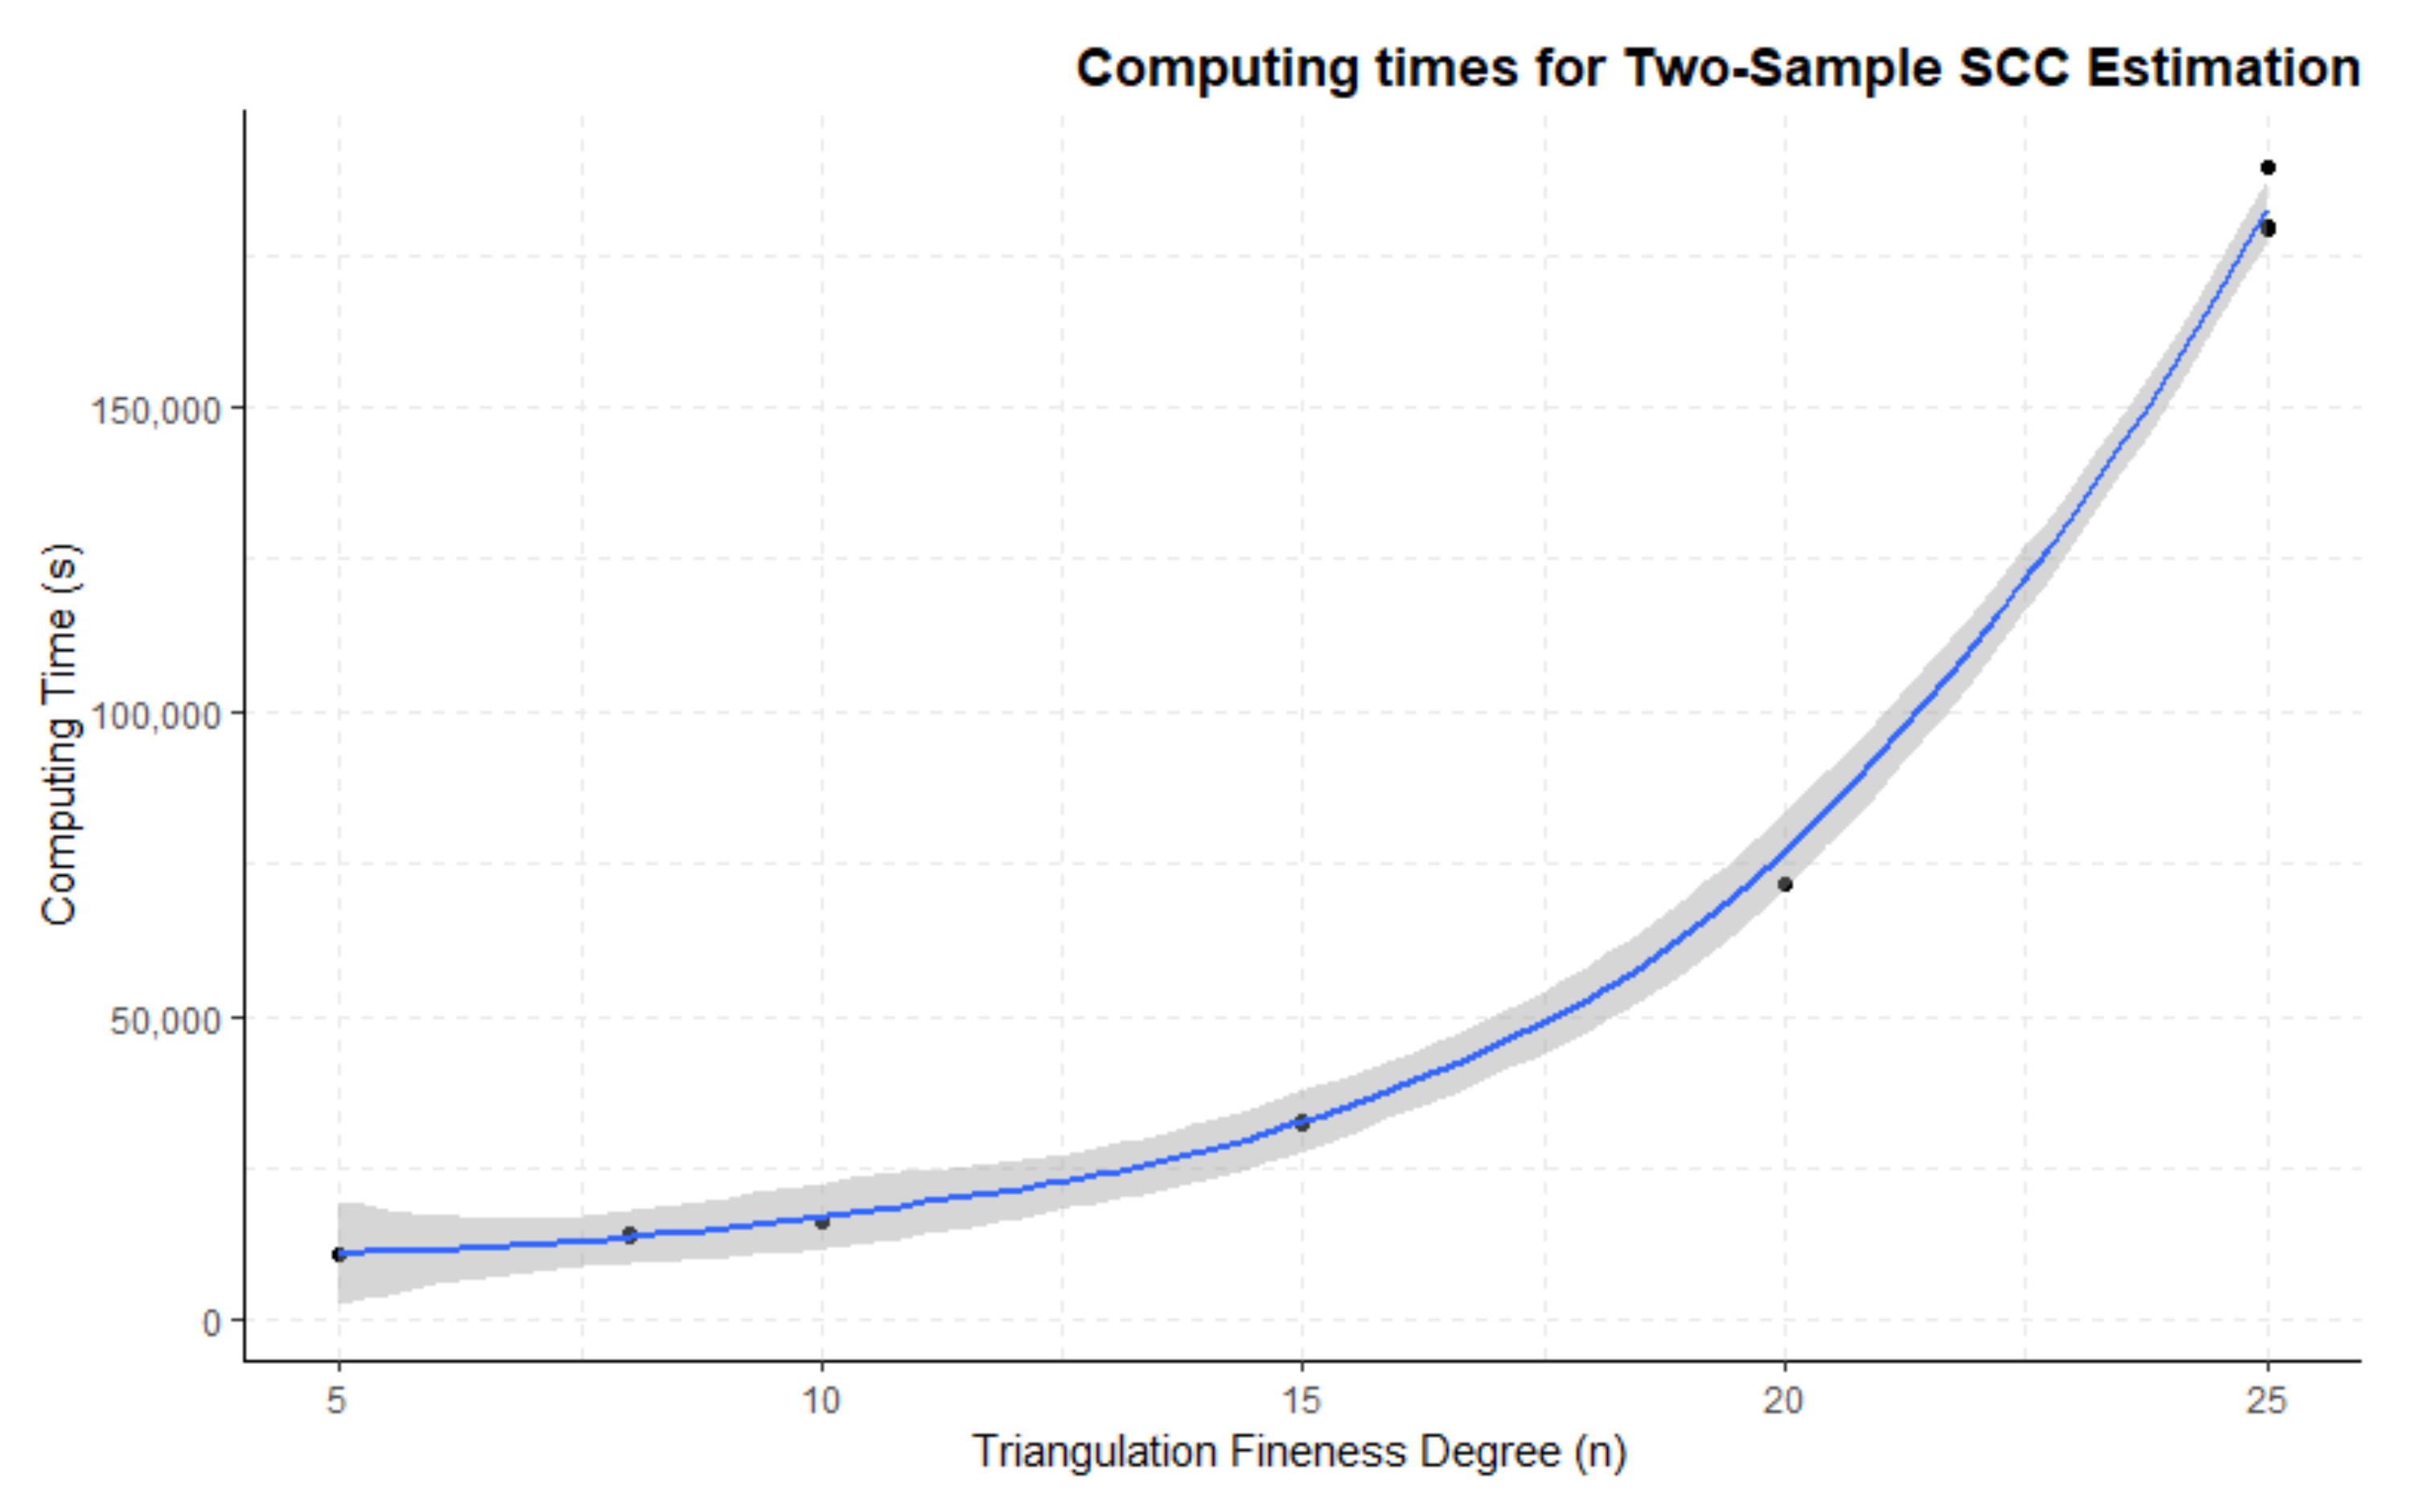
3.3. Two-Group Mean Function and SCC Estimation

In Figure 6, a visual examination of computing costs for performing a two-group comparison using this FDA technique is presented. This technique implies the calculation of mean function for the difference between both groups of images and also the associated SCC (as shown in Figure 3). We carry out this time calculation for a growing value of triangulation’s fineness degree using the same parameters recommended by Wang et al. [4] and described in the previous subsection.
These results show a similar pattern to the ones presented in Figure 5. Computing times remain stable and sensible until a triangulation’s fineness degree threshold placed approximately around N = 15 . Above that value, computing times for this methodology grow and can even go above 50 h of time. It is important to note that computing times for the two-sample case, which is the most significant for clinical practice, are much higher than for the one-sample case. In line with the results of the previous subsection, it does not seem sensible to choose a triangulation fineness parameter only on the basis of the triangulation’s computing times. The whole process needs to be taken into consideration, and that forces us to choose lower values (e.g., N = 15 ) as appropriate for computations inside a sensible time frame.

4. Discussion

The main goal for this article was to first implement the FDA methodology of Wang et al. [4] for the estimation of mean functions and SCC for data in the form of images to a practical case using neuroimaging data. This objective was approached by gathering PET data from open neuroimaging databases focused, in this case, on AD and other dementias. After a complex pre-processing stage performed in order to guarantee pixel-to-pixel comparability, the Delaunay triangulation polygonal space was calculated in order to serve as a fundamental grid for estimations from an FDA approach. Likewise, we then proceeded to estimate the mean function and SCC for a single group of images (see Section 3.2) and for the difference between two groups of images (see Section 3.3), detecting this way areas with patterns of hypo- or hyper-activity in one group compared to another.
After carrying out these processes of triangulation (Figure 1), one-group mean and SCC estimation (Figure 2), and two-group mean difference and SCC estimation (Figure 3), there was still a necessity to evaluate whether the computational costs associated to this methodology are worthy of the results obtained. Although there are previous publications covering computing times and parameter selection for this methodology [7], these were performed with low-complexity simulated data. For this reason, this article aimed to perform the different stages of this FDA methodology using diverse triangulation parameters in order to assess computation times and also to provide future researchers with indications on the preference of choice when replicating or expanding these results with real applications.
The results obtained in this study suggest that, in line with previous publications [7] and against the default parameters suggested by Wang et al. [4], a sensible degree of fineness for the Delaunay triangle polygonal domain can be higher than N = 8 . According to the visualizations presented for triangulation computing times in Figure 4, together with results displayed in Figure 5 and Figure 6, this parameter of triangulation fineness can be increased to at least N = 15 and still obtain results inside sensible time limits when using computers with relatively high computation power (see Section 5). Computing times—both for one-sample and two-sample cases—grow as the triangulation grid’s complexity increases, reaching critical points in which computing times start to be measured in days rather than hours. This goes in line with expected outcomes for functional data methodologies, which are meant to be applied to a high number of cases, whereas increases in the intricacy of the triangulation meshes tend to produce cumulative effects deriving in increased computing times due to the higher complexity of the calculations involved.
In summary, the proposal of applying FDA techniques to imaging data as bi-dimensional extensions of functional data is feasible and promising. The different steps necessary for a practical case application with brain imaging data were performed, obtaining plausible results which go in line with previous literature in a sensible amount of time. It is sensible to suggest that given the current computational power usually available at biomedical data science research groups, parameters for mean function and SCC estimation can be stricter than the ones suggested in previous articles. It is also important to consider that an appropriate choice of triangulation parameters is the most relevant decision for this methodology, as the cumulative effect of their complexity appears to be the most influential factor affecting computing times. In short, these results confirm the utility of FDA techniques for real practical cases of imaging analysis as they display desirable properties such as stability and reasonable computing times.
However, there is still a gap of knowledge to bridge with regard to this new methodology. Traditionally, SPM has been the golden standard for brain imaging studies. This software suite relies on simple statistical tests such as T-tests repeated following what is known as the mass univariate approach and then correcting false positives derived from multiple comparisons with methods such as Bonferroni’s correction. Thus, SPM considers pixels as independent units inside the image, which are compared against its correspondent pixel in another set of images in order to conclude whether the value of brain activity in that coordinate is equal to, higher, or lower than its counterpart. This approach can elude this problematic as FDA considers the whole image as the basic data unit and, besides, it can potentially obtain better results for complex data structures such as brain images. For these reasons, it is reasonable to argue that FDA should detect changes in brain activity more accurately than SPM and thus be more useful for clinical practice and research in fields such as neurodegenerative diseases diagnosis and other fields of medical imaging which are of great relevance in this century. For these reasons, future research should strive to mathematically address the predictive value of this methodology compared to SPM in order to have a clearer image of what the advancement of the implementation of this methodology could mean for researchers and clinical professionals in the field of neuroimaging and medical imaging more generally.
There are computational considerations to be taken in account which could further improve the performance of this methodology in terms of computing time. One line of research should strive for testing this method with GPU together with CPU, as some sections of the applied code are computationally intensive and could be accelerated but have only been tested with CPU, as stated in Section 5. Finally, it is also worth considering that the statistical programming language “R” was used in this study given that the necessary packages are only available for this language [5,11]. Further research should also consider adapting these functions in order to use them in other programming languages which are known to be more efficient with highly-demanding computations such as the ones herein performed.

5. Computer Specifications

This study was carried out using the Biostatistics and Biomedical Data Science’s server available at University of Santiago de Compostela, a computer with the following specifications and R version. Model: ProLiant DL160 Gen9; OS: Ubuntu 18.04.6 LTS x86; CPU: Intel(R) Xeon(R) CPU E5-2620 v4 @ 2.10 GHz; RAM memory: 118 Gb; R version: 4.0.3 (10 October 2020).

Author Contributions

Data curation, J.A.A.-L.; Formal analysis, C.C.-S.; Investigation, J.A.A.-L.; Methodology, J.A.A.-L.; Project administration, P.A.-F.; Software, J.A.A.-L.; Writing—original draft, J.A.A.-L.; Writing—review & editing, C.C.-S. and P.A.-F. All authors have read and agreed to the published version of the manuscript.

Funding

This work was developed under funding from project MTM2017-83513-R, cofinanced by the Ministry of Economy and Competitiveness (SPAIN) and by the European Regional Development Fund (FEDER). The work was also supported by the project ED431C-2020-20, approved within the framework of the Competitive Research Unit Consolidation Programme of the Galician Regional Authority (Xunta de Galicia). This work was also partly funded by the UE projects EAPA-791/2018 and 0624-2iqbioneuro-6.

Institutional Review Board Statement

Not applicable.

Informed Consent Statement

Not applicable.

Data Availability Statement

18F-FDG PET data for this practical case was drawn upon the Alzheimer’s Disease Neuroimaging Initiative: https://adni.loni.usc.edu (accessed on 1 April 2022), a platform that collects data from different research institutions focusing on AD diagnosis. Supporting information and scripts for replication of this study can be downloaded at the following GitHub open repository: https://github.com/iguanamarina/FDA-for-neuroimaging-mean-function-estimation----computing-times-and-parameter-selection (accessed on 1 April 2022).

Conflicts of Interest

The authors declare no conflict of interest.

Abbreviations

The following abbreviations are used in this manuscript:
FDAFunctional Data Analysis
SCCSimultaneous Confidence Corridor
PETPositron Emissionn Tomography
18F-FDG18-Fluorodeoxyglucose
ADAlzheimer’s Disease
SPMStatistical Parametric Mapping

References

  1. Ramsay, J.O. Functional data analysis. In Encyclopedia of Statistical Sciences; John Wiley & Sons: Hoboken, NJ, USA, 2004; Volume 4. [Google Scholar] [CrossRef]
  2. Wang, J.-L.; Chiou, J.-M.; Müller, H.-G. Functional data analysis. Annu. Rev. Stat. Appl. 2016, 3, 257–295. [Google Scholar] [CrossRef] [Green Version]
  3. Worsley, K.J.; Taylor, J.E.; Tomaiuolo, F.; Lerch, J. Unified univariate and multivariate random field theory. NeuroImage 2004, 23, S189–S195. [Google Scholar] [CrossRef] [PubMed]
  4. Wang, Y.; Wang, G.; Wang, L.; Ogden, R.T. Simultaneous confidence corridors for mean functions in functional data analysis of imaging data. Biometrics 2020, 76, 427–437. [Google Scholar] [CrossRef] [PubMed]
  5. Lai, M.J.; Wang, L. Bivariate Spline over Triangulation, R Package Version 0.1.0; R Core Team: Vienna, Austria, 2019.
  6. Degras, D.A. Simultaneous confidence bands for nonparametric regression with functional data. Stat. Sin. 2011, 21, 1735–1765. [Google Scholar] [CrossRef] [Green Version]
  7. Arias-López, J.A.; Cadarso-Suárez, C.; Aguiar-Fernández, P. Computational Issues in the Application of Functional Data Analysis to Imaging Data. In Computational Science and Its Applications—ICCSA 2021, Proceedings of the 21st International Conference, Cagliari, Italy, 13–16 September 2021; Gervasi, O., Murgante, B., Misra, S., Garau, C., Blečić, I., Taniar, D., Apduhan, B.O., Rocha, A.M.A.C., Tarantino, E., Torre, C.M., Eds.; Springer International Publishing: Berlin/Heidelberg, Germany, 2021; pp. 630–638. [Google Scholar] [CrossRef]
  8. López-González, F.J.; Silva-Rodríguez, J.; Paredes-Pacheco, J.; Niñerola-Baizán, A.; Efthimiou, N.; Martín-Martín, C.; Moscoso, A.; Ruibal, Á.; Roé-Vellvé, N.; Aguiar, P. Intensity normalization methods in brain FDG-PET quantification. NeuroImage 2020, 222, 117229. [Google Scholar] [CrossRef] [PubMed]
  9. Mueller, S.G.; Weiner, M.W.; Thal, L.J.; Petersen, R.C.; Jack, C.R.; Jagust, W.; Trojanowski, J.Q.; Toga, A.W.; Beckett, L. Ways toward an early diagnosis in Alzheimer’s disease: The Alzheimer’s Disease Neuroimaging Initiative (ADNI). Alzheimer’s Dement. 2005, 1, 55–66. [Google Scholar] [CrossRef] [PubMed] [Green Version]
  10. Penny, W.D.; Friston, K.J.; Ashburner, J.T.; Kiebel, S.J.; Nichols, T.E.; Klebel, S.J.; Nichols, T.E. Statistical Parametric Mapping: The Analysis of Functional Brain Images; Elsevier: Amsterdam, The Netherlands, 2006. [Google Scholar]
  11. Lai, M.J.; Wang, L. Triangulation: Triangulation in 2D Domain, R Package Version 0.1.0; R Core Team: Vienna, Austria, 2020.
  12. Wang, Y.; Wang, G.; Wang, L. ImageSCC: SCC for Mean Function of Imaging Data, R Package Version 0.1.0; R Core Team: Vienna, Austria, 2020.
Figure 1. Delaunay triangulations produced for this practical case with real brain imaging data. Increasing triangulation’s degree of fineness is measured by parameter N. (a) N = 10. (b) N = 25. (c) N = 50.
Computers 11 00091 g001
Figure 2. (a) Scale; (b) Lower SCC; (c) Mean Function; and (d) Upper SCC for brain imaging data. SCCs calculated for α = 0.05 using Delaunay triangulations (fineness degree N = 10 ).
Computers 11 00091 g002
Figure 3. Example of results for a two-sample approach comparing two sets of images: one conformed by control patients and another by pathological (AD) patients. Blue indicates detected hypo-activity while orange indicates hyper-activity. Delaunay triangulations’ fineness degree N = 10 . (a) α = 0.1 . (b) α = 0.05 . (c) α = 0.01 .
Computers 11 00091 g003
Figure 4. Computing times for Delaunay triangulations for complex neuroimaging data structures with growing fineness degree values. Curve fitted with local (LOESS) regression.
Computers 11 00091 g004
Figure 5. Computing times for one-group mean function and SCC estimation for neuroimaging data with growing value of triangulation fineness degree. Curve fitted using local (LOESS) regression.
Computers 11 00091 g005
Figure 6. Computing times for two-group mean function and SCC estimation for the differences between groups with growing value of triangulation fineness degree. Curve fitted using local (LOESS) regression.
Computers 11 00091 g006
Publisher’s Note: MDPI stays neutral with regard to jurisdictional claims in published maps and institutional affiliations.

