A Complexity Metrics Suite for Cascading Style Sheets


1
Department of Computer and Information Sciences, Covenant University, Canaanland, Ota 0123, Nigeria
2
Department of Computer Engineering, Atilim University, 06830 Ankara, Turkey
3
Department of Software Engineering, Kaunas University of Technology, 51368 Kaunas, Lithuania
*
Author to whom correspondence should be addressed.
Computers 2019, 8(3), 54; https://0-doi-org.brum.beds.ac.uk/10.3390/computers8030054
Submission received: 6 June 2019
/
Revised: 1 July 2019
/
Accepted: 8 July 2019
/
Published: 10 July 2019
(This article belongs to the Special Issue Code Generation, Analysis and Quality Testing)
Abstract
:We perform a theoretical and empirical analysis of a set of Cascading Style Sheets (CSS) document complexity metrics. The metrics are validated using a practical framework that demonstrates their viability. The theoretical analysis is performed using the Weyuker’s properties−a widely adopted approach to conducting empirical validations of metrics proposals. The empirical analysis is conducted using visual and statistical analysis of distribution of metric values, Cliff’s delta, Chi-square and Liliefors statistical normality tests, and correlation analysis on our own dataset of CSS documents. The results show that five out of the nine metrics (56%) satisfy Weyuker’s properties except for the Number of Attributes Defined per Rule Block (NADRB) metric, which satisfies six out of nine (67%) properties. In addition, the results from the statistical analysis show good statistical distribution characteristics (only the Number of Extended Rule Blocks (NERB) metric exceeds the rule-of-thumb threshold value of the Cliff’s delta). The correlation between the metric values and the size of the CSS documents is insignificant, suggesting that the presented metrics are indeed complexity rather than size metrics. The practical application of the presented CSS complexity metric suite is to assess the risk of CSS documents. The proposed CSS complexity metrics suite allows identification of CSS files that require immediate attention of software maintenance personnel.
1. Introduction
Web applications have become indispensable to a growing number of business organizations today as they now form an integral part of their business strategies [1]. Considering this point of view, it is essential that web applications be maintainable so as to have a long lifecycle. However, achieving this objective is not a trivial task. As large-scale web applications become increasingly complex, the quality of such systems decreases. Of all the quality attributes, maintainability is one of the most important attributes that should be taken into consideration during the development of web applications. Maintaining the quality of large-scale web applications after they have been built can be very challenging. One of the approaches to decrease the maintainability effort is by managing the complexity of applications. Another approach is to predict code bug [2] or smells [3] thus contributing to prolonging the lifecycle of programs too. Software complexity is measured in order to, among other things, be able to predict the maintainability and reliability of software given that code metrics can serve as indicators of software defects [4]. A good number of complexity metrics have been proposed to measure software programs. In many cases, these metrics are based on cognitive informatics [5]—an approach to evaluating the complexity of software based on cognitive weights [6,7,8].
Metrics have been suggested for both procedural (or functional) and object-oriented languages [9]. Notable metrics for procedural languages includes the Halstead complexity measure [10], McCabe’s cyclomatic complexity [11], and Lines of Code (LoC) for functional/procedural languages, and Chidamber and Kemerer (CK) Metric Suite [12] for object-oriented languages. In comparison to programming languages however, little work has been done in proposing metrics for other notation systems such as metaprograms [13], or style sheet languages. Recently, complexity metrics were suggested for the web application domain, including Extensible Markup Language (XML) schema documents [14], Web Services [15,16], and Document Type Definition (DTDs) [17]. These components are a requisite part of contemporary web applications. Several complexity metrics have been proposed for XML. For example, Feuerlicht and Hartman [18] proposed a Service Entropy Metric (SEM) that estimates the complexity of XML message structures on which web service interfaces are based. Pušnik et al. [19] suggested a full set of composite metrics based on the 25 properties of XML documents for assessing an XML Schema’s quality. An overview of complexity metrics for XML schema languages is presented in Reference [20].
Cascading Style Sheets (CSS) are another important part of web applications. It is a style sheet language that is used to structure the presentation of web pages written in markup languages, such as Wireless Markup Language (WML), Hyper Text Markup Language (HTML), and eXtensible HTML (XHTML), for implementing user-friendly and aesthetically attractive web interfaces. The main advantage that CSS offers is separation of the content aspects from the presentation aspects as suggested by the ‘separation of concerns’ paradigm [21]. Despite this advantage, users perceive CSS as over-complex and this has hampered its far-reaching adoption. While CSS are perceived as complex, the domain of style sheets remains under-researched and no metric has been proposed to measure CSS complexity [22]. Keller and Nussbaumer [23] proposed a quality metric based on abstractness factor in order to understand why CSS codes written by humans were better than those automatically generated by tools. The goal of his research was to use the result of the metric as a benchmark for improving CSS authoring tools. The work however did not deal with measuring complexity of CSS. Mesbah and Mirshokraie [24] in their work began by identifying the inheritance and cascading features of CSS as the main factors that make CSS code difficult to maintain. They went on to propose an automated method to aid CSS code maintenance by analyzing the performance dependencies between the CSS rules and Document Object Model (DOM) elements in a web application and detecting overridden declaration properties, unmatched and ineffective selectors, and undefined class values. A key significance of their approach is that it can help to ensure a clean code base by reporting unused code, which can then be deleted. This will in turn reduce complexity of the CSS code. Selecting high-quality CSS templates for website design can increase website maintainability and reduce work effort required in the future.
In our previous work [25], we presented structural factors that contribute to complexity in CSS documents. While evaluating the complexity of CSS, it was identified that size, number of blocks, reuse of rule blocks, cohesion and attribute definition are the factors responsible for increasing the complexity. The study proceeded to propose metrics based on these factors. The metrics proposed include: Rule length (size); number of rule blocks (size); entropy (variety in rule block structure); number of extended rule blocks (rule block reuse); number of attributes defined per rule block (attribute definition in rule blocks); and number of cohesive rule blocks (cohesion). The metrics were validated using a practical framework. The validation results showed that the metrics were useful and applicable. The work however did not perform theoretical validation. Additionally, empirical validation of the metrics was not carried out. These aspects form the focus of this article.
The ultimate objective of this study is to carry out the theoretical and empirical validation on CSS metrics previously proposed in Reference [25]. The structure of the remaining parts of the article is as follows. In Section 2, we describe the proposed metric suite. The methodology adopted comprising of theoretical and empirical analysis as well as risk assessment is conducted in Section 3. Section 4 presents the results obtained and discusses the threats to validity. Section 5 concludes the work.
2. Definition and Demonstration of Proposed Metrics
“The greater the size of a CSS the more complex the CSS will be. Since size is an important measure, we are proposing rule length metric which is similar to lines of code in procedural programming and number of rule block metric which is similar to the number of modules in structured programming.
Also, the more dissimilar the rule blocks in a CSS are to one another, the more complex it will be to understand. Since variety in rule block structure is an important measure, we are proposing entropy metric.
The smaller the number of modules that are reused in CSS increases the complexity of the CSS. Since reuse is an important measure, we are proposing number of extended rule blocks metric.
Furthermore, cohesion plays a vital role in the complexity of CSS as the lower the level of cohesion among rule blocks, the more complex the CSS. Since cohesion is an important measure, we are proposing number of cohesive rule blocks as metric.
In addition, the more the attributes defined for a rule block the more complex it will be. Since attribute definition in rule blocks is an important measure, we are pro- posing number of attributes defined per rule block as metric. In the paragraphs that follow, we describe the proposed metrics in detail” [25].
In this section, the various metrics are demonstrated using the following CSS example:
  /* CSS Code Listing 1 */
  * {
       padding: 0;
       margin: 0;
    }

    a {
       text-decoration: underline;
       color: #FFF;
    }

    a:hover {
       text-decoration: none;
    }

    body {
       background: #281525 url(images/bg0.jpg) top center no-repeat;
       background-size: 100%;
       line-height: 1.75em;
       color: #CCB7C0;
       font-size: 12pt;
    }

    h2 {
       font-size: 1.75em;
    }

    h2,h3,h4 {
       color: #FFF;
       font-family: Abel, sans-serif;
       margin-bottom: 1em;
    }

    h3 {
       font-size: 1.5em;
    }

    h4 {
       font-size: 1.25em;
    }

    #content {
       padding: 0;
       width: 765px;
       float: left;
    }

    #footer {
       text-align: center;
       margin: 40px 0 80px 0;
       color: #543E51;
       text-shadow: 1px 1px 1px rgba(0,0,0,0.75);
    }
2.1. Rule Length (RL)
A CSS document consists of a list of rules described according to the World Wide Web Consortium (W3C) specifications. The Rule Length (RL) metric counts the number of lines of rules in a CSS, while excluding white spaces or comment lines as comments and white spaces are not executable. The value of the RL metric is computed as the number of rule statements in a CSS file. Here, a rule statement can be any of the elements of a CSS file presented as follows:
- Selector attribute(s) finishing with a semicolon “;”, e.g., “color: #00FF00”;
- Selector(s) and an opening brace of a rule block “{”, e.g., “body {” as well as
- A closing brace of a rule block represented by “}”
From the given CSS Code Listing 1, there are 43 lines aside comments and line spaces hence the RL metric has 43 lines.
2.2. Number of Rule Blocks (NORB)
Number of Rule Blocks (NORB) is calculated as the number of rule blocks in a CSS file. A rule block refers to a selector and its attributes (properties). This is illustrated by the following syntax:
   /* Syntax of a rule block */
   selector [, selector2, …] [:pseudo-class] {
        property: value;
        property2: value2;
        …
        propertyN: valueN;
   }
Usually, a CSS document has at least one rule block.
In the CSS Code Listing 1, there are 10 rule blocks hence the value of NORB is 10.
2.3. Entropy Metric (E)
The concept of entropy is one that has been adopted for software measurements on different occasions [2,3,14]. The entropy of a CSS file with unique classes of elements can be computed using their frequency of occurrence as an unbiased estimate of their probability . The frequency of the equivalence classes of the CSS file is the number of corresponding elements divided by the total number of CSS rule blocks. The unique class of elements means that elements with the same structural complexity are categorized to the same equivalence class (). The entropy value is computed by first finding the equivalence classes by grouping similar rule blocks, which have the same number of attributes.
Finally, the Entropy (E) metric is calculated as follows:
There are seven similar classes as follows:
- C1 = {*, a} = 2 elements
- C2 = {a:hover} = 1 element
- C3 = {body} = 1 element
- C4 = {h2, h3, h4} = 3 elements
- C5 = {{h2, h3, h4}} = 1 element
- C6 = {#content} = 1 element
- C7 = {#footer} = 1 element
Applying the formula we have:
E(CSS) = (2/10)log2(2/10) + (1/10)log2(1/10) + (1/10)log2(1/10) + (3/10)log2(3/10) + (1/10)log2(1/10) + (1/10)log2(1/10) + (1/10)log2(1/10)
= 0.3219 + 0.2303 + 0.2303 + 0.3612 + 0.2303 + 0.2303 + 0.2303
= 1.8346
2.4. Number of Extended Rule Blocks (NERB)
The Number of Extended Rule Blocks (NERB) metric calculates the number of rule blocks that are extended in a CSS file. For instance, in the CSS Code Listing 1 example, rule block a{…} is extended to give a:hover{…}. Hence, the value of NERB is one.
2.5. Number of Attributes Defined per Rule Block (NADRB)
The Number of Attributes Defined per Rule Block (NADRB) metric calculates the average number of attributes defined in the CSS rule blocks. It is calculated as the total number of attributes in all rule blocks divided by the total number of rule blocks.
From the CSS Code Listing 1 example, there are 23 attributes in all the rule blocks combined and there are 10 rule blocks in all, as already established. Hence,
NADRB = 23/10 = 2.3
2.6. Number of Cohesive Rule Blocks (NCRB)
The Number of Cohesive Rule Blocks (NCRB) metric counts all CSS rule blocks having only one attribute.
From the CSS Code Listing 1 example, there are four rule blocks that fulfill this criterion namely: a:hover, h2, h3, and h4. They all possess single attributes within their rule blocks.
3. Validation of the Proposed Metrics
We carry out both theoretical and empirical validation in order to evaluate our proposed CSS metrics. For the theoretical validation, we evaluate the CSS metrics against formal Weyuker’s properties [26,27]. Weyuker’s properties [28] are measures that must be satisfied by every complexity measure in order to be considered as a good and acceptable one. Furthermore, Weyuker’s properties are straightforward and easy to understand [29]. In addition, Weyuker’s properties have been proved as an appropriate measure for evaluation of new complexity measures [29].
We present the description of Weyuker’s properties in the following subsection.
3.1. Theoretical Validation by Weyuker’s Properties
Property 1 implies that a measure should not rank all CSS documents as having an equal complexity:
Property 1.
hereandare programs.
Property 2.
Letbe a non-negative number then there is only a finite number of programs, which have complexity .
Property 3 implies that two distinct CSS files can have the same complexity value.
Property 3.
There are distinct programs andsuch that
Property 4 implies that there can be two equivalent CSS rules achieving the same goal yet having distinct complexity values.
Property 4.
Property 5 states that any subset of a CSS rule is always less than or equal to the value of the entire rule set.
Property 5.
Properties 6a and 6b seek to find out if there are any three CSS rules (, , and ) such that has the same complexity value as and when is joined to each of them they produce different complexity values.
Property 6a.
Property 6b.
Property 7.
If a programis formed by permuting the order of the statements of program, then.
Property 8 means that if semantic renaming of symbols, variables or program does not change the complexity, then this property is satisfied.
Property 8.
Ifis constructed by the renaming of, then.
Property 9 allows for the possibility that as the number of the CSS rules grow, additional complexity is introduced.
Property 9.
3.2. Empirical Validation
Empirical validation is vital to prove the practical usefulness of any metric. According to Reference [30], it is the only way through which researchers can assist industry in selecting a new technology. In order to interpret and comprehend software metrics, calculating appropriate ranges and thresholds of metrics is imperative [31]. Moreover, well-defined thresholds have good relation to software quality [32]. Therefore, researchers have proposed to use statistical characteristics of metrics to obtain their ranges and thresholds [33]. Although, most of software metrics do not follow the normal distribution, normality of distribution is a desired property as it provides more flexibility in calculating metric thresholds [34].
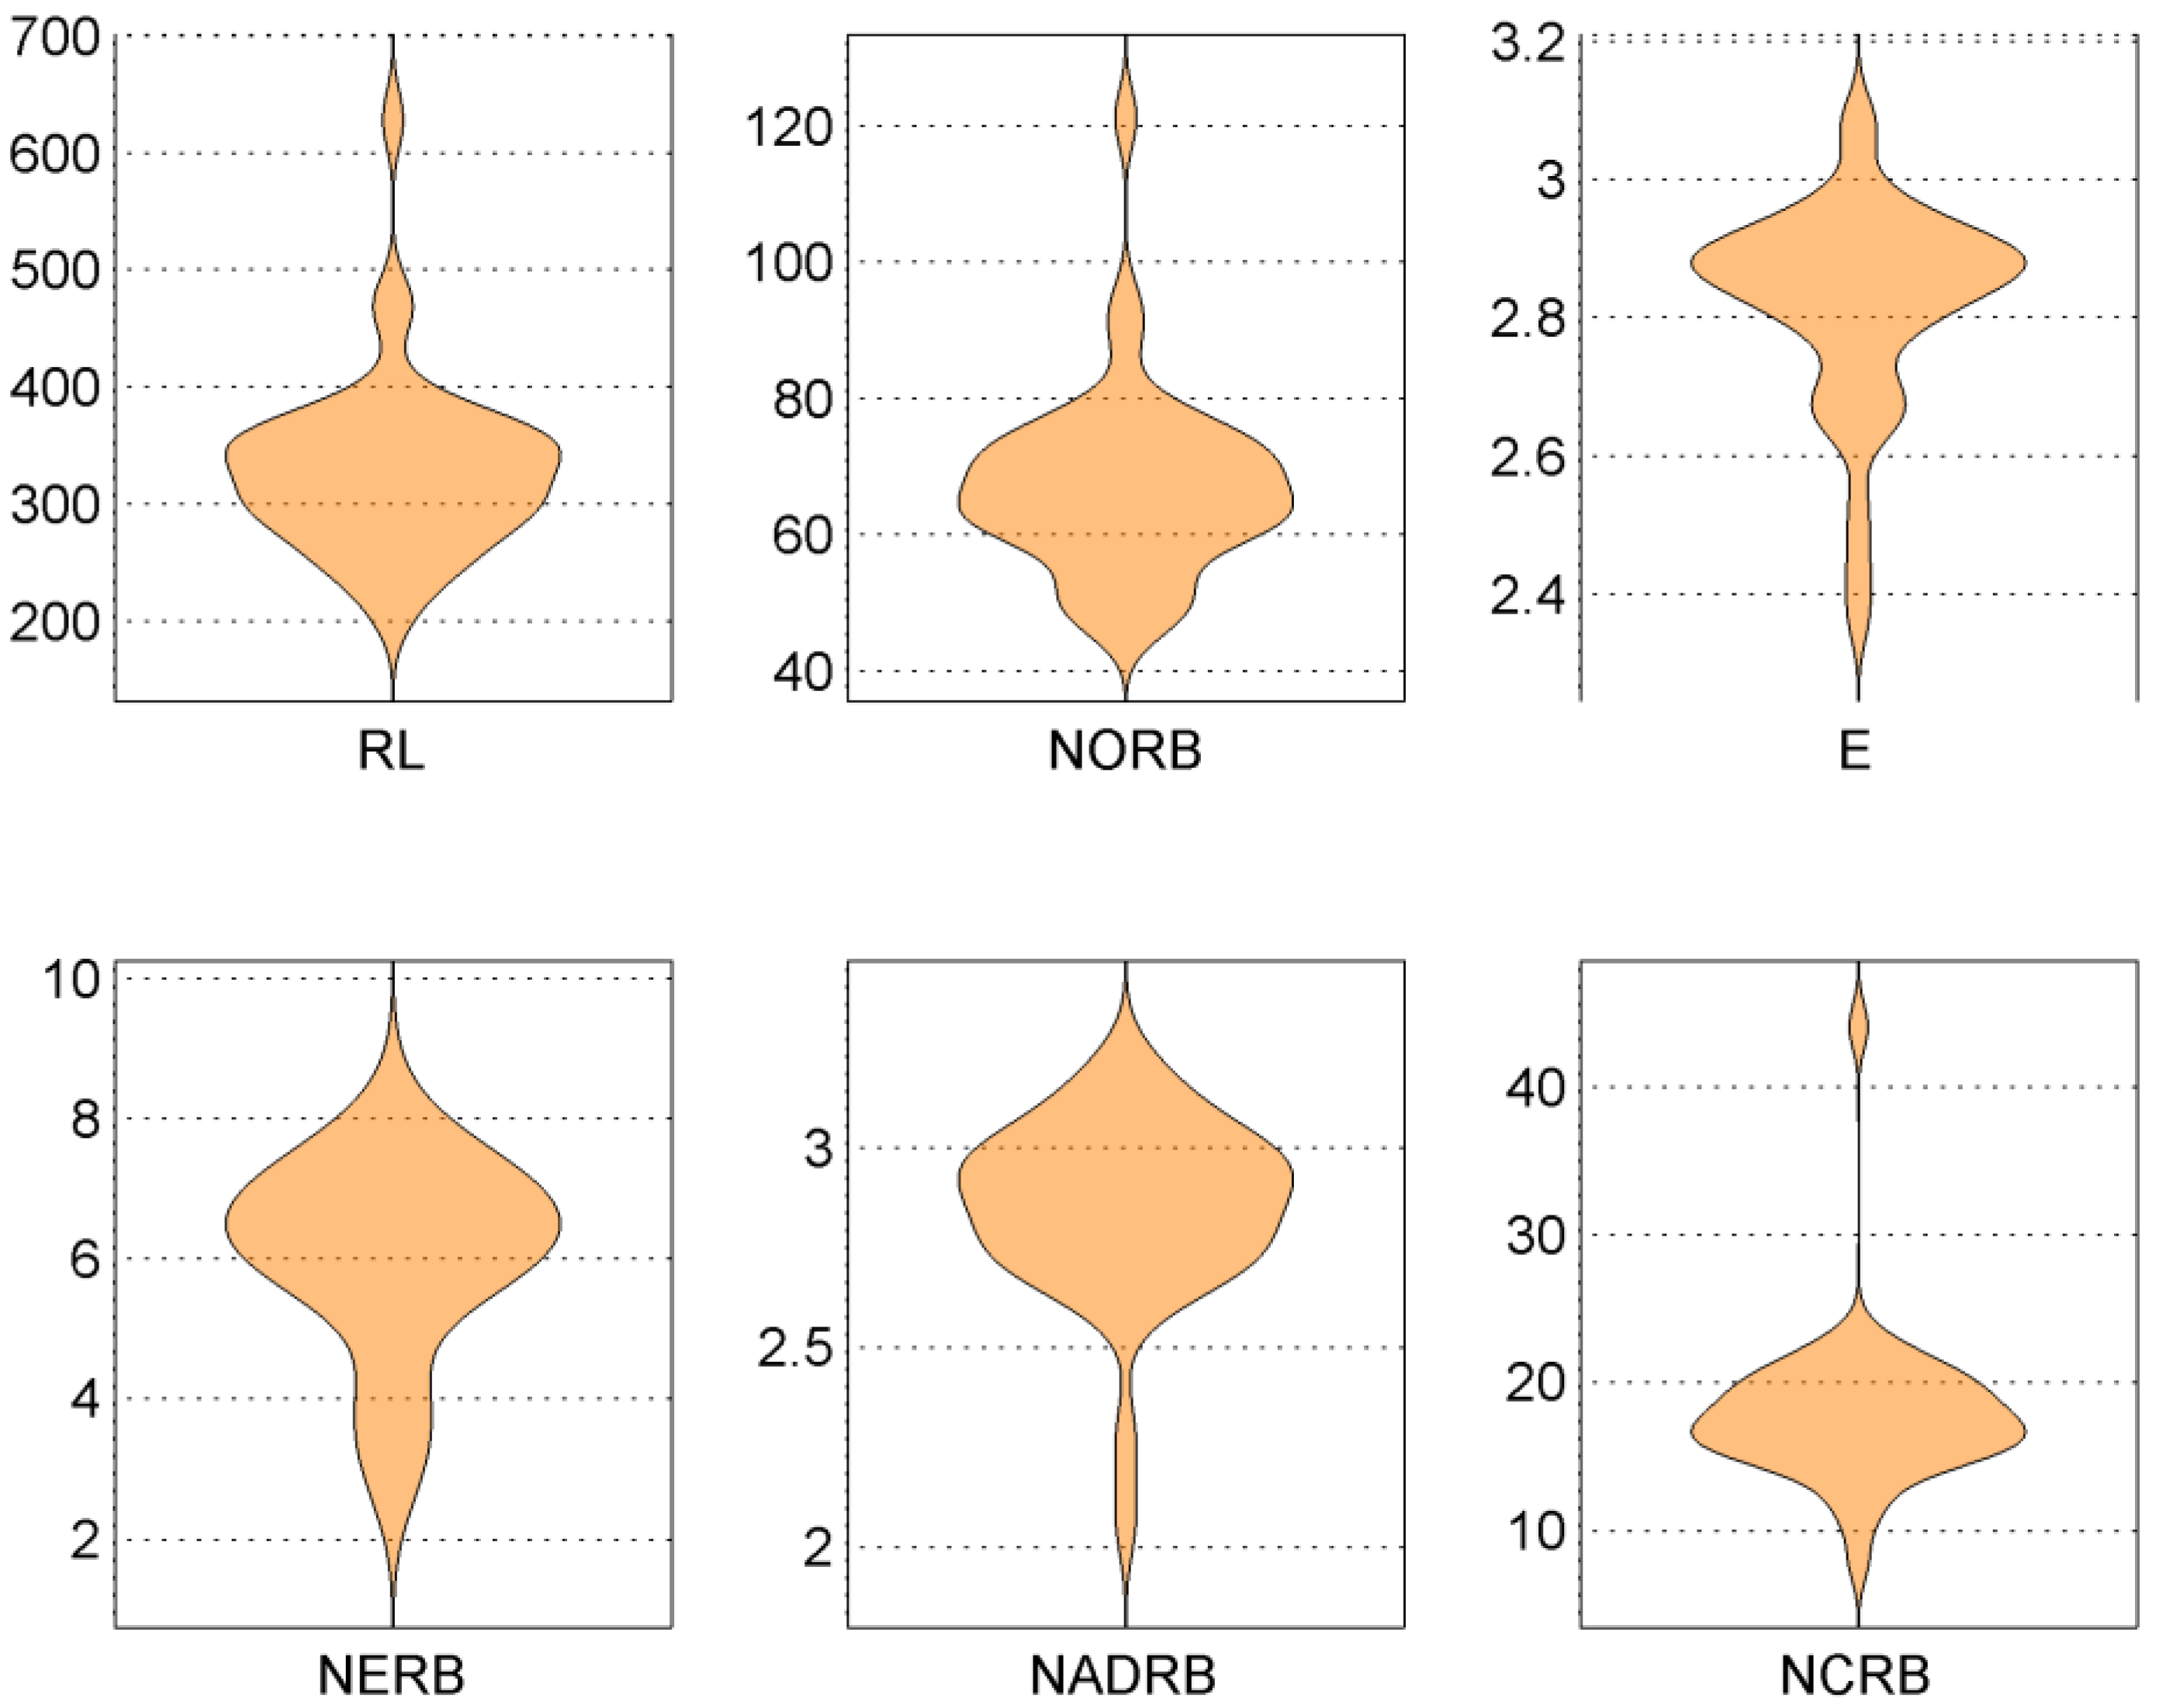
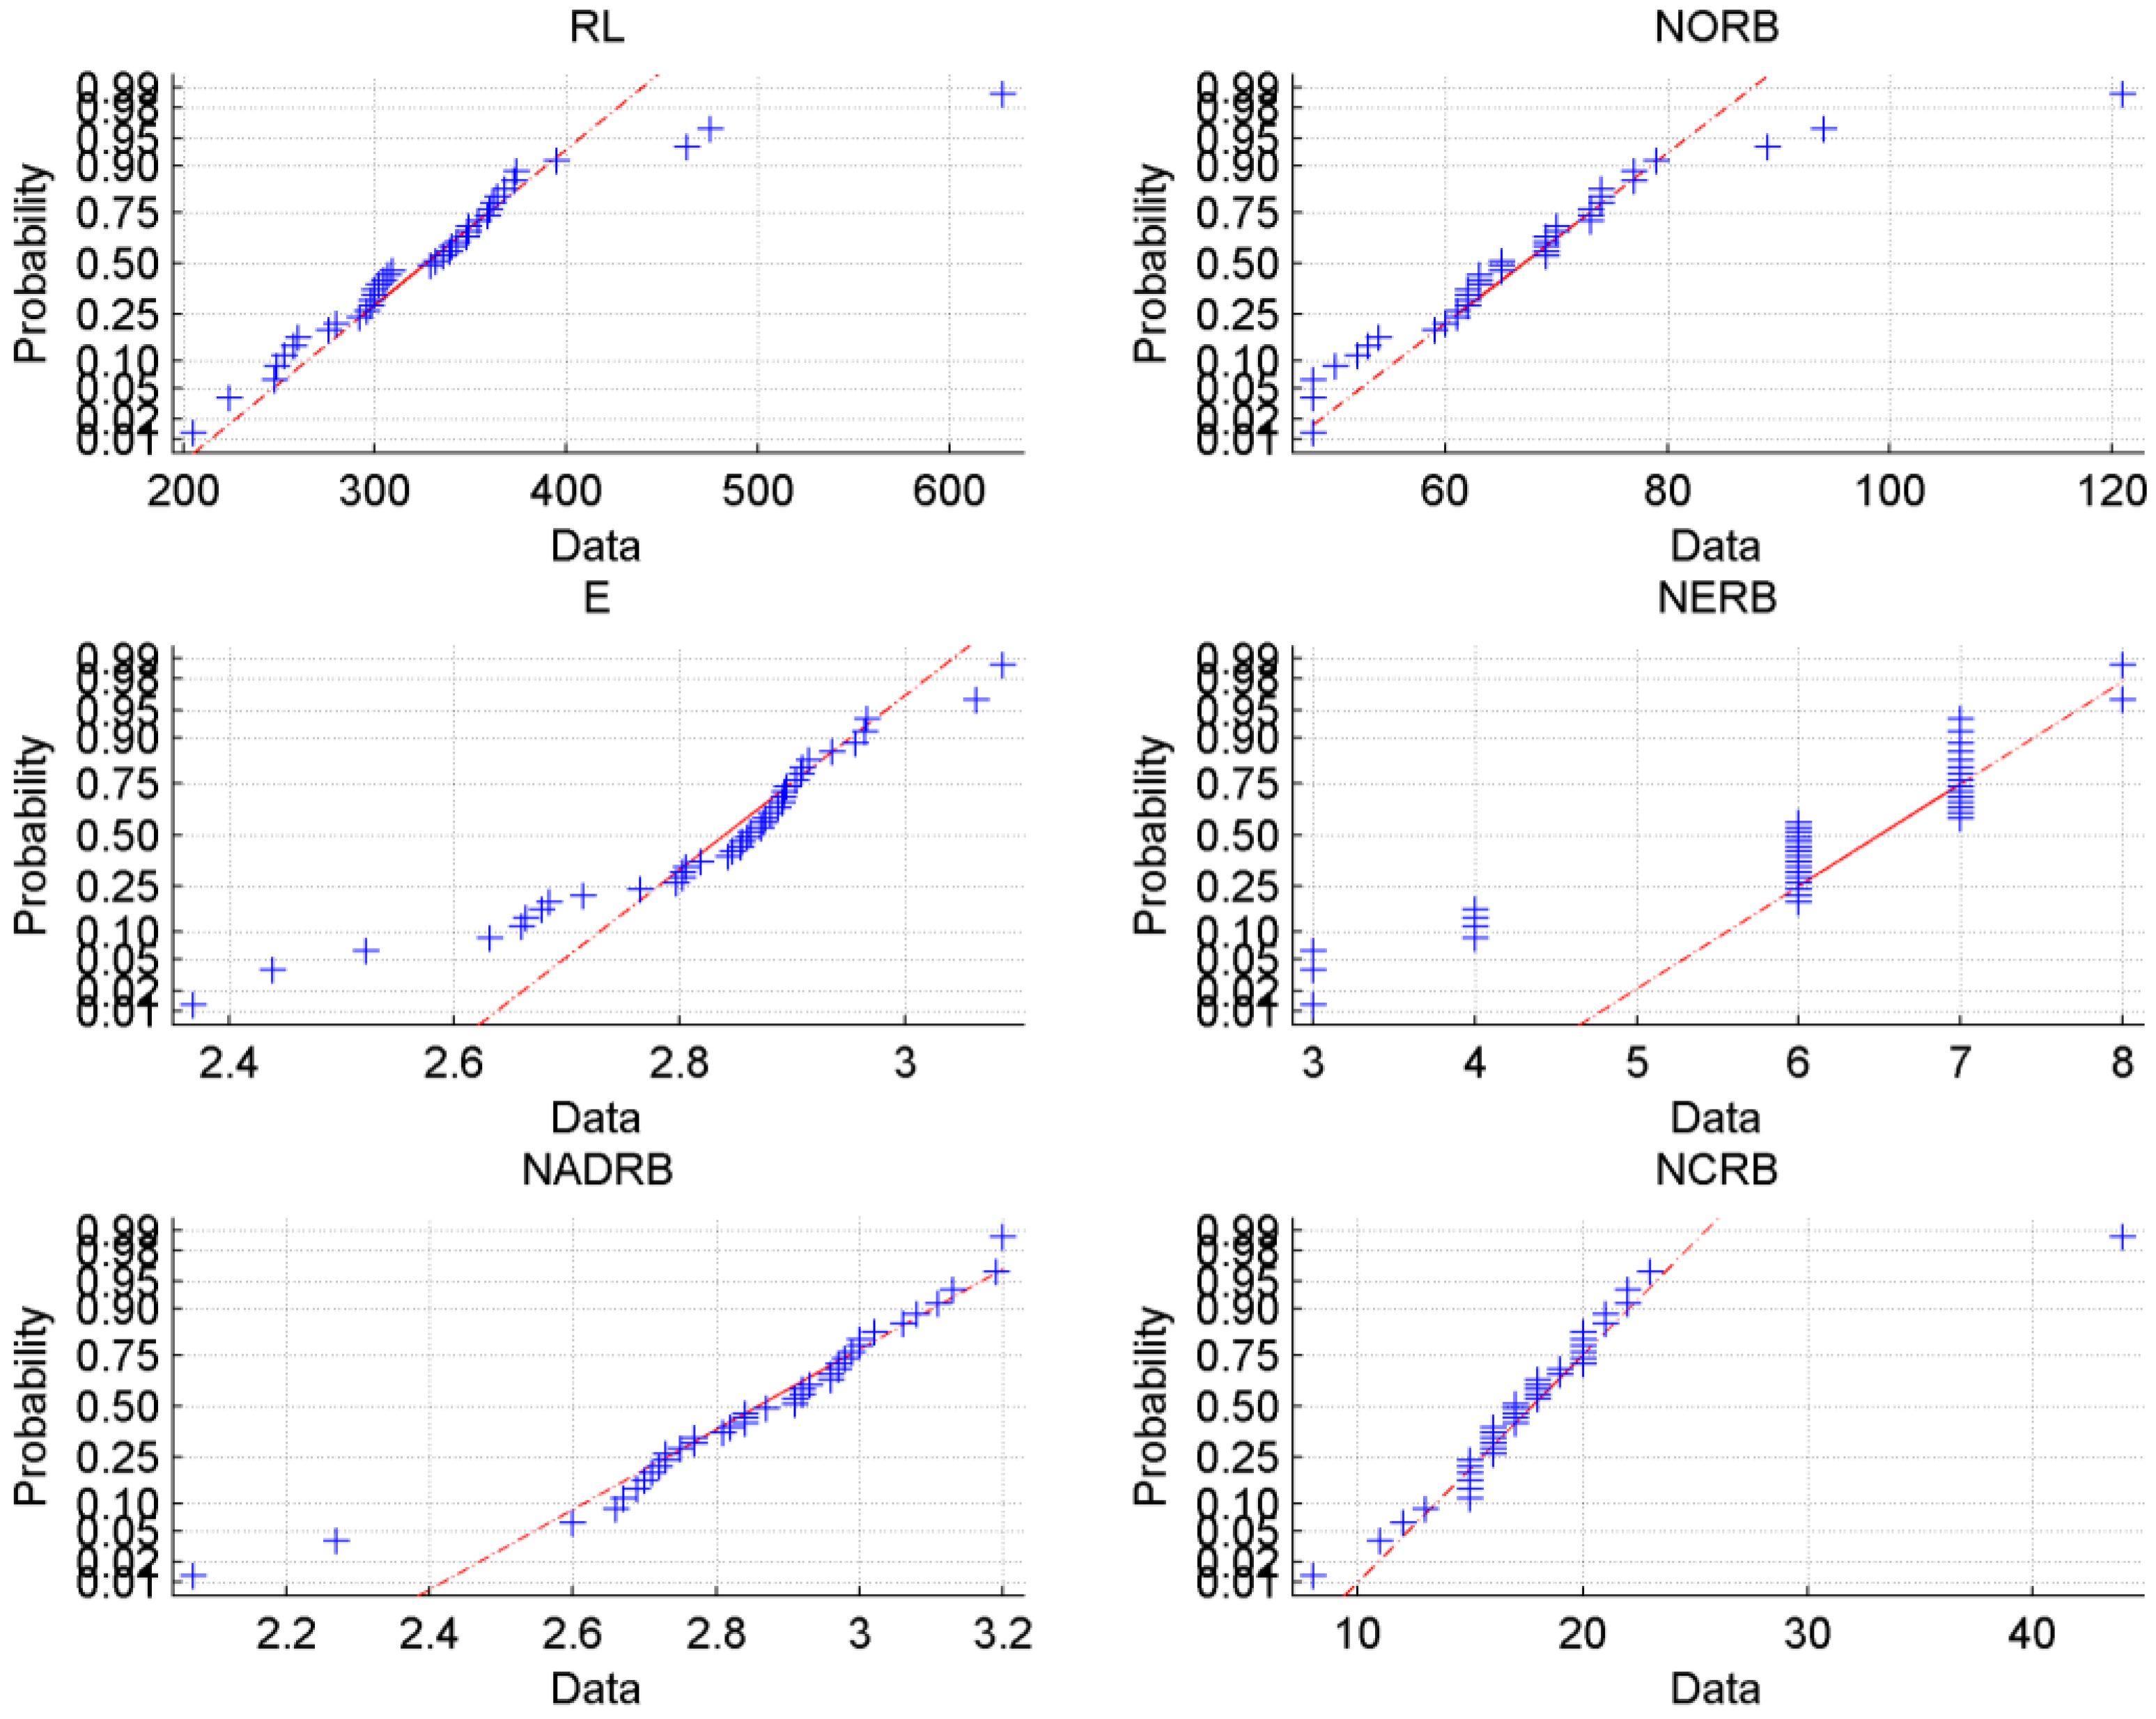
To assess normality of metric values, we follow the recommendations presented in Reference [35]. We use the Q-Q (quantile-quantile) plot graphs the quantiles (i.e., values that divide a data set into equal parts) of the data for checking normality visually. We also use a violin plot (a specific case of a boxplot). A symmetric plot with the median value of the data set placed at approximately the center of the plot suggests that the data may have originated from a Gaussian distribution.
The statistical normality tests are an additional tool to the visual assessment of normality. Here we use the Chi-square test and Lilliefors corrected Kolmogorov-Smirnov (KS) test, as also suggested in Reference [35]. The tests provide a decision for the null hypothesis that the tested data originates from a normal distribution at the 0.05 level of significance.
To assess reliability of metrics, we use the method described in Reference [36]. We divide the metric values randomly into two groups. To compare the distribution of values among both groups, we apply Kruskal Wallis and Mann-Whitney U tests [37] using the 0.05 level of confidence (i.e., p-value < 0.05). Both tests are non-parametric statistical tests that do not assume a Gaussian distribution of data values. We apply the Bonferroni correction to adjust the threshold p-value by dividing it by the number of tests executed. If there is a statistically significant difference (i.e., p-value < 0.05/number of tests), we reject the null hypothesis and report that the division into groups (i.e., the sampling strategy) affects the distribution of values, i.e., the metric is not reliable.
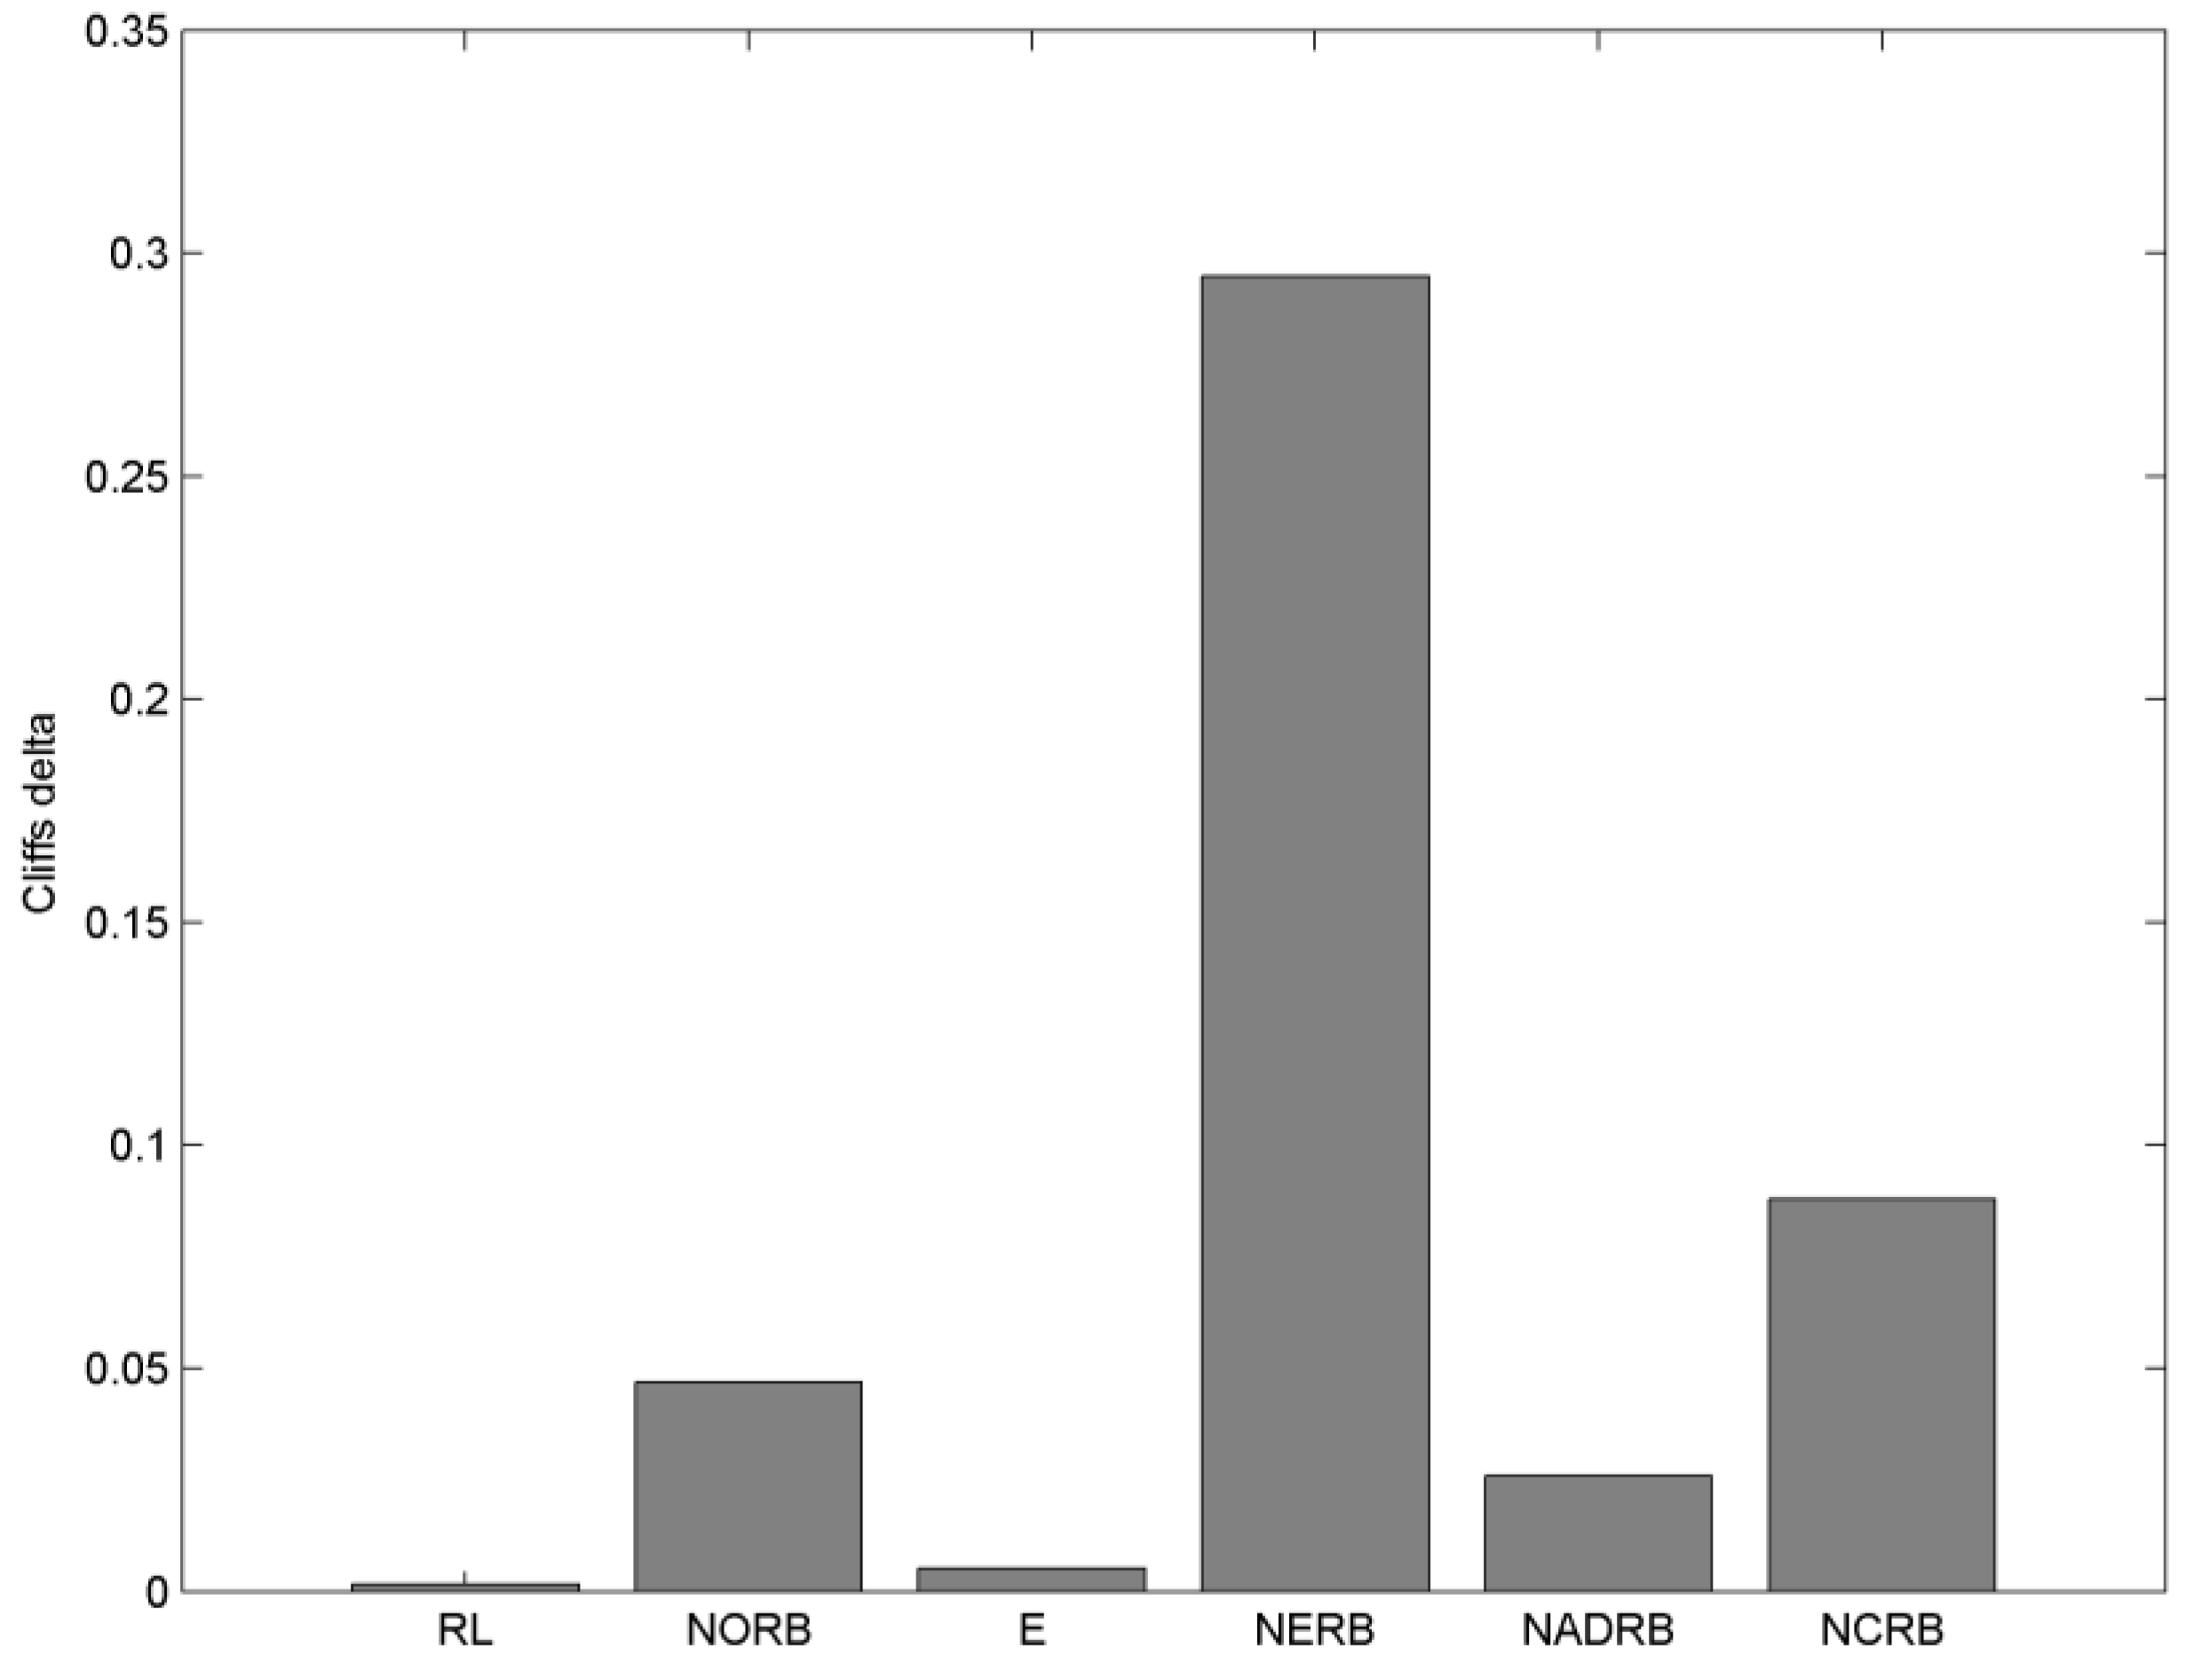
We also use a non-parametric measure of effect size, Cliff’s delta [38], which estimates the probability that a randomly selected value from one group is larger than a randomly selected value from another group, minus the reverse probability as follows:
here and are values within group 1 and group 2, respectively, and are the sizes of groups, and is the Iverson operator. Cliff’s delta values range from 1 to −1, whereas fully overlapping distributions have a Cliff’s delta of 0.
To assess the relationship between metric values and document size, and between the metrics, we use Pearson’s correlation. Following the suggestions presented in Reference [39], values exceeding 0.7 are considered as strong, while values exceeding 0.4 are considered as moderate, while the significance is evaluated using the p-value.
3.3. Assessment of Risk
To evaluate the risk categories of CSS documents associated with their high complexity/low maintainability, we follow the approach presented in [34] (see Table 1).
The 70%, 80%, and 90% percentiles of the metric’s values are used as thresholds to assign the categories of low, moderate, and high risk. The low risk category is assigned a risk value of 0, the moderate risk category is assigned a risk value of 0.5, and the high risk category is assigned a risk value of 1. Finally, the aggregate risk is calculated as an average of risk values across all metrics.
4. Results
4.1. Dataset
For the empirical validation of our proposed metrics, we analyzed a dataset of forty CSS documents randomly downloaded from a popular CSS template site—https://templated.co/.
Table A1 in Appendix A shows the links to all the CSS files used in this evaluation. A tool was developed to analyze and retrieve the RL, NORB, NADRB, and NCRB metric values of the CSS dataset files.
The measures of the analyzed CSS documents are given in Table 2.
4.2. Performance of the Measures against Weyuker’s Properties
Table 2 gives the summary of the performance of the proposed CSS metrics against formal Weyuker’s properties. Here, ‘*’ means that a measure satisfies a Weyuker property, and ‘-’ means that the measure does not satisfy a Weyuker property.
As we can see from Table 2, different CSS documents have different RL, NORB, E, NERB, NADRB and NCRB values. Though some of the CSS documents had similar values for some metric, it was not the case for all the CSS documents. Hence, Property 1 is satisfied by our metrics suite.
Property 3 implies that it is possible for two distinct CSS files to have the same complexity value. As can be observed in Table 2, different CSS documents have the same RL (e.g., CSS documents 4 and 16), NORB (e.g., CSS documents 1, 9 and 17), E (e.g., CSS documents 11 and 16), NERB (CSS documents 1, 29 and 40), NADRB (e.g., CSS documents 3 and 12), and NCRB values (e.g., 1, 25, 27, 35, 38, and 40) and hence Property 3 is also satisfied by all the proposed measures.
All the proposed metrics are independent of the arrangement or rearrangement of rule blocks in a CSS rule. In other words, permuting the order of the rule blocks in the CSS will not cause a change in the measures. Therefore, none of our metrics satisfy property 7.
Property 8 means that if semantic renaming of symbols, variables or program does not change the complexity, then this property is satisfied. Renaming of CSS documents does not modify the metric value. As a result, Property 8 is satisfied by all our metrics.
Therefore, all the proposed CSS metrics satisfy properties 1, 2, 3, 5, 8; while none of our metrics satisfy properties 4, 7, and 9 (Table 3).
Our metrics satisfy five out of nine Weyuker’s properties which indicates that our measure is a good measure. It is worth mentioning that for a measure to be rated as good and acceptable, it is not mandatory to fulfill all the properties [40].
4.3. Empirical and Statistical Evaluation Results
To assess distribution of the metric values we used the visual approach: the violin plots of the metric values are presented in Figure 1 while the Q-Q plots are presented in Figure 2. We can see that although the distribution of all metric values is skewed, they are still similar to normal distribution as they have a single maxima and tails. The observation is confirmed by the Q-Q plots, which clearly show a linear relationship between quantile values of metrics.
The statistical tests of Chi-square and Liliefors rejected the normality hypothesis for the RL, E, NERB and NCRB metrics, while the results for the NORB and NADRB metric were mixed (hypothesis not rejected but the p-values exceeded a threshold value of 0.05). The results suggest the need for applying normalization transform to the values of metrics to make them more usable.
The results of Cliff’s delta are presented in Figure 3. Following the rule-of-thumb given in [41] the metric values smaller than 0.1 are considered as acceptable. In our case, only the NERB metric has exceeded the value of 0.1
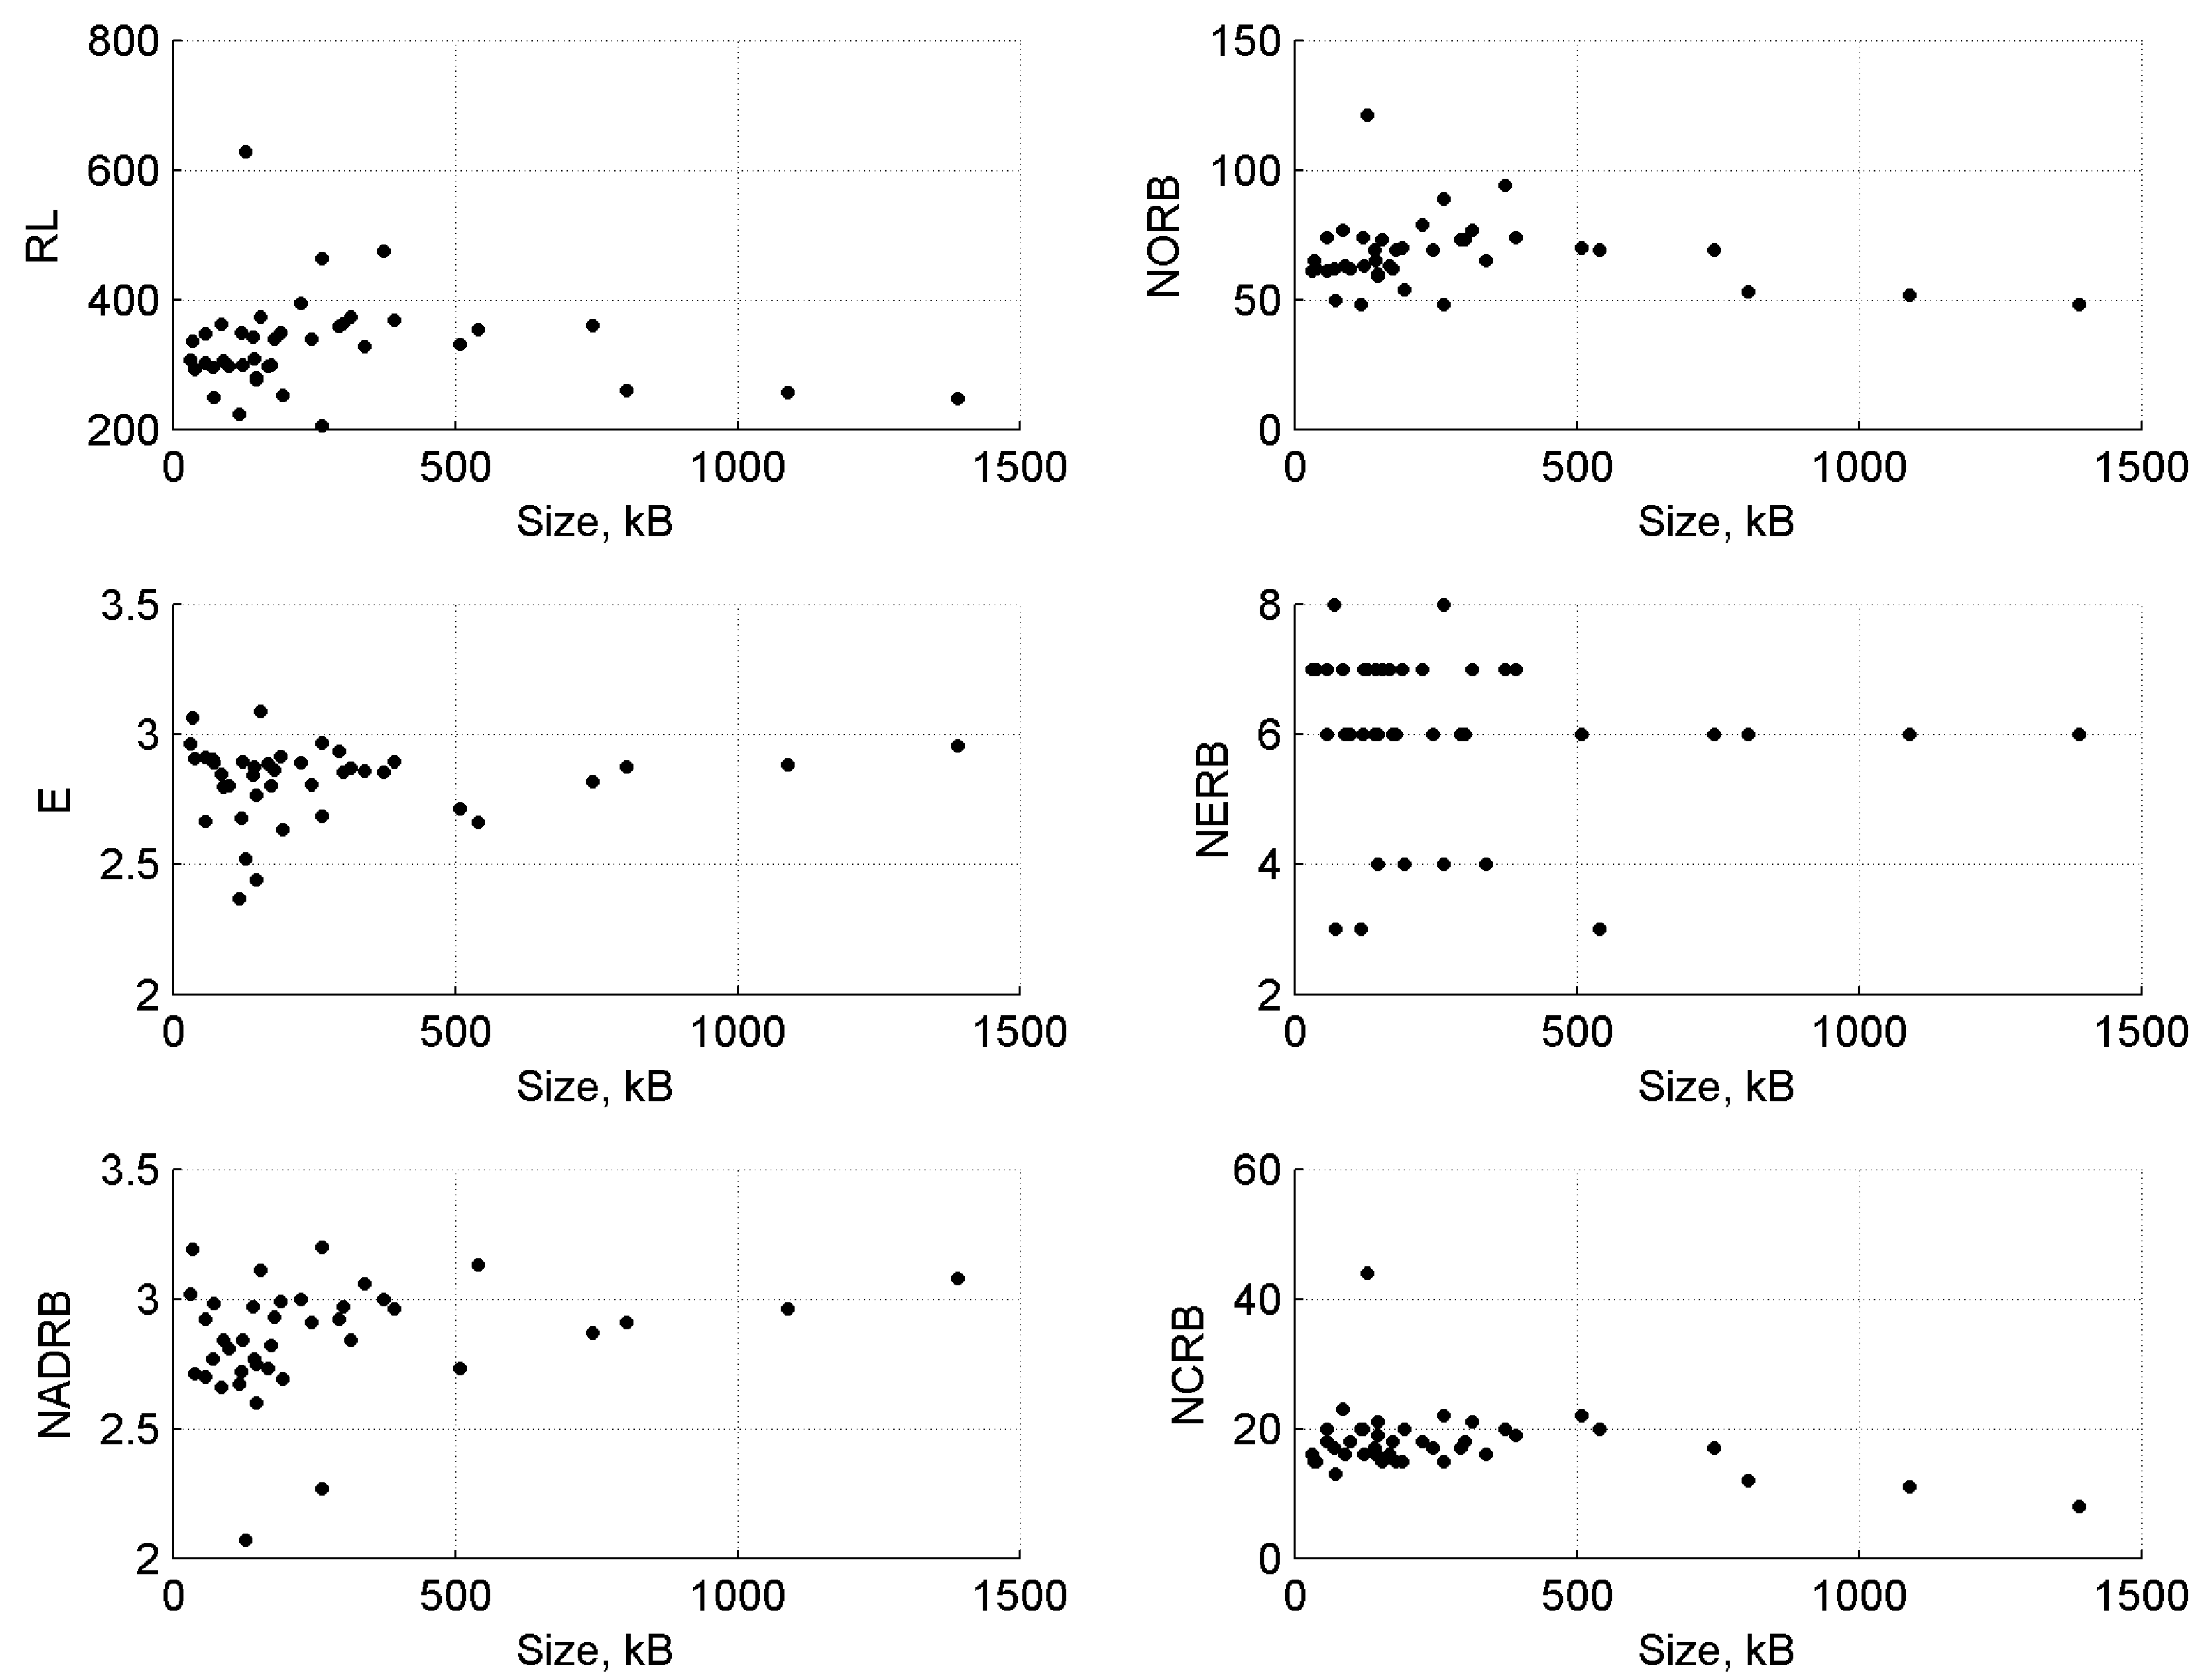
Following the suggestions presented in [42], complexity metrics should not be confused to size metrics, because correlation to size can produce a wrong impression that some metrics are valid. Moreover, asserted size has a confounding effect on the metric validity [43]. To check for the absence of correlations, we employed both a visual approach (see Figure 4) as well as calculated Pearson correlation between CSS metric values and the CSS document sizes (in kB) (see Figure 5).
From visual inspection, we can observe small effects of the size of the CSS documents on the values of CSS complexity metrics. The results are confirmed by the Pearson correlation values, which show insignificant correlation to metric values (RL, NORB, NERB NCRB metrics—negative correlation; E, NADRB—positive correlation). In all cases, the coefficient of determination was insignificant ().
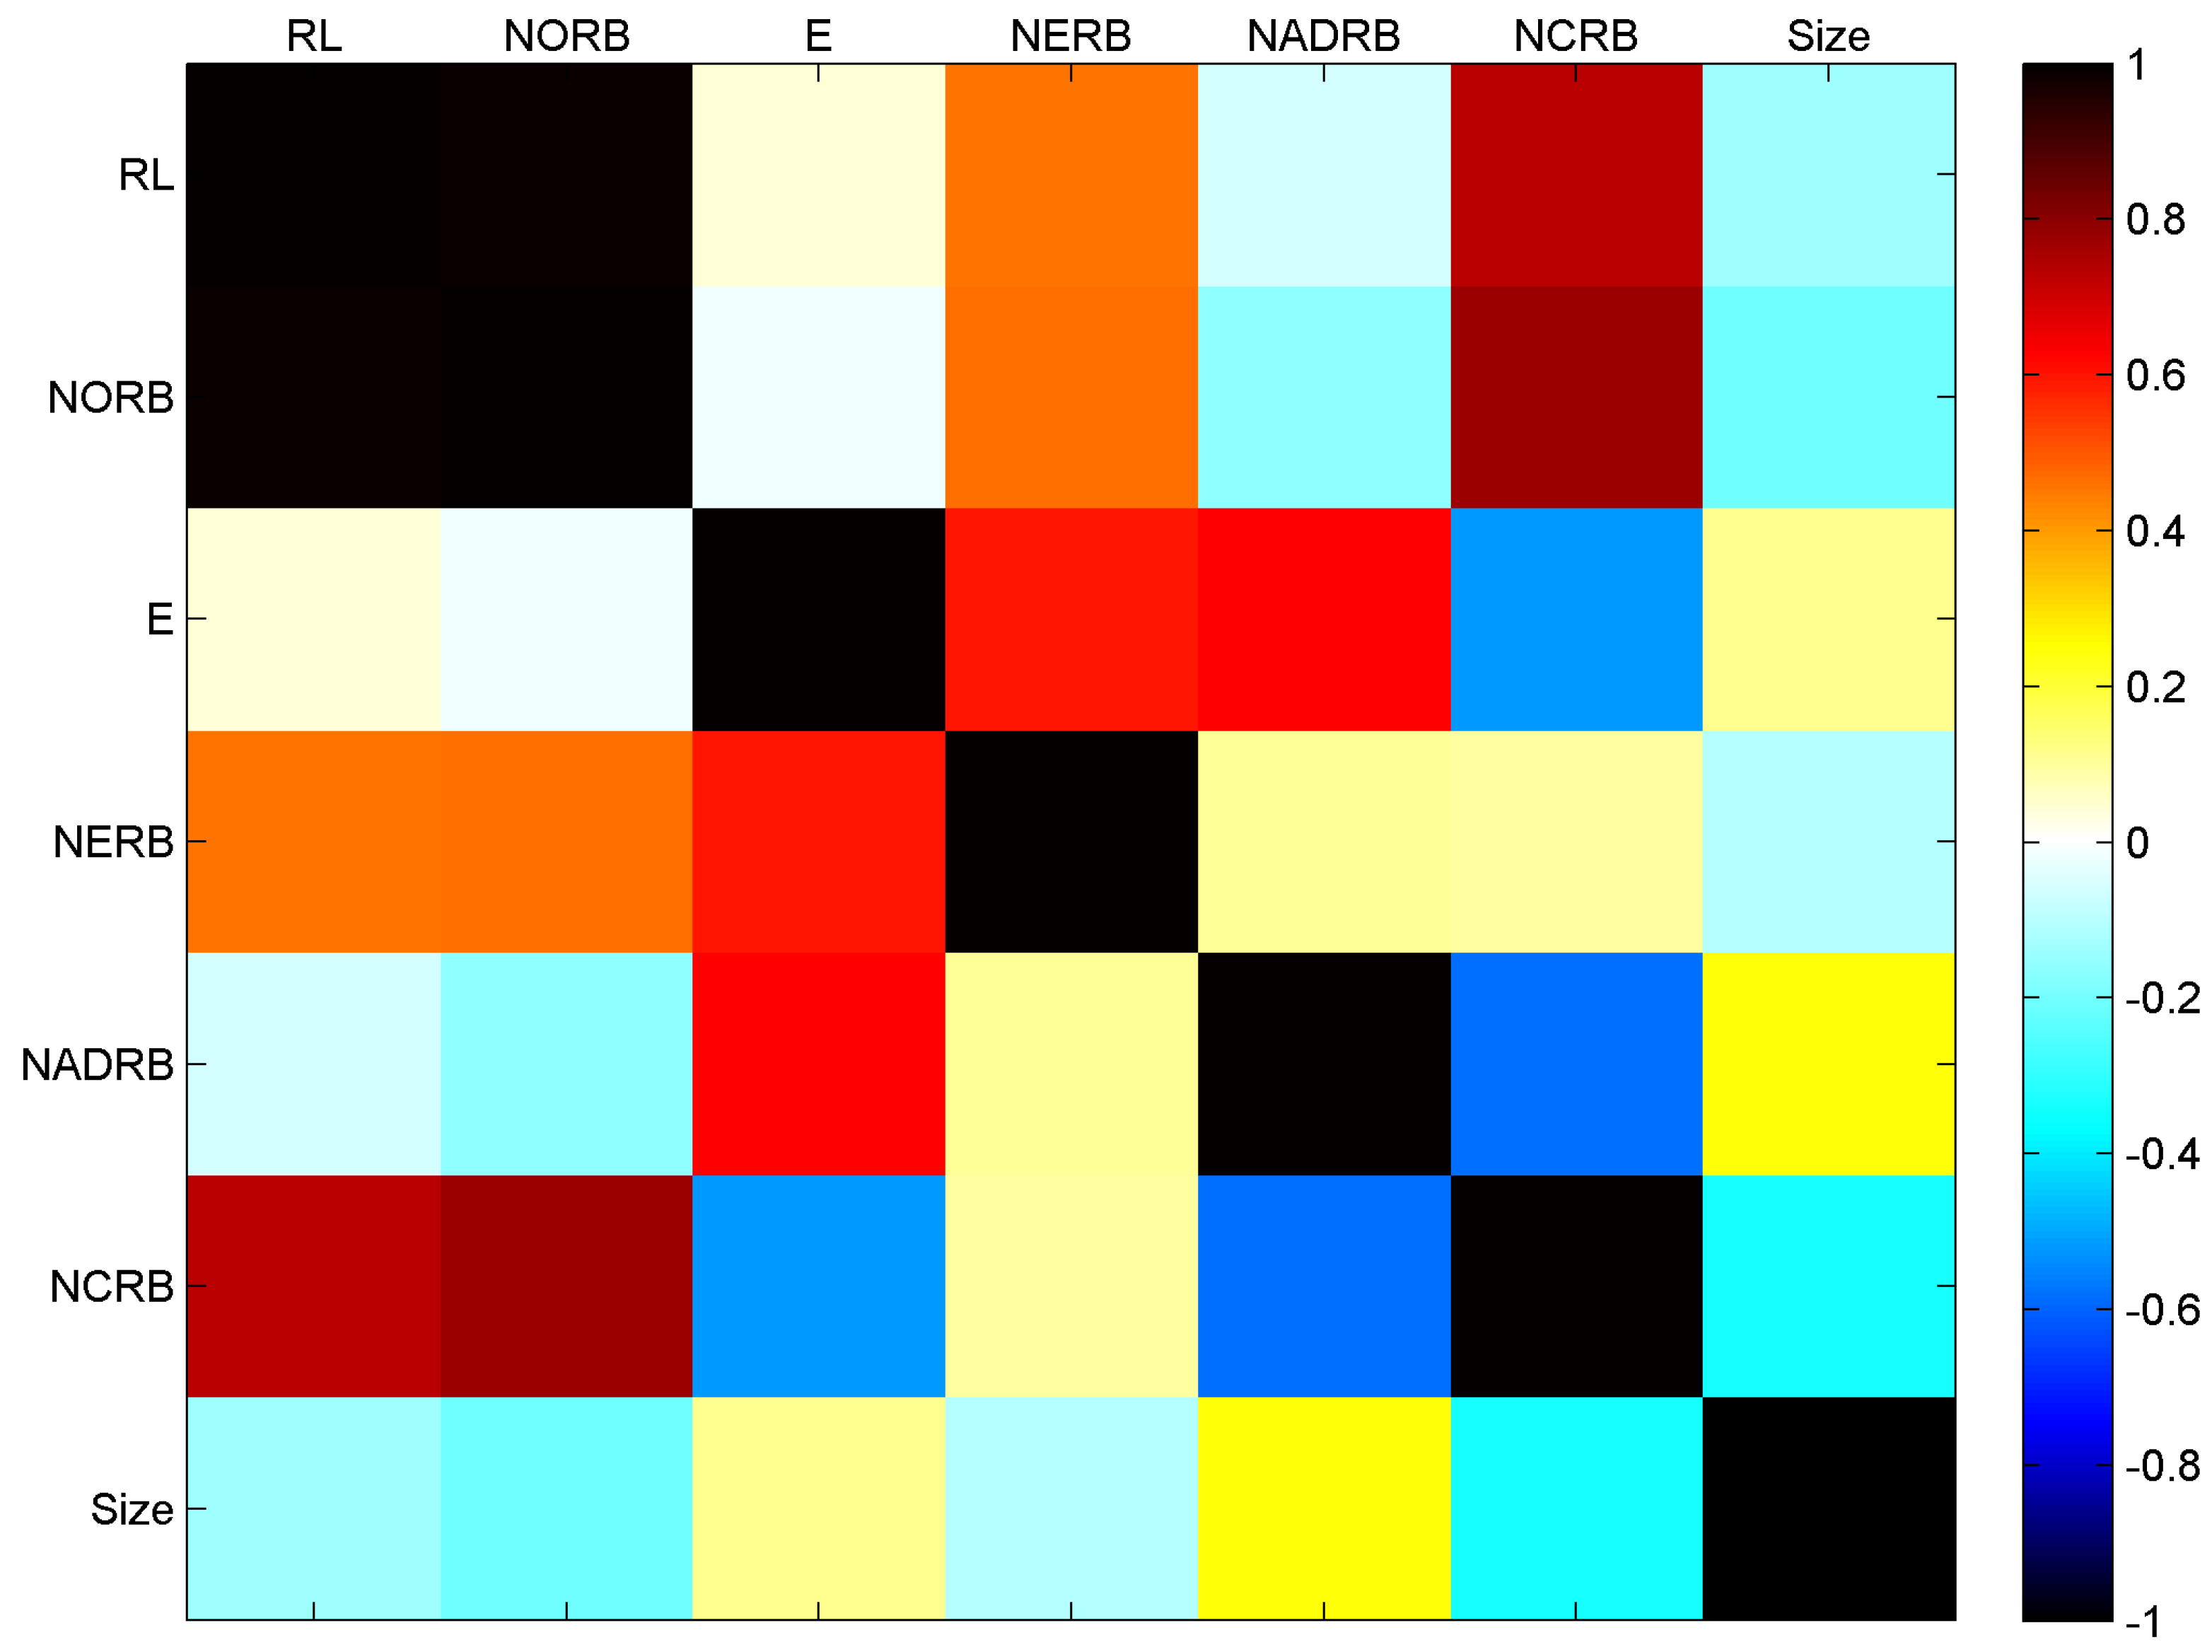
Correlation between metric values in the metric suite is considered bad as correlated metrics, e.g., can skew the results of some applications such as defect prediction, while removing correlated metrics from the metric suite improves the consistency [44]. From the correlation matrix presented in Figure 5 we can see that strong correlations are observed between the RL and NORB metrics (), NORB and NCRB (), RL and NCRB (). Moderate correlations are observed between E and NADRB (), E and NERB (), NADRB and NCRB (), E and NCRB (), NORB and NERB (), RL and NERB ().
These results suggest that the metric suite is redundant and one or two metrics could be removed without the significant loss of information.
4.4. Threats to Validity
We follow guidelines provided in Reference [45] in discussing the threats to validity of our study.
Threats to internal validity involve selection of systems and analysis methods. We randomly have sampled 40 CSS documents from the templated.co CSS repository. As a result, our findings might be definitive to CSS documents hosted on https://templated.co/ only.
Threats to external validity involve the generalization power of our results. Our findings might not be directly applicable to other types of style sheet languages. Yet our approach can be useful for benchmarking quality and maintainability of web applications.
Threats to reliability validity include the ability to replicating this study. We have attempted to report all the necessary information to allow replication of our study.
Threats to conclusion validity address the relation between the selection of the dataset and the result. As noted by Gil and Lalouche [4], code metrics are context dependent and the distribution of their values in different projects varies. The selection of CSS documents involved arbitrary decisions. Including other CSS documents may have changed the statistical properties of the calculated metric values.
4.5. Discussion
Software metrics are important for evaluation of software maintainability. Developing software programs that are less complex and more maintainable means that these programs (or programming artefacts, such as data files or specifications as CSS, in general) have a lower probability of bugs, are more stable and have a longer prospective lifecycle [46]. Having the ability to evaluate maintainability early enough by calculation of software metrics can help to avoid costly repairs in the future as well as to improve the availability of critical software systems [47] such as, for example, online banking systems, which among other heavily use and depend upon CSS documents. The primary role of the proposed metrics suite is, therefore, to be a part of the risk assessment process when evaluating and predicting the risk of failure of online systems and websites [48]. Software metrics that indicate potential software failures, are in high demand in the areas of software testing and maintenance, when developing complex software-intensive systems.
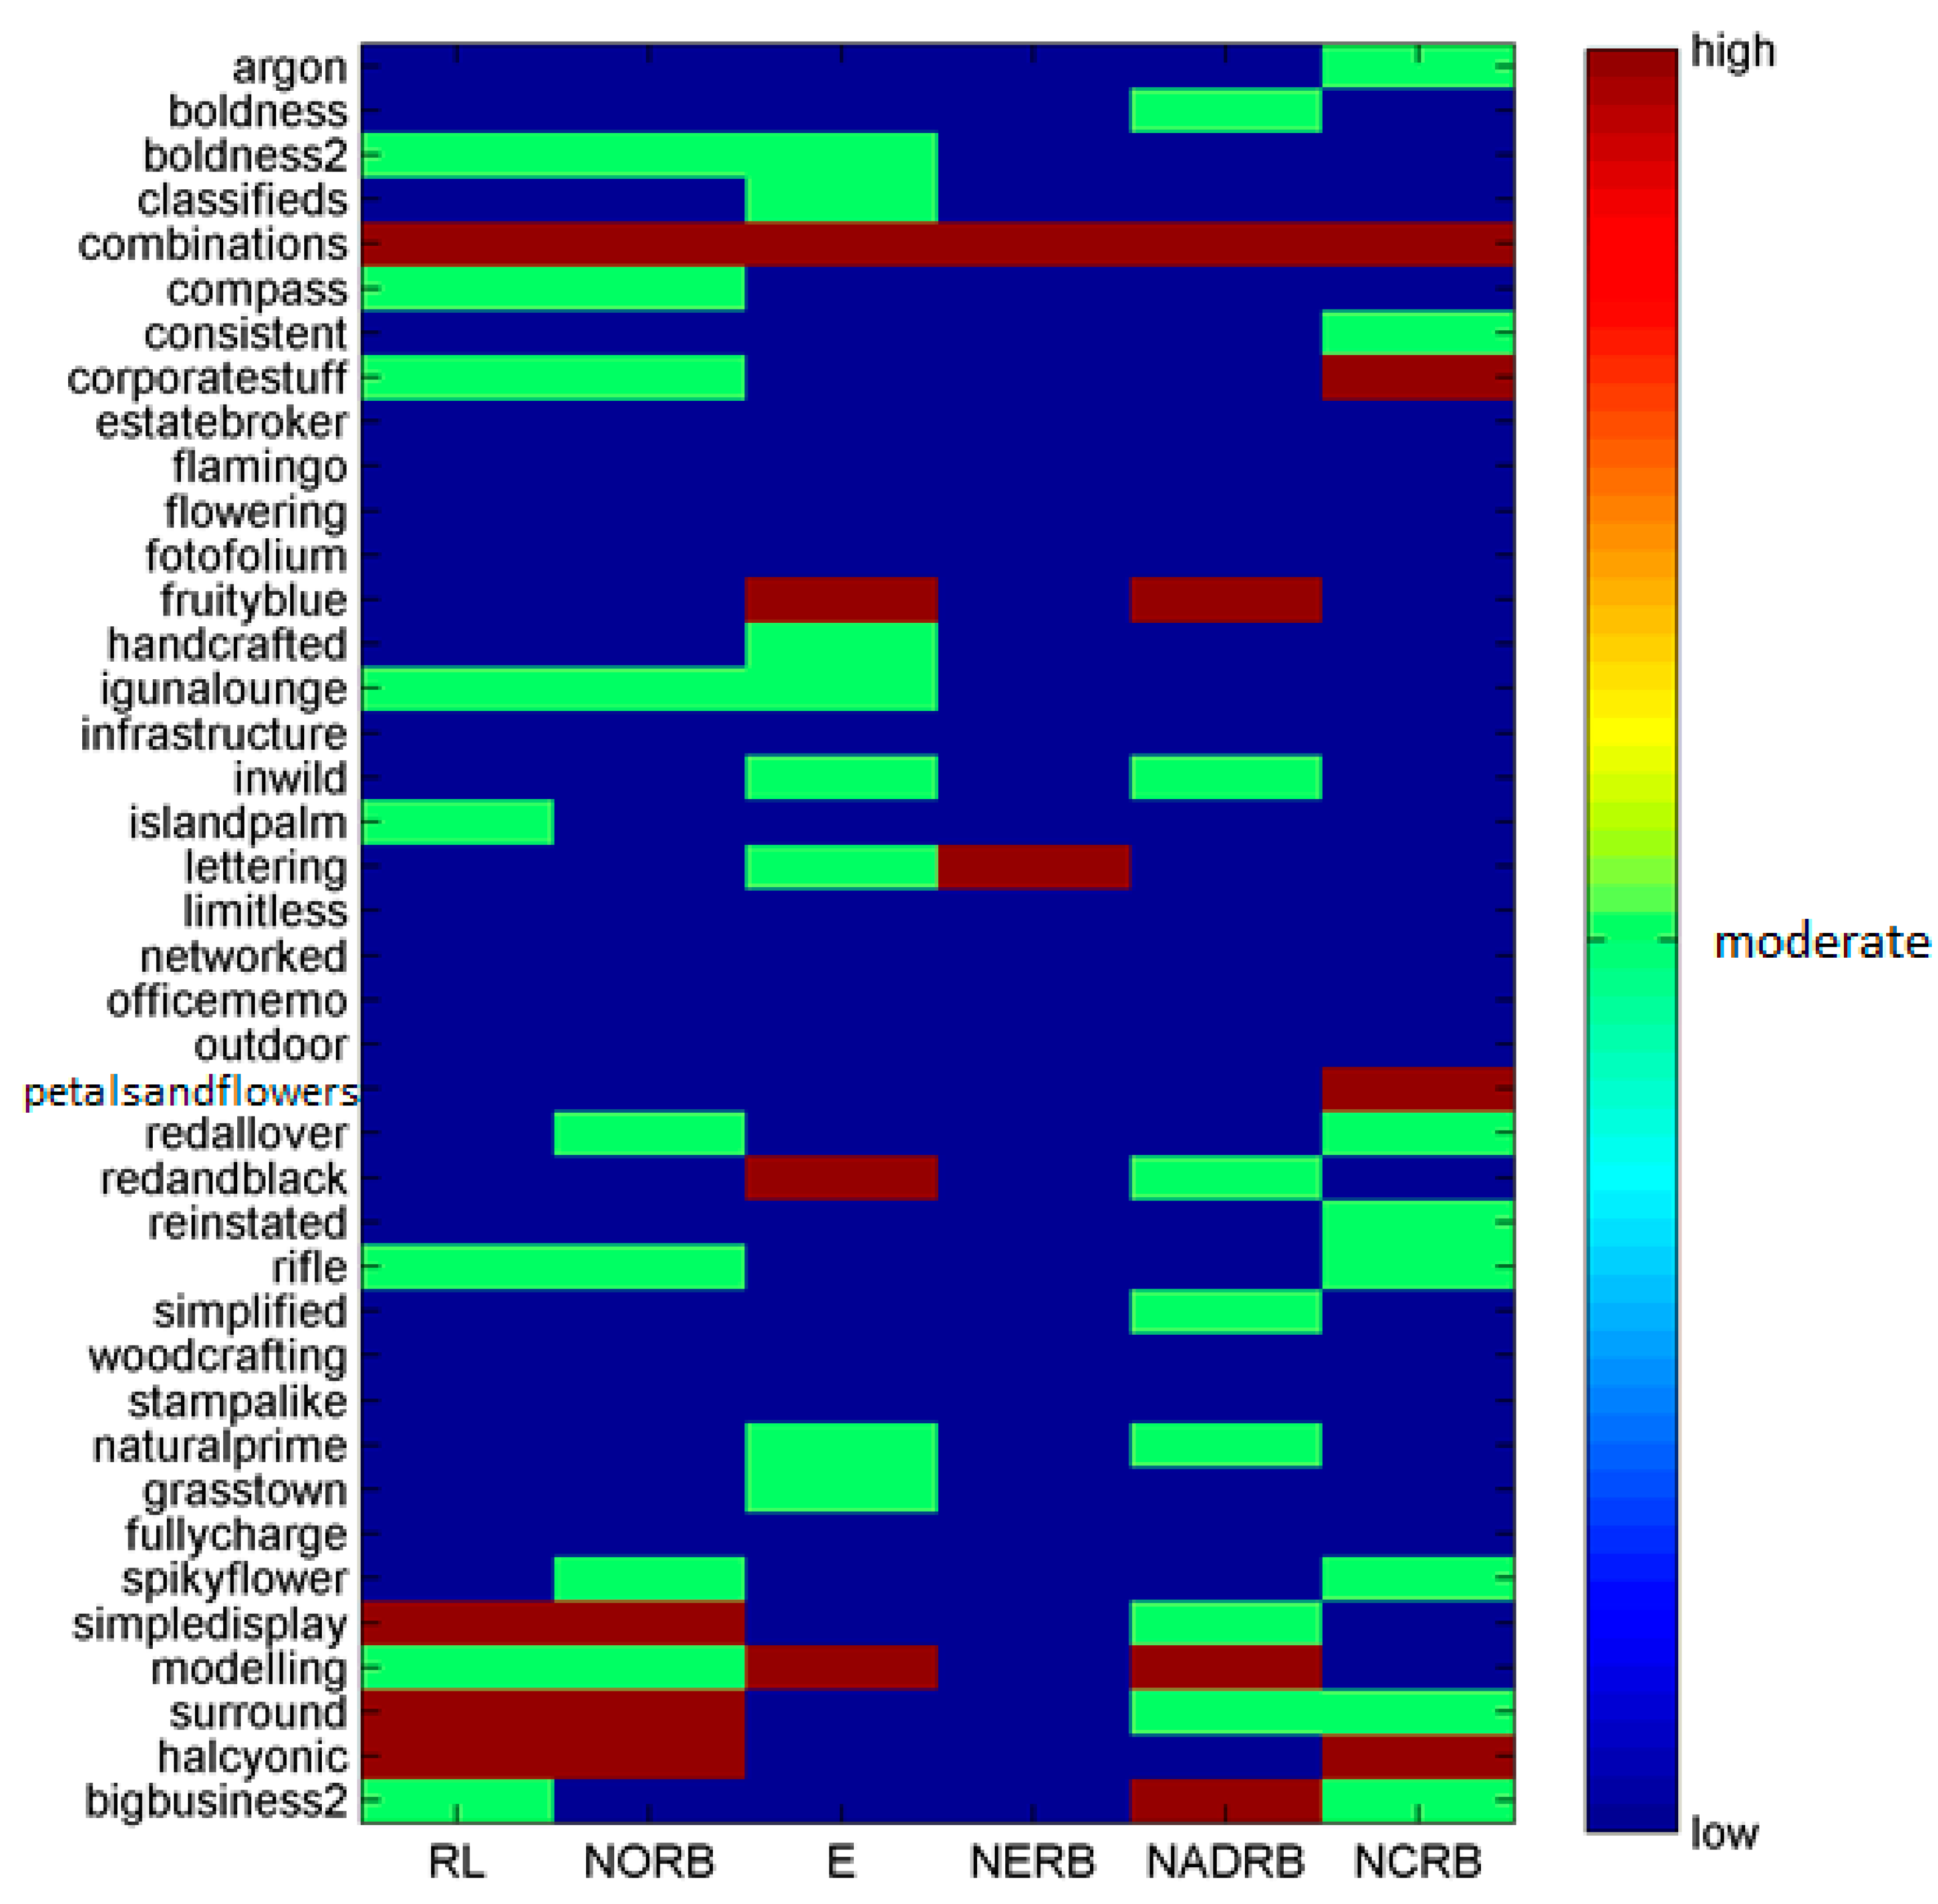
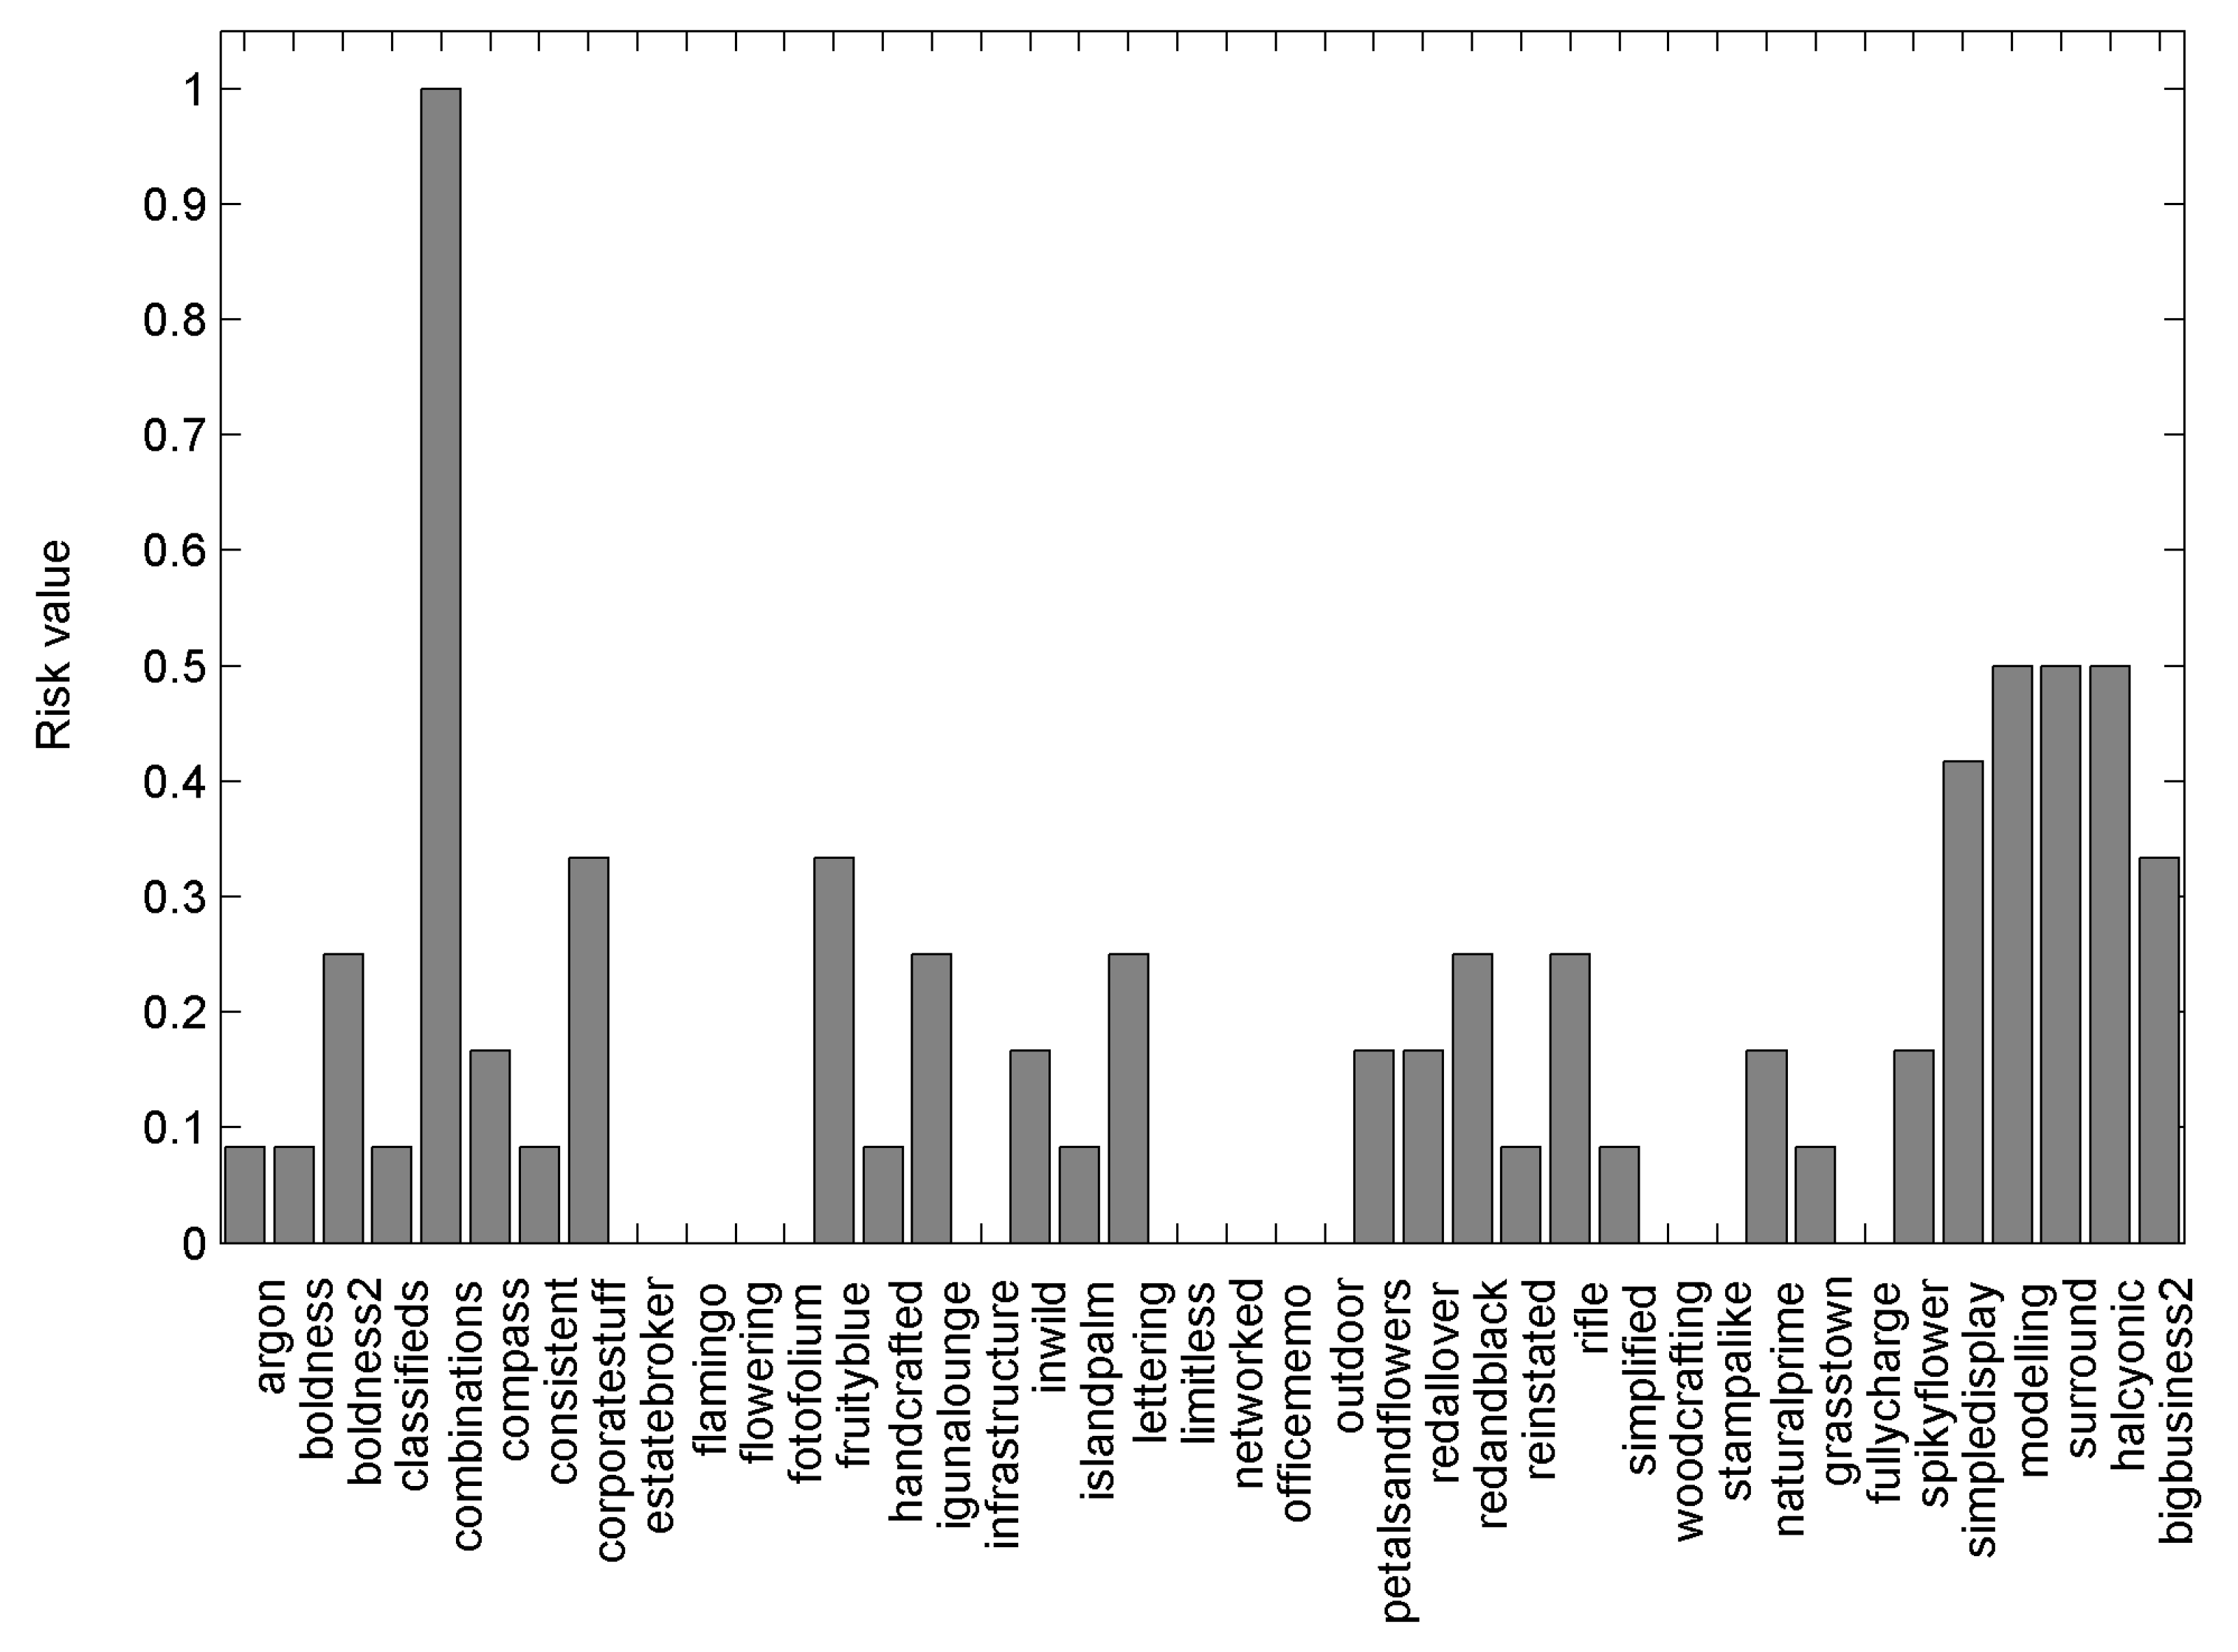
As an example, we present the risk assessment results in Figure 6 and Figure 7. The results show that the combinations component of the CSS dataset exceeds threshold values of all CSS metrics and is assigned to the high-risk category, suggesting the immediate need for attention by software maintainability personnel.
In future, we plan to develop a tool to estimate the various metrics as the other previous tools are not comprehensive and also integrate the suite into one comprehensive metric that can be used in estimating the complexity of CSS documents as well as documents written in other stylesheet languages such as Sass (Syntactically awesome style sheets) for web application developers in the context for risk assessment framework for online systems and applications.
5. Conclusions
In this article we have presented and analyzed six metrics—Rule Length (RL), Number of Rule Blocks (NORB), Entropy Metric (E), Number of Extended Rule Blocks (NERB), Number of Attributes Defined per Rule Block (NADRB), and Number of Cohesive Rule Blocks (NCRB), which can be used to assess complexity in Cascading Style Sheets (CSS).
These metrics were theoretically and empirically validated using Weyuker properties: five out of the nine metrics (56%) satisfy the Weyuker properties, except for the NADRB metric, which satisfies six out of nine (67%) properties. This qualifies them as good metrics from a formal viewpoint. In addition, the results from the empirical and statistical study show good statistical distribution characteristics (only the NERB metric exceed the rules-of-thumb threshold value of Cliff’s delta). The correlation between the metric values and the size of CSS documents was insignificant, suggesting that the presented metrics were indeed complexity rather than size metrics. However, the correlation analysis of metrics within the presented metric suite revealed cases of redundancy suggesting that the optimization of the suite by removing one or two metrics is possible.
The practical application of the presented CSS complexity metric suite is to assess the risk of CSS documents. The analysis of our CSS dataset allowed identification of the CSS file that would require immediate attention of the software maintenance personnel.
Author Contributions
Conceptualization, S.M.; Formal analysis, S.M.; Investigation, A.A.; Methodology, S.M.; Software, A.A.; Supervision, S.M.; Validation, S.M.; Visualization, R.D.; Writing—original draft, A.A. and S.M.; Writing—review & editing, R.D.
Funding
This research received no external funding.
Conflicts of Interest
The authors declare no conflict of interest.
Appendix A

Table A1.
The analyzed CSS document IDs and associated Web Links.
References
- Pressman, R.S. Software Engineering: A Practitioner’s Approach; McGraw-Hill: New York, NY, USA, 2005. [Google Scholar]
- Kumari, M.; Misra, A.; Misra, S.; Sanz, L.F.; Damasevicius, R.; Singh, V.B. Quantitative quality evaluation of software products by considering summary and comments entropy of a reported bug. Entropy 2019, 21, 91. [Google Scholar] [CrossRef]
- Gupta, A.; Suri, B.; Kumar, V.; Misra, S.; Blažauskas, T.; Damaševičius, R. Software code smell prediction model using shannon, rényi and tsallis entropies. Entropy 2018, 20, 372. [Google Scholar] [CrossRef]
- Gil, J.Y.; Lalouche, G. When do software complexity metrics mean nothing?-when examined out of context. J. Object Technol. 2016, 15, 1–25. [Google Scholar] [CrossRef]
- Wang, Y. On Cognitive Informatics. In Proceedings of the Second IEEE International Conference on Cognitive Informatics (ICCI 2002), London, UK, 20–20 August 2003. [Google Scholar]
- Misra, S.; Akman, I.; Koyuncu, M. An Inheritance Complexity Metric for Object Oriented Code: A Cognitive Approach. SADHANA 2011, 36, 317–338. [Google Scholar] [CrossRef]
- Misra, S.; Akman, I. Weighted Class Complexity: A Measure of Complexity for Object Oriented Systems. J. Inf. Sci. Eng. 2008, 24, 1689–1708. [Google Scholar]
- Wang, Y.; Shao, J. A New Measure of Software Complexity based on Cognitive Weights. Can. J. Electr. Comput. Eng. 2003, 28, 69–74. [Google Scholar]
- Misra, S.; Adewumi, A.; Fernandez-Sanz, L.; Damasevicius, R. A suite of object oriented cognitive complexity metrics. IEEE Access 2018, 6, 8782–8796. [Google Scholar] [CrossRef]
- Halstead, M.H. Elements of Software Science, Operating, and Programming Systems Series; Elsevier: New York, NY, USA, 1977; Volume 7. [Google Scholar]
- McCabe, T.J. A complexity measure. IEEE Trans. Softw. Eng. 1976, 4, 308–320. [Google Scholar] [CrossRef]
- Chidamber, S.R.; Kemerer, C.F. A Metrics Suite for Object Oriented Design. IEEE Trans. Softw. Eng. 1994, 20, 476–493. [Google Scholar] [CrossRef]
- Damaševičius, R.; Štuikys, V. Metrics for evaluation of metaprogram complexity. Comput. Sci. Inf. Syst. 2010, 7, 770–787. [Google Scholar] [CrossRef]
- Basci, D.; Misra, S. Entropy as a Measure of Quality of XML Schema Document. Int. Arab J. Inf. Technol. 2011, 8, 16–24. [Google Scholar]
- Basci, D.; Misra, S. Data Complexity Metrics for XML Web Services. Adv. Electr. Comput. Eng. 2009, 9, 9–15. [Google Scholar] [CrossRef]
- Basci, D.; Misra, S. Metrics Suite for Maintainability of XML Web Services. IET Softw. 2011, 5, 320–341. [Google Scholar]
- Basci, D.; Misra, S. Entropy Metric for XML DTD Documents. ACM SIGSOFT Softw. Eng. Notes 2008, 33, 5. [Google Scholar] [CrossRef]
- Feuerlicht, G.; Hartman, D. Estimating the complexity of software services using an entropy based metric, 2016. In Service-Oriented Computing—ICSOC 2015 Workshops; Norta, A., Gaaloul, W., Gangadharan, G., Dam, H., Eds.; Lecture Notes in Computer Science; Springer: Berlin/Heidelberg, Germany, 16–19 November 2015; Volume 9586. [Google Scholar] [CrossRef]
- Pušnik, M.; Heričko, M.; Budimac, Z.; Šumak, B. XML schema metrics for quality evaluation. Comput. Sci. Inf. Syst. 2014, 11, 1271–1290. [Google Scholar] [CrossRef]
- Falola, O.; Misra, S.; Adewumi, A.; Damasevičius, R. Evaluation and comparison of metrics for XML schema languages. International Conference of the Catalan Association for Artificial Intelligence. In Frontiers in Artificial Intelligence and Applications 300; IOS Press: Amsterdam, The Netherlands, 2017. [Google Scholar] [CrossRef]
- Damasevicius, R.; Stuikys, V. Separation of Concerns in Multi-language Specifications. Informatica 2002, 13, 255–274. [Google Scholar]
- Marden, P.M.; Munson, E.V. Today’s Style Sheet Standards: The Great Vision Blinded. Computer 1999, 32, 123–125. [Google Scholar] [CrossRef]
- Keller, M.; Nussbaumer, M. CSS Code Quality: A Metric for Abstractness. In Proceedings of the Seventh International Conference on the Quality of Information and Communications Technology, Porto, Portugal, 29 October 2010; pp. 116–121. [Google Scholar]
- Mesbah, A.; Mirshokraie, S. Automated Analysis of CSS Rules to Support Style Maintenance. In Proceedings of the 34th International Conference on Software Engineering, Zurich, Switzerland, 2–9 June 2012; pp. 408–418. [Google Scholar]
- Adewumi, A.; Misra, S.; Ikhu-Omoregbe, N. Complexity Metrics for Cascading Style Sheets. In Proceedings of the 12th International conference on Computational Science and Its Applications, ICCSA 2012, Salvador de Bahia, Brazil, 18–21 June 2012; pp. 248–257. [Google Scholar]
- Misra, S. Modified Set of Weyuker’s properties. In Proceedings of the IEEE (ICCI ‘06), Istanbul, Turkey, 11–15 June 2006; pp. 242–247. [Google Scholar]
- Misra, S. Weyuker’s properties, language independency and object oriented metrics. In Proceedings of the International Conference on Computational Science and Its Applications, ICCSA 2009, Seoul, Korea, 29 June–2 July 2009; pp. 70–81. [Google Scholar] [CrossRef]
- Weyuker, E.J. Evaluating software complexity measure. IEEE Trans. Softw. Eng. 1988, 14, 1357–1365. [Google Scholar] [CrossRef]
- Misra, S. An Analysis of Weyuker’s Properties and Measurement Theory. Proc. Indian Natl. Sci. Acad. 2010, 76, 55–66. [Google Scholar]
- Cherniavsky, J.C.; Smith, C.H. On Weyuker’s axioms for software complexity measures. IEEE Trans. Softw. Eng. 1991, 17, 636–638. [Google Scholar] [CrossRef]
- Herbold, S.; Grabowski, J.; Waack, S. Calculation and optimization of thresholds for sets of software metrics. Empir. Softw. Eng. 2011, 16, 812–841. [Google Scholar] [CrossRef] [Green Version]
- Yamashita, K.; Huang, C.; Nagappan, M.; Kamei, Y.; Mockus, A.; Hassan, A.E.; Ubayashi, N. Thresholds for Size and Complexity Metrics: A Case Study from the Perspective of Defect Density. In Proceedings of the IEEE Int Conference on Software Quality, Reliability and Security (QRS), Vienna, Austria, 1–3 August 2016. [Google Scholar] [CrossRef]
- Shatnawi, R. A quantitative investigation of the acceptable risk levels of object-oriented metrics in open-source systems. IEEE Trans. Softw. Eng. (TSE) 2010, 36, 216–225. [Google Scholar] [CrossRef]
- Alves, T.L.; Ypma, C.; Visser, J. Deriving metric thresholds from benchmark data. In Proceedings of the IEEE International Conference on Software Maintenance, Timisoara, Romania, 12–18 September 2010; pp. 1–10. [Google Scholar] [CrossRef]
- Ghasemi, A.; Zahediasl, S. Normality tests for statistical analysis: A guide for non-statisticians. Int. J. Endocrinol. Metab. 2012, 10, 486–489. [Google Scholar] [CrossRef] [PubMed]
- Zhang, F.; Mockus, A.; Zou, Y.; Khomh, F.; Hassan, A.E. How Does Context Affect the Distribution of Software Maintainability Metrics? In Proceedings of the 29th IEEE International Conference on Software Maintenance, Eindhoven, The Netherlands, 1 January 2013; pp. 350–359. [Google Scholar] [CrossRef]
- Sheskin, D.J. Handbook of Parametric and Nonparametric Statistical Procedures, 4th ed.; Chapman Hall/CRC: Eugene, OR, USA, 2007. [Google Scholar]
- Cliff, N. Ordinal Methods for Behavioral Data Analysis; Erlbaum: Mahwah, NJ, USA, 1996. [Google Scholar]
- Akoglu, H. User’s guide to correlation coefficients. Turk. J. Emerg. Med. 2018, 18, 91–93. [Google Scholar] [CrossRef] [PubMed]
- Misra, S.; Akman, I. Applicability of weyuker’s properties on oo metrics: Some misunderstandings. ComSIS 2008, 5, 17–24. [Google Scholar] [CrossRef]
- He, P.; Ma, Y.; Li, B. TDSelector: A Training Data Selection Method for Cross-Project Defect Prediction. arXiv 2016, arXiv:1612.09065. [Google Scholar]
- El Emam, K.; Benlarbi, S.; Goel, N.; Melo, W.; Lounis, H.; Rai, S.N. The optimal class size for object-oriented software. IEEE Trans. Softw. Eng. 2002, 28, 494–509. [Google Scholar] [CrossRef]
- Zhou, Y.; Leung, H.; Xu, B. Examining the potentially confounding effect of class size on the associations between object-oriented metrics and change-proneness. IEEE Trans. Softw. Eng. 2009, 35, 607–623. [Google Scholar] [CrossRef]
- Jiarpakdee, J.; Tantithamthavorn, C.; Hassan, A.E. The Impact of Correlated Metrics on the Interpretation of Defect Models. IEEE Trans.Softw. Eng. 2019. [Google Scholar] [CrossRef]
- Yin, R.K. Case Study Research: Design and Methods, 3rd ed.; SAGE Publications: Thousand Oaks, CA, USA, 2002. [Google Scholar]
- Ulziit, B.; Warraich, Z.A.; Gencel, C.; Petersen, K. A conceptual framework of challenges and solutions for managing global software maintenance. J. Softw. Evol. Proc. 2015, 27, 763–792. [Google Scholar] [CrossRef]
- Hecht, M.; Tang, D.; Hecht, H.; Brill, R.W. Quantitative reliability and availability assessment for critical systems including software. In Proceedings of the COMPASS ’97, Annual Conference on Computer Assurance, Gaithersburg, MD, USA, 16–19 June 1997; pp. 147–158. [Google Scholar]
- Li, L.; Lu, M.; Gu, T. A systematic modeling approach for failure indicators of complex software-intensive systems. In Proceedings of the 12th International Conference on Reliability, Maintainability, and Safety, ICRMSS, Shanghai, China, 17–19 October 2018; pp. 43–51. [Google Scholar] [CrossRef]
Figure 1.
Violin plots of metric values.

Figure 2.
Q-Q plots of metric values.

Figure 3.
Cliff’s delta for different CSS metrics.

Figure 4.
Distribution of metric values vs. CSS document size

Figure 5.
Correlation among metric values and CSS document size.

Figure 6.
Risk assessment results for the CSS dataset.

Figure 7.
Aggregate risk value for the CSS dataset.

Table 1.
Relationship between metric threshold values and risk values.
| Percentile | Risk Category | Risk Value |
|---|---|---|
| 70% | Low | 0 |
| 80% | Moderate | ½ |
| 90% | High | 1 |
Table 2.
The metric values for the analyzed CSS documents.
| ID | RL | NORB | E | NERB | NADRB | NCRB | SIZE (kB) |
|---|---|---|---|---|---|---|---|
| 1 | 224 | 48 | 2.3681 | 3 | 2.67 | 20 | 118 |
| 2 | 329 | 65 | 2.8601 | 4 | 3.06 | 16 | 340 |
| 3 | 368 | 74 | 2.8933 | 7 | 2.96 | 19 | 391 |
| 4 | 300 | 63 | 2.8951 | 7 | 2.84 | 16 | 123 |
| 5 | 463 | 89 | 2.9670 | 8 | 3.20 | 22 | 265 |
| 6 | 364 | 73 | 2.8543 | 6 | 2.97 | 18 | 301 |
| 7 | 280 | 59 | 2.4394 | 4 | 2.75 | 21 | 148 |
| 8 | 362 | 77 | 2.8475 | 7 | 2.66 | 23 | 85.7 |
| 9 | 205 | 48 | 2.6844 | 4 | 2.27 | 15 | 265 |
| 10 | 340 | 69 | 2.8635 | 6 | 2.93 | 15 | 180 |
| 11 | 298 | 62 | 2.8028 | 6 | 2.81 | 18 | 98.8 |
| 12 | 258 | 52 | 2.8809 | 6 | 2.96 | 11 | 1090 |
| 13 | 336 | 65 | 3.0634 | 7 | 3.19 | 15 | 34.3 |
| 14 | 292 | 62 | 2.9080 | 7 | 2.71 | 15 | 37.8 |
| 15 | 359 | 73 | 2.9353 | 6 | 2.92 | 17 | 295 |
| 16 | 300 | 62 | 2.8028 | 6 | 2.82 | 18 | 174 |
| 17 | 248 | 48 | 2.9561 | 6 | 3.08 | 8 | 1390 |
| 18 | 360 | 69 | 2.8185 | 6 | 2.87 | 17 | 743 |
| 19 | 296 | 62 | 2.9032 | 8 | 2.77 | 17 | 70.4 |
| 20 | 305 | 63 | 2.7977 | 6 | 2.84 | 16 | 88.5 |
| 21 | 339 | 69 | 2.8060 | 6 | 2.91 | 17 | 246 |
| 22 | 298 | 63 | 2.8877 | 7 | 2.73 | 16 | 169 |
| 23 | 343 | 69 | 2.8435 | 6 | 2.97 | 17 | 141 |
| 24 | 332 | 70 | 2.7145 | 6 | 2.73 | 22 | 509 |
| 25 | 348 | 74 | 2.6639 | 6 | 2.70 | 20 | 57.1 |
| 26 | 307 | 61 | 2.9648 | 7 | 3.02 | 16 | 30.7 |
| 27 | 253 | 54 | 2.6322 | 4 | 2.69 | 20 | 194 |
| 28 | 373 | 77 | 2.8725 | 7 | 2.84 | 21 | 315 |
| 29 | 249 | 50 | 2.8916 | 3 | 2.98 | 13 | 72.8 |
| 30 | 276 | 60 | 2.7650 | 6 | 2.60 | 19 | 147 |
| 31 | 309 | 65 | 2.8749 | 7 | 2.77 | 16 | 143 |
| 32 | 349 | 70 | 2.9146 | 7 | 2.99 | 15 | 190 |
| 33 | 302 | 61 | 2.9095 | 7 | 2.92 | 18 | 56.8 |
| 34 | 260 | 53 | 2.8763 | 6 | 2.91 | 12 | 803 |
| 35 | 349 | 74 | 2.6783 | 6 | 2.72 | 20 | 121 |
| 36 | 395 | 79 | 2.8925 | 7 | 3.00 | 18 | 226 |
| 37 | 374 | 73 | 3.0873 | 7 | 3.11 | 15 | 156 |
| 38 | 475 | 94 | 2.8554 | 7 | 3.00 | 20 | 374 |
| 39 | 628 | 121 | 2.5217 | 7 | 2.07 | 44 | 128 |
| 40 | 354 | 69 | 2.6601 | 3 | 3.13 | 20 | 540 |
Table 3.
Performance of measures against Weyuker’s properties.
| Measures | RL | NORB | E | NERB | NADRB | NCRB | |
|---|---|---|---|---|---|---|---|
| Property | |||||||
| 1 | * | * | * | * | * | * | |
| 2 | * | * | * | * | * | * | |
| 3 | * | * | * | * | * | * | |
| 4 | - | - | - | - | - | - | |
| 5 | * | * | * | * | * | * | |
| 6 | - | - | - | - | * | - | |
| 7 | - | - | - | - | - | - | |
| 8 | * | * | * | * | * | * | |
| 9 | - | - | - | - | - | - | |
© 2019 by the authors. Licensee MDPI, Basel, Switzerland. This article is an open access article distributed under the terms and conditions of the Creative Commons Attribution (CC BY) license (http://creativecommons.org/licenses/by/4.0/).
Share and Cite
MDPI and ACS Style
Adewumi, A.; Misra, S.; Damaševičius, R. A Complexity Metrics Suite for Cascading Style Sheets. Computers 2019, 8, 54. https://0-doi-org.brum.beds.ac.uk/10.3390/computers8030054
AMA Style
Adewumi A, Misra S, Damaševičius R. A Complexity Metrics Suite for Cascading Style Sheets. Computers. 2019; 8(3):54. https://0-doi-org.brum.beds.ac.uk/10.3390/computers8030054
Chicago/Turabian StyleAdewumi, Adewole, Sanjay Misra, and Robertas Damaševičius. 2019. "A Complexity Metrics Suite for Cascading Style Sheets" Computers 8, no. 3: 54. https://0-doi-org.brum.beds.ac.uk/10.3390/computers8030054
Note that from the first issue of 2016, this journal uses article numbers instead of page numbers. See further details here.