When Two Become One: How Group Mergers Affect Solidarity

ETH Zürich; Department of Humanities, Social and Political Science, Chair of Economics, CLD D 10.1, Clausiusstrasse 37, 8092 Zürich, Switzerland
Games 2019, 10(3), 30; https://0-doi-org.brum.beds.ac.uk/10.3390/g10030030
Submission received: 12 January 2019
/
Revised: 5 July 2019
/
Accepted: 9 July 2019
/
Published: 19 July 2019
(This article belongs to the Special Issue Social Norm and Risk Attitudes)
Abstract
:Solidarity in teamwork situations is important for the success and longevity of teams. This paper studies how helping group members is affected when groups are randomly merged and increase in size. Group mergers put social norms that are prevailing in previously small groups to the test as new team members may not share the same norms and values. I present results from an experiment in which subjects interact in groups and face the decision to help a group member who is in need of help due to an exogenous shock. Subjects interact in small groups in the first part of the experiment and groups are randomly merged to form big groups in the second part of the experiment. Helping rates are higher in merged groups compared with big groups that stay in the same constellation throughout the experiment. Moreover, in merged groups, high helping norms are more influential compared with low helping norms.
1. Introduction
In many situations employees need to exert extra effort which is not monetarily rewarded and may even be individually costly. For example, team members oftentimes face a trade-off between loafing and helping out other members of their group. Helping another team member is individually costly but may have positive scale effects (Comer [1]; Margarida Passos and Caetano [2]; Schermerhorn [3]). If one employee, for example, is given a task shortly before the end of the work day, his or her leisure time will be massively reduced. If his or her colleagues, instead of enjoying leisure time, decide to help, each employee suffers only a little bit. All involved co-workers will be late for whatever they had planned instead, but the cost would be evenly distributed among the entire group.
The willingness to take voluntary, non-selfish actions can significantly contribute to the success and longevity of groups (Bowles [4]; Fehr and Fischbacher [5]; Hu and Liden [6]; Schjoedt et al. [7]) and enhance overall efficiency (Akerlof and Kranton [8]; Dur and Sol [9]; Kandel and Lazear [10]; Rob and Zemsky [11]). If such high solidarity, i.e., high social capital (Adler and Kwon [12]; Putnam [13]), is reflected in corporate culture, it may also contribute to firms’ success and lead to higher profits—see, e.g., Kitzmueller and Shimshack [14]; Lins et al. [15]; Schmitz and Schrader [16].
However, in some situations, there is a decreasing benefit in the number of people who help. Consider, for example, moving house. If too few people show up and help, the person in need of help and the few helpers have to pay the cost and finish the move alone. If too many people show up, however, everyone needs to bear only little cost but there is some risk that some of the helpers are not necessary and do not further speed up the move. Thus, if a sufficient number of people already decide to help, more helpers may not be able to additionally contribute. In fact, the excess helpers may have sacrificed individual payoff because they could have done something else during the time of the move, which renders their helping decision inefficient.
Situations in which excess helping is inefficient allow people to diffuse responsibility, see, e.g., Latane and Darley [17]. If the individual decision to help or not may not have additional impact, people may be hesitant to exert costly helping behavior because others may step into the breach and help. In these situations, however, there is risk involved that only a few people decide to help which may lead to worse outcomes compared with a situation in which too many people decide to help. These situations are prone to bystander effects (Dana et al. [18]; Diekmann [19]; Latane and Darley [17]; Latane et al. [20]; Panchanathan et al. [21]).
The size of the group in which people interact, however, sometimes changes over time.1 As a consequence, established norms within groups are put to the test when group size expands and teams frequently interact. For example, if divisions of firms are integrated or firms merge, group members who only faced the problem to help others in their relatively small group are now confronted with an extended group size. In this new situation, on the one hand, more potential helpers can step into the breach and help. On the other hand, an extended group size may complicate coordination on solidarity outcomes because people may be reluctant to help and diffuse responsibility in bigger groups. In addition, the new and old group members may not share the same set of norms which potentially jeopardizes established norms in previously small groups.
In this paper, I experimentally study how helping in groups is affected when two smaller groups are randomly merged to form bigger groups. I thereby focus on the situation in which the decision to help or not is pivotal to the subject who is in need of help in small groups and subjects can more easily diffuse responsibility when groups are merged and increase in size. To study the random combination of groups and its effects on helping behavior, I develop a game in which teamwork, i.e., the collective action of others is needed to support a group member in need of help. Each period, all subjects in a group start with an endowment of 100 tokens. A randomly chosen subject then loses her endowment. The other members of her group can then (simultaneously) decide to help. While not helping (keeping the endowment of 100 tokens) does not entail a monetary cost, helping is always costly. However, the cost of helping declines in the number of helpers. If only one subject helps, both the helper and the group member who lost her endowment end up with 30 tokens. If two subjects help, the group member who lost her endowment and the helpers each receive 60 tokens. If there are three (or more) helpers, all involved group members (the helpers and the subject in need) receive 90 tokens.
Subjects first interact in small groups in the first part of the experiment (Part A: Period 1–10). These groups are then randomly merged and interact in—then—bigger groups in the second part of the experiment (Part B: Period 11–20). I benchmark the effect of group mergers on helping against helping behavior of subjects who, in both parts of the experiment, interact in big groups that do not change in size. This comparison is necessary because the group members’ help may depend, among other things, on the number of potential helpers that are present. Thus, it is crucial to know how subjects in big groups who did not experience a merger and play the helping game in the same constellation throughout the experiment behave in the second part of the experiment.
Helping behavior in Part B of the study is higher in merged groups compared with big groups. Positive norms of helping, which have been established in small groups, seem to influence behavior in the merged groups. The effects are particularly strong if one of the small groups showed a high helping norm in Part A. When groups that have established high helping norms in Part A are merged with groups that have established low helping norms in Part A, helping rates in Part B are higher than those of big groups that have a low helping norm in Part A. Moreover, helping rates of merged groups with different (high and low) helping norms are higher compared with big groups that had a high helping norm in Part A. In addition, within the merged groups, helping rates are higher when one of the two merged groups had a high helping norm in Part A compared with the situation in which two low helping norm groups are randomly merged. In the merged groups, high helping norms are thus more influential than low helping norms.
The finding that high helping norms are more influential than selfish norms contrasts findings from other social dilemma games in which few selfish players induce subjects to adjust their strategy and also free-ride (Frey and Meier [24]; Frey and Torgler [25]; Fischbacher et al. [26]; Keser and Van Winden [27]). In the experiment presented in this paper, however, the negative consequence of the few selfish subjects is attenuated. It seems as if subjects who infrequently help in their groups pre-merger now observe a substantial number of others who help and, thus, they also start helping.
These findings complement the literature studying the effects of group mergers on performance and norm transmission in groups (Charness and Yang [28]; Ehrhart and Keser [29]; Gürerk et al. [30]; Guido et al. [31]; Feiler and Camerer [32]; Ranehill et al. [33]; Weber and Camerer [34]; Weber [35]).2 Feiler and Camerer [32] for example, study endogenous group mergers in an experiment (i.e., group mergers in which group members decide whether or not and with whom to merge). They report a decrease in profitability of merged groups. In their experiment, however, they concentrate on task solving after endogenous group mergers, i.e., students from two universities had to identify pictures from both campuses. When groups merged, performance decreased as the new group members were not able to identify pictures from the other university. Weber and Camerer [34] exogenously merge groups who develop an individual “corporate culture” in a first part of their experiment. The corporate culture—reflected in a common understanding of the content of different pictures when described by a group member—varied between groups. As a consequence, the group mergers significantly impacted the ability to coordinate within newly formed groups. Thus, when the new team members lack in knowledge about the new task overall performance may decrease post-merger. Huckman et al. [45] supports this notion by empirically investigating non-stable teams and highlighting that familiarity between team members is an important factor for team success. Smeets et al. [46] further identify that the success of mergers is indeed dependent on ‘soft’ aspects like corporate culture and social relationships in firms. Furthermore, Charness and Yang [28], Ehrhart and Keser [29] and Ranehill et al. [33] provide additional arguments for the beneficial effect of similarity between individuals on cooperation. When groups endogenously merge cooperative subjects cannot fully escape free-riders and actively decide to exclude uncooperative subjects from their group. As a result public goods provision increases (see also, Gürerk et al. [30]). Moreover, Ranehill et al. [33] study group mergers in public goods games in which groups randomly merge or in which groups exogenously grow over time. They show that cooperative behavior in public goods games decreases if groups exogenously merge.
In public goods games, subjects decide to contribute to the entire group. In reality, however, specific members of a group may be in need of support and group members need to decide whether or not to help this group member. Moreover, increased group size often allows individuals to diffuse responsibility as their decision may only have little (or no) impact if others already help. Given that altruistic behavior and cooperation within groups is crucial for group success, it is important to isolate the effect of mergers on helping behavior in groups.3 Research on norm transmission usually focuses on cultural norms or norm transmission within families over time (see, e.g., Bisin and Verdier [56,57]). Experimental research studying how norms evolve over time usually focuses on similar sized groups in public goods games (Fehr and Gächter [58]; Fischbacher et al., [26]) and the actual number of subjects in groups is held constant. Feld and Torgler [59] and Feld et al. [60], however, study cooperative norms of tax compliance in unified Germany and find that social norms erode over time. Attanasi et al. [61] study how participants’ behavior in an experimental public goods game is affected when they know that information about their choices and outcomes, together with different sets of information about their identity, will be transmitted the following year to a set of new, unknown participants.4 It is, however, not clear whether evasion rates would not have increased anyway. It is therefore difficult to disentangle the effect of group mergers from pure group size effects in the field. This paper therefore contributes to identify how social norms of helping in groups are affected by group mergers.
2. Experimental Design, Procedure and Hypotheses
The details of the experimental game (the helping game) are presented in Section 2.1. Section 2.2 discusses the features of the game in light of existing social dilemmas. In Section 2.3, I detail the treatment variations. Section 2.4 describes the experimental procedure and in Section 2.5 hypotheses guiding the analysis in Section 3 are presented.
2.1. The Helping Game
In the helping game, all subjects start with the same endowment of 100 tokens (equivalent to 4 Euro). To create a situation which requires the joint help of the other group members, a negative exogenous shock to one group member is implemented in each period (e.g., additional workload at the end of the working day). The shock constitutes the loss of the endowment of one randomly determined subject. This subject will not receive any income at all if no other subject decides to help. The other subjects in the group can decide to either help this group member in need or not. Helping is costly and the cost of helping depends on how many subjects help in total. If only one subject helps, both the helping subject and the subject in need receive an income of 30 tokens. If a second subject from a group helps, all three subjects (the two helpers and the subject in need) receive an income of 60 tokens each. If a third subject from a group decides to help, all four subjects (the three helpers and the subject in need) receive an income of 90 tokens. If more than three subjects help, the helpers and the subject who lost the endowment receive 90 tokens. A subject that does not help incurs no cost at all and keeps her entire endowment. This subject receives the highest income which represents the costless outside option in the game. Consequently, the helping subjects face individual losses in any case but could—through joint interaction—increase the total welfare of the group. Subjects make their decision to help or not simultaneously after learning their income and the individual identification number of the subject who lost her endowment. To avoid framing effects, the actions are denoted “Option A” (helping) and “Option B” (not helping and keeping the endowment) throughout the experiment. Table 1 highlights the payoff structure of the game. After subjects make their decision, they receive information on their payoff. No further information was provided.
2.2. Discussion of the Helping Game
The helping game builds on the solidarity game (Selten and Ockenfels [64]), the volunteer’s dilemma (Diekmann [19]) and a threshold public goods game—see, e.g., Croson and Marks, [65]. The helping game has components from each of these games but deviates from their structure in distinct ways for several reasons. First, solidarity and risk are both characteristics of the solidarity game and the helping game. However, more potential losers are possible in the solidarity game. Furthermore, risk in the solidarity game is purely exogenous. On the contrary, in the helping game, uncertainty stems from the interaction with others and subjects make only one decision according to their pro-social attitude and beliefs about group members’ actions which is advantageous when studying a teamwork situation. Second, the structure of the helping game also relates to the volunteer’s dilemma. However, in the volunteer’s dilemma, only one team member is needed to sacrifice payoffs for the benefit of the entire group. Thus, to emphasize the teamwork component of the helping game, the effect of helping out a group member in need is conditioned on the number of others who also help in a group (i.e., the level of teamwork). Third, similar to public goods games, deviating from the pro-social optimum also yields individual benefits in the helping game. However, in public goods games, no pure group size effect can be identified—see, e.g., Isaac et al. [40]. A substantial variation in group helping, however, is necessary to determine whether group mergers affect social norms positively or negatively.
Another important difference between the helping game compared to public goods games is that there is one subject which is in need of help in the helping game. This incentive structure has the benefit of making the impact and importance of the helping decision salient. Additionally, the helping game also creates a situation in which excess helping is possible. Thus, subjects who help may incur cost, but their decision does not create any additional benefit to the subject in need. In the public goods game, every contribution yields (at least some) benefit to all group members.
The situation that only a certain number of subjects is needed to fully help the subject in need is common in many settings, e.g., only a limited number of co-workers can help with finishing a task and excess helpers may be in the way and hinder the progress. However, in the helping game, there is also risk involved that too few subjects help. Insufficient helping thereby creates higher cost than excess helping, i.e., if too few people decide to help, the social costs are higher compared with the situation in which too many people help. These components of socially inefficient helping are reflected in the helping game.5
2.3. Treatments
In the Big Group treatment, a group consists of the same eight subjects in all 20 periods of the experiment (Part A and Part B). In the Merged Group treatment, a group consists of four subjects in Part A of the experiment. In Part B, two groups of four are randomly merged to form one group of eight subjects. Hence, each group of four remains in the same constellation, but four new members are added to the group (see Table 2 for a treatment overview with number of groups in parentheses). In both treatments, subjects play the helping game described in Section 2.1 for a total of 20 periods (ten periods in Part A and ten periods in Part B).
This setup allows identifying whether and how helping norms which have been established in small groups evolve when groups are randomly combined. Moreover, the treatments allow for contrast helping in Part B of the experiment between subjects that always play the helping game in the same constellation in big groups and subjects that interacted with fewer subjects in Part A but were confronted with an increased group size and new group members in Part B. In Part B, the group size is the same for all subjects in both treatments. Since only three subjects are needed to fully help the subject who lost the endowment, excess helping is possible in both treatments which allows subjects to diffuse responsibility. The difference between the Merged Group treatment and the Big Group treatment is that, in Part A, the decision of each subject who did not lose the endowment is pivotal for the income of the subject who lost the endowment in the Merged Group treatment. Subjects in the Merged Group treatment thus move from a situation in which fewer potential helpers are available in a small group to a situation in which the difficulty of the task (three subjects are needed to fully help a subject who lost the endowment) is the constant but more potential helpers are available.
Subjects make their decision to help or not simultaneously and only receive information on their own payoff and not about the number of others who also help. Feedback on the number of helpers was not provided, such that subjects need to help if they want to ensure that the subject in need receives an income. Furthermore, in big groups (and in merged groups in Part B), subjects with an income of 90 tokens do not know whether a total of three or more subjects help. Thus, there is risk involved that no subject or only few subjects help.6 The incentive structure is the same in both treatments in Part B.
Moreover, in the experiment, each subject learns her own subject ID and is given information about the other group members’ IDs. Hence, in Part B of the Merged Group treatment, subjects know whether a subject in need stems from the same group as in Part A or from the new group.
2.4. Procedure and Data Collection
A total of 192 subjects (undergraduate students and graduate students from the University of Hamburg) participated in the eight sessions of the experiment. Subjects were on average 25 years old.7 About 48% of the subjects were male. Twelve observations on behavior of big groups in the Big Group treatment and 24 observations on behavior of small groups in the Merged Group treatment were collected.8
The experiment was programmed in z-Tree (Fischbacher [66]) and carried out between June 5th and July 12th 2012 at the University of Hamburg Experimental Laboratory. The University of Hamburg used the ORSEE software by Greiner [67] to recruit subjects. A session lasted on average 69 min and 24 subjects participated in each session. The mean payment was 12.24 Euros.9
In both treatments, the structure was similar and the experiment consisted of 20 periods which were divided into two parts, Part A and Part B. After arrival, participants were randomly seated at a computer terminal. Subsequently, the first part of the instructions was handed out and read aloud to the participants—by the same experimenter in all sessions—to ensure that experimental rules are common knowledge. The instructions for Part A set out the main procedure, i.e. that there are multiple parts but that they will receive instructions for each part separately and contained the information needed for the first part of the experiment.10 After the 10th period, the experiment was stopped and new instructions for Part B were provided and read to the participants. Subjects received instructions after each part in both treatments (regardless of a change in group size) to keep the experimental procedure comparable between treatments.
Subsequent to the completion of the final period of the helping game, two payment periods were drawn at random. To secure the highest degree of transparency, one participant was randomly selected to pick a number between one and ten from a deck of shuffled cards and a different participant was randomly selected to pick a number between eleven and 20 from another deck of cards. The numbers were publicly announced. The two drawn numbers represented the two payment periods for all participants of the respective session. A third, distinct, participant then entered the payment periods into z-Tree under supervision of one experimenter (to make sure the drawn periods were entered correctly).
2.5. Hypotheses
In the Merged Group treatment, subjects first interact in small groups of four in Part A and in big groups of eight in Part B of the experiment. In contrast, in the Big Group treatment, subjects interact in big groups of eight throughout the experiment. The literature on bystander effects and diffusion of responsibility suggests that subjects will be on average more likely to help in small groups compared with big groups—see, e.g., Latane and Darley [17]. Thus, norms of helping may be more easily formed in small groups as compared with big groups in Part A of the study. As a consequence, helping norms may be more likely to sustain after groups randomly merge. Hypothesis 1 emerges:
Hypothesis 1.
In Part B, helping behavior is higher in the Merged Group treatment compared with the Big Group treatment.
Hypothesis 1 conjectures that the average helping rate is higher in merged groups compared with big groups.11 Previously, small groups have been more likely to build up a high helping norm in Part A. Thus, after groups randomly merge, there might be more merged (now big) groups with high helping norms in the Merged Group treatment as compared to the Big Group treatment. Evidence from public goods games indicates that cooperation rates decline over time—see, e.g., Attanasi et al. [61]; Chaudhuri [69]; Ledyard [70]. Assuming that helping rates decline similarly between treatments over time, helping will be higher in the merged groups compared with the big groups.12
Literature on norm transmission suggests that whether or not two groups sharing the same or different norms are combined influences the magnitude of these effects—see, e.g., Brosig-Koch et al. [62]; Feld and Torgler [59]; Feld et al. [60]; Ranehill et al. [33]. Since groups are randomly merged, three possibilities arise: (i.) a group with a high helping norm will be merged with another group also sharing a high helping norm, (ii.) two groups with low helping norms may be merged with each other and (iii.) a group with a high helping norm may be merged with a group sharing a low helping norm.13
These different group constellations in Part B allow for deriving a hypothesis between the Merged Group treatment and the Big Group treatment as well as within the Merged Group treatment for the different combination of sub-groups. When two groups with high helping norms are merged or two groups sharing a low helping norm are randomly merged to form one big group, behavior is likely similar between the merged groups in the Merged Group treatment and the respective big groups which had a high (or low) helping norm in Part A in the Big Group treatment. Thus, between treatments, the most interesting comparison is the one between two merged groups sharing different helping norms in Part A and big groups sharing a high or a low helping norm in Part A. Evidence from the public goods literature suggest that selfish subjects induce others (e.g., conditional cooperators) to withhold cooperation over time—see, e.g., Frey and Meier [24]; Frey and Torgler [25]; Fischbacher et al. [26]; Keser and Van Winden [27]. Translated to this experiment, groups with a low helping norm in Part A may influence subjects in groups with a high helping norm in Part A to stop helping and behave selfishly in Part B. Hypothesis 2A follows:
Hypothesis 2A.
If two groups with different (high and low) helping norms are randomly merged, helping behavior in the Merged Group treatment is lower compared with helping behavior in groups with a high helping norm in the Big Group treatment.
The helping game has features from the volunteer’s dilemma. Recent evidence from volunteer’s dilemma games suggests that heterogeneous groups compared with homogeneous groups may be better able to coordinate on pro-social outcomes (Przepiorka and Diekmann [71]). This would imply that, if two groups with diverging helping norms merge, helping may be similar (or even higher) in the Merged Group treatment compared with helping in the Big Group treatment. Moreover, in the helping game, subjects in groups with low helping norms may be merged with four subjects with a high helping norm. Since three helpers are sufficient to fully help a subject who lost her endowment, subjects from the low helping norm group may observe full helping behavior in Part B. As a consequence, high helping norms may be more influential than low helping norms. From this, Hypothesis 2B follows:
Hypothesis 2B.
If two groups with different (high and low) helping norms are randomly merged, helping behavior in the Merged Group treatment is not different compared with helping behavior in groups with a high helping norm in the Big Group treatment.
Given that the helping game has features from both public goods games and the volunteer’s dilemma, it is ex-ante unclear whether Hypothesis 2A or 2B can be supported. The same is true when comparing helping rates in high-low norm mergers with helping rates in big groups sharing a low helping norm. Because the low helping norm may be more influential than the high helping norm, Part B helping rates in merged groups sharing different norms in Part A may be indistinguishable from the Part B helping rates in big groups that had a low helping norm in Part A.
Hypothesis 3A.
If two groups with different (high and low) helping norms are randomly merged, helping behavior in the Merged Group treatment is not different compared with helping behavior in groups with a low helping norm in the Big Group treatment.
However, when two groups that have differing norms in Part A merge, it may also be that the high helping norm may be more influential. If at least some subjects from the group with a high helping norm (at least initially) help, overall helping behavior in high-low merged groups may be higher compared with big groups that had a low helping norm in Part A. Hypothesis 3B directly follows from this assumption.
Hypothesis 3B.
If two groups with different (high and low) helping norms are randomly merged, helping behavior in the Merged Group treatment is higher compared with helping behavior in groups with a low helping norm in the Big Group treatment.
In merged groups, groups increase in size and new group members are included. Big groups stay constant throughout the experiment. The previous hypotheses thus only allow for deriving predictions about whether merging of subjects who interacted in small groups of four in Part A impacts helping behavior in Part B compared with helping behavior of subjects who interact in big groups of eight throughout the experiment. Moreover, in Part A of the experiment, three helpers are needed to reach the social optimum in big groups and in small groups. Thus, coordination on high helping is facilitated in small groups. Subjects further know the identity of the subject in need and can more easily identify uncooperative subjects in the small group setting. While comparing behavior in Part A between treatments is not the focus of the experiment, this may influence behavior in big groups in Part B too. Since subjects know the identity of the subject who lost her endowment helping norms in Part A may be influenced more by subjects’ tendency to build a reputation for being seen as pro-social, reciprocity or retaliation compared with helping norms in big groups.
The experimental setup, however, allows testing hypotheses within the Merged Group treatment. Comparisons within the Merged Group treatment are not subject to the above-mentioned constraints. These comparisons provide evidence on whether high or low helping norms may be more likely to sustain in merged groups. The only difference for groups that share a high helping norm in Part A, for example, is whether they are randomly merged to form a big group with another group that also shares a high helping norm in Part A or with new group members having experienced a low helping norm in Part A. Likewise, subjects in groups with low helping norms in Part A are either confronted with new group members who also experienced a low helping norm in Part A or with new group members who shared a high helping norm in Part A. Two hypotheses related to the influence of high or low helping norms arise:
Hypothesis 4A.
Helping behavior in merged groups is higher if two groups with high helping norms are merged compared to helping behavior in merged groups if one group with a high helping norm and one group with a low helping norm are merged. If two groups with low helping norms are merged, helping behavior is not different compared with helping behavior if one group with a high and one group with a low helping norm are merged.
Hypothesis 4B.
Helping behavior in merged groups is not different if two groups with high helping norms are merged compared to helping behavior in merged groups if one group with a high helping norm and one group with a low helping norm are merged. If two groups with low helping norms are merged, helping behavior is lower compared with helping behavior if one group with a high and one group with a low helping norm are merged.
Hypothesis 4A builds on the evidence from public goods games suggesting that selfish behavior may be more contagious than cooperation (Fischbacher et al. [26]). Few selfish subjects may thus reduce helping rates. As a consequence, Part B helping rates in merged groups with different helping norms (high-low) in Part A may be lower compared with Part B helping rates in merged groups with exclusively high helping norms (high-high) in Part A. Moreover, the low helping norm may be more influential compared with the high helping norm in merged groups. Thus, Part B helping rates may not be different between merged groups with different (high and low) helping norms in Part A compared with Part B helping rates in merged groups with similar, but low (low-low) helping rates in Part A.
Hypothesis 4B accounts for the fact that the helping game does not only entail features from public goods games. In the helping game, subjects who did not experience (sufficient) helping in their small group in Part A may now experience helping from the new group members. Helping from the new group members may be sufficient in order to reduce losses for the subject in need of help, i.e., to achieve an income of 90 tokens. Experiencing this solidarity may induce subjects who did not help in their small groups in Part A to help in Part B. This may increase helping rates in Part B for groups with low solidarity levels in Part A.
3. Experimental Results
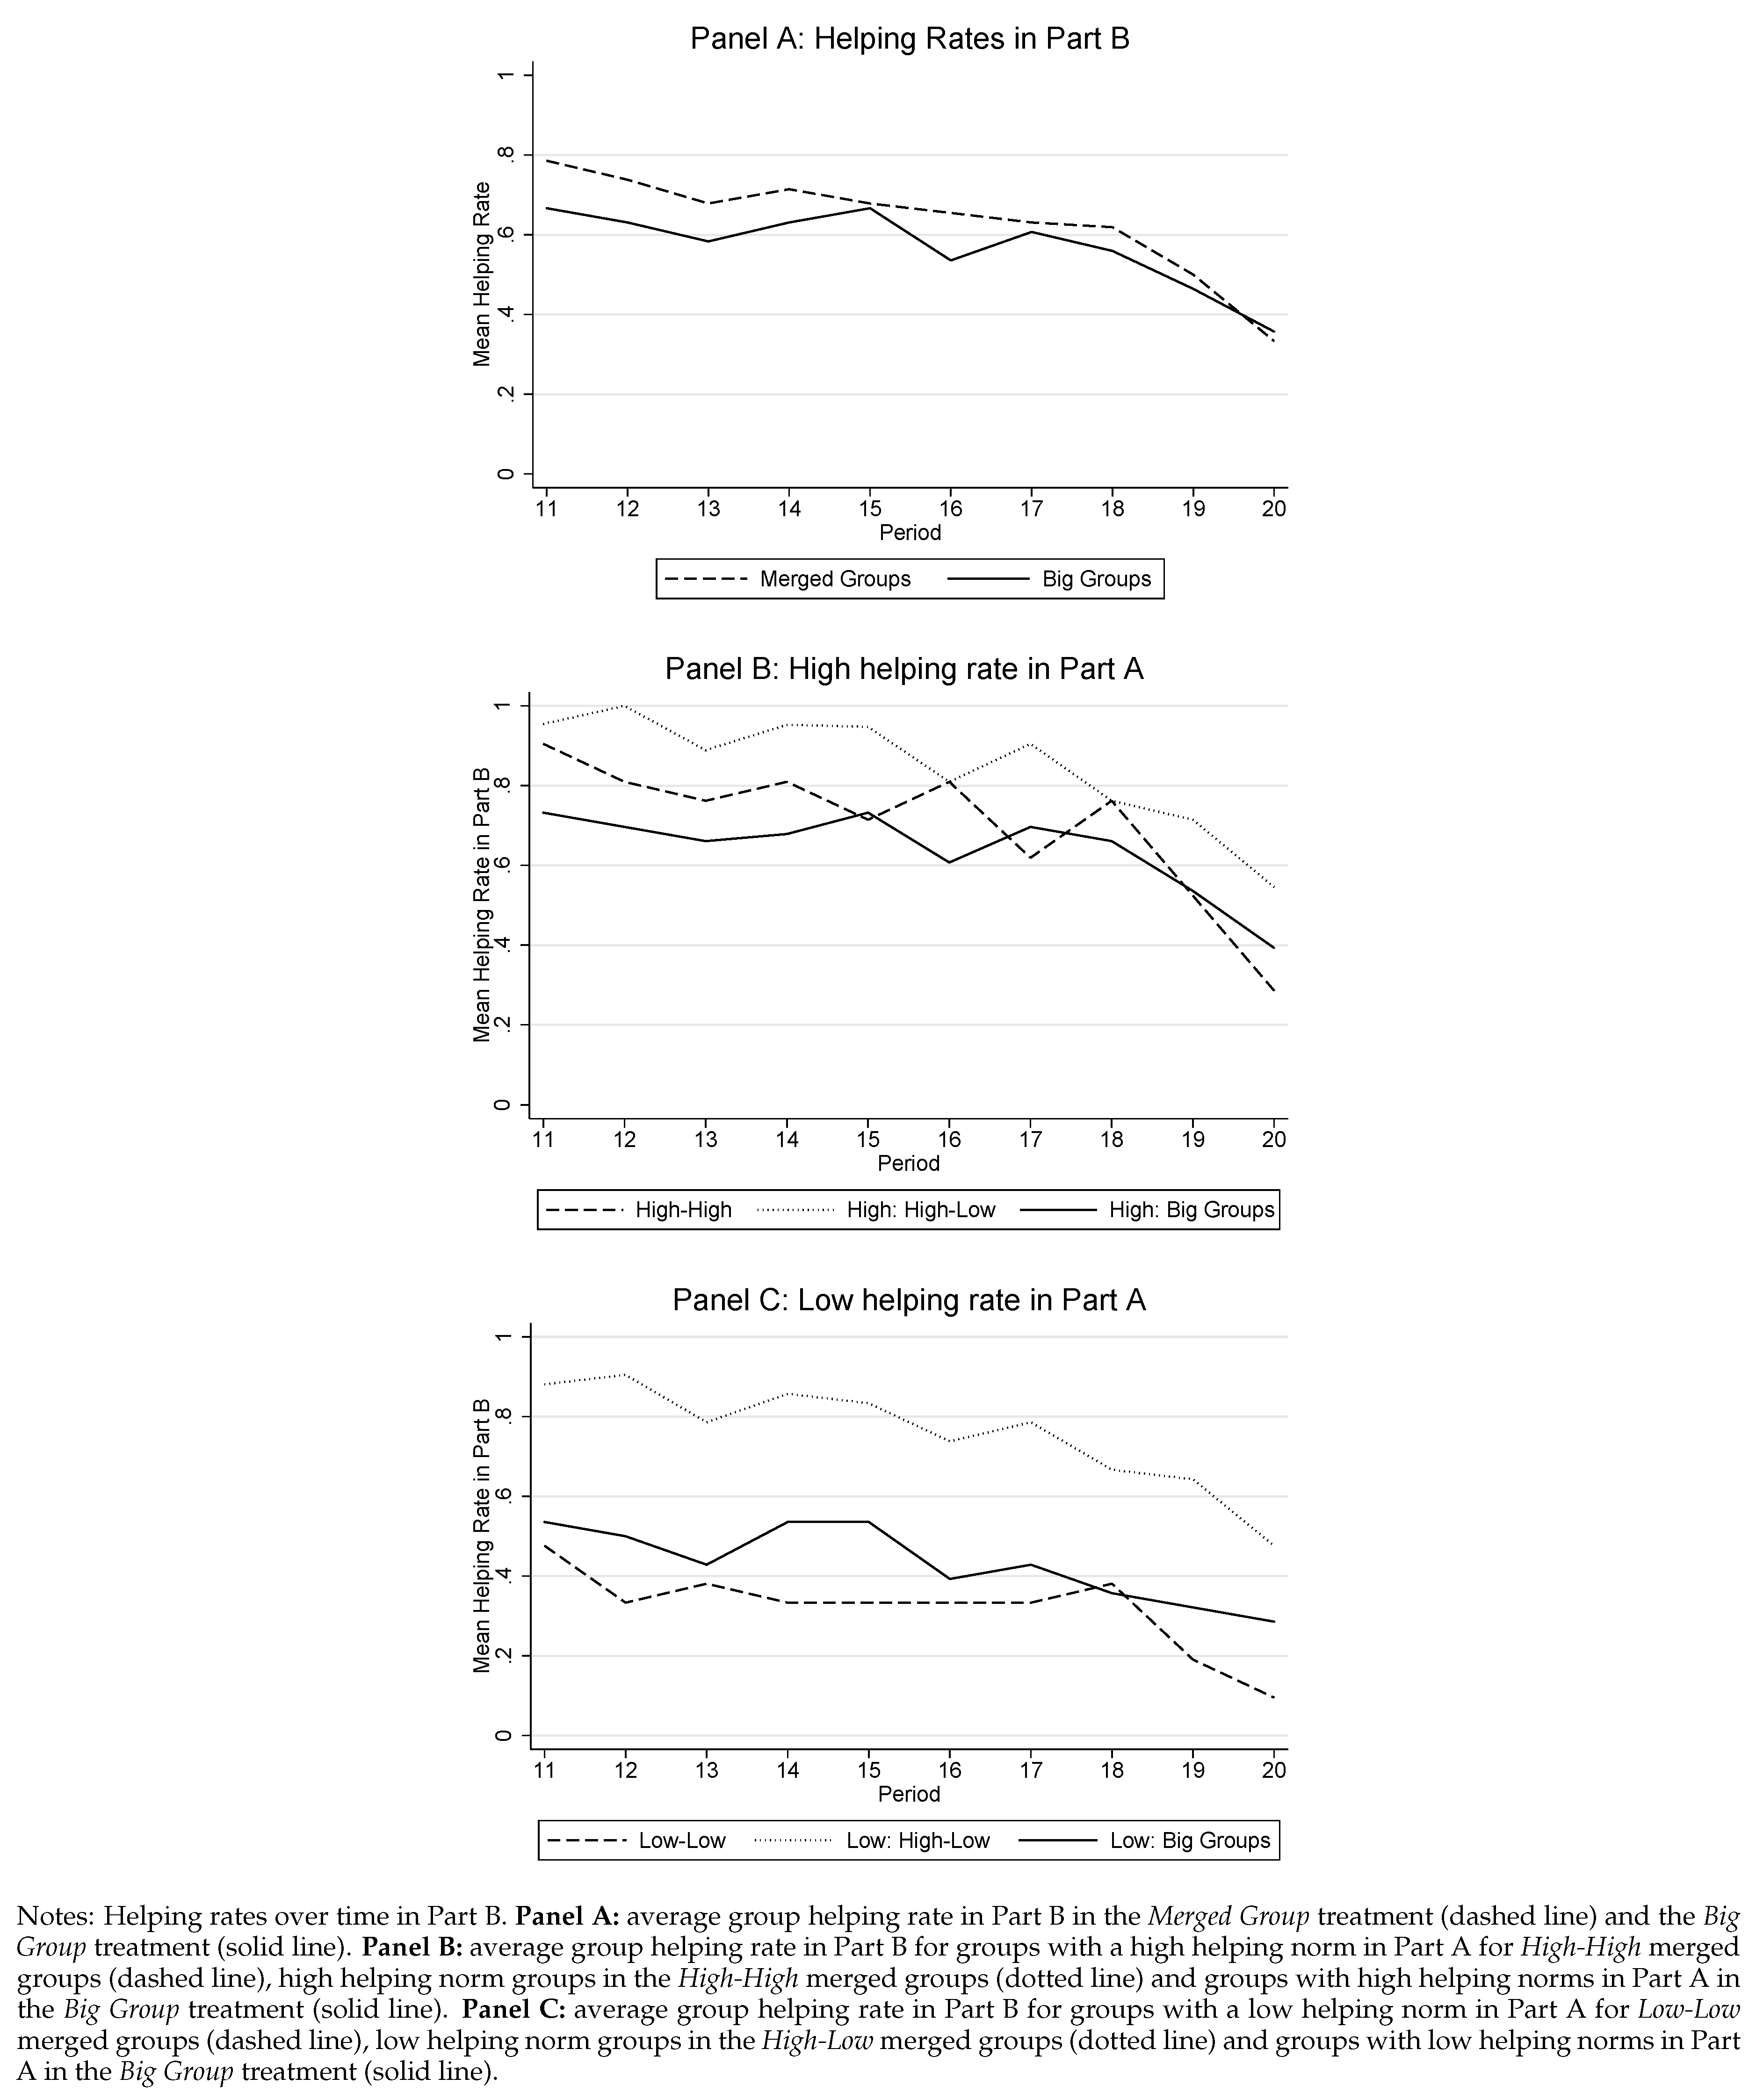
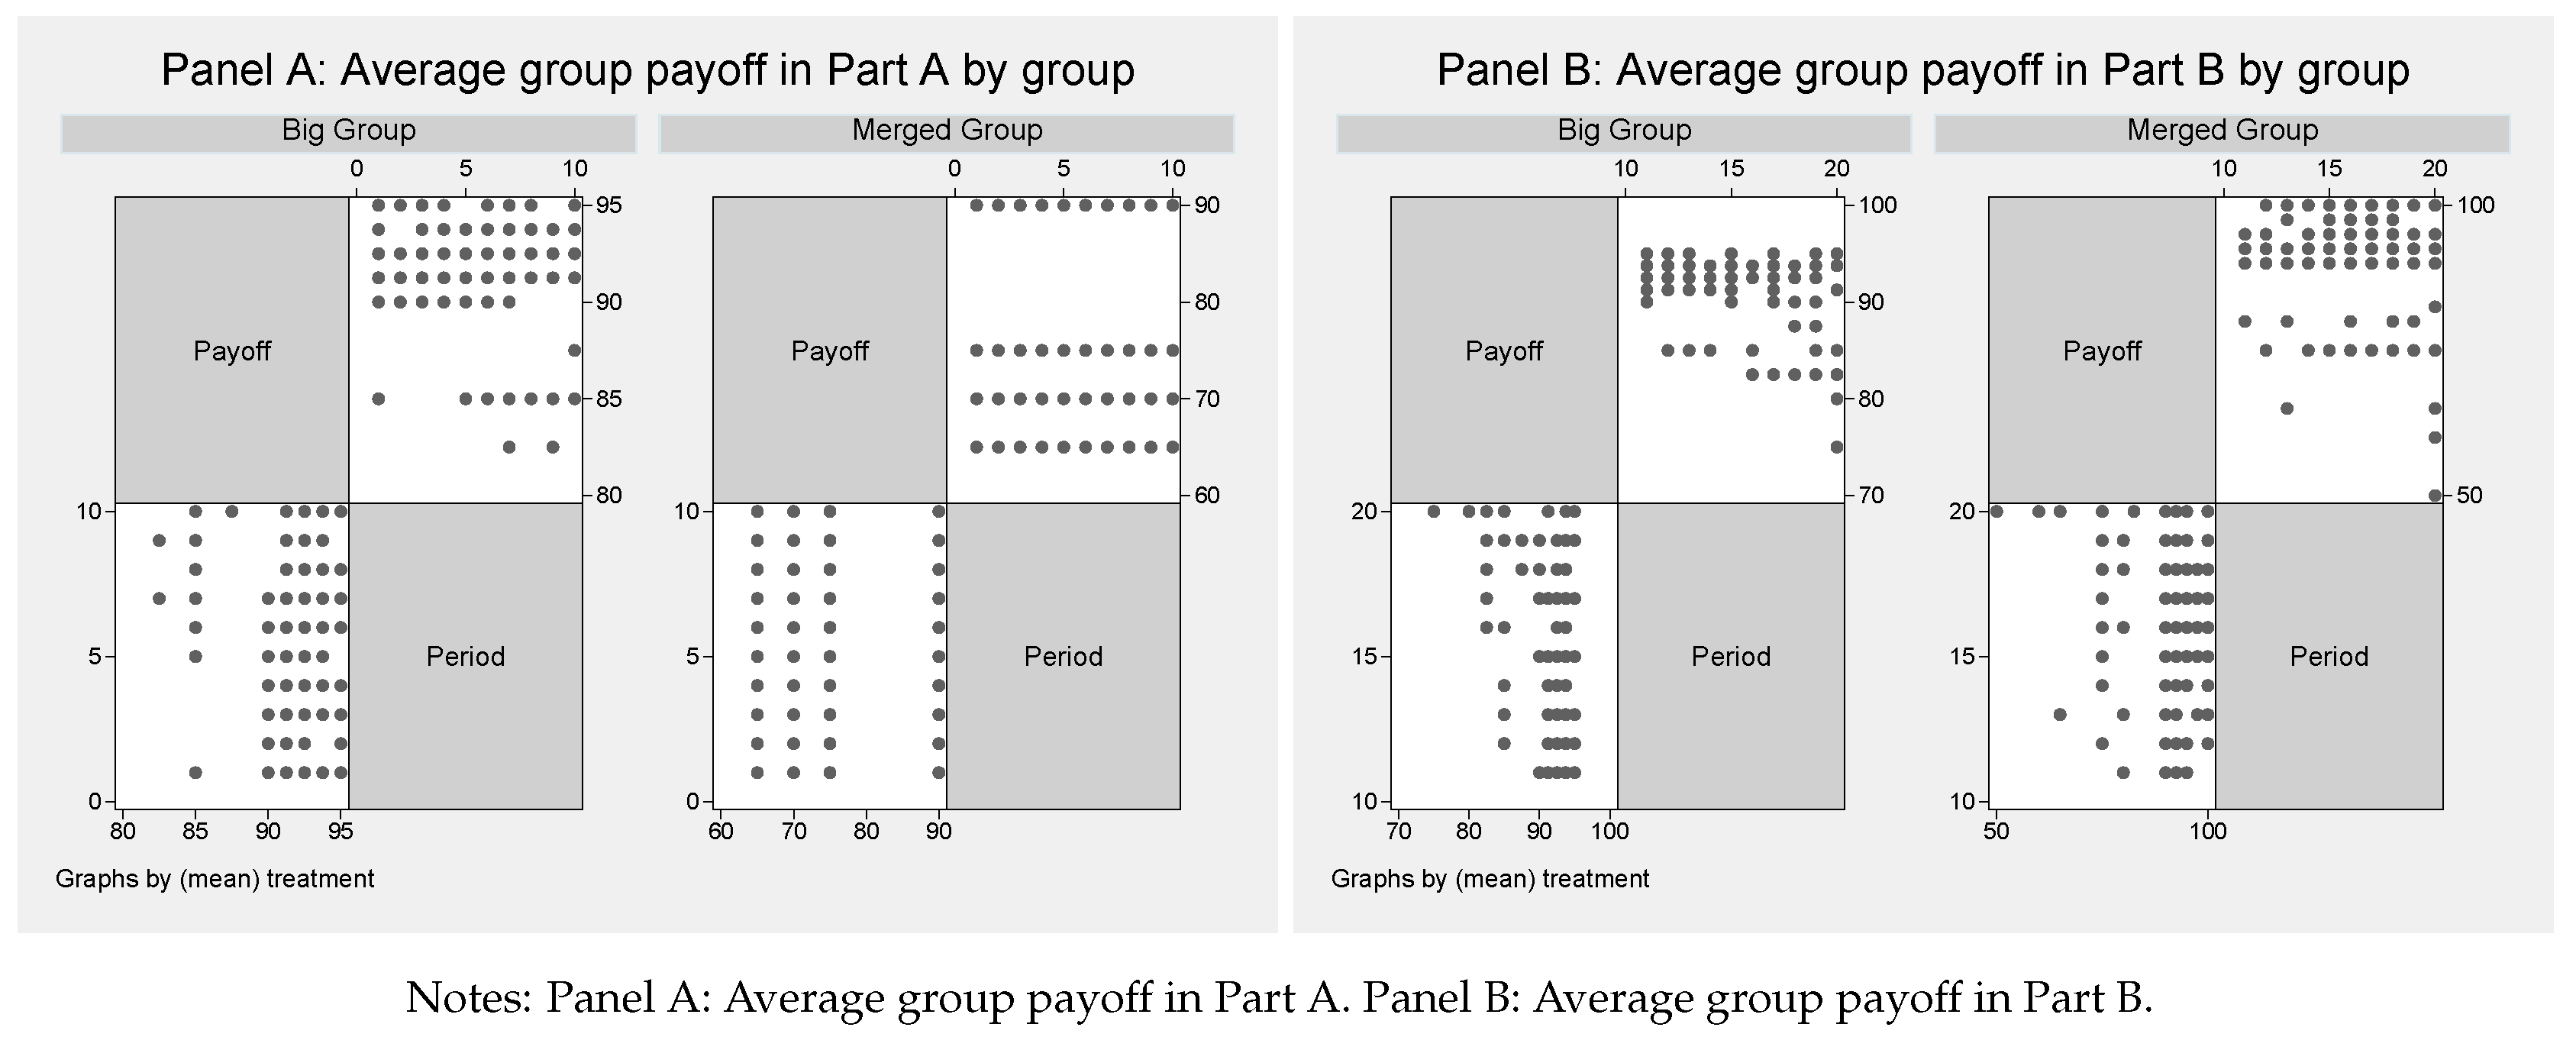
Table 3 presents summary statistics for the main dependent variable (the average helping rate by group) in Part B of the experiment.14 The table presents results for the Big Group treatment (Columns 1–3) and for the Merged Group treatment (Columns 4–7). Figure A1 in Appendix A.1 graphically displays treatment differences over time. Summary statistics for the number of helpers in a group and for average group payoffs are presented in Table A4 in Appendix A.2.
Table 3 statistics (Column 1 vs. Column 4) show that the average helping rate is about 11% (6 percentage points) higher in the Merged Group treatment (63%) compared with the Big Group treatment (57%). Table 4 provides statistical evidence for the results presented in Table 3. The table shows results from linear regressions with robust standard errors and group averages as observations.15 Column 1 of the table presents regressions results comparing group averages between the Big Group treatment and the Merged Group treatment and shows that the difference of six percentage points is marginally significant (at the 10% level). Result 1 supports Hypothesis 1:
Result 1.
Helping rates in merged groups are higher compared with helping rates in big groups that play the helping game in the same group constellation throughout the experiment.
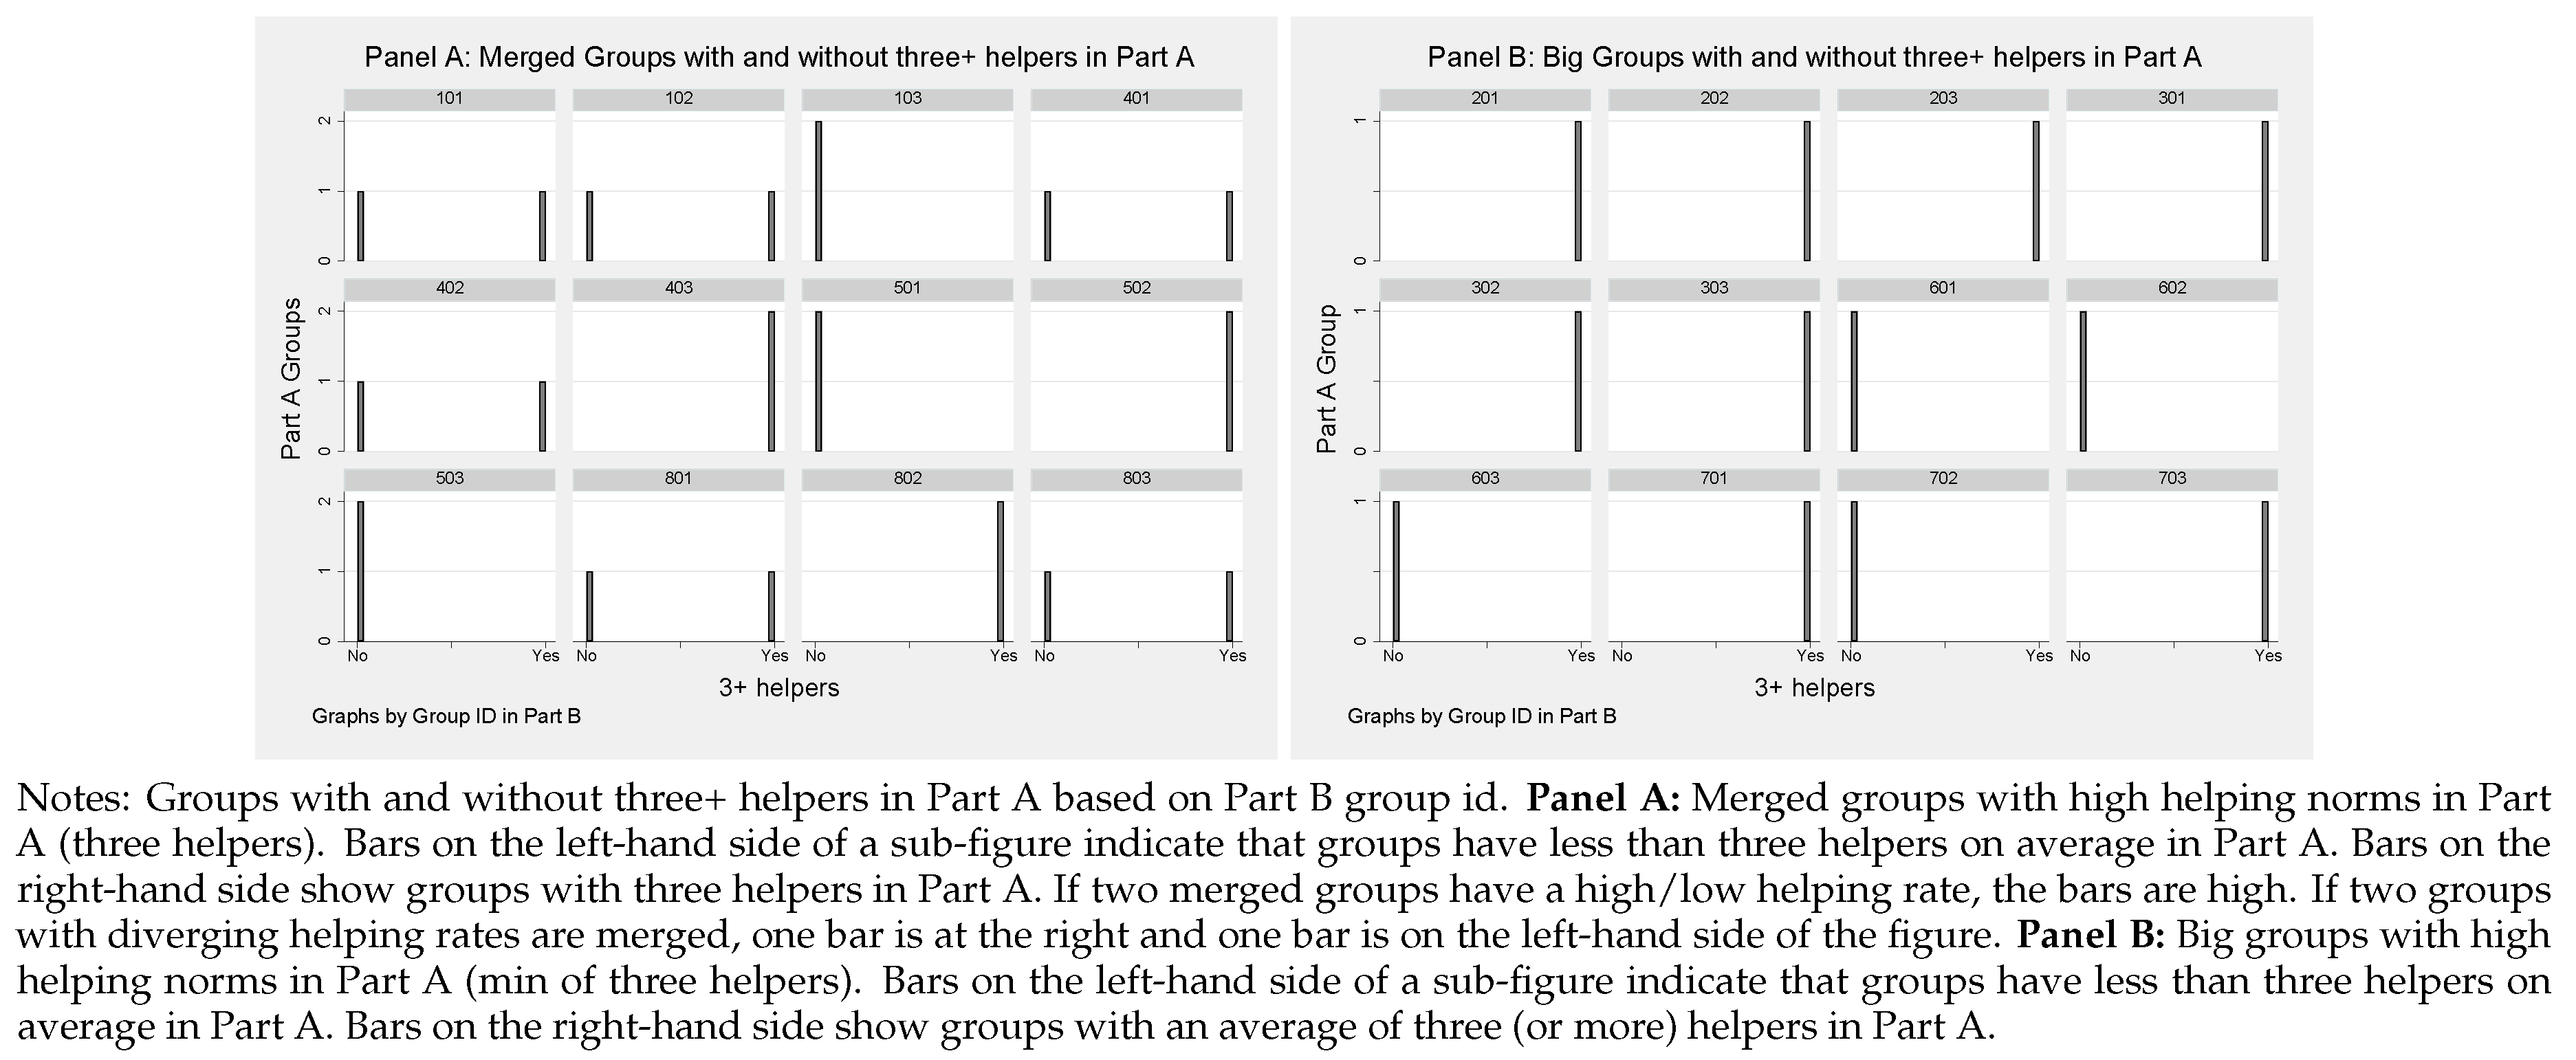
Column 1 of Table A2 in Appendix A.1 presents results from difference-in-difference regressions between the Big Group treatment and the Merged Group treatment with the group helping rate as dependent variable. The helping rate in Merged Group treatment is significantly higher in Part A already (76.8% in the Merged Group treatment compared with 63.6% in the Big Group treatment). Between parts, the helping rate decreases in both treatments, but the decrease is not significantly stronger in the Merged Group treatment compared with the Big Group treatment. As a consequence, there are more groups with a high norm of helping (12) in the Merged Group treatment compared with the Big Group treatment (8) which impacts the average helping rate in Part B.16 Groups with an average of three (or more in the Big Group treatment) helpers per groups are classified as groups with a high helping norm. Groups with fewer helpers are classified as groups with a low helping norm.17
Table 3 summarizes the average group helping rate in Part B also for the different sub-groups. The results suggest that higher helping rates in the Merged Group treatment in Part B may be a result of more influential high helping norms. Precisely, the table presents summary statistics for the average helping rates in Part B for big groups which had a high helping norm in Part A (Column 2) and for big groups that had a low helping norm in Part A (Column 3). The table also shows Part B helping rates for the different combinations of small groups in the Merged Group treatment (Column 5–7). Since groups randomly merge, three possibilities arise: First, two groups with a high helping norm in Part A form a big group in Part B (High-High; Column 5). Second, a group with a high helping norm in Part A is randomly merged with a group that had a low helping norm in Part A (High-Low; Column 6). These two groups form a group in Part B. Third, two groups with a low helping norm in Part A form a big group in Part B (Low-Low; Column 7). As anticipated in Section 2.5, there is no difference in helping rates when comparing helping rates in big groups with a high helping norm (64%) with merged groups when both merged groups had a high helping norm in Part A (70%). Table 4 presents statistical evidence for comparing sub-groups between treatments. Column 2 of Table 4 presents regression results comparing Part B helping rates in big groups with a high helping norm in Part A to Part B helping rates in the case of a random group merger between two small groups with a high helping norm. The regressions show that the difference of six percentage points in helping rates is insignificant. When comparing helping behavior in big groups with a low helping norm (43%) to helping rates in merged groups with a low helping norm (32%); however, helping rates in big groups are significantly higher in the Big Group treatment (see Column 7 in Table 4 for regression results).
The most interesting between treatment comparison is, however, the one between big groups who play the helping game in the same constellation in both parts of the experiments and have established a high (low) helping norm in Part A and merged groups that consist of two groups that have established diverging (high and low) helping norms in Part A. Column 6 in Table 3 shows the average helping rate in merged groups with different (High-Low) helping norms (76%). Row 3 of the column further presents Part B helping rates in these groups for the sub-group with a high helping norm (84%) in Part A and for the sub-group with a low helping norm (67%) in Part A. Table 4 presents statistical evidence for theses sub-group comparisons, too. Column 3 of Table 4 shows that helping rates in High-Low merged groups are significantly (12 percentage points) higher than in big groups with a high helping norm. Column 4 of Table 4 further indicates that, in these groups, the helping rates are significantly (by 21 percentage points) higher compared with big groups with a low helping norm. Moreover, Column 5 presents regression results comparing helping rates in big groups with a high helping norm with the sub-group with a high helping norm in the merged group only (High-Low). Column 6 presents regressions comparing helping rates in big groups with a low helping norm with the sub-group with a low helping norm in the merged groups only (High-Low). The regressions show that groups with a high helping norm that have been merged with a group that had a low helping norm display significantly higher helping rates compared to big groups with a high helping norm (21 percentage points). Likewise, when restricting observations to low helping norm groups that have been merged with a high helping norm group, helping rates are significantly higher (by 23 percentage points) compared with big groups that had a low helping norm in Part A. Results 2 and 3 summarize these findings:
Result 2.
When two groups with different helping norms from Part A are randomly merged in Part B, helping rates are higher in the merged groups compared with big groups that play the helping game in the same group constellation throughout the experiment and have established a high helping norm in Part A. In addition, helping rates in the high sub-group are higher compared with helping rates in big groups that stay in the same constellation throughout the experiment and established a high helping norm in Part A.
Result 3.
When two groups with different helping norms from Part A are randomly merged in Part B, helping rates are higher in the merged groups compared with big groups that play the helping game in the same group constellation throughout the experiment and have established a low helping norm in Part A. In addition, helping rates in the low sub-group are higher compared with helping rates in big groups that stay in the same constellation throughout the experiment and established a low helping norm in Part A.
Result 2 and Result 3 reject Hypotheses 2A and 3A. The results indicate that the higher average helping rates in merged groups compared to big groups that play the helping game with the same group members throughout the experiment presented in Result 1 is based on the bigger influence of high helping norms in the merged groups. Subjects in groups with a high helping norm seem to be motivated to help if merged with new group members with a low helping norm. Subjects in groups with a low helping norm also seem to be influenced by the new group members with a high helping norm and help.18
These findings already inform that, depending on the pre-existing helping norms in groups, merging small groups may be beneficial for group helping. The between treatment comparison, however, does not allow for testing whether high or low helping norms in the helping game are more influential per se. The reason is that, in the Merged Group treatment, groups increase in size and old group members now interact with new and old group members. In the Big Group treatment, group size and group membership stay constant. Subjects in the Big Group treatment may further be less prone to help because they have experienced, on average, a lower frequency of shocks (losing the endowment) and therefore did not experience others’ help to the same extent as subjects in the Merged Group treatment. The between treatment comparison thus does not allow for disentangling the effect of an increased group size from the effect of interacting with new group members in the helping game in Part B of the experiment. It further does not allow for taking the potentially lower frequency of experienced help (or the absence of it) nor differences in shock probability into account.
To identify whether high or low helping norms are more influential, I compare behavior within the Merged Group treatment. Here, subjects are always confronted with four new group members but whether a group with a high helping norm or a group with a low helping norm is merged with another group with the same (high/low) or a different helping norm (low/high) is random.
Table 3 statistics already indicate that helping rates within the Merged Group treatment are influenced by the presence of at least one group with a high helping norm. Table 5 presents results from linear OLS regressions within the Merged Group treatment. Column 1 of the Table presents regression results across all sub-groups with the Low-Low group merger as benchmark condition. High-High is a dummy variable indicating that a sub-group belongs to a merged group of two small groups with a high helping norm in Part A. High-Low is a dummy variable indicating a sub-group belongs to a merged group with a high and a low helping norm in Part A. In Column 2, regressions are limited to groups with a high helping norm in Part A, thus comparing sub-groups with a high helping norm that are combined with another sub-group with a high helping norm (High-High) to sub-groups with a high helping norm which have been combined with a group with a low helping norm (High-Low). In Column 3, regressions are limited to groups that had a low helping norm in Part A. Column 3 regressions therefore compare helping rates of merged groups with a low helping norm that have been combined with another group with a low helping norm (Low-Low) to a group with a low helping norm that has been merged with a group with a high helping norm (High-Low).
Across all sub-groups, helping rates are significantly higher in both High-High and High-Low groups. Between the High-High and High-Low groups, however, helping rates are not statistically different (post-estimation F-test: F(1, 117)= 1.22; p = 0.27). When limiting observations to sub-groups with a high helping norm, however, regression results show that helping rates in Part B are significantly higher compared with low helping norm sub-groups (see Column 2). Similarly, when comparing groups that had a low helping norm in Part A, groups that are merged with a high helping norm group display significantly higher helping rates in Part B (Column 3). Thus, in the Merged Group treatment, high helping norms are more influential compared with low helping norms.19 Supporting Hypothesis 4B, Result 4 emerges:
Result 4.
In merged groups, high helping norms are more influential than low helping norms. When two groups with high helping norms are merged, helping rates are not different compared to helping rates in merged groups that consist of one group with a high helping norm and one group with a low helping norm. When two groups with low helping norms are merged, helping rates are significantly lower compared with helping rates in merged groups that consist of one group with a high helping norm and one group with a low helping norm.
The data reveal that groups with a high helping norm help regardless of whether they are merged with a group that had a low helping norm in Part A or with another group that had a high helping norm in Part A. Groups with low helping norms are, however, more likely to help in Part B if they are merged with a group with a high helping norm in Part A.
The stark difference in helping between groups with low helping norms depending on the helping norm of the other group stems from subjects who, in Part A, only infrequently decided to help.20 Table A8 in Appendix A.3 shows that these subjects help more often when their group is merged with a group having a high helping norm. These subjects seem to be positively influenced by the helping norm of the new group members and condition their helping decision on the decision of others’ to help as well. Although subjects do not receive information on the helping history of the group they are merged with, they seem to rationally update their behavior based on whether they can expect others’ to reciprocate their helping decision. If both merged groups had a low helping norm in Part A, new group members likely do not help in Part B either. If one of the sub-groups had a high helping norm in Part A, however, this becomes more likely. This behavior may explain why, within the Merged Group treatment, high helping norms are more influential compared with low helping norms.21
4. Discussion of the Results and Limitations of the Study
In this experiment, the focus lies on helping behavior arising in merged groups after subjects were able to experience helping behavior in small groups. The study shows that, when groups randomly merge from small to big groups, they are, on average, more likely to sustain helping compared with big groups who do not change in size and remain constant throughout the experiment. The data suggest that behavior in Part A of the experiment determines whether merged groups are more likely to display higher helping behavior compared with big groups in Part B. Whether merging groups is beneficial for helping behavior depends on whether groups with high helping norms in Part A are part of the group merger in Part B. When two groups with low helping norms in Part A randomly merge, helping rates in Part B of the experiment are lower compared with big group counterparts that had a low helping norm in Part A.
In the experiment, however, merged groups increase in size and new group members are included. Big groups, on the contrary, remain constant throughout the experiment. The interpretation of the results is therefore limited as merging groups per se leads to higher helping behavior compared with helping behavior in big groups. Moreover, in Part A of the experiment, three helpers are needed to achieve the socially optimal helping outcome in big groups of eight and in small groups of four. Coordination on helping may therefore be easier in small groups. Subjects further know the identity of the subject who lost the endowment and can more easily identify uncooperative subjects in the small group setting. While comparing behavior in Part A between treatments is not the focus of the experiment, this may influence behavior in big groups in Part B too. Helping norms in Part A may be influenced more by subjects’ tendency to build a reputation for being seen as pro-social, reciprocity or retaliation compared with helping norms in big groups.
To account for these limitations, the data are analyzed within the merged group treatment and helping rates are compared across different combinations of groups. The results are similar to the ones established between treatments. The data show that groups with high helping rates in Part A influence helping behavior more compared with groups that had a low helping rate in Part A. Helping behavior in merged groups largely depends on whether at least one sub-group shares a high helping norm.
The finding that high helping norms are more influential than low helping norms contrasts with findings from experiments studying group mergers using public goods games—see, e.g., Ranehill et al. [33], in which few selfish players induce subjects to adjust their strategy and free-riding increases. However, in this experiment, when subjects in groups with low helping rates are confronted with a collective of others (the new group) which exhibits high helping behavior, the negative consequence of the few selfish subjects is attenuated. In this case, it seems as if subjects who only sometimes help in their groups pre-merger now observe a substantial number of others who help and thus they also help. Subjects seem to rationally update their behavior as subjects in groups with low helping norms are more likely to help new group members compared to old group members who have not proven to behave in a solidaric manner.
In contrast to the studies using public goods games, however, there is no full feedback about the behavior of others’ in the helping game. Subjects who want to ensure that the subject in need receives help need to help although there might already be a sufficient number of helpers. This difference in feedback provision in contrast to public goods games may also explain deviations from findings in other studies. Moreover, the helping game also entails features from the volunteer’s dilemma. The risk that one subject may lose her endowment if not enough others’ help may lead to a slower decline in helping rates compared with cooperation in public goods games studying group mergers. Thus, in line with Przepiorka and Diekmann [71] who show that heterogeneity of subjects may be beneficial for coordination in volunteer’s dilemma situations, a clash of norms by heterogeneous groups does not necessary lead to bad outcomes.
These results are important for team leaders in organizations as they introduce and lay foundations of costly cooperation in sequentially different sized groups. These findings can improve situations at the workplace in many areas. Assembling teams of workers in smaller groups and combining these groups in situations that require more manpower can result in higher amounts of help among team members. In the experiment, I highlight that individuals behave more socially in similar situations. Furthermore, the experiment provides insights on how to induce an increase in helping behavior when people do show low helping behavior small groups. In these situations, subjects aim for a new start with new group members when group size increases and the new group members share a high helping norm. No positive effects, however, were found when two low solidarity groups merge. Here, the group mergers seem to negatively impact overall helping rates. Because of the limited number of observations on the group level, however, multiple hypothesis testing correction was not feasible with the sample size. More research is needed to explore situations in which combining groups is beneficial or detrimental for outcomes. Additionally, the present paper studies a volunteer’s dilemma like situation in which helping behavior of other group members is not perfectly observable. Future research may take into account that whether others already help or not may sometimes be observable in group settings. When helping behavior is revealed to others, subjects may be willing to sacrifice resources to build up a reputation for being seen as pro-social. This may increase the utility of some subjects and increase helping rates. Duca and Nax [75] find that such reputation mechanism are less effective in big as opposed to small groups in multi person prisoners’ dilemma settings. It would be interesting to study whether—and which kind of—reputation mechanism may sustain cooperation if groups randomly merge and increase in size.22 In particular, it would be interesting to know whether certain reputation mechanisms such as, e.g., image scoring remain effective in bigger groups if the mechanism are implemented already before groups merge. Findings from the experiment presented in this paper suggest that this may be the case as groups with high helping norms induce subjects from groups with low helping norms to start helping post-merger even in the absence of explicit image scores. In addition, future research may shed light on how the difficulty of achieving solidarity outcomes in small and big groups may affect behavior post-merger.
Supplementary Materials
The supplementary files are available online at https://0-www-mdpi-com.brum.beds.ac.uk/2073-4336/10/3/30/s1.
Funding
This research was funded by the WISO Graduate School of the University of Hamburg. Additional financial support from the German Research Foundation (Grant No. GRK 1597/1) is acknowledged.
Acknowledgments
I thank the editors, Heinrich Nax and Juri Viehoff for their helpful advice during the review process. I further thank four anonymous referees for their helpful comments and suggestions. Moreover, I am indebted to Jannis Liedtke for his invaluable support, input and help during the research process. I additionally thank Philipp Doerrenberg, Claus Ghesla, Manuel Grieder, Alexander Götz, Sebastian Hafenbrädl, Deborah Kistler, Andreas Lange, Laura Metzger, Andreas Nicklisch, Renate Schubert, Felix Schlüter, Frédéric Schneider, Marcel Stadelmann and Christian Zehnder for helpful comments and suggestions. Financial support by the WISO Graduate School of the University of Hamburg and the German Research Foundation (Grant No. GRK 1597/1) is acknowledged.
Conflicts of Interest
The author declares no conflict of interest. In addition, the funders had no role in the design of the study; in the collection, analyses, or interpretation of data; in the writing of the manuscript, or in the decision to publish the results.
Appendix A
Appendix A.1. Helping Rates in Part B, DID Regressions, Group Composition and Part B Behavior—Full Helping, Median and Mean Split
Figure A1.
Helping rates in Part B.


Table A1.
Linear regressions: #Helpers in Part B.
| Big Group | All vs. | High vs. | Low vs. | ||
|---|---|---|---|---|---|
| Merged Group | All | High-High | High-Low | High-Low | Low-Low |
| (1) | (2) | (3) | (4) | (5) | |
| Merged Group | 0.433 | 0.433 | 0.833 | 2.258 | −0.842 |
| (0.238) | (0.323) | (0.257) | (0.323) | (0.414) | |
| Constant | 4.025 | 4.500 | 4.500 | 3.075 | 3.075 |
| (0.140) | (0.145) | (0.145) | (0.243) | (0.244) | |
| Observations | 240 | 110 | 140 | 100 | 70 |
| F | 3.308 | 1.795 | 10.55 | 48.88 | 4.141 |
| R | 0.0137 | 0.0195 | 0.0756 | 0.327 | 0.0600 |
Notes: Linear regressions with period group averages as observations. Robust Standard Errors in parentheses. * , ** , *** . Merged Group is a variable that is equal to one for groups in the Merged Group treatment and zero otherwise. Dependent variable in all regressions: Average number of helpers per group. Column 1: Comparison across all big and merged groups. Column 2: Regressions limited to big groups with a high helping norm and merged groups with high helping norms. Column 3: Regressions limited to big groups with a high helping norm and merged groups with a high helping norm and a low helping norm. Column 4: Regressions limited to big groups with a low helping norm and merged groups with a high helping norm and a low helping norm. Column 5: Regressions limited to big groups with a low helping norm and merged groups with low helping norms.
Table A2.
Difference-in-difference regressions: helping rates, #Helpers and payoff.
| Helping Rate | #Helpers | Payoff | |
|---|---|---|---|
| (1) | (2) | (3) | |
| Merged Group | 0.132 | −2.146 | -8.385 |
| (0.0306) | (0.152) | (0.651) | |
| Part B | −0.0655 | −0.425 | −0.510 |
| (0.0279) | (0.194) | (0.429) | |
| Merged Group × Part B | −0.0692 | 2.579 | 7.406 |
| (0.0426) | (0.247) | (0.852) | |
| Constant | 0.636 | 4.450 | 92.09 |
| (0.0192) | (0.134) | (0.253) | |
| Observations | 720 | 720 | 720 |
| F | 13.55 | 121.0 | 56.65 |
| R | 0.0532 | 0.266 | 0.215 |
Notes: Difference-in-Difference regressions with period group averages as observations. Robust Standard Errors in parentheses. * , ** , *** . Merged Group is a variable which is equal to one for groups in the Merged Group treatment and zero otherwise. Part B is a dummy variable for Part B. Merged Group × Part B captures the interaction term between the Merged Group treatment and Part B. Dependent variables: Column 1: Mean Helping Rate; Column 2: Mean number of helpers per group; Column 3: Average payoff per group.
Figure A2.
High and low helping norms in Part A by Part B groups.

Table A3.
Average helping rate and average group payoff in Part B by treatment and sub-group—median split and mean split.
Table A3.
Average helping rate and average group payoff in Part B by treatment and sub-group—median split and mean split.
| Panel A: Median Split | Big Group | Merged Group | |||||
| All | High | Low | All | High-High | High-Low | Low-Low | |
| Helping Rate | 0.570 | 0.671 | 0.469 | 0.633 | 0.70 | 0.757 | 0.319 |
| (0.168) | (0.108) | (0.162) | (0.250) | (0.049) | (0.169) | (0.265) | |
| 0.844; 0.674 | |||||||
| (0.117; 0.265) | |||||||
| #Helpers | 3.99 | 4.7 | 3.28 | 4.433 | 4.9 | 5.3 | 2.23 |
| (1.179) | (0.770) | (1.359) | (1.753) | (0.346) | (1.184) | (1.855) | |
| 2.88; 2.42 | |||||||
| (0.402; 0.945) | |||||||
| Payoff | 91.58 | 91.97 | 91.19 | 90.60 | 91.29 | 91.45 | 88.21 |
| (2.126) | (1.165) | (2.865) | (2.026) | (2.19) | (1.185) | (2.444) | |
| 90.78; 93.07 | |||||||
| (0.754; 2.491) | |||||||
| Panel B: Mean Split | Big Group | Merged Group | |||||
| All | High | Low | All | High-High | High-Low | Low-Low | |
| Helping Rate | 0.570 | 0.671 | 0.469 | 0.633 | 0.72 | 0.714 | 0.192 |
| (0.168) | (0.108) | (0.162) | (0.250) | (0.136) | (0.170) | (0.212) | |
| 0.838; 0.599 | |||||||
| (0.151; 0.252) | |||||||
| #Helpers | 3.99 | 4.7 | 3.28 | 4.433 | 5.08 | 5 | 1.35 |
| (1.179) | (0.770) | (1.359) | (1.753) | (0.951) | (1.191) | (1.484) | |
| 2.78; 2.22 | |||||||
| (0.567; 0.953) | |||||||
| Payoff | 91.58 | 91.97 | 91.19 | 90.60 | 91.13 | 91.53 | 87.19 |
| (2.126) | (1.165) | (2.865) | (2.026) | (1.657) | (2.157) | (2.303) | |
| 91.00; 93.09 | |||||||
| (0.869; 2.738) | |||||||
Notes: Mean of variables with standard deviation on the Part B group level in parentheses. Helping Rate describes the mean helping rate in Part B. Payoff describes average group payoff in Part B. Columns 1–3 present variables in the Big Group treatment- Column 1 shows variable averages in all big groups. Column 2 presents means of variable in big groups with a high helping norm in Part A. Column 3 shows averages for big groups with a low helping norm in Part A. Columns 4–8 present averages in the Merged Group treatment. Column 4 presents variable averages for all merged groups. Column 5 presents means of variables if two groups with a high helping norm in Part A are merged. Column 6 present averages if one group with a high helping norm in Part A is merged with a group with a low helping norm in Part A. Row 3, Row 7 and Row 11 in Column 6 presents averages for the sub-groups (high; low) in case two groups with different helping norms are merged. Column 7 presents mean of variables if two groups with a low helping norm in Part A are merged. Panel A: presents mean of variables when groups with above median helping rates (0.97 in the Merged Group treatment and 0.63 in the Big Group treatment) in Part A. Panel C: presents mean of variables when groups with above mean helping rates (0.77 in the Merged Group treatment and 0.64 in the Big Group treatment) in Part A.
Appendix A.2. Number of Helpers and Group Payoff
Table A4.
Average group payoff and #Helpers in Part B by treatment and sub-group.
| Big Group | Merged Group | ||||||
|---|---|---|---|---|---|---|---|
| All | High | Low | All | High-High | High-Low | Low-Low | |
| #Helpers | 3.99 | 4.7 | 3.28 | 4.433 | 4.9 | 5.3 | 2.23 |
| (1.179) | (0.770) | (1.359) | (1.753) | (0.346) | (1.184) | (1.855) | |
| 2.88; 2.42 | |||||||
| (0.402; 0.945) | |||||||
| Payoff | 91.58 | 92.13 | 90.60 | 90.60 | 91.29 | 91.45 | 88.20 |
| (2.126) | (1.629) | (3.323) | (2.427) | (2.188) | (1.786) | (2.467) | |
| 90.54; 92.38 | |||||||
| (0.827; 2.078) | |||||||
Notes: Mean of variables with standard deviation on the Part B group level in parentheses. #Helpers describes the mean number of subjects who help in a group in Part B. Payoff describes average group payoff in Part B. Columns 1–3 present variables in the Big Group treatment- Column 1 shows variable averages in all big groups. Column 2 presents means of variable in big groups with a high helping norm in Part A. Column 3 shows averages for big groups with a low helping norm in Part A. Columns 4–8 present averages in the Merged Group treatment. Column 4 presents variable averages for all merged groups. Column 5 presents means of variables if two groups with a high helping norm in Part A are merged. Column 6 presents averages if one group with a high helping norm in Part A is merged with a group with a low helping norm in Part A. Row 3 and Row 5 in Column 6 presents averages for the sub-groups (high; low) in case two groups with different helping norms are merged. Column 7 presents mean of variables if two groups with a low helping norm in Part A are merged.
Table A5.
Linear regressions: group payoffs in Part B.
| Big Group | All vs. | High vs. | Low vs. | High vs. | Low vs. | ||
|---|---|---|---|---|---|---|---|
| Merged Group | All | High-High | High-Low | High-Low | High-Low | High-Low | Low-Low |
| (1) | (2) | (3) | (4) | (5) | (6) | (7) | |
| Merged Group | −0.979 | −0.833 | −0.667 | 0.958 | −1.583 | 1.875 | −2.292 |
| (0.516) | (0.632) | (0.516) | (0.830) | (0.516) | (0.867) | (1.349) | |
| Constant | 91.58 | 92.12 | 92.12 | 90.50 | 92.13 | 90.50 | 90.50 |
| (0.347) | (0.355) | (0.354) | (0.740) | (0.354) | (0.740) | (0.743) | |
| Observations | 240 | 110 | 140 | 100 | 140 | 100 | 70 |
| F | 3.601 | 1.736 | 1.667 | 1.332 | 9.398 | 4.680 | 2.885 |
| R | 0.0149 | 0.0144 | 0.0117 | 0.0160 | 0.0623 | 0.0508 | 0.0438 |
Notes: Linear regressions with period group averages as observations. Robust Standard Errors in parentheses. * , ** , *** . Merged Group is a variable which is equal to one for groups in the Merged Group treatment and zero otherwise. Dependent variable in all regressions: Group Payoff. Column 1: Comparison across all big and merged groups. Column 2: Regressions limited to big groups with a high helping norm and merged groups with high helping norms. Column 3: Regressions limited to big groups with a high helping norm and merged groups with a high helping norm and a low helping norm. Column 4: Regressions limited to big groups with a low helping norm and merged groups with a high helping norm and a low helping norm. Column 5: Regressions limited to big groups with a high helping norm and merged groups with a high helping norm which have been merged with a group with a low helping norm. Column 6: Regressions limited to big groups with a low helping norm and merged groups with a low helping norm which have been merged with a group with a high helping norm. Column 7: Regressions limited to big groups with a low helping norm and merged groups with low helping norms.
Table A6.
Linear regressions: average number of subjects per group who help in Part B—merged group treatment.
Table A6.
Linear regressions: average number of subjects per group who help in Part B—merged group treatment.
| All | High | Low | |
|---|---|---|---|
| (1) | (2) | (3) | |
| High-High | 2.700 *** | ||
| (0.442) | |||
| High-Low | 3.100 *** | 0.433 *** | 1.300 *** |
| (0.395) | (0.164) | (0.205) | |
| Constant | 2.233 *** | 2.450 *** | 1.117 *** |
| (0.333) | (0.127) | (0.130) | |
| Observations | 120 | 120 | 120 |
| F | 31.81 | 6.995 | 40.21 |
| R | 0.378 | 0.0560 | 0.254 |
Notes: Linear regressions with period group averages as observations. Robust Standard Errors in parentheses. * , ** , *** . High-High is a variable describing two merged groups with a high helping norm. High-Low is a variable describing two merged groups in which one has a high helping norm and one has a low helping norm. Dependent variable in all regressions is the average number of helpers per group. Benchmark condition in Column 1 are merged groups with a low helping norm. In Column 2, the benchmark condition are two groups with a high helping norm (in High-Low groups). Regressions are limited to groups with a high helping norm. In Column 3, the benchmark condition are two groups with a low helping norm. Regressions are limited to groups with a low helping norm (in High-Low groups).
Table A7.
Linear regressions: average group payoff in Part B—merged group treatment.
| All | High | Low | |
|---|---|---|---|
| (1) | (2) | (3) | |
| High-High | −0.905 | ||
| (1.133) | |||
| High-Low | −1.143 | −1.375 * | 0.0556 |
| (1.056) | (0.762) | (1.103) | |
| Constant | 93.10 *** | 92.15 *** | 93.11 *** |
| (1.016) | (0.674) | (1.024) | |
| Observations | 120 | 120 | 120 |
| F | 0.623 | 3.258 | 0.00254 |
| R | 0.0185 | 0.0269 | 0.0000215 |
Notes: Linear regressions with period group averages as observations. Robust Standard Errors in parentheses. * , ** , *** . High-High is a variable describing two merged groups with a high helping norm. High-Low is a variable describing two merged groups in which one has a high helping norm and one has a low helping norm. Dependent variable in all regressions is group payoff. Benchmark condition in Column 1 are merged groups with a low helping norm. In Column 2, the benchmark condition are two groups with a high helping norm (in High-Low groups). Regressions are limited to groups with a high helping norm. In Column 3, the benchmark condition are two groups with a low helping norm. Regressions are limited to groups with a low helping norm (in High-Low groups).
Appendix A.3. Helping: New vs. Old Group Members
Table A8.
Linear regressions: Part B helping in low-low and high-low groups of subjects who only sometimes help in Part A.
Table A8.
Linear regressions: Part B helping in low-low and high-low groups of subjects who only sometimes help in Part A.
| Individual Decision to Help | |
|---|---|
| (1) | |
| High-low | 0.409 *** |
| (0.0611) | |
| Constant | 0.341 *** |
| (0.0410) | |
| Observations | 227 |
| F | 44.85 |
| R | 0.162 |
Notes: Linear regressions with individual decisions as observations. Robust Standard Errors in parentheses. * , ** , *** . HighlLow is a variable which is equal to one if a subject who only sometimes helped in Part A is in a merged group with subjects with high helping norms in Part A. Dependent variable: Decision to Help. Benchmark condition is a Low-Low merged group.
Table A9.
Helping: New vs. Old Group members.
| Merged Group | ||||
|---|---|---|---|---|
| High-High | High-Low | High-Low | Low-Low | |
| Old Group | 0.645 | 0.883 | 0.585 | 0.297 |
| (0.122) | (0.152) | (0.312) | (0.227) | |
| New Group | 0.593 | 0.813 | 0.712 | 0.356 |
| (0.237) | (0.145) | (0.273) | (0.279) | |
Notes: Mean of variables with standard deviation on the Part A group level in parentheses. Old Group represents the mean helping rate if a Part A group member loses the endowment. New Group shows the mean helping rate if a group member who is new in Part B loses the endowment. Column 1 describes the mean helping rate for new and old group members if two groups with a high helping norm are merged. Column 2 shows mean helping rates for groups with a high helping norm if this group is merged with a group with a low helping norm. Column 3 presents mean helping rates for groups with a low helping norm if this group is merged with a group with a high helping norm. Column 4 presents the mean helping rate for new and old group members if two groups with a low helping norm are merged.
Table A10.
Linear regressions: helping of new group members.
| Helping Rate | ||
|---|---|---|
| (1) | (2) | |
| New Group | 0.0341 | 0.104 |
| (0.0390) | (0.0523) | |
| Constant | 0.711 | 0.435 |
| (0.0192) | (0.0309) | |
| Observations | 200 | 160 |
| F | 0.767 | 3.949 |
| R | 0.00415 | 0.0255 |
Notes: Linear regressions with period group averages as observations. Robust Standard Errors in parentheses. * , ** , *** . New Group is a variable which is equal to one if the subject in need is from the new group and zero otherwise. Dependent variable: Mean Helping Rate by group. Column 1: Regressions limited to groups with a high helping norm in Part A. Column 2: Regressions limited to groups with a low helping norm in Part A.
Appendix A.4. Efficiency
Table A11 highlights the group efficient outcomes. In each group, exactly three subjects need to help. If fewer subjects (or more in a group of eight) help, the efficient group payment is not reached.
Table A11.
Helping game: group payoffs.
| # Subjects Help | Group of 4 Payoff | Group of 8 Payoff |
|---|---|---|
| 0 | 300 | 700 |
| 1 | 260 | 630 |
| 2 | 280 | 680 |
| 3 | 360 | 760 |
| 4 | – | 750 |
| 5 | – | 740 |
| 6 | – | 730 |
| 7 | – | 720 |
The average total payoff in the groups in period one to ten was 737 tokens in the big groups and 335 tokens in the small groups. Thus, both groups were close to the efficiency level of 760 tokens and 360 tokens, respectively. In period eleven to 20, a similar pattern is observed. Average total tokens paid out in a group were 733 in the big groups and 725 in the combined groups. Thus, there is little difference between treatments. There is a reason to believe that subjects did not try to coordinate on such an outcome but rather that the decision to help or not was the focus of their action. First, no information was provided such that a coordination on efficiency would be a process of learning. I do not expect significant learning effects due to small number of iterations of the game and the absence of aggregate information on helping rates. As a second piece of evidence, regression results from linear regressions with robust standard errors are presented in Table A12.
Table A12.
Linear regressions: individual helping—coordination on efficiency.
| Part: | Part A | Part B | ||
|---|---|---|---|---|
| Treatment: | Big Group | Merged Group | Big Group | Merged Group |
| (1) | (2) | (3) | (4) | |
| Efficient Helping () | 0.217 | 0.715 | 0.129 | 0.401 |
| (0.0737) | (0.0725) | (0.115) | (0.147) | |
| Over Efficient Helping () | 0.412 | 0.375 | 0.615 | |
| (0.0607) | (0.0520) | (0.0966) | ||
| Period | −0.0113 | −0.00836 | −0.0168 | −0.0179 |
| (0.00690) | (0.00553) | (0.00476) | (0.00766) | |
| Constant | 0.358 | 0.321 | 0.524 | 0.404 |
| (0.0785) | (0.0627) | (0.0842) | (0.158) | |
| Observations | 756 | 648 | 840 | 840 |
| F | 21.97 | 52.98 | 31.02 | 26.86 |
| R | 0.0758 | 0.612 | 0.0924 | 0.228 |
Notes: Robust Standard Errors in parentheses. * , ** , *** . Dependent variable: individual decision to help in a period. Standard errors are clustered on the session-group level. Efficient Helping () indicates whether the previous period helping was already efficient. Over Efficient Helping () is a variable indicating that too many subjects helped in the previous period. Period is a variable controlling for time trends.
If subjects were to coordinate on a group efficient outcome, I would expect helping to be inversely affected by last period over-efficient helping (over efficient helping ()) and not (or positively in small groups) affected by efficient helping (efficient helping ()). In Column 2 and Column 3, regressions for the Big Group treatment and the Merged Group treatment in the first ten periods are presented. There is a positive effect on helping when the efficient outcome was reached but also a positive effect on the decision to help when more than the efficient number of group members helped (in the big group). This indicates that subjects did not coordinate on the efficient outcome in the first ten periods. If so, they were more successful in the small groups. However, this is because coordination on full solidarity is also the efficient outcome in small groups. In Column 4 and Column 5, similar regressions for the Part B of the experiment are presented. Patterns are similar in both treatments indicating that subjects do not coordinate on efficiency or likewise fail to do so.
Furthermore, suggestive evidence that efficiency concerns are only a minor part of subjects’ motivation to help is presented in Table A13. The table presents summary statistics for subjects’ answers to open questions in the post experimental survey. Precisely, subjects were asked to state their motivation for “having chosen Option A” (having helped) and for “having chosen Option B/not having chosen Option A” (not having helped) in the experiment. In addition, 150 subjects answer the first question and only 67 subjects provide answers to the second question. Most frequently, subjects state that they help because others do so too and because they believe helping increases payoffs for everyone (36%—Reciprocity in Panel A). Subjects relate to helping because of pro-social motives almost as frequent (33% of the answers). Only about 4% of the subjects state that they did not help because helping was not efficient or because they thought that enough others already helped.
Table A13.
Summary statistics: reason to help or not to help—questionnaire answers.
| Panel A: Helpreason | Big Group | Merged Group | Total |
| Efficiency | 0 | 0 | 0 |
| (0) | (0) | (0) | |
| Reciprocity | 0.313 | 0.406 | 0.359 |
| (0.466) | (0.494) | (0.481) | |
| Pro Social | 0.323 | 0.333 | 0.328 |
| (0.470) | (0.474) | (0.471) | |
| Payoff | 0.0208 | 0.0625 | 0.0417 |
| (0.144) | (0.243) | (0.200) | |
| Other | 0.0833 | 0.0208 | 0.0521 |
| (0.278) | (0.144) | (0.223) | |
| Panel G: Reason Not to Help | Big Group | Merged Group | Total |
| Efficiency | 0.0313 | 0.0417 | 0.0365 |
| (0.175) | (0.201) | (0.188) | |
| Reciprocity | 0.0729 | 0.135 | 0.104 |
| (0.261) | (0.344) | (0.306) | |
| Pro Social | 0 | 0 | 0 |
| (0) | (0) | (0) | |
| Payoff | 0.125 | 0.0833 | 0.104 |
| (0.332) | (0.278) | (0.306) | |
| Other | 0.0833 | 0.0208 | 0.0521 |
| (0.278) | (0.144) | (0.223) |
Notes: Mean of variables with standard deviation in parentheses. Panel A: Answers to open questions in post experiment survey: Reasons for having helped. Panel B: Answers to open questions: Reasons for not having helped. Efficiency is equal to one if subjects state they have helped/not helped because of efficiency reasons. Reciprocity is a variable describing that subjects helped/not help because others did so too/did not help and if subjects think it that helping increases group welfare. Pro Social is a variable describing that subjects help/do not help because of pro-social reasons (e.g., altruism). Payoff is a variable describing subjecs’ motivation to help or not because of individual payoff considerations. Other is a variable describing other helping motives (e.g. because I always chose Option A).
Appendix A.5. Part A Behavior, Period 11 Behavior and Behavior over Time
Table A14.
Average helping rate, average group payoff and average helpers per group in Part A by treatment and sub-group.
Table A14.
Average helping rate, average group payoff and average helpers per group in Part A by treatment and sub-group.
| Panel A: Full Solidarity | Big Group | Merged Group | ||||
| All | High | Low | All | High | Low | |
| Helping Rate | 0.635 | 0.730 | 0.446 | 0.768 | 1 | 0.536 |
| (0.178) | (0.113) | (0.124) | (0.351) | (0) | (0.374) | |
| #Helpers | 4.45 | 5.11 | 3.13 | 2.30 | 3 | 1.61 |
| (1.248) | (0.790) | (0.866) | (1.052) | (0) | (1.122) | |
| Payoff | 92.03 | 92.35 | 91.56 | 83.71 | 90 | 77.42 |
| (1.336) | (0.987) | (1.927) | (8.440) | (0) | (7.911) | |
| Panel B: Median Split | Big Group | Merged Group | ||||
| - | High | Low | - | High | Low | |
| Helping Rate | 0.769 | 0.502 | 1 | 0.356 | ||
| (0.103) | (0.129) | (0) | (0.255) | |||
| #Helpers | 5.38 | 3.52 | 3 | 1.07 | ||
| (0.719) | (0.906) | (0) | (0.765) | |||
| Payoff | 92.02 | 92.17 | 90 | 74.08 | ||
| (0.899) | (1.763) | (0) | (4.732) | |||
| Panel B: Mean Split | Big Group | Merged Group | ||||
| - | High | Low | - | High | Low | |
| Helping Rate | 0.769 | 0.502 | 0.991 | 0.321 | ||
| (0.103) | (0.129) | (0.149) | (0.247) | |||
| #Helpers | 5.38 | 3.52 | 2.97 | 0.96 | ||
| (0.719) | (0.906) | (0.447) | (0.741) | |||
| Payoff | 92.02 | 92.17 | 89.5 | 72.13 | ||
| (0.899) | (1.763) | (0.894) | (1.529) | |||
Notes: Mean of variables with standard deviation on the Part A group level in parentheses. Helping Rate describes the mean helping rate in Part A. Payoff describes average group payoff in Part A. #Helpers depicts the average number of subjects who help in a group. Columns 1–3 present variables in the Big Group treatment- Column 1 shows variable averages in all big groups. Column 2 presents means of variable in big groups with a high helping norm in Part A. Column 3 shows averages for big groups with a low helping norm in Part A. Columns 4–7 present averages in the Merged Group treatment. Column 4 presents variable averages for all merged groups in Part A. Column 5 presents means of variables for groups with a high helping norm in Part A. Column 6 presents averages in groups with a low helping norm in Part A. Panel A: presents mean of variables when groups with full solidarity (three+ helpers) in Part A constitute groups with a high helping norm. Panel B: presents mean of variables when groups with above median helping rates (0.97 in the Merged Group treatment and 0.63 in the Big Group treatment) in Part A constitute groups with a high helping norm. Panel C: presents mean of variables when groups with above mean helping rates (0.77 in the Merged Group treatment and 0.64 in the Big Group treatment) in Part A constitute groups with a high helping norm.
Table A15.
Linear regressions: between treatment helping rates in Period 11.
| Big Group | All vs. | High vs. | Low vs. | High vs. | Low vs. | ||
|---|---|---|---|---|---|---|---|
| Merged Group | All | High-High | High-Low | High-Low | High-Low | High-Low | Low-Low |
| (1) | (2) | (3) | (4) | (5) | (6) | (7) | |
| Merged Group | 0.104 | 0.151 | 0.130 | 0.302 | 0.234 | 0.198 | −0.0521 |
| (0.0694) | (0.104) | (0.0861) | (0.108) | (0.0913) | (0.133) | (0.136) | |
| Constant | 0.583 | 0.641 | 0.641 | 0.469 | 0.641 | 0.469 | 0.469 |
| (0.0506) | (0.0607) | (0.0605) | (0.0893) | (0.0607) | (0.0898) | (0.0898) | |
| Observations | 192 | 88 | 112 | 80 | 88 | 56 | 56 |
| F | 2.251 | 2.130 | 2.288 | 7.762 | 6.583 | 2.217 | 0.146 |
| R | 0.0117 | 0.0209 | 0.0196 | 0.0963 | 0.0523 | 0.0388 | 0.00269 |
Notes: Linear regressions with individual decisions in Period 11 as observations. Robust Standard Errors in parentheses. * , ** , *** . Merged Group is a variable which is equal to one for groups in the Merged Group treatment and zero otherwise. Dependent variable in all regressions: Mean Helping Rate. Column 1: Comparison across all big and merged groups. Column 2: Regressions limited to big groups with a high helping norm and merged groups with high helping norms. Column 3: Regressions limited to big groups with a high helping norm and merged groups with a high helping norm and a low helping norm. Column 4: Regressions limited to big groups with a low helping norm and merged groups with a high helping norm and a low helping norm. Column 5: Regressions limited to big groups with a high helping norm and merged groups with a high helping norm that have been merged with a group with a low helping norm. Column 6: Regressions limited to big groups with a low helping norm and merged groups with a low helping norm that have been merged with a group with a high helping norm. Column 7: Regressions limited to big groups with a low helping norm and merged groups with low helping norms.
Table A16.
Linear regressions: helping Rates in period 11—merged group treatment.
| All | High | Low | |
|---|---|---|---|
| (1) | (2) | (3) | |
| High-High | 0.375 | ||
| (0.132) | |||
| High-Low | 0.354 | 0.0833 | 0.250 |
| (0.119) | (0.109) | (0.142) | |
| Constant | 0.417 | 0.792 | 0.417 |
| (0.102) | (0.0847) | (0.103) | |
| Observations | 96 | 48 | 48 |
| F | 5.072 | 0.582 | 3.090 |
| R | 0.114 | 0.0125 | 0.0629 |
Notes: OLS regressions with individual decisions in Period 11 as observations. Robust Standard Errors in parentheses. * , ** , *** . High-High is a variable describing two merged groups with a high helping norm. High-Low is a variable describing two merged groups in which one has a high helping norm and one has a low helping norm. (Post-estimation F test between High-High and High-Low:F(1, 93) = 0.04, p = 0.84.). Dependent variable in all regressions is the group helping rate. Benchmark condition in Column 1 are merged groups with a low helping norm. In Column 2, the benchmark condition are two groups with a high helping norm (in High-Low groups). Regressions are limited to groups with a high helping norm. In Column 3, the benchmark condition are two groups with a low helping norm. Regressions are limited to groups with a low helping norm (in High-Low groups).
Table A17.
Part B: time trends by treatment and subgroups.
| Big Group | Merged Group | ||||
|---|---|---|---|---|---|
| All | High-High | High-Low | Low-Low | ||
| (1) | (2) | (3) | (4) | (5) | |
| Period 12 | −0.0313 | −0.0417 | −0.0833 | 0.0208 | −0.125 |
| (0.0718) | (0.0683) | (0.127) | (0.0853) | (0.140) | |
| Period 13 | −0.0729 | −0.0937 | -0.125 | −0.0833 | −0.0833 |
| (0.0720) | (0.0693) | (0.130) | (0.0913) | (0.142) | |
| Period 14 | -0.0313 | −0.0625 | −0.0833 | −0.0208 | -0.125 |
| (0.0718) | (0.0688) | (0.127) | (0.0880) | (0.140) | |
| Period 15 | −4.59e-18 | −0.0937 | −0.167 | −0.0417 | −0.125 |
| (0.0715) | (0.0693) | (0.132) | (0.0892) | (0.140) | |
| Period 16 | −0.115 | −0.115 | −0.0833 | −0.125 | −0.125 |
| (0.0720) | (0.0695) | (0.127) | (0.0929) | (0.140) | |
| Period 17 | −0.0521 | −0.135 | −0.250 | -0.0833 | −0.125 |
| (0.0720) | (0.0697) | (0.134) | (0.0913) | (0.140) | |
| Period 18 | −0.0938 | −0.146 | −0.125 | −0.187 | −0.0833 |
| (0.0720) | (0.0698) | (0.130) | (0.0945) | (0.142) | |
| Period 19 | −0.177 | −0.250 | −0.333 | −0.208 | −0.250 |
| (0.0714) | (0.0697) | (0.134) | (0.0948) | (0.129) | |
| Period 20 | −0.229 | −0.365 | −0.500 | -0.312 | −0.333 |
| (0.0705) | (0.0676) | (0.127) | (0.0951) | (0.118) | |
| Constant | 0.583 | 0.687 | 0.792 | 0.771 | 0.417 |
| (0.0506) | (0.0476) | (0.0847) | (0.0613) | (0.103) | |
| Observations | 960 | 960 | 240 | 480 | 240 |
| F | 2.291 | 4.807 | 2.460 | 2.396 | 1.611 |
| R | 0.0206 | 0.0413 | 0.0834 | 0.0449 | 0.0380 |
Notes: Linear Regressions. Robust Standard Errors in parentheses. * , ** , *** . Dependent variable: Group helping Rate.
Appendix A.6. Controls
Prior to the helping game, subjects filed in a quiz which was incentivized at the group level. The winning group was announced after the helping game at the end of the experiment. In the quiz, subjects had the possibility to chat and exchange ideas for correct answers within a group. In this section, I control for behavior in the quiz in two ways: First, I include dummy variables for groups who used cooperative messages in the quiz into the regressions. Second, I use the points obtained in the quiz as a measure of cooperation on the group level and control for points achieved in the regressions. Importantly, there is no difference between treatments in frequency of cooperative messages and the average performance in the quiz. About 58% of the groups mentioned cooperation during the quiz chat in the Big Group treatment. This is not significantly different from the 54% of groups who did so in the Merged Group treatment (two sided t-test: n = 36, p = 0.82). Furthermore, group points by subject were also not different between treatments. In the Big Group treatment, each group member earned on average 13.64 points. In the Merged Group treatment, the subject group average was 12.46 points (two sided t-test: n = 36, p = 0.11).23 Table A18 presents results from robust regressions with group helping rate as the dependent variable. Table shows that the results are robust when controlling for chat performance, chat behavior and time trends.
Table A19 presents the corresponding regressions including controls for chat performance, chat behavior and time trends for the within treatment comparisons in the Merged Group treatment. The results are robust.
Table A18.
Linear regressions: between treatment helping rates in Part B—with controls.
| Big Group | All vs. | High vs. | Low vs. | High vs. | Low vs. | ||
|---|---|---|---|---|---|---|---|
| Merged Group | All | High-High | High-Low | High-Low | High-Low | High-Low | Low-Low |
| (1) | (2) | (3) | (4) | (5) | (6) | (7) | |
| Merged Group | 0.0935 | 0.0737 | 0.123 | 0.208 | 0.156 | 0.304 | −0.103 |
| (0.0293) | (0.0379) | (0.0336) | (0.0302) | (0.0546) | (0.0442) | (0.0758) | |
| Quiz Points | 0.0145 | 0.000708 | 0.00900 | −0.00563 | 0.0213 | −0.0636 | −0.00346 |
| (0.00811) | (0.00843) | (0.0118) | (0.0175) | (0.01000) | (0.0198) | (0.0170) | |
| Cooperative Chat | 0.243 | 0.134 | 0.0418 | 0.0465 | 0.0297 | 0.214 | 0.184 |
| (0.0351) | (0.0350) | (0.0408) | (0.0612) | (0.0353) | (0.0500) | (0.0539) | |
| Time Trend | −0.0319 | −0.0320 | −0.0312 | −0.0337 | −0.0315 | −0.0330 | −0.0264 |
| (0.00515) | (0.00676) | (0.00600) | (0.00711) | (0.00572) | (0.00824) | (0.00819) | |
| Constant | 0.726 | 1.025 | 0.970 | 1.020 | 0.815 | 1.769 | 0.843 |
| (0.135) | (0.139) | (0.153) | (0.257) | (0.123) | (0.304) | (0.275) | |
| Observations | 240 | 110 | 140 | 100 | 140 | 100 | 70 |
| F | 30.64 | 17.93 | 13.76 | 23.52 | 28.85 | 26.74 | 5.782 |
| R | 0.293 | 0.298 | 0.254 | 0.454 | 0.418 | 0.339 | 0.227 |
Notes: Linear regressions with period group averages as observations. Robust Standard Errors in parentheses. * , ** , *** . Merged Group is a variable which is equal to one for groups in the Merged Group treatment and zero otherwise. Quiz Points reflects the average number of points by a subject within a group. Cooperative Chat is a dummy variable indicating whether groups mentioned cooperation in their chat. Time Trend represents period controls. Dependent variable in all regressions: Mean Helping Rate. Column 1: Comparison across all big and merged groups. Column 2: Regressions limited to big groups with a high helping norm and merged groups with high helping norms. Column 3: Regressions limited to big groups with a high helping norm and merged groups with a high helping norm and a low helping norm. Column 4: Regressions limited to big groups with a low helping norm and merged groups with a high helping norm and a low helping norm. Column 5: Regressions limited to big groups with a high helping norm and merged groups with a high helping norm which have been merged with a group with a low helping norm. Column 6: Regressions limited to big groups with a low helping norm and merged groups with a low helping norm which have been merged with a group with a high helping norm. Column 7: Regressions limited to big groups with a low helping norm and merged groups with low helping norms.
Table A19.
Linear regressions: helping rates in Part B—merged group treatment—with controls.
| All | High | Low | |
|---|---|---|---|
| (1) | (2) | (3) | |
| High-High | 0.333 | ||
| (0.0458) | |||
| High-Low | 0.388 | 0.123 | 0.363 |
| (0.0494) | (0.0455) | (0.0665) | |
| Quiz Points | 0.00170 | 0.00640 | −0.0207 |
| (0.00793) | (0.00879) | (0.0204) | |
| Cooperative Chat | 0.102 | 0.0695 | 0.0708 |
| (0.0358) | (0.0405) | (0.0539) | |
| Time Trend | −0.0376 | −0.0435 | −0.0317 |
| (0.00570) | (0.00725) | (0.00846) | |
| Constant | 0.863 | 1.257 | 1.039 |
| (0.124) | (0.117) | (0.281) | |
| Observations | 240 | 120 | 120 |
| F | 37.88 | 12.59 | 16.48 |
| R2 | 0.430 | 0.359 | 0.338 |
Notes: Linear regressions with period group averages as observations. Robust Standard Errors in parentheses. * , ** , *** . High-High is a variable describing two merged groups with a high helping norm. High-Low is a variable describing two merged groups in which one has a high helping norm and one has a low helping norm. (Post-estimation F test between High-High and High-Low: F(1, 117) = 1.76; p = 0.19.). Quiz Points reflects the average number of points by a subject within a group. Cooperative Chat is a dummy variable indicating whether groups mentioned cooperation in their chat. Time Trend represents period controls. Dependent variable in all regressions is the group helping rate. Benchmark condition in Column 1 are merged groups with a low helping norm. In Column 2, the benchmark condition are two groups with a high helping norm (in High-Low groups). Regressions are limited to groups with a high helping norm. In Column 3, the benchmark condition are two groups with a low helping norm. Regressions are limited to groups with a low helping norm (in High-Low groups).
Heterogeneity Plots:
Figure A3.
Mean helping rates in Part A and Part B.

Figure A4.
Number of helpers by group in Part A and Part B.

Figure A5.
Average group payoff in Part A and Part B.

Appendix B. Instructions


References
- Comer, D.R. A model of social loafing in real work groups. Hum. Relat. 1995, 48, 647–667. [Google Scholar] [CrossRef]
- Margarida Passos, A.; Caetano, A. Exploring the effects of intragroup conflict and past performance feedback on team effectiveness. J. Manag. Psychol. 2005, 20, 231–244. [Google Scholar] [CrossRef]
- Schermerhorn, J.R.J. Management, 9th ed.; John Wiley & Sons, Inc.: Hoboken, NJ, USA, 2008. [Google Scholar]
- Bowles, S. Group competition, reproductive leveling, and the evolution of human altruism. Science 2006, 314, 1569–1572. [Google Scholar] [CrossRef] [PubMed]
- Fehr, E.; Fischbacher, U. The nature of human altruism. Nature 2003, 425, 785–791. [Google Scholar] [CrossRef] [PubMed]
- Hu, J.; Liden, R.C. Making a difference in the teamwork: Linking team prosocial motivation to team processes and effectiveness. Acad. Manag. J. 2015, 58, 1102–1127. [Google Scholar] [CrossRef]
- Schjoedt, L.; Monsen, E.; Pearson, A.; Barnett, T.; Chrisman, J.J. New venture and family business teams: Understanding team formation, composition, behaviors, and performance. Entrep. Theory Pract. 2013, 37, 1–15. [Google Scholar] [CrossRef]
- Akerlof, G.A.; Kranton, R.E. Identity and the Economics of Organizations. J. Econ. Perspect. 2005, 19, 9–32. [Google Scholar] [CrossRef]
- Dur, R.; Sol, J. Social interaction, co-worker altruism, and incentives. Games Econ. Behav. 2010, 69, 293–301. [Google Scholar] [CrossRef] [Green Version]
- Kandel, E.; Lazear, E.P. Peer pressure and partnerships. J. Political Econ. 1992, 100, 801–817. [Google Scholar] [CrossRef]
- Rob, R.; Zemsky, P. Social capital, corporate culture, and incentive intensity. RAND J. Econ. 2002, 33, 243–257. [Google Scholar] [CrossRef]
- Adler, P.S.; Kwon, S.W. Social capital: Prospects for a new concept. Acad. Manag. Rev. 2002, 27, 17–40. [Google Scholar] [CrossRef]
- Putnam, R.D. The prosperous community. Am. Prospect 1993, 4, 35–42. [Google Scholar]
- Kitzmueller, M.; Shimshack, J. Economic perspectives on corporate social responsibility. J. Econ. Lit. 2012, 50, 51–84. [Google Scholar] [CrossRef]
- Lins, K.V.; Servaes, H.; Tamayo, A. Social capital, trust, and firm performance: The value of corporate social responsibility during the financial crisis. J. Financ. 2017. [Google Scholar] [CrossRef]
- Schmitz, J.; Schrader, J. Corporate Social Responsibility: A Microeconomic Review of the Literature. J. Econ. Surv. 2015, 29, 27–45. [Google Scholar] [CrossRef]
- Latane, B.; Darley, J.M. Group inhibition of bystander intervention in emergencies. J. Personal. Soc. Psychol. 1968, 10, 215. [Google Scholar] [CrossRef]
- Dana, J.; Weber, R.; Kuang, J. Exploiting moral wiggle room: experiments demonstrating an illusory preference for fairness. Econ. Theory 2007, 33, 67–80. [Google Scholar] [CrossRef]
- Diekmann, A. Volunteer’s Dilemma. J. Confl. Resolut. 1985, 29, 605–610. [Google Scholar] [CrossRef]
- Latane, B.; Nida, S. Ten years of research on group size and helping. Psychol. Bull. 1981, 89, 308–324. [Google Scholar] [CrossRef]
- Panchanathan, K.; Frankenhuis, W.E.; Silk, J.B. The bystander effect in an N-person dictator game. Organ. Behav. Hum. Decis. Process. 2013, 120, 285–297. [Google Scholar] [CrossRef]
- Darai, D.; Rouxy, C.; Schneider, F. Endogenous Mergers, Mavericks and Tacit Collusion: Experimental Evidence; Mimeo, Cambride University: Cambride, UK, 2019. [Google Scholar]
- Goette, L.; Schmutzler, A. Merger policy: What can we learn from competition policy. In Experiments and Competition Policy; Hinloopen, J., Normann, H.T., Eds.; Cambridge University Press: Cambridge, MA, USA, 2009; pp. 185–216. [Google Scholar]
- Frey, B.S.; Meier, S. Social Comparisons and Pro-Social Behavior: Testing “Conditional Cooperation” in a Field Experiment. Am. Econ. Rev. 2004, 94, 1717–1722. [Google Scholar] [CrossRef]
- Frey, B.S.; Torgler, B. Tax morale and conditional cooperation. J. Comp. Econ. 2007, 35, 136–159. [Google Scholar] [CrossRef] [Green Version]
- Fischbacher, U.; Gächter, S.; Fehr, E. Are people conditionally cooperative? Evidence from a public goods experiment. Econ. Lett. 2001, 71, 397–404. [Google Scholar] [CrossRef] [Green Version]
- Keser, C.; Van Winden, F. Conditional cooperation and voluntary contributions to public goods. Scand. J. Econ. 2000, 102, 23–39. [Google Scholar] [CrossRef]
- Charness, G.; Yang, C.L. Starting small toward voluntary formation of efficient large groups in public goods provision. J. Econ. Behav. Organ. 2014, 102, 119–132. [Google Scholar] [CrossRef]
- Ehrhart, K.; Keser, C. Cooperation and mobility: On the run; Working Paper; CIRANO and University of Karlsruhe: Karlsruhe, Germnay, 1999; p. 99s-24. [Google Scholar]
- Gürerk, Ö.; Irlenbusch, B.; Rockenbach, B. On cooperation in open communities. J. Public Econ. 2014, 120, 220–230. [Google Scholar] [CrossRef]
- Guido, A.; Robbett, A.; Romaniuc, R. Group formation and cooperation in social dilemmas: A survey and meta-analytic evidence. Econ. Behav. Organ. 2019, 159, 192–209. [Google Scholar] [CrossRef] [Green Version]
- Feiler, L.; Camerer, C.F. Code creation in endogenous merger experiments. Econ. Inq. 2010, 48, 337–352. [Google Scholar] [CrossRef]
- Ranehill, E.; Schneider, F.; Weber, R.A. Growing Groups, Cooperation, and the Rate of Entry. CESifo Working Paper Series 2014, No. 4719. Available online: https://papers.ssrn.com/sol3/papers.cfm?abstract_id=2425583 (accessed on 15 December 2018).
- Weber, R.A.; Camerer, C.F. Cultural conflict and merger failure: An experimental approach. Manag. Sci. 2003, 49, 400–415. [Google Scholar] [CrossRef]
- Weber, R.A. Managing growth to achieve efficient coordination in large groups. Am. Econ. Rev. 2006, 96, 114–126. [Google Scholar] [CrossRef]
- Archetti, M. The volunteer’s dilemma and the optimal size of a social group. J. Theor. Biol. 2009, 261, 475–480. [Google Scholar] [CrossRef]
- Diekmann, A. Volunteers Dilemma. A Social Trap without a Dominant Strategy and some Empirical Results. In Paradoxical Effects of Social Behavior; Springer: Berlin, Germany, 1986; pp. 187–197. [Google Scholar]
- Murnighan, J.K.; Kim, J.W.; Metzger, A.R. The volunteer dilemma. Adm. Sci. Q. 1993, 38, 515–538. [Google Scholar] [CrossRef]
- Isaac, R.M.; Walker, J.M. Group size effects in public goods provision: The voluntary contributions mechanism. Q. J. Econ. 1988, 103, 179–199. [Google Scholar] [CrossRef]
- Isaac, R.M.; Walker, J.M.; Williams, A.W. Group size and the voluntary provision of public goods: experimental evidence utilizing large groups. J. Public Econ. 1994, 54, 1–36. [Google Scholar] [CrossRef]
- Carpenter, J.P. Punishing free-riders: How group size affects mutual monitoring and the provision of public goods. Games Econ. Behav. 2007, 60, 31–51. [Google Scholar] [CrossRef] [Green Version]
- Feri, F.; Irlenbusch, B.; Sutter, M. Efficiency gains from team-based coordinationlarge-scale experimental evidence. Am. Econ. Rev. 2010, 100, 1892–1912. [Google Scholar] [CrossRef]
- Gaube, T. Altruism and charitable giving in a fully replicated economy. J. Public Econ. 2006, 90, 1649–1667. [Google Scholar] [CrossRef] [Green Version]
- Nosenzo, D.; Quercia, S.; Sefton, M. Cooperation in small groups: The effect of group size. Exp. Econ. 2015, 18, 4–14. [Google Scholar] [CrossRef]
- Huckman, R.S.; Staats, B.R.; Upton, D.M. Team familiarity, role experience, and performance: Evidence from Indian software services. Manag. Sci. 2009, 55, 85–100. [Google Scholar] [CrossRef]
- Smeets, V.; Ierulli, K.; Gibbs, M. An Empirical Analysis of Post-Merger Organizational Integration. Scand. J. Econ. 2016, 118, 463–493. [Google Scholar] [CrossRef]
- Ashforth, B.E.; Mael, F. Social identity theory and the organization. Acad. Manag. Rev. 1989, 14, 20–39. [Google Scholar] [CrossRef]
- Bernhard, H.; Fehr, E.; Fischbacher, U. Group affiliation and altruistic norm enforcement. Am. Econ. Rev. 2006, 96, 217–221. [Google Scholar] [CrossRef]
- Efferson, C.; Lalive, R.; Fehr, E. The coevolution of cultural groups and ingroup favoritism. Science 2008, 321, 1844–1849. [Google Scholar] [CrossRef]
- Falk, A.; Zehnder, C. A city-wide experiment on trust discrimination. J. Public Econ. 2013, 100, 15–27. [Google Scholar] [CrossRef] [Green Version]
- Goette, L.; Huffman, D.; Meier, S. The Impact of Group Membership on Cooperation and Norm Enforcement: Evidence Using Random Assignment to Real Social Groups. Am. Econ. Rev. 2006, 96, 212–216. [Google Scholar] [CrossRef] [Green Version]
- Charness, G.; Rigotti, L.; Rustichini, A. Individual behavior and group membership. Am. Econ. Rev. 2007, 97, 1340–1352. [Google Scholar] [CrossRef]
- Grund, C.; Harbring, C.; Thommes, K. Public good provision in blended groups of partners and strangers. Econ. Lett. 2015, 134, 41–44. [Google Scholar] [CrossRef]
- Grund, C.; Harbring, C.; Thommes, K. Group (Re-) formation in Public Good Games: The Tale of the Bad Apple? Econ. Behav. Organ. 2018, 145, 306–319. [Google Scholar] [CrossRef]
- Attanasi, G.; Hopfensitz, A.; Lorini, E.; Moisan, F. Social connectedness improves co-ordination on individually costly, efficient outcomes. Eur. Econ. Rev. 2016, 90, 86–106. [Google Scholar] [CrossRef] [Green Version]
- Bisin, A.; Verdier, T. Beyond the melting pot: cultural transmission, marriage, and the evolution of ethnic and religious traits. Q. J. Econ. 2000, 115, 955–988. [Google Scholar] [CrossRef]
- Bisin, A.; Verdier, T. The Economics of Cultural Transmission and the Dynamics of Preferences. J. Econ. Theory 2001, 97, 298–319. [Google Scholar] [CrossRef] [Green Version]
- Fehr, E.; Gächter, S. Cooperation and punishment in public goods experiments. Am. Econ. Rev. 2000, 90, 980–994. [Google Scholar] [CrossRef]
- Feld, L.P.; Torgler, B. Tax Morale after the Reunification of Germany: Results from a Quasi-Natural Experiment. CESifo Working Paper. 2007, No. 1921. Available online: https://ideas.repec.org/p/ces/ceswps/_1921.html (accessed on 15 Decmeber 2018).
- Feld, L.P.; Torgler, B.; Dong, B. Coming Closer? Tax Morale, Deterrence and Social Learning after German Unification; Working Paper No. 232; Queensland University of Technology, School of Economics and Finance: Brisbane, Australia, 2008. [Google Scholar]
- Attanasi, G.; Dessi, R.; Moisan, F.; Robertson, D. Public Goods and Future Audiences: Acting as Role Models?: The Audience Matters; No. 17-860; Toulouse School of Economics (TSE), Working Paper; Toulouse School of Economics: Toulouse, France, 2018. [Google Scholar]
- Brosig-Koch, J.; Helbach, C.; Ockenfels, A.; Weimann, J. Still different after all these years: Solidarity behavior in East and West Germany. J. Public Econ. 2011, 95, 1373–1376. [Google Scholar] [CrossRef]
- Ockenfels, A.; Weimann, J. Types and patterns: An experimental East-West-German comparison of cooperation and solidarity. J. Public Econ. 1999, 71, 275–287. [Google Scholar] [CrossRef]
- Selten, R.; Ockenfels, A. An Experimental Solidarity Game. Econ. Behav. Organ. 1998, 34, 517–539. [Google Scholar] [CrossRef]
- Croson, R.T.; Marks, M.B. Step returns in threshold public goods: A meta-and experimental analysis. Exp. Econ. 2000, 2, 239–259. [Google Scholar] [CrossRef]
- Fischbacher, U. z-Tree: Zurich Toolbox for Ready-made Economic Experiments. Exp. Econ. 2007, 10, 171–178. [Google Scholar] [CrossRef]
- Greiner, B. Subject pool recruitment procedures: organizing experiments with ORSEE. J. Econ. Sci. Assoc. 2015, 1, 114–125. [Google Scholar] [CrossRef]
- Hugh-Jones, D.; Leroch, M. Intergroup Revenge: A Laboratory Experiment. Homo Oeconomicus 2017, 34, 117–135. [Google Scholar] [CrossRef]
- Chaudhuri, A. Sustaining cooperation in laboratory public goods experiments: A selective survey of the literature. Exp. Econ. 2011, 14, 47–83. [Google Scholar] [CrossRef]
- Ledyard, J. Public Goods: A Survey of Experimental Research. In Handbook of Experiment Economic; Kagel, J., Roth, A., Eds.; Princeton University Press: Princeton, NJ, USA, 1995; pp. 111–194. [Google Scholar]
- Przepiorka, W.; Diekmann, A. Heterogeneous groups overcome the diffusion of responsibility problem in social norm enforcement. PLoS ONE 2018, 13, e0208129. [Google Scholar] [CrossRef]
- Miller, D.L.; Cameron, A.C. Robust Inference with Clustered Data. In Handbook of Empirical Economics and Finance; Chapman and Hall/CRC: Boca Raton, FL, USA, 2016; pp. 16–43. [Google Scholar]
- Cameron, A.C.; Gelbach, J.B.; Miller, D.L. Bootstrap-based improvements for inference with clustered errors. Rev. Econ. Stat. 2008, 90, 414–427. [Google Scholar] [CrossRef]
- Roodman, D.; Ørregaard Nielsen, M.; MacKinnon, J.G.; Webb, M.D. Fast and wild: Bootstrap inference in Stata using boottest. Stata J. 2019, 19, 4–60. [Google Scholar] [CrossRef] [Green Version]
- Duca, S.; Nax, H.H. Groups and scores: The decline of cooperation. J. R. Soc. Interface 2018, 15. [Google Scholar] [CrossRef]
| 1 | |
| 2 | The Part A findings on helping behavior contribute to the literature studying diffusion of responsibility and group size. Existing literature studying pure group size effects finds ambiguous results. Without immediate individual gains from cooperation, individuals diffuse responsibility and are more hesitant to help in larger groups (Latane and Darley [17]; Latane et al. [20]). Dana et al. [18] and Panchanathan et al. [21] find similar effects in multiple dictator games. In a one shot volunteer’s dilemma, the effects are similar (Archetti [36]; Diekmann [19,37]; Murnighan et al. [38]). In other social dilemmas like public goods games, however, empirical evidence does not identify a pure group-size effect. Isaac and Walker [39], Isaac et al. [40], and Carpenter [41], for example, do not find evidence for group-size effects on the provision of costly public goods (or punishment of free riders). In addition, Feri et al. [42] also highlight that groups (of three) are better able to coordinate on efficiency than individuals. Furthermore, Gaube [43] theoretically points out that if groups consist of altruistic individuals, an increase in group size may reduce underprovision of public goods. Nosenzo et al. [44] observe a negative group-size effect with high marginal per capita return and a positive effect of group size when the individual benefits from cooperation are low. In these cases, social considerations may outweigh negative group-size effects. In this study, the lower helping rates in big groups in Part A points to a bystander effect as they are related to the group size. Other factors, such as reputation building or increased reciprocity in small groups may, however, also play a role. |
| 3 | The random combination of groups in Part B of the experiment also relates to the literature on in-group favoritism (see, e.g., Ashforth and Mael [47]; Bernhard et al. [48]; Efferson et al. [49]; Falk and Zehnder [50]; Goette et al. [51]). Given that merged groups consist of two small groups in which subjects previously interacted, the likelihood of expressed solidarity may depend on the pre-merger group affiliation of the subjects who need support. Charness et al. [52] highlight that group membership indeed affects behavior in social dilemmas and individuals cooperate more with their in-group. Furthermore, Grund et al. [53] highlight that cooperation may decrease in blended groups. However, Grund et al. [54] indicate that when groups are newly composed but do not increase in size, previous group history only rarely affects cooperation negatively. Thus, if individuals still discriminate against new group members’ post merger solidarity is likely affected negatively. If, however, individuals welcome the new group members as belonging to their own group, negative consequences from in-group favoritism will not be observed in this experiment. In addition, Attanasi et al. [55] analyze coordination among players interacting with partners from different in-groups in terms of size and social ties. They find that smaller and more salient in-groups lead to significantly more group beneficial choices. |
| 4 | Brosig-Koch et al. [62] use a student subject population and find that norms are still different between the two parts of Germany after 20 years of reunification. They compare their results to behavior of a different student population in Ockenfels and Weimann [63] and ascertain that solidarity norms between Eastern and Western Germans are still different. Their findings indicate that norms harmonize rather slowly over time. |
| 5 | In the helping game, helping is socially inefficient if more or less than three subjects help. |
| 6 | Appendix A.4 in the Appendix highlights that the decision to help or not was really the focus of subjects’ action. |
| 7 | One subject did not provide his or her age. Subjects’ age ranges between 19 and 45 years. |
| 8 | This disparity in number of observations was necessary to gather sufficiently rich data to make meaningful inferences about behavior in Part B of the experiment in which two groups of four were randomly combined to one group of eight. |
| 9 | Average hourly student wage in Germany is 10 Euro. |
| 10 | In addition, before the helping game started in Part A, subjects participated in an incentivized quiz in which subjects solved 20 questions within a time constraint of ten minutes to receive additional income [68]. To avoid grief, envy and income effects in the subsequent parts, the subjects were told about their group performance in the quiz only after the second part of the experiment and before the final questionnaire which was administered to elicit socio demographic variables (like, e.g., age and gender). Detailed experimental instructions can be found in the Appendix B and Supplementary Materials. |
| 11 | Note that I concentrate on the helping rate by group as the main dependent variable. This allows for comparing the share of subjects who help across groups. I also perform analysis on the number of helpers per group and on average group payoffs. |
| 12 | Higher helping behavior in the Merged Group treatment may also impact group welfare. In the helping game, group income is highest if exactly three subjects help. Consequently, excess helping reduces group income. If fewer than three subjects help, however, group payoff is lower compared with the case in which more than three subjects decide to help. Higher norms of helping in the Merged Group treatment may therefore also impact payoffs since the critical threshold of three helpers may be less likely to be reached in the Big Group treatment. For brevity, I concentrate on hypothesis for helping behavior. |
| 13 | Groups with a “high” helping norm are thereby characterized by an average of three (or more in the Big Group treatment) helpers in Part A. Other groups are classified as groups with a "low" helping norm. More information on group classification is provided in Section 3. |
| 14 | The average helping rate by group is defined by the number of subjects in a group who help (between one and seven) divided by the number of potential helpers in a group (seven). In Part A, the average group helping rate in small groups is defined similarly. However, here only three potential helpers are present. |
| 15 | Because of a limited number of clusters, I rely on group averages as observations in the regressions instead of using regressions with individual decisions as observations and clustering (Miller and Cameron [72]). Regression results are robust to including controls for period effects and behavior in the quiz (see Appendix A.6). Moreover, regression results are mostly comparable when using individual decisions as observations with bootstrap inference (wild bootstrap) to account for the limited number of clusters (Cameron et al. [73]; Roodman et al. [74]). Furthermore, effects are (at least directionally) already present in Period 11 (see Appendix A.5). |
| 16 | Figure A2 in Appendix A.1 shows the group composition in Part B by high and low helping norms in Part A. |
| 17 | This distinction allows for comparing behavior between small and big groups as all groups in which the subject who lost the endowment received full helping are characterized as those who have established a high helping norm in Part A in both treatments. Other classifications are, however, also possible. Table A3 in Appendix A.1 shows that the results do not change when classifying groups by median or mean helping rate in Part A as having a high or a low helping norm. |
| 18 | Table A4 in Appendix A.2 presents summary statistics for the average number of helpers per group and the average group payoff. The table results on the number of helpers per group concur with the findings for the average helping rates. The table further reveals that there is little variance in group payoffs between treatments and sub-groups. Table A1 presents statistical evidence for the average number of helpers in a group which is likewise in line with the findings on helping rates. Regression results on average group payoffs are presented in Table A5. The results indicate that subjects in the Merged Group treatment earn on average 1 point less than subjects in the Big Group treatment. While this difference is marginally significant it is economically meaningless (1 token transfers to 4 cent). Furthermore, the regressions indicate that the difference is mainly driven by merging of to groups with low helping norms which earn on average 2.3 token less compared with big groups with a low helping rate. |
| 19 | Table A6 in Appendix A.2 presents results from regressions on the average number of helpers per group within the Merged Group treatment. The results show that high helping norms are more influential than low helping norms in the merged groups. Table A7 shows regression results with the average group payoff as the dependent variable within the Merged Group treatment. The table shows that there are little payoff differences between sub-groups, but subjects in groups with a high helping norm forgo profit (1.3 token) in order to help others. |
| 20 | In groups with low helping norms about 26% of the subjects only infrequently help in Part A. In the big groups, 53% of subjects only help sometimes; 31% of the subjects always help and 15% never help in Part A. In small groups, 64% of the subjects always help and only 8% of subjects behave selfishly in Part A. |
| 21 | Furthermore, because subjects know the id of the subject who lost her endowment in the helping game, subjects in the Merged Group treatment are able to distinguish old group members from new group members in Part B of the experiment. Table A9 and Table A10 in Appendix A.3 highlight that groups with a high helping norm are slightly, alas insignificantly, more likely to help if a subject who lost her endowment stems from the same group they have interacted with in Part A of the experiment already. Groups with low helping norms are, however, significantly more likely to help group members who stem from the new group with which they have been merged in Part B. This, however, is not surprising given that the old group has proven to behave in an unsolidaric manner in Part A already. |
| 22 | Duca and Nax [75] study a four image scoring mechanism (plus a control group) which all result in a steady decline in cooperation in repeated multi person prisoner’s dilemma. |
| 23 | Note that average points per group were 109 in the Big Group treatment and 50 points in the Merged Group treatment. This was because of the different group sizes in the quiz. Dividing the total points by group size is thus necessary to identify whether big groups or small groups were more productive in the quiz. |
Table 1.
Helping game payoffs.
| # Helpers | Payoff: Subject in Need | Payoff: Helpers | Payoff: Non-Helpers |
|---|---|---|---|
| 0 | 0 | - | 100 |
| 1 | 30 | 30 | 100 |
| 2 | 60 | 60 | 100 |
| 3 + | 90 | 90 | 100 |
Notes: Column 1 highlights the number of subjects in a group who have an endowment of 100 and decide to help. Column 2 presents the corresponding income of the subject in need. Column 3 summarizes the payoff of subjects who help conditional on how many others also help. The payoff of subjects who decide to keep their endowment is depicted in Column 4. Independent of what others do, this payoff is 100 tokens.
Table 2.
Treatment overview.
| Merged Group | Big Group | |
|---|---|---|
| Part A | Group of 4 | Group of 8 |
| (Period 1–10) | (24) | (12) |
| Part B | Group of 8 | Group of 8 |
| (Period 11–20) | (12) | (12) |
Notes: Big Group treatment: Subjects are randomly matched in groups of 8. All eight subjects remain in the same group in Part A and Part B of the experiment. Merged Group treatment: In Part A, subjects are randomly matched in groups of four. In Part B, subjects remain in their group of four but two groups of four are combined to a group of eight (four new subjects are added to each group of four to form a group of eight). The number of observations on the group level is in parentheses.
Table 3.
Average helping rate and average group payoff in Part B by treatment and sub-group.
| Big Group | Merged Group | ||||||
|---|---|---|---|---|---|---|---|
| All | High | Low | All | High-High | High-Low | Low-Low | |
| Helping Rate | 0.570 | 0.639 | 0.432 | 0.633 | 0.697 | 0.759 | 0.319 |
| (0.168) | (0.110) | (0.194) | (0.250) | (0.091) | (0.215) | (0.243) | |
| High; Low | |||||||
| 0.844; 0.674 | |||||||
| (0.117; 0.265) | |||||||
Notes: Mean of variables with standard deviation on the Part B group level in parentheses. Helping Rate describes the mean helping rate in Part B. Columns 1–3 present variables in the Big Group treatment—Column 1 shows variable averages in all big groups. Column 2 presents means of variable in big groups with a high helping norm in Part A. Column 3 shows averages for big groups with a low helping norm in Part A. Columns 4–7 present averages in the Merged Group treatment. Column 4 presents variable averages for all merged groups. Column 5 presents means of variables if two groups with a high helping norm in Part A are merged. Column 6 presents averages if one group with a high helping norm in Part A is merged with a group with a low helping norm in Part A. Row 4 in Column 6 presents averages for the sub-groups (high; low) in case two groups with different helping norms are merged. Column 7 presents mean of variables if two groups with a low helping norm in Part A are merged.
Table 4.
Linear regressions: between treatment helping rates in Part B.
| Big Group | All vs. | High vs. | Low vs. | High vs. | Low vs. | ||
|---|---|---|---|---|---|---|---|
| Merged Group | All | High-High | High-Low | High-Low | High-Low | High-Low | Low-Low |
| (1) | (2) | (3) | (4) | (5) | (6) | (7) | |
| Merged Group | 0.0631 | 0.0607 | 0.118 | 0.325 | 0.211 | 0.235 | −0.113 |
| (0.0342) | (0.0466) | (0.0370) | (0.0463) | (0.0352) | (0.0541) | (0.0591) | |
| Constant | 0.570 | 0.639 | 0.639 | 0.432 | 0.639 | 0.432 | 0.432 |
| (0.0203) | (0.0212) | (0.0211) | (0.0348) | (0.0211) | (0.0348) | (0.0349) | |
| Observations | 240 | 110 | 140 | 100 | 140 | 100 | 70 |
| F | 3.412 | 1.696 | 10.14 | 49.38 | 35.92 | 18.77 | 3.661 |
| R | 0.0141 | 0.0182 | 0.0725 | 0.329 | 0.213 | 0.142 | 0.0534 |
Notes: Linear regressions with period group averages as observations. Robust Standard Errors in parentheses. * , ** , *** . Merged Group is a variable which is equal to one for groups in the Merged Group treatment and zero otherwise. Dependent variable in all regressions: Mean Helping Rate. Column 1: Comparison across all big and merged groups. Column 2: Regressions limited to big groups with a high helping norm and merged groups with high helping norms. Column 3: Regressions limited to big groups with a high helping norm and merged groups with a high helping norm and a low helping norm. Column 4: Regressions limited to big groups with a low helping norm and merged groups with a high helping norm and a low helping norm. Column 5: Regressions limited to big groups with a high helping norm and merged groups with a high helping norm which have been merged with a group with a low helping norm. Column 6: Regressions limited to big groups with a low helping norm and merged groups with a low helping norm which have been merged with a group with a high helping norm. Column 7: Regressions limited to big groups with a low helping norm and merged groups with low helping norms.
Table 5.
Linear regressions: helping rates in Part B-merged group treatment
| All | High | Low | |
|---|---|---|---|
| (1) | (2) | (3) | |
| High-High | 0.381 | ||
| (0.0633) | |||
| High-Low | 0.438 | 0.150 | 0.350 |
| (0.0566) | (0.0438) | (0.0549) | |
| Constant | 0.319 | 0.700 | 0.317 |
| (0.0476) | (0.0336) | (0.0361) | |
| Observations | 120 | 120 | 120 |
| F | 31.05 | 11.70 | 40.61 |
| R | 0.372 | 0.0902 | 0.256 |
Notes: Linear regressions with period group averages as observations. Robust Standard Errors in parentheses. * , ** , *** . High-High is a variable describing two merged groups with a high helping norm. High-Low is a variable describing two merged groups in which one has a high helping norm and one has a low helping norm. Dependent variable in all regressions is the group helping rate. Benchmark condition in Column 1 are merged groups with a low helping norm. In Column 2, the benchmark condition are two groups with a high helping norm (in High-Low groups). Regressions are limited to groups with a high helping norm. In Column 3, the benchmark condition are two groups with a low helping norm. Regressions are limited to groups with a low helping norm (in High-Low groups).
© 2019 by the author. Licensee MDPI, Basel, Switzerland. This article is an open access article distributed under the terms and conditions of the Creative Commons Attribution (CC BY) license (http://creativecommons.org/licenses/by/4.0/).
Share and Cite
MDPI and ACS Style
Schmitz, J. When Two Become One: How Group Mergers Affect Solidarity. Games 2019, 10, 30. https://0-doi-org.brum.beds.ac.uk/10.3390/g10030030
AMA Style
Schmitz J. When Two Become One: How Group Mergers Affect Solidarity. Games. 2019; 10(3):30. https://0-doi-org.brum.beds.ac.uk/10.3390/g10030030
Chicago/Turabian StyleSchmitz, Jan. 2019. "When Two Become One: How Group Mergers Affect Solidarity" Games 10, no. 3: 30. https://0-doi-org.brum.beds.ac.uk/10.3390/g10030030
Note that from the first issue of 2016, this journal uses article numbers instead of page numbers. See further details here.