Communication, Expectations, and Trust: An Experiment with Three Media


1
Centre for Geography, Resources, Environment, Energy and Networks, Bocconi University, 20136 Milan, Italy
2
Department of Food, Agricultural, and Resource Economics, Guelph University, Guelph, ON N1G 2W1, Canada
3
Department of Economics, University of Hawaii at Manoa, Honolulu, HI 96822, USA
*
Author to whom correspondence should be addressed.
†
Current address: via Roentgen 1, 20136 Milan, Italy.
‡
These authors contributed equally to this work.
Games 2020, 11(4), 48; https://0-doi-org.brum.beds.ac.uk/10.3390/g11040048
Submission received: 1 August 2020
/
Revised: 13 October 2020
/
Accepted: 16 October 2020
/
Published: 28 October 2020
(This article belongs to the Special Issue Experiments on Communication in Games)
Abstract
:We studied how communication media affect trust game play. Three popular media were considered: traditional face-to-face, Facebook groups, and anonymous online chat. We considered post-communication changes in players’ expectations and preferences, and further analyzed the contents of group communications to understand the channels though which communication appears to improve trust and trustworthiness. For senders, the social, emotional, and game-relevant contents of communication all matter, significantly influencing both their expectations of fair return and preferences towards receivers. Receivers increased trustworthiness is mostly explained by their adherence to the norm of sending back a fair share of the amount received. These results do not qualitatively differ among the three communication media; while face-to-face had the largest volume of messages, all three media proved equally effective in enhancing trust and trustworthiness.
JEL Classification:
C72, C92, D831. Introduction
‘More than two-thirds of teens say they would rather communicate with their friends online than in person’—The Wall Street Journal, 10 September 20181
Online social media is now ubiquitous as a communication medium. According to the Pew Research Center, just 5% of American adults used social media platforms in 2005, but by 2019 this fraction had risen to 72% (with 90% of adults aged 18–29 reporting the use of online social media) [1]. Aside from YouTube, Facebook remains the most widely used social media site among adults in the U.S. [1].
We investigated the role of popular online communication media as compared to traditional face-to-face communication in enhancing trust and trustworthiness in a standard laboratory trust game [2]. Understanding the characteristics of economic and social environments that enhance trust and trustworthiness is important because of the documented link between trust and economic development [3].2 An extensive literature on the role of communication using laboratory experiments shows that communication enhances economic cooperation and trust [9]. However, communication via online social media such as Facebook is still understudied in controlled laboratory settings. Do the contents and other aspects of communication via online media differ substantially from face-to-face, and do these differences lead to different levels of trust and trustworthiness in a simple laboratory setting?
In this study, we considered three communication media that are now commonly used in everyday life: face-to-face communication, communication via Facebook, and communication via anonymous online chat, and compared their effectiveness in enhancing trust and trustworthiness. These media differ in the degree of anonymity and the richness of available communication channels. Face-to-face is the most traditional and the richest medium, allowing speakers to supplement verbal communication with facial expressions, body language, and voice tones. Communication through a Facebook group offers more anonymity by allowing users to adjust their privacy settings, but it is less anonymous than online chat and offers important personal information including name and profile picture; it also allows users to check for mutual friends on Facebook. Moreover, with the existence of emoticons, GIFs, and various avatars, it allows for more freedom of expression. Anonymous online chat only allows for verbal communication and gives participants full control over which personal information, if any, to disclose. Based on the richness of communication channels, one would expect face-to-face to continue to be the most effective medium, as has been traditionally found [10].
Alternatively, the common use of online media in everyday life may make these media equally effective in enhancing trust and trustworthiness in simple experimental games. Online surveys among Facebook users find that active participation in Facebook groups increases life satisfaction, social trust, civic engagement, and political participation [11,12]. Many Facebook groups are open to prior strangers, and many are created specifically to facilitate market transactions.3 Facebook Marketplace,4 in particular, along with many Facebook groups are dedicated to buying and selling items among individuals [16]. Trading companies further use social media “to interact directly with … desired customers to start building a trusting relationship” [17]. With the number of Facebook groups open to new members and the large sizes of many of these groups,5 it is becoming common practice to interact and share personal information with a wide network of strangers. Many other online forums and discussion groups allow people to disclose less personal information (if any at all), and therefore approach simple text chat in terms of their degree of anonymity. Comments sections on blogs, periodicals, and other online forums not only focus on sharing opinions with total strangers, but may also influence people’s attitudes and beliefs about politics and social norms [20,21]. Based on this evidence, one may conjecture that despite variable degrees of anonymity and the amount of personal information shared, online communication media may still be effective in fostering cooperation and trust among strangers.
Although face-to-face communication has traditionally been found to improve economic outcomes in laboratory experiments more effectively than other forms of communication [22,23], more recent studies suggest that online communication is becoming as effective. Ben-Ner and Putterman [9] demonstrate that pre-play communication via structured proposals and chat messages increases trusting and trustworthy behavior. Charness and Dufwenberg [24] find strong effects of written free-form messages in experimental games studying trust in partnerships. Chen and Li [25] report that communication through online chat is effective in inducing group identity and increasing economic productivity. Abatayo et al. [26] find that communication via online chat as well as posts and replies in Facebook groups are just as effective in fostering cooperation in a voluntary contributions public good game as face-to-face communication. Bicchieri and Lev-On [27] find that game-relevant online anonymous chat has the same positive effect on trust as game-relevant face-to-face chat, while “irrelevant” communication, both face-to-face and online, had a much smaller effect on trust and trustworthiness.6 Fiedler and Haruvy [29] study communication in Second Life (virtual reality world) using avatars and text chat. They find that anonymous and irrelevant pre-play communication in groups of three or four had a large and positive effect on trust (the amount sent), and—for university students, but not for Second life residents—a positive effect on the proportion returned.7 Babin [31] finds a large effect of text-messages and emoji on trust, but only a modest effect on reciprocation. However, none of these papers directly compare three of the most commonly-used communication media in a trust game setting, the task that we undertake in the present study.
We solicited participants’ beliefs about their counterparts’ actions to investigate the mechanisms through which communications via different media affect trust and trustworthiness. The experimental literature has long established a high correlation between own behavior and expectations of other players’ actions [32,33,34,35,36]. Ashraf et al. [34] report that variations in trust and trustworthiness are explained both by expectations of the counterpart’s action and by unconditional kindness. Sapienza et al. [35] also argue that sender behavior is driven by both beliefs and preferences. Guerra and Zizzo [33] confirm the hypothesis on “trust responsiveness”, the tendency of individuals to fulfill trust because they believe that the trust—through expectations—has been placed on them. Much of the recent literature discusses the effect of one-way communication such as promises on second-order beliefs [24], suggesting that trustworthiness may be explained by guilt-aversion.8 However, Ellingsen et al. [40] show that a correlation between second-order beliefs and own behavior of responders may be due to the consensus effect rather than guilt-aversion; Blanco et al. [41] find evidence that preferences and beliefs in sequential social dilemmas are not independent.
We therefore solicited first-order player beliefs of their counterpart’s actions, and use pre-communication beliefs as proxies for pro-social inclinations; we further studied how these beliefs change after communication under different media, and whether these changes in beliefs explain changes in trust game play.
We further analyzed communication content under each media to understand whether the content of the communication is more important for trust and trustworthiness than the type of communication medium used. We used two complementary communication analysis techniques: (1) a human-coded content analysis similar to Chen and Chen [42] and Cooper and Kühn [43]; (2) a linguistic analysis using the content analysis software package “Linguistic Inquiry and Word Count” (LIWC) [44,45,46]. Content analysis allowed us to consider which components of communication are especially effective, and which are detrimental for trust and trustworthiness under the media that we studied.
As promises in dyadic communications are known to enhance trustworthy behavior [24], we also considered the role of sender and receiver promises and group agreements on coordinating beliefs and actions in the trust game. Unlike many studies on promises that focus on two-person communications, we explored the effect of promises and agreements under free-form multi-way group communications of various degrees of anonymity, where participants’ respective roles of sender or receiver may remain undisclosed.
In sum, the contributions of this study are threefold. First, we compared traditional face-to-face communication with two relatively new but now common online media, Facebook discussion, and online chat. Second, we linked the effects of communication to actions and expectations in the trust game, and considered if after-communication changes in behavior are solely due to changes in expectations of a counterpart’s play, or to other aspects, such as changes in preferences and norm-enhancement. Third, we contributed to the study of communication contents by using two complimentary approaches: content analysis using human coders and computational linguistic analysis LIWC. We also provided insights on agreements in group settings where player roles may remain undisclosed.
We focused on three main research questions in this study. First, does traditional face-to-face communication outperform other forms of communication at fostering trust and trustworthiness, and do richer and less anonymous formats (Facebook) increase trust and trustworthiness more than anonymous text messages (chat)? Second, do different modes of communication affect sender and receiver expectations and preferences differently? Third, which verbal and emotional components of communication, including its volume and contents, have the most pronounced effect on sender and receiver behavior, and do these elements differ across communication media?
We found that all three communication media are equally effective in enhancing trust and trustworthiness. Following group communication, almost two-thirds of sender–receiver pairs achieved joint-payoff-maximizing and egalitarian outcomes. On an individual level, daily Facebook users who had many Facebook friends behaved no differently than participants who used Facebook less often. Face-to-face communication had the highest communication volume, whereas Facebook had the lowest volume but the highest share of game-relevant messages. While sender trust under Facebook was slightly lower than under face-to-face or anonymous chat, this is likely attributable to differences in initial sender predispositions rather than to differentiated media effects. We further found that communication had markedly different effects on senders and receivers. While communication increased senders’ trust both via increasing their expectation of fair return and via other channels such as changing preferences towards the receivers, its effect on receivers was mostly via enhanced expectations of the amount that would be sent; conditional on receiver expectations, the share returned remained unchanged before and after communication. Senders were much more likely to send full amounts and expect fair return if such play was explicitly discussed, although explicit agreements and promises on following through with “send all—return fair share” strategies appear to be unimportant for both senders and receivers. Interestingly, game-irrelevant social communications are also associated with trusting behavior, likely through affecting sender preferences. In contrast, communication content had no significant association with receiver trustworthiness.
2. Experimental Design
Participants were recruited from the student population of the University of Hawaii in Manoa (USA) using the Online Recruitment Software for Experimental Economics (ORSEE) [47]. For consistency across treatments, only individuals who had a Facebook account were invited to participate. Each experimental session consisted of three parts: Part 1, pre-communication trust game; Part 2, communication; Part 3, post-communication trust game. We conducted Part 1 for two reasons. First, although we randomly assigned participants into sessions (and hence, into treatments), Part 1 provides for a check for any differences in subjects’ predispositions towards trust and trustworthiness across treatments prior to communication; this allows us to test if the treatment differences observed in post-communication play are attributable to treatment effects rather than differences in individuals assigned to each treatment. Second, Part 1 ensures that participants know and understand how to play the trust game before discussing it during communication stage.9
At the end of the experiment, we randomly picked a part, between Part 1 and Part 3, to pay. In Part 1, senders were not given feedback regarding the amount sent back by the receivers (see Experimental Instructions in the Supplementary Materials).
2.1. Stage Game
We used the standard trust game (TG) of Berg et al. [2] to measure trust and trustworthiness. Participants were randomly assigned to either sender or receiver role; the roles remained unchanged for the duration of the session. Senders and receivers were given 10 dollars each. The sender could send any part of their endowment to the receiver. The amount sent was tripled. The receiver then decided on how much of the money received to send back to the sender. Receiver’s expectations of the amount sent and sender’s expectations of the amount returned were elicited in an incentive compatible way [48] while their counterparts were making decisions; each participant could gain up to one dollar for correctly guessing the counterpart’s action.10
Both pre-communication (Part 1) and post-communication (Part 3) trust games were one-shot. Participants remained in the same sender or receiver role throughout the session, but were re-matched into new sender–receiver pairs between Part 1 and Part 3 using stranger design, so that each individual was matched with a different person, as was explained to participants in Experimental Instructions.
2.2. Communication Stage and Treatments
To assess the effect of communication per se and specific communication media on sender and receiver behavior, we implemented four different treatments using a between-subject design. The treatments differed only in how Part 2 of a session, the communication stage, was implemented, and were exactly the same in Parts 1 and 3. In each treatment, the communication stage lasted for ten minutes and was implemented as follows.
- No Communication (NC)
- Participants were told that experimenters needed time to setup for the next stage of the experiment. During the ten-minute “setup” time, participants were allowed to open their internet browsers and surf the web but could not communicate with one another. Participants were not given any new information about other people in their session.
- Face-to-Face communication (FTF)
- Participants in a group were seated around a table. These tables were situated as far as possible from one another so that one group did not hear the discussions of the other group. Participants could see and listen to each other “live”, but were not given each others’ names. Communications were audio-recorded with participants’ consent.
- Facebook-to-Facebook communication (FB)
- Participants communicated in Facebook groups created by the experimenter. Participants belonging to the same group could post messages and reply to each others’ messages via the Facebook group. They could see each other’s Facebook profiles, pictures, and names,11 but did not see or listen to each other “live”; the experimenter could monitor their online communication as group administrator. Once the communication time was over, the experimenter removed all the participants from the Facebook group and asked them to log out from Facebook. At the end of each session, Facebook group communication logs were saved, and the groups were then deleted.
- Online Chat (Chat)
- Participants interacted with their group members via the z-Tree software’s online text messaging option, “Chat box”. Participants were only identified using their Subject ID number, were not shown each others’ names or pictures, and could not see or hear each other “live”. The experimenter monitored communications among participants via the experimental software; chat logs were saved in z-Tree.
In all three communication treatments (other than NC), communication among participants occurred in groups of four, with two senders and two receivers. Bicchieri and Lev-On [27] find the effectiveness of group communication to be lower than dyadic, two-person, communication; we therefore employed a more challenging four-person group communication which, unlike two-person communication, allowed us to keep sender–receiver roles undisclosed, and potentially permits hiding selfish actions through channels such as diffusion of responsibility [49] or moral wiggle room [50]. Before communication started, participants in these treatments were informed that after the stage was over, they will “participate in another game with one of the individuals they just communicated with” (see Experimental Instructions in Supplementary Materials). Moreover, to maximize anonymity of past decisions, communication groups were formed in a way that no participant had their counterpart from Part 1 present in their communication group.
No additional game-relevant information, such as participant roles (sender, “A”, or receiver, “B”) or past decisions, were provided to communication groups by the experimenter; however, participants could voluntarily disclose any information they chose during communication.
2.3. Procedures
The experiment adopted standard protocols. Participants were seated in computer stations and were not allowed to communicate with one another except during the communication stage. The game and the chat part of the experiment were implemented via z-Tree [51]. A standard web browser was used for the communication session in FB. To standardize procedures across treatments, at the beginning of each session participants in all treatments were asked to open a web browser before initializing the z-Tree software. Experimental instructions were read out loud, distributed as hard copies, and displayed on the participants’ screens. At the end of Part 3, we conducted a short questionnaire which asked the participants basic demographic information and several questions on their use of online technologies. Both the questionnaire and the experimental instructions are available in the Supplementary Materials.
3. Results
We conducted 12 experimental sessions with 8 participants each, for the total of 96 participants. Table 1 provides a summary of sessions by treatment; Table S1 in the Supplementary Materials presents more details. All participants were college students, mostly undergraduates, from various majors. The gender split was close to 50/50. Out of 96 participants, only two participants (one in NC treatment and one in FTF treatment) did not have Facebook accounts. Of all participants, 69% reported using Facebook every day and 72% had more than 100 Facebook friends. Average earnings were about $23, including the $5 show-up fee. The sessions lasted for an average of 70 min.
Behavioral benchmarks for TG
We discuss several behavioral benchmarks against which we evaluate the observed behavior in the trust game. The selfish outcome corresponds to the subgame perfect equilibrium prediction under the assumption of selfish preferences: senders send zero, and receivers return zero for any amount sent. At the other extreme is the set of joint-payoff-maximizing outcomes, which are achieved as long as sender sends all $10 (which is then tripled); receiver’s action affects only the distribution of payoffs, not their sum. If parties care about the distribution of final payoffs, an egalitarian, or fair outcome is achieved if, for any amount sent by the sender, the receiver returns back twice the amount sent, i.e., two thirds of the amount received.12 Among all fair outcomes, the unique fair joint-payoff-maximizing outcome involves sender sending all ten dollars and receiver returning $20, which gives both parties the payoff of $20 each. We refer to the strategy combination implementing this outcome as “send 10/return 20”, or “10/20” strategy.
Results overview
Table 2 summarizes the results, including the actual amounts sent, frequencies of sending all, percentage returned and frequencies of fair return. In addition to actual decisions, the table summarizes the participants’ counterpart’s expectations of the corresponding actions. ‘Before’ refers to Part 1, and ‘After’ to Part 3 observations, which occurred after communication in all but NC treatments. Consider the actual actions first. From Table 2, observe that the “selfish” behavioral benchmark has very low explanatory power for our data: senders sent zero in only four out of 96 observations, and receivers returned zero in only one out of 92 observations. Next, we see that all forms of group communication increased the amount sent and did not change (under FTF) or increased (under FB and Chat) the percentage returned. In Part 1, before communication, senders in the three communication treatments sent on average $5.56, while receivers returned on average of $9.00; both amounts are no higher than what senders sent on average ($6.58) and receivers returned on average ($ 10.17) under the no communication baseline. In Part 3, after group communication, senders in the three communication treatments sent on average $3.58 more, while receivers returned, on average, $8.33 more than before. This contrasts sharply with non-positive changes in the amounts sent and percentage returned in Part 3 in the NC baseline.
Figure 1 and Figure 2 illustrate the behavior of senders and receivers in the TG before and after communication. The figures display the tripled amount each sender sent (in light grey) and the amount that the corresponding receiver returned, for each sender–receiver pair before and after communication, by treatment.13 While we observed a considerable number of senders sending the full amount of 10 dollars in both Parts 1 and 3 even in the NC baseline, we see an increased number of senders sending 10 dollars in Part 3 in all communication treatments. In fact, the frequency of sending all 10 dollars increased from 25% in Part 1 to 77.8% in Part 3 in treatments with communication, whereas it remained at 41.67% in the No Communication treatment. The frequency of fair 200% return also increased from Parts 1 to Part 3 much more, from 34.2% to 77.8% under communication, compared to a small change, from 54.6% to 60.0%, under no communication. The share of fair joint-payoff-maximizing outcomes increased from 13.9% to 64.6% between Parts 1 and 3 in the communication treatments, whereas it dropped from 25% to 16.7% between Parts 1 and 3 under no communication.
To assess the effect of different communication modes on sender and receiver behavior and expectations, we used difference-in-difference regressions of sender and receiver decisions and beliefs on part and treatment dummies, and their interaction terms. To consider possible associations of frequent online media use with game behavior, we include an indicator variable for “daily FB use, many friends” for individuals who reported using Facebook daily and having more than 50 Facebook friends; we also control for gender. Due to a relatively small number of independent sessions, and to account for possible inter-dependencies of observations within sessions, we conducted, for each regression reported in this section, 1000 bootstrap estimations based on 12 clusters on session, and used the percentile method to compute the bootstrap confidence intervals for all estimated coefficients [52,53].
Sender behavior and expectations
Consider sender behavior first. Table 3, columns (1), and (4), display the results of difference-in-difference maximum likelihood estimation of the amounts sent and probability of sending all ten dollars, correspondingly, on part and treatment dummies, their interaction terms, and the indicator variables for frequent Facebook use and gender. Tobit was employed for the estimation of the amount sent because of high number of observations with all 10 dollars sent.
We observed a positive and significant effect of each communication treatment on the amount sent and probability of sending all (regressions (1) and (4)). First observe that coefficient on “After” (Part 3) dummy is negative and significant for Tobit regression (1) () or zero (for Logit regression (4)), indicating that the amount sent decreased, and the probability of sending the full amount did not change from Part 1 to Part 3 in the baseline No Communication treatment. In contrast, the amount sent and the probability of sending all increased in Part 3, as compared to No Communication baseline, in all communication treatments: the coefficients on “FTF After”, “FB After”, and “Chat After” are all positive and significant at 1% or 5% significance levels in both regressions. Further, based on chi-squared tests, post-communication amounts sent and probabilities of sending all 10 dollars are not statistically different among the three communication treatments at 5% level of significance, indicating that all three communication modes resulted in similar, close to the maximal, amounts sent, and high probabilities of sending all.14
To understand the mechanism behind the effect of communication, we considered sender expectations of receiver behavior next. From Table 2, we observe noticeable increases of expected percentage returned after communication, with the average expected share returned at or close to fair return of 66.7% in two out of three (FTF and Chat) communication treatments. Following communication, three-quarters or more of all senders expected fair return on their amount sent in all three communication treatments, compared to only ten percent of senders expecting fair return in Part 3 under no communication.
We asked, therefore, whether communication increased the amount sent through affecting sender’s first-order beliefs about the amount to be returned by receivers, or through other channels such as changing preferences towards the receivers (e.g., because of reduced social distance) or creating commitment to sending more, or both. For robustness purposes, we use two alternative regression specifications: one including expected share returned (regressions (2) and (5) in Table 3), and the other including an indicator variable for sender expecting a positive and fair 200% return on the amount sent (regressions (3) and (6)). We observe that the indicator variable specification explains sender behavior better: the correlation coefficient with the amount sent is higher for “expect fair return” (Spearman’s ) then for the expected percentage returned ().15 As discussed in the Behavioral Benchmarks above, the special value of 200% return on the amount sent would guarantee, for any amount sent, equal payoffs for sender and receiver. Further, if the full amount of $10 is sent, it guarantees the fair joint-payoff-maximizing outcome, with both sender and receiver getting $20. Hence, an expectation of 200% return on the investment would make a social-welfare maximizing and inequality-averse sender [54,55] inclined to send more.
We observe that the expectation of fair return is highly positive and significant () in explaining sender behavior (Table 3, columns (3) and (6)), suggesting that an increased amount sent after communication is due, to a significant extent, to increased expectations of fair return. Variables “FTF After”, “FB After”, and “Chat After” representing corresponding treatment effects (through channels other than first-order expectations) maintain their significance () for the estimation of the amount sent, but only “FTF After” remains significant for the estimation of probability of sending all. This suggests that communication through all three media affected the amount sent both through increasing sender expectations of the amount returned, and through other channels. However, the probability of sending all increased after communication mostly due to senders’ increased expectations of fair return, with FTF standing out as the only treatment that affected sender’s probability of sending all through other channels. These regressions further indicate that lower amounts sent observed under FB treatment after communication are due to the initial propensity of FB users to send less compared to other treatments, and not to differentiated effect of communication under FB: the coefficient on ‘FB’ indicator variable is negative and significant. We also observed that demographic variables, and frequent Facebook use in particular, have no significant association with sender behavior.16
To verify that communication indeed had a significant effect on expectations, we present, in Table 4, regression analyses of sender expectations on treatment.17 We focus on regression specifications (1), (3), and (5), which estimate sender expected return and probability of expecting fair return on part and treatment variables, as well as Facebook use demographics. (Regression specifications (2), (4), and (6) that include communication contents as explanatory variables will be discussed in Section 4 below.) We find that the expected percentage returned did not significantly change from Part 1 to Part 3 under No Communication (the coefficient on ‘After’ is insignificant); in contrast, it increased after communication under all three communication treatments, with the increase being positive and significant for all three treatments under most specifications. Moreover, based on chi-squared test for regression specifications (1) and (3), the effect of FTF after communication (FTF After) is significantly different (higher) than under “FB After” () and “Chat After” (); the difference between “FB After” and “Chat After” is not significant. Thus we obtained a weak evidence that FTF communication has a stronger effect on expectations than computer-mediated media. However, there were no such differences in the increases of expectation of fair return (column (5)), which had the most pronounced effect on sender behavior.18
In addition, the estimation (5) in Table 4 indicates that daily Facebook users with many friends were more likely to expect a fair return than other participants.
We conclude:
Result 1.
The amount sent and the probability of sending all ten dollars increased significantly under all communication treatments, but not under no communication. This increase is explained by communication increasing sender expectations of fair return, and also by affecting senders through other channels. Sender expected return after communication increased more under face-to-face, as compared to other media. Daily Facebook users with many online friends had higher expectation of fair return compared to other individuals. However, these differences in expectations did not translate into significant differences in sender behavior, as most senders trusted all following communication.
Receiver behavior and expectations
We now turn to receivers. Regression estimations of receiver decisions on the amount and share returned, and on the probability of fair return, are presented in Table 5. As with senders, first consider the direct effect of communication treatments on receiver behavior (columns (1), (3), and (5) in the table). We observe that the amount sent affects the amount returned, but not the share returned by receivers: the coefficient on ‘amount sent’ is positive and significant in regression (1), but not in regression (3); the probability of fair return is significantly positively associated with senders sending all (column (5)), but not with other amounts sent. Next, both the amount and the share returned decreased in Part 3 under no communication (the coefficient on ‘After’ is negative and significant, ), although the probability of fair return increased (column (5)). In comparison, all three communication treatments displayed a significant increase in the amount returned after communication even controlling for the amount sent. However, the share returned is estimated to increase after communication only under Chat (column (3)), and the probability of fair return changed insignificantly compared to the NC baseline (column (5)).
Can the increase in the amount returned observed in all communication treatments, conditional on the amount sent (column (1) above), be attributed to changes in receiver expectations? From columns (2), (4), and (6) in Table 5, we observe that expectations had a robust, significant, and positive effect on receiver behavior, although receivers made decisions on the amount returned after observing the actual amount sent. This provides evidence that receiver expectations of sender actions are not independent of their preferences [40,41] and may be indicative of receiver’s own pro-social tendencies.19
In the presence of receiver expectations, most other explanatory variables of receiver decisions lose significance, although the amount sent remains significant in the estimation of the amount returned (column (2)), and the indicator on ‘sent all’ stays marginally significant () in the estimation of the probability of fair return (column (6)). In other words, receiver behavior is driven mostly by receiver expectations of the amount sent; the actual amount sent affects significantly only the amount, not the percentage returned. Sender sending all ten dollars increases the probability of fair return, but not the percentage returned, indicating a substantial variability of the latter.
Given the strong effect of receiver expectations on decisions, we now explore whether and how these expectations changed between Parts 1 and 3 of the experiment, and whether these changes, if any, were any different between communication media. The results of regression estimations of the effect of treatments on receiver expectations of the amount sent, and of the probability that receivers expect senders to send all, are presented in Table 6. As with senders, we focus on (1), (3), and (5) columns now, and discuss regression specifications (2), (4), and (6) in Section 4 below.
We first note that, compared to other treatments, receivers in FB treatment before communication had significantly lower expectations of the amount sent overall, and fewer receivers expected senders to send all; in fact, no receiver expected senders to send all 10 dollars before communication under FB (see Table 2). Comparing Parts 1 and 3, while receivers expectations did not change significantly between Parts 1 and 3 under no communication, the expectations of amount sent increased after communication under FTF and Chat (columns (1) and (3)). Furthermore, FTF, FB and Chat all displayed a significant increase in the share of receivers expecting senders to send all ten dollars following the communication stage (column (5)). FB exhibited significantly higher increase as compared to other treatments , changing the percent of receivers expecting to be sent all 10 dollars from 0% before to 58.3% after communication (Table 2). In spite of the highest increase in receiver expectations under FB across treatments, post-communication shares of receivers expecting ‘sent all’ were still lower, although insignificantly (, chi-squared test), under FB as compared to either FTF or Chat treatments. Indeed, from Table 2, the overwhelming majority (91.7%) of receivers under both FTF and Chat expected senders to send all 10 dollars after communication, compared to only 58.3% under FB. However, we believe that the difference is explained by receiver lower initial expectations under FB, rather than lower effectiveness of FB communication compared to other media (FTF or Chat). It is notable that these lower expectations did not translate into lower, compared to FTF and Chat, returns by receivers, with receivers under FB returning as high a share of the amount received, and making a fair return more frequently than receivers under FTF and FB treatments (Table 2 and Table 5).
We also observe from Table 5 and Table 6 that daily Facebook use had no association with receiver game behavior or expectations.
We conclude:
Result 2.
The amount returned increased significantly after communication under all three communication treatments. This increase is due to both the increase in the actual amount sent by senders, and to the increase in receiver expectations of the amount sent. Receivers who observed senders send all were significantly more likely to make a fair return, resulting in a high frequency of fair joint-payoff-maximizing outcomes after communication. There is no evidence of differentiated effect of communication on receiver actions or expectations across the FTF, FB, and Chat media. Receivers in the FB treatment had lower, compared to other treatments, initial expectations of sender behavior, but these expectations increased to levels not significantly different from FTF and Chat after communication. Daily Facebook use and having many online friends is not associated with any differences in receiver behavior or expectations.
We summarize these results as follows. Communication had a strong effect on senders, causing them to send significantly more to receivers, both because they expected receivers to return more, and through other channels (such as changing preferences towards receivers, or creating a commitment to send more). In contrast, communication did not directly affect the percentage receivers sent back to senders. However, since both the amount sent and receiver expectations of the amount sent significantly increased after communication, so did the absolute amount returned. Senders expecting a fair return were significantly more likely to send the full amount, and receivers receiving the full amount were significantly more likely to return a fair share, resulting in almost two thirds of sender–receiver pairs obtaining the fair joint-payoff maximizing outcome after communication. Moreover, these results do not differ, qualitatively, between FTF, FB, and Chat treatments. All three communication media were equally effective in enhancing trust through the increased expectations of fair return and as well as other channels, and in enhancing trustworthiness through the increased expectation of amount sent.
4. Communication Analysis
To better understand the reasons for the effectiveness of communication under the three media, we now turn to a detailed analysis of participant conversations. First, we provide an intuitive summary of communication contents under the three media, focusing on features of communications that were apparent from reading group communication logs.
Second, we conducted a more formal and detailed content analyses and consider whether FTF, FB, and Chat media differ in communication volume and in the composition of messages—specifically, the proportions of “irrelevant” social, and game-relevant messages. Further, we use statistical analyses to search for the types of message contents that had a significant impact on the enhancement of trust and trustworthiness. Was engaging in game-relevant conversation alone important, or was the social and emotional aspect of communication important as well? Which game-relevant topics had a significant impact on sender and receiver behavior?
All communication sessions were recorded, using an audio recorder under FTF, computer logs under FB, and Z-Tree chat session logs under Chat. FTF sessions were then transcribed by a stenographer. We conducted content analyses of communication logs using two complementary approaches: using human coders (similar to Chen and Chen [42] and Cooper and Kühn [43]) and using a standard Content Analysis software package Linguistic Inquiry and Word Count 2007 (LIWC).
We present a short summary of communications in Section 4.1, then present human–coder analysis in Section 4.2, and finally turn to the computational analysis in Section 4.3.
4.1. Communication Summary
A short summary of group communication logs contents by treatment is presented in Table 7. Sample communication logs are included in Tables S4–S9 of the Supplementary Materials.
One apparent similarity of group communications across different media is groups’ frequent discussions of joint-payoff-maximizing ‘send 10/return 20’ (‘10/20’) strategy. In many cases, participants approached the task of finding the ‘best and equal payoff’ outcome as a group decision problem; discussions of trust issues appeared secondary. Most groups that found the ‘10/20’ solutions successfully implemented it, with and without explicit agreements.20 In a minority of groups, participants did not discuss the ‘10/20’ strategy but promised to “send more” as senders and “send back half” or “be fair” as receivers; participants in such groups appeared largely unsuccessful in attaining efficient and egalitarian outcomes in the post-communication game. Below, in addition to considering contents variables obtained form more formal contents analysis, we also consider simple indicator variables for group discussions of ‘10/20’, and individual promises, in association with player post-communications trust game play and beliefs.
There were few other differences across the media. Players in half or more groups in each treatment disclosed their roles, and some disclosed past decisions. Participants in half of FB groups referred to each other by names, but participants in Chat groups sometimes called each other by ID’s instead of names.
4.2. Game-Relevant and Social Communications
Two independent human coders classified all messages21 into either social or game-relevant content categories, and into three statement types: (i) proposals and explanations, (ii) questions, and (iii) approvals and agreements. Game-relevant categories included: discussion of norms and goals (money maximization, equal split, and fairness), division of payoffs (how much to send and return), and implementation and enforcement issues (not cheating, trust, etc.). Detailed classification categories are available in the Supplementary Materials. We allowed for one content category per message; disagreements between the two coders were rare. A measure of inter-coder agreement for Message Content and Message Type, [56], along with the distribution of messages by content category and by statement type, are reported in Table 8.
Before analyzing the content, we summarize communication volume and share of game-relevant messages per treatment, as displayed in the bottom part of Table 8. We observe that FTF groups are characterized by a much higher communication volume: 120.67 messages on average per group as compared to only 35.1 messages under FB and 76.33 messages under Chat. However, the share of game-relevant messages is the highest under FB: 69.98%, followed by 56.41% under FTF, and the lowest, 54.06%, under Chat. This suggests that FB, while characterized by relatively low communication volume, was more focused on game-relevant conversations compared to the other two treatments.
We next conducted regression analyses of trust (amount sent) or trustworthiness (share returned) of individual senders and receivers in the post-communication trust game with the content and volume of communication as explanatory variables. Due to a limited number of independent communication groups, we kept the number of explanatory variables low, and considered these analyses exploratory.22 We chose the set of content variables to provide the best fit; therefore, not all content categories are included.23 Aside from the variables on number of social and specific game-relevant messages, the explanatory variables include FB and Chat treatment dummies (FTF treatment is the omitted variable), the pre-communication amount sent for senders or the pre-communication percentage returned for receivers (to control for initial individual differences), and, for receivers, the amount they have been sent. To allow for comparison across treatments, the number of messages in each category is normalized by the average communication volume by treatment.
The results are presented in Table 9.
The estimation of the amount sent presented in column (1) suggest that the number of social messages have a positive and marginally significant effect (), and the number of game-relevant messages is significantly and positively associated with the amount sent (), indicating that both social and game-relevant communications improve trust. Messages on sending the full amount of 10 (implying joint payoff maximization) without discussing the amount returned have no significant association with the amount sent, while messages on sending 10 and returning 20 (implying joint payoff maximizing and fair outcome) significantly increase the amount sent (). Interestingly, messages on cheating, although stated mostly as appeals not to cheat, significantly reduced the amount sent by senders (). Such messages likely expressed sender concerns about receiver trustworthiness or anchored sender attention to the receivers’ lack of incentives to send anything back. Discussions of trust had no significant association with sender behavior.
As a robustness check, and given an apparently focal nature of the ‘10/20’ strategy discussions in many groups, we present alternative regression estimations of amount sent and probability of sending all, by including, for contents, only the indicator variables for ‘discussed 10/20 strategy’ and ‘agreed on 10/20 strategy’. As is apparent from the results given in in columns (2) and (3) of the table, these alternative specifications provide a better fit for sender decision estimations then the larger set of content variables; discussing the ‘10/20’ strategy is positively and significantly () associated with the amount sent, and with senders sending all.
For receiver behavior (column (4) in the table), consistent with Section 3 findings, the content of communications had little effect on the percentage returned: the coefficients on content variables are insignificant. Alternative estimation of share returned using the ‘10/20’ strategy discussion as an explanatory variable confirms that for receivers, communication contents appeared to have little relevance for the percentage returned (column (5)). However, having discussed ‘10/20’ strategy is positively and significantly associated with the probability of fair return (column (6)). In addition, receiver promise to “be fair” is associated with an increased share returned (, column (5)) and an increased probability of fair return (, column (6)).
Considering whether FTF, FB, and Chat media had a differentiated effect via channels other than verbal contents, we observe that senders under FB were less likely to send all than under FTF, other things being equal ( for FB indicator in column (3)) but receivers under FB exhibited higher trustworthiness in spite of lower trust shown by senders ( for FB indicator in column (6)). However, as discussed above, these differences were likely due to variations in participant initial characteristics which persisted through the session, rather than differentiated effects of communication treatments.
Result 3.
Both social and game-relevant discussions are positively associated with the amount sent by senders. Discussions of ‘sending 10, returning 20’, had a strong, positive, and significant association with the the amount sent and the probability of sending all by senders, and with the probability of fair return by receivers. Having explicit agreements on implementing the ‘10/20’ strategy was not significant, while making a promise to “be fair” was significant for receivers. Discussion of cheating were associated with lower amounts sent, and messages on trust were of no significance. Controlling for communication contents, there were no significant differences in the effect of communications via FTF, FB, and Chat media.
We finally considered if communication contents, and specifically, discussing and agreeing on ‘10/20’ strategy, is associated with player beliefs. Table 4, columns (2), (4), and (6), present estimations of sender beliefs about percentage returned with added ‘10/20’ discussions and agreements indicator variables. We observe, surprisingly, that game-relevant discussions appeared to have little effect on sender expected return: the indicator variables on the discussions and explicit agreements on ‘10/20’ strategy are not significant. As these game-relevant discussions do not seem to significantly influence sender first-order beliefs about percentage returned, it appears that the process of communication itself—especially under face-to-face—enhances sender beliefs of receiving a higher and fair return on their investment. For receivers, we observe, in contrast to senders, that discussing “send 10/receive 20” strategy had a statistically significant effect on increasing receiver expectations of the amount sent, and especially of senders sending all; see Table 6, columns (2), (4), and (6). In addition to discussions of ‘10/20’ strategy, explicit agreements on implementing this payoff-maximizing and fair strategy did not have an additional positive effect on expectations.
Result 4.
Game-relevant discussions of ‘send10/return20’ strategy are not significantly associated with increased sender expected return on the amount sent. In comparison, for receivers, discussions of ‘10/20’ are associated with significantly higher expectations of the amount sent, and of senders sending all.
We concluded that communication appeared to change sender and receiver expectations through completely different channels: while it increased sender expectations of fair return through channels other that specific strategy discussions, receiver changes in first-order expectations were significantly associated with game-relevant discussions of strategies. While receiver first-order beliefs are not as instrumental for their decisions as senders’, because receivers observe the actual amount sent before making a decision on the amount returned, these receiver expectation changes serve as an indicator of coordinating role of communication.
4.3. Linguistic Analysis
The words used in each Trust Game communication session were also analyzed using a Content Analysis software package: Linguistic Inquiry and Word Count 2007 (LIWC). The software processes each word spoken or written by searching for it from a list of category dictionaries and then incrementing the score of any category that the word appears in. For example, the word “distrust” is part of three word categories: (i) affect, (ii) negative emotion, and (iii) anger. Hence, if “distrust” is found in the text for a group, each of these three category scores gets incremented for that group.
We used the output from the software to explore whether differences in the words used by groups are associated with individual-level differences in trust and trustworthiness. We considered the following word categories that may impact the amount of money sent and returned: the number of words per sentence, numerals, money, positive emotions, negative emotions, question mark, and exclamation mark. The numerals category include words like “second” and “thousand”; the money category includes words like “cash”, “audit”, and “owe”; the positive emotions category includes words like “love”, “nice”, and “sweet”; the negative emotions category includes words like “hurt”, “ugly”, and “nasty”; and the question mark and exclamation mark categories include their respective punctuation marks.
Table 10 presents the regression results of sender and receiver actions on the above word categories. Consistent with the findings reported in Section 4.2 above, the shares returned by the receivers are only affected by the amount sent by the senders. The amounts sent, on the other hand, increase the more participants talk about numerals, decrease the more participants use words that evoke negative emotions, and decrease the more participants use question marks. The results for numerals and question marks hold even after controlling for individual sender predispositions (measured by the amount sent in Part 1). We also reconfirm that senders under FB are less trusting, as they send less compared to other treatments.
Result 5.
Senders in groups that discussed specific numerical proposals sent higher amounts, while senders in groups that expressed more negative emotions and questioned more sent lower amounts. Shares returned by receivers were not significantly associated with communication contents or emotions categories considered.
5. Conclusions
We present an experiment that considers how communications under different popular media affect trust game play through player expectations and preferences. Our findings are quite stark. The three communication media that we studied—the traditional face-to-face, the popular online media Facebook, and anonymous chat—all result in equally significant increases and in trust and trustworthiness, leading to the majority of senders fully trusting, and the majority of receivers sending back a fair return, under all treatments. While face-to-face was characterized by the highest communication volume, Facebook had the highest share of game-relevant content, with all three media proving equally effective in enhancing trust and trustworthiness. These findings are in contrast with earlier studies documenting superior effects of face-to-face [22,23], but in agreement with more recent evidence on the growing effectiveness of online media [26]. Apparently, having access to any kind of free-form communication prior to making decisions in the trust game allowed participants to discuss and achieve joint-payoff-maximizing and fair outcomes irrespective of whether explicit agreements were reached or not during communication. These outcomes were achieved in spite of the group, no-dyadic nature of communications, and irrespective of participants’ ability to see or hear other participants live (as under face-to-face), or see others’ pictures, names, and public profiles (as under Facebook).
Given that we only invited participants who had an existing Facebook account, these results are reflective of people who are already well versed with online communication; hence it may not be surprising that they are as at ease communicating online as face-to-face. However, as discussed in the introduction, these online media users constitute an overwhelming majority—90 percent—of American adults aged 18–29 [1]. We therefore believe that our participants are quite representative of a wider population of college students, if not a broader group of young adults, and these results are informative about the effects of communication media in simple economic situations involving trust.
We further explored the reasons for the high effectiveness of communication. We established a special, focal role of sender expecting a fair return, and receiver expecting the maximal amount sent. Senders expecting a fair return were significantly more likely to send the full amount and receivers expecting and receiving the full amount were significantly more likely to return a fair share. These expectations, that were greatly enhanced through communication, resulted in almost two thirds of sender–receiver pairs obtaining the joint-payoff-maximizing fair outcome after communication, providing evidence of participant preferences for efficiency and fairness [54,55]. Indeed, using contents analysis, we confirm that discussing sending the full amount and returning a fair share had a strong positive impact on implementing these outcomes.
Our findings are consistent with Ben-Ner and Putterman [9] who report that both senders and receivers favor fair and efficient divisions. However, in our experiments, communication affected senders and receivers via somewhat different channels. Communication had a strong effect on senders, causing them to send significantly more dollars to receivers, both because they expected receivers to return more, and through other channels, such as enhanced preferences towards receivers, or though feeling a moral obligation to follow though with the strategy of sending all, that was often discussed during communication. Interestingly, senders’ belief of receivers returning a fair share was not enhanced by game-relevant discussions, but appeared to be reinforced by communication process per se. For receivers, we find that communication did not directly influence the percentage they sent back to senders. However, since both the amount sent and receiver expectations of amount sent increased significantly after communication, so did the amount returned. Unlike senders, receiver expectations of the amount sent were significantly influenced by game-relevant discussions of ‘sending 10/returning 20’ strategy.
The finding on an insignificant direct effect of communication on percentage returned by receivers may appear puzzling, although not inconsistent with Fiedler and Haruvy [29] and Babin [31]. Receivers actions do not seem to be significantly affected by communication contents either, although their beliefs about sender actions are reinforced by game-relevant discussions. Apparently, receivers’ behavior in our experiment is largely driven by their adherence to a social norm of giving back a fair share in response to the full amount sent; while many receivers returned close to fair share even before communication, communication enhanced receiver expectation of senders sending the full amount, thus making receivers more likely to return a fair share.
We further obtained interesting insights into communication contents. Not only we find that game-relevant discussions are critical for achieving efficient and fair outcomes; social discussions also increase the amount sent, most likely though enhancing sender preferences towards receivers. Using computational linguistics analysis, we further documented a detrimental effect of negative emotions and question marks on trust: participants in groups who expressed negative emotions and asked more questions sent less. The finding on the negative effect of question marks is in curious contrast with Chen and Chen [42], who report that participants who asked more questions during problem-solving stage chose higher efforts in a minimum-effort coordination game. It appears that the effect of questions is highly context-dependent; while it may indicate constructive inquiry and higher group involvement under problem-solving, it may also signal doubts and and concerns about cheating in settings such as trust game.
In sum, we demonstrated that online communication, traditionally a limited medium, has become as effective as direct face-to-face communication in inducing individuals to trust and return trust in a simple laboratory settings. We believe that this equivalence is due to the common use of online communication media in people’s lives, rather than by the artifacts of our design. We observe very few differences in either overall effects of different communication media, or in the channels through which these media affect sender or receiver behavior. There is weak evidence that face-to-face communication leads to higher increase of expected return by senders, and that daily Facebook users with many online friends have higher expectation of fair return compared to other individuals (Result 1). However, these differences in expectations did not translate into significant differences in behavior in our experiment, as most senders trusted all, and most receivers returned a fair share, following communication under all three media. The next challenge is to consider features of economic situations where such media equivalence breaks down. We leave this challenge for future inquiry.
Supplementary Materials
The following are available online at https://0-www-mdpi-com.brum.beds.ac.uk/2073-4336/11/4/48/s1.
Author Contributions
All authors contributed equally to the paper. All authors have read and agreed to the published version of the manuscript.
Funding
We gratefully acknowledge the support of a Technology, Innovation and Society grant from the University Research Council of the University of Hawai‘i. Lynham acknowledges the support of the National Science Foundation through grant GEO-1211972. Abatayo acknowledges the support of the European Research Council through Project RISICO, Grant No. 335703.
Acknowledgments
We would like to thank audiences of conferences at the Economic Science Association. We would also like the editor and three anonymous referees for their useful feedback.
Conflicts of Interest
We have no conflict of interest to declare.
References
- Perrin, A.; Anderson, M. Social Media Usage in the U.S. in 2019; Technical Report; Pew Research Center: Washington, DC, USA, 2019; Available online: https://www.pewresearch.org/internet/fact-sheet/social-media/ (accessed on 1 June 2020).
- Berg, J.; Dickhaut, J.; McCabe, K. Trust, Reciprocity, and Social History. Games Econ. Behav. 1995, 10, 122–142. [Google Scholar] [CrossRef] [Green Version]
- Camerer, C.F. Behavioral Game Theory: Experiments in Strategic Interaction; Princeton University Press: Princeton, NJ, USA, 2003. [Google Scholar]
- Gächter, S.; Herrmann, B.; Thöni, C. Trust, voluntary cooperation, and socio-economic background: Survey and experimental evidence. J. Econ. Behav. Organ. 2004, 55, 505–531. [Google Scholar] [CrossRef]
- Rydgren, J.; Sofi, D.; Hällsten, M. Interethnic friendship, trust, and tolerance: Findings from two north Iraqi cities. Am. J. Sociol. 2013, 118, 1650–1694. [Google Scholar] [CrossRef]
- Pappas, J.M.; Flaherty, K.E. The effect of trust on customer contact personnel strategic behavior and sales performance in a service environment. J. Bus. Res. 2008, 61, 894–902. [Google Scholar] [CrossRef]
- Carpenter, J.P.; Daniere, A.G.; Takahashi, L.M. Social capital and trust in south-east Asian cities. Urban Stud. 2004, 41, 853–874. [Google Scholar] [CrossRef]
- Knack, S.; Keefer, P. Does Social Capital Have an Economic Payoff ? A Cross-Country Investigation. Q. J. Econ. 1997, 112, 1251–1288. [Google Scholar] [CrossRef]
- Ben-Ner, A.; Putterman, L. Trust, communication and contracts: An experiment. J. Econ. Behav. Organ. 2009, 70, 106–121. [Google Scholar] [CrossRef] [Green Version]
- Davis, D.D.; Holt, C.A. Experimental Economics; Princeton University Press: Princeton, NJ, USA, 1992. [Google Scholar]
- Valenzuela, S.; Park, N.; Kee, K.F. Is there social capital in a social network site?: Facebook use and college students’ life satisfaction, trust, and participation. J. Comput.-Mediat. Commun. 2009, 14, 875–901. [Google Scholar] [CrossRef] [Green Version]
- Warren, A.M.; Sulaiman, A.; Jaafar, N.I. Social media effects on fostering online civic engagement and building citizen trust and trust in institutions. Gov. Inf. Q. 2014, 31, 291–301. [Google Scholar] [CrossRef]
- Preston, J. Facebook Officials Keep Quiet on Its Role in Revolts. New York Times, 14 February 2011. [Google Scholar]
- Korkmaz, G.; Capra, M.; Kraig, A.; Lakkaraju, K.; Kuhlman, C.J.; Vega-Redondo, F. Coordination and common knowledge on communication networks. In Proceedings of the 17th International Conference on Autonomous Agents and Multiagent Systems, Stockholm, Sweden, 10–15 July 2018; pp. 1062–1070. [Google Scholar]
- Fergusson, L.; Molina, C. Facebook Causes Protests. CEDE 018002, Universidad de los Andes—CEDE. 2019. Available online: https://ideas.repec.org/p/col/000089/018002.html (accessed on 1 June 2020).
- Bolton, N. How to Sell and Trade on Facebook. 2013. Available online: https://smallbusiness.chron.com/sell-trade-facebook-76955.html (accessed on 11 October 2020).
- Olenski, S. How Social Media Is Transforming Marketing? 2018. Available online: https://www.forbes.com/sites/steveolenski/2018/05/29/how-social-media-is-transforming-the-trading-world/{#}3b24945e12b4 (accessed on 11 October 2020).
- Aslam, S. Facebook by the Numbers: Stats, Demographics & Fun Facts. Technical Report, Omnicore Agency. 2020. Available online: https://www.omnicoreagency.com/facebook-statistics/ (accessed on 1 June 2020).
- Baer, D. List of the 25 Largest Facebook Groups (2020 Update). Technical Report, OneUp Blog Social Media Marketing Resources. 2020. Available online: https://blog.oneupapp.io/largest-fb-groups/ (accessed on 1 June 2020).
- Anderson, A.A.; Brossard, D.E.; Scheufele, D.A.; Xenos, M.A. Online talk: How exposure to disagreement in online comments affects beliefs in the promise of contro-versial science. In Citizen Voices: Performing Public Participation in Science and Environment Communication; Intellect: Bristol, UK, 2012; pp. 119–136. [Google Scholar]
- Stroud, N.J.; Muddiman, A.; Scacco, J.M. Like, recommend, or respect? Altering political behavior in news comment sections. New Media Soc. 2017, 19, 1727–1743. [Google Scholar] [CrossRef]
- Brosig, J.; Weimann, J.; Ockenfels, A. The Effect of Communication Media on Cooperation. Ger. Econ. Rev. 2003, 4, 217–241. [Google Scholar] [CrossRef] [Green Version]
- Bochet, O.; Page, T.; Putterman, L. Communication and punishment in voluntary contribution experiments. J. Econ. Behav. Organ. 2006, 60, 11–26. [Google Scholar] [CrossRef] [Green Version]
- Charness, G.; Dufwenberg, M. Promises and Partnership. Econometrica 2006, 74, 1579–1601. [Google Scholar] [CrossRef] [Green Version]
- Chen, Y.; Li, S.X. Group Identity and Social Preferences. Am. Econ. Rev. 2009, 99, 431–457. [Google Scholar] [CrossRef] [Green Version]
- Abatayo, A.L.; Lynham, J.; Sherstyuk, K. Facebook-to-Facebook: Online communication and economic cooperation. Appl. Econ. Lett. 2018, 25, 762–767. [Google Scholar] [CrossRef]
- Bicchieri, C.; Lev-On, A. Studying the ethical implications of e-trust in the lab. Ethics Inf. Technol. 2011, 13, 5–15. [Google Scholar] [CrossRef]
- Ederer, F.; Stremitzer, A. Promises and expectations. Games Econ. Behav. 2017, 106, 161–178. [Google Scholar] [CrossRef] [Green Version]
- Fiedler, M.; Haruvy, E. The lab versus the virtual lab and virtual field: An experimental investigation of trust games with communication. J. Econ. Behav. Organ. 2009, 72, 716–724. [Google Scholar] [CrossRef] [Green Version]
- Greiner, B.; Caravella, M.; Roth, A.E. Is avatar-to-avatar communication as effective as face-to-face communication? An Ultimatum Game experiment in First and Second Life. J. Econ. Behav. Organ. 2014, 108, 374–382. [Google Scholar] [CrossRef]
- Babin, J.J. Linguistic signaling, emojis, and skin tone in trust games. PLoS ONE 2020, 15, e0233277. [Google Scholar] [CrossRef]
- Nyarko, Y.; Schotter, A. An experimental study of belief learning using elicited beliefs. Econometrica 2002, 70, 971–1005. [Google Scholar] [CrossRef]
- Guerra, G.; Zizzo, D.J. Trust responsiveness and beliefs. J. Econ. Behav. Organ. 2004, 55, 25–30. [Google Scholar] [CrossRef] [Green Version]
- Ashraf, N.; Bohnet, I.; Piankov, N. Decomposing trust and trustworthiness. Exp. Econ. 2006, 9, 193–208. [Google Scholar] [CrossRef]
- Sapienza, P.; Toldra-Simats, A.; Zingales, L. Understanding trust. Econ. J. 2013, 123, 1313–1332. [Google Scholar] [CrossRef]
- Costa-Gomes, M.A.; Huck, S.; Weizsäcker, G. Beliefs and actions in the trust game: Creating instrumental variables to estimate the causal effect. Games Econ. Behav. 2014, 88, 298–309. [Google Scholar] [CrossRef] [Green Version]
- Vanberg, C. Why do people keep their promises? An experimental test of two explanations. Econometrica 2008, 76, 1467–1480. [Google Scholar]
- Charness, G.; Dufwenberg, M. Bare promises: An experiment. Econ. Lett. 2010, 107, 281–283. [Google Scholar] [CrossRef]
- Di Bartolomeo, G.; Dufwenberg, M.; Papa, S.; Passarelli, F. Promises, expectations & causation. Games Econ. Behav. 2019, 113, 137–146. [Google Scholar]
- Ellingsen, T.; Johannesson, M.; Tjøtta, S.; Torsvik, G. Testing guilt aversion. Games Econ. Behav. 2010, 68, 95–107. [Google Scholar] [CrossRef]
- Blanco, M.; Engelmann, D.; Koch, A.K.; Normann, H.T. Preferences and beliefs in a sequential social dilemma: A within-subjects analysis. Games Econ. Behav. 2014, 87, 122–135. [Google Scholar] [CrossRef] [Green Version]
- Chen, R.; Chen, Y. The Potential of Social Identity for Equilibrium Selection. Am. Econ. Rev. 2011, 101, 2562–2589. [Google Scholar] [CrossRef] [Green Version]
- Cooper, D.J.; Kühn, K.U. Communication, Renegotiation, and the Scope for Collusion. Am. Econ. J. Microecon. 2014, 6, 247–278. [Google Scholar] [CrossRef] [Green Version]
- Wojcik, S.P.; Hovasapian, A.; Graham, J.; Motyl, M.; Ditto, P.H. Conservatives report, but liberals display, greater happiness. Science 2015, 347, 1243–1246. [Google Scholar] [CrossRef]
- Rheault, L.; Beelen, K.; Cochrane, C.; Hirst, G. Measuring emotion in parliamentary debates with automated textual analysis. PLoS ONE 2016, 11, e0168843. [Google Scholar] [CrossRef]
- Crossley, S.A.; Kyle, K.; McNamara, D.S. Sentiment Analysis and Social Cognition Engine (SEANCE): An automatic tool for sentiment, social cognition, and social-order analysis. Behav. Res. Methods 2017, 49, 803–821. [Google Scholar] [CrossRef] [Green Version]
- Greiner, B. Subject pool recruitment procedures: Organizing experiments with {ORSEE}. J. Econ. Sci. Assoc. 2015, 1, 114–125. [Google Scholar] [CrossRef]
- Buchan, N.R.; Croson, R.T.A.; Solnick, S. Trust and gender: An examination of behavior and beliefs in the Investment Game. J. Econ. Behav. Organ. 2008, 68, 466–476. [Google Scholar] [CrossRef]
- Bandura, A.; Underwood, B.; Fromson, M.E. Disinhibition of aggression through diffusion of responsibility and dehumanization of victims. J. Res. Personal. 1975, 9, 253–269. [Google Scholar] [CrossRef]
- Dana, J.; Weber, R.A.; Kuang, J.X. Exploiting moral wiggle room: Experiments demonstrating an illusory preference for fairness. Econ. Theory 2007, 33, 67–80. [Google Scholar] [CrossRef]
- Fischbacher, U. z-{T}ree: Zurich toolbox for ready-made economic experiments. Exp. Econ. 2007, 10, 171–178. [Google Scholar] [CrossRef] [Green Version]
- Efron, B.; Tibshirani, R.J. An Introduction to the Bootstrap; CRC Press: Boca Raton, FL, USA, 1994. [Google Scholar]
- Fréchette, G.R. Session-effects in the laboratory. Exp. Econ. 2012, 15, 485–498. [Google Scholar] [CrossRef] [Green Version]
- Charness, G.; Rabin, M. Understanding social preferences with simple tests. Q. J. Econ. 2002, 117, 817–869. [Google Scholar] [CrossRef] [Green Version]
- Fehr, E.; Schmidt, K.M. A theory of fairness, competition, and cooperation. Q. J. Econ. 1999, 114, 817–868. [Google Scholar] [CrossRef]
- Cohen, J. A Coefficient of Agreement for Nominal Scales. Educ. Psychol. Meas. 1960, 20, 37–46. [Google Scholar] [CrossRef]
| 1. | |
| 2. | Trust engenders voluntary cooperation, which, in turn, increases economic production in a society where many contracts are incomplete and efficient behavior cannot be enforced formally [4]. Trust and trustworthiness have been found to lower the incidence of violence and increase tolerance toward outgroups [5], increase workplace productivity [6], and improve environmental management [7]. They are are considered an important component of social capital, a determinant of economic growth [8]. |
| 3. | |
| 4. | Facebook Marketplace can be accessed via https://www.facebook.com/marketplace/. |
| 5. | |
| 6. | Ederer and Stremitzer [28] finds that game irrelevant “empty talk” communication does better than sending no message. |
| 7. | Greiner et al. [30] also find that communication had little effect on Second Life residents in an ultimatum game experiment, suggesting environmental or selection effects among Second Life residents. |
| 8. | Charness and Dufwenberg [24] report that promises in partnerships may enhance trustworthy behavior because players believe that their promises change others’ expectations of their action; a guilt-averse player would then tend to live up to these expectations and choose an efficient but costly action. Vanberg [37] questions these conclusions and suggests that people have a preference for keeping their promises per se. See also Charness and Dufwenberg [38], Ederer and Stremitzer [28] and Di Bartolomeo et al. [39]. |
| 9. | Indeed, communication logs indicate that not all participants understood well the ways to achieve joint-payoff maximizing outcomes even after participating is part 1 of the game. See sample logs included in the Supplementary Materials. |
| 10. | The instructions read: “While Person A(B) is making their decision, Person B(A) will be asked how much they expect A(B) to send (send back) to them. Person B(A) will receive a $1 bonus if their expectation exactly matches A’s (B’s) decision and the bonus will decrease as B’s (A’s) expectation gets further away from A’s (B’s) decision. The lowest value for the bonus is $0.” |
| 11. | Individuals were randomly invited and assigned into sessions. Within a session, individuals were further randomly assigned into communication groups. Participants in a session were very unlikely to know each other from before the experiment. |
| 12. | To see this, remember that both the sender and the receiver start with an equal initial endowment of $10. Letting x, be the amount sent, and y, be the amount returned, the final wealth of the sender is given by , and that of the receiver by ; hence if and only if . Likewise, if , and if . |
| 13. | Figures S1–S4 in the Supplementary Materials show the frequencies of amounts sent by senders and amounts returned by receivers, by treatment. |
| 14. | Under the difference-in-difference approach, one should compare the changes, rather the absolute amounts, of the amounts sent across treatments. Yet we believe comparing the absolute levels after communication is more informative in our setting because the amount sent was bounded by $10. The differences in changes in the amount sent and the probability of sending all after communication among three communication treatments were not significantly different at 5% level either. |
| 15. | Expected share returned has an insignificant effect on the amount sent, regression (2); it has a significant and positive effect on the probability of sending all (regression (5)), but results in overall lower fit of the regression compared to the regression using expectation of fair return (regression (6)). |
| 16. | As communication appears to have an overwhelming effect on post-communication decisions, we also consider if frequent Facebook users with a large network of online friends behaved any differently from others in Part 1 of experiment (before communication). Additional regressions estimations of Sender (and Receiver) behavior in Part 1, as given in the Supplementary Materials, Tables S2 and S3, confirm that the frequent FB use had no significant association with game behavior, and senders under FB treatment sent less. |
| 17. | Here, we employed linear regression as well as Tobit to estimate expected returns, as very few senders’ expectations were at the boundaries of 0 or 300 percent. Further, for the expectation of fair return, we employed Probit rather than Logit maximum likelihood estimation because of better convergence of the former method. |
| 18. | Note that these regressions are likely to under-estimate the effect of communication since in four cases when senders sent zero (three of which occurred under NC treatment, one in Part 1 and two in Part 3; one in Part 1 under FB; see Figure 1 and Figure 2), the expected returns are treated as missing. This may explain why the change in the expectation of fair return from Part 1 to Part 3 is estimated to be significant at 10% level only between NC and FB treatment, although the frequency of expected fair return remained unchanged under NC (9% in Part 1 and 10% in Part 3), whereas it increased from 45.5% in Part 1 to 66.7% in Part 3 under FB. |
| 19. | Additional regression estimations of receiver behavior presented in Table S3 in Supplementary Materials confirm a significant effect of receiver expectations on actions in the pre-communication trust game. |
| 20. | Agreements came close to promises as player roles were not always disclosed. |
| 21. | We define a message as a player’s uninterrupted statement. An alternative would to define a message as a piece of verbal communication by the same participant until followed by another participant. However, the same participant sometimes typed several verbal entries one after another under FB or Chat communications. Under FTF, verbal entries were audio-taped and then transcribed, and were not tied to specific participants in a group. We therefore used "Enter" command in online communications, and a pause in FTF communications, as a way to separate messages. |
| 22. | Maximum likelihood estimations of the probability of sending all and the probability of fair return could not be completed even with a limited set of content variables, as convergence was not achieved in either case. Likewise, bootstrap replications could not be successfully completed. The effect the indicator variable for sender promise to send more, and for group agreements on ‘10/20’ strategy (in addition of group discussions of this strategy) could not be estimated under most or all regression specifications. |
| 23. | Message type categories, such as the share of questions and approvals, had an insignificant effect on behavior and were dropped from the set of explanatory variables. |
Figure 1.
No Communication (NC) and Face-to-Face communication (FTF): amount sent tripled (grey) and amount returned (black), by match.
Figure 1.
No Communication (NC) and Face-to-Face communication (FTF): amount sent tripled (grey) and amount returned (black), by match.

Figure 2.
Facebook-to-Facebook (FB) and Chat communication: amount sent tripled (grey) and amount returned (black), by match.
Figure 2.
Facebook-to-Facebook (FB) and Chat communication: amount sent tripled (grey) and amount returned (black), by match.


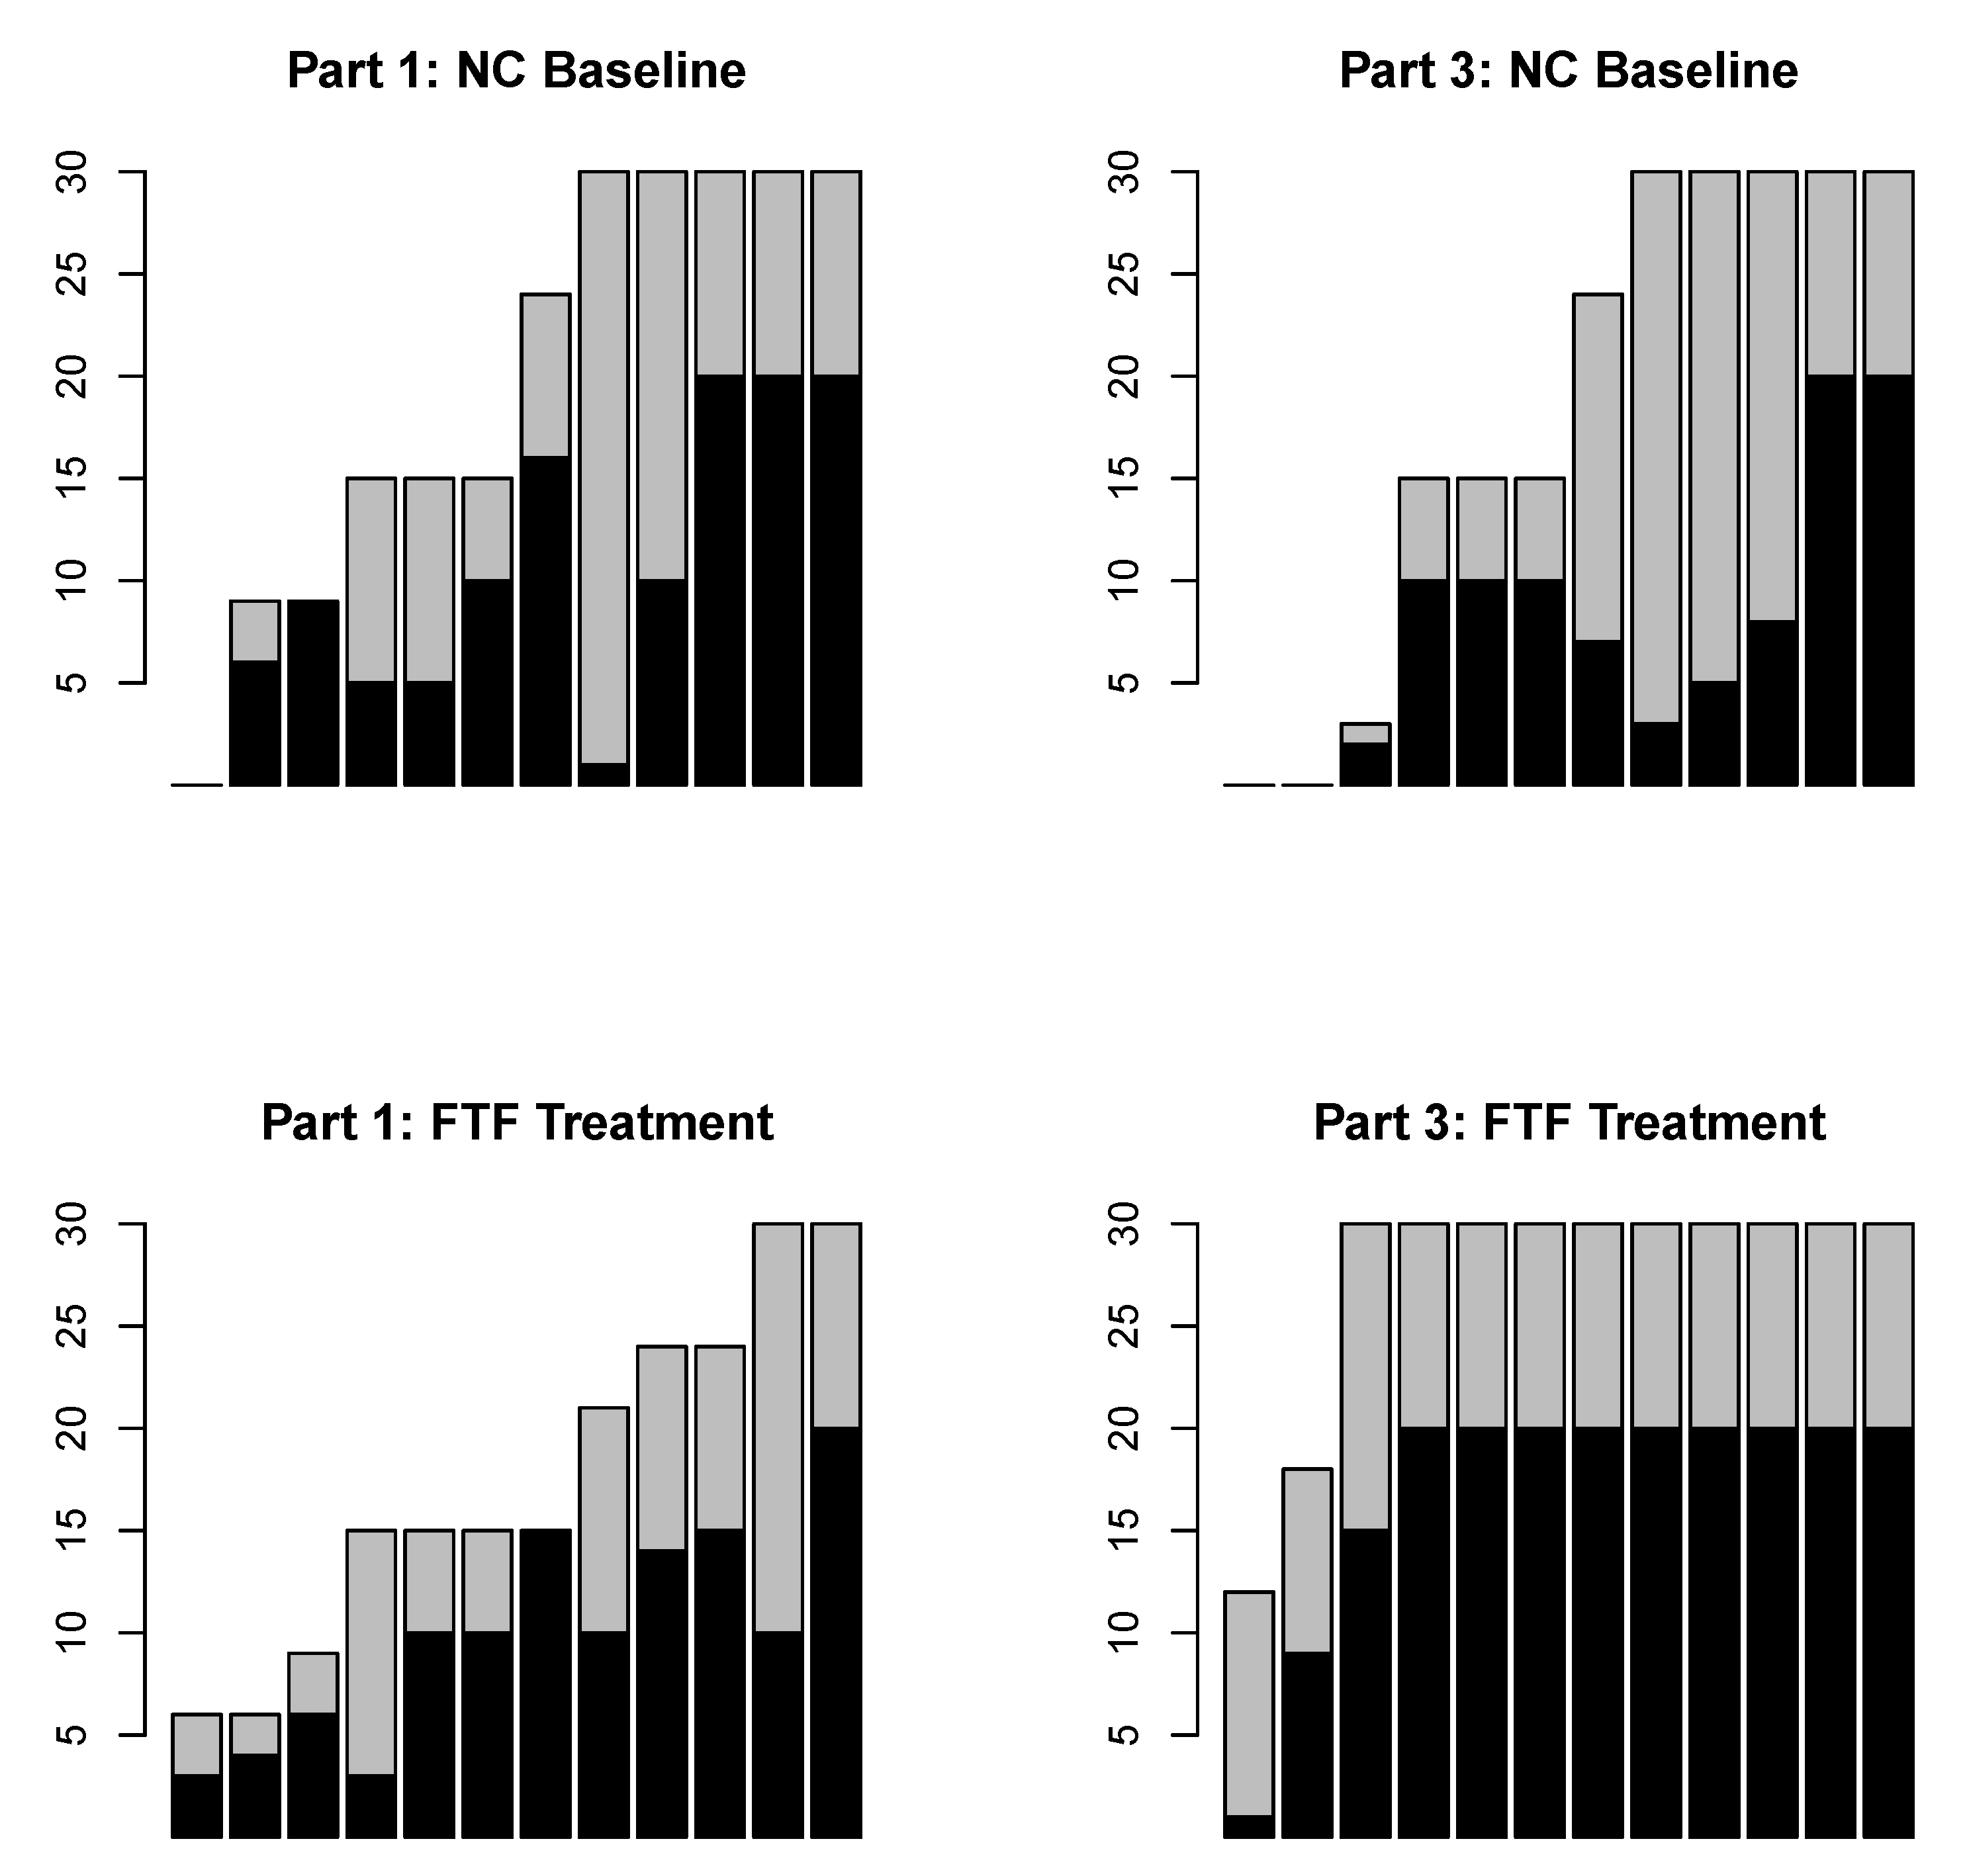
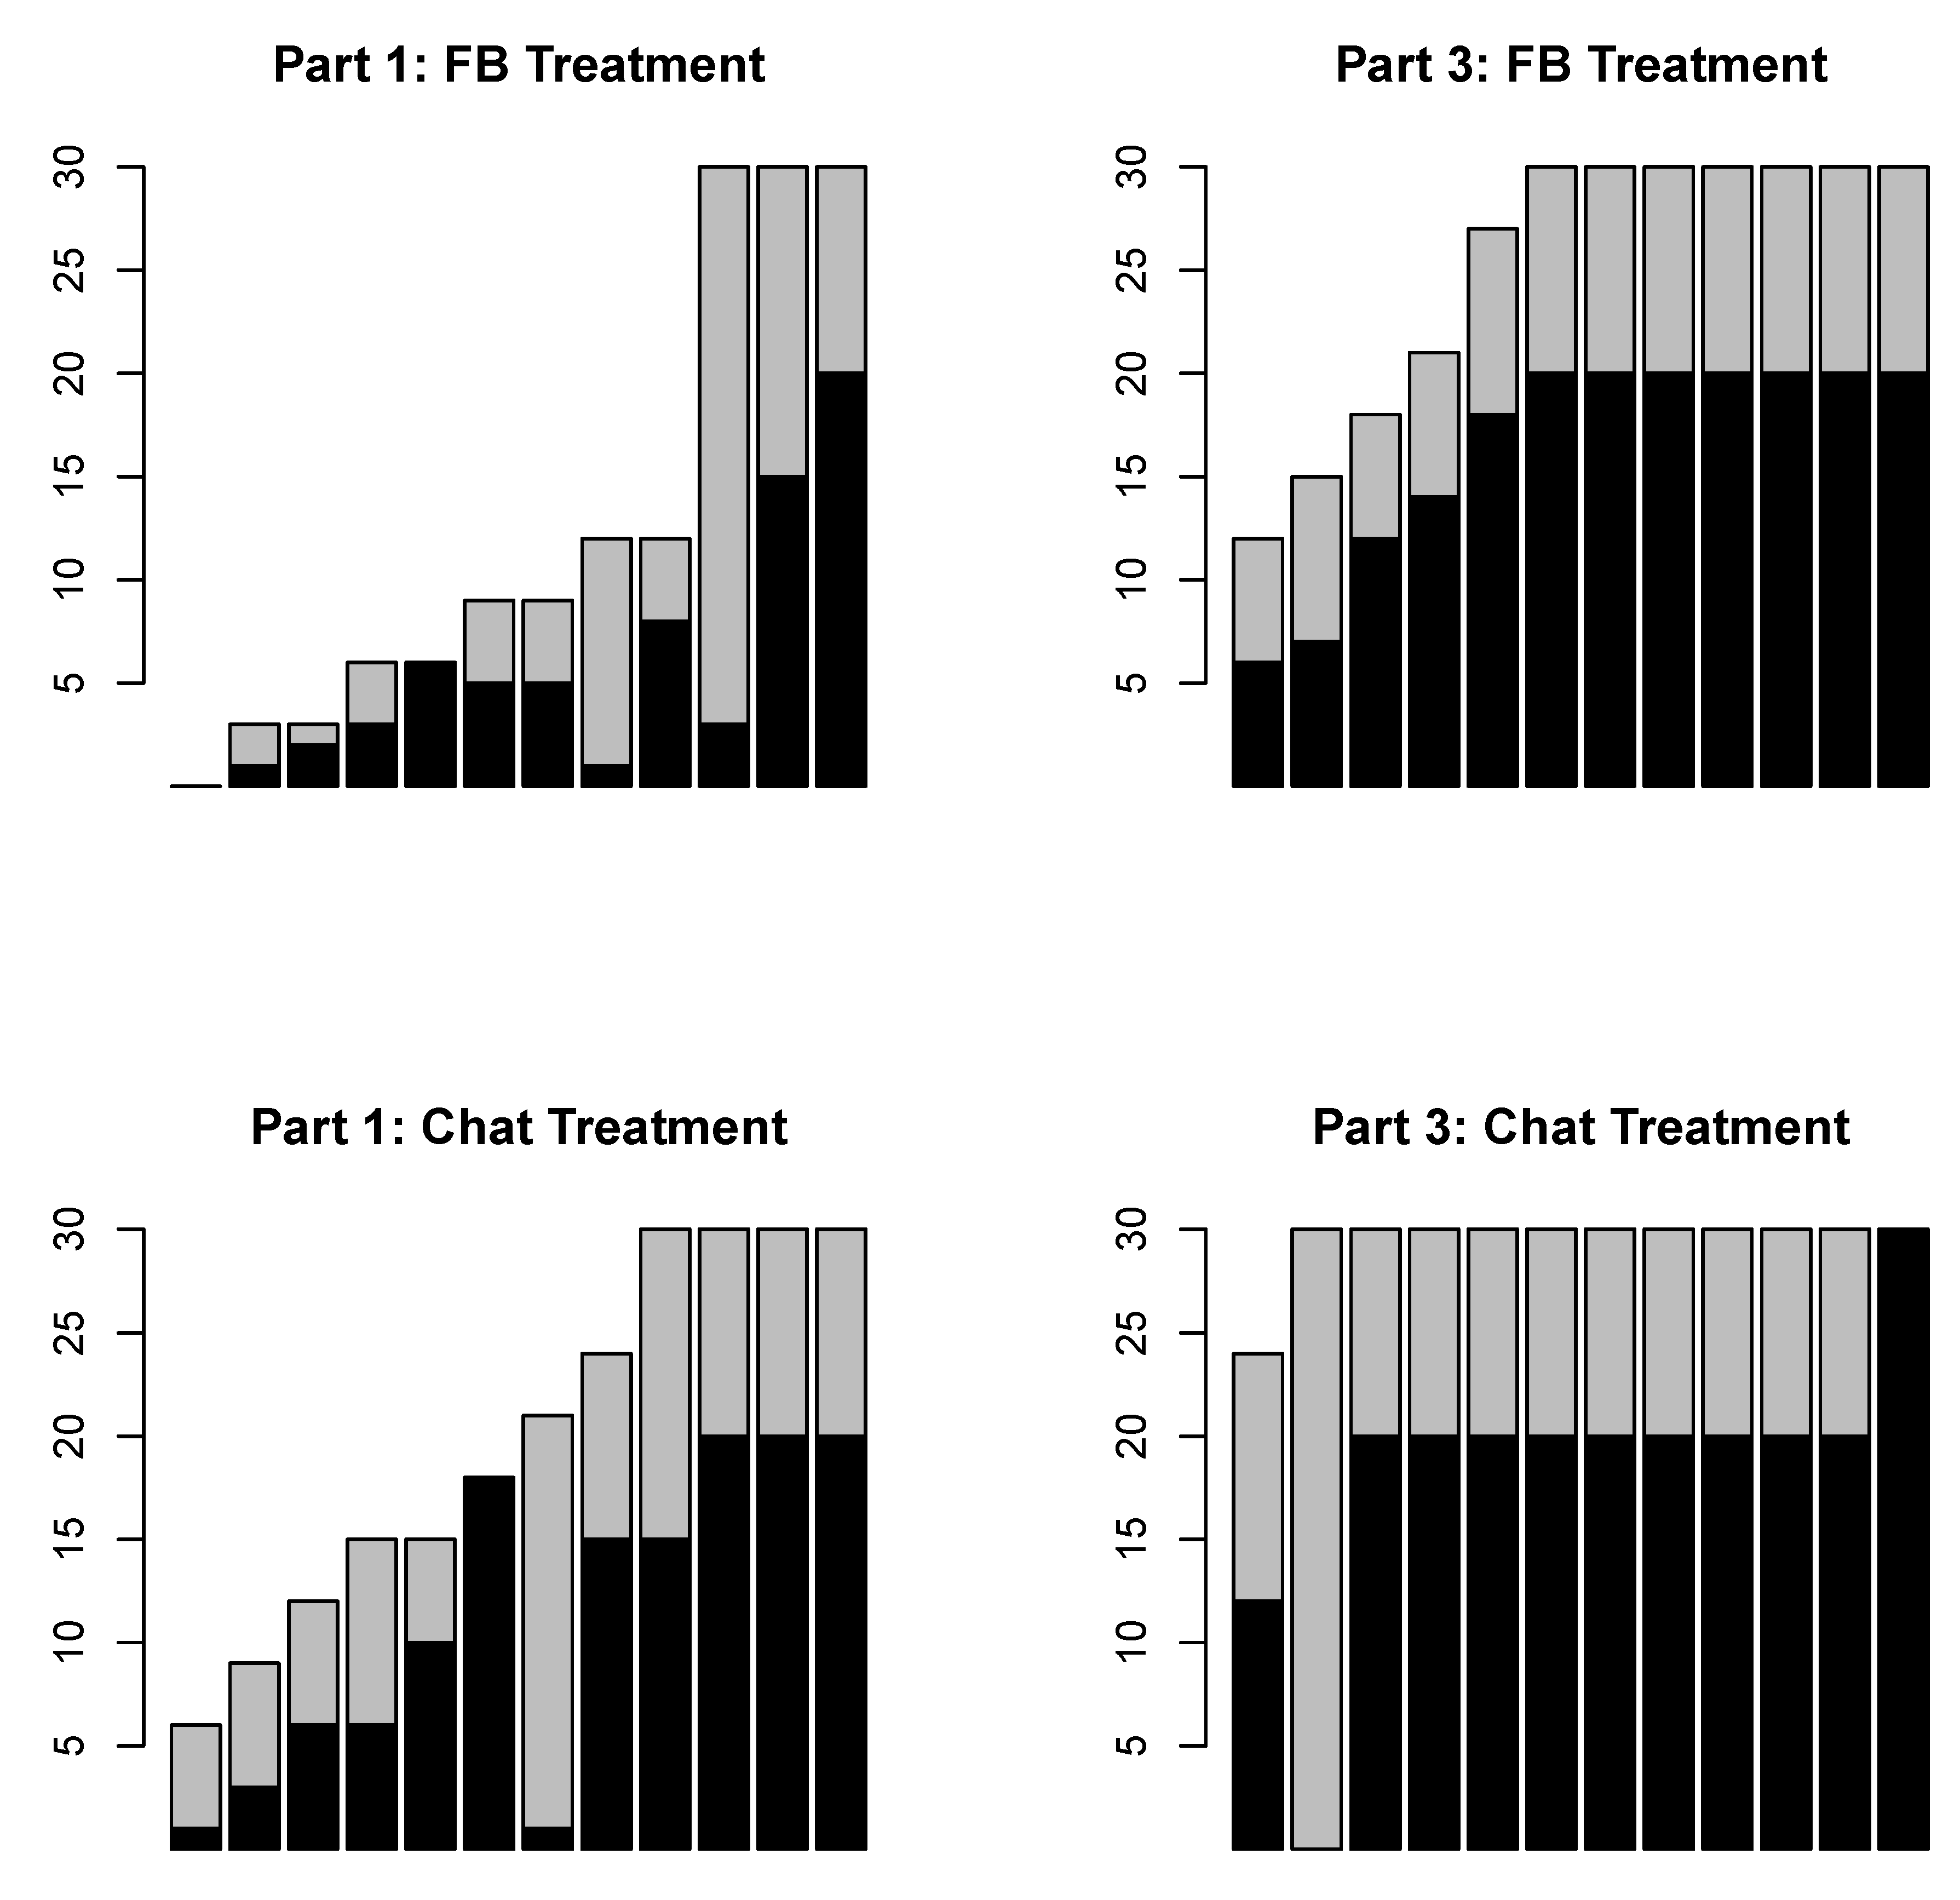
Table 1.
Treatment Summary.
| Treatment | Number of | Number of | Number of | Number of |
|---|---|---|---|---|
| Sessions | Participants | Sender-Receiver Pairs | Communication Groups | |
| NC | 3 | 24 | 12 | 6 |
| FTF | 3 | 24 | 12 | 6 |
| FB | 3 | 24 | 12 | 6 |
| Chat | 3 | 24 | 12 | 6 |
Notes: The treatments are: “NC”—No Communication, “FTF”—Face-to-Face Communication, “FB”—Facebook Communication; “Chat”—Chat Communication.
Table 2.
Amounts sent and returned before and after communication.
| Treatment | Amount Sent, $ | Frequency of | Percentage | Frequency of | |||||
|---|---|---|---|---|---|---|---|---|---|
| Sending All, % | Returned, % | Fair Return, % | |||||||
| Before | After | Before | After | Before | After | Before | After | ||
| NC | actual | 6.58 | 6.17 | 41.67 | 41.67 | 54.84 | 48.25 | 54.55 | 60.00 |
| expected | 6.00 | 6.42 | 25.00 | 33.33 | 47.37 | 42.00 | 9.09 | 10.00 | |
| FTF | actual | 5.83 | 9.17 | 16.67 | 83.33 | 58.76 | 59.03 | 41.67 | 75.00 |
| expected | 6.25 | 9.50 | 33.33 | 91.67 | 41.36 | 65.28 | 8.33 | 75.00 | |
| FB | actual | 4.17 | 8.42 | 25.00 | 58.33 | 51.16 | 63.61 | 27.27 | 83.33 |
| expected | 4.75 | 8.08 | 0.00 | 58.33 | 51.16 | 57.04 | 45.45 | 66.67 | |
| Chat | actual | 6.67 | 9.83 | 33.33 | 91.67 | 51.99 | 62.50 | 33.33 | 75.00 |
| expected | 6.00 | 9.92 | 16.67 | 91.67 | 50.61 | 66.67 | 33.33 | 83.33 | |
Notes: ‘Before’ refers to Part 1, and ‘After’ to Part 3 observations. For four observations with zero amount sent, the corresponding values of amount returned and expected return are treated as missing.
Table 3.
Sender decision: regression estimation.
| Amount Sent, $, | Probability Send All, | |||||
|---|---|---|---|---|---|---|
| Tobit Estimation | Logit Estimation | |||||
| (1) | (2) | (3) | (4) | (5) | (6) | |
| Expected Return | 1.42 | 0.92 ** | ||||
| (1.25) | (0.64) | |||||
| Expect Fair Return | 6.12 *** | 3.29 *** | ||||
| (1.17) | (0.89) | |||||
| FTF | −1.34 | −2.06 | −2.44 | −1.28 | −1.34 ** | −1.77 * |
| (2.33) | (1.85) | (1.64) | (0.80) | (0.74) | (0.96) | |
| FB | −3.06 | −3.74 ** | −5.76 *** | −0.83 | −1.09 | −2.71 ** |
| (2.59) | (1.78) | (1.68) | (0.83) | (0.74) | (1.21) | |
| Chat | 0.07 | −1.12 | −2.35 | −0.39 | −0.68 | −1.73 |
| (2.71) | (1.87) | (1.75) | (0.83) | (0.74) | (0.99) | |
| After | −0.69 ** | 0.65 | 0.39 | 0.00 | 0.35 * | 0.20 * |
| (0.76) | (0.51) | (0.32) | (0.00) | (0.24) | (0.24) | |
| FTF After | 8.46 ** | 5.31 | 3.25 ** | 3.25 *** | 2.33 ** | 1.64 *** |
| (13.21) | (10.67) | (9.62) | (0.98) | (1.00) | (0.60) | |
| FB After | 7.16 ** | 4.71 ** | 4.11 ** | 1.45 ** | 0.90 | 0.94 |
| (9.26) | (7.32) | (6.19) | (1.03) | (0.98) | (1.38) | |
| Chat After | 10.24 ** | 7.00 ** | 5.49 ** | 3.11 *** | 2.36 | 2.19 |
| (11.84) | (10.74) | (10.20) | (0.86) | (0.96) | (1.49) | |
| FB Daily Use, Many Friends | 1.45 | 0.67 | -0.40 | 0.42 | 0.21 | −0.38 |
| (1.48) | (1.64) | (1.64) | (0.65) | (0.65) | (0.89) | |
| Male | −1.15 | 0.06 | 0.60 | −0.02 | 0.20 | 0.41 |
| (2.02) | (1.42) | (1.05) | (0.68) | (0.59) | (0.70) | |
| Constant | 7.38 *** | 6.11 ** | 8.02 *** | −0.58 | −1.70 | −0.28 |
| (1.62) | (2.62) | (1.44) | (0.60) | (1.25) | (0.95) | |
| Sigma | 4.98 *** | 4.34 *** | 3.81 *** | |||
| (0.72) | (0.42) | (0.37) | ||||
| R-squared (Adjusted/Pseudo) | 0.097 | 0.099 | 0.163 | 0.207 | 0.223 | 0.381 |
| Number of Observations | 96 | 92 | 92 | 96 | 92 | 92 |
Notes: Fair return denotes returning twice the amount sent. “After” refers to Part 3 decisions, which occurred after communication in all but NC treatments.“FB use, many friends” indicates individuals with 50 or more Facebook friends who use Facebook daily. Bootstrap replications based on 12 clusters in session. In four instances where senders sent zero amounts, expectations of fair return are treated as missing, resulting in reduced numbers of observations in regressions (2)–(3) and (5)–(6). */**/*** indicate significance at the 10/5/1 percent level. Significance levels are from bootstrap percentile confidence intervals.
Table 4.
Sender expected return on amount sent: regression estimation.
| Sender Expected Return, | Probability Expect Fair, | |||||
|---|---|---|---|---|---|---|
| Linear Regression | Tobit Estimation | Probit Estimation | ||||
| (1) | (2) | (3) | (4) | (5) | (6) | |
| FTF | −0.17 | −0.18 | −0.19 | −0.19 | −0.02 | −0.00 |
| (0.16) | (0.16) | (0.17) | (0.17) | (2.90) | (2.98) | |
| FB | 0.09 | 0.08 | 0.09 | 0.08 | 1.20 ** | 1.10 ** |
| (0.25) | (0.24) | (0.26) | (0.25) | (2.50) | (2.37) | |
| Chat | 0.09 | 0.09 | 0.09 | 0.09 | 1.01 ** | 0.98 ** |
| (0.14) | (0.15) | (0.15) | (0.15) | (2.39) | (2.50) | |
| After | −0.16 | −0.16 | −0.17 | −0.17 | 0.07 | 0.11 |
| (0.13) | (0.14) | (0.14) | (0.14) | (0.07) | (0.09) | |
| FTF After | 0.87 *** | 0.81 *** | 0.91 *** | 0.86 *** | 2.20 ** | 0.46 |
| (0.14) | (0.28) | (0.16) | (0.30) | (3.03) | (3.90) | |
| FB After | 0.34 ** | 0.29 | 0.35 | 0.31 | 0.60 * | −0.75 |
| (0.18) | (0.25) | (0.20) | (0.27) | (0.35) | (3.05) | |
| Chat After | 0.64 *** | 0.56 | 0.65 *** | 0.59 | 1.50 ** | −0.24 |
| (0.20) | (0.34) | (0.21) | (0.36) | (0.87) | (4.15) | |
| Discussed 10/20 Strategy | 0.04 | 0.02 | 1.62 | |||
| (0.31) | (0.34) | (5.22) | ||||
| Agreed on 10/20 Strategy | 0.05 | 0.05 | 0.88 | |||
| (0.15) | (0.15) | (4.71) | ||||
| FB Daily Use, Many Friends | 0.13 | 0.13 | 0.12 | 0.13 | 0.94 ** | 1.23 ** |
| (0.10) | (0.10) | (0.10) | (0.10) | (1.23) | (2.39) | |
| Male | 0.01 | 0.02 | 0.01 | 0.02 | −0.14 | 0.25 |
| (0.09) | (0.09) | (0.09) | (0.09) | (0.93) | (0.69) | |
| Constant | 1.34 *** | 1.34 *** | 1.34 *** | 1.33 *** | −2.02 | −2.44 |
| (0.08) | (0.08) | (0.08) | (0.08) | (2.27) | (2.93) | |
| Sigma | 0.44 *** | 0.44 *** | ||||
| (0.05) | (0.05) | |||||
| R-squared (Adjusted/Pseudo) | 0.2184 | 0.2011 | 0.2130 | 0.2141 | 0.3407 | 0.4523 |
| Number of Observations | 92 | 92 | 92 | 92 | 92 | 92 |
Notes: Expected return is normalized by the amount sent. Fair return denotes returning twice the amount sent. In four instances where senders sent zero amounts, expected returns are treated as missing. Bootstrap replications based on 12 clusters in Session. */**/*** indicate significance at the 10/5/1 percent level. Significance levels are obtained from bootstrap percentile confidence intervals.
Table 5.
Receiver decision: regression estimation.
| Amount Returned, $ | Share Returned | Probability of Fair Return | ||||
|---|---|---|---|---|---|---|
| Linear Regression | Tobit Estimation | Logit Estimation | ||||
| (1) | (2) | (3) | (4) | (5) | (6) | |
| Receiver Expectation | 0.71 *** | 0.04 *** | 0.38 ** | |||
| (0.15) | (0.01) | (0.24) | ||||
| Amount Sent | 1.28 *** | 1.47 *** | −0.02 | −0.00 | −0.25 | −0.21 |
| (0.37) | (0.42) | (0.02) | (0.02) | (0.19) | (0.23) | |
| Sent All $10 | 1.55 | 0.47 | 0.07 | 0.00 | 2.62 ** | 2.77 * |
| (1.60) | (2.09) | (0.09) | (0.12) | (1.12) | (1.46) | |
| FTF | 1.58 | 1.30 | 0.06 | 0.04 | −0.18 | −0.34 |
| (2.48) | (2.50) | (0.16) | (0.15) | (5.79) | (5.77) | |
| FB | −0.93 | 0.24 | −0.06 | 0.01 | −1.45 | −1.06 |
| (2.73) | (2.95) | (0.17) | (0.15) | (0.93) | (1.23) | |
| Chat | 1.14 | 1.12 | −0.02 | −0.02 | −1.02 ** | −1.24 |
| (2.35) | (2.37) | (0.16) | (0.14) | (0.70) | (1.03) | |
| After | −1.88 ** | −1.60 | −0.07 * | −0.05 | 0.21 ** | 0.39 |
| (1.06) | (1.48) | (0.04) | (0.05) | (4.52) | (5.07) | |
| FTF After | 3.67 ** | 1.15 | 0.07 | −0.08 | 0.42 | −1.07 |
| (1.49) | (1.95) | (0.08) | (0.08) | (7.23) | (7.17) | |
| FB After | 6.53 ** | 3.52 | 0.22 | 0.05 | 2.93 | 2.07 |
| (3.08) | (2.66) | (0.16) | (0.11) | (4.67) | (5.13) | |
| Chat After | 4.18 *** | 1.13 | 0.18 ** | −0.00 | 1.05 | −0.54 |
| (1.29) | (1.97) | (0.07) | (0.08) | (4.77) | (5.11) | |
| FB Daily Use, Many Friends | 1.32 | 1.02 | 0.06 | 0.04 | 0.01 | −0.09 |
| (1.46) | (1.34) | (0.07) | (0.06) | (0.88) | (0.97) | |
| Male | −0.88 | −0.77 | −0.03 | −0.02 | −0.83 | −0.97 |
| (1.88) | (1.81) | (0.08) | (0.08) | (0.89) | (1.06) | |
| Constant | 0.49 | −4.54 | 0.60 *** | 0.31 | 1.25 | −1.23 |
| (2.68) | (3.66) | (0.19) | (0.21) | (1.55) | (2.96) | |
| Sigma | 0.22 *** | 0.20 *** | ||||
| (0.02) | (0.02) | |||||
| R-squared (Adjusted/Pseudo) | 0.557 | 0.608 | 0.948 | 3.648 | 0.200 | 0.288 |
| Number of Observations | 92 | 92 | 92 | 92 | 92 | 92 |
Notes: Share returned is out of tripled amount sent. Fair return denotes returning twice the amount sent. Bootstrap replications based on 12 clusters in session. */**/*** indicate significance at the 10/5/1 percent level. Significance levels are obtained from bootstrap percentile confidence intervals.
Table 6.
Receiver expectation of amount sent: regression estimation.
| Expectation of Amount Sent, $ | Probability Expect Send All, | |||||
|---|---|---|---|---|---|---|
| Linear Regression | Tobit Estimation | Probit Estimation | ||||
| (1) | (2) | (3) | (4) | (5) | (6) | |
| FTF | 0.30 | 0.23 | 0.48 | 0.17 | 0.20 | 0.09 |
| (1.12) | (1.09) | (1.54) | (1.59) | (0.27) | (0.30) | |
| FB | −1.24 | −1.27 | −1.92 * | −1.91 ** | −4.72 *** | −5.19 *** |
| (0.87) | (0.84) | (1.06) | (0.81) | (0.19) | (0.32) | |
| Chat | 0.00 | −0.05 | −0.27 | −0.39 | −0.35 | −0.46 |
| (1.07) | (1.13) | (1.17) | (1.22) | (0.30) | (0.34) | |
| After | 0.42 | 0.42 | 0.50 | 0.49 | 0.24 * | 0.25 * |
| (0.82) | (0.83) | (1.11) | (1.08) | (0.24) | (0.25) | |
| FTF After | 2.83 ** | 0.57 | 6.72 ** | 1.36 | 1.57 *** | −0.07 |
| (1.15) | (1.60) | (8.19) | (5.97) | (0.35) | (0.45) | |
| FB After | 2.92 | 1.08 | 4.67 | −0.15 | 5.34 *** | 0.07 |
| (2.11) | (1.80) | (6.83) | (1.89) | (0.74) | (0.60) | |
| Chat After | 3.50 ** | 1.36 | 8.54 ** | 4.74 | 2.14 *** | 0.97 ** |
| (1.36) | (1.25) | (9.57) | (6.01) | (0.52) | (0.40) | |
| Discussed 10/20 Strategy | 3.30 ** | 8.56 ** | 11.13 *** | |||
| (1.15) | (7.67) | (0.85) | ||||
| Agreed on 10/20 Strategy | −0.74 | −4.58 *** | ||||
| (0.75) | (0.66) | |||||
| FB Daily Use, Many Friends | 0.20 | −0.02 | 0.24 | −0.52 | −0.12 | −0.49 |
| (0.59) | (0.54) | (1.27) | (1.06) | (0.40) | (0.48) | |
| Male | −0.13 | −0.18 | −0.53 | −0.63 | −0.13 | −0.15 |
| (0.50) | (0.49) | (0.98) | (0.95) | (0.36) | (0.45) | |
| Constant | 5.91 *** | 6.12 *** | 6.60 *** | 7.24 *** | −0.50 | −0.19 |
| (0.84) | (0.83) | (1.57) | (1.44) | (0.44) | (0.52) | |
| Sigma | 3.69 *** | 3.38 *** | ||||
| (0.32) | (0.32) | |||||
| R-squared (Adjusted/Pseudo) | 0.2877 | 0.3327 | 0.1315 | 0.1831 | 0.3561 | 0.5094 |
| Number of observations | 96 | 96 | 96 | 96 | 96 | 96 |
Notes: Bootstrap replications based on 12 clusters in session. */**/*** indicate significance at the 10/5/1 percent level. Significance levels are obtained from bootstrap percentile confidence intervals.
Table 7.
Summary of group communications.
| Treatment | Number of Groups | Disclosed Role? | Disclosed Past Decisions? | Discussed 10/20? | Agreed on 10/20? | Sender Promise: Send More | Receiver Promise: Be Fair | Discussed Expectations? | Used Names? | Share Matches Implemented 10/20 |
|---|---|---|---|---|---|---|---|---|---|---|
| FTF | 6 | 1.00 | 0.83 | 0.83 | 0.67 | 0.17 | 0.17 | 0.67 | N/A | 0.75 |
| FB | 6 | 0.50 | 0.33 | 0.67 | 0.50 | 0.50 | 0.50 | 0.17 | 0.5 | 0.58 |
| Chat | 6 | 0.50 | 0.50 | 0.83 | 0.83 | 0.17 | 0.33 | 0.17 | 0.5 | 0.75 |
Notes: The table displays the share of communication groups where the characteristic in question was observed. ‘10/20’ denotes the strategy of Sender sending 10 and the Receiver returning 20. Unlike ‘10/20’ strategy agreements, promises of ‘Sending More’ and ‘Being Fair’ are one-way promises.
Table 8.
Communication content by treatment.
| FTF Treatment | FB Treatment | Chat Treatment | |||||
|---|---|---|---|---|---|---|---|
| Message Description | % Observed | % Observed | % Observed | ||||
| Message Content Categories | |||||||
| Empty Content | 0.14 | 0.7798 | 0.94 | 0.7186 | 8.03 | 0.6047 | |
| Social Discussion | 46.48 | 31.13 | 45.58 | ||||
| Norms and Goals Discussion | 7.17 | 9.91 | 6.83 | ||||
| Strategy: Division and Payoff | 15.45 | 29.25 | 27.11 | ||||
| -in particular, send 10 | 3.17 | 6.13 | 4.82 | ||||
| -in particular, send 10, return 20 | 5.66 | 15.09 | 15.26 | ||||
| Strategy: Implementation | 9.93 | 16.04 | 4.42 | ||||
| -in particular, messages on cheating | 0.97 | 3.30 | 0.20 | ||||
| -in particular, messages on trust | 7.31 | 7.08 | 1.00 | ||||
| Payoff/Game Discussion | 8.97 | 7.55 | 6.02 | ||||
| Personal Game-Related Discussion | 11.86 | 5.19 | 2.01 | ||||
| Message Type Categories | |||||||
| Empty Content | 0 | 0.94 | 7.83 | ||||
| Statement/Proposition | 71.57 | 0.7381 | 67.45 | 0.7625 | 66.27 | 0.5973 | |
| Question/Doubt/Confusion | 21.00 | 18.40 | 13.45 | ||||
| Approve/Agree/Ok | 7.43 | 13.21 | 12.45 | ||||
| Message Volume Data | Mean | Std. Dev. | Mean | Std. Dev. | Mean | Std. Dev. | |
| Number of Messages | 120.67 | (30.26) | 35.17 | (6.82) | 76.33 | (19.36) | |
| Share of game-relevant messages | 0.56 | (0.24) | 0.70 | (0.13) | 0.54 | (0.23) | |
| Number of Communication Groups | 6 | 6 | 6 | ||||
Notes: refers to the measure of inter-coder agreement.
Table 9.
Effect of communication volume and relevance.
| Amount Sent | Probability of | Share Returned | Probability of | |||
|---|---|---|---|---|---|---|
| Send All | Fair Return | |||||
| (1) | (2) | (3) | (4) | (5) | (6) | |
| Amount Sent | 0.06 *** | 0.09 *** | 10.38 *** | |||
| (0.01) | (0.02) | (0.95) | ||||
| Amount Sent Before | 0.25 | 0.03 | 0.17 | −0.02 ** | −0.02 ** | −0.04 |
| (0.23) | (0.14) | (0.17) | (0.01) | (0.01) | (0.09) | |
| Percentage Returned Before | 0.23 | 0.22 | 0.20 | |||
| (0.18) | (0.17) | (2.77) | ||||
| Social Messages, Number | 7.89 * | −0.28 ** | ||||
| (4.04) | (0.11) | |||||
| Game-relevant Messages, Number | 24.02 ** | −0.22 | ||||
| (10.46) | (0.17) | |||||
| Messages on Send 10, Number | 24.36 | −0.42 | ||||
| (17.50) | (0.55) | |||||
| Messages on Send10/Return20, Number | 49.33 *** | −0.23 | ||||
| (12.00) | (0.41) | |||||
| Messages on No Cheating, Number | −134.01 *** | 0.82 | ||||
| (43.78) | (0.76) | |||||
| Messages on Trust, Number | 9.61 | −0.16 | ||||
| (14.08) | (0.35) | |||||
| Discussed 10/20 Strategy | 7.35 *** | 11.70 *** | −0.04 | 11.81 *** | ||
| (0.92) | (0.75) | (0.06) | (1.73) | |||
| Agreed on 10/20 Strategy | −0.04 | |||||
| (0.04) | ||||||
| Receiver Promise to be Fair | 0.12 * | 4.93 *** | ||||
| (0.06) | (1.13) | |||||
| FB | −3.87 * | −0.83 | −4.59 *** | 0.10 * | 0.05 | 52.14 *** |
| (2.19) | (1.40) | (0.60) | (0.05) | (0.04) | (4.70) | |
| Chat | −1.69 | 3.58 *** | 5.33 *** | 0.06 | −0.01 | −0.05 |
| (2.03) | (0.96) | (0.21) | (0.07) | (0.06) | (0.61) | |
| Constant | −8.52 | 6.09 *** | −6.58 *** | 0.28 ** | −0.19 | −114.29 *** |
| (8.86) | (1.46) | (1.18) | (0.12) | (0.15) | (12.04) | |
| Sigma | 2.63 *** | 2.22 *** | ||||
| (0.58) | (0.47) | |||||
| (Pseudo) R-squared | 0.3499 | 0.4161 | 0.7885 | 0.5642 | 0.5363 | 0.6686 |
| Number of Observations | 36 | 36 | 36 | 35 | 35 | 35 |
Notes: Number of messages are normalized by the average communication volume per treatment. In the receiver regressions, we dropped one observation where the sender sent zero in Part 1. ‘Before’ refers to Part 1 decisions. FTF is the baseline/omitted treatment. Standard errors are adjusted for 18 clusters in communication groups. */**/*** indicate significance at the 10/5/1 percent level.
Table 10.
Effects of communication on amount sent and returned (LIWC).
| Dependent Variable: | Amount Sent ($) | Share Returned | |||
|---|---|---|---|---|---|
| (1) | (2) | (3) | (4) | (5) | |
| Amount Sent Before | 0.09 | ||||
| (0.09) | |||||
| Share Returned Before | 0.24 | ||||
| (0.15) | |||||
| Amount Sent to Receiver | 0.08 *** | 0.08 *** | |||
| (0.02) | (0.02) | ||||
| FB | −1.60 * | −1.58 * | −0.04 | 0.09 | 0.09 |
| (0.86) | (0.88) | (0.10) | (0.07) | (0.07) | |
| Chat | 0.47 | 0.08 | −0.00 | −0.04 | −0.10 |
| (1.40) | (1.27) | (0.19) | (0.13) | (0.12) | |
| Words per Sentence | −0.01 | 0.01 | 0.01 | 0.01 | 0.01 |
| (0.06) | (0.06) | (0.00) | (0.00) | (0.00) | |
| Numerals | 0.36 ** | 0.35 ** | 0.02 | −0.01 | −0.00 |
| (0.13) | (0.14) | (0.02) | (0.02) | (0.02) | |
| Money | 0.50 | 0.57 | 0.04 | −0.00 | 0.02 |
| (0.53) | (0.54) | (0.04) | (0.05) | (0.04) | |
| Positive Emotions | 0.20 | 0.17 | −0.01 | −0.03 | −0.02 |
| (0.27) | (0.27) | (0.02) | (0.02) | (0.02) | |
| Negative Emotions | −0.75 * | −0.69 | −0.01 | 0.05 | 0.06 |
| (0.44) | (0.41) | (0.06) | (0.04) | (0.04) | |
| Question Marks | −1.13 *** | −1.09 *** | −0.05 | 0.05 | 0.05 |
| (0.38) | (0.35) | (0.05) | (0.04) | (0.04) | |
| Exclamation Marks | 0.45 | 0.49 | −0.01 | −0.05 | −0.02 |
| (0.34) | (0.33) | (0.07) | (0.06) | (0.05) | |
| Constant | 9.69 *** | 8.84 *** | 0.56 *** | −0.25 | −0.46 * |
| (1.54) | (1.70) | (0.16) | (0.26) | (0.27) | |
| R-squared | 0.58 | 0.6 | 0.27 | 0.53 | 0.6 |
| Number of Observations | 36 | 36 | 36 | 36 | 36 |
Notes: Ordinary least squares regressions ran. Robust standard errors clustered on a group level in parentheses. Share Returned is the ratio of amount returned by the receiver and three times the amount sent by the sender. FBy and Chat are treatment dummies corresponding to the FB and Chat treatments. ‘Before’ refers to Part 1 decisions. The independent variables counting words by categories are obtained using the LIWC software. */**/*** indicate significance at the 10/5/1 percent level.
Publisher’s Note: MDPI stays neutral with regard to jurisdictional claims in published maps and institutional affiliations. |
© 2020 by the authors. Licensee MDPI, Basel, Switzerland. This article is an open access article distributed under the terms and conditions of the Creative Commons Attribution (CC BY) license (http://creativecommons.org/licenses/by/4.0/).
Share and Cite
MDPI and ACS Style
Abatayo, A.L.; Lynham, J.; Sherstyuk, K. Communication, Expectations, and Trust: An Experiment with Three Media. Games 2020, 11, 48. https://0-doi-org.brum.beds.ac.uk/10.3390/g11040048
AMA Style
Abatayo AL, Lynham J, Sherstyuk K. Communication, Expectations, and Trust: An Experiment with Three Media. Games. 2020; 11(4):48. https://0-doi-org.brum.beds.ac.uk/10.3390/g11040048
Chicago/Turabian StyleAbatayo, Anna Lou, John Lynham, and Katerina Sherstyuk. 2020. "Communication, Expectations, and Trust: An Experiment with Three Media" Games 11, no. 4: 48. https://0-doi-org.brum.beds.ac.uk/10.3390/g11040048
Note that from the first issue of 2016, this journal uses article numbers instead of page numbers. See further details here.