Are People Willing to Tell Pareto White Lies? A Review and New Experimental Evidence


1
Department of Economics and Marketing, De Montfort University, Leicester LE1 9BH, UK
2
Economics and Management School, Wuhan University, Wuhan 430072, China
3
School of Economics, University of Kent, Canterbury CT2 7NZ, UK
*
Author to whom correspondence should be addressed.
Games 2021, 12(1), 1; https://0-doi-org.brum.beds.ac.uk/10.3390/g12010001
Submission received: 1 September 2020
/
Revised: 29 November 2020
/
Accepted: 11 December 2020
/
Published: 23 December 2020
(This article belongs to the Special Issue Experiments on Dishonesty in Strategic Interactions)
Abstract
:We explore whether individuals are averse to telling a Pareto white lie—a lie that benefits both themselves and another. We first review and summarize the existing evidence on Pareto white lies. We find that the evidence is relatively limited and varied in its conclusions. We then present new experimental results obtained using a coin-tossing experiment. Results are provided for both the UK and China. We find evidence of willingness to tell a partial lie (i.e., inflating reports slightly) and high levels of aversion to telling a Pareto white lie that would maximize payoffs. We also find no significant difference between willingness to tell a Pareto white lie and a selfish black lie—a lie that harms another. We find marginal evidence of more lying in China than the UK, but the overall results in the UK and China are very similar.
1. Introduction
Are people willingly to lie to benefit another? Are they more willing to lie to benefit themselves if, in doing, so they also benefit another? These questions have practical importance in a number of settings. For instance, a supervisor may give overly positive feedback about a worker in order to create a positive working environment, or boost respective incomes. A teacher may allow a student to cheat on an exam to boost the standing of both. A sportsperson may dope to benefit herself and teammates. While lying in these contexts may not be completely innocuous (because other workers, students, or teams lose out), one could argue that it is ‘easier to justify’ a lie that benefits another than one that does not [1].
While there have been huge advances in recent years in the study of lie aversion, the focus has primarily been on individual decision-making [2,3,4]. In particular, lie aversion has been extensively studied in settings where a lie ‘takes money away from the experimenter’. Informative though such work has been, it is clearly vital to also study lie aversion in settings where a lie can directly harm or benefit another [5]. Our focus in this paper will be on settings where an individual can tell a Pareto white lie in order to benefit both themselves and somebody else. If we assume that it is ‘easier to justify’ a Pareto white lie, then an individual’s unwillingness to tell a Pareto white lie would seem to be very compelling evidence of aversion to telling any kind of lie [5]. To the best of our knowledge, however, there are only a handful of experimental studies that have analyzed Pareto white lies. The results of those studies are also wide ranging.
To demonstrate the point, in Table 1, we summarize the main findings of existing studies in terms of two key research questions: (a) Were a significant proportion of subjects averse to telling a Pareto white lie, and (b) was the proportion of subjects averse to telling a Pareto white lie less than those averse to telling a selfish lie (a lie that only benefits themselves)?1 In terms of question (a), there is clearly more ‘yes’ than ‘no’, but there is still reason to delve deeper. For instance, Lightle (2013) [6] and Vanberg (2017) [7] provide experiments in which all subjects given the opportunity to tell a Pareto white lie do so. On question (b), there is no consensus at all. Some studies, such as that of Erat and Gneezy (2012) [5], find that people are more willing to tell a Pareto white lie than a selfish lie. However, other studies, such as Ploner and Regner (2013) [8], find no such differences (economically or statistically).
Our objectives in this paper are twofold. First, we provide a comprehensive survey of evidence on Pareto white lies. The aim is to bring into one place the disparate evidence on Pareto white lies to aid comparison and give clearer understanding of what that evidence says. In doing so, we shall pay particular attention to the pros and cons of different experimental protocols. Second, we propose a novel experimental protocol to study Pareto white lies, building on previous work looking at coin-flipping tasks [9]. We provide some initial results using this protocol that show, both in the UK and China, considerable aversion to telling a Pareto white lie that would maximize payoffs, although less aversion to telling a partial lie. We also find no evidence of a higher willingness to tell a Pareto white lie than a selfish lie.

Table 1.
Summary of results of existing studies on two key research questions: Was there evidence of aversion to telling a Pareto lie? Was there less aversion to telling a Pareto lie than a selfish lie?
Table 1.
Summary of results of existing studies on two key research questions: Was there evidence of aversion to telling a Pareto lie? Was there less aversion to telling a Pareto lie than a selfish lie?
| Study | Task | Averse Pareto | Less Averse |
|---|---|---|---|
| Wiltermuth (2011) [10] | Word jumbles | Yes | Yes |
| Rosaz and Villeval (2012) [11] | Marking effort | Yes | No |
| Erat and Gneezy (2012) [5] | Sender–receiver game | Yes | Yes |
| Cappelen et al. (2013) [12] | Sender–receiver game | Yes | NA |
| Conrads et al. (2013) [13] | Die-roll match | Yes | No |
| Gino et al. (2013) [1] | Math problems | Yes | Yes |
| Lightle (2013) [6] | Sender–receiver game | No | NA |
| Ploner and Regner (2013) [8] | Die-roll | Yes | No |
| Biziou-van-Pol et al. (2015) [14] | Distribution task | No | Yes |
| Weisel and Shalvi (2015) [15] | Die-roll match | Yes | Yes |
| Glätzle-Rützler and Lergetporer (2015) [16] | Sender–receiver game | Yes | No |
| Vanberg (2017) [7] | Sender–receiver game | No | NA |
| Wouda et al. (2017) [17] | Die-roll match | Yes | NA |
We proceed as follows. In Section 2, we introduce some terminology around the study of Pareto white lies. In Section 3, we review the prior literature, looking at sender–receiver games, payoff distribution games, and real effort games. In Section 4, we introduce our experimental protocol and discuss our results. In Section 5, we conclude.
2. Terminology
In this section, we introduce some terminology that will be useful in the remainder of the paper. Unless otherwise stated, we assume pairwise interaction between two individuals. For expositional convenience, let us refer to one of the individuals as Alice and the other as Brian. In all the games, we consider that Alice will have the option to lie. This lie, either directly or indirectly, can then influence the payoffs of both Alice and Brian. Around this basic framework, we will see that games can vary in a multitude of different ways (summarized in Section 3.4), but those details are not vital at this stage. Note that we will use the word ‘lie’ [2,18], but the word ‘cheat’ is also commonly used in the literature [9,10,19].2
Erat and Gneezy (2012) [5] introduce the following classification of lies based on how the lie influences payoffs. The benchmark for comparison is payoffs if everyone is honest. In the case where Brian determines payoffs, the lie of Alice is classified based on what she would expect Brian to do given the lie she has told.
- Altruistic white lie—a lie that harms Alice and benefits Brian.
- Pareto white lie—a lie that benefits both Alice and Brian.
- Spiteful black lie—a lie that harms both Alice and Brian.
- Selfish black lie—a lie that benefits Alice and harms Brian.
Given the various settings considered in the literature, we suggest to add the following options.
- Altruistic neutral lie—a lie that benefits Brian and has no effect on Alice.
- Selfish neutral lie—a lie that benefits Alice and has no effect on Brian.
- Spiteful neutral lie—a lie that harms Brian and has no effect on Alice.
Let us emphasize that in the interpretation of a selfish neutral lie, we still take as given that Brian is a specific individual paired with Alice. We, thus, draw a distinction between pairwise interaction and a setting in which Alice acts in complete isolation. Pairwise interaction can influence Alice’s incentives to tell a neutral lie if Brian will observe the choice of Alice, or if Alice is concerned with the distribution of payoffs (because of, say, inequality aversion).3
A further distinction will prove useful and is relevant for settings where the choice set allows for variation in the extent of lying, i.e., Alice can lie ‘a little’ or ‘a lot’ [18,22].
- Full honesty—Alice tells the truth.
- Selfish lying to the fullest extent—Alice tells a lie that maximizes her payoff.
- Altruistic lying to the fullest extent—Alice tells a lie that maximizes the payoff of Brian.
- Payoff-maximizing lying to the fullest extent—Alice tells a lie that maximizes the joint payoff of Alice and Brian.
- Partial lie—Alice tells a lie that does not maximizes her payoff, that of Brian, or joint payoff.
- Infrequent lying—Alice sometimes lies but does not always tell a lie that maximizes her payoff, that of Brian, or joint payoff.
Partial lies and infrequent lying are of interest because they give insight into the costs of lying [18,22]. In particular, if Alice tells a partial or infrequent lie, then it suggests that she understands the potential benefits from lying (so we can more confidently rule out confusion or misunderstanding), and yet she does not maximize her own or others’ payoff. We will distinguish, where relevant, aversion to partial lying, which suggests full honesty, and aversion to full lying, which allows for partial or infrequent lying.
3. Prior Literature
In this section, we review studies that provide experimental evidence on aversion to telling a Pareto white lie. Given that many of these studies were not specifically aimed at analyzing Pareto white lies, it is interesting to pick out the relevant results and collect them together for easy comparison. We focus our review on some specific research questions: Is there evidence that subjects are averse to telling Pareto white lies? Are subjects less averse to telling Pareto white lies than selfish lies, or similar? What factors may influence aversion to telling a Pareto white lie? We will also pay particular attention to the experimental protocols used in search of pros and cons of different methods. This will inform our subsequent experiment (discussed in Section 4).
3.1. Sender–Receiver Game
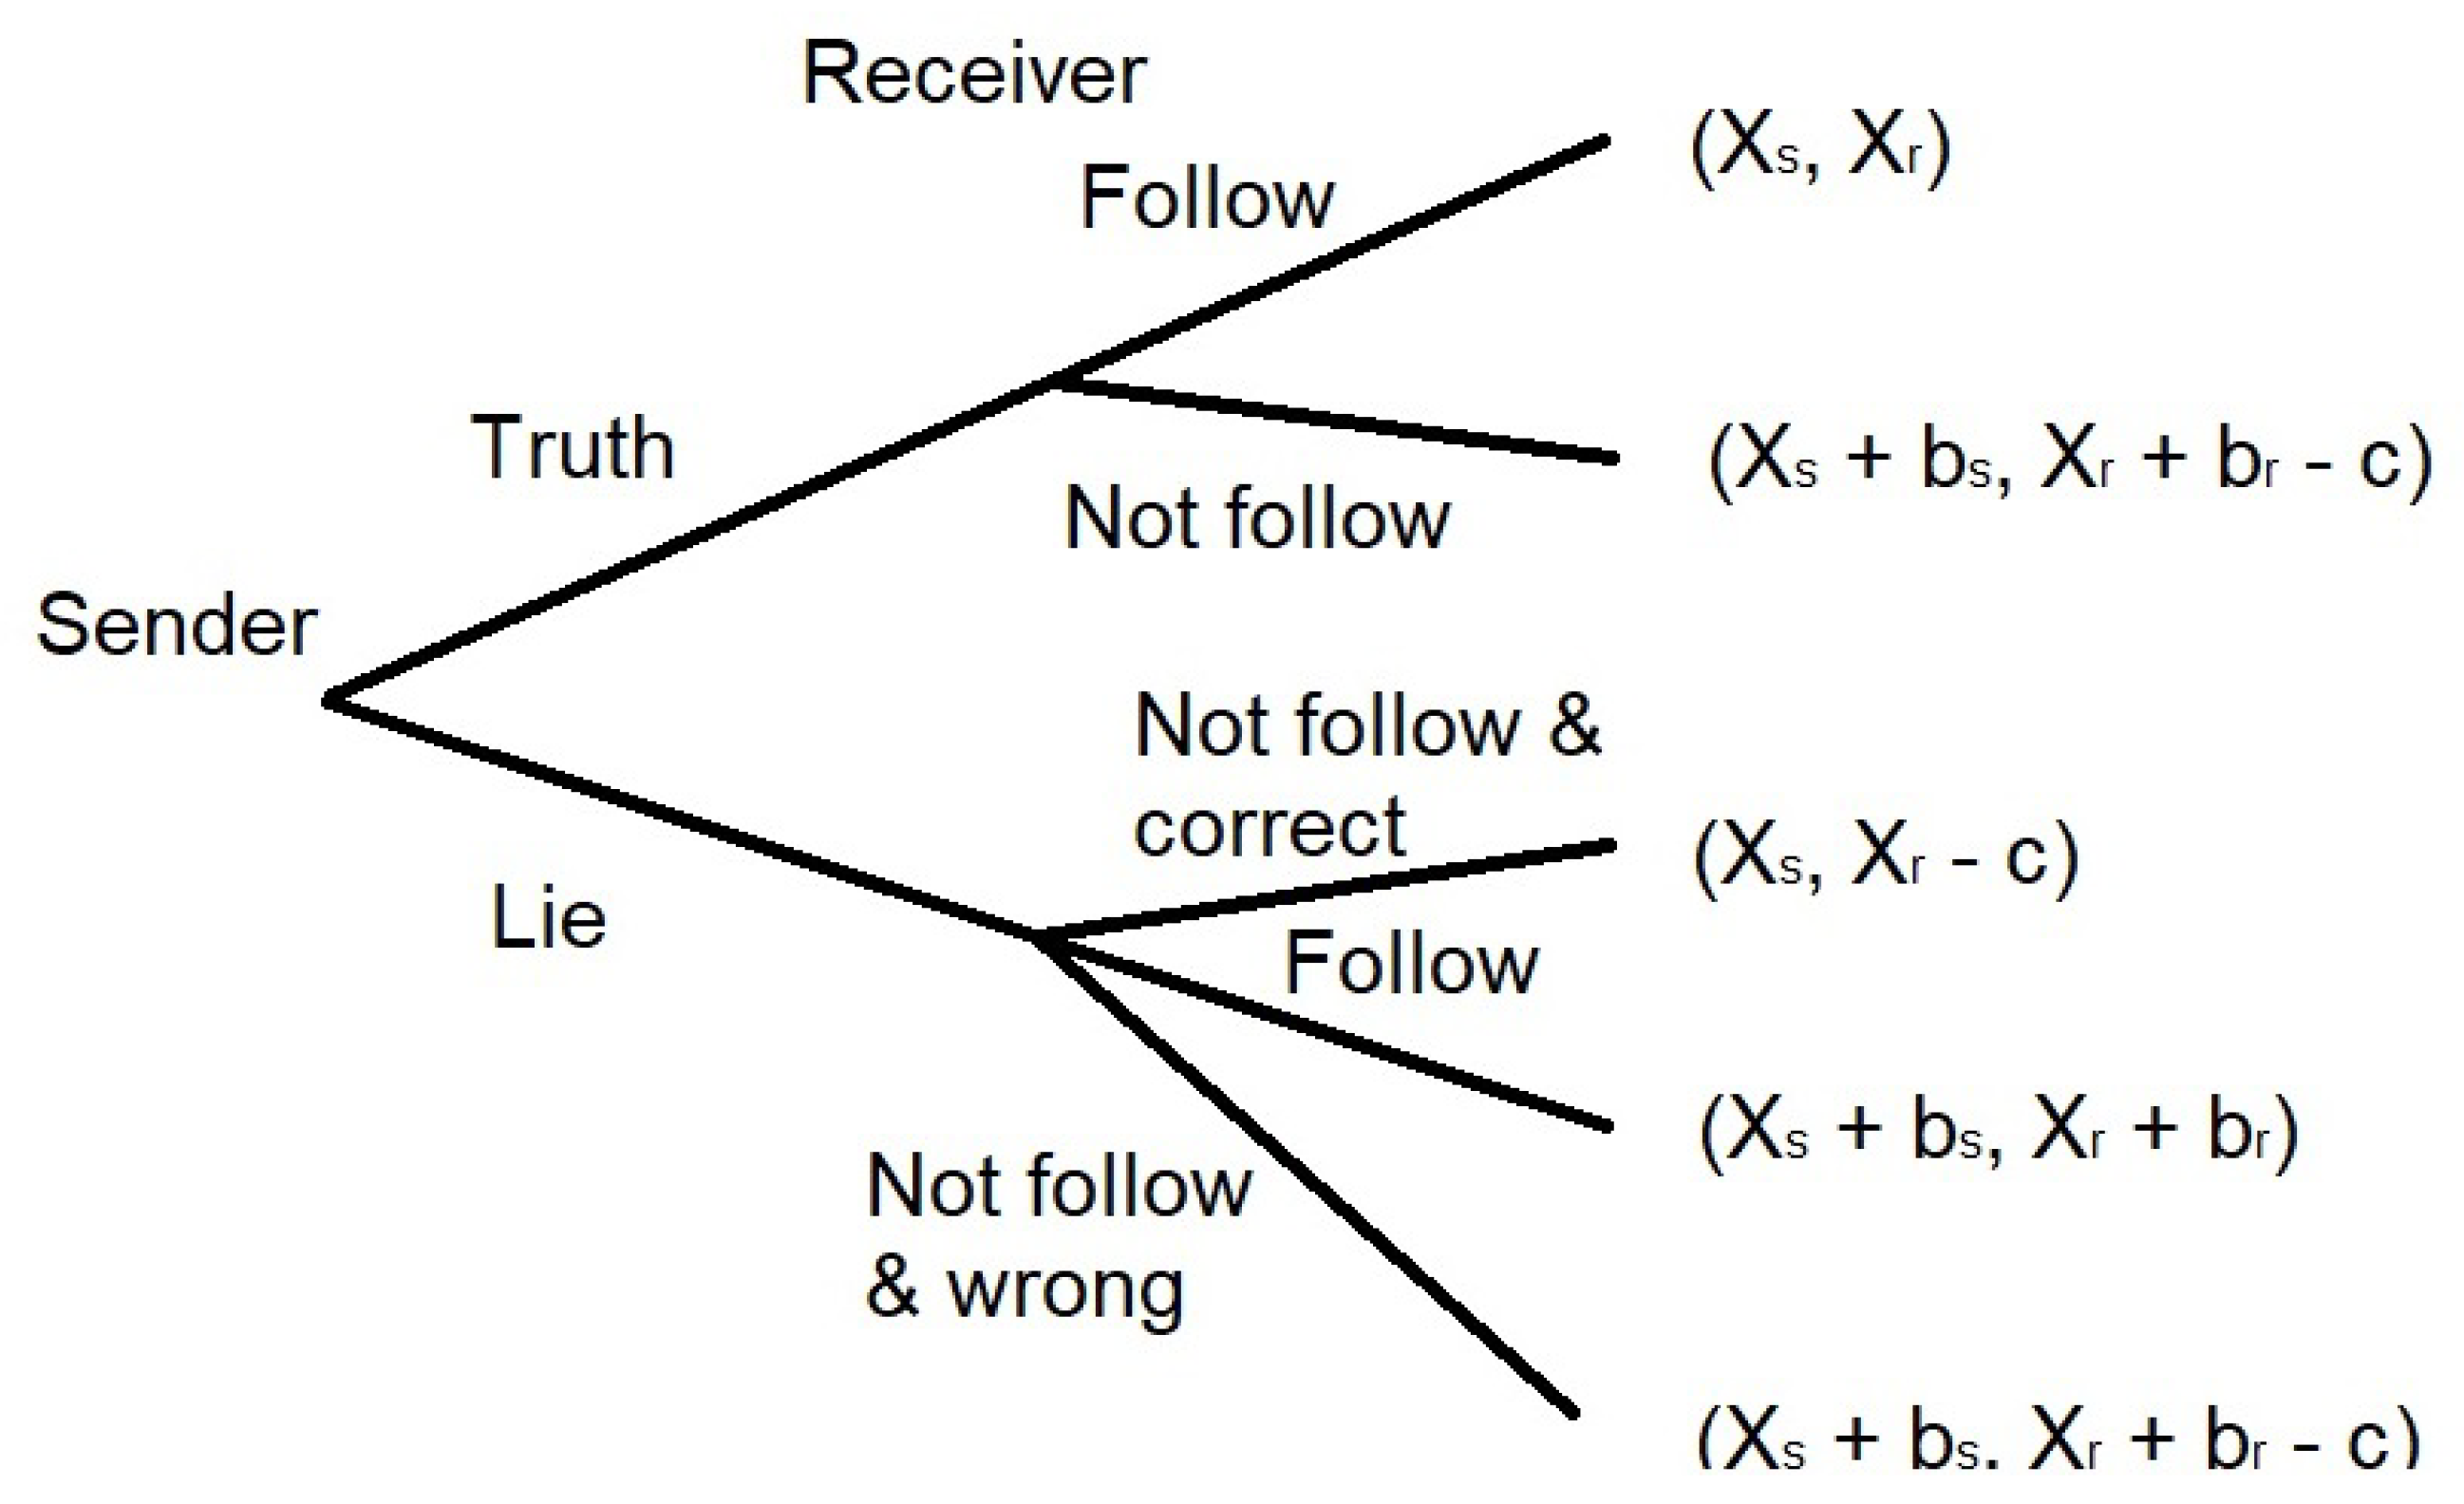
Erat and Gneezy [5] studied lying in a sender–receiver game.4 A general version of the game can be described as follows. A random number r is generated from set and determines the correct answer. This is typically determined by the role of a die () or toss of a coin (). The sender (Alice in our terminology) is privately told r. She then chooses a number and sends a message to the receiver of the form ‘the correct answer is x’. In interpretation, the sender can tell the truth () or lie (). Having been told x, the receiver (Brian in our terminology) chooses a number . In interpretation, he can follow the advice () or not follow the advice (). Figure 1 summarizes payoffs to all possibilities. If the receiver chooses the correct number, , then the sender and receiver get and , respectively. If the receiver does not choose the correct number, , then the sender and receiver get and , respectively. Finally, if the receiver deviates from the message of the sender, , then he pays penalty c. Note that senders know all payoffs, while receivers do not.
An advantage of the sender–receiver game is that by varying and , it is possible to obtain the full spread of Pareto white lies, selfish lies, etc. To illustrate, consider a ‘baseline’ setting of and . If the sender tells the truth and is followed, then both get payoff 20. If the sender lies and is followed, then both get payoff 30. The sender, thus, has the opportunity to lie for mutual benefit—a Pareto white lie. In Table 2, we detail the proportion of subjects who lie in this baseline setting across a range of studies. The different treatments in the study of Cappelen et al. (2013) [12] reflect different priming tasks before the sender chooses to lie.5 This baseline of Pareto white lies can then be compared (as illustrated in Table 2) with altruistic white lies , selfish lies , etc.
One of the key findings of Erat and Gneezy (2012) [5] is that a large proportion of people are averse to telling Pareto white lies. This finding is reinforced by the results of Cappelen et al. (2013) [12]. One can see in Table 2 that anything from a quarter to a half of subjects do not tell Pareto white lies. A second key finding of Erat and Gneezy (2012) [5] is that a higher proportion of subjects are willing to tell a Pareto white lie than either an altruistic white lie or selfish lie. In particular, one can see in Table 2 that the proportion of subjects willing to tell a Pareto white lie is around 20–30% more than those willing to tell an altruistic white lie. Glätzle-Rützler and Lergetporer (2015) [16] find no such difference in a study of teenagers.
The studies detailed in Table 2 show a good deal of consistency. Unfortunately, however, the sender–receiver game has a non-trivial flaw as a method of measuring lie aversion. Namely, the sender’s choice to ‘lie’ or ‘tell the truth’ may be influenced by beliefs about the likely actions of the receiver. For instance, the sender may tell the truth in expectation that the receiver will not follow the advice [26]. If R and c are sufficiently large, then one can argue the receiver has no incentive to do anything other than follow the sender [5,12]. Cappelen et al. (2013) [12] and Kerschbamer et al. (2019) [25] report, however, that receivers chose to follow in only and of instances. It does not seem unreasonable, therefore, that senders should put some doubt on the likely actions of receivers. This means that the interpretations of ‘lie’ and ‘truth’ become somewhat murky.
A study by Vanberg (2017) [7] provides direct evidence that senders need not expect receivers to follow. In a baseline replication, 32 of 106 subjects chose ‘truth’. As we can see in Table 2, this is consistent with other studies. Crucially, Vanberg also asked subjects what they expected the receiver to do. Of the 32 subjects who told the truth, 24 said they expected the receiver not to follow. Of the 74 subjects who lied, 32 said they expected the receiver not to follow. Given that the questions were not incentivized, it would be premature to argue that a majority of senders expected the receiver to not follow. Even so, these results strongly suggest that there is no simple interpretation of ‘lie’ and ’truth’ in the sender–receiver game.
To reinforce the point, Vanberg conducted two new treatments [7]. In one, the subjects commonly knew that their material interests aligned. Hence, it is more natural that receivers would follow the advice of senders.6 In all instances where it was beneficial to lie, senders chose ‘lie’. In the other treatment, receivers could send a message to the sender stating whether they would follow the message. In all instances where it was beneficial to lie and receivers said they would follow, senders chose ‘lie’. These results directly challenge the finding that a significant proportion of people are averse to telling a Pareto white lie.
A study that draws a similar conclusion is that of Lightle (2013) [6]. This experiment was framed in terms of an Analyst and Investor. The Analyst observed the exact value of a company and sent the message to the Investor. The message was subject to random noise, with upper limit ± 40, before being seen by the Investor. The Investor then chose to invest or not. Two treatments were compared. In an aligned treatment, the interests of the Analyst and Investor coincided; both preferred investment if and only if . However, in a conflict treatment they did not; the Analyst preferred investment if and only if , while the Investor preferred it if and only if . Subjects were exposed to eight rounds of each treatment. This setup is a variant on the sender–receiver game in which there is: a scale to lying, random noise, a framed context, and repetition.
In both treatments, it was in the Analyst’s interest to choose extreme messages—for example, if , to send message 200. This has the effect of taking out the random noise. In the aligned treatment, to send this message is a Pareto white lie because it should increase the expected payoff of both the Investor and Analyst. Recall that subjects played the game eight times. Nosubject reported truthfully on any more than four occasions. The majority of subjects (37 out of 70) lied on all eight occasions. Hence, there is little evidence of significant aversion to telling a Pareto white lie. Note, however, that lying increases with repetition and there is evidence of partial lying, with a strong correlation between r and x. We are not, therefore observing, lying to the fullest extent. In the conflict treatment, to send message 200 (when ) is to tell a selfish lie because it ‘misinforms’ the Investor. The interesting question for our purposes is whether there was less willingness to tell such a selfish lie than a Pareto white lie. The evidence suggests that there was not, or at most, the effect was very marginal. In particular, messages sent when were very similar in the Aligned and Conflict treatments ( vs. frequency of lies). It seems, therefore, that subjects were not averse to telling any lie, selfish or Pareto. This willingness is potentially caused by the Analyst/Investor frame, but given that the study stands alone in many different dimensions, it is difficult to know.
In summary, the evidence from the sender–receiver games is inconclusive. The studies following the approach of Erat and Gneezy (2012) [5] consistently find that (a) around 30–40% of subjects are averse to telling a Pareto white lie, and (b) less subjects are averse to telling a Pareto white lie than a selfish lie. However, the study of Lightle (2013) [6] challenges (a) and (b), that of Glätzle-Rützler and Lergetporer (2015) [16] challenges (b), and that of Vanberg (2017) [7] challenges point (a) (and gives no insight on (b)). Perhaps more importantly, the study of Vanberg (2017) [7] highlights the difficulties of using the sender–receiver game to measure lie aversion [26]. In particular, the complicating factors of strategy and imperfect information make it difficult to infer motives from actions. It seems important, therefore, to consider alternative ways of measuring lie aversion.
3.2. Distribution Games with Lying
Given that the interpretation of what constitutes a lie in sender–receiver game is complex, a simplified variant is one in which the sender determines the outcome. That is, the sender observes some signal r and has to decide what to report (x). Monetary payoffs for both the sender and receiver are solely determined by the report x. Equivalently, one can think of the receiver as having to follow the advice of the sender. The message sent is, to some extent, meaningless in that the receiver will never know potential payoffs in the game. To report does, though, mean that the sender has to lie. Given that the task of the sender is essentially to determine the payoff distribution, we refer to this as a distribution game with lying.
Of the studies that have used this framework, Biziou-van-Pol et al. (2015) [14] allow for Pareto white lies. Subjects were told that they had been matched with another participant and that the other participant ‘does not play any active role’. They were also told that there are two groups (group 1 and group 2) and they have been randomly assigned to one of them. The subject—Alice in our terminology—is informed of her group, but the other participant—Brian—is not. Alice is then asked to declare the group she is assigned to by choosing between the messages ‘I have been assigned to group 1’ or ‘to group 2’. If she declares the truth, then she and Brian each receive . If she lies, then payoffs depend on treatment. In the altruistic white lie treatment, Alice receives and Brian receives . In the Pareto white lie treatment, they both receive . At no point does Brian learn the payoff from the option not chosen by Alice.
In Table 3, we summarize the results of this and related studies. One can see that the vast majority of subjects (but not all) were willing to tell a Pareto white lie, while the vast majority of subjects were not willing to tell an altruistic white lie. For comparison, we provide the numbers from a similar study by Capraro (2017) and Capraro et al. (2019) [27,28] looking at selfish lies. One can see that the proportion telling a selfish lie is significantly lower (around ) compared to that telling a Pareto white lie. Overall, therefore, we see a very stark result with little aversion to telling a Pareto white lie and a big gap between willingness to tell a Pareto and a selfish lie. One possible explanation for this stark result is the very stripped down nature of the context. Alice is picking between two payoff outcomes without any interaction with Brian in any meaningful sense. This may, amongst other things, lead to an experimenter demand effect of subjects choosing the outcome they think they are supposed to choose.
For a very different type of distribution game with lying (and Pareto white lies), we turn to the study by Ploner and Regner (2013) [8]. In their experimental design, subjects roll a die to determine whether they will receive an endowment of 15 tokens (odd number) or five tokens (even number). The subject, Alice in our terminology, can lie to obtain the 15 tokens. Subsequently, Alice is the dictator in a dictator game with another participant in the experiment—Brian in our terminology. Thus, Alice must choose how much of her endowment (15 or five tokens) to give to Brian. Crucially, subjects knew about the dictator game before rolling the die. To lie and claim 15 tokens is, therefore, a Pareto white lie if Alice lies to also increase the amount she can give to Brian. As a control, the study compared this dictator game treatment with a treatment where the subject simply keeps the endowment without any dictator game. In this control treatment, a lie is unambiguously selfish.
Table 4 summarizes the estimated proportion of subjects who lied in the dictator game compared to the control treatment. In the standalone version of the experiment (with no preceding experiment), one can see that there is no discernible difference between the dictator game and the control. This finding appears, though, sensitive to the task that subjects performed before the experiment. If subjects had just taken part in a task around philanthropy (performing a real effort task to generate money for charity), lying in the dictator game was higher. By contrast, if subjects had just taken part in a public good game with punishment, lying in the control treatment was higher. From our perspective, the two key findings are that there a significant proportion of subjects appeared averse to telling a Pareto white lie, and there was no evidence of less aversion to telling a Pareto white lie than a selfish lie.
Two other studies that can be classified as using a distribution game are that of Weisel and Shalvi (2015) [15] and the replication study of Wouda et al. (2017) [17]. In the baseline treatment, subjects are split into pairs. One subject, Brian in our terminology, rolls a diee and reports the outcome to Alice. Alice then rolls a diee and reports the outcome. If Alice and Brian report the same number, then they get paid that number (e.g., if they both report 5, they get EUR 5), and if they report a different number, they get nothing. This task was repeated 20 times. To maximize individual and joint payoffs, Brian should report 6 and Alice should report the same number as Brian.
We will focus on the behavior of Alice. In the baseline treatment, it is a Pareto white lie for Alice to claim she matched the die roll of Brian. Weisel and Shalvi (2015) [15] consider a range of different treatments in which they vary the payoff to both subjects. The specific details of those treatments are not particularly relevant here other than to note that some treatments gave Alice the opportunity to tell a Pareto white lie, some an altruistic white lie, and one a selfish neutral lie. This is summarized in Table 5 along with the mean number of matches reported (out of 20) and the proportion of subjects who were ‘brazen’ in claiming 20 out of 20 matches. Note that brazen subjects exhibit selfish (and altruistic) lying to the fullest extent, while non-brazen subjects exhibit infrequent lying.
If subjects in the role of Alice report truthfully, then we would expect to see mean matches and no brazen subjects. One can, therefore, see in Table 5 that there is clear evidence of dishonesty. Moreover, there are higher levels of dishonesty in telling a Pareto white lie than altruistic or selfish neutral lies. On the flip side, we are far from observing lying to the full extent. For instance, the proportion of brazen subjects is never more than and is typically much lower. The replication study by Wouda et al. (2017) [17] finds even lower levels of dishonesty. We observe, therefore, high levels of aversion to full lying, but evidence of partial and infrequent lying.
We finish this section with a brief comment on the experiment of Conrads et al. (2013) [13]. They consider a team variant of the die-rolling task introduced by Fischbacher and Follmi-Heusi (2013) [18]. Two subjects, Alice and Brian in our terminology, independently throw a six-sided die and report the number. Reporting a 6 is worth zero points and reporting 1 to 5 is worth one to five points, respectively. Let and denote the points reported by Alice and Brian. In the team treatment, the payoff of Alice and Brian is given by . To inflate points, e.g., report 5 instead of 6, is a Pareto white lie because it increases the payoff of both Alice and Brian. In the mixed treatment, the payoff of Alice is and the payoff of Brian is , where z is the points from a random die roll. For Alice to inflate points is now a selfish neutral lie because it has no effect on Brian. For Brian to inflate points is still a Pareto white lie.
Conrads et al. (2013) [13] observe a mix of partial lying, reporting four points, and lying to the fullest extent, reporting five points. Crucially, for our purposes, they find no difference between the behavior of Alice in the team treatment and in the mixed treatment. Thus, willingness to tell a selfish neutral lie is similar to that of telling a Pareto white lie. Interestingly, they do find lower reports from Brian in the mixed compared to team treatment. The authors connect this with diffusion of responsibility. In the team treatment, Brian may be more willing to lie because Alice may have lied as well. That, however, reiterates the evidence for aversion to telling a (full) Pareto white lie.
The four experimental protocols we have discussed in this subsection are very different. With the exception of the stark results of Biziou et al. (2015) [14], there is some consistency in the results. Specifically, (a) there is evidence of considerable aversion to telling a Pareto white lie, particularly aversion to lying to the fullest extent, and (b) two out of three studies find no evidence of any less aversion to tell a Pareto white lie than a selfish lie. In terms of experimental protocols, it is interesting to compare the protocols of Biziou et al. (2015) [14] and Ploner and Regner (2013) [8], where Alice determines the payoff of Brian without interacting with him in any meaningful sense, those of Conrads et al. (2015), where Alice and Brian determine each other’s payoff without any direct interaction, and, finally, those of Weisel and Shalvi (2015) [15], where there is direct interaction and payoff interdependence. These are factors that may, potentially, influence willingness to lie.
3.3. Real Effort Tasks
We finish our review of the literature by looking at lying in the reporting of real effort tasks. The papers by Wiltermuth (2011) [10] and Gino et al. (2013) [1] consider similar experimental designs. In one method (see Study 2 and 4 of Wiltermuth (2011) [10]), subjects are asked to unscramble word jumbles in the order they appear. Subjects are paid according to how many words they report having unscrambled. There were nine words in total and, crucially, the third word was difficult to solve—Unaagt unscrambles to Taguan. If, therefore, subjects report honestly, it is likely that most would only unscramble two words. In Table 6, we summarize, by treatment, the proportion of subjects who likely cheated by reporting they solved Taguan. The treatments vary intuitively in terms of who benefits from each word solved. The ‘Self-alone’ treatments measure selfish lies, the ‘self-and-other’ treatments measure Pareto white lies, and the ‘other-alone’ treatment measure altruistic lies.7 From Table 6, one can see that the majority of subjects did not report having solved Taguan. This suggests that a large proportion of people are averse to telling a Pareto white lie. Dishonesty was, however, higher in the treatments with Pareto white lies than in any other treatment.
In the second task considered by Wiltermuth (2011) [10] (see Study 3) and the second experiment of Gino et al. (2013) [1], subjects had to solve mathematical matrix problems (finding two numbers out of 12 that add to 10). They had 5 min to solve up to 20 matrices and self-reported results. In the design used by Wiltermuth (2011) [10], five of the matrices did not contain a solution, allowing a direct test of cheating. In the ‘self-alone’ treatment, a subject received USD per matrix solved. In the ‘self-and-other benefit’ treatment, the subject and another participant each received USD per matrix solved. The mean number of unsolvable matrices was higher in the self-and-other treatment ( vs. ), as was the total number of matrices solved ( vs. ). This reinforces the finding that subjects are more willing to tell a Pareto white lie than a selfish lie. We observe, though, partial lying with reports well away from the 20 consistent with maximal lying.
In the version used by Gino et al. (2013) [1] (see study 2), answers were recorded so that cheating at the individual level could be checked.8 One can see in Table 6 that the results obtained by Gino et al. (2013) [1] in their study 2 are consistent with those obtained by Wiltermuth (2011) [10]. Specifically, around 20–30% of subjects appeared willing to tell a selfish lie and around 40–60% appeared willing to tell a Pareto white lie. Again, these results suggest that a significant proportion of individuals are averse to telling even a partial Pareto white lie. Study 3 of Gino et al. (2013) [1] provides very different results. Here, subjects had to solve simple math problems (and so the task was not unlike the matrix task). There was, though, a twist in that the correct answer would be shown by default unless the subject pressed the space bar on the computer. There was, therefore, an element of cheating ‘by default’, and a subject had to actively make an effort to avoid cheating. One can see in Table 6 that almost all subjects cheated in this context. Note, however, that cheating is still higher in the case of a Pareto white lie than in the other two treatments.
The study by Rosaz and Villeval (2012) [11] provides a very different experimental design. Subjects were split into workers and a supervisor. Workers were asked to perform a task—counting the occurrence of four random letters in paragraphs of a text. Supervisors were then asked to mark the sheet of a worker. Payment of both the worker and supervisor was based on how many correct answers the supervisor reported, as detailed in the bottom two rows of Table 7. One can see that the payoff of the worker was increasing in the supervisor’s report, while the supervisor’s payoff was maximized with a medium report. The top half of Table 7 details the number of observations of each performance/report combination. For instance, in 85 out of the 221 pairings, the workers’ performance was medium and the supervisor reported that performance was medium.
Depending on the performance of the worker, the supervisor may have the possibility to tell a spiteful lie, selfish lie, Pareto white lie, or altruistic white lie. There were 77 cases of misreporting. Of these, 41 () were Pareto white lies, 29 () were selfish black lies, four were altruistic white lies, and three were spiteful black lies. The vast majority of lies were, thus, Pareto white lies or selfish black lies. Interesting, for our purposes, is the proportion of times that supervisors tell a Pareto white lie when they have the chance to do so. If performance was very low, then to report anything other than the truth was a Pareto white lie, and five out of nine supervisors did so. If performance was low, then to report medium or very high was a Pareto white lie, and 27 out of 47 supervisors did this. If performance was high, then to report very high was a Pareto white lie, and only 9 out of 55 supervisors did this. Overall, therefore, in the 111 cases where a Pareto white lie was possible, we observe 41 or of supervisors telling a Pareto white lie. Interestingly, there were 74 cases where a selfish black lie was possible, and on 29, or, equivalently, , of occasions, the supervisor told a black lie.9 There is no clear difference, therefore, between willingness to tell a Pareto white lie compared to a selfish black lie.
3.4. Summary
While the overall literature on lie aversion has grown considerably over the last 20 years or so, we can see that there are still relatively few studies that give insight on Pareto white lies. As we previewed in the introduction (see Table 1), results vary considerably by study. Some studies show that up to half of people are averse to telling a Pareto white lie [10,11], while others show no aversion at all [6,7]. Some studies find no difference between willingness to tell a Pareto white lie and a selfish lie [8,11], while others find a 30–50% difference [1,5]. It would seem crucial to identify why we observe such diverse results and, more generally, identify what factors influence willingness to tell a Pareto white lie.
An obvious candidate for why we observe such diverse results are that studies fundamentally differ in task and design. To elaborate on this point, consider just some of the points of variation we have seen: (a) The choice of Alice to lie can be binary or on a scale. (b) Alice may merely have the option to tell a Pareto white lie (or not) or may have other options (e.g., Pareto white lie, selfish white lie, and truth). (c) The frame can vary from choosing A or B, to an investment decision, to reporting effort. (d) Alice may lie to Brian or lie to the experimenter knowing that this influences Brian. (e) Alice may lie about the effort she has exerted or the effort that Brian exerted. (f) Alice may lie about a random or non-random event. (g) Payoffs, irrespective of choices, may be partially random. (h) A lie is observable/inferable by Brian and/or the experimenter. (i) Brian is a mere observer or can also lie. (j) Alice and Brian interact repeatedly or only once. (k) Brian earns more, less, or the same as Alice if Alice lies. (l) Brian is aware of respective payoffs ex-ante. (m) Brian is aware of payoffs ex-post. (n) Brian can influence Alice’s payoff.
The prior literature gives us some strong hints of factors that increase lying. For instance, lying appears to increase with repetition [6,15], and lying to the fullest extent is rare when partial lying is possible [1,6,10,13]. Even so, the wide variation in experimental design makes it impossible to robustly identify the factors influencing lie aversion. Studies that systematically vary some of the factors identified above (a–n) would be needed. In motivating our experimental work, we take a different approach. Many of the studies we have identified in this paper were not explicitly designed to measure willingness to tell a Pareto lie. We, therefore, suggest taking a step back and identifying experimental design features that would be desirable in studying Pareto white lies. Clearly, there is going to be no ‘perfect’ setting. Our review of the literature allows us, however, to identify three features that seem desirable.
One particular feature we would highlight is the sense of ‘interaction’ and ‘payoff interdependence’ between Alice and Brian. In the sender–receiver game, there is direct interaction between Alice and Brian, but also imperfect information (they typically do not know that their interests are aligned) and the confounding problem of ‘deception by telling the truth’. This makes it difficult to accurately measure lie aversion [7]. At the other extreme are distribution games in which Alice decides on the fate of Brian without any interaction with him in any meaningful sense. This lack of interaction may influence willingness to benefit another. A similar argument can be made for real effort tasks in which Alice exerts and reports her own effort [1,10]. We would suggest that the studies of Rosaz and Villeval (2012) [11] and Weisel and Shalvi (2015) [15] strike a nice middle ground. In these studies, there is meaningful interaction in the sense that Alice observes something of Brian, while there is also perfect information and no role for strategic considerations.
The second feature we will highlight is the choice set of Alice. We would argue that choice settings that allow lying on a scale can give a richer understanding of lie aversion [2,18]—for instance, distinguishing between those who are averse to telling a partial Pareto white lie versus a full Pareto white lie. The design of Rosaz and Villeval (2012) [11] allows variation in the extent of lying, but with relatively complex payoff trade-offs. The studies of Lightle (2013) [6] and Weisel and Shalvi (2015) [15] allow variation in the extent of lying, but only through repetition of a binary task. The real effort experiments of Wiltermuth et al. (2011) [10] and Gino et al. (2013) [1], arguably, provide the most straightforward environment in which Alice can lie a little or a lot.
The final factor we will highlight is flexibility to vary payoff incentives. In Section 2, we contrasted a range of different types of lies—altruistic white lies, spiteful black lies, etc. Ideally, one would want an experimental protocol that can easily accommodate all the various permutations. Studies such as those of Rosaz and Villeval (2012) [11], Ploner and Regner (2013) [8], and Weisel and Shalvi (2015) [15] are not well placed to do this because they consider specific, if interesting, settings. The sender–receiver game and real effort tasks are more easily able to accommodate payoff flexibility.
Table 8 summarizes how experimental designs compare on the three features we have identified. The interesting point to recognize is that no study combines the features of: (a) meaningful interaction with perfect information and no role for strategic deception, (b) the potential to capture partial lying, and (c) full payoff flexibility. The studies of Rosaz and Villeval (2012) [11] and Weisel and Shalvi (2015) [15] come close to this ‘ideal’, but without a simple mechanism to lie at scale. Similarly, the real effort tasks of Wiltermuth (2011) [10] and Gino et al. [1] do not have meaningful interaction between Alice and Brian. In the next section, we introduce an experiment that combines the three features we have identified. Before doing so, let us briefly note that the four studies we have picked out for mention immediately above are relatively consistent in estimating that around 40–60% of subjects are averse to telling a Pareto white lie [1,10,11,15]. We will use this observation to help interpret our experimental results.
4. Coin-Tossing Experiment
We introduce a new experimental design that we argue satisfies the three desirable features discussed in the previous section. Our approach builds on previous studies using a coin-tossing task [9,29,30]. Subjects were asked to perform two tasks in sequence, a guesser task and a marker task. In the guesser task, subjects were asked to guess the outcome, heads or tails, of 10 coin tosses. These guesses were recorded by the guesser on a guess sheet (see column “HEADS or TAILS” on the guess sheet in Figure 2). In the marker task, subjects were asked to toss a coin 10 times and record whether or not each guess was correct. Specifically, they filled in the final three columns on the guess sheet, detailing correct or incorrect, guesser payoff, and marker payoff. They then handed the sheet to the experimenter to determine payoff. Payoffs were determined, as we discuss shortly, based on how many guesses were recorded as correct on the sheet. Crucially, there was no external validation of the marker’s record. Markers tossed the coin privately with nobody, neither the guesser nor experimenter, having any opportunity to verify if the marker’s record was accurate. This provides an opportunity for ‘dishonesty’.
Irrespective of the guess, the probability of each guess being correct is . The distribution of payoffs we would expect with honest reporting is, therefore, a binomial distribution with 10 trials. This allows us to detect dishonesty at a treatment level [9,18]. We emphasize that there is no ‘strategy’ to guessing, and in this sense, the guessing tasks serve no payoff-relevant purpose—it is simply a subject ‘randomly’ ticking Heads or Tails on a piece of paper. The guessing and marking process does, though, create interaction between the two individuals involved. In particular, the marker has some connection with the guesser in that they are reporting on the guesser’s ‘success’ in predicting outcomes. This is similar to a supervisor marking the performance of a worker [11]. Moreover, the marking sheet forces the marker to indicate the payoff that each of them will get (see Figure 2), making payoff interdependence transparent. The interaction does not, however, involve any complications, such as strategic dishonesty or diffusion of responsibility. The task is also quick and easy to run. For instance, in our case, it was readily transferable between China and the UK without any fear of cultural/subject differences influencing the underlying honesty benchmark.
In our experiment, we contrasted two payoff mechanisms—constant-sum and mutual-gain. In the constant-sumgame, for each correct, guess the guesser received a positive payoff B, and the marker received zero. For each incorrect guess, the marker received B and the guesser received zero. Given that there was no external validation of the marker’s record, the marker could allocate any amount of money up to to themselves. This is the opportunity, and incentive, to be dishonest. Dishonesty, though, comes as the direct cost of the guesser. To report a higher number of incorrect guesses than actually observed is, therefore, a selfish black lie. To report a higher number of correct guesses is an altruistic white lie. In a mutual-gain game, the payoffs were changed so that a correct guess resulted in B for the guesser and B for the marker, while an incorrect guess resulted in zero for both. Again, the marker could allocate any amount of money up to to themselves. Here, though, the incentives of the guesser and marker are perfectly aligned, and so to report a higher number of incorrect guesses than actually observed is a Pareto white lie.
While we focus here on the distinction between the constant-sum game and mutual-gain game, one can see that the basic design is very flexible. By altering the payoff trade-offs (see the top of Figure 2), incentives can be varied widely, similarly to studies using a real effort task [1,10]. By changing the number of coin tosses, the setting can range from binary (one coin toss) to semi-continuous (large number of coin tosses). In our experiment, both guesser and marker were fully informed of payoff incentives, but this could also be changed, e.g., by not informing the guesser (as in a sender–receiver game). One key advantage of this experimental design (over real effort tasks) is that outcomes can be judged relative to an objective expected distribution (namely the binomial distribution). This is important if ‘honest’ performance may vary depending on incentives and/or cultural differences.
4.1. Experiment Design
We performed two experimental studies to compare the constant-sum and mutual-gain treatments. This can give insight into the aversion to telling a Pareto white lie and how the willingness to tell a Pareto white lie compares to that of a selfish black lie (and altruistic white lie). In both studies, we used the strategy method, meaning that every subject performed the roles of both guesser and marker. Specifically, after all subjects completed the guesser task, the guess sheet was passed randomly to another anonymous subject to be marked. Subjects were informed (correctly) that the subject marking their guess sheet would be different from the subject whose guess sheet they were marking. This ruled out any reciprocal incentives. At the end of the experiment, each subject was paid based on one of the tasks. The task chosen was randomly determined subject to a preservation of legitimate pairings.10
Study 1 was conducted at University of Kent (UK) with students recruited from the student population. The experiment was run using ‘pen and paper’ with GBP . As summarized in Table 9, a total of 92 subjects took part with an average payment of GBP , including a GBP 5 participation fee. There were 30 subjects in the mutual-gain treatment and 62 subjects in the constant-sum treatment. These were split into 32 subjects who were told that their partner was in the same room and 30 subjects who were told that their partner was in a different room.11 These treatments were run to see if subjects were more willing to lie if the ‘distance’ between them and their partner was varied. In the mutual-gain treatment, subjects were told that their partner was in the same room. The full instructions given to subjects are available in the Appendix B. We highlight that subjects were spaced out in a large classroom and provided with the guess sheet, a pen, instructions, and a coin to toss. After sufficient time for every subject to make their guesses, the guess sheets were collected and then distributed to relevant makers. Markers and guessers were identified by a two-digit ID number. Guess sheets were then collected to determine payoff. Subjects were spaced out sufficiently to mean that any cross-observation of marking was not possible. This lack of observation should have been apparent to subjects.
Study 2 was conducted at Wuhan University (China). Participants were recruited from the lab’s standard subject pool, which is managed using the Weikeyan (Ancademy) platform. We focused here on treatments that used pen and paper and were thus directly related to the study in the UK. Additional treatments are discussed elsewhere [31]. We set B = RMB 2 (Chinese yuan). A total of 77 subjects took part in the pen-and-paper treatments, with an average payment of RMB 28, including an average supplementary payment of RMB 16.5 (including an RMB 5 participation payment) and an equality-equivalent task (RMB 11.5). There were 39 subjects in the mutual-gain treatment and 38 in the constant-sum treatment.12 The Chinese study replicated the UK study in all respects except being conducted in a computer lab (using pen and paper) rather than a classroom.13
Our experiment allowed us to explore two basic hypotheses: (1) There is no aversion to telling a partial/full Pareto white lie. (2) Willingness to tell a Pareto white lie is similar to that of telling a selfish lie. We were also able to compare behavior between the UK and China. To perform a power analysis of sample size, Hypothesis 1 can be tested by comparing the observed distribution to that of the unbiased binomial distribution. Let p denote the probability of a subject reporting a correct guess. If there is no aversion to telling a Pareto white lie, then we should observe . If there is full honesty, then we observe . A reasonable test of the extent of lie aversion is, thus, to compare with . The power of a binomial test to distinguish from with 30 subjects has power 0.974.14 A sample size of 30 should, therefore, be sufficient to distinguish between little or strong aversion to telling a Pareto white lie.
Hypothesis 2 can be tested by comparing the observed distribution with mutual gain to that with constant sum. Again, the binomial test can be used, and a sample size of 30 should be sufficient to distinguish a large difference between aversion to telling a selfish lie () and a Pareto white lie (). Equivalently, we can perform a test for equality of means. If we want to test a mean of 6 out of 10 versus 9 out of 10, then the power with a sample size of 30 is 0.99. To test a mean of 6 versus 8 has a power of 0.81. A sample size of 30 per treatment should also, therefore, be sufficient to distinguish between little aversion to telling a Pareto white lie and strong aversion to telling a selfish lie. If the differences between the mutual-gain and constant-sum settings are more subtle, then power decreases considerably. Our primary interest, however, is to test for ’big’ shifts in willingness to tell a Pareto white lie compared to a selfish lie.
We highlight that our objective, as encapsulated in Hypotheses 1 and 2, is to study Pareto white lies. This can be measured by high reported personal payoff in the mutual-gain treatment. There are alternative forms that lying may take. For instance, someone could make up marks without tossing a coin, or they could engineer a particular outcome, such as an equal payoff in the constant-sum game. While our experiment (as is standard) is not designed to study individual lying, we can obtain some insight into these issues by looking at the randomness of the 10 marks.15 We consider two tests of randomness. One test of randomness is to look at the number of runs in the sequence of 10 marks.16 A low or high number of runs (1, 2, 9, or 10) is unlikely with honest reporting, and is thus a signal of potential dishonesty [32]. Second, we look at whether there are any discernible trends in the reporting of personal payoff in the sequence of 10 marks. Evidence of a tendency for personal payoff to systematically increase or decrease during the sequence would also suggest dishonesty.
4.2. Experimental Results
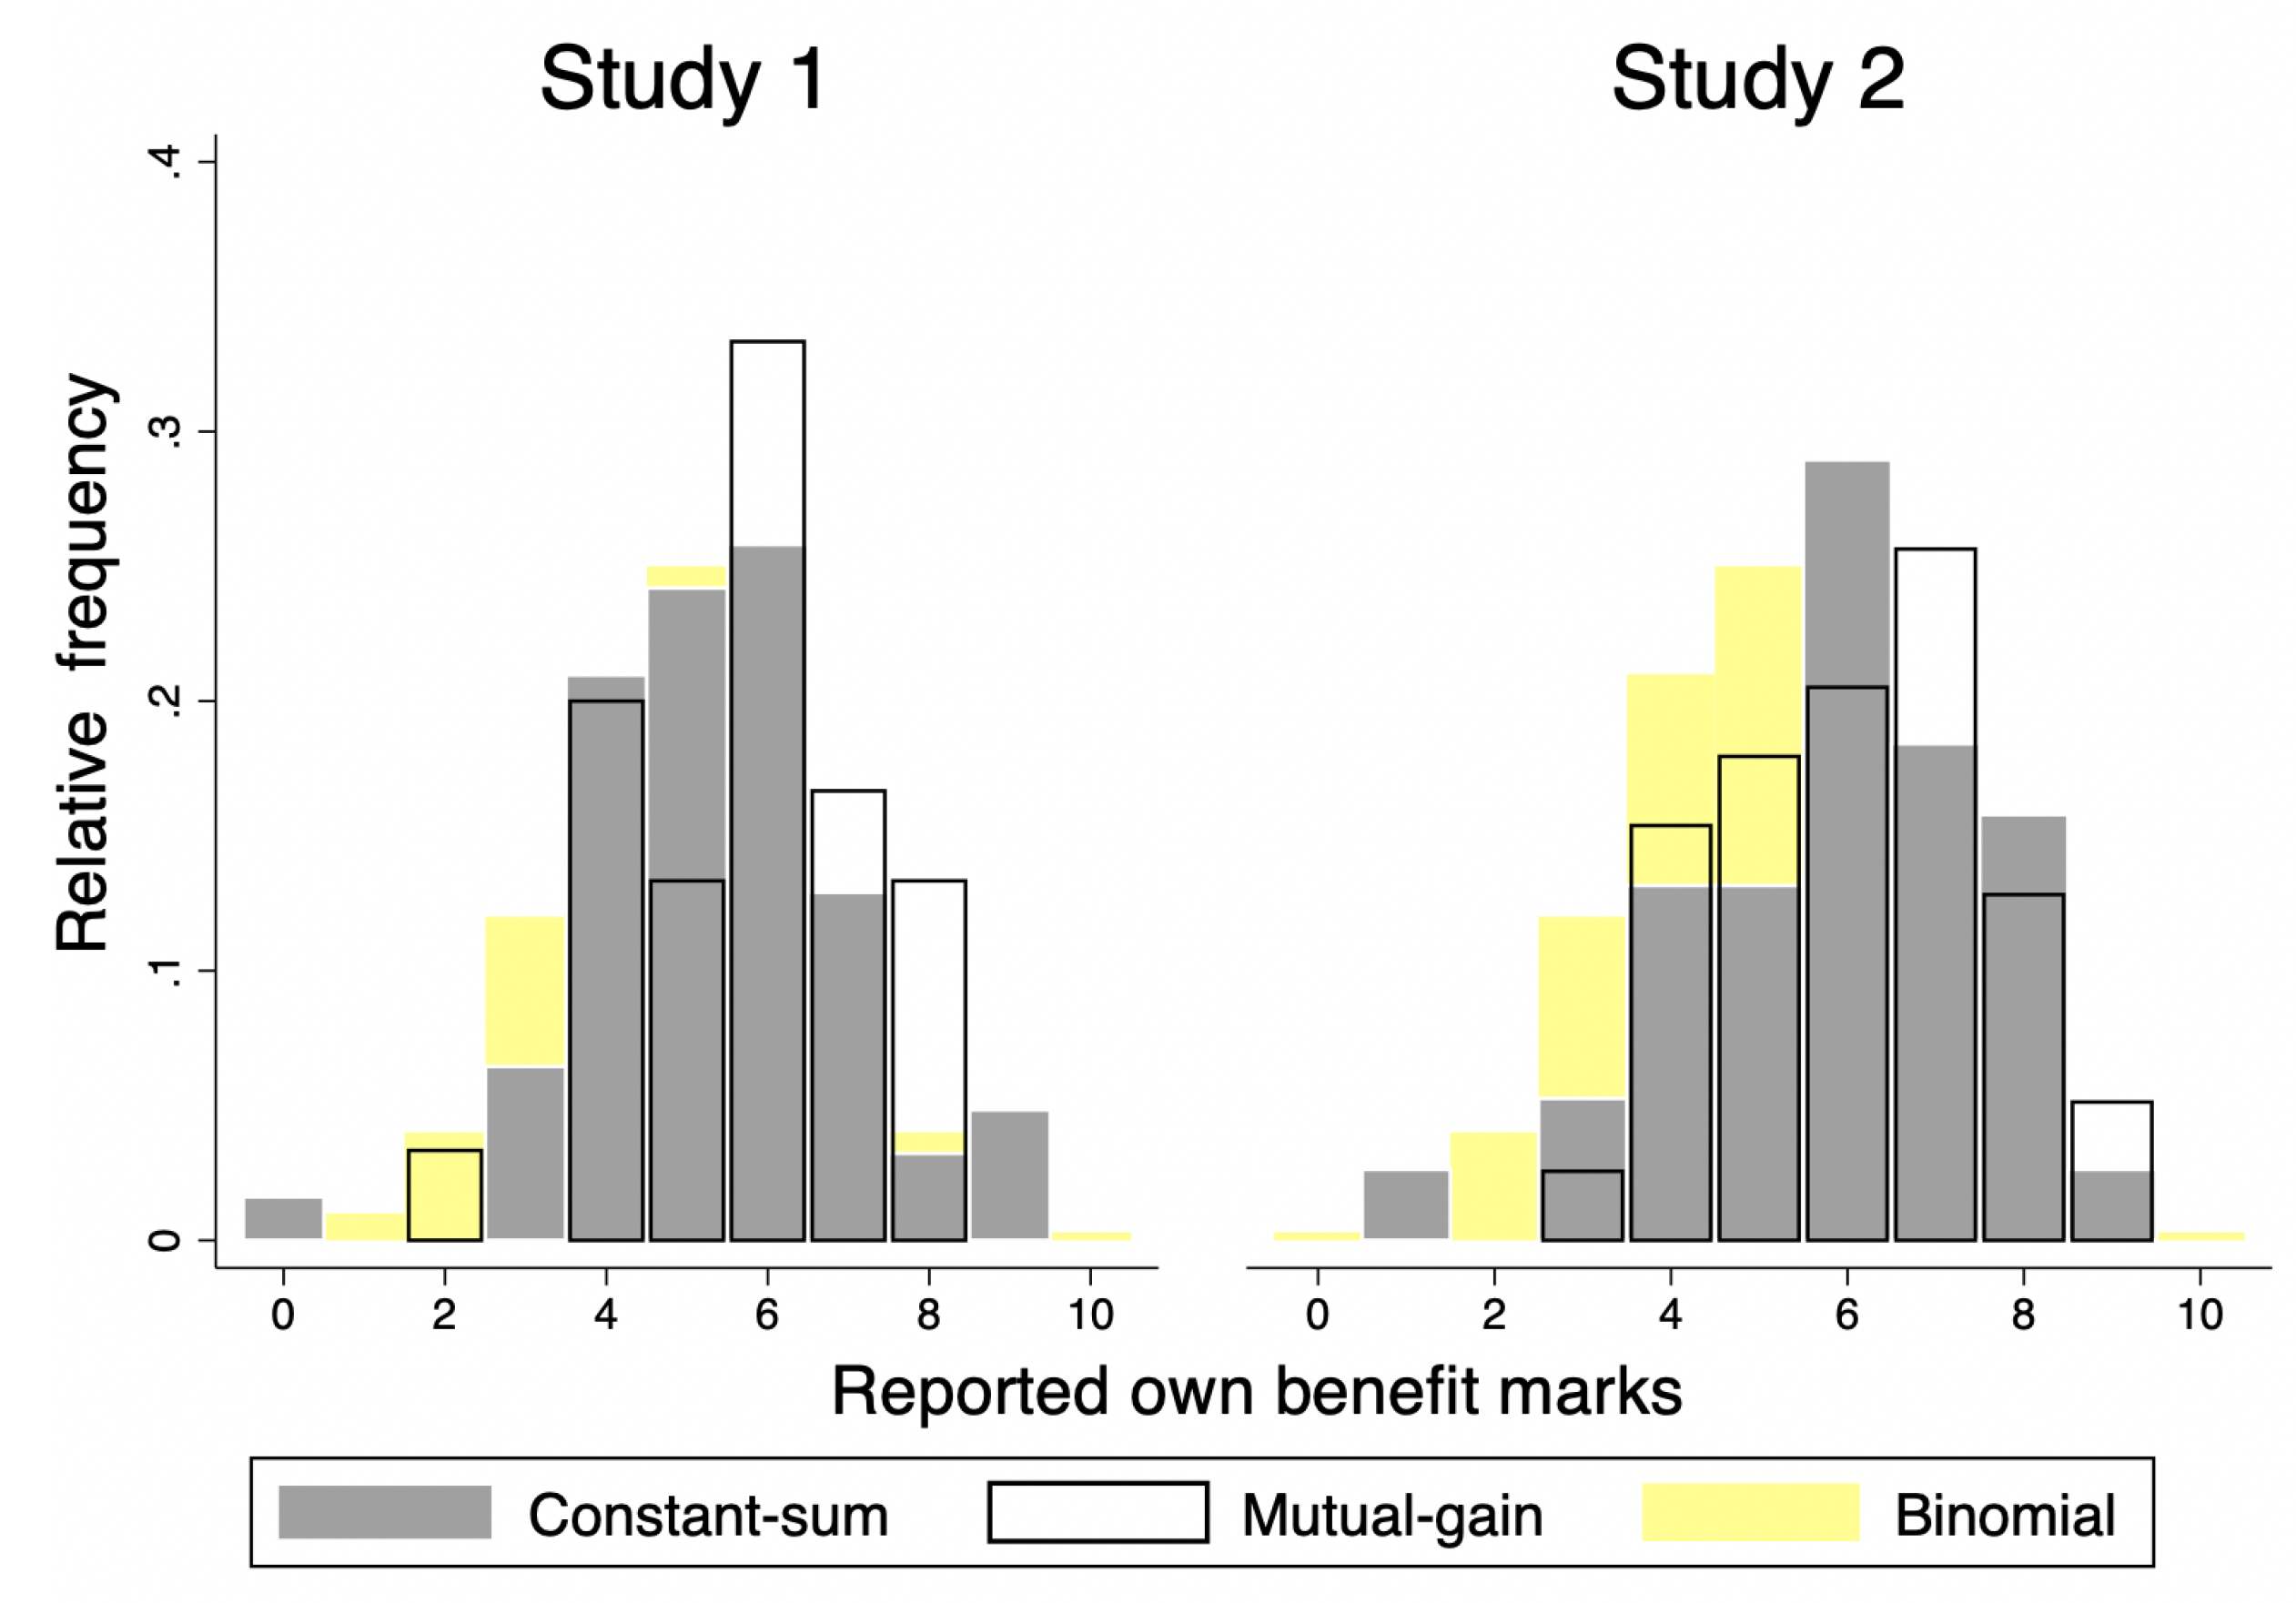
Given that the only payoff-relevant choices are made by markers, we focus exclusively on the behavior of markers in our analysis. To ease readability, marks that result in a positive personal payoff, i.e., correct guess in the mutual-gain game and incorrect guess in the constant-sum game, are defined as ‘personal benefit marks’. Reporting a personal benefit mark higher than or equal to 8 is defined as an ‘unlikely high’ report; this is a report that benefits the marker consistently with a Pareto white lie (mutual gain) or selfish black lie (constant sum). Reporting lower or equal to 3 is defined as a ‘low report’; to not make such a report benefits the marker. Table 10 shows the frequency of personal benefit marks and the proportion of unlikely high and low reports by treatment. Details of the distributions can be seen in Figure 3 below and Table A1 in the Appendix A. In Table 10, we also report the proportion of unlikely runs, and in Table A2, we report the full distribution of runs. For comparison, we also provide outcomes with some benchmark predictions that we will discuss in detail shortly.
Consider Hypothesis 1. From the results in Table 10 and Figure 3, it is clear that we see aversion to full lying. Indeed, there was no subject in either the UK or China that lied to the fullest extent. We do, though, observe dishonesty. Specifically, the observed mean reports in both Study 1 and Study 2 are statistically unlikely to have happened with fully honest reporting ( Study 1, Study 2, comparison to binomial distribution). In both studies, the distribution of personal-benefit marks in the mutual-gain treatment is skewed left compared with the honest binomial distribution (as seen in Figure 3). This is consistent with partial lying.17
In Table 10, we propose four models that are broadly consistent with the data: (i) , meaning that all subjects have a slight bias toward reporting personal benefit marks; (ii) half , meaning that half of the subjects are honest and half have a slightly larger bias toward report personal benefit marks; (iii) add one, meaning that all subjects add one personal benefit mark to an honest report; (iv) half add two, meaning that half of the subjects are honest, while half add two personal benefits marks.18 It is not possible (even with a much larger data set) to confidently distinguish between these four models because they heavily overlap. All of them, though, point to significant aversion to telling anything other than a ‘small’ Pareto white lie. Given the heterogeneous behavior observed in other studies [10,11,18], we suggest a mix of full honesty and partial lie aversion, where subjects differ in the size of partial lies.
In evaluating Hypothesis 2, our key finding is to report little difference between the mutual-gain and constant-sum games. The mean report is higher in the mutual-gain treatments than in the constant-sum treatments in both Study 1 and Study 2, but the difference is not statistically significant ( for Studies 1 and 2, Mann–Whitney test and Epps–Singleton two-sample test). Similarly, the skewness of the mutual-gain treatment is slightly stronger than in the constant-sum treatment; however, the distribution is not statistically significantly different ( for Studies 1 and 2, Fisher’s exact test). There is no significant difference in the distribution of runs in the sequence (, Mann–Whitney test). With a larger sample size, the difference we observe may well become statistically significant, and so we would not strongly argue that there is no difference. Our results do allow us, however, to confidently rule out a large difference (in economic terms) between the mutual-gain and constant-sum treatments. This finding may be sensitive to the communication media, with evidence of significant difference when using a desktop computer (as opposed to pen and paper) [31]. Even here, however, the difference is not particularly large (in an economic sense), and considerable aversion to telling a full Pareto white lie remains. Our studies suggest, therefore, no large increase in willingness to tell a Pareto white lie as opposed to a selfish lie.
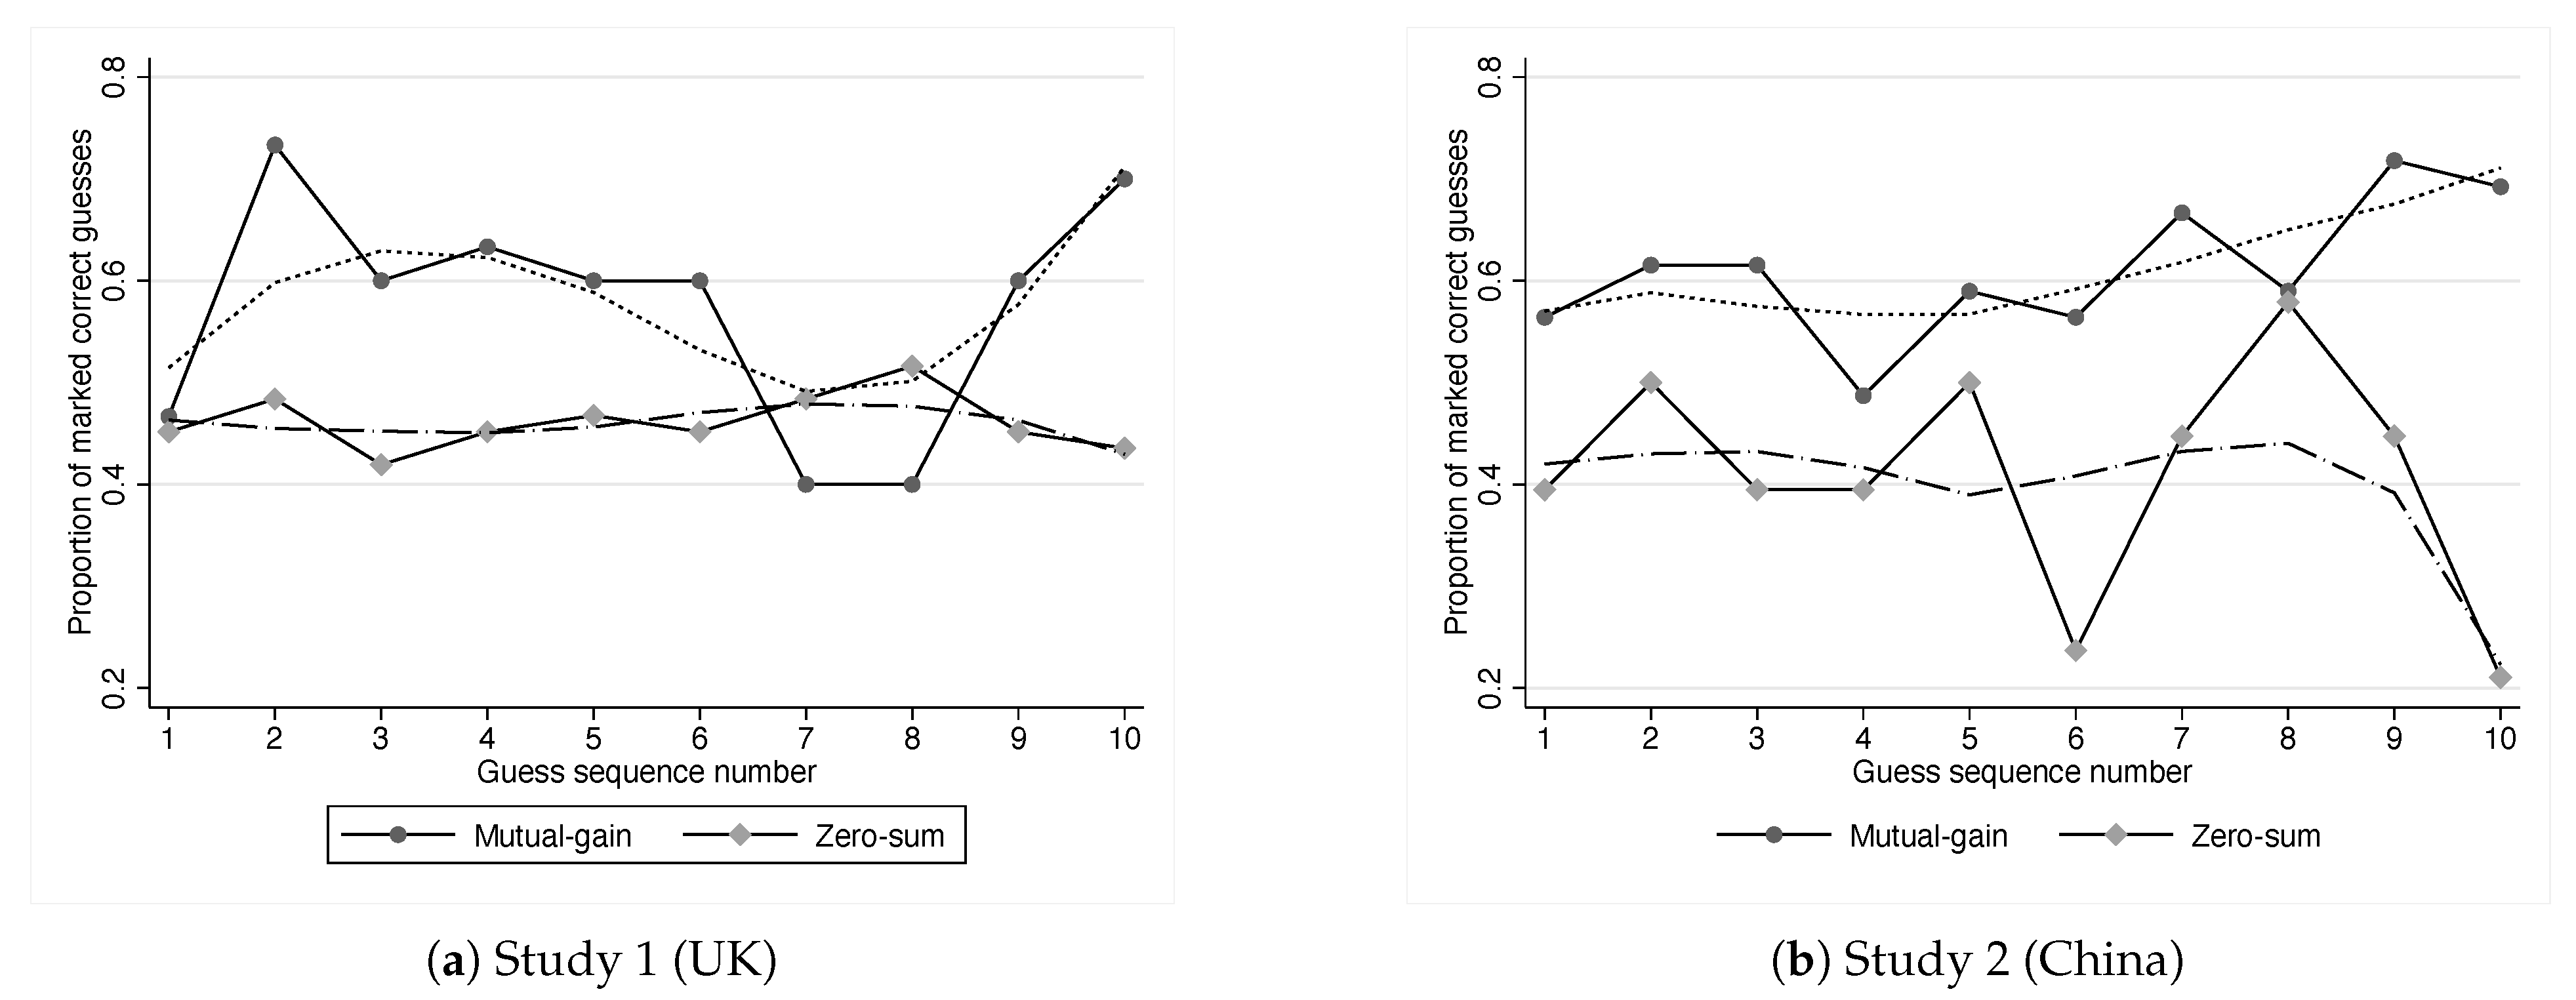
We look next for any trends in reporting of personal payoff during the sequence of 10 marks. Plausibly, as subjects fill in the guess sheet (see Figure 2), they may start off by reporting honestly and then begin to lie as they realize that their payoff (or that of the marker) will be particularly low or high. This would generate partial lying. In Figure 4, we report the proportion of correct guesses (positive personal payoff in mutual gain and zero payoff in constant sum) by the ordering of the marks. In Study 1, there is no evidence of a dynamic effect. In Study 2, there is some evidence of an increasing trend in both the mutual-gain and constant-sum treatments toward reporting personal payoff marks. This trend is, however, only marginally significant (, logit regression with robust standard error clustered at the subject level). Another possibility is that inequality-averse subjects may ‘fix’ outcomes in the constant-sum treatment to have payoffs of five each. Such subjects would, however, inflate payoffs above five in the mutual-gain treatment, and we do not see that. We do not, therefore, find any compelling evidence of dishonesty changing with repetition of the task.
We finish the analysis with the UK–China comparison. As one can see in Table 10, reported personal payoffs are higher in China compared to the UK, suggesting more dishonesty. This effect is significant if we compare overall reported payoffs (, Mann–Whitney), but there is only a marginally statistically significant effect if we just look at the constant sum (, Mann–Whitney) and no effect if we focus on the mutual-gain (, Mann–Whitney). The evidence for increased dishonesty in China is, therefore, inconclusive. However, we highlight that our results are in line with prior cross-cultural studies that find slightly higher levels of dishonesty in China than in the UK [29,33].19 One important thing that we take from the UK–China comparison is that our results seem robust. In particular, the results we obtained in the UK—which surprised us in terms of the apparent aversion to telling a full Pareto white lie—were replicated almost exactly in China. In China, we see broadly similar levels of aversion to telling a Pareto white lie and also see no greater willingness to tell a Pareto white lie than a selfish lie.
5. Conclusions
Huge advances have been made in recent years in modeling and measuring lie aversion [2,3]. The focus, however, has been on selfish lies—where an individual lies to benefit themselves. In this paper, we looked at the evidence on white lies—where an individual lies to benefit another. We reviewed the existing evidence and then provided some new experimental data. In terms of prior evidence, despite a flurry of widely cited papers around 2011–2013 [1,5,10], there have been surprisingly few studies since. This is not because ‘questions have been answered’. As we have seen, there are significant differences in findings across studies. Going forward, it would be desirable to have studies that systematically vary factors—e.g., whether subjects lie to another subject or the experimenter—to try to disentangle why we observe these differences. In this paper, we take the different approach of proposing a new experimental protocol that is flexible and combines desirable features from existing studies.
The two key questions we explored in this paper are: (1) Are people averse to telling a Pareto white lie, and (2) are people more willing to tell a Pareto white lie than a selfish lie? In our study, we find considerable aversion to telling a full Pareto white lie, although there is evidence of willingness to tell a partial Pareto white lie. This finding is in line with related results using real effort tasks [1,10,11]. We also find no large difference in willingness to tell a Pareto white lie compared to a selfish lie. While this finding is more at odds with prior results from real effort tasks, it is not far out. Specifically, Rosaz and Villeval (2012) [11], like us, see no difference in willingness to tell a Pareto white lie, while Wiltermuth (2011) [10] observe a difference of around 10–20%. Gino et al. (2013) [1] find a larger difference.
Going forward, we would suggest more studies using experiment protocols like our own and those of real effort tasks (e.g., [11]), in which there is a direct interaction between a ‘worker’ and ‘supervisor’. In our experiment, we had a ‘guesser’ guessing the outcome of a coin flip and then a ‘marker’ marking outcomes. This protocol creates a direct interaction and transparent payoff interdependence between subjects without introducing the strategic complications that arise in sender–receiver games [7] or relying on a very artificial environment, as in payoff distribution games [14]. We also suggest that more work is needed to compare the full classification of lies discussed in Section 2, comparing, for instance, Pareto white lies with selfish neutral lies, altruistic neutral lies, selfish black lies, etc. This may prove useful in picking apart the connection between social preferences and lie aversion. Various studies have suggested that ‘altruistic’ individuals may be averse to lying, but with subtle effects depending on the nature of payoff interdependence [14,25,34]. There is much to do, therefore, in picking apart why individuals (including ‘altruists’) appear averse to telling a Pareto white lie.
Author Contributions
E.C. and C.B. designed and implemented Study 1 and analysed the data. L.X. implemented Study 2 and analysed the data. E.C. surveyed the literature. E.C. and L.X. wrote the manuscript. All authors have read and agreed to the published version of the manuscript.
Funding
This research was partly funded by National Science Foundation China (NSFC) grant number: 71903147.
Conflicts of Interest
The authors declare no conflict of interest.
Appendix A. Full Distributionof Data
Table A1.
Distribution of frequency of personal benefit marks by treatment.
| Study 1 (UK) | Study 2 (China) | |||||
|---|---|---|---|---|---|---|
| Mutual Gain | Constant Sum | Constant Sum | Mutual Gain | Constant-Sum | ||
| Frequency | Same Room | Diff Room | Total | |||
| 0 | 0 | 1 | 0 | 0 | 0 | 1 |
| 1 | 0 | 0 | 0 | 0 | 1 | 1 |
| 2 | 1 | 0 | 0 | 0 | 0 | 1 |
| 3 | 0 | 2 | 2 | 1 | 2 | 7 |
| 4 | 6 | 7 | 6 | 6 | 5 | 30 |
| 5 | 4 | 7 | 8 | 7 | 5 | 31 |
| 6 | 10 | 9 | 7 | 8 | 11 | 45 |
| 7 | 5 | 2 | 6 | 10 | 7 | 30 |
| 8 | 4 | 2 | 0 | 5 | 6 | 17 |
| 9 | 0 | 2 | 1 | 2 | 1 | 6 |
| Total | 30 | 32 | 30 | 39 | 38 | 169 |
Table A2.
Distribution of numbers of runs in sequences of 10 marks by treatment.
| Study 1 (UK) | Study 2 (China) | |||||
|---|---|---|---|---|---|---|
| Mutual Gain | Constant Sum | Constant Sum | Mutual Gain | Constant Sum | ||
| No. of Runs | Honest | Same Room | Diff Room | |||
| 1 | 0.2 | 0 | 1 | 0 | 0 | 0 |
| 2 | 1.8 | 1 | 2 | 1 | 0 | 2 |
| 3 | 7.0 | 2 | 0 | 4 | 6 | 3 |
| 4 | 16.4 | 4 | 9 | 3 | 4 | 5 |
| 5 | 24.6 | 7 | 6 | 8 | 13 | 11 |
| 6 | 24.6 | 8 | 8 | 5 | 8 | 6 |
| 7 | 16.4 | 5 | 4 | 8 | 5 | 6 |
| 8 | 7.0 | 2 | 2 | 1 | 2 | 3 |
| 9 | 1.8 | 1 | 0 | 0 | 1 | 2 |
| 10 | 0.2 | 0 | 0 | 0 | 0 | 0 |
| Total | 30 | 32 | 30 | 39 | 38 | |
Appendix B. Experimental Instructions
Thank you for agreeing to take part in this experiment based on economic decision-making. Below are the instructions for carrying out the experiment; please read through them carefully and do not communicate with any of the other participants. If you have any questions, please ask one of the experimenters.
You have been paired with another participant in this room. [in a different room.] 20
This part of the experiment consists of two tasks. In the first task, you will be a “Guesser” and the other participant will be a “Marker”. In the second task, you will be a “Marker” and the other participant will be a “Guesser”.
Task of the Guesser:
- You have been given an answer sheet.21 In the column marked HEADS or TAILS, you must write HEADS or TAILS for each of the 10 guesses.
- You can guess whatever you like for each guess, but please write clearly.
- Once you have made your ten guesses, the sheet will be passed on to the Marker.
Task of the Marker:
- You will receive the answer sheet of the Guesser.
- You need to flip a coin 10 times and record whether the Guesser correctly guessed the flip of each coin. You should record this on the answer sheet in the column provided.
- The payoff that you and the Guesser receive is then determined as detailed on the answer sheet. Please fill in the columns for Guesser payoff and Marker payoff, recording the respective payoffs for each guess.
In each task, you will get the total corresponding earnings from the 10 guesses.
At the end of the experiment, one of the tasks will be randomly selected to determine your final payoff.
Once you have read through and understood the instructions, please wait for your experimenter for further instructions. If you have any questions, then please raise your hand and wait for someone to come to you.
References
- Gino, F.; Ayal, S.; Ariely, D. Self-serving altruism? The lure of unethical actions that benefit others. J. Econ. Behav. Organ. 2013, 93, 285–292. [Google Scholar] [CrossRef] [PubMed] [Green Version]
- Abeler, J.; Nosenzo, D.; Raymond, C. Preferences for truth-telling. Econometrica 2019, 87, 1115–1153. [Google Scholar] [CrossRef] [Green Version]
- Gerlach, P.; Teodorescu, K.; Hertwig, R. The truth about lies: A meta-analysis on dishonest behavior. Psychol. Bull. 2019, 145, 1. [Google Scholar] [CrossRef] [PubMed]
- Jacobsen, C.; Fosgaard, T.R.; Pascual-Ezama, D. Why do we lie? A practical guide to the dishonesty literature. J. Econ. Surv. 2018, 32, 357–387. [Google Scholar] [CrossRef]
- Erat, S.; Gneezy, U. White lies. Manag. Sci. 2012, 58, 723–733. [Google Scholar] [CrossRef] [Green Version]
- Lightle, J.P. Harmful lie aversion and lie discovery in noisy expert advice games. J. Econ. Behav. Organ. 2013, 93, 347–362. [Google Scholar] [CrossRef]
- Vanberg, C. Who never tells a lie? Exp. Econ. 2017, 20, 448–459. [Google Scholar] [CrossRef]
- Ploner, M.; Regner, T. Self-image and moral balancing: An experimental analysis. J. Econ. Behav. Organ. 2013, 93, 374–383. [Google Scholar] [CrossRef] [Green Version]
- Cohn, A.; Fehr, E.; Maréchal, M.A. Business culture and dishonesty in the banking industry. Nature 2014, 516, 86. [Google Scholar] [CrossRef]
- Wiltermuth, S.S. Cheating more when the spoils are split. Organ. Behav. Hum. Decis. Process. 2011, 115, 157–168. [Google Scholar] [CrossRef]
- Rosaz, J.; Villeval, M.C. Lies and biased evaluation: A real-effort experiment. J. Econ. Behav. Organ. 2012, 84, 537–549. [Google Scholar] [CrossRef]
- Cappelen, A.W.; Sorensen, E.O.; Tungodden, B. When do we lie? J. Econ. Behav. Organ. 2013, 93, 258–265. [Google Scholar] [CrossRef]
- Conrads, J.; Irlenbusch, B.; Rilke, R.M.; Walkowitz, G. Lying and team incentives. J. Econ. Psychol. 2013, 34, 1–7. [Google Scholar] [CrossRef] [Green Version]
- Biziou-van-Pol, L.; Haenen, J.; Novaro, A.; Occhipinti Liberman, A.; Capraro, V. Does telling white lies signal pro-social preferences? Judgm. Decis. Mak. 2015, 10, 538–548. [Google Scholar]
- Weisel, O.; Shalvi, S. The collaborative roots of corruption. Proc. Natl. Acad. Sci. USA 2015, 112, 10651–10656. [Google Scholar] [CrossRef] [Green Version]
- Glätzle-Rützler, D.; Lergetporer, P. Lying and age: An experimental study. J. Econ. Psychol. 2015, 46, 12–25. [Google Scholar] [CrossRef]
- Wouda, J.; Bijlstra, G.; Frankenhuis, W.E.; Wigboldus, D.H. The Collaborative Roots of Corruption? A Replication of Weisel & Shalvi (2015). Collabra Psychol. 2017, 3, 27. [Google Scholar]
- Fischbacher, U.; Föllmi-Heusi, F. Lies in disguise—An experimental study on cheating. J. Eur. Econ. Assoc. 2013, 11, 525–547. [Google Scholar] [CrossRef] [Green Version]
- Mazar, N.; Amir, O.; Ariely, D. The dishonesty of honest people: A theory of self-concept maintenance. J. Mark. Res. 2008, 45, 633–644. [Google Scholar] [CrossRef] [Green Version]
- Faravelli, M.; Friesen, L.; Gangadharan, L. Selection, tournaments, and dishonesty. J. Econ. Behav. Organ. 2015, 110, 160–175. [Google Scholar] [CrossRef] [Green Version]
- Rigdon, M.L.; D’Esterre, A.P. The effects of competition on the nature of cheating behavior. South. Econ. J. 2015, 81, 1012–1024. [Google Scholar]
- Gneezy, U.; Kajackaite, A.; Sobel, J. Lying Aversion and the Size of the Lie. Am. Econ. Rev. 2018, 108, 419–453. [Google Scholar] [CrossRef] [Green Version]
- Gneezy, U. Deception: The role of consequences. Am. Econ. Rev. 2005, 95, 384–394. [Google Scholar] [CrossRef] [Green Version]
- Hurkens, S.; Kartik, N. Would I lie to you? On social preferences and lying aversion. Exp. Econ. 2009, 12, 180–192. [Google Scholar] [CrossRef] [Green Version]
- Kerschbamer, R.; Neururer, D.; Gruber, A. Do altruists lie less? J. Econ. Behav. Organ. 2019, 157, 560–579. [Google Scholar] [CrossRef]
- Sutter, M. Deception through telling the truth?! Experimental evidence from individuals and teams. Econ. J. 2009, 119, 47–60. [Google Scholar] [CrossRef] [Green Version]
- Capraro, V. Does the truth come naturally? Time pressure increases honesty in one-shot deception games. Econ. Lett. 2017, 158, 54–57. [Google Scholar] [CrossRef] [Green Version]
- Capraro, V.; Schulz, J.; Rand, D.G. Time pressure and honesty in a deception game. J. Behav. Exp. Econ. 2019, 79, 93–99. [Google Scholar] [CrossRef] [Green Version]
- Hugh-Jones, D. Honesty, beliefs about honesty, and economic growth in 15 countries. J. Econ. Behav. Organ. 2016, 127, 99–114. [Google Scholar] [CrossRef] [Green Version]
- Bucciol, A.; Piovesan, M. Luck or cheating? A field experiment on honesty with children. J. Econ. Psychol. 2011, 32, 73–78. [Google Scholar] [CrossRef] [Green Version]
- Cartwright, E.; Xue, L. Lie Aversion, Anonymity and Social Distance: Are People More Willing to Lie Using a Mobile Phone? Elsevier: Amsterdam, The Netherlands. [CrossRef]
- Doğanaksoy, A.; Sulak, F.; Uğuz, M.; Şeker, O.; Akcengiz, Z. New statistical randomness tests based on length of runs. Math. Probl. Eng. 2015, 2015, 626408. [Google Scholar] [CrossRef] [Green Version]
- Gächter, S.; Schulz, J.F. Intrinsic honesty and the prevalence of rule violations across societies. Nature 2016, 531, 496–499. [Google Scholar] [CrossRef] [PubMed] [Green Version]
- Maggian, V.; Villeval, M.C. Social preferences and lying aversion in children. Exp. Econ. 2016, 19, 663–685. [Google Scholar] [CrossRef] [Green Version]
| 1. | These studies and, therefore, the results will be discussed in more detail below. The findings we report in Table 1 are consistent with those reported in the respective papers. |
| 2. | Potentially, one could reserve ‘lie’ for contexts in which Alice lies to Brian, rather than one in which Alice lies to the experimenter in a way that influences Brian. The use of ‘lie’ and ‘cheat’ appears, however, to be more split down subject boundaries, with ‘lie’ being the norm in economics. This is potentially because ‘cheat’ can include a much wider set of actions than lying. |
| 3. | While it is not our focus here, we remark that there are a few studies that have compared selfish lies in a setting with no interaction to that with interaction [1,10]. For instance, Faravelli et al. (2015) [20] and Rigdon and D’Esterre (2015) [21] compare dishonesty in a real effort task with a piece rate—USD 1 per task solved—with a competition, USD 2 per task solved if reporting higher than the competitor, and USD 0 otherwise. |
| 4. | |
| 5. | In the base treatment, senders are asked to spend 5 min writing about the city of Bergen, Norway; in the personal treatment, they are asked to write about the number revealed in the sender–receiver game; in the intuition treatment, they are asked to write about when they had benefited from trusting their intuition; and in the market treatment, they are asked to write about when they had benefited from buying or selling a good or service. |
| 6. | Recall that in the baseline setting, the receiver has no knowledge of payoffs and incentives at all. |
| 7. | In the ‘friend’ treatment, a designated friend benefited. In the ‘prejudiced’, treatment the person who would benefit had expressed racist attitudes. |
| 8. | Each subject had a unique matrix to solve, meaning that answer sheets, while seeming anonymous, could be checked. |
| 9. | This is primarily driven by the supervisor reporting a high output as medium. |
| 10. | For example, if subject 1 was randomly chosen to be paid as the guesser and subject 2 marked their sheet, then subject 2 was paid as the marker. |
| 11. | In all treatments, subjects were registered by one experimenter upon arrival and then directed by another experimenter to one of two adjacent rooms. Hence, all treatments were identical in this regard. They only differed in whether the partner was in the same or different room. |
| 12. | Records of three subjects in Study 2 (one in mutual-gain and two in constant-sum) were invalid due to incorrect answers in the reported “Guesser payoff” and “Marker payoff” in the guess sheet, and were thus were removed from the analysis. |
| 13. | Both studies involved students with a similar age demographic, 18–25. Study 1 included primarily economics students. Study 2 had a wider spread of students, although economics was still modal. |
| 14. | Power calculated using Matlab pwrout function. |
| 15. | |
| 16. | For example, the sequence where 1 indicates correct and 0 incorrect has 6 runs—(0,0), (1,1), (0), (1), (0,0,0), (1). |
| 17. | In Study 1, the same-room and different-room treatments are combined because we observed no significant differences between them ( Fisher’s exact test, Mann–Whitney test). In Table 10, one can observe that the proportion of unlikely high is higher in the same room condition. The exact distribution, however, shows a less dramatic difference. In the same room condition, there two subjects that reported seven, two that reported eight, and two that reported nine. In the different-room condition, there were six subjects that reported seven and one that reported nine. Similarly, if we look at the distribution of runs in the reported sequence, there is no evidence of lying to the fullest extent (the proportion with 1, 2, 9, and 10 runs is low), but the distribution of runs (particularly in China) suggests partial dishonesty (with an unlikely number of five runs). |
| 18. | For instance, in ‘half add two’, the observed means are not unexpected ( Study 1, Study 2, boot-strapped p values). |
| 19. | The meta-analysis of Abeler et al. (2019) finds that average dishonesty in China is slightly less than that in the UK—see http://www.preferencesfortruthtelling.com/index for the full details. This, however, is to compare studies that potentially differ across multiple dimensions. |
| 20. | Experimental protocols between the constant-sum same-room treatment and constant-sum different-room treatment were kept as close as possible. In both treatments, subjects registered their experimental identity, drew a random seat number upon arrival outside the main experimental lab, and followed another experimenter to one or two different rooms depending on the treatment. |
| 21. | An example of an answer sheet can be seen in Figure 2 (constant-sum treatment). The mutual-gain treatment differs only in the payoff table at the top. |
Figure 1.
Payoffs in the sender–receiver game.

Figure 2.
An example of a guess sheet.

Figure 3.
Distribution of personal benefit marks.

Figure 4.
Average proportion of correct guesses by sequence of guesses.

Table 2.
Results in the sender–receiver game.
| Source | c | n | Proportion of Lies | No. Subjects | ||||
|---|---|---|---|---|---|---|---|---|
| Pareto white lie | ||||||||
| Study 1 [5] | 20 | 20 | 10 | 10 | 0 | 6 | 102 | |
| Study 2 [5] | 20 | 20 | 10 | 10 | 0 | 6 | 58 | |
| Base treatment [12] | 20 | 20 | 10 | 10 | 2 | 6 | 68 | |
| Personal treatment [12] | 20 | 20 | 10 | 10 | 2 | 6 | 67 | |
| Intuition treatment [12] | 20 | 20 | 10 | 10 | 2 | 6 | 69 | |
| Market treatment [12] | 20 | 20 | 10 | 10 | 2 | 6 | 65 | |
| Replication [7] | 20 | 20 | 10 | 10 | 2 | 6 | 106 | |
| Common knowledge [7] | 20 | 20 | 10 | 10 | 2 | 6 | 36 | |
| Receiver message [7] | 20 | 20 | 10 | 10 | 2 | 6 | 40 | |
| Study 1 [5] | 20 | 20 | 1 | 10 | 0 | 6 | 101 | |
| Study 2 [5] | 20 | 20 | 1 | 10 | 0 | 6 | 58 | |
| Teenagers [16] | 20 | 20 | 10 | 0 | 6 | 383 | ||
| Altruistic white lie | ||||||||
| Study 1 [5] | 20 | 20 | 10 | 0 | 6 | 101 | ||
| Study 2 [5] | 20 | 20 | 10 | 0 | 6 | 58 | ||
| Teenagers [16] | 20 | 20 | 10 | 0 | 6 | 383 | ||
| Selfish neutral lie | ||||||||
| Study 1 [5] | 20 | 20 | 10 | 0 | 0 | 6 | 109 | |
| NEU [25] | 2 | 3 | 1 | 0 | 0 | 2 | 108 | |
| Teenagers [16] | 20 | 20 | 0 | 0 | 6 | 383 | ||
| Selfish lie | ||||||||
| Study 1 [5] | 20 | 20 | 1 | 0 | 6 | 104 | ||
| Study 2 [5] | 20 | 20 | 1 | 0 | 6 | 58 | ||
| NEG [25] | 2 | 3 | 1 | 0 | 2 | 104 | ||
| Teenagers [16] | 20 | 20 | 1 | 0 | 6 | 383 |
Table 3.
Results in distribution games.
| Source | Payoff Distribution | Proportion of Lies | No. Subjects | |
|---|---|---|---|---|
| Truth | Lie | |||
| Altruistic white lie [14] | 10, 10 | 614 | ||
| Pareto white lie [14] | 598 | |||
| Time pressure [27] | 497 | |||
| Time delay [27] | 516 | |||
| Time pressure own group [28] | ≈350 | |||
| Time pressure other group [28] | ≈350 | |||
| Time delay own group [28] | ≈350 | |||
| Time delay other group [28] | ≈350 | |||
Table 4.
Results from the dictator game experiment of Ploner and Regner (2013) [8]. Estimated proportion of lies in the dictator game and control treatments.
Table 4.
Results from the dictator game experiment of Ploner and Regner (2013) [8]. Estimated proportion of lies in the dictator game and control treatments.
| Preceding Experiment | Dictator Game | Control | No. Subjects |
|---|---|---|---|
| None | 128 | ||
| Philanthropy | 128 | ||
| Public good game | 64 |
Table 5.
Results from the die-roll experiment of Weisel and Shavli (2015) [15] and a further replication study [17]. This details the mean number of matches out of 20 and the proportion of brazen subjects (who match on all 20 replications).
| Treatment | Alice Payoff | Mean Matches | Brazen (%) | No. Subjects |
|---|---|---|---|---|
| Pareto white lie | ||||
| Baseline | EUR 1–6 if match | 20 | ||
| B High | EUR 6 if match | 20 | ||
| B Low | EUR 1 if match | 20 | ||
| A High | EUR 1–6 if match | 20 | ||
| A low | EUR 1–6 if match | 20 | ||
| Replication | GBP 1–6 if match | 20 | ||
| Multiplication | GBP 2–6 if match | 20 | ||
| Addition | GBP 3–8 if match | 20 | ||
| Replication 2 [17] | EUR 0.25–1.50 if match | 20 | ||
| Low behavioural norm [17] | EUR 0.25–1.50 if match | 20 | ||
| High behavioural norm [17] | EUR 0.25–1.50 if match | 20 | ||
| Altruistic neutral lie | ||||
| B fixed | EUR 1 regardless | 20 | ||
| B fixed replication | GBP 1 regardless | 20 | ||
| B fixed multiplication | GBP 2 regardless | 20 | ||
| B fixed addition | GBP 3 regardless | 20 | ||
| Selfish neutral lie | ||||
| A fixed | EUR 1–6 if match | 20 |
Table 6.
Results from self-reports of real effort tasks.
| Treatment | Own Payoff | Other Payoff | Cheated | No. Subjects |
|---|---|---|---|---|
| Study 2 [10] | ||||
| Self-alone low benefit | USD 1 per word | NA | 30 | |
| Self-alone high benefit | USD 2 per word | NA | 67 | |
| Self-and-friend benefit | USD 1 per word | USD 1 per word | 51 | |
| Self-and-other benefit | USD 1 per word | USD 1 per word | 60 | |
| Other-alone benefit | USD 0 per word | USD 2 per word | 49 | |
| Study 4 [10] | ||||
| Self-alone benefit | USD per word | NA | 69 | |
| Self-and-other benefit | USD per word | USD per word | 88 | |
| Self-and-prejudiced other | USD per word | USD per word | 60 | |
| Study 2 [1] | ||||
| Self-only high | USD 2 per matrix | NA | 36 | |
| Self-only low | USD 1 per matrix | NA | 35 | |
| Self-and-other | USD 1 per matrix | USD 1 per matrix | 36 | |
| Study 3 [1] | ||||
| Self-only high | USD 2 per problem | NA | 42 | |
| Self-and-other | USD 1 per problem | USD 1 per problem | 43 | |
| Other-only | USD 0 per problem | USD 1 per problem | 43 |
Table 7.
Results from real effort task [11].
Table 7.
Results from real effort task [11].
| Supervisor Report | ||||||
|---|---|---|---|---|---|---|
| Very Low | Low | Medium | High | Very High | ||
| Performance | Very low | 4 | 1 | 4 | 0 | 0 |
| Low | 0 | 20 | 25 | 0 | 2 | |
| Medium | 0 | 2 | 85 | 1 | 3 | |
| High | 0 | 0 | 24 | 22 | 9 | |
| Very high | 0 | 0 | 5 | 1 | 13 | |
| Payoff | Worker | 12 | 14 | 16 | 23 | 25 |
| Supervisor | 13 | 18 | 23 | 14 | 19 | |
Table 8.
Summary of experimental methods to measure aversion to Pareto white lies.
| Method | Interaction | Extent of Lying | Payoff Flexbility |
|---|---|---|---|
| Sender–receiver [5,12] | Alice reports to Brian | Binary | Good |
| Distribution game [14] | Alice chooses | Binary | Good |
| Dictator game [8] | Alice reports and allocates | Binary | None |
| Mutual die roll [15] | Brian reports and Alice reacts | Binary | Possible |
| Unscramble, matrix [1,10] | Alice effort and reports | Scale | Good |
| Worker–supervisor [11] | Brian effort Alice reports | Complex | Possible |
| Team performance [13] | Alice and Brian report | Scale | Possible |
Table 9.
Experimental design and numbers of subjects.
| Treatment | Marker Payoff | Guesser Payoff | Partner Location | Subjects | Female |
|---|---|---|---|---|---|
| Study 1 (UK) | |||||
| Mutual-gain | GBP per correct | GBP per correct | Same classroom | 30 | 14 |
| Constant-sum-same | GBP per wrong | GBP per correct | Same classroom | 32 | 19 |
| Constant-sum-different | GBP per wrong | GBP per correct | Different classroom | 30 | 15 |
| Study 2 (China) | |||||
| Mutual-gain | RMB 2 per correct | RMB 2 per correct | Same computer lab | 39 | 24 |
| Constant-sum | RMB 2 per wrong | RMB 2 per correct | Same computer lab | 38 | 19 |
Table 10.
Personal benefit marks, unlikely high/low reports and unlikely runs by treatment.
| Treatment | Mean | Median | High Report | Low Report | Unlikely Runs |
|---|---|---|---|---|---|
| Freq (Out of 10) | Proportion (8,9,10) | Proportion (0,1,2,3) | Proportion (1,2,9,10) | ||
| Study 1 (UK) | |||||
| Mutual gain | 5.77 | 6 | 13.3 | 3.33 | 6.7 |
| Constant sum, same room | 5.34 | 5 | 12.5 | 9.38 | 9.4 |
| Constant sum, different room | 5.43 | 6 | 3.3 | 6.67 | 3.3 |
| Study 2 (China) | |||||
| Mutual gain | 6.10 | 6 | 17.9 | 2.56 | 2.5 |
| Constant sum | 5.89 | 6 | 18.4 | 7.89 | 10.0 |
| Binomial benchmark | |||||
| Full honesty | 5 | 5 | |||
| 6 | 6 | ||||
| 7 | 7 | ||||
| Half | 6 | 6 | |||
| Add one | 6 | 6 | NA | ||
| Half add two | 6 | 6 | NA | ||
The table reports the average frequency of personal benefit marks out of 10 and the median in each treatment. The “High Report” column reports the proportion (%) of participants that report personal benefit marks greater than or equal to 8 in each treatment. The “Low Report” column reports the proportion of reports that are lower than or equal than 3. The “Unlikely Runs” column reports the proportion of unlikely numbers of runs (1,2,9, or 10).
Publisher’s Note: MDPI stays neutral with regard to jurisdictional claims in published maps and institutional affiliations. |
© 2020 by the authors. Licensee MDPI, Basel, Switzerland. This article is an open access article distributed under the terms and conditions of the Creative Commons Attribution (CC BY) license (http://creativecommons.org/licenses/by/4.0/).
Share and Cite
MDPI and ACS Style
Cartwright, E.; Xue, L.; Brown, C. Are People Willing to Tell Pareto White Lies? A Review and New Experimental Evidence. Games 2021, 12, 1. https://0-doi-org.brum.beds.ac.uk/10.3390/g12010001
AMA Style
Cartwright E, Xue L, Brown C. Are People Willing to Tell Pareto White Lies? A Review and New Experimental Evidence. Games. 2021; 12(1):1. https://0-doi-org.brum.beds.ac.uk/10.3390/g12010001
Chicago/Turabian StyleCartwright, Edward, Lian Xue, and Charlotte Brown. 2021. "Are People Willing to Tell Pareto White Lies? A Review and New Experimental Evidence" Games 12, no. 1: 1. https://0-doi-org.brum.beds.ac.uk/10.3390/g12010001
Note that from the first issue of 2016, this journal uses article numbers instead of page numbers. See further details here.