
Rock-Paper-Scissors Play: Beyond the Win-Stay/Lose-Change Strategy


1
School of Psychology, Central China Normal University, Wuhan 430079, China
2
Department of Social and Decision Sciences, Carnegie Mellon University, Pittsburgh, PA 15213, USA
3
EM Lyon Business School, GATE UMR 5824, F-69130 Ecully, France
*
Authors to whom correspondence should be addressed.
Games 2021, 12(3), 52; https://0-doi-org.brum.beds.ac.uk/10.3390/g12030052
Submission received: 30 April 2021
/
Revised: 24 May 2021
/
Accepted: 28 May 2021
/
Published: 22 June 2021
(This article belongs to the Special Issue Psychological Perspectives on Simple Games)
Abstract
:This research studied the strategies that players use in sequential adversarial games. We took the Rock-Paper-Scissors (RPS) game as an example and ran players in two experiments. The first experiment involved two humans, who played the RPS together for 100 times. Importantly, our payoff design in the RPS allowed us to differentiate between participants who used a random strategy from those who used a Nash strategy. We found that participants did not play in agreement with the Nash strategy, but rather, their behavior was closer to random. Moreover, the analyses of the participants’ sequential actions indicated heterogeneous cycle-based behaviors: some participants’ actions were independent of their past outcomes, some followed a well-known win-stay/lose-change strategy, and others exhibited the win-change/lose-stay behavior. To understand the sequential patterns of outcome-dependent actions, we designed probabilistic computer algorithms involving specific change actions (i.e., to downgrade or upgrade according to the immediate past outcome): the Win-Downgrade/Lose-Stay (WDLS) or Win-Stay/Lose-Upgrade (WSLU) strategies. Experiment 2 used these strategies against a human player. Our findings show that participants followed a win-stay strategy against the WDLS algorithm and a lose-change strategy against the WSLU algorithm, while they had difficulty in using an upgrade/downgrade direction, suggesting humans’ limited ability to detect and counter the actions of the algorithm. Taken together, our two experiments showed a large diversity of sequential strategies, where the win-stay/lose-change strategy did not describe the majority of human players’ dynamic behaviors in this adversarial situation.
1. Introduction
Almost everyone has settled disputes by playing a simple game called Rock-Paper-Scissors (RPS). The rule for winning a one-shot play of this game is simple: rock crushes scissors; scissors cuts paper; and paper covers rock. In addition to being a fun game to resolve disagreements, RPS is also used by game theorists and psychologists to study competitive behavior strategies in situations such as security, terrorism, and war [1]. Because rock can beat paper, but, at the same time, rock can be beaten by scissors, none of the selections (R, P, or S) is absolutely better than the other two. This feature makes RPS a unique research paradigm to study sequential adversarial strategies in repeated interactions.
Although the optimal strategy in this game is to play purely randomly, it is well known that humans have difficulty generating random sequences of actions (e.g., [2]). Instead, humans’ strategies have been categorized from a number of different perspectives (see [3], for a recent review). Some research has focused on a frequency-based strategy (e.g., [4]), i.e., the (over)play of one selection (R, P, or S), while other research has focused on sequential actions based on memories of past actions and outcomes (cycle-based and outcome-based strategies). These strategies include the “Win-Stay/Lose-Change” (WSLC) strategy, i.e., keep the same selection that resulted in a win in the previous trial and switch when the previous selection resulted in a loss (e.g., [5,6,7]). Furthermore, if players are willing to invest more cognitive resources to predict and even think “one-step-ahead”, players could collect contenders’ historical choice information (e.g., [8,9]) and utilize recursive thinking strategies (e.g., [10]). Together, players’ behavior might also reveal sequential dependence patterns that are related to their contenders’ behavior.
To comprehensively explore the strategies that players use in sequential adversarial games, we designed two experiments using the RPS game. In the first experiment, two human participants played the RPS repeatedly for 100 trials, using a novel payoff matrix to distinguish between playing randomly or in agreement with the Nash strategy and to study the adherence to WSLC strategy. A second experiment was designed to control for the strategy followed by one of the players by pairing a human with a bot that would use different algorithms. This experiment will help elucidate the conditions when strategies such as WSLC (or the reversed “win-change/lose-stay”) strategy is used.
1.1. Literature Review
The literature indicates that players in the RPS game are consistent with the Nash strategy, at least some of the time (e.g., [9]). However, this literature has frequently used a payoff matrix that cannot distinguish between Nash and random play, and strategies other than random have often been reported (e.g., [4]). Research also demonstrates that players have a preference for repeating specific sequential patterns. For example, Eyler et al. [4] noted that players tended to repeat choices consecutively (e.g., rock-rock-rock) or to cycle in a sequence (e.g., rock-paper-scissors). This “cycling” behavior includes attempts to “upgrade” (i.e., each choice beat the previous one such as rock-paper-scissors) or to downgrade (i.e., each choice was beaten by the previous one such as scissors-paper-rock) their choices [6]. Importantly, results also indicate that players had a weak tendency to stay with the previous selection following a win and to switch the selection following a loss. Dyson et al. concluded that this strategy reflects the classic behavior principle that reinforced responses are more likely to be used again (“win-stay”), whereas non-reinforced responses are less likely to be picked immediately after (“lose-change”). This WSLC strategy in RPS has been observed by others as well (e.g., [5]). Forder and Dyson [7] argued that humans follow a WSLC strategy, but that “win-stay” relies more on System 2 (e.g., rational and strategic planning) processes, while “lose-change” relies on System 1 (intuitive and impulsive) processes (cf. [11]).
It is important to highlight that most research have employed experimental designs in which the players were asked to play against a random computer algorithm (i.e., also a Nash Equilibrium strategy) (e.g., [6,7]). These designs make it less probable that players will win. Alternatively, if the opponent is not able to play according to the Nash Equilibrium strategy, there must be a combination of actions to be exploited with which the other player would win. Under this nonrandom behavior assumption, a winning strategy would require that a player predict the opponent’s choices and to counteract them. To determine what types of information players use in predicting their opponents’ behavior, West and Lebiere [8] proposed a neural network model with inputs for the opponents’ last two moves. The model outputs were thus determined by cumulatively activated connections from the input nodes to the output nodes based on the opponent’s historical choices (see also [12], as another model example). West and Lebiere demonstrated that the models produced highly similar results to the behavior exhibited by human subjects, suggesting that players attend to the opponent’s last two actions. Moreover, the players are also sensitive to game payoffs, which can be modeled with associated play outcomes [13].
In a more applied scenario, Batzilis et al. [9] analyzed players’ actions from a large online RPS game dataset. They reported that players strategically used the information on their opponents’ previous play. As a result, players with more experience used information about their opponents more effectively than less-experienced players and, thus, were more likely to win. Cook et al. [14] observed another possibility of knowing the opponents’ throws—players tended to imitate their opponents. They found a higher frequency of draws when one player could see the other, compared to when both players were blindfolded.
The studies discussed above provide some evidence that people are capable of predicting the opponent’s selection and acting to counter such predictions. This predictive ability means that a player’s own strategy is also exposed to the opponent, and thus the player can also be “predicted”. Imagine that Player 2 is temporarily choosing paper more often. Player 1 could choose scissors as a result, but Player 1 would also expect that Player 2 would know that Player 1 is expected to choose scissors, and consequently Player 2 chooses rock more often. Such recursive thinking and assumptions on knowing what Player 2 knows about Player 1 are known in psychology as “theory of mind” (ToM) (cf. [15]). Generally speaking, ToM refers to the ability to infer and interpret the beliefs, desires, and intentions of others [16]. ToM is known to be an essential component of human learning of social phenomena, including the acquisition of social norms and social beliefs [17]. For example, predicting that the opponent Player 2 will select rock can lead Player 1 to choose paper, which is named as the zero-order ToM. In addition, Player 1 can assume that Player 2 can also deduce that Player 1 would play paper (since Player 1 knows that Player 2 will play rock), thus Player 2 might switch to paper instead. In this scenario, Player 1’s assumptions about Player 2’s knowledge about Player 1 could make Player 1 choose scissors instead (i.e., first-order ToM). De Weerd et al. [10] implemented computational agents that use simulated ToM play the RPS game and found that first-order and second-order agents outperformed agents of the lower order of ToM. Although the results are based only on computer simulations, it suggests that players who consider others’ intentions would have a distinct advantage in the RPS game.
1.2. Current Study
The current study provides the following contributions. As previous noted, past research that focused on players’ aggregated frequency strategy observed deviations from the Nash Equilibrium strategies among players. However, playing randomly implies a 33% of each action (R, P, and S) is also the optimal Nash Equilibrium strategy. Thus, it is not possible to know whether participants deviate from Nash or deviate from the random behavior given that random and Nash strategies are confounded in the payoff matrix. In the current research, we clarify this behavior by using a novel payoff matrix that allows us to make such distinctions. Second, past research examining sequential choices has shown that players play in agreement with the WSLC, or other types of complex strategical patterns, to exploit the opponents’ actions. In this research, we look at the circumstances in which these WSLC, and other sequential patterns, reflect human strategies.
In Experiment 1, we developed a two-player online RPS game and focused on whether we would observe the Nash Equilibrium, random, or a generalized WSLC strategy among players. Based on our results from Experiment 1, in Experiment 2, we tested the ability of human players to predict the opponent’s actions by pairing them with strategic computer probabilistic opponents. We hypothesized that players would display various strategies in the RPS game, and that their selected strategies would be based on their understanding of opponents’ behavior.
2. Experiment 1
2.1. Methods
2.1.1. Participants
A total of 111 participants from Amazon Mechanic Turk (MTurk) signed up for a study about the RPS game. Among these players, 96 of them (Age: [18, 64], = 36)) completed the study. It took 14 min on average to finish the task. Participants received a payment of 50 cents and a bonus based on their cumulative points (2 points equal to 1 cent). Participants who finished the study earned an average payment of $1.5 (), participants who did not finish received only 50 cents. Three dyads were excluded from data analysis because at least one player chose the same consecutive action in over 50% of the trials. This left 45 dyads (90 participants) in the final data analysis.
2.1.2. Design
To be able to distinguish players’ use of a random strategy versus a Nash strategy, we designed a novel payoff matrix (Table 1), in which the Nash Equilibrium is a mix of 1/4, 1/2, 1/4 for rock, paper, and scissors, respectively (see [13], for a similar payoff design). The random strategy used 1/3 for each action.
Let be the probabilities with which Player 1 chooses rock, paper, and scissors and be the probabilities for Player 2. In the Nash Equilibrium play, Player 1’s payoff for Player 2’s combination of selections. Thus, in the payoff matrix design in Table 1, the expected payoff for Player 1 for playing rock equals the expected payoff of playing paper and playing scissor when Player 2 chooses with probabilities . Because the payoff matrix is symmetrical, Player 1 should also have the same choice probability so that Player 2’s expected value for choosing each action is the same as well, which gives the solution for the Nash Equilibrium.
To avoid the effect of real losses [7], we did not include negative points in this game. A tie corresponded to 2 points for each player, a loss would be 1 point (Rock vs. Paper or Paper vs. Scissors) or 0 points (Rock vs. Scissors), and a win corresponded to 3 points (Paper vs. Rock or Scissors vs. Paper) or 4 points (Rock vs. Scissors).
2.1.3. Procedure
Participants consented to the study protocol approved by the Institutional Review Board at Carnegie Mellon University. Next, participants completed a brief demographic survey about their age, gender, residency, and education level.
All players received the same general task instructions for the RPS game. They were informed that they would be matched with an anonymous MTurker to play the RPS game. Participants were not given any specific information about the player they were matched with. Participants entered a “waiting room” until they could be paired into dyads. After a match was successful, pairs played the RPS for 100 trials.
In each trial, participants were asked to choose one of three buttons with the pictures of a hand illustrating rock, paper, or scissors. A player could not change the selection after clicking. Once both players made a choice, they were notified of the points obtained from the outcome, as well as their total accumulated points. Participants were not informed of the payoff matrix ahead of time, but rather they “discovered” the outcomes through immediate feedback of the payoffs (Table 1). After receiving feedback, participants then clicked on the “Next” button to proceed. Upon completion of 100 trials, participants completed a short, general survey about their strategies during the game.
2.2. Results
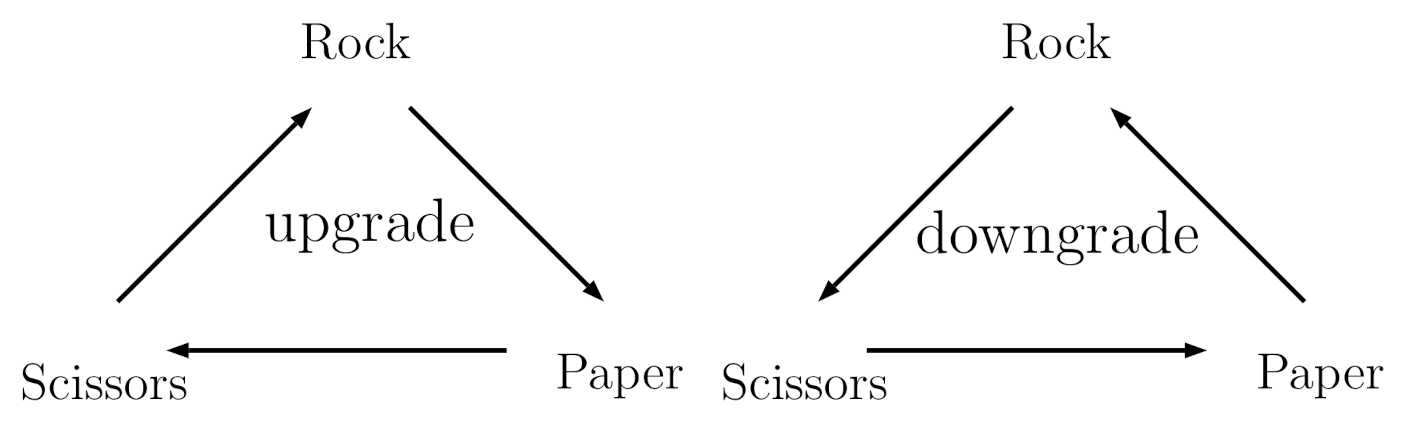
Our dependent variable was the proportion of choices of each type (rock, paper, and scissors) made by each player over the 100 trials, and the cycling behaviors (upgrade, downgrade, and stay; Figure 1) after each choice. We used JASP [18] for a repeated ANOVA analysis (Greenhouse–Geisser Correction for Sphericity where appropriate).
Following Dyson [3], we described players’ strategies from two different perspectives. We first calculated the proportion of choices to investigate whether players’ behavior is in agreement with the Nash Equilibrium or the random strategy. Second, we explored the serial dependency of actions, and specifically focused on whether these actions were in agreement with the WSLC patterns. WSLC is an outcome-based strategy: players choose to stay with the same action if winning and to switch actions if losing. For example, if Player 1 wins with paper against a rock, Player 1 may choose paper again (win-stay). If Player 2 decides to self-downgrade to scissors, this is a lose-change strategy. The choice of Player 1 and Player 2 is also an other-upgrade strategy, i.e., Player 1 from rock to paper and Player 2 from paper to scissors. In this way, the decision to win-stay (by Player 1) and lose-downgrade (by Player 2) is not differentiated from the cycle-based other-upgrade strategy (We refer readers to the review by Dyson [3] for a more detailed explanation of the isomorphism between the cyclic strategies and the self-outcome strategies. Generally, the win-downgrade/lose-upgrade strategy can be viewed as the other-stay strategy and the win-upgrade/lose-stay can be viewed as the other-downgrade strategy). Without making strict assumptions on whether participants act based on the opponent’s choice (cycle-based strategy), or whether they choose to focus on their wins and loses (outcome-based), our Experiment 1 sorted players’ actions into two groups: outcome-based and non-outcome-based.
2.2.1. Random or Nash Strategies
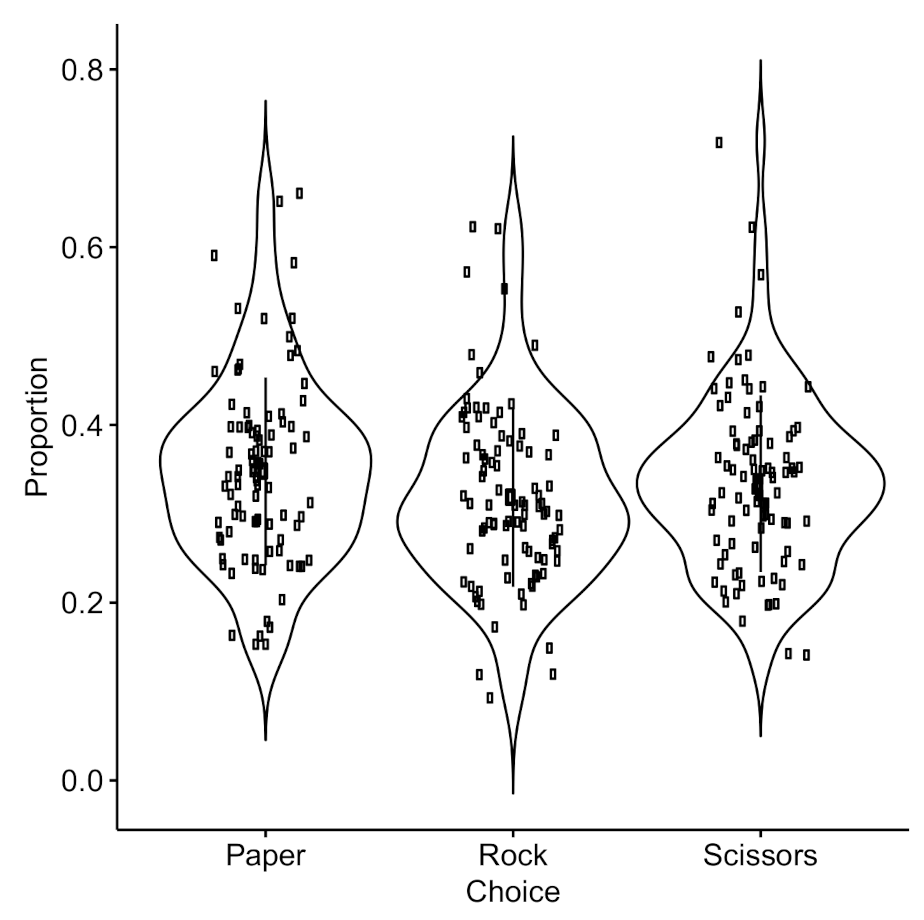
Figure 2 presents the averaged proportion of R, P, and S choices for all participants. We observed that players appear to choose randomly, rather than in agreement with the Nash strategy (50%, 25%, and 25% for choosing rock, paper, and scissors). A one-way ANOVA indicated that there was no statistical difference between the proportions of the three types of actions ( = 0.16), suggesting that the participant’s behavior was consistent with the random strategy.
2.2.2. Win-Stay/Lose-Change
To analyze the WSLC strategy, we first determined whether participants’ actions were related to the outcomes. We performed a chi-square test for players’ cycling actions by the outcomes. The null hypothesis for a chi-square test is that the outcomes and their subsequent actions are independent—the proportions of selected actions are the same regardless of the outcome in the previous trial. This independence would suggest that participants’ selections are not outcome-based. The chi-square test results reveal that, at the individual level, 36 out of 90 participants violated the independence hypothesis, indicating that their actions were related to the previous trial’s outcome. For the other 54 participants, we found that their actions are not related to the outcomes in the previous trial, indicating that their actions are not outcome-based.
To further describe the individual strategy variability, we use hierarchical clustering on the outcome-based group and non-outcome-based group. For the outcome-based group, we explored whether there are change/stay patterns embedded in the average group behavior such as WSLC. Additionally, we also checked if participants who do not act based on outcomes have a preference for a specific cycling action instead, e.g., keep using “upgrading” or “downgrading” strategies.
2.2.3. Cluster Analysis
Cluster analysis allows us to systematically capture the similarities and dissimilarities in strategies adopted by individual participants. We employed a basic Ward agglomerate clustering method. We present the results of the cluster analysis as dendrograms, in which each data point is a cluster in the first level initially. Then, for each step, the clusters are merged based on their proximity to larger dyads of clusters. The merging procedure ends when all clusters form a last single cluster. In the current analysis, we check the last one or two steps of merging and cut the dendrogram into three representative levels. This provides an informative description and visualization of the underlying clustering structures of players’ behavior. We refer readers who are interested in knowing more about hierarchical clustering to the related literature (e.g., [19,20]).
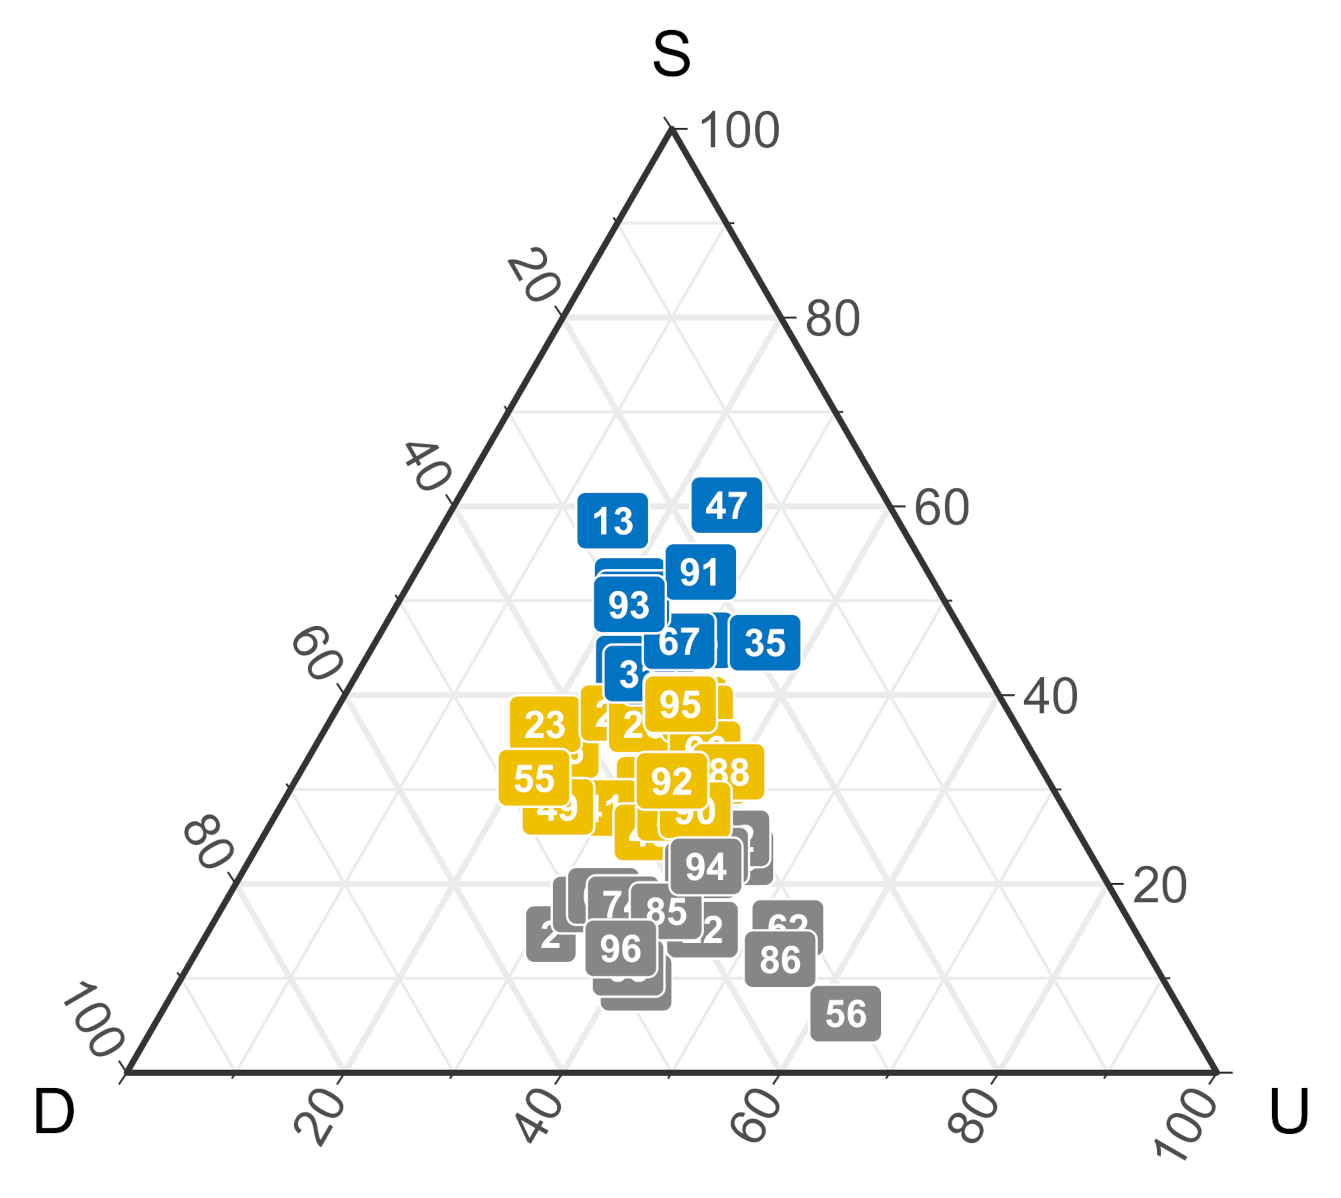
Figure 3 shows the proportion of change/stay strategies for participants in the “independence” group, i.e., their acts were not based on previous outcomes. Each dot represents a participant’s actions averaged across different outcomes. The colors represent groups categorized by the cluster analysis based on players’ action proximity. Instead of strictly following an upgrade or downgrade strategy (e.g., paper-rock-scissor or scissor-rock-paper; [6]), our cluster analysis indicated that there was no absolute tendency in the group. Many participants were located in the middle of the ternary plot who did not have a clear preference (Yellow cluster) while others chose to stay more (Blue cluster) or less (Grey cluster). We infer that, although participants chose strategies while ignoring the associated outcome, they still adopted a mix of change/stay strategies.
We explored the exploratory descriptive information for the outcome-based group separately by the type of outcome (win, tie, or lose; Figure 4). Participants seemed to have a specific strategy following a win and a loss. Participants in the Blue cluster and part of the Grey cluster seem to follow a win-stay strategy more than switching strategies. The other group (i.e., Yellow cluster and some in the Grey cluster) resembled win-change that may either win-upgrade or win-downgrade. In addition, participants’ behavior resembled lose-stay strategies (i.e., Yellow clusters) and lose-change strategies (i.e., Blue and Yellow clusters). On the other hand, there is no clear grouped strategy for participants following a tie—most participants seem to adopt a mix of change/stay strategies. Together, the descriptive data analysis of hierarchical clustering suggested a large heterogeneity in individuals’ strategies. Participants who followed a win-stay strategy often (although not always) demonstrate a lose-change strategy. Similarly, those who follow a win-change strategy are often those who also follow a lose-stay strategy. These exploratory results suggest two prominent strategies followed by individuals: a “win-stay/lose-change” strategy and a “win-change/lose-stay” strategy.
2.2.4. Dyad-Level Payoffs
Our analyses indicated that only actions of about of all participants were dependent on the previously experienced outcome and fell into the outcome-based group while about acted independently. It is likely that, within each dyad, one player’s action depended on the outcome, whereas the other player acted independently. Given such a mix of behaviors within a dyad, it might be less meaningful to further analyze the dyad-level strategy.
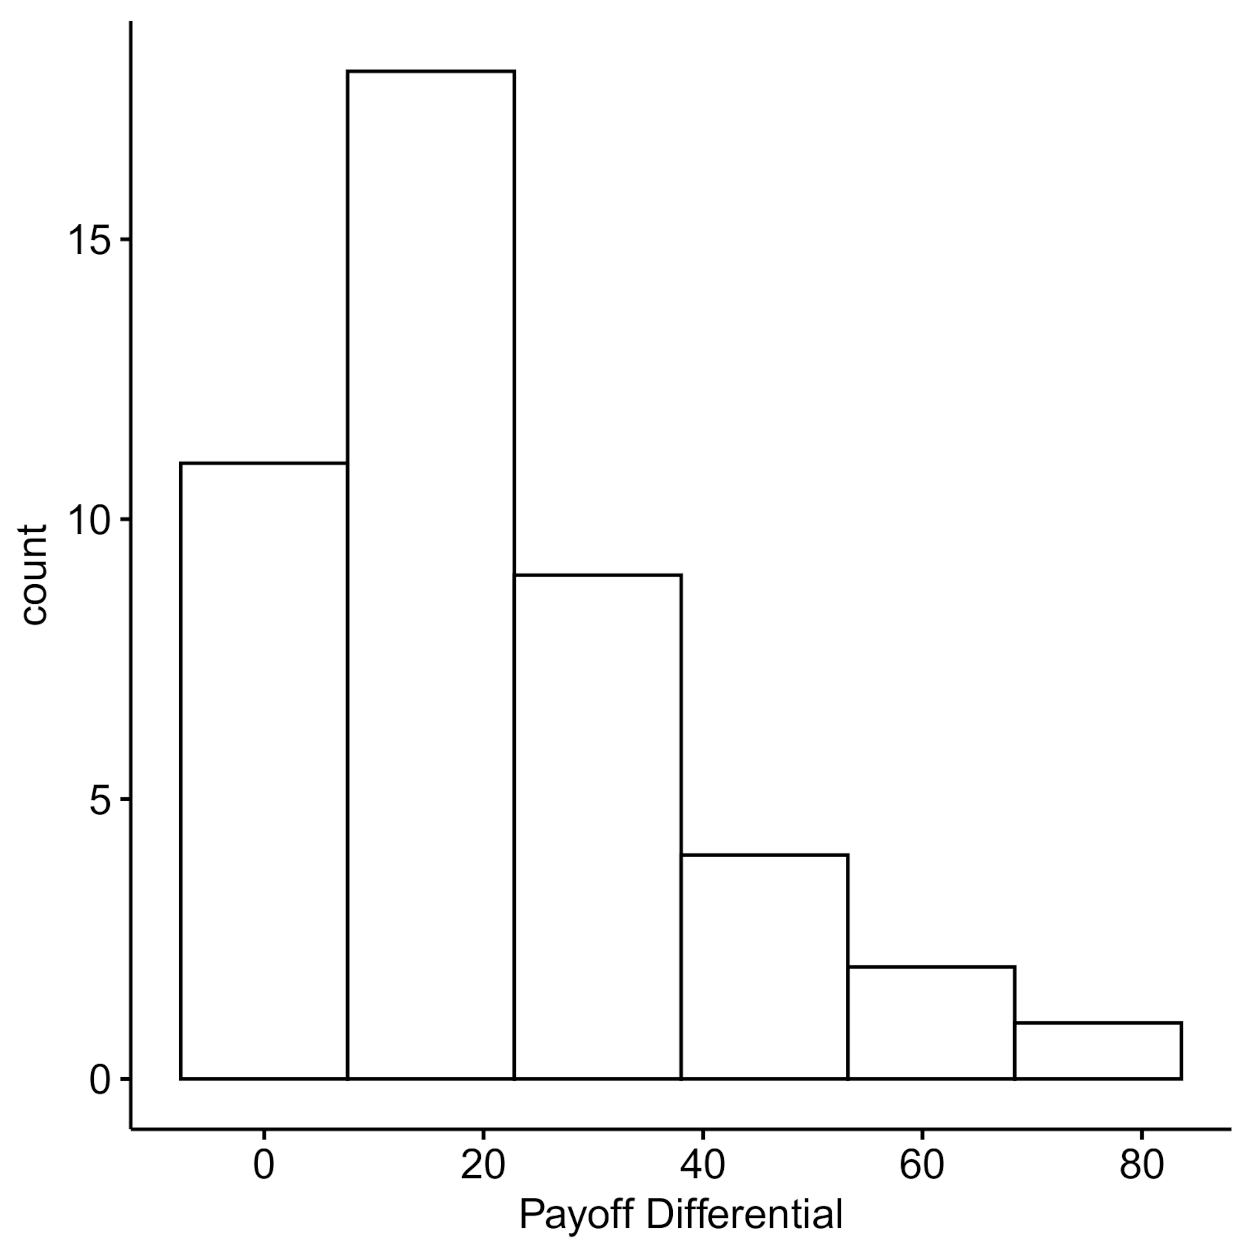
Nevertheless, we present data on the extent to which players may have exploited (or were exploited by) their opponents. Figure 5 shows the distribution of the win count differentials within a dyad and Figure 6 presents the resulting payoff difference. Many of the dyads’ win count differences are centered around 10 points (), indicating the members were equally likely to win over 100 trials, resulting a payoff difference centered around 20 points (). Given that few individuals within a pair seem to exploit their opponents, and that individuals within a pair are largely equivalent in terms of win counts and payoff differentials, we explore the dyad-level strategies more directly in Experiment 2.
2.3. Discussion
In Experiment 1, we collected data in an online two-player RPS game while employing a payoff matrix that allowed the distinction between the Nash strategy and random strategy. Our first observation was that participants’ behavior was close to the random strategy, and it was not well represented by the Nash strategy. Additionally, individuals selected paper, rock, or scissors, depending on their experienced outcomes (outcome-based group) or independently from the outcomes (non-outcome-based group). Using the hierarchical clustering analysis, we found that participants in the non-outcome-based group had no distinctive change/stay preference, and participants in the outcome-based group seemed to prefer two main strategies: Win-Stay, Lose-Change (WSLC) or Win-Change, Lose-Stay (WCLS).
As discussed above in the Results Section, many strategies are simply redescriptions of the same mechanics (cf. [3]), e.g., if players decide to upgrade based on the players’ selections, it is not differentiated from a WSLC strategy. Furthermore, the LC and WC strategies do not say much about how participants change their behavior after they lose or win. Players may focus on changing by upgrading or downgrading, and more concretely they could make those decisions based on the opponents’ choices rather than their own. Instead, there seemed to be a weak trend that players who choose WSLC strategy present the win-stay/lose-downgrade behavior, and players who choose WCLS strategies follow the win-upgrade/lose-stay pattern (Figure 4).
Therefore, in Experiment 1, we are only able to conclude that a majority of players’ behaviors appear to be consistent with the WSLC and WCLS patterns, but not whether they are upgrading or downgrading when they decide to change, and not whether they are making those changes based on the opponent’s actions.
In Experiment 2, we designed a RPS game to let human participants play with computer algorithms that exhibit specific probabilistic outcome-based upgrade or downgrade strategies. By introducing computer algorithms as RPS players, we aimed to analyze within-dyad human behavior accordingly.
3. Experiment 2
As discussed in the Introduction, making assumptions of the opponents’ actions involves “theory of mind” (ToM) ability. The RPS game is not only about predicting the state of mind of the other player but also about using that information to avoid being exploited. We suspect that only a subset of players’ behavior is similar to the WSLC or WCLS strategies in Experiment 1 because players realize that such simple heuristic strategies would be exploited by their paired opponents (i.e., the paired opponent knows what I know). If humans play with probabilistic computer opponents, we suspect that such ToM reasoning would not be possible, and humans might exhibit the WSLC or WCLS behavior more clearly. Additionally, if human players “believe” that computer opponents play randomly, the heuristic strategy of WSLC makes it an easy way to randomize choices.
In a previous study, Eyler et al. [4] found that human players lost the RPS game more often when playing with adaptive computer algorithms than when playing with humans. However, they failed to further investigate the human strategy; as a result, it is unknown to us whether players adopted different strategies when playing with the adaptive algorithm compared to when playing with random opponents. The goal of Experiment 2 was to test the interaction between human players and computer opponents—whether participants can adapt their strategies based on the type of opponent they encounter. Specifically, based on players who fall into the outcome-based group in Experiment 1, we designed two types of nonrandom behaviors that computer opponents play: WSLC and WCLS.
When playing with a computer opponent, it would be possible to determine whether the human player exploits the computer’s heuristic strategy. Figure 7 gives an illustration of a trial in which the human plays rock (and loses) and the computer plays paper (and wins). If the computer plays the heuristic strategy of “win-stay/lose-change”, then it would choose paper again, and the best action for the human player is to choose to downgrade to scissors (i.e., lose-downgrade). In this way, we can determine whether humans are able to stay or to change (upgrade or downgrade) based on their learning of the computer strategy.
In Experiment 2, we tested whether participants were able to detect and exploit the computer strategies. If humans’ behavior appears to emulate the WSLC strategy, then we could conclude that the WSLC human behavior results from playing with computer opponents. If humans adapt their strategies according to the computer strategy, then we can conclude that humans actively exploit opponents in the RPS game and whether they can be successful—at least when playing with computers.
3.1. Methods
3.1.1. Participants
A total of 343 participants signed up for the study using MTurk. Out of this total, 129 participants failed an attention check (explained below), and 18 participants did not finish the task. A total of 196 participants (Age: [19, 72], = 73, = 3) completed the experiment in full, and they were included in the analyses. Participants received $1.5 as the base payment for completing the experiment. In addition, participants received a bonus payment based on their performance (2 points equal to 1 cent), and they received an average payoff of $2.61 (). The average time to complete the study was 15 min.
3.1.2. Design
When playing with a computer opponent, it was possible to determine whether the human player exploits the computer’s heuristic strategy. Figure 7 gives an illustration of a trial in which the human plays rock (and loses) and the computer plays paper (and wins). If the computer plays the heuristic strategy of “win-stay/lose-change”, then it would choose paper again, and the best action for the human player is to choose to downgrade to scissors. In this way, we can determine whether the human is following the best action while learning the strategy of the computer opponent.
To further determine the type of “change” action (e.g., win-upgrade or win-downgrade) that the algorithm performs, we included all the expected algorithmic reactions (Table 2), assuming a human would want to beat the algorithm. The left two columns present the case in which the computer wins (i.e., the human loses) and the right two columns present the case that the computer loses (i.e., the human wins). Similarly, the top two rows present the computer’s algorithm strategy of “win-stay/lose-change” and the bottom two rows present the computer’s algorithm strategy of “win-change/lose-stay”. We describe above that the best action for a “win-stay” opponent is to go with “lose-downgrade”. When the computer loses, the human player simply needs to follow the action that the computer chooses (Figure 7). The same applies to the “win-change/lose-stay” strategy (the bottom two rows); the human player needs to stay if they win and change the strategy based on computers’ actions.
Summarizing Table 2, the best action for human players when playing against a “win-stay/lose-downgrade” opponent is always to downgrade; the strategy for human players against a “win-upgrade/lose-stay” opponent is always to stay. It is notable that the two strategies also correspond to other-upgrade and other-downgrade strategies. To examine whether participants are able to selectively choose the strategy based on opponents’ behavior and adopt the outcome-based behavior, we removed the computer strategies that may result in consistent cycle-based strategies (i.e., always “downgrade” or “stay”). This left us with two strategies for designing computer algorithms: “Win-Stay/Lose-Upgrade (WSLU)” and “Win-Downgrade/Lose-Stay (WDLS)” (i.e., representing “win-stay/lose-change” and “win-change/lose-stay” strategies, respectively).
We designed probabilistic algorithms that would follow WSLU or WDLS strategies, as shown in Table 3. The WSLU algorithm chooses to stay after a win and chooses to upgrade from its previous action after a loss (with a probability of 0.8). The WDLS algorithm chooses to downgrade from its previous action after a win and chooses to stay after a loss (with a probability of 0.8). Each of the other actions after a win or loss are selected with a probability of 0.1. After a tie, both algorithms choose to stay, upgrade, or downgrade with equal probability (1/3). Given that the dominated strategy selection of change/stay, we expect that players would secure the best actions depicted in Table 2.
Each algorithm started with a random selection (paper, rock, or scissors) in the first trial. The following actions were determined by the probabilities associated with each outcome, as shown Table 3.
3.2. Procedure
The procedure was the same as in Experiment 1 except that participants were matched to an experimental algorithm instead of another MTurk worker. The instructions were changed so that participants knew they would play the RPS game with a computer algorithm. Participants were not given information regarding the exact behavior patterns of the computer algorithm. Participants were randomly assigned to one of the two experimental conditions. In addition, we inserted an attention check trial that was randomly located between the first trial and the 20th trial. Participants were aware that there would be attention check(s) but had no idea when the attention check would appear. The attention check trial was the same as a regular trial except that they were asked to make the same choice as their opponents made in the previous trial.
3.3. Results
Out of the total of 196 participants, 99 (Age range: [20, 72]; , ) participated in WSLU condition and 97 participants (Age range: [18, 70]; , ) in the WDLS condition.
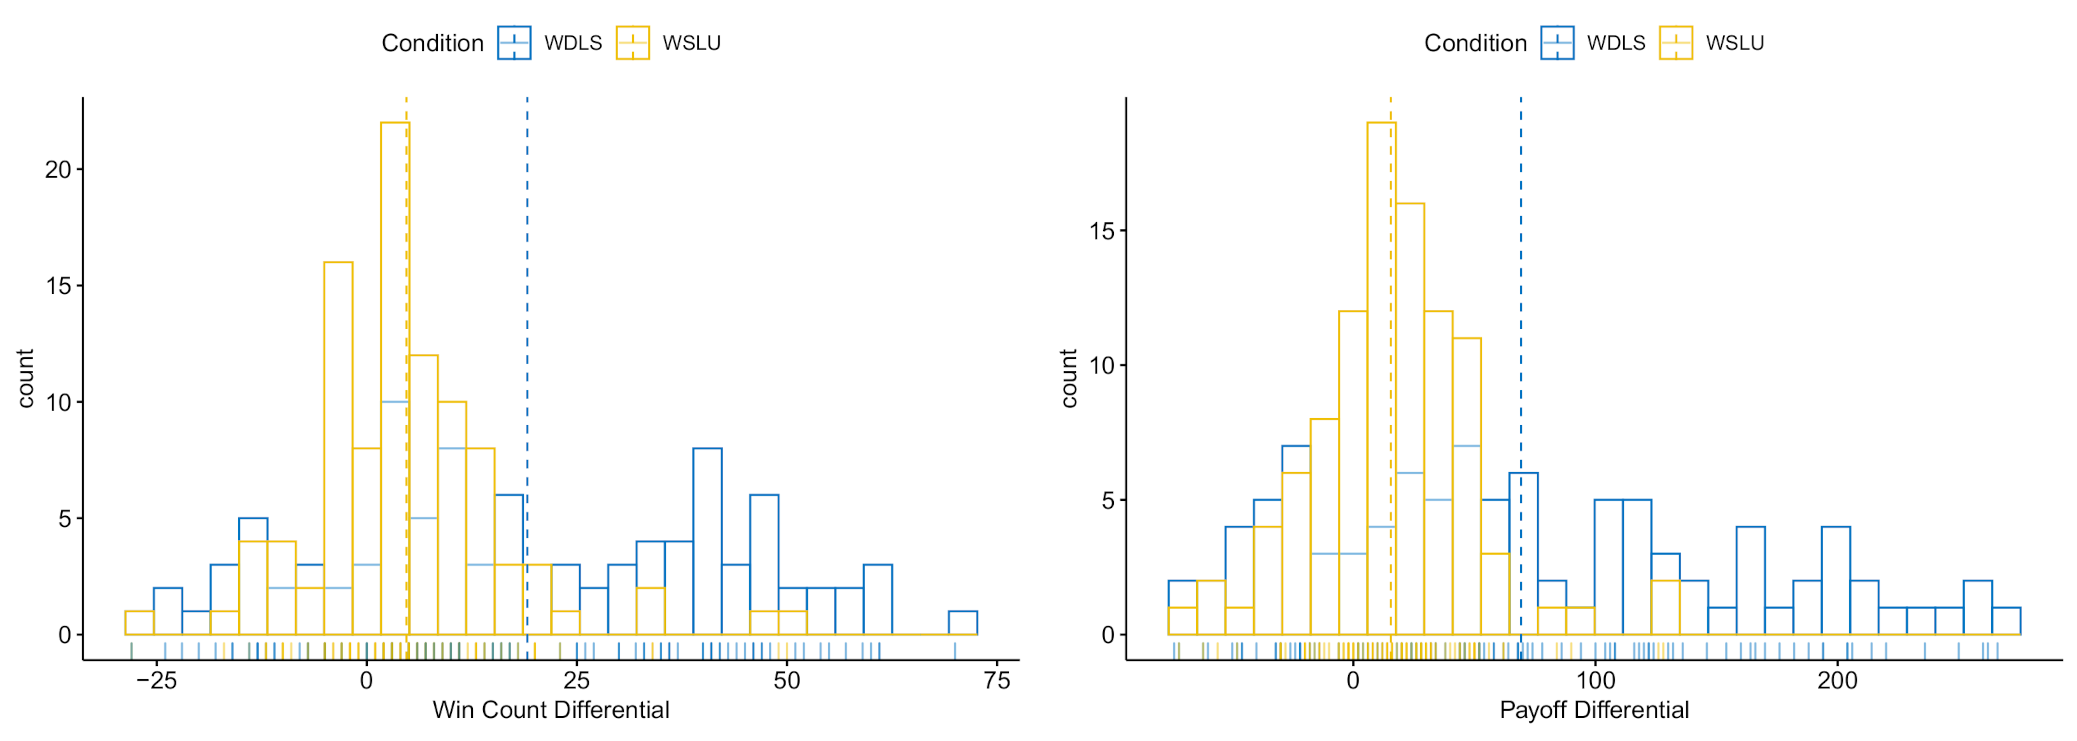
We first investigated whether players were able to exploit computer opponents. Figure 8 (left) shows the win count differentials between human players and computer algorithms (). Here, the positive win count refers to humans successfully exploiting their assigned computer algorithm. The negative win count indicates that computer exploited the human players. In both conditions, WSLU () and WDLS () human players exploited their computer opponents. We also noted that human players in the WDLS condition win more compared to those in the WSLU condition (). Correspondingly, players in both WLDS () and WSLU () conditions earned more points than their paired computer opponents (; Figure 8, right). In addition to the relative gains within each dyad, players in the WDLS condition generally won more points than players in the WSLU condition ().
Is the human players’ success due to their ability to detect and take advantage of the computer strategy? We hypothesized that participants playing with the WSLU algorithm would learn to upgrade when they win (win-upgrade) and to downgrade when they lose (lose-downgrade), WULD. Participants who played with the WDLS algorithm would learn the Win-Stay/Lose-Upgrade (WSLU) strategy.
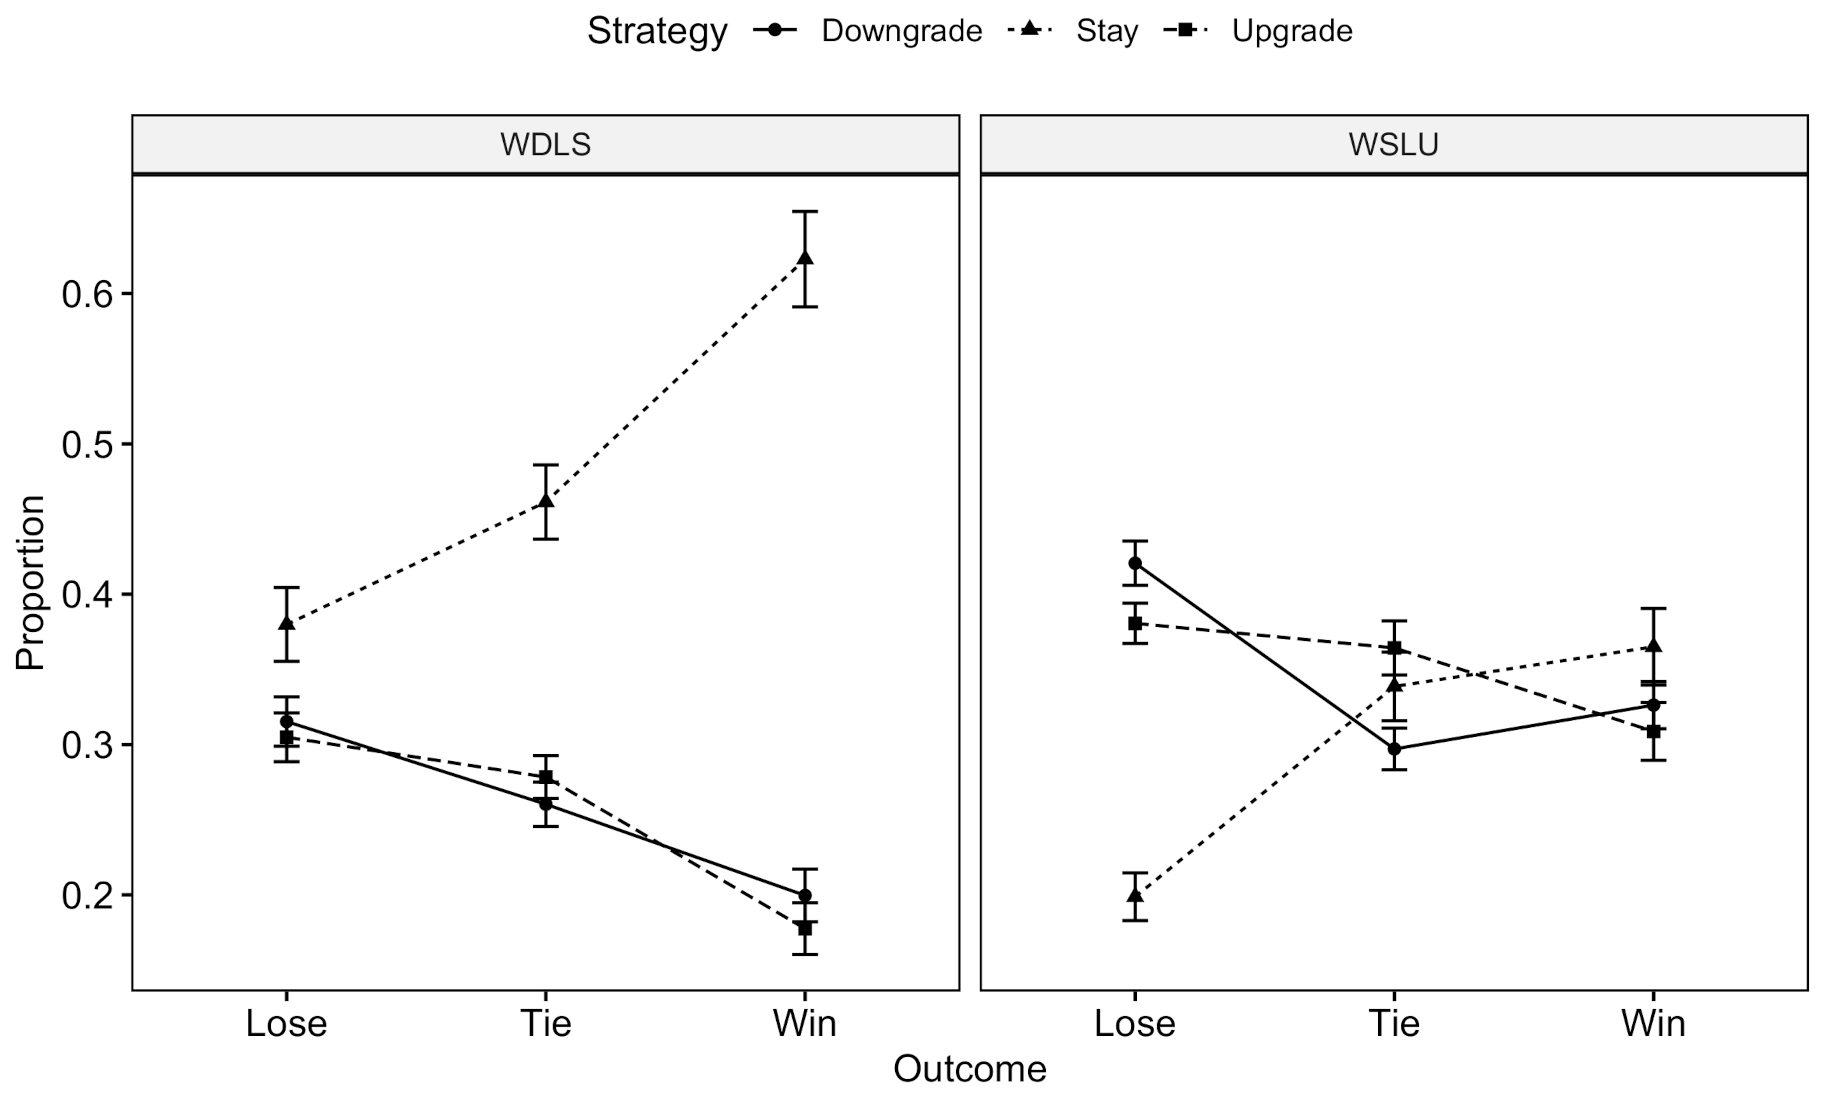
Figure 9 describes the proportion of actions followed by different outcomes in the WDLS and WSLU conditions. A repeated ANOVA indicated that there was a main effect of strategy on proportions of choices () and an interaction between the strategy and condition (). In addition, there was an interaction between the outcome and strategy () and an interaction among the three main effects (). Since the sum of outcomes equals 1 in both conditions, there is no main effect of outcome or the interaction between the outcome and condition.
To further interpret the three-way interaction, separate analyses of strategies and outcomes were conducted on WDLS and WSLU using a repeated ANOVA. In the WDLS condition, there was a main effect of strategy () and an interaction with the outcome (). Players chose to stay more after a win compared to downgrade () or upgrade (). After a tie, the differences between stay and downgrade () and stay and upgrade () were also significant. The preference of choosing strategies after a loss is not significant. In the WSLU condition, there was only an interaction between the strategy and outcome (): after a loss, players chose to stay compared to downgrade () or upgrade ().
3.4. Discussion
In Experiment 2, we designed two probabilistic computer algorithms that would choose win-downgrade and lose-stay or win-stay and lose-upgrade to explore whether players are able to employ outcome-based strategies to counteract their opponents. We hypothesized that players would outperform their computer opponents by successfully exploiting the patterns embedded in algorithms. Our results generally suggest that participants did performed better than the computer algorithms, but not by following the hypothesized strategies. Rather, we observed that players tended to keep the same choice (i.e., stay) after a win in the WDLS condition. It is probably given that the algorithm stays most after losing. In the WSLU condition, players were more likely to adopt the “lose-change” strategy but were unable to oppose the computer’s action change (i.e., upgrade or downgrade). Although we set computers to upgrade after losing (WSLU) or downgrade after winning (WDLS) with a probability of 80%, players failed to act according to the winning strategy.
Our results were in agreement with the argument by Dyson et al. [6] that reinforced responses were more likely to be used again (win-stay in the WDLS condition) while the non-reinforced responses were used less (lose-change in the WSLU condition). In contrast to the findings of Eyler et al. [4] that computer algorithms won more trials against the human player, humans in our study were more successful when playing against nonrandom computer opponents, particularly in the WDLS condition. It is likely humans master the win-stay strategy to counteract algorithms’ lose-stay behavior whereas in the WSLU condition, algorithms’ upgrade and downgrade behaviors were more difficulty for humans to exploit.
4. General Discussion
In the current research, we explored players’ sequential strategies in the RPS game with a payoff matrix that distinguishes between the Nash Equilibrium strategy and the random strategy. In Experiment 1, players were paired with another human player in an online two-player RPS game. Our results indicate that participants did not follow the Nash Equilibrium strategy. Instead, their behavior was similar to the random strategy. Moreover, participants’ sequential actions indicated a heterogeneous cycle-based behavior. Some participants’ actions were independent of the past outcome, whereas other participants’ actions depended on the outcome (outcome-based cycling)—win-stay, lose-change or win-change, lose-stay. In Experiment 2, participants played with computer algorithms that followed the probabilistic strategies win-stay/lose-upgrade and win-downgrade/lose-stay. Our results suggest that participants chose simple and heuristic reactive strategies using the information of computer opponents’ actions to decide whether to stay sub-sequentially. In the WDLS condition, players were likely to choose win-stay, and, in the WSLU condition, players tended to lose-change. The pattern suggested that players were more sensitive to the computer’s repeated actions (WS or LS) rather than a specific cycle direction (e.g., downgrade or upgrade).
Although we did not observe a conclusive WSLC strategy for players to follow in Experiment 1, Experiment 2 suggested that the separation of the two (WS in WDLS and LC in WSLU) is still more easily adopted than other outcome-based strategies. While we expected players would detect computer algorithms’ update/downgrade patterns, we did not find evidence suggesting that human players precisely master the cycle directions, e.g., lose-upgrade to counteract win-downgrade or win-upgrade to counteract lose-upgrade. Therefore, our research suggests that opponents’ upgrade/downgrade patterns are hard to follow. Instead, the WDLS and WSLU strategies can be simplified as self-repeat and other-repeat strategies separated by outcomes. For the computer that performed the win-downgrade strategy, winning with paper means that it is likely to choose rock next time. Thus, the computer repeats human’s last action. The same applies to the “lose-upgrade” computer algorithm: losing with rock means it is likely to choose paper next time, which is the human’s last winning action. Believing that a computer opponent “tried to” repeat a player’s previous choice (I think you think like me) or itself (stay) would also lead players to beat algorithms. Our results indicate that players had difficulty to use their ToM abilities to compete with others [21,22].
Due to a limited number of choices in the RPS game, it is hard for us to conclude that paper follows from that player believing the opponent is going to play rock (zero-order ToM) or from believing the opponent believes she would choose the scissors (first-order ToM). Thus, we did not give too much emphasis on recursive strategies in designing Experiment 2 and interpreting the results. As De Weerd et al. [10] also noted, there may be a limit to the effectiveness of the application of higher orders of ToM; the low performance of the third-order and fourth-order ToM may be caused by the special characteristic that there are only three unique predictions of the opponent’s next action (see also [3]). For future research that is interested in further discussing recursive strategies in adversarial behavior (cf. [23]), we wish to point out that there are other research paradigms that can be used to test recursive thinking directly (e.g., [24,25]). Those games involve multiple choices, making it easier to directly understand whether the layers of recursive thinking are involved. Future research can also investigate whether players’ recursive thinking ability can be trained into their play in the RPS game.
5. Conclusions
Our research evaluated the behavior of human players against other human opponents as well as computer probabilistic opponents in the RPS game. We found that, regardless of playing with another human or an algorithm, participants did not play the optimal strategy. In general, we did not observe a conclusive win-stay/lose-change strategy for players, but, when humans played with an algorithm, we observed that the win-stay strategy was common against the WDLS computer strategy, and lose-change was also common against the WSLU computer strategy. This suggests that participants are capable of learning simple strategies when these can result in a clear advantage against their opponent.
Author Contributions
Conceptualization, F.M., C.G. and H.Z.; methodology, H.Z. and C.G.; software, F.M.; validation, F.M., C.G. and H.Z.; formal analysis, H.Z.; investigation, F.M. and C.G.; resources, C.G.; data curation, F.M. and H.Z.; writing—original draft preparation, H.Z.; writing—review and editing, F.M. and C.G.; visualization, H.Z.; supervision, C.G.; project administration, C.G.; and funding acquisition, C.G. All authors have read and agreed to the published version of the manuscript.
Funding
This research was sponsored by the Army Research Office and accomplished under Grant Number W911NF-17-1-0431 and MURI Grant Number W911NF-17-1-0370 to Cleotilde Gonzalez.
Institutional Review Board Statement
The study was conducted according to the guidelines of the Declaration of Helsinki and approved by the Institutional Review Board of Carnegie Mellon University (protocol code STUDY2017_00000234).
Informed Consent Statement
Informed consent was obtained from all subjects involved in the study.
Data Availability Statement
Data collected and more details about the reported study are available online at https://osf.io/s54hb/, accessed on 22 June 2021.
Acknowledgments
A previous version of the analysis on Experiment 1 has been presented at Human Factors and Ergonomics Society Annual Meeting 2020. The authors want to thank the previous collaborators Michael Yu, Pegah Fekhari, and Hui Sun for some initial analyses performed on this data (not reported here) and research assistants at the Dynamic Decision Making Laboratory for supporting data collection for this study.
Conflicts of Interest
The authors declare no conflict of interest.
References
- Fisher, L. Rock, Paper, Scissors: Game Theory in Everyday Life; Basic Books: New York, NY, USA, 2008. [Google Scholar]
- Gilovich, T.; Vallone, R.; Tversky, A. The hot hand in basketball: On the misperception of random sequences. Cogn. Psychol. 1985, 17, 295–314. [Google Scholar] [CrossRef]
- Dyson, B.J. Behavioural isomorphism, cognitive economy and recursive thought in non-transitive game strategy. Games 2019, 10, 32. [Google Scholar] [CrossRef] [Green Version]
- Eyler, D.; Shalla, Z.; Doumaux, A.; McDevitt, T. Winning at Rock-Paper-Scissors. Coll. Math. J. 2009, 40, 125–128. [Google Scholar]
- Wang, Z.; Xu, B.; Zhou, H.J. Social cycling and conditional responses in the Rock-Paper-Scissors game. Sci. Rep. 2014, 4, 5830. [Google Scholar] [CrossRef] [PubMed] [Green Version]
- Dyson, B.J.; Wilbiks, J.M.P.; Sandhu, R.; Papanicolaou, G.; Lintag, J. Negative outcomes evoke cyclic irrational decisions in Rock, Paper, Scissors. Sci. Rep. 2016, 6, 20479. [Google Scholar] [CrossRef] [PubMed] [Green Version]
- Forder, L.; Dyson, B.J. Behavioural and neural modulation of win-stay but not lose-shift strategies as a function of outcome value in Rock, Paper, Scissors. Sci. Rep. 2016, 6, 33809. [Google Scholar] [CrossRef] [PubMed] [Green Version]
- West, R.L.; Lebiere, C. Simple games as dynamic, coupled systems: Randomness and other emergent properties. Cogn. Syst. Res. 2001, 1, 221–239. [Google Scholar] [CrossRef]
- Batzilis, D.; Jaffe, S.; Levitt, S.; List, J.A.; Picel, J. Behavior in Strategic Settings: Evidence from a Million Rock-Paper-Scissors Games. Games 2019, 10, 18. [Google Scholar] [CrossRef] [Green Version]
- De Weerd, H.; Verbrugge, R.; Verheij, B. How much does it help to know what she knows you know? An agent-based simulation study. Artif. Intell. 2013, 199, 67–92. [Google Scholar] [CrossRef]
- Kahneman, D. Thinking, Fast and Slow; Macmillan: New York, NY, USA, 2011. [Google Scholar]
- Rutledge-Taylor, M.; West, R. Using DSHM to model paper, rock, scissors. In Proceedings of the Annual Meeting of the Cognitive Science Society, Boston, MA, USA, 20–23 July 2011; Volume 33. [Google Scholar]
- Rutledge-Taylor, M.; West, R. Cognitive Modeling Versus Game Theory: Why cognition matters. In Sixth International Conference on Cognitive Modeling; Psychology Press: New York, NY, USA, 2004; pp. 255–260. [Google Scholar]
- Cook, R.; Bird, G.; Lünser, G.; Huck, S.; Heyes, C. Automatic imitation in a strategic context: Players of rock–paper–scissors imitate opponents’ gestures. Proc. R. Soc. B Biol. Sci. 2012, 279, 780–786. [Google Scholar] [CrossRef] [PubMed] [Green Version]
- Hedden, T.; Zhang, J. What do you think I think you think? Strategic reasoning in matrix games. Cognition 2002, 85, 1–36. [Google Scholar] [CrossRef]
- Premack, D.; Woodruff, G. Does the chimpanzee have a theory of mind? Behav. Brain Sci. 1978, 1, 515–526. [Google Scholar] [CrossRef] [Green Version]
- MacLean, E.L. Unraveling the evolution of uniquely human cognition. Proc. Natl. Acad. Sci. USA 2016, 113, 6348–6354. [Google Scholar] [CrossRef] [PubMed] [Green Version]
- JASP Team. JASP (Version 0.14.1) [Computer Software]. 2020. Available online: https://jasp-stats.org/ (accessed on 22 June 2021).
- Cichosz, P. Data Mining Algorithms: Explained Using R; John Wiley & Sons: Hoboken, NJ, USA, 2014. [Google Scholar]
- Xu, R.; Wunsch, D. Clustering; John Wiley & Sons: Hoboken, NJ, USA, 2008; Volume 10. [Google Scholar]
- De Weerd, H.; Diepgrond, D.; Verbrugge, R. Estimating the use of higher-order theory of mind using computational agents. BE J. Theor. Econ. 2018, 18. [Google Scholar] [CrossRef]
- Brockbank, E.; Vul, E. Recursive Adversarial Reasoning in the Rock, Paper, Scissors Game. In Proceedings of the Annual Meeting of the Cognitive Science Society, Online, 29 July–1 August 2020. [Google Scholar]
- Camerer, C.F.; Ho, T.H.; Chong, J.K. A cognitive hierarchy model of games. Q. J. Econ. 2004, 119, 861–898. [Google Scholar] [CrossRef] [Green Version]
- Frey, S.; Goldstone, R.L. Cyclic game dynamics driven by iterated reasoning. PLoS ONE 2013, 8, e56416. [Google Scholar] [CrossRef] [PubMed] [Green Version]
- Frey, S.; Goldstone, R.L. Going with the group in a competitive game of iterated reasoning. In Proceedings of the Annual Meeting of the Cognitive Science Society, Boston, MA, USA, 20–23 July 2011; Volume 33. [Google Scholar]
Figure 1.
The coded cyclic strategies of upgrade (left) and downgrade (right) that represent consecutive choices. Upgrade refers to the subsequent th choice that beats the previous tth choice (e.g., rock-paper) and downgrade refers to the subsequent th choice that is beaten by the previous tth choice (e.g., paper-rock), based on each player’s self choice.

Figure 2.
The proportion of choices selected by each player. The dot in the center represents the mean with the line represents one ± standard deviation.
Figure 2.
The proportion of choices selected by each player. The dot in the center represents the mean with the line represents one ± standard deviation.

Figure 3.
The ternary figure describes participants’ proportion of different strategies in the non outcome-based group. Each color represents a cluster group based on players’ action proximity. S, stay; D, downgrade; U upgrade.
Figure 3.
The ternary figure describes participants’ proportion of different strategies in the non outcome-based group. Each color represents a cluster group based on players’ action proximity. S, stay; D, downgrade; U upgrade.

Figure 4.
The ternary figure describes participants proportion of different strategies in the outcome-based group separately by the outcome: win (left); tie (middle); and lose (right). Each color represents a cluster group based on players’ action proximity. S, stay; D, downgrade; U, upgrade.
Figure 4.
The ternary figure describes participants proportion of different strategies in the outcome-based group separately by the outcome: win (left); tie (middle); and lose (right). Each color represents a cluster group based on players’ action proximity. S, stay; D, downgrade; U, upgrade.
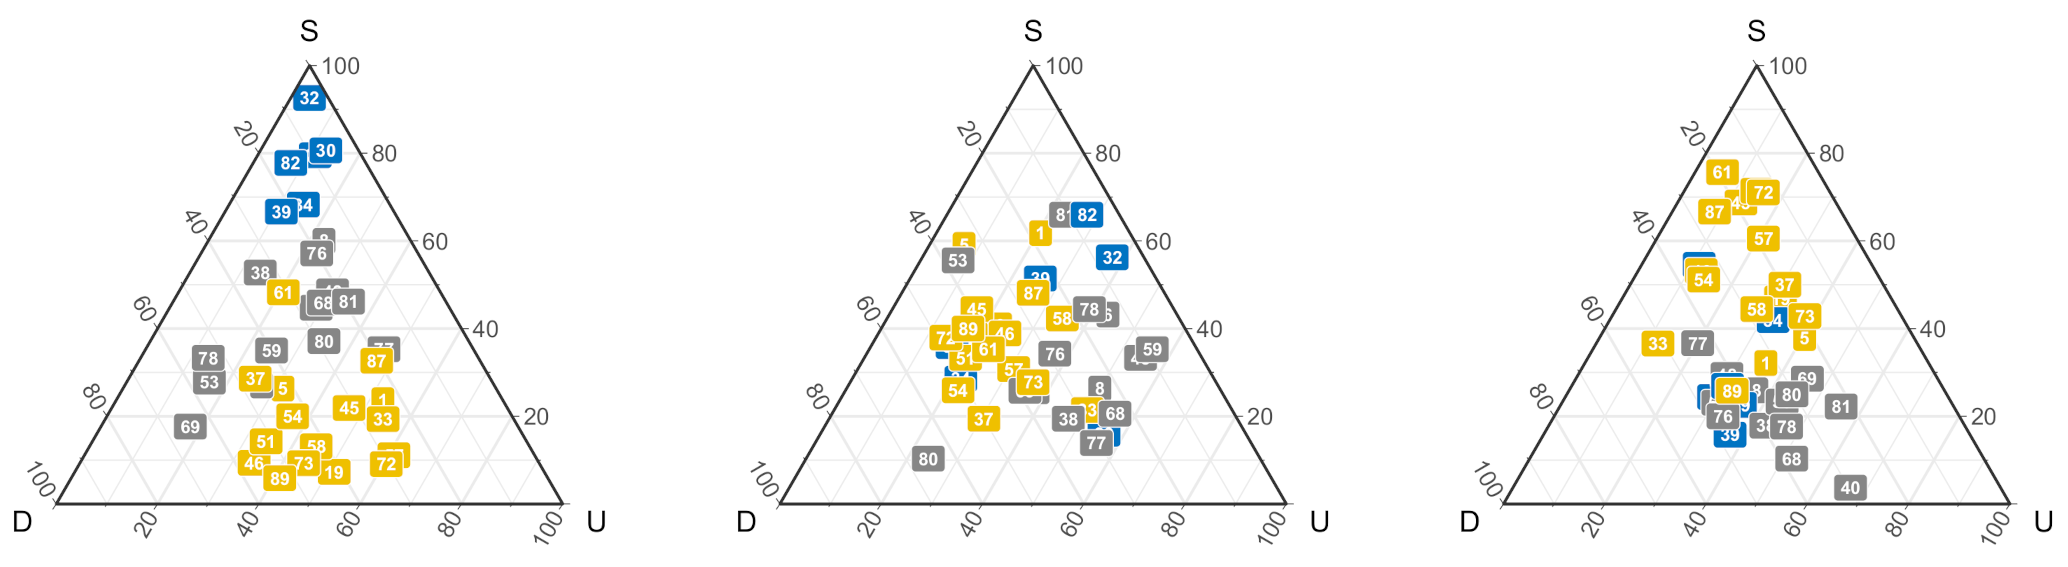
Figure 5.
Win differential: The distribution of the win count differentials within a dyad.
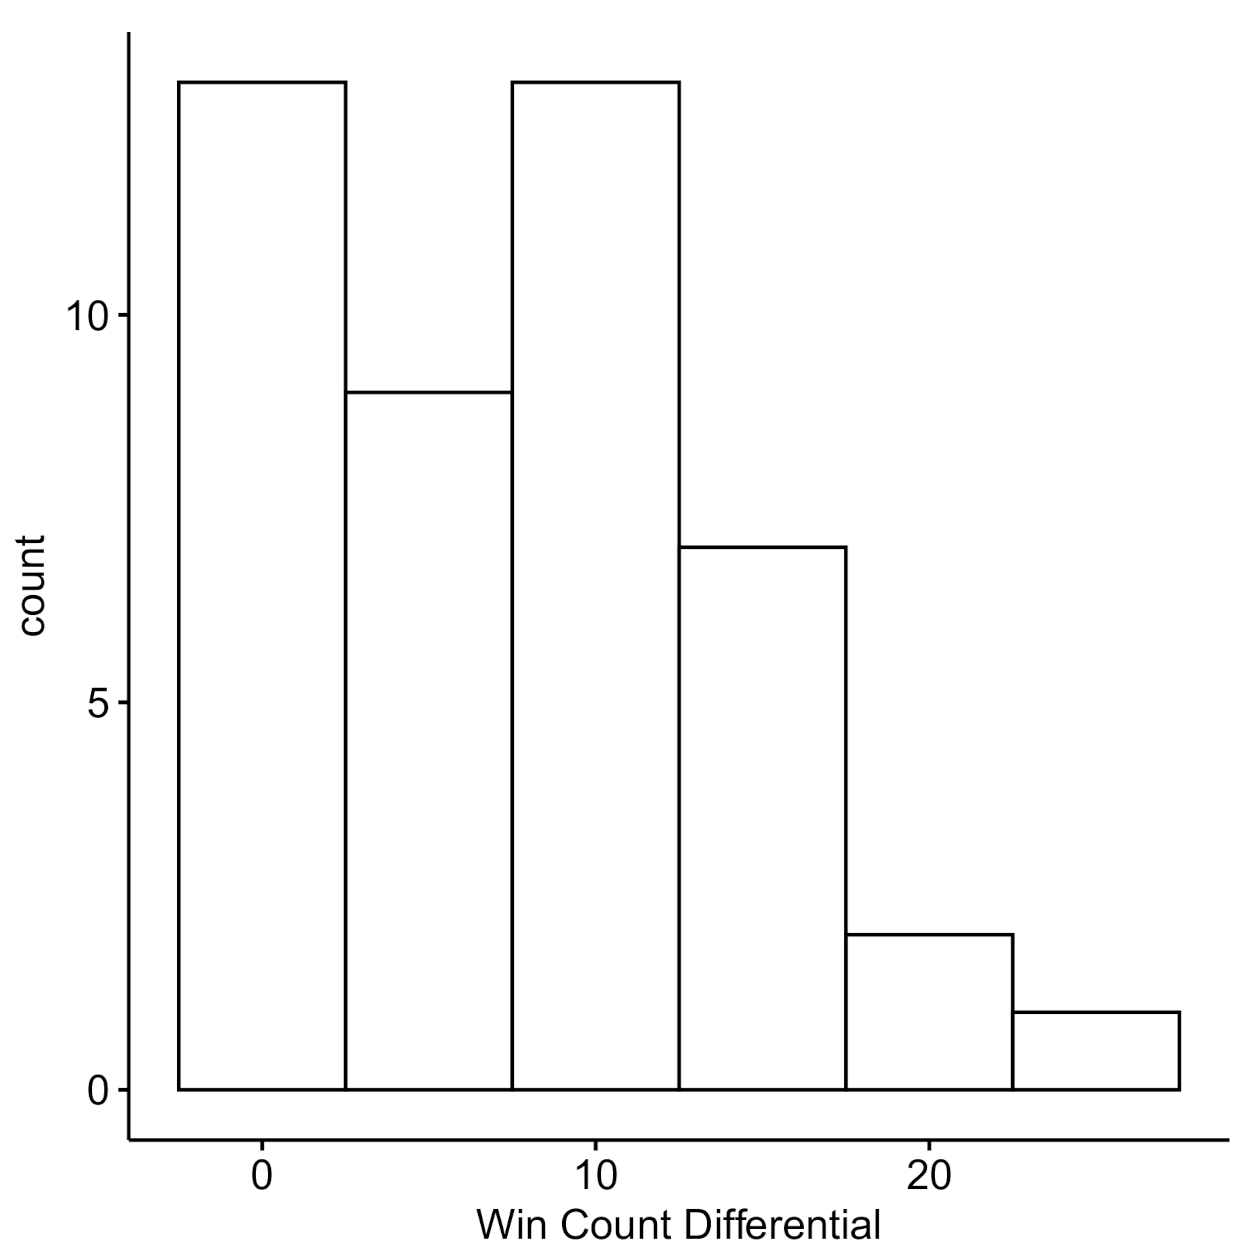
Figure 6.
Payoff differential: The distribution of the payoff differentials within a dyad.

Figure 7.
The example of change/stay strategy of Player Human against Player Computer that has a preferable change/stay action: if the Player Computer uses a “win-stay” pattern, then the best action for Player Human is “lose-downgrade”.
Figure 7.
The example of change/stay strategy of Player Human against Player Computer that has a preferable change/stay action: if the Player Computer uses a “win-stay” pattern, then the best action for Player Human is “lose-downgrade”.
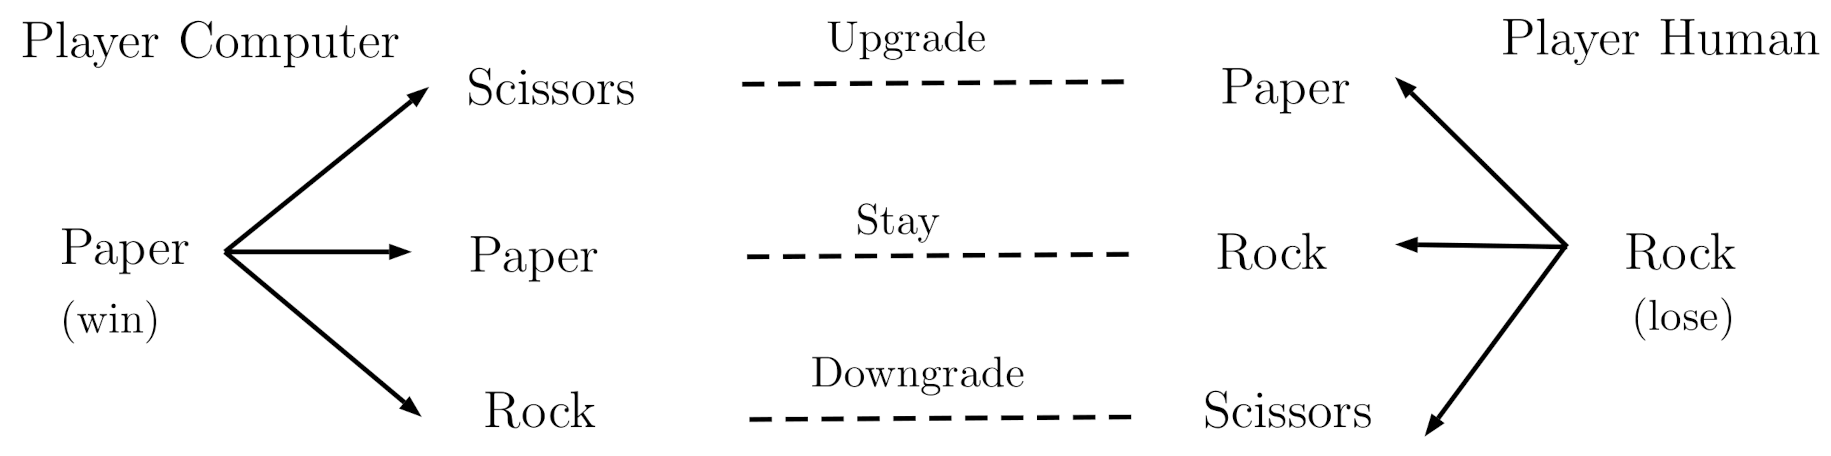
Figure 8.
The empirical distribution of win count differentials (left) and payoff count differentials (right). The differentials are computed as performance difference between human players and computer algorithms. The dash lines indicate the average differentials within each group.
Figure 8.
The empirical distribution of win count differentials (left) and payoff count differentials (right). The differentials are computed as performance difference between human players and computer algorithms. The dash lines indicate the average differentials within each group.

Figure 9.
The proportion of each strategy following different outcomes in the WDLS and WSLU conditions. Error bar represents one standard error.
Figure 9.
The proportion of each strategy following different outcomes in the WDLS and WSLU conditions. Error bar represents one standard error.


Table 1.
The payoff (Player 1, Player 2) matrix table.
| Player 1 | ||||
|---|---|---|---|---|
| Rock | Paper | Scissor | ||
| Player 2 | Rock | (2,2) | (1,3) | (4,0) |
| Paper | (3,1) | (2,2) | (1,3) | |
| Scissor | (0,4) | (3,1) | (2,2) | |
Table 2.
Best actions of human players to beat computer opponents that play stay/change strategies.
| Player | Strategy | Computer | Human | Computer | Human |
|---|---|---|---|---|---|
| Outcome | Win | Lose | Lose | Win | |
| WSLC | Stay | Downgrade | Upgrade | Upgrade | |
| Downgrade | Downgrade | ||||
| WCLS | Upgrade | Stay | Stay | Stay | |
| Downgrade | Upgrade |
Note. WSLC, Win-Stay/Lose-Change; WCLS, Win-Change/Lose-Stay.
Table 3.
Two algorithms used to play against human participants in the Experiment 2.
| Algorithm | Outcome | Strategy | ||
|---|---|---|---|---|
| Stay | Upgrade | Downgrade | ||
| (1) Win-Stay/Lose-Upgrade (WSLU) | Lose | 0.1 | 0.8 | 0.1 |
| Tie | 0.33 | 0.33 | 0.33 | |
| Win | 0.8 | 0.1 | 0.1 | |
| (2) Win-Downgrade/Lose-Stay (WDLS) | Lose | 0.8 | 0.1 | 0.1 |
| Tie | 0.33 | 0.33 | 0.33 | |
| Win | 0.1 | 0.1 | 0.8 | |
Publisher’s Note: MDPI stays neutral with regard to jurisdictional claims in published maps and institutional affiliations. |
© 2021 by the authors. Licensee MDPI, Basel, Switzerland. This article is an open access article distributed under the terms and conditions of the Creative Commons Attribution (CC BY) license (https://creativecommons.org/licenses/by/4.0/).
Share and Cite
MDPI and ACS Style
Zhang, H.; Moisan, F.; Gonzalez, C. Rock-Paper-Scissors Play: Beyond the Win-Stay/Lose-Change Strategy. Games 2021, 12, 52. https://0-doi-org.brum.beds.ac.uk/10.3390/g12030052
AMA Style
Zhang H, Moisan F, Gonzalez C. Rock-Paper-Scissors Play: Beyond the Win-Stay/Lose-Change Strategy. Games. 2021; 12(3):52. https://0-doi-org.brum.beds.ac.uk/10.3390/g12030052
Chicago/Turabian StyleZhang, Hanshu, Frederic Moisan, and Cleotilde Gonzalez. 2021. "Rock-Paper-Scissors Play: Beyond the Win-Stay/Lose-Change Strategy" Games 12, no. 3: 52. https://0-doi-org.brum.beds.ac.uk/10.3390/g12030052
Note that from the first issue of 2016, this journal uses article numbers instead of page numbers. See further details here.