
Punishment Strategies across Societies: Conventional Wisdoms Reconsidered


1
Department of Psychology, University of Haifa, Abba Khoushy Avenue 199, Haifa 3498838, Israel
2
Research & Statistical Consultant, 26/10 Haviva St., Haifa 3254713, Israel
*
Author to whom correspondence should be addressed.
Games 2021, 12(3), 63; https://0-doi-org.brum.beds.ac.uk/10.3390/g12030063
Submission received: 6 May 2021
/
Revised: 21 July 2021
/
Accepted: 27 July 2021
/
Published: 1 August 2021
(This article belongs to the Special Issue Pro-sociality and Cooperation)
Abstract
:Experiments using the public goods game have repeatedly shown that in cooperative social environments, punishment makes cooperation flourish, and withholding punishment makes cooperation collapse. In less cooperative social environments, where antisocial punishment has been detected, punishment was detrimental to cooperation. The success of punishment in enhancing cooperation was explained as deterrence of free riders by cooperative strong reciprocators, who were willing to pay the cost of punishing them, whereas in environments in which punishment diminished cooperation, antisocial punishment was explained as revenge by low cooperators against high cooperators suspected of punishing them in previous rounds. The present paper reconsiders the generality of both explanations. Using data from a public goods experiment with punishment, conducted by the authors on Israeli subjects (Study 1), and from a study published in Science using sixteen participant pools from cities around the world (Study 2), we found that: 1. The effect of punishment on the emergence of cooperation was mainly due to contributors increasing their cooperation, rather than from free riders being deterred. 2. Participants adhered to different contribution and punishment strategies. Some cooperated and did not punish (‘cooperators’); others cooperated and punished free riders (‘strong reciprocators’); a third subgroup punished upward and downward relative to their own contribution (‘norm-keepers’); and a small sub-group punished only cooperators (‘antisocial punishers’). 3. Clear societal differences emerged in the mix of the four participant types, with high-contributing pools characterized by higher ratios of ‘strong reciprocators’, and ‘cooperators’, and low-contributing pools characterized by a higher ratio of ‘norm keepers’. 4. The fraction of ‘strong reciprocators’ out of the total punishers emerged as a strong predictor of the groups’ level of cooperation and success in providing the public goods.
1. Introduction
Previous research shows that altruistic punishment is fundamental for maintaining cooperation between strangers when reciprocity and reputation effects are absent. Several experiments using the public goods game as a workhorse have demonstrated that many individuals punish free riders altruistically when punishment is costly to them and yields no personal material gain (see, e.g., [1,2,3,4,5,6]. In all experiments, when punishment was an option, group members punished harshly and cooperation increased dramatically, whereas, when it was absent, cooperation decreased at similar rates [1]. Remarkably, research has also shown that in some countries, individuals playing public goods games in groups with fixed composition (hereby “partners”) punish cooperators and defectors similarly [7,8]. The widespread phenomenon of punishing cooperators, termed “antisocial punishment”, was interpreted as costly revenge by low contributors against high contributors suspected of punishing them in previous rounds [7,8,9].
In the present paper, we reconsidered the generality of both explanations. We also tested the hypothesis concerning the pivotal role of ‘strong reciprocators’ on the emergence and sustenance of cooperation [10,11]. ‘Strong reciprocity’ describes a set of behavioral patterns, which includes a tendency to engage in cooperation with strangers, to reward others for cooperation, and to sanction others for violating a cooperative norm, even when these behaviors are costly and provide neither present nor future material benefits [2,12,13]. Research on evolutionary and experimental economics have stressed the role of strong reciprocation in the emergence and sustenance of cooperation (e.g., [10,11,13,14,15].
The reminder of the article is organized as follows: in Section 2 we reconsider the revenge explanation. We show, based on the data reported by Hermann et al. [7] of the separate participant pools, that the revenge explanation might be valid only for two cities (Samara and Seoul). We further examined the revenge explanation by conducting a study on a public goods experiment with punishment with two experimental conditions: ‘partners’ and ‘strangers’. The results of this study, to be detailed hereafter, raise serious doubts concerning the ‘revenge’ explanation for the punishment of high contributors, while suggesting an exhaustive fourfold typology of the participants depending on their contribution level and punishment behavior. Section 3 details a second study in which we reanalyzed the Hermann et al. 16-participant pool data using the above-mentioned typology. The main objectives of this study were to look for societal differences in the mix of participant types in each participant pool, and to correlate the frequency of each type with the level of cooperation and earnings in each participant pool. In particular, we were interested in further testing of the pivotal role played by strong reciprocators in enhancing and sustaining group cooperation. In Section 4, we discuss the two studies’ main findings and conclude with general remarks.
2. Study 1—Questioning the Revenge Hypothesis
Hermann et al. [7] base their revenge explanation on a significant relationship, across all participant pools of their study, between the punishment points assigned in time t and the punishment points received in period t − 1. However, a closer look at the regression coefficients of the separate participants pools reveals that in the eight participant pools that demonstrated low to moderate contribution levels and high ‘antisocial’ punishment (Muscat, Athens, Riyadh, Samara, Minsk, Istanbul, Seoul, and Dnipropetrovs’k), a significance level, at p < 0.05, was reached only for Samara and Seoul (see Table S3B in Hermann et al.’s [7] supporting material). On top of this, the regressions for five participant pools that demonstrated high contribution levels and low ‘antisocial’ punishment (Boston, Nottingham, Bonn, Zurich, and St. Gallen) were significant (at p < 0.05). Thus, while the ‘revenge’ explanation is supported by the aggregate data, its validity as a general explanation for the data is highly questionable.
To re-examine the revenge explanation, we ran a public goods experiment with punishment on 192 Israeli participants, all students at the University of Haifa. The experiment included a ‘partners’ treatment and a ‘strangers’ treatment. In the ‘partners’ treatment, the composition of the group was fixed for all rounds of the game, whereas in the ‘strangers’ treatment, the groups’ composition was changed, such that no subject ever met another subject more than once in all the rounds. We hypothesized that if punishment of high contributors is indeed an act of revenge by low contributors who suspected the former of punishing them in previous rounds, then we should expect to find a significantly lower antisocial punishment in the ‘strangers’ treatment, compared to the ‘partners’ treatment.
2.1. Method
In both treatments, groups of four members played a phase of six rounds of a public goods game with punishment, followed by another phase of six rounds of a similar game without punishment. In each round, each participant received an endowment of 20 monetary units (MUs), from which he or she could contribute any amount between 0 and 20 MUs to a group project. Each MU kept by a group member yielded one MU, and each MU contributed yielded 0.4 MUs for each group member. As the cost of contributing one MU to the project was exactly one MU, whereas the return on that MU was only 0.4 MUs, keeping all of one’s MUs was always in the participant’s material self-interest, irrespective of how much the other three group members contributed. Yet, if each group member retained all of his or her MUs, there were no earnings to be shared. On the other hand, if all group members invested their entire 20 MU endowment in the project, then each member would earn 0.4 × 80 = 32 MUs.
In the second stage of each period (the punishment stage), after all group members were informed about their investments, each group member could punish each of the other group members. A punishment decision was implemented by assigning the punished member between zero and 10 deduction points. Each deduction point assigned reduced the punished member’s earnings by three Mus and cost the punishing member one MU. All punishment decisions were made simultaneously, and participants were not informed who had punished them.
We ran eight experimental sessions of 24 subjects each, three in the ‘partners’ treatment and five in the ‘strangers’ treatment. All the experimental sessions were computer-mediated. In running the sessions, we used the “Zurich toolbox for ready-made economic experiments” (z-Tree) software [16]. In the ‘partners’ treatment, participants interacted only within their groups; thus, the unit of analysis for this treatment is the group (18 observations). On the other hand, in the ‘strangers’ treatment, all members of a session interacted with each other; thus, the unit of analysis for this treatment is the entire session (five observations). For a detailed description of the experiment, see Appendix A. In the experiment, the exchange rate between MUs and Israeli Shekel was 100 MUs = 1 Shekel (≈ $0.25).
2.2. Results
2.2.1. Cooperation
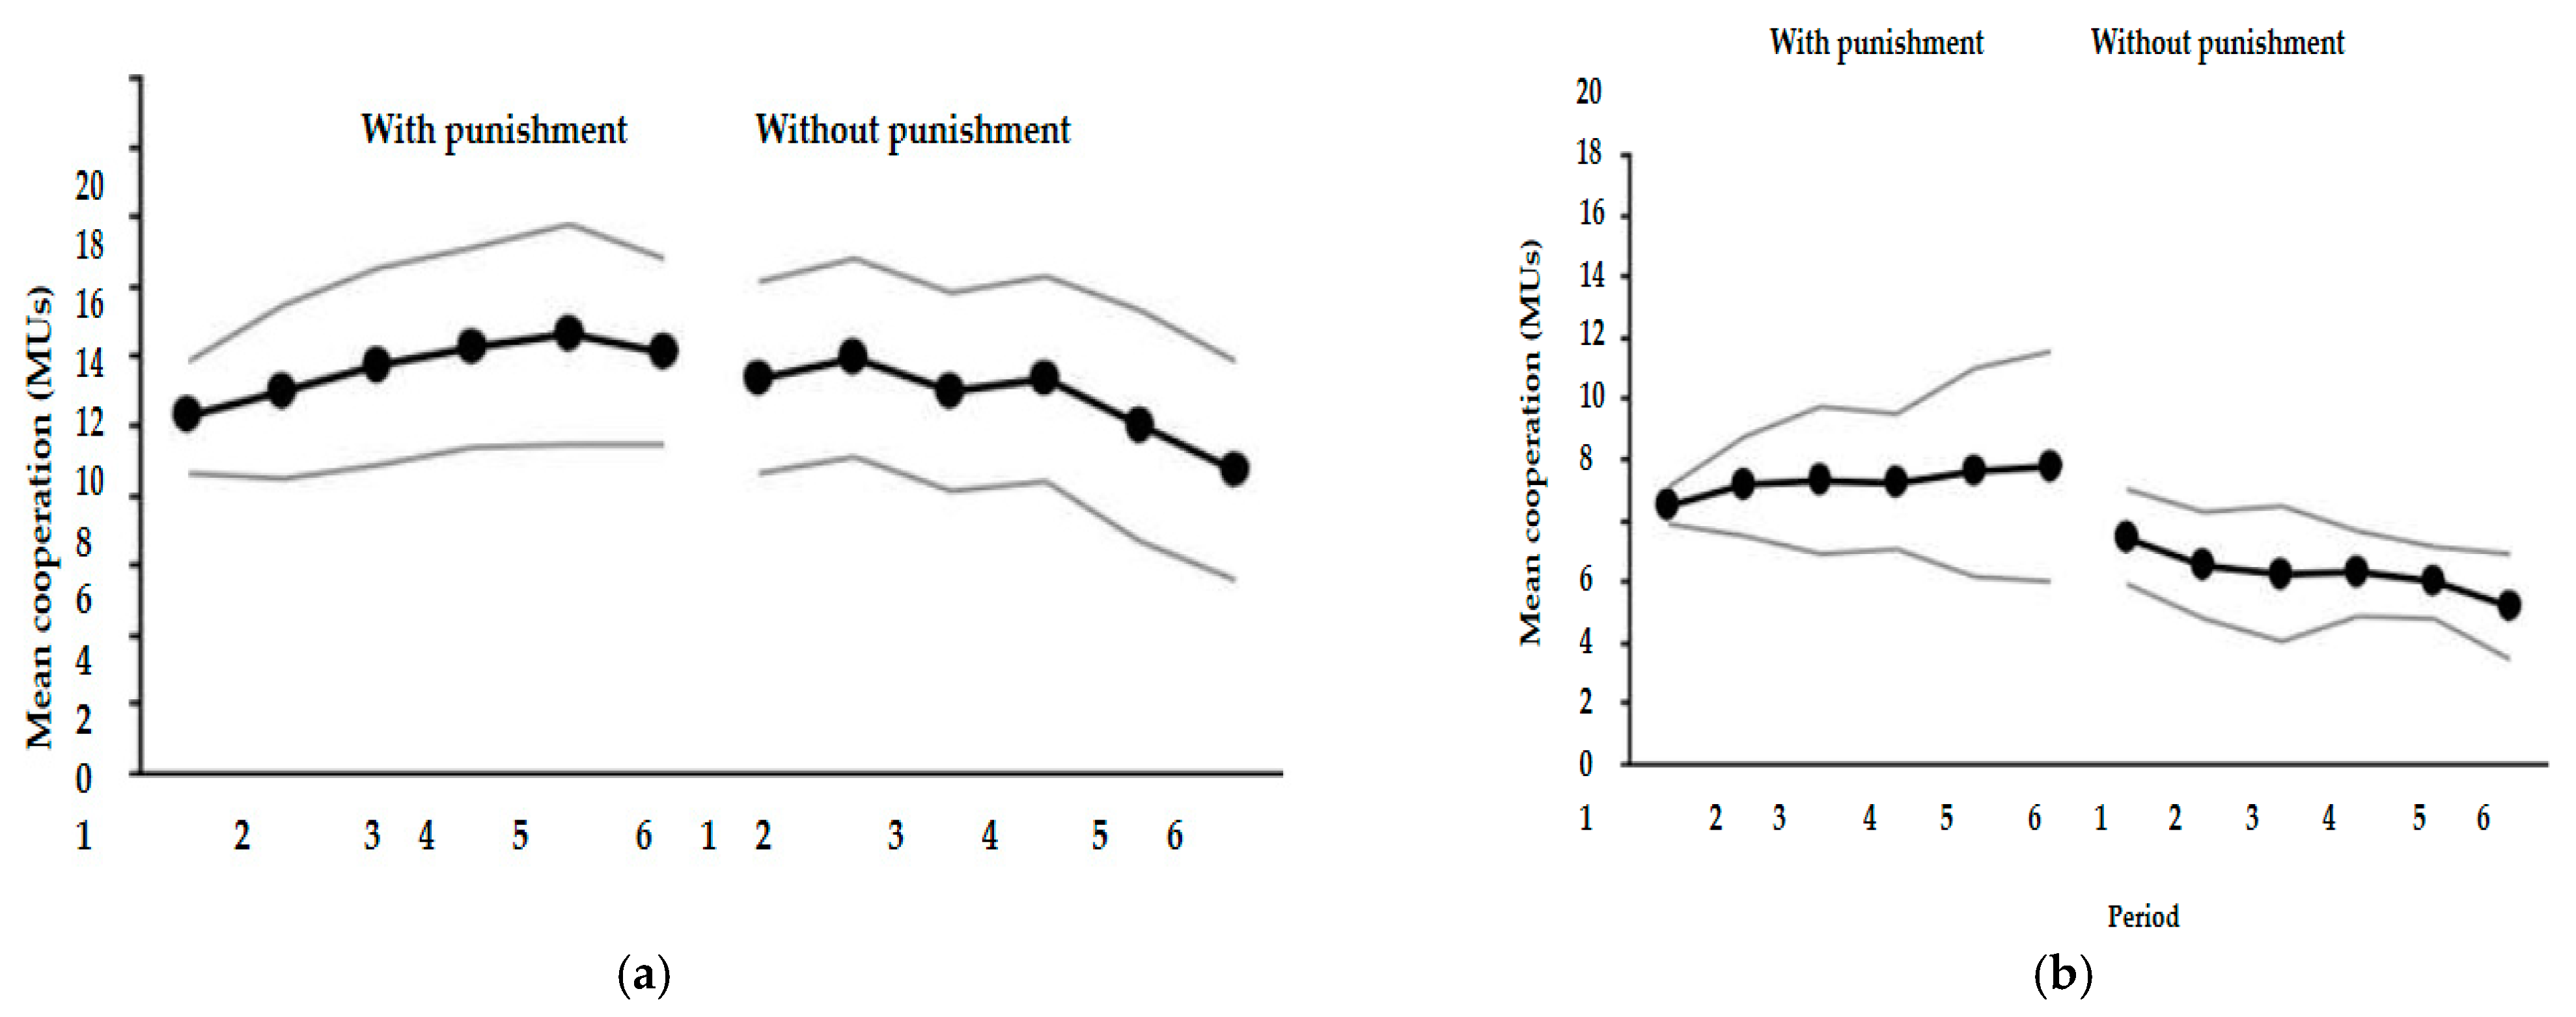
Before turning to the main question of testing the revenge explanation, we briefly summarize the contribution results. The mean contributions in each trial under the two treatments are depicted in Figure 1a,b. The efficacy of punishment in enhancing cooperation in the two treatments is quite moderate compared to the rates detected in cities from Western countries, such as Boston, Copenhagen, and Zurich, and is closest to the cooperation levels observed in non-Western cities, such as Samara and Minsk. On average, in the ‘partners’ treatment, punishment increased the contribution level from 10.63 MUs in the first two periods to 12.40 MUs in the last two periods (the difference is significant at p = 0.0203 using the signed-rank test, two-tailed). In the ‘strangers’ treatment, punishment increased the mean contribution from 8.33 MUs in the first two periods to 9.67 MUs in the last two periods (the difference is not significant, p = 0.625 using the signed-rank test, two-tailed). Interestingly, while the removal of punishment in the ‘partners’ treatment was associated with only a slight drop of 0.94 MUs in the mean contribution (from 11.67 to 10.73 MUs, the difference is not significant at p = 0.5226 using the signed-rank test, two-tailed), the removal of punishment in the ‘strangers’ treatment was associated with a drop of 2.99 MUs in the mean contribution (from 9.27 to 6.29 MUs, difference is significant at p = 0.0625 using the signed-rank test, two-tailed).
2.2.2. Punishment
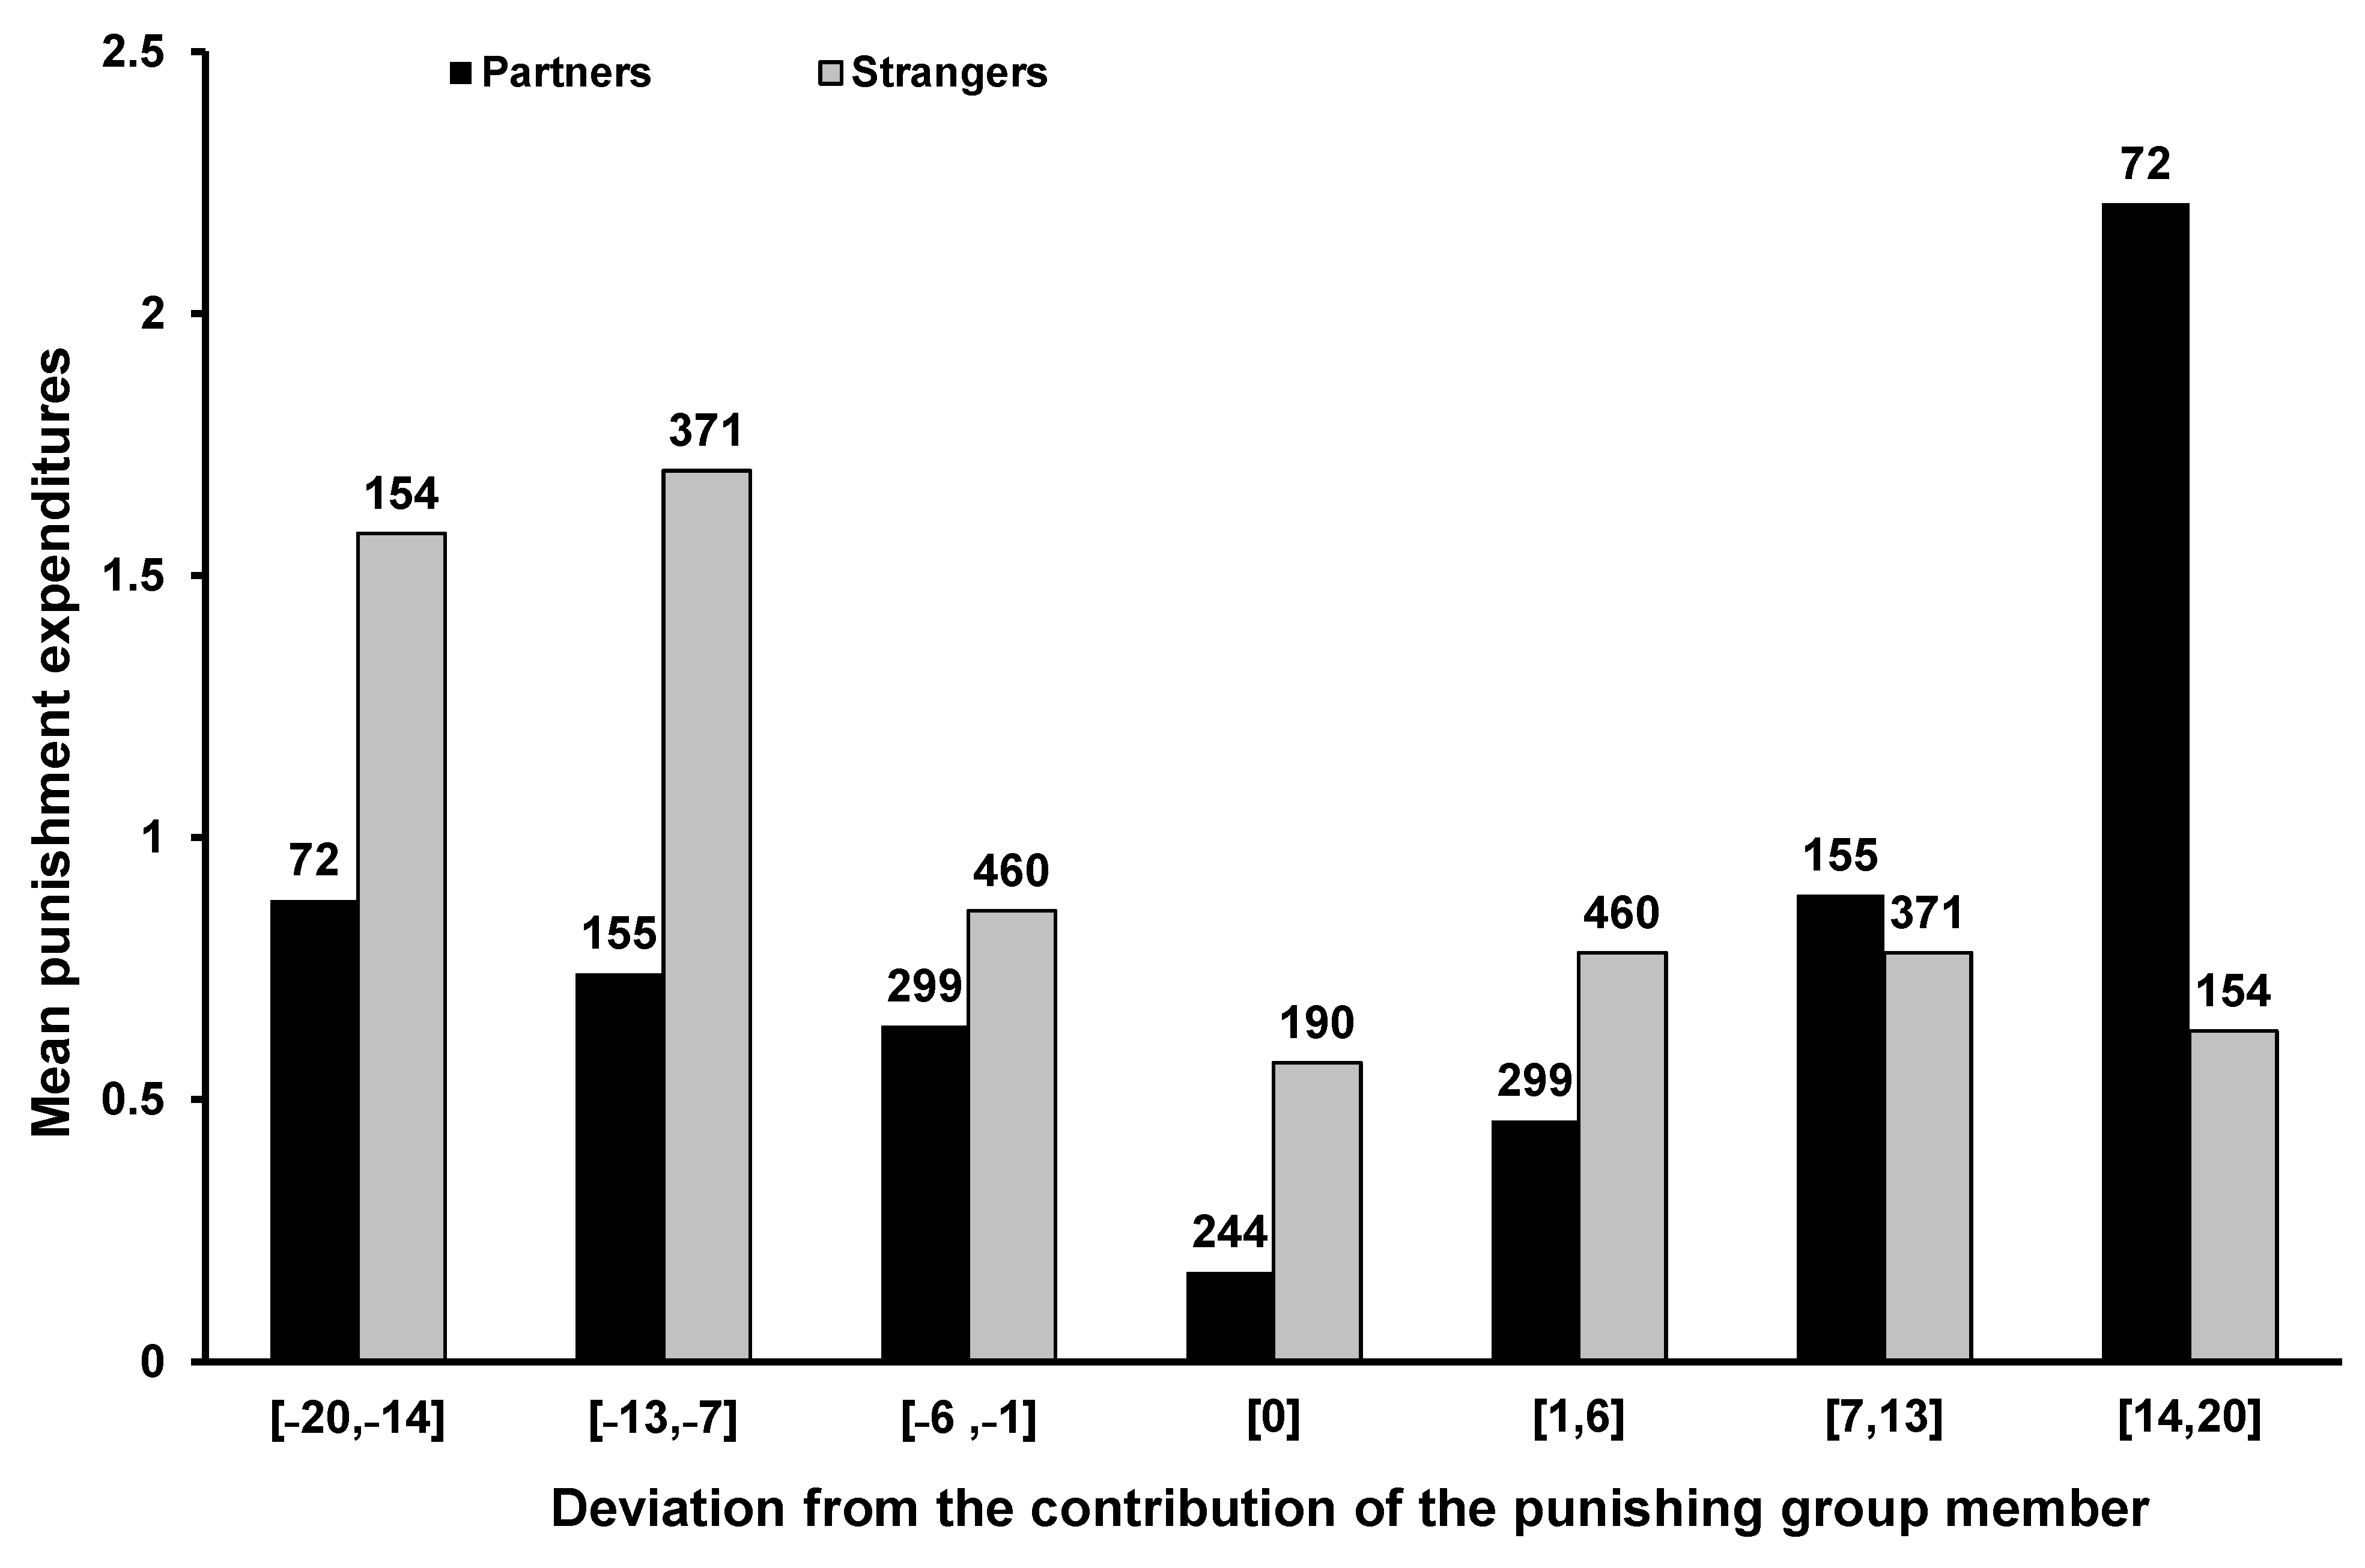
The punishment expenditures in the two treatments are shown in Figure 2, which depicts the expenditures on punishment as functions of the deviation of the contribution of the punished group member from the contribution of the punishing member. The bars corresponding to negative deviations in the histogram indicate mean expenditures on punishing free riders, and the bars corresponding to non-negative deviations indicate mean expenditures on punishing cooperators. The figure above each bar indicates the number of observations in the respective interval. As the figure shows, the patterns of punishment in the two treatments are similar. In both treatments, the higher the absolute difference between the contributions of the punished player and the punishing player, the more punishment points were assigned.
Figure 3 depicts the overall mean expenditures on punishing free riders and on punishing cooperators in the two treatments. As the figure shows, the expenditure on punishing free riders was significantly higher in the ‘complete strangers’ than in the ‘partners’ treatment (1.29 and 0.72 MUs per punishment opportunity, respectively, p = 0.0193, two-sided Wilcoxon exact test). On the other hand, the figure reveals that the mean expenditures on punishing cooperators in the strangers treatment were almost equal to the expenditure of punishing cooperators in the partners treatment (the difference is insignificant, p = 0.1076, two-sided Wilcoxon exact test).
We also tested the revenge explanation directly. For this purpose, we conducted a series of Tobit regression analyses on the points assigned to punishment in period t as a function of the punishment points received in period t − 1, the contribution of the punished group member at time t, the contribution of the punishing group member at time t, and the average contribution of the other two group members at time t. We used a Tobit estimation procedure to account for the fact that the dependent variable is censored at 0 and 10 punishment points [17,18]. Table 1 depicts the results of the Tobit analyses. Inspection of the table reveals that, contrary to the revenge explanation, in the two treatments, punishment of cooperators in period t was not correlated with the punishment received in period t − 1.
The table also shows that in both treatments, the contribution of the punished group member best explains the points assigned to punishment. In the ‘partners’ treatment, the regression coefficient between the assigned punishment points and the punished contribution is b = 0.203 (p < 0.0001), and in the ‘strangers’ treatment, the regression coefficient is b = 0.366 (p < 0.0001). The negative coefficients indicate that the less a group member contributes, the more punishment points he or she receives. Interestingly, in the ‘partners’ treatment, the punishment of free riders is significantly correlated with the mean contribution of the other group members (regression coefficient of 0.121, p < 0.0001) but not with the punisher’s contribution (p = 0.673), whereas in the ‘strangers’ treatment, the punishment of free riders is significantly correlated with the punisher’s contribution (regression coefficient of 0.101, p = 0.005) but not with the mean contribution of the other group members (p = 0.570). These findings suggest that for situations in which the groups’ composition is kept fixed, a collective benchmark partly explains the punishment of free riders. Conversely, when the group composition is varied from period to period, an individualistic benchmark partly explains the punishment of free riders.
2.2.3. Other Punishment Strategies
In search of alternative explanations to the observed punishment of cooperators, we looked at participants who consistently used the same punishment strategy in all rounds of the punishment phase. This classification yields four types: group members who cooperated but never punished (‘non-punishers’); group members who cooperated and punished low contributors (‘strong reciprocators’); group members who punished upward and downward relative to their own contribution (‘norm-keepers’), and group members who punished only cooperators (antisocial punishers). Table 2 depicts the relative frequencies of each type, together with the means (and SDs) of the punishment points, and the contribution of each type.
The table shows that, with the exception of a slightly lower ratio of ‘strangers’ who never punished, participants in each treatment are distributed almost evenly between non-punishers, strong reciprocators, and participants, who punished free riders and cooperators alike. In both treatments, the ratio of participants who punished only cooperators was negligible (3.1% and 5.3% for partners and strangers, respectively). Thus, what was previously interpreted as antisocial punishment appears to be predominantly part of an upward–downward punishment strategy that some participants have used against deviants from their own contributions.
We also compared the mean contributions of non-punishers, strong reciprocators, and upward–downward punishers. For the ‘partners’ treatment, a generalized estimating equations (GEE) analysis [19,20] revealed that cooperators who did not punish and strong reciprocators contributed more than upward–downward punishers (χ2(1) = 8.22, p = 0.0041 and χ2(1) = 4.27, p = 0.039, respectively). A similar analysis for the ‘strangers’ treatment revealed that strong reciprocators contributed more than cooperators who did not punish (χ2(1) = 8.32, p = 0.0039) and more than the upward–downward punishers (χ2(1) = 89.43, p < 0.0001).
3. Study 2. Punishment Strategies across Societies
In this study we reanalyzed the Hermann et al. data using the above detailed typology of punishment strategies. Table 3 depicts the results for two participant pools with the highest mean contribution (Boston and Nottingham) and two participant pools with the lowest mean contribution (Athens and Riyadh). The complete table for the 16 investigated participant pools is depicted in Table A1, Appendix C. The top figure in each cell in Table 3 indicates the percentage of participants who used the respective strategy. The figure below indicates the participants’ numbers, and the bottom figure indicates the mean contribution of participants using the respective strategy. Table 3 and the complete table (see Appendix C) reveal stark differences between high- and low-contributing pools. For example, out of the participants in Boston (who contributed, on average, 18 MUs out of 20), 41% contributed 18.37 MUs and never punished, 45% contributed 18.37 MUs and punished free riders, 10% contributed 16.35 MUs and punished low and high contributors, and 4% contributed 12.55 and punished only high contributors. By contrast, the results for Athens show that the percentages of non-punishers and punishers of free riders were considerably low (11% and 10%, respectively), with a majority of participants (55%) punishing both low and high contributors.
Overall, Table 3 and Table A1 clearly show that participant pools in which punishment was effective in enhancing cooperation are characterized by high percentages of strong reciprocators, and of cooperators who did not punish, along with low percentages of punishers of cooperators. Conversely, participant pools in which punishment was ineffective in enhancing cooperation are characterized by low percentages of strong reciprocators and cooperators who did not punish, along with high percentages of ‘norm-keeper’ participants who punished both cooperators and non-cooperators. Additionally, the percentage of ‘antisocial punishers’, who punished only cooperators, was relatively low in most participant pools, regardless of their mean contribution levels.
3.1. Punishment as Deterrence
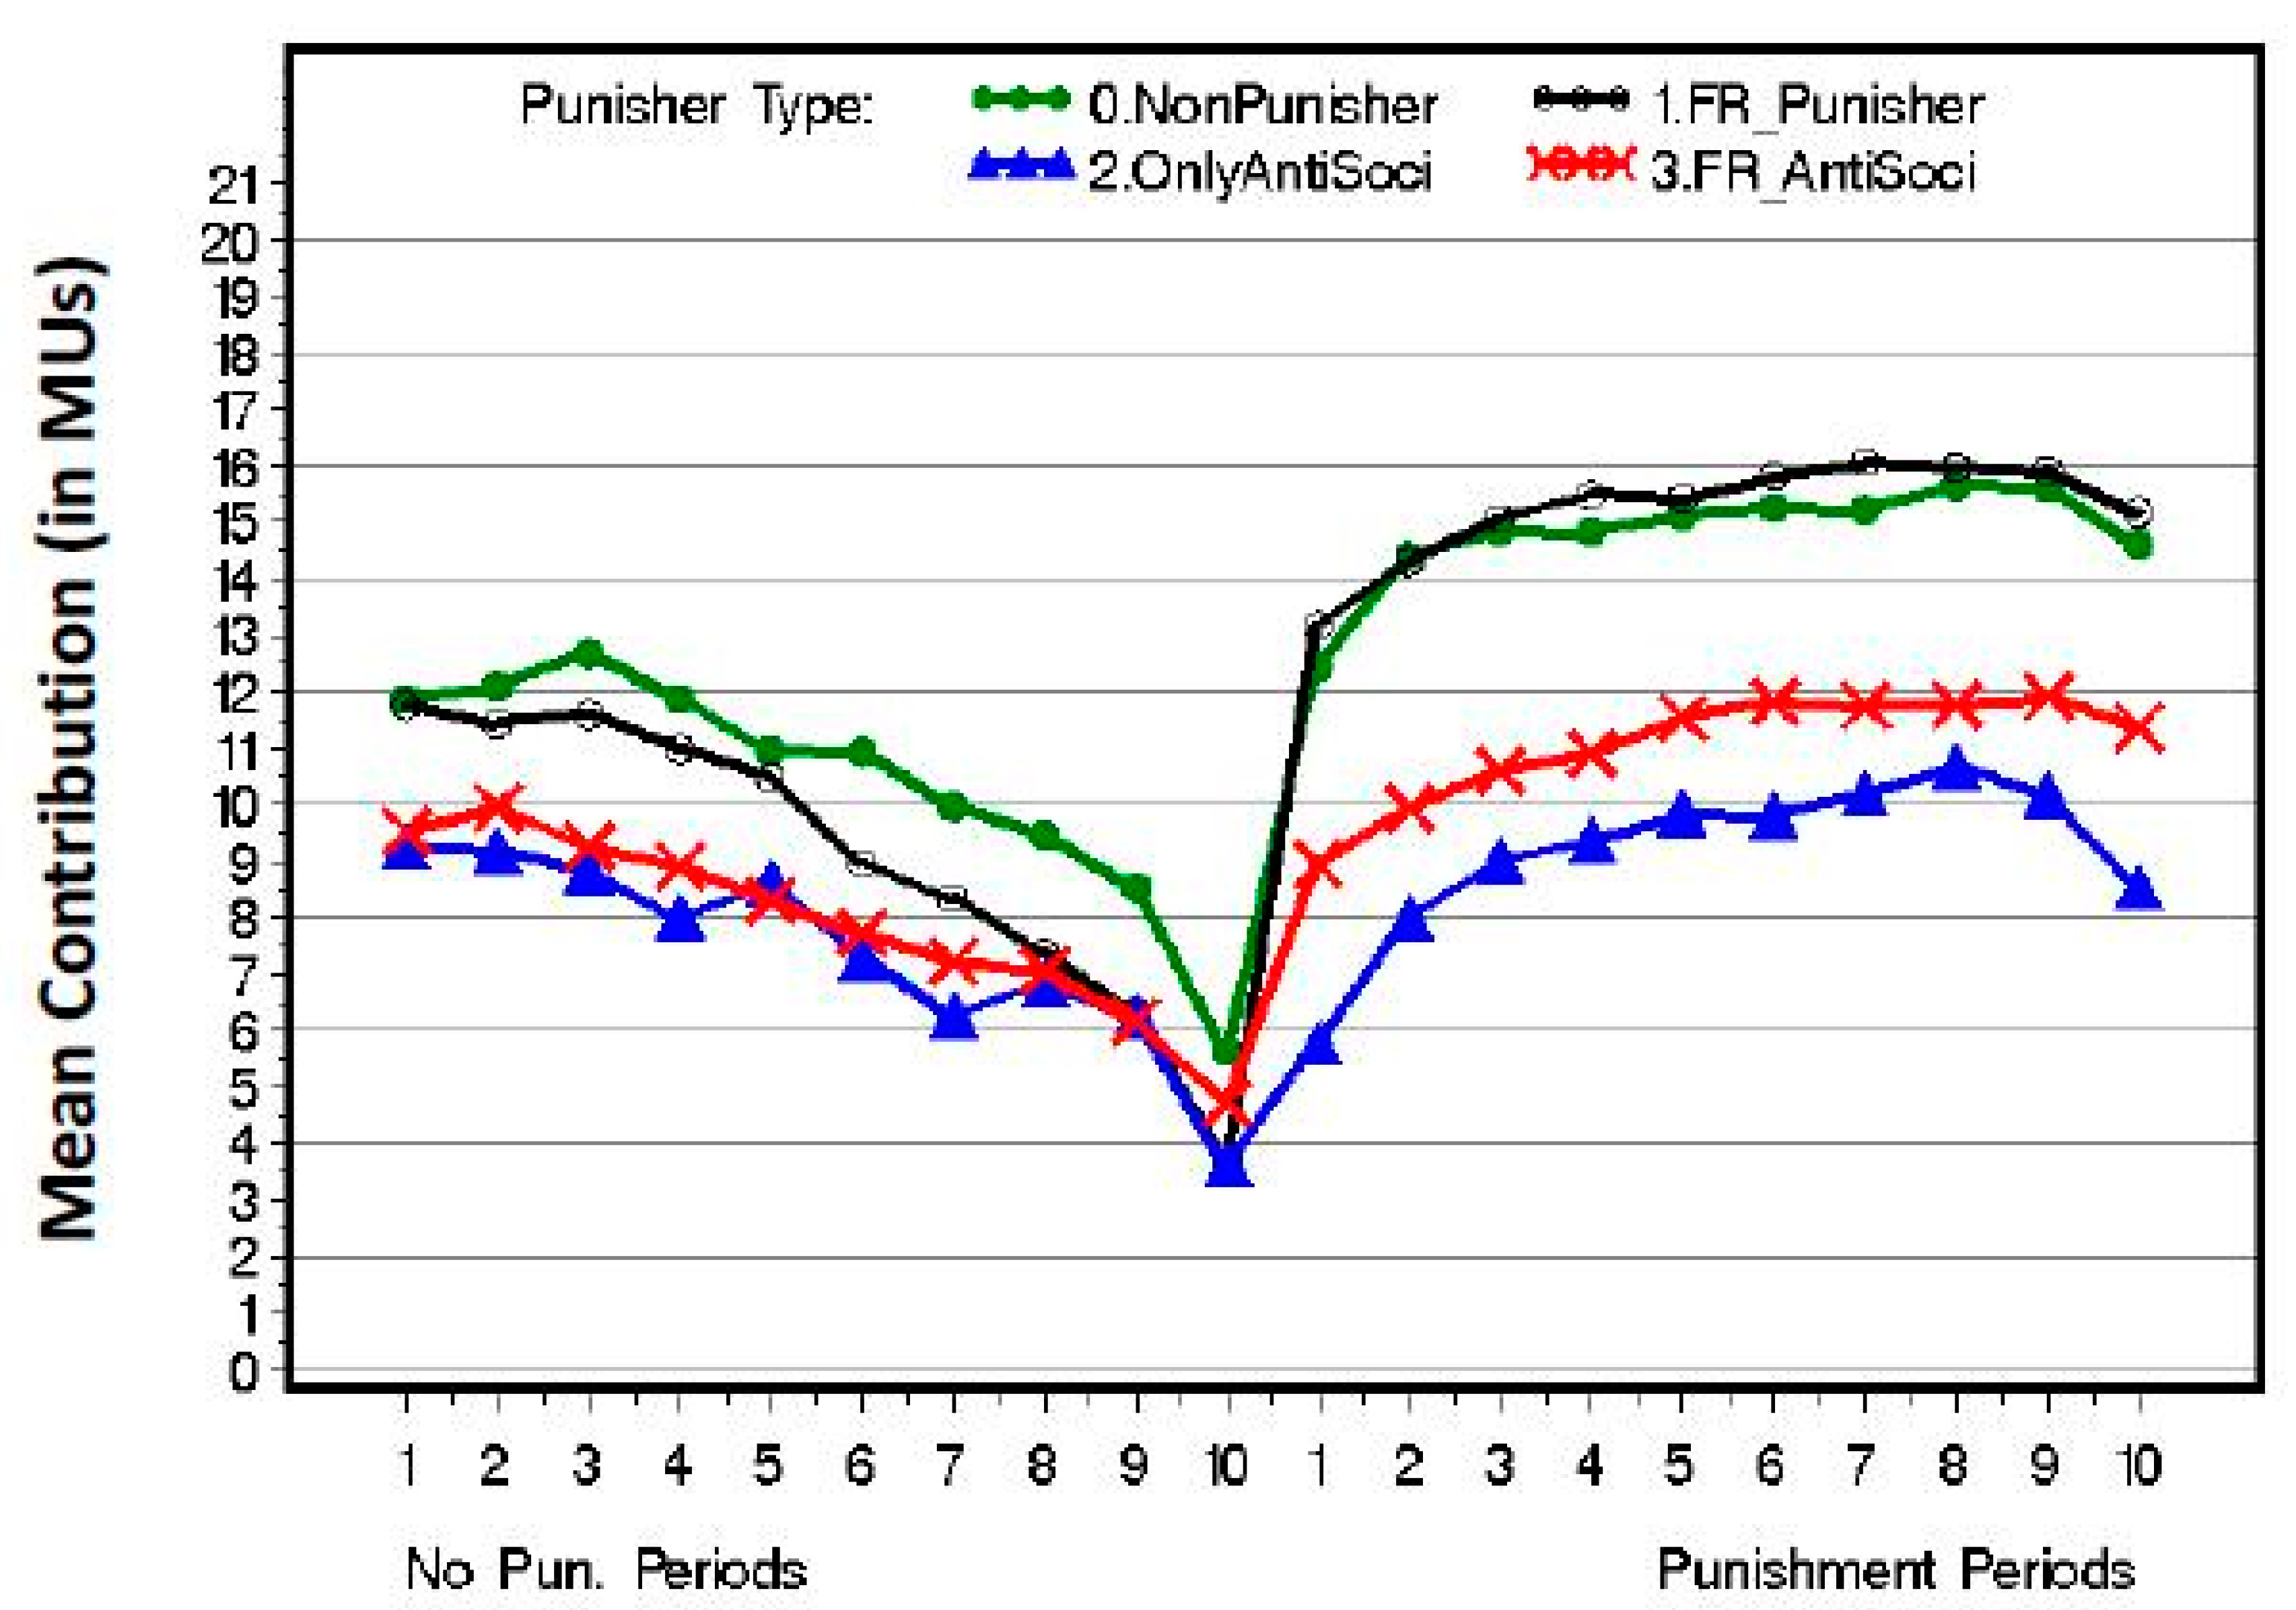
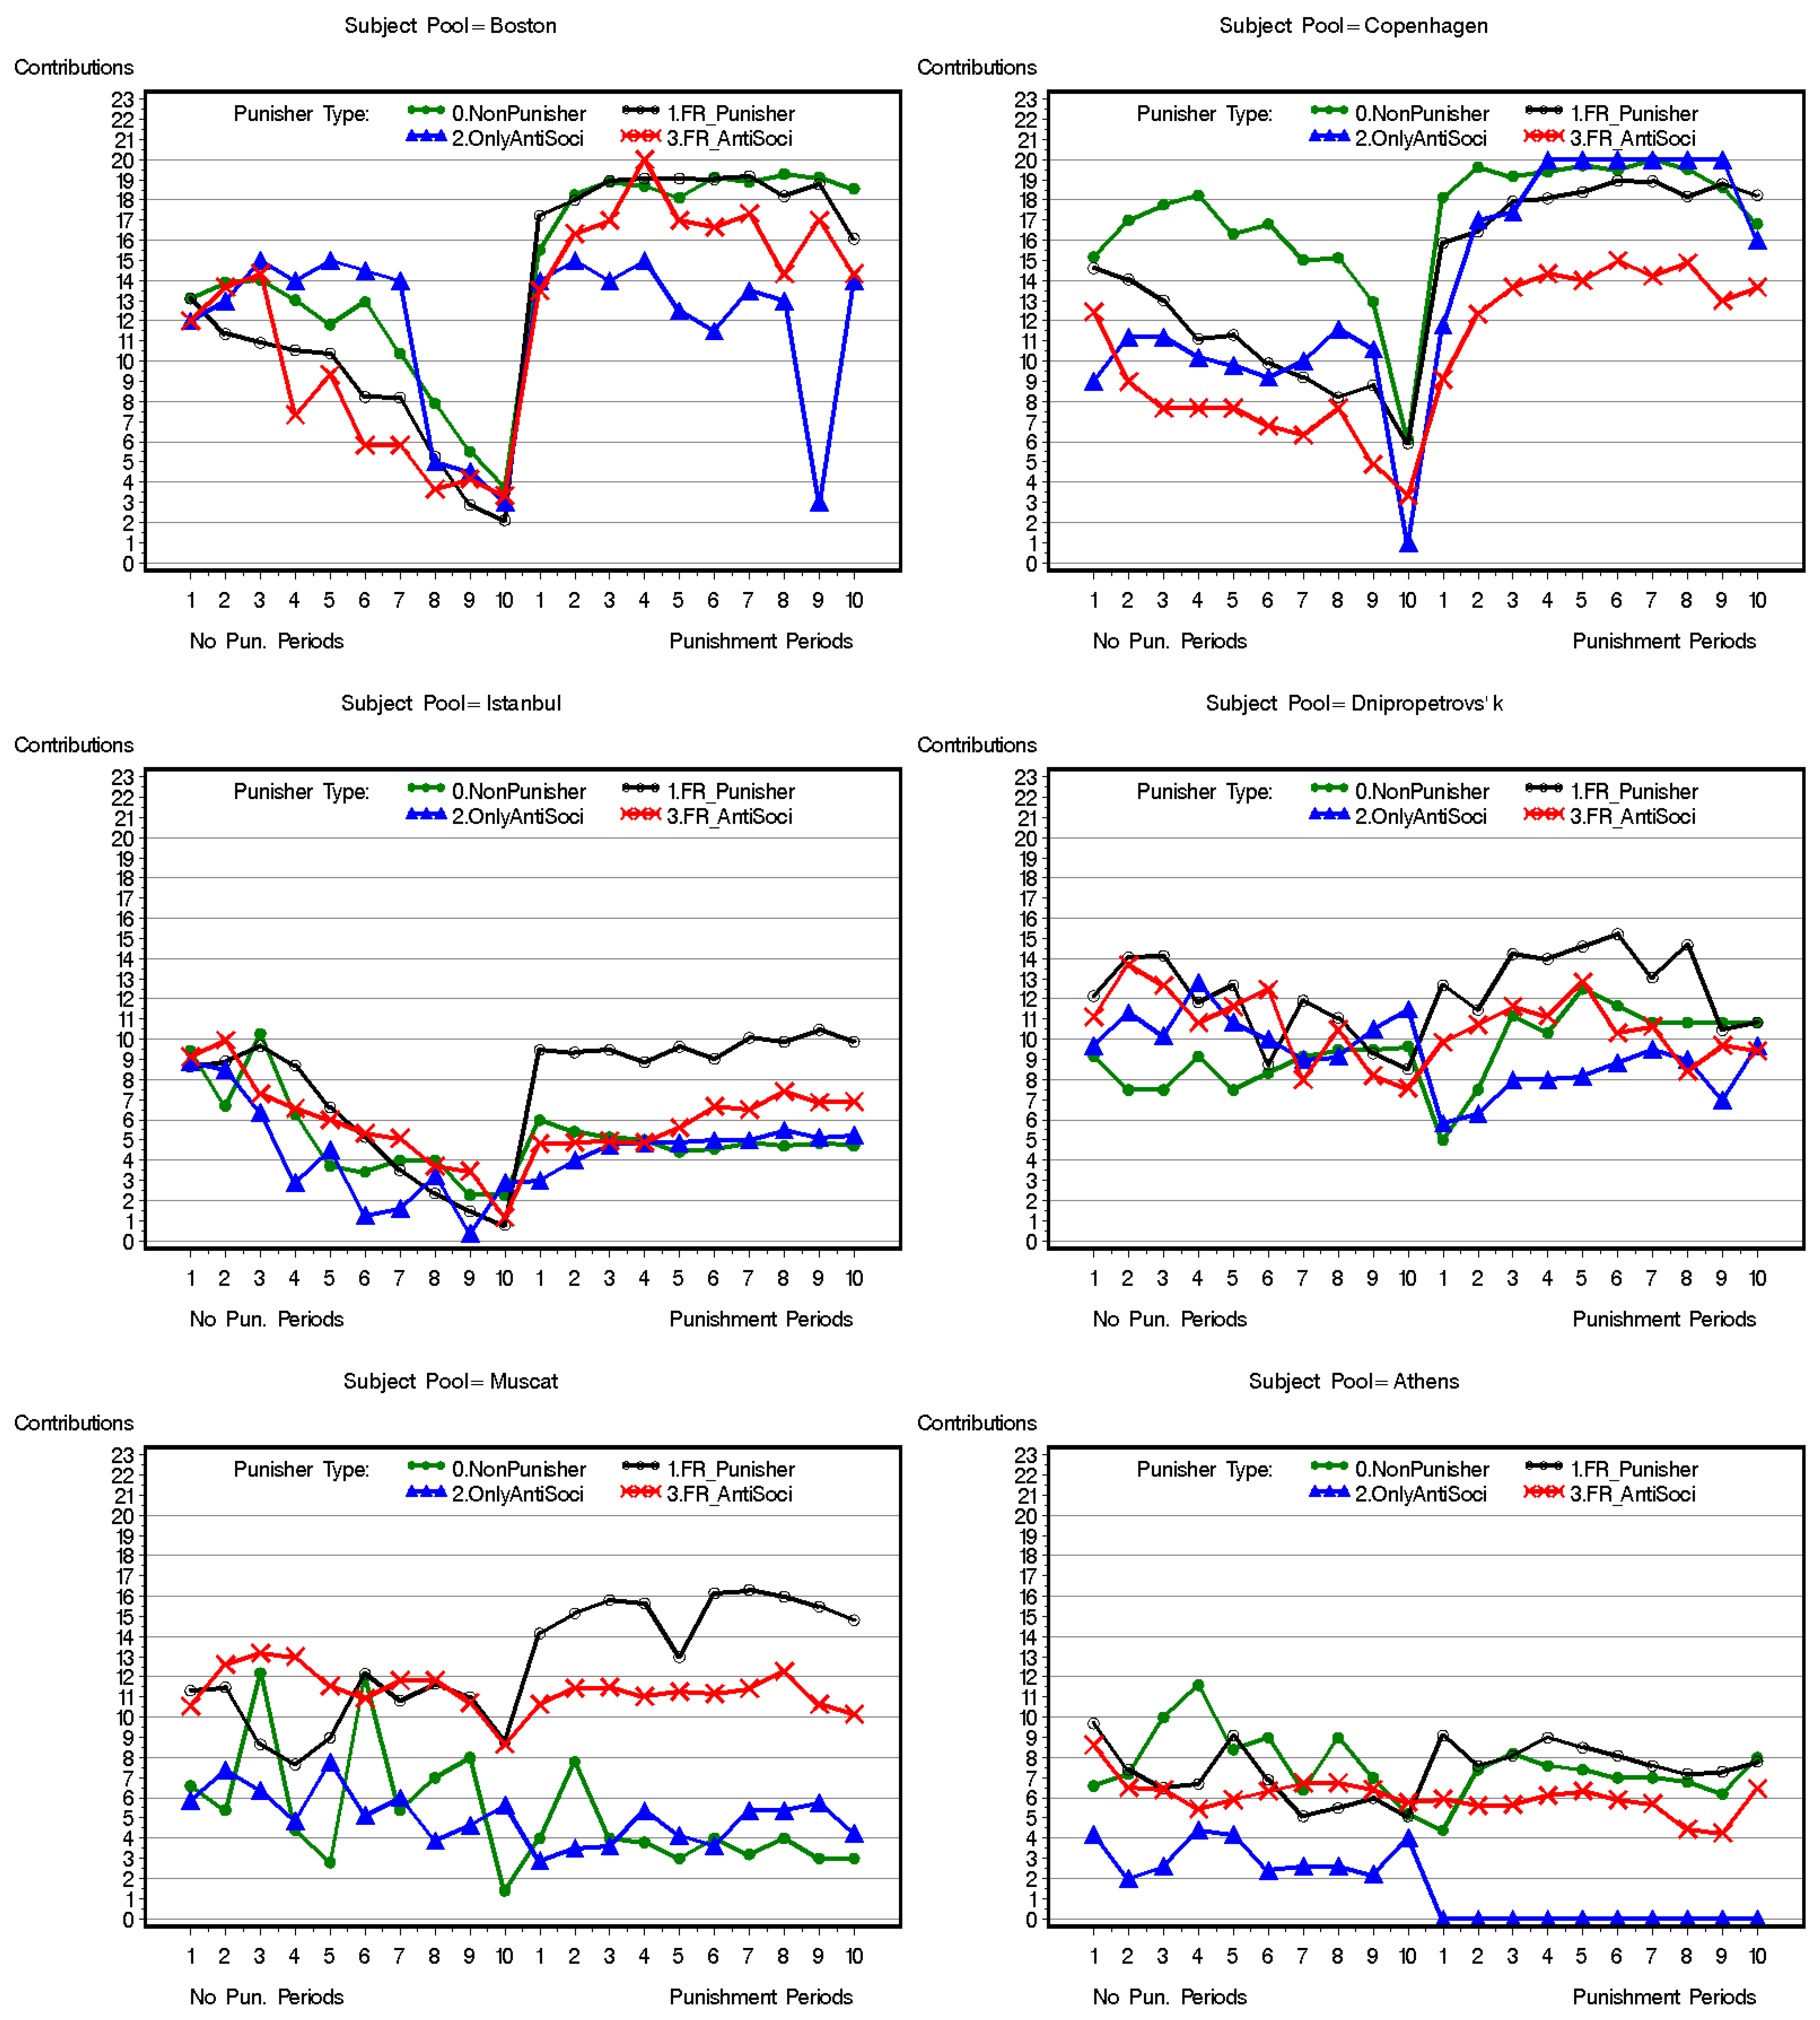
The common view holds that the importance of punishment in promoting cooperation lies in the fact that it deters free riders from exploiting the cooperation of others [1,3]. We tested this argument by looking at the effect of punishment on participants who used different types of punishment strategies. For this purpose, we reanalyzed the raw data collected by Hermann et al. [7] and compared the mean contributions of the four punisher types across all 16 participant pools. Figure 4 depicts the mean contributions of the four punisher types in the no-punishment and punishment rounds of the game (corresponding figures for representative pools from cities with high, moderate, and low contributions are included in Appendix D).
Strikingly, the figure reveals that more than being instrumental in increasing the contribution of upward–downward punishers and of antisocial punishers, the possibility of sanctions was instrumental in increasing the contributions of strong reciprocators and cooperators who did not punish. The figure also shows that for strong reciprocators and non-punishing cooperators, the increase in cooperation in the first round of the punishment phase is more than the total increase in cooperation in all the subsequent rounds. As in the experiment the contribution decisions were made prior to the punishment decisions, the significant increase in cooperation in the first round of the punishment phase is due to an anticipatory effect of punishment, rather than to the punishment itself, implying that the possibility of being punished was more effective than the actual punishment.
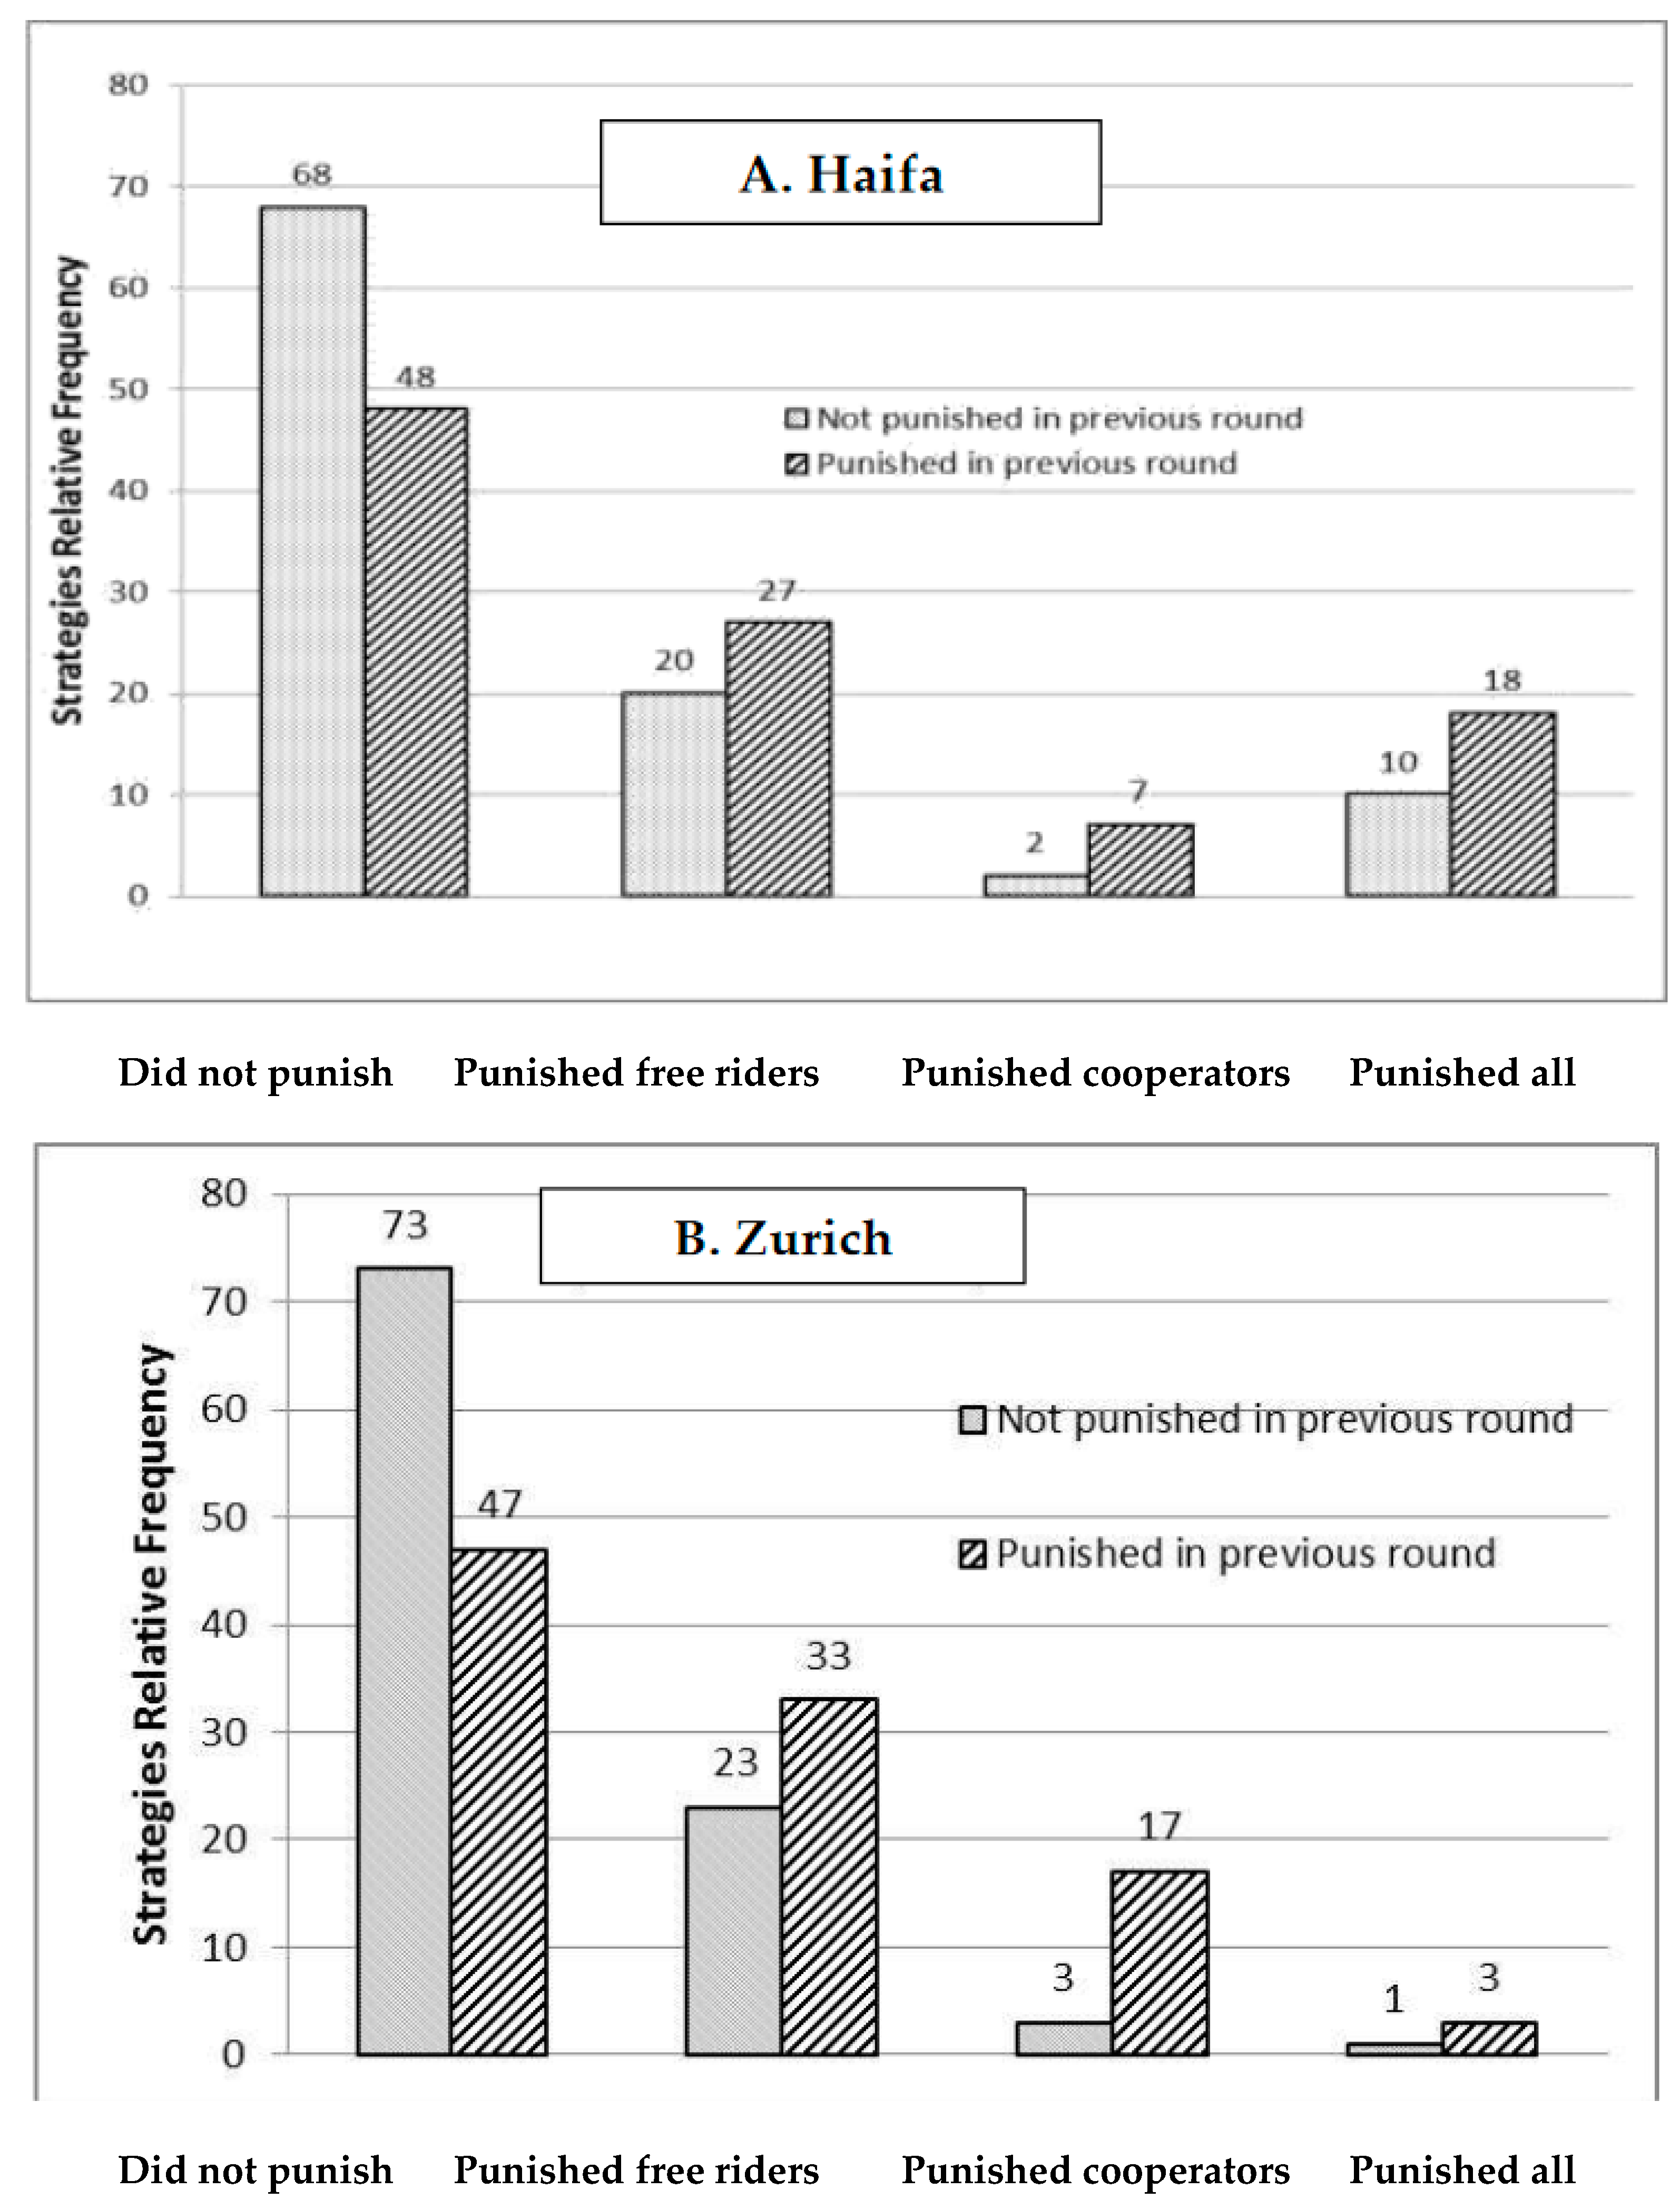
We also looked at the effect of participants being punished in a given round on their investment in punishing others in the subsequent round. Rather than looking at types of punishers, we looked at the sample space of all punishment strategies played at each round of the game. For a given round t, each player could have played one of four strategies: do not punish, punish only low contributors, punish only high contributors, or punish both high and low contributors. Figure 5a,b depicts the relative frequencies of the four punishment strategies in Haifa’s participant pool (from Study 1), in which the effect of punishment on contribution was moderate (Figure 5a), and the corresponding frequencies in Zurich (From Study 2), in which the effect of punishment on contribution was significant (Figure 5b). The light shaded bars in each figure correspond to the relative frequencies of the various punishment strategies in cases in which the focal player was not punished in the previous round, and the dark shaded bars correspond to the frequencies of the same strategy when the focal player was punished in the previous round. The figures show that in the two participant pools, the frequencies of the “cooperated, but did not punish” strategy was significantly lower when participants were punished in the previous round, compared to when they were not. In Haifa’s pool, the relative frequency of “cooperated, but did not punish” was 20% lower (48% compared to 68%). In Zurich’s pool, the frequency of the same strategy was 26% lower following punishment than following no-punishment (47% compared to 73%). Concurrently, the percentage of strong reciprocation (punish only free riders) increased by 7% in Haifa and by 10% in Zurich. Additionally, in Haifa, the frequency of “norm keeping” (punish high and low contributors) increased by 8%, and in Zurich, the antisocial punishment increased by 14%. In the total analysis, punishment seems to have caused a sizable minority of contributors who did not punish in a given round (about 30% in Haifa and 36% in Zurich) to switch to strong reciprocation in the subsequent round. Others seem to have responded to being punished either by punishing antisocially (in Zurich) or punishing high and low contributors alike (in Haifa).
3.2. Strong Reciprocators and Cooperation
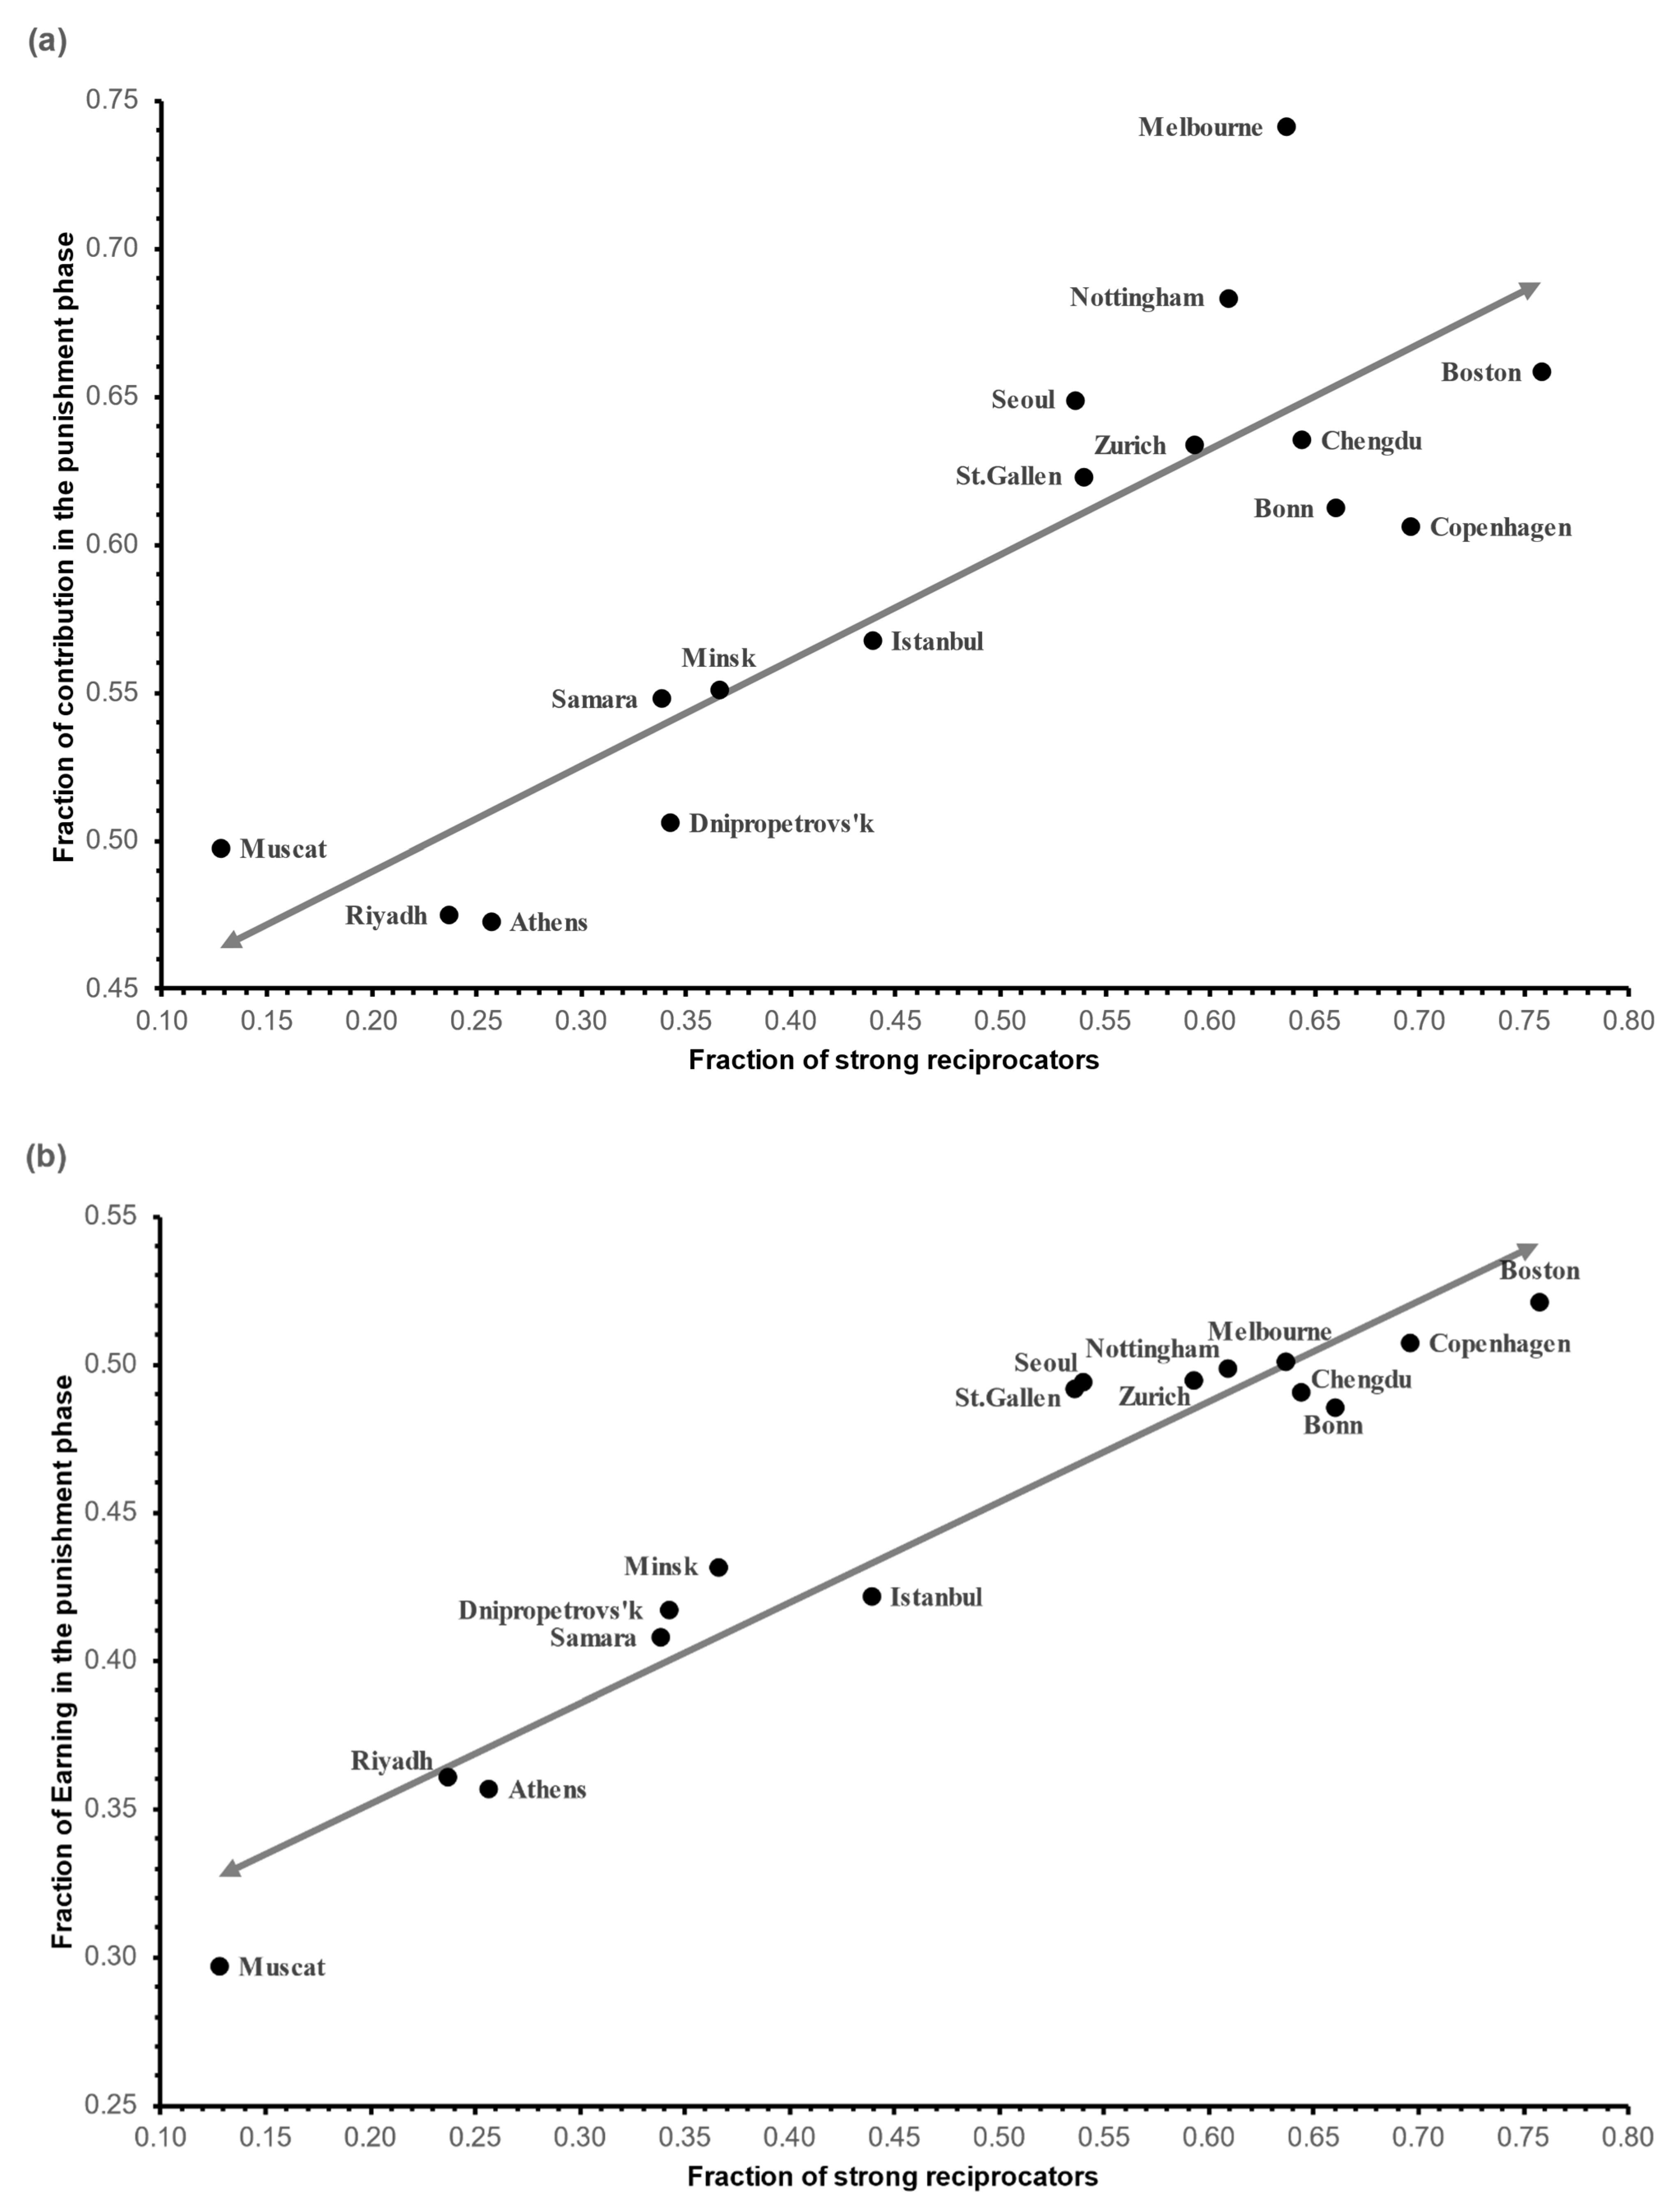
Our typology of participants into various punisher types enabled a direct test of the role of strong reciprocators is promoting cooperation in public goods games. For each participant pool investigated in Hermann et al. [7], we calculated the fraction of strong reciprocators, out of the total number of punishers in the respective pool, along with fraction of the contributions (and net earnings) in the punishment phase, out of the total contributions (and net earnings) in the no-punishment and punishment phase. The results are depicted in Figure 6a,b, respectively. The resulting Pearson correlation coefficients between the fraction of strong reciprocators and the fraction of contributions was r = 0.858, p < 0.0001, and the correlation between the fraction of strong reciprocators and the fraction of net earnings was r = 0.962, p < 0.0001.
4. Summary and Concluding Remarks
In the present paper, we reconsidered two widespread conventions concerning the functionality of punishment in public goods games. One is the claim that punishment works as a deterrent to potential free riders, and the second is that antisocial punishment is revenge by low cooperators directed against high cooperators suspected of punishing them in previous rounds.
With regard to the claim that punishment enhances cooperation by deterring free riders, our findings show that this explanation does not tell the whole story. Using data from a new experiment on participants from the city of Haifa, Israel, and from 16 participant pools from cities around the world [7], we found that the effect of punishment on the emergence of cooperation is mainly due to contributors increasing their cooperation, rather than from free riders being deterred.
Another unexpected phenomenon that our results suggest is that a sizable minority of contributors who are punished in a given round behave in the next round as strong reciprocators, and thus contribute their part in punishing free riders and in enhancing the overall group cooperation.
Our findings also contradict the conventional claim that punishment of high cooperators is an act of revenge by low cooperators. First, the data of Study 1 reveal that the punishment of cooperators was of the same magnitude in the ‘strangers’ treatment as in the ‘partners’ treatment. Second, in the two treatments in Study 1, the punishment points allocated in period t were not correlated with the punishment received in period t − 1. Third, in our participant pool and in all participant pools reported in Hermann et al. [7], the rates of punishers of only cooperators were quite low (see Table 2 and Table 3, Table A1 in Appendix C). Fourth, in all participant pools, the majority of punishers of high contributors punished both high and low contributors. They also contributed about half of their endowments, and thus they are not low contributors who might have acted vengefully against high contributors. In fact, they invested as much in punishing free riders as in punishing cooperators (see Table 2). We note that although we used the term ‘norm-keepers’ to characterize the behavior of participants who punished both low and high contributors, other explanations for such a behavior are possible. One possible explanation could be provided by ‘inequality aversion’ theory [21].
Other main conclusions derived from the previous analysis are the following:
1. Contrary to the common wisdom that punishment affects free riders, causing them to increase their contributions, which in turn enhances groups’ cooperation, we found that the punishment condition enhances cooperation, mainly by increasing the contributions of strong reciprocators and cooperators who do not punish (Figure 4), and that inflicted punishment causes a fraction of cooperators who do not punish to act as strong reciprocators (see Figure 5a,b).
2. Interestingly, we found that the anticipation of being punished or of inflicting punishment was more effective than the actual inflicted punishment, particularly with regard to high contributors. Worth noting is that the ‘anticipation effect’ of punishment was as strong in all previous public goods games in which rounds with no punishment preceded the punishment phase. In all reported results, a dramatic overshoot in cooperation occurred in the first round of the punishment phase, before any punishment had been applied, but this effect was somehow obscured from investigators’ eyes. From a policy-making perspective, the differential effect of an anticipated punishment on participants playing different punishment strategies (see Figure 4) suggests that institutions that plan to impose sanctions on rule violators (e.g., driving above a speed limit) might fare better by not appealing primarily to frequent rule breakers.
3. An important result of the present study is that in all participant pools, subjects could be classified according to their punishment strategies into four groups: cooperators (who cooperate but do not punish), strong reciprocators (who cooperate and punish free-riders), antisocial punishers (who punish only cooperators), and norm-keepers (who punish low and high cooperators). This finding lend strong support to the view that individuals and social groups vary in their use of sanctions against others to achieve different objectives [5,22,23,24]. Bruhin et al. [23], utilizing the data of the Hermann et al. study, delineated two mutually exclusive types of punishers: norm-keepers who punished both cooperators and free riders, and strong reciprocators who punished only free riders. Our exhaustive classification added two other types: contributors who did not punish and antisocial punishers. We found that participant pools which exhibited high levels of cooperation had relatively high percentages of strong reciprocators and cooperators who did not punish, and low percentages of antisocial punishers.
Similar to the Bruhin et al. analysis, norm-keepers emerged in our analysis as a sizable group. This finding adds to ample evidence showing that social norms play an important role in determining the contribution and punishment behaviors in collective action situations [23,24,25,26,27]. For example, Parks and Stone [25] found that high contributors were perceived by group members as norm breakers, who should be excluded from the group, and that participants in a reward treatment primarily rewarded group members whose contributions were equal to theirs. More recently, Kawamura and Kusum [26] found that unfavorable evaluations of altruism depended on how much it deviated from social norms, particularly in societies with low tolerance for deviation from accepted norms.
4. Many studies on the role of punishment in the evolution of cooperation have emphasized the crucial role of strong reciprocity in promoting and sustaining cooperation (e.g., [8,9,10,28,29,30]). Gintis et al. ([9], p. 154) argued that “the evolutionary success of our species and the moral sentiments that have led people to value freedom, equality, and representative government, are predicated upon strong reciprocity and related motivations”. Our results lend strong empirical support to this view by showing that the fraction of strong reciprocators out of the total punishers in a group, is a potent predictor of the group’s level of cooperation and its success in providing public goods.
Finally, three general remarks are in order:
First, from a policy-making perspective, the revenge explanation leads to the conclusion that to shun revenge, the use of sanctions should be centralized in the hands of the state. On the other hand, if a norm-enforcement mechanism could be maintained through non-centralized “mutual coercion mutually agreed upon” [31], then the need for punishment will be reduced to a minimum, and the benefit for each group member will be maximized. Such a mechanism is possible if all or most group members agree on permitted minimum and maximum levels of contribution.
Second, our results suggest that the enforcement and maintenance of cooperation in a group with no interference of a central authority requires that a sizable number of its members behave as strong reciprocators.
Third, an interesting question which experimental studies like ours cannot answer satisfactorily is whether the different mixes of punishment strategies are transitory, or relatively stable. The second possibility is intriguing because it suggests that cultural differences in producing public goods reflect wider cultural differences in the evolution of social contracts and norms. According to such a perspective, the evolved norm in countries where we detected high percentages of cooperators and strong reciprocators favors high cooperation and disfavors low cooperation, whereas the evolved norm in countries where we detected high percentages of punishers of both high and low contributors is a mediocrity norm that favors normative behaviors and disfavors deviations from the norm. The possibility that different mixes of punishment styles could be in equilibrium is supported by agent-based simulations, as well as by experiments, showing that instead of evolving into homogeneous populations, the population dynamics often evolve into heterogeneous populations comprising multiple strategy types that coexist at equilibrium [10,32,33,34,35,36,37].
Author Contributions
Both authors conceived and designed Study 1. Y.S. collected the data of Study 1, and analyzed the data of studies 1 & 2. Both authors interpreted the data and worked on the first draft. R.S. wrote the final versions of the manuscript. All authors have read and agreed to the published version of the manuscript.
Funding
This research was supported by the Israeli Science Foundation (grant No. 1213/11).
Institutional Review Board Statement
Not applicable.
Informed Consent Statement
Informed consent was obtained from all subjects involved in the study.
Data Availability Statement
Data available on request from the authors.
Acknowledgments
We thank Simon Gächter, Christian Thöni, and Benedikt Herrmann for providing the raw data of the Hermann et al. (2008) Science paper. We also thank Amir Haik for adapting the z-tree software to Hebrew. Special thanks to the Editor and three anonymous reviewers for their helpful remarks.
Conflicts of Interest
The authors declare no conflict of interest.
Appendix A. Experiment’s Instructions
In the following, we detail the complete instructions for the ‘partners’ treatment. The instructions for the ‘strangers’ treatment were identical. The only difference was that the participants were instructed that in each period of the experiment, they would be divided into groups of four members each and that the composition of the group would change from one period to another. We informed each participant that the composition of his or her group would change and that in each period, he or she would interact with different group members.
Appendix A.1. Instructions for the Punishment Phase in the Partners Treatment
“This is an experiment on decision-making. If you read the following instructions carefully, you can, depending on your decisions, earn a considerable amount of money. It is therefore very important that you read these instructions carefully.
It is prohibited to communicate with the other participants during the experiment.
If you have a question at any time raise your hand and the monitor will come to your desk to answer it.
During the experiment you can earn “money units”. At the end of the experiment these money units will be converted to cash at the following rate:
1 Money Unit = 12 Agura1
At the end of the experiment your entire earnings from the experiment will be paid to you in cash. In addition to his or her earnings, each participant will receive 10 NIS for his or her participation in the experiment. The experiment consists of two parts. The instructions detailed below are for the first part. When this part ends, you will receive the instructions for the second part.
This part of the experiment is divided into six periods. In each period the participants are divided into groups of four. You will therefore be in a group with three other participants. The composition of the groups will stay the same for all six periods. You are therefore with the same people in a group for all six periods.
Each period consists of two stages. In the first stage you will be endowed with money units and will have to decide how many money units you would like to contribute to a project. In the second stage you will be informed of the contributions to the project by the three other group members. You will then decide whether or how much to reduce their earnings from the first stage by distributing points to them. The following pages describe the course of the experiment in detail:
Every 100 Agura equals 1 NIS (about $0.25),
Detailed Information on the Experiment,
The First Stage.
At the beginning of each period each participant receives an endowment of 20 money units. Your task is to decide how many of the 20 money units you want to contribute to a project and how many of them to keep for yourself. The consequences of your decision are explained in detail below.
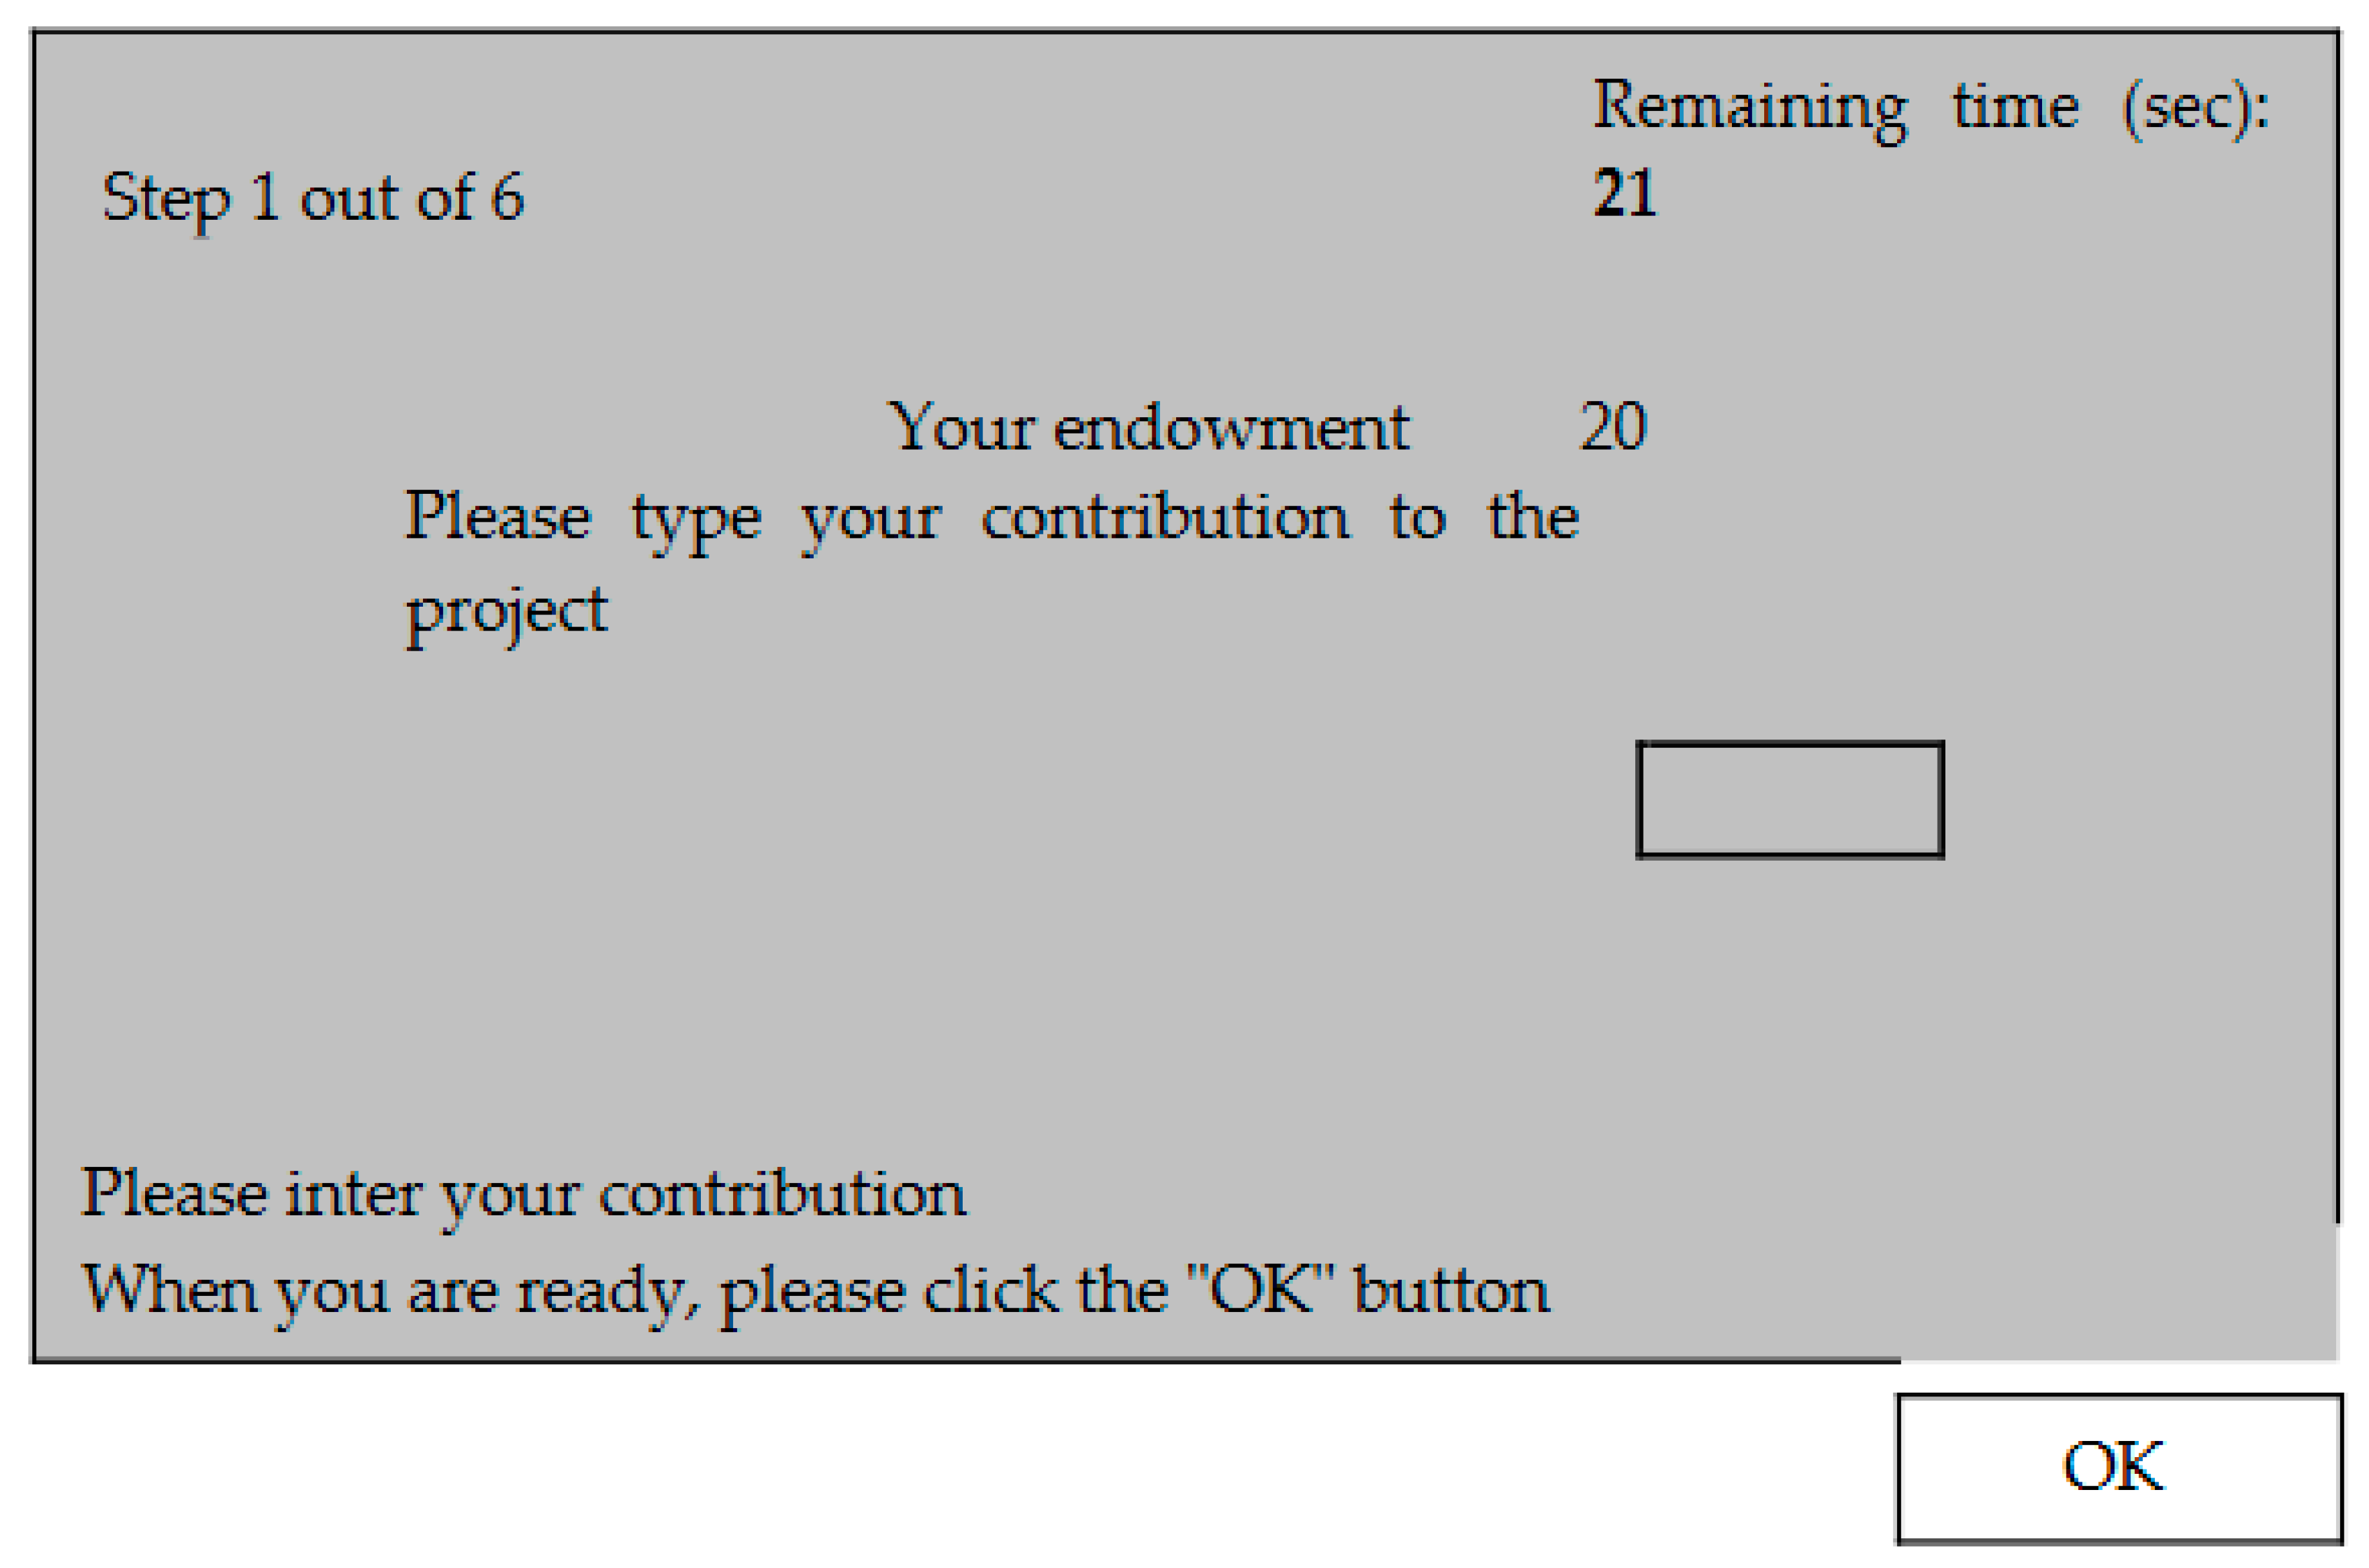
At the beginning of each period the following input screen will appear:
The Input Screen:
Figure A1.
First screen.

The number of the period appears in the upper left side of the screen. In the upper left side you can see how many seconds are left for you to make your contribution decision. You must make your decision before this time has passed.
Your endowment in each period is 20 money units. You have to decide how many money units you want to contribute to the project by typing a number between 0 and 20 in the input field. This field can be reached by clicking it with the mouse. As soon as you have decided how many money units to contribute to the project, you have also decided how many money units you keep for yourself: this is (20 money units − your contribution). After entering your contribution you must press the O.K. button. Once you have done this, your decision has been made and cannot be changed.
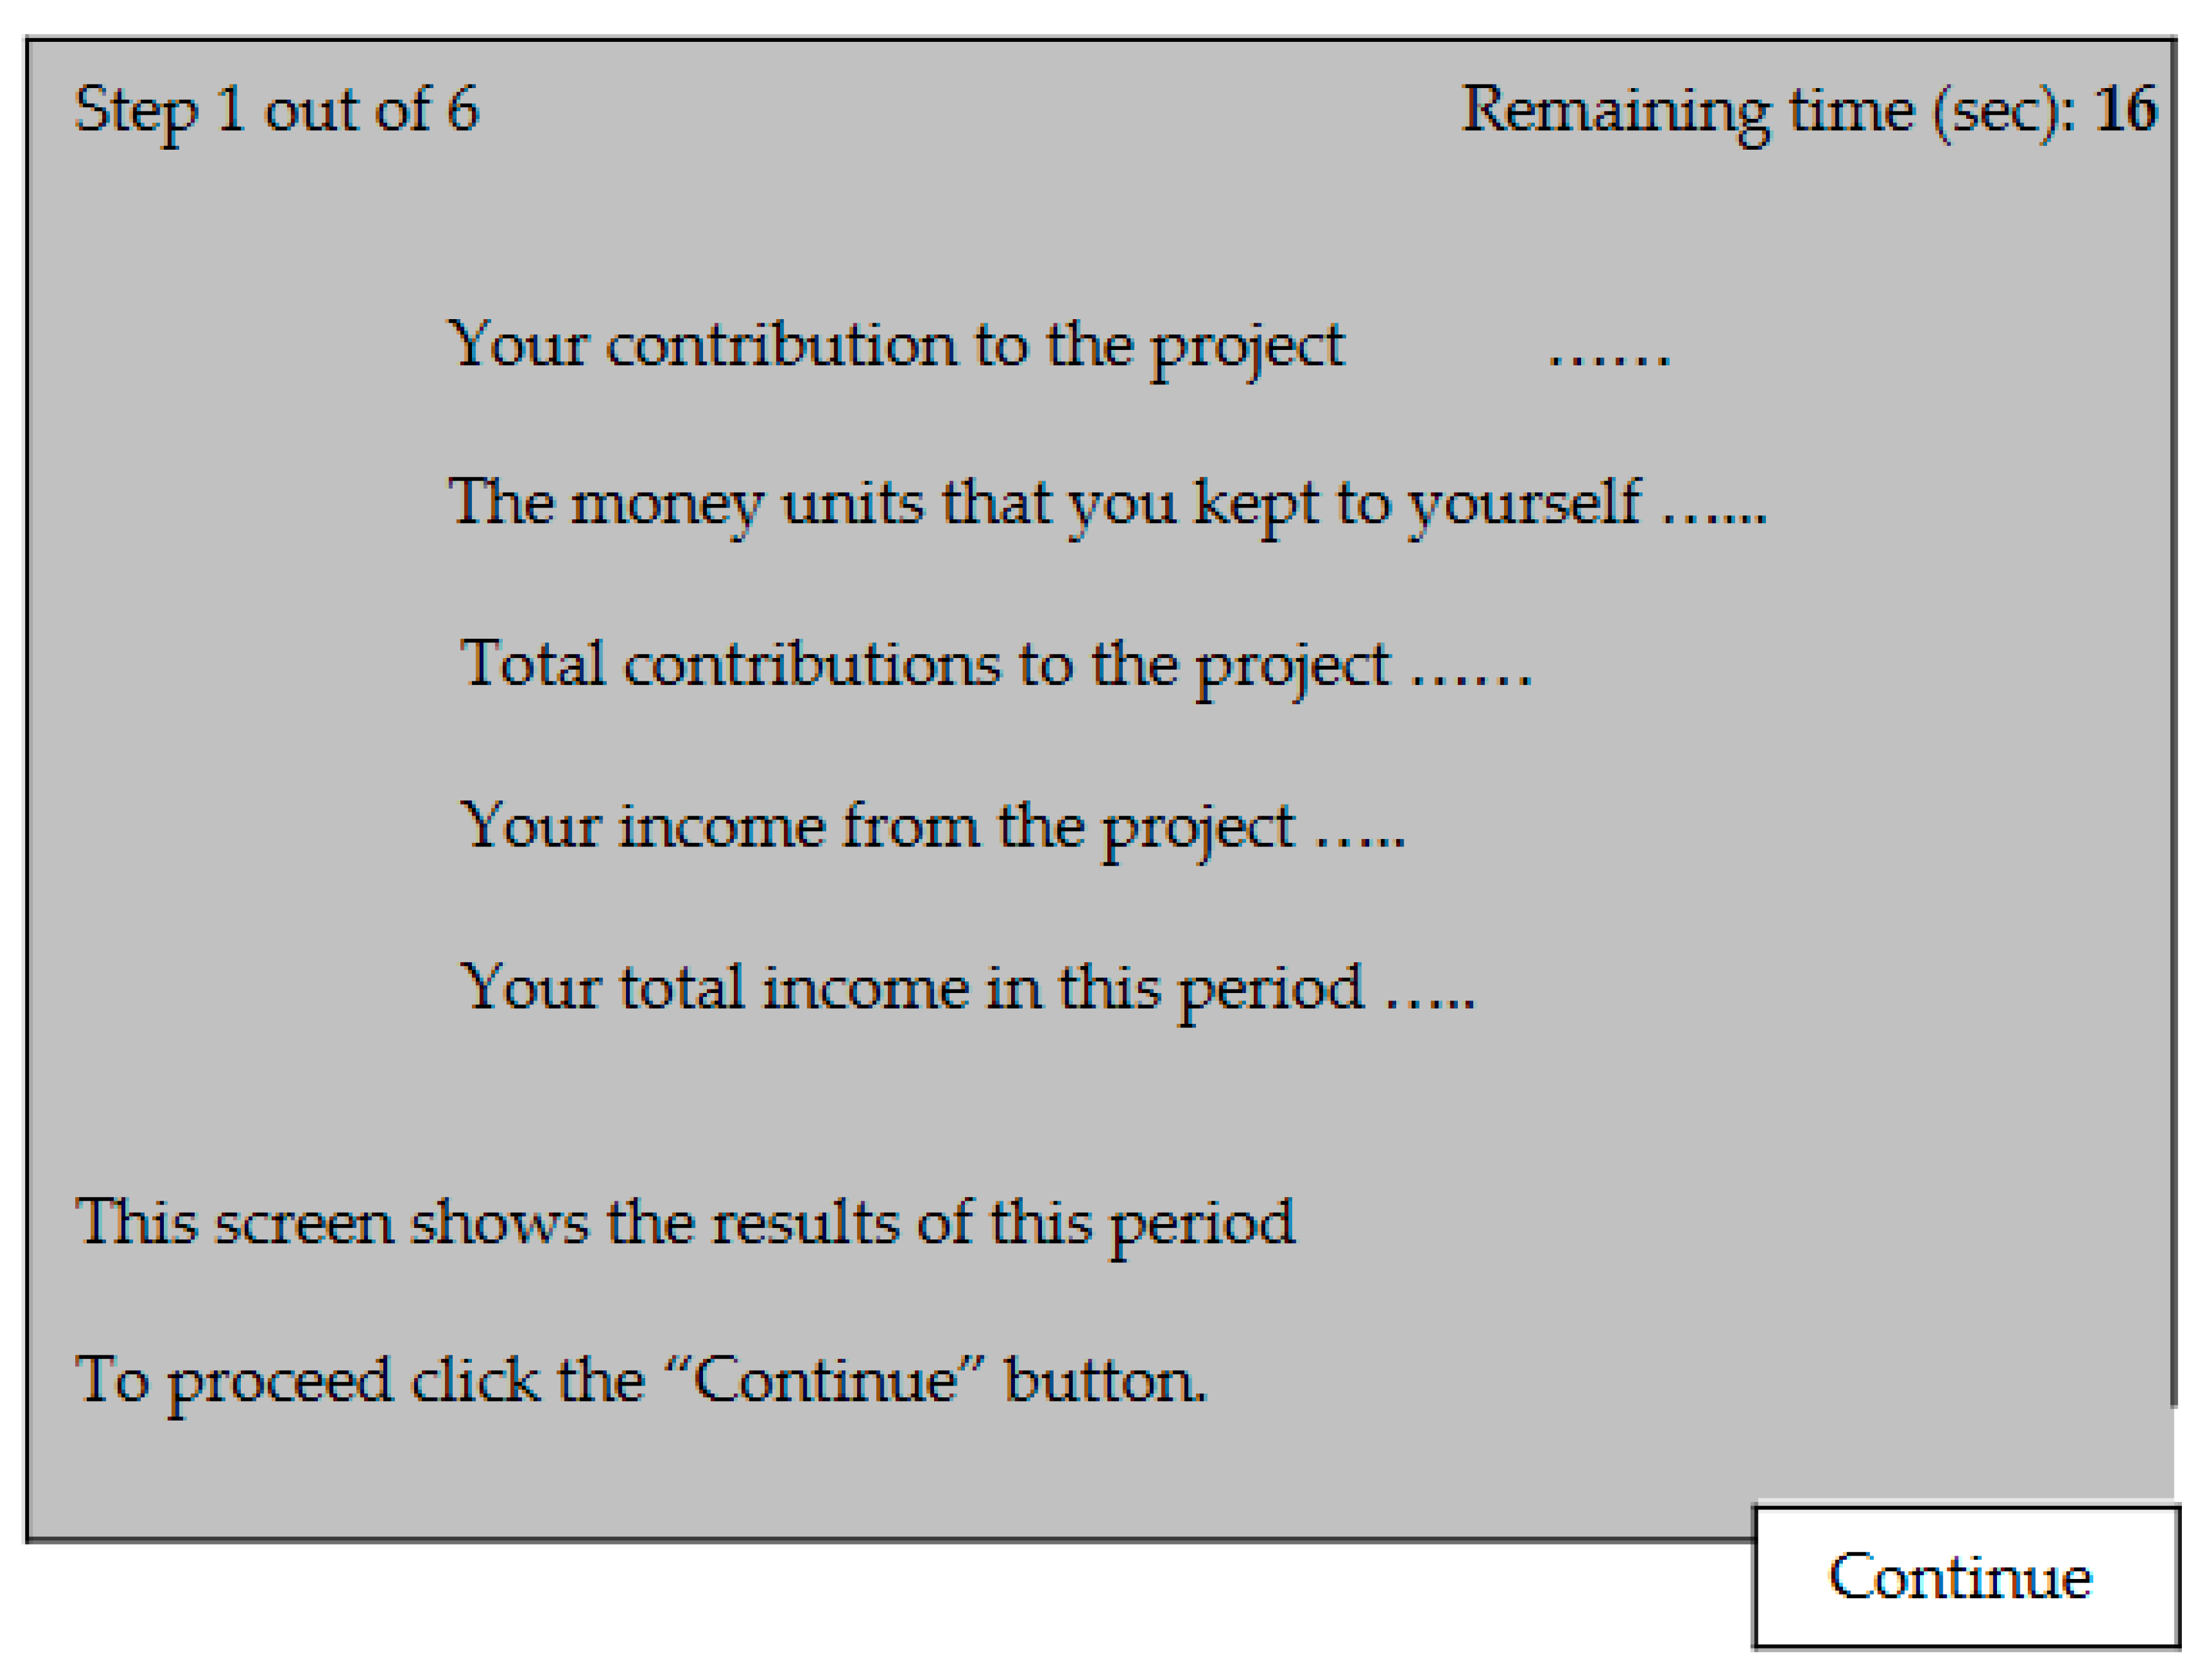
After all members of your group have made their decisions, the following income screen will show you the total amount of money units contributed by all four group members to the project (including your contribution). Additionally, this screen shows you how many money units you have earned in the period.
The Income Screen:
Figure A2.
Second screen.

As you can see, your income consists of two parts:
The money units which you have kept for yourself,
Your “income from the project”. This income is calculated as follows:
Your income from the project = 0.4 times the sum of contributions to the project.
Your total income in the period, in money units, is equal to:
(20 − your contribution to the project) + 0.4 × (total contributions to the project)
The income of each group member from the project is calculated in the same way, i.e., each group member receives the same income from the project. Assume, for example, that the sum of the contributions of all group members is 60 money units. In this case each member of the group receives an income from the project of 0.4 × 60 = 24 money units. If the total contribution to the project is 9 money units, then you and all other group members receive an income of 0.4 × 9 = 3.6 money units from the project.
For each money unit you keep for yourself you earn 1 money unit. Supposing you contributed this money unit to the project instead, then the total contribution to the project would rise by one money unit. Your income from the project would rise by 0.4 × 1 = 0.4 money unit. However, the income of each other group member would also rise by 0.4 money units each, so that the total income of the group from the project would rise by 1.6 money units. Your contribution to the project therefore also raises the income of the other group members.
Similarly, you earn an income for each money unit contributed by the other members to the project. For each money unit contributed by any member you earn 0.4 × 1 = 0.4 money units. After you have viewed the income screen the first stage is over and the second stage commences.
The Second Stage.
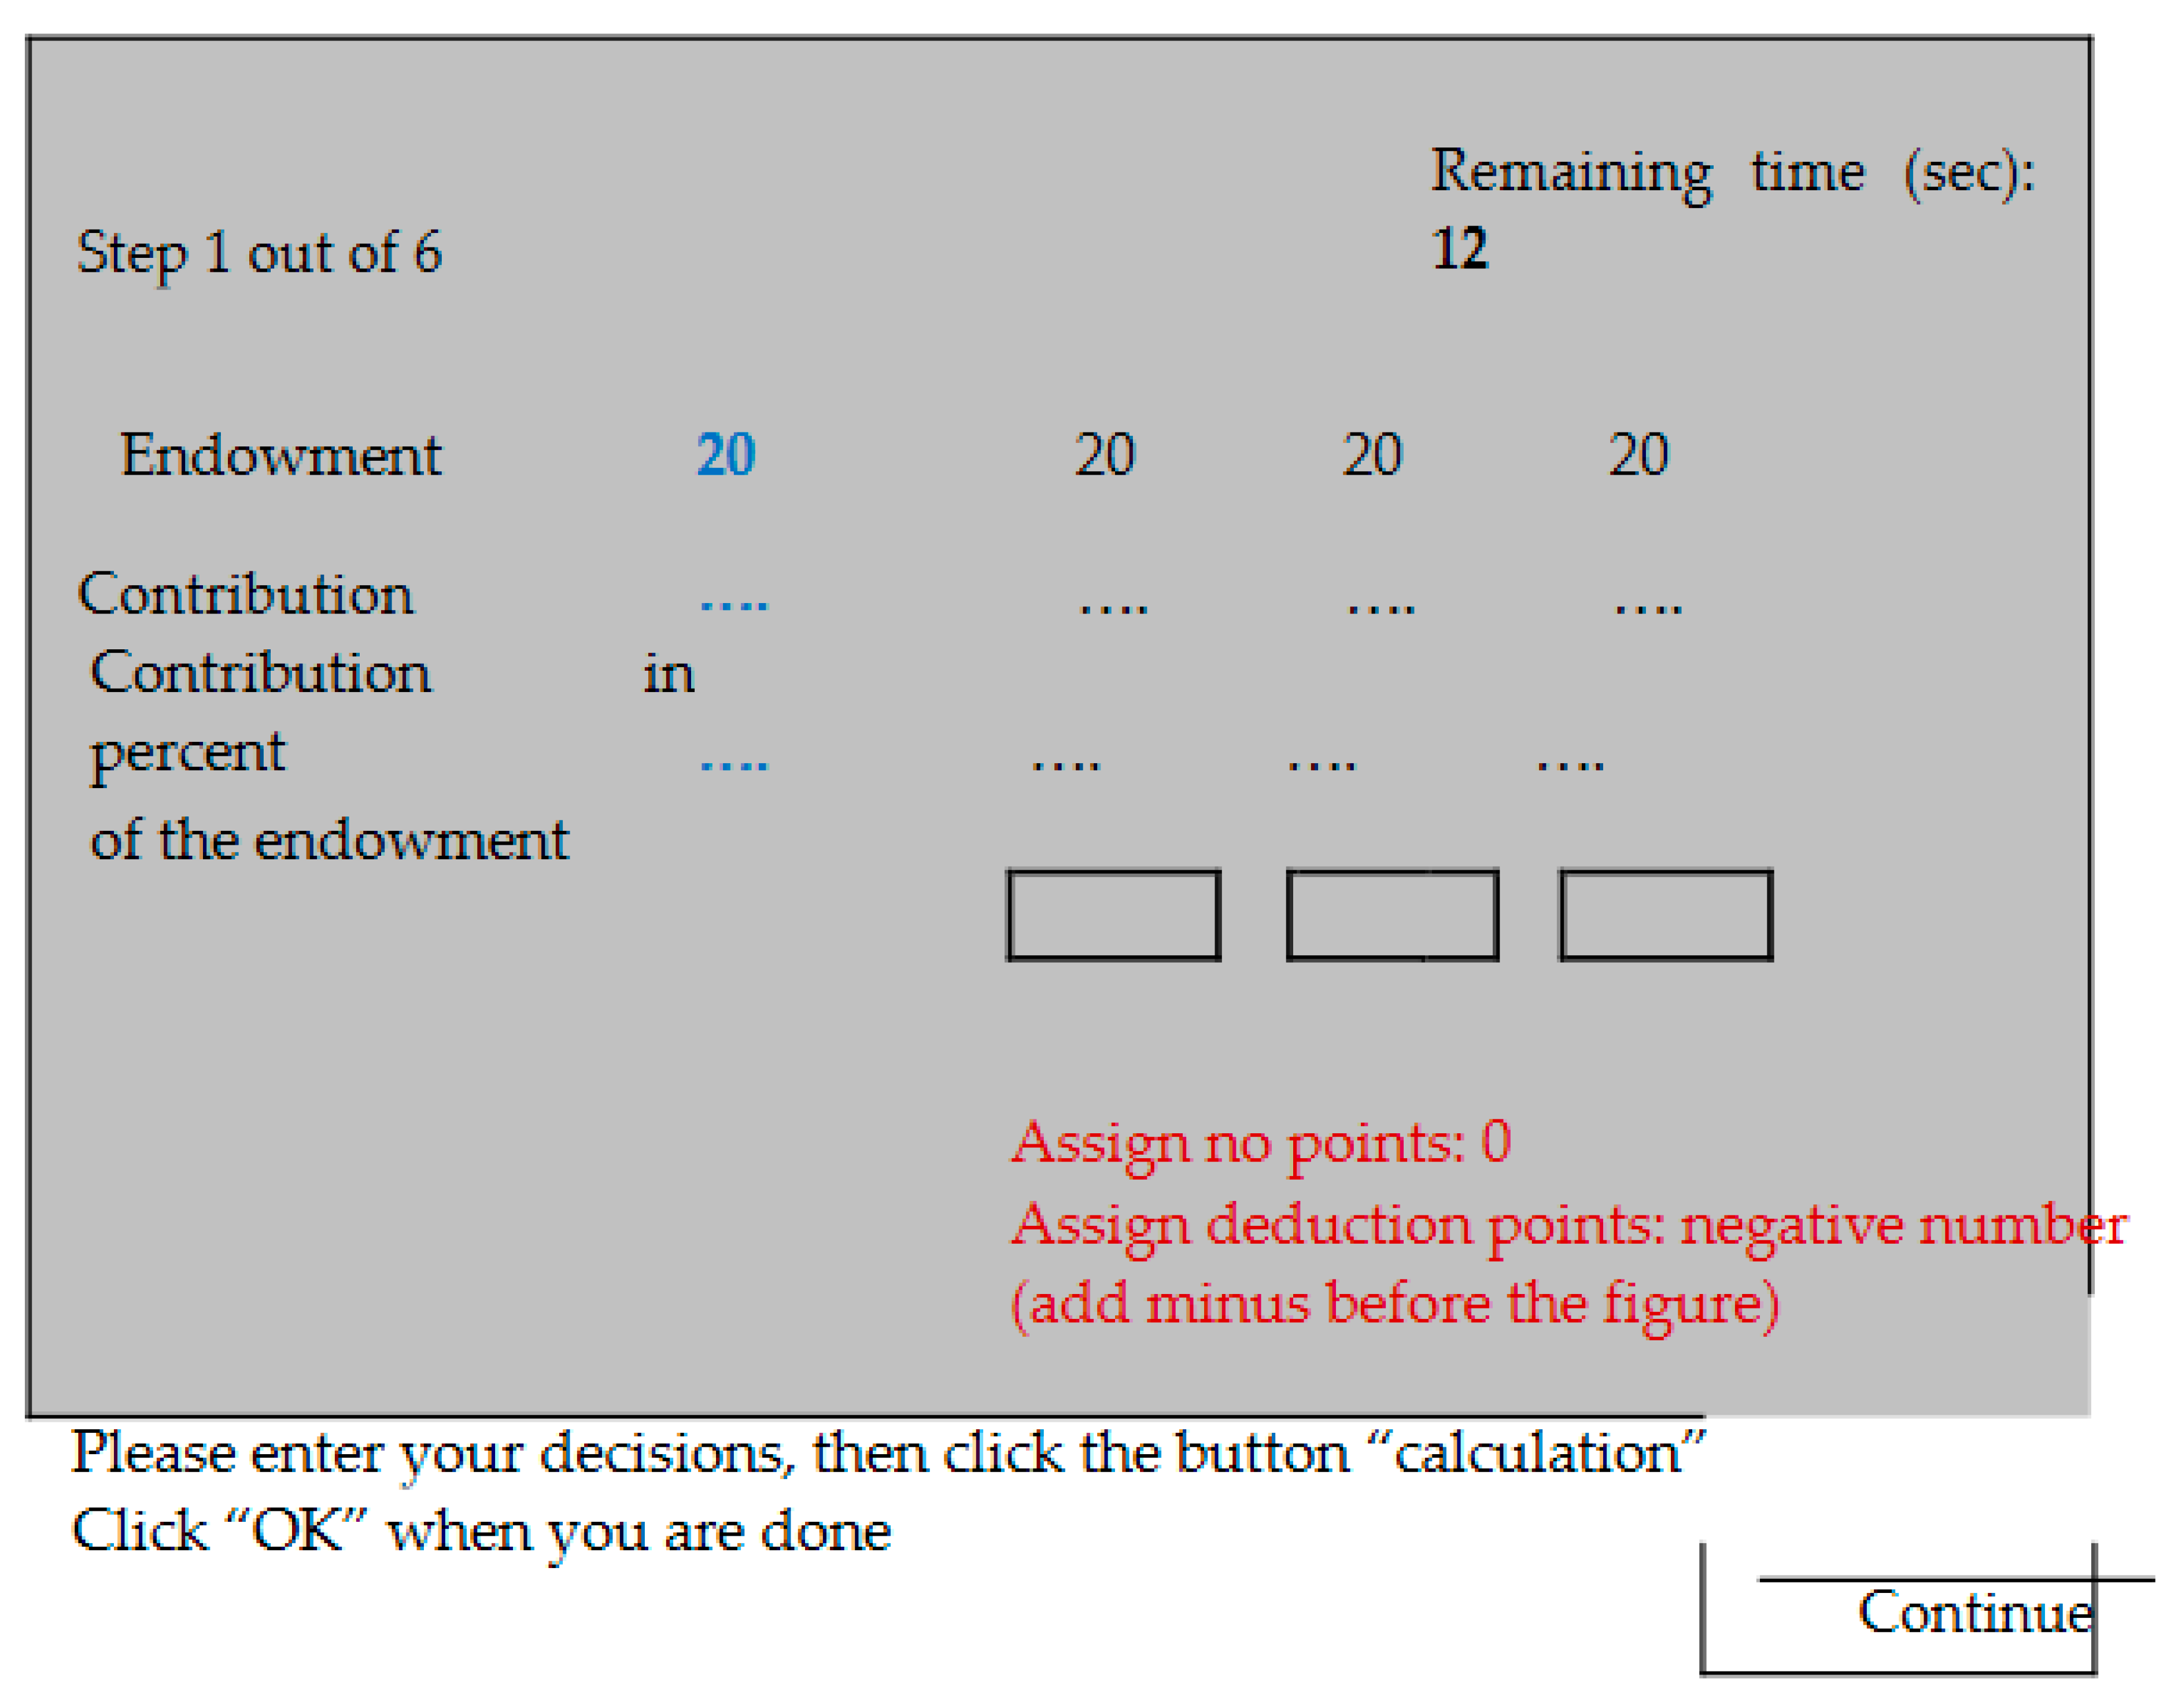
In the second stage you will see how much each group member contributed to the project. Moreover, in this stage you can decide whether to decrease the income of each other group member by assigning deduction points. The other group members can also decrease your income if they wish to. This is apparent from the input screen at the second stage:
The Second Stage Input Screen:
Figure A3.
Third screen.

Your contribution is displayed in blue in the first column, while the contributions of the other group members of this period are shown in the remaining three columns. Note that the order in which others’ contributions are displayed will be determined at random in every period. The contribution in the second column, for example, could represent a different group member in different periods. The same holds true for the third and fourth columns. You will have to decide how many deduction points to assign to each of the other three group members. You must enter a number for each of them. If you do not wish to change the income of a specific group member then you must enter 0. You can assign up to 10 points to each group member.
You will incur costs from assigning deduction points. Every deduction point you assign costs you 1 money unit. For example, if you assign 2 deduction points to one member, this costs you 2 money units; if, in addition, you assign 9 deduction points to another member this costs you an additional 9 money units; if, in addition you assign 0 deduction points to the third group member this will cost you 0 money units. In total you would have assigned 11 points and your total costs therefore amount to 11 money units.
After you have assigned points to each of the other three group members you must click the button “calculation” (see the second stage input screen). On the screen you will then see the total costs of your assigned points. As long as you have not yet clicked the O.K. button, you can still change your decision. To recalculate the costs after a change of your assigned points, simply press the “calculation” button again.
If you assign 0 deduction points to a particular group member (i.e., enter “0”), you will not alter his or her income. However, if you assign one deduction point to a group member you will decrease the income of this group member by 3 money units. If you assign a group member 2 deduction points you will decrease the group member’s income by 6 money units, etc. Each deduction point that you assign to another group member will reduce his or her income by 3 money units. Similarly, each deduction point assigned to you by another group member will reduce your first stage income by three money units:
Cost, in money units, of received deduction points = 3 × sum of received deduction points.
How much the income at the second stage is decreased depends on the sum of deduction points received. For instance, if somebody receives a total of 3 deduction points (from all other group members in this period), his or her income would be decreased by 9 money units. If somebody receives a total of 4 deduction points, his or her income is reduced by 12 points.
There is one exception to this rule. If the cost of received deduction points exceeds the group member’s first stage income, his or her first stage income will be reduced to zero.
However, even in this case the group member must still incur the costs of any deduction points he or she assigned.
Your total income from the two stages is therefore calculated as follows:
If the income from the first stage is greater than or equal to the cost of received deduction points:
Total income, in money units, at the end of the second stage = period income =
Income from the first stage
3 × (sum of received deduction points),
sum of deduction points you have assigned.
OR
If income from the first stage is less than the cost of received deduction points:
Total income, in money units, at the end of the second stage = period income 0 − sum of deduction points you have assigned.
Please note that your income in money units at the end of the second stage can be negative if the costs of your assigned points exceed your income from the first stage minus the income reduction by the received deduction points. You can, however, avoid such losses with certainty through your own decisions!
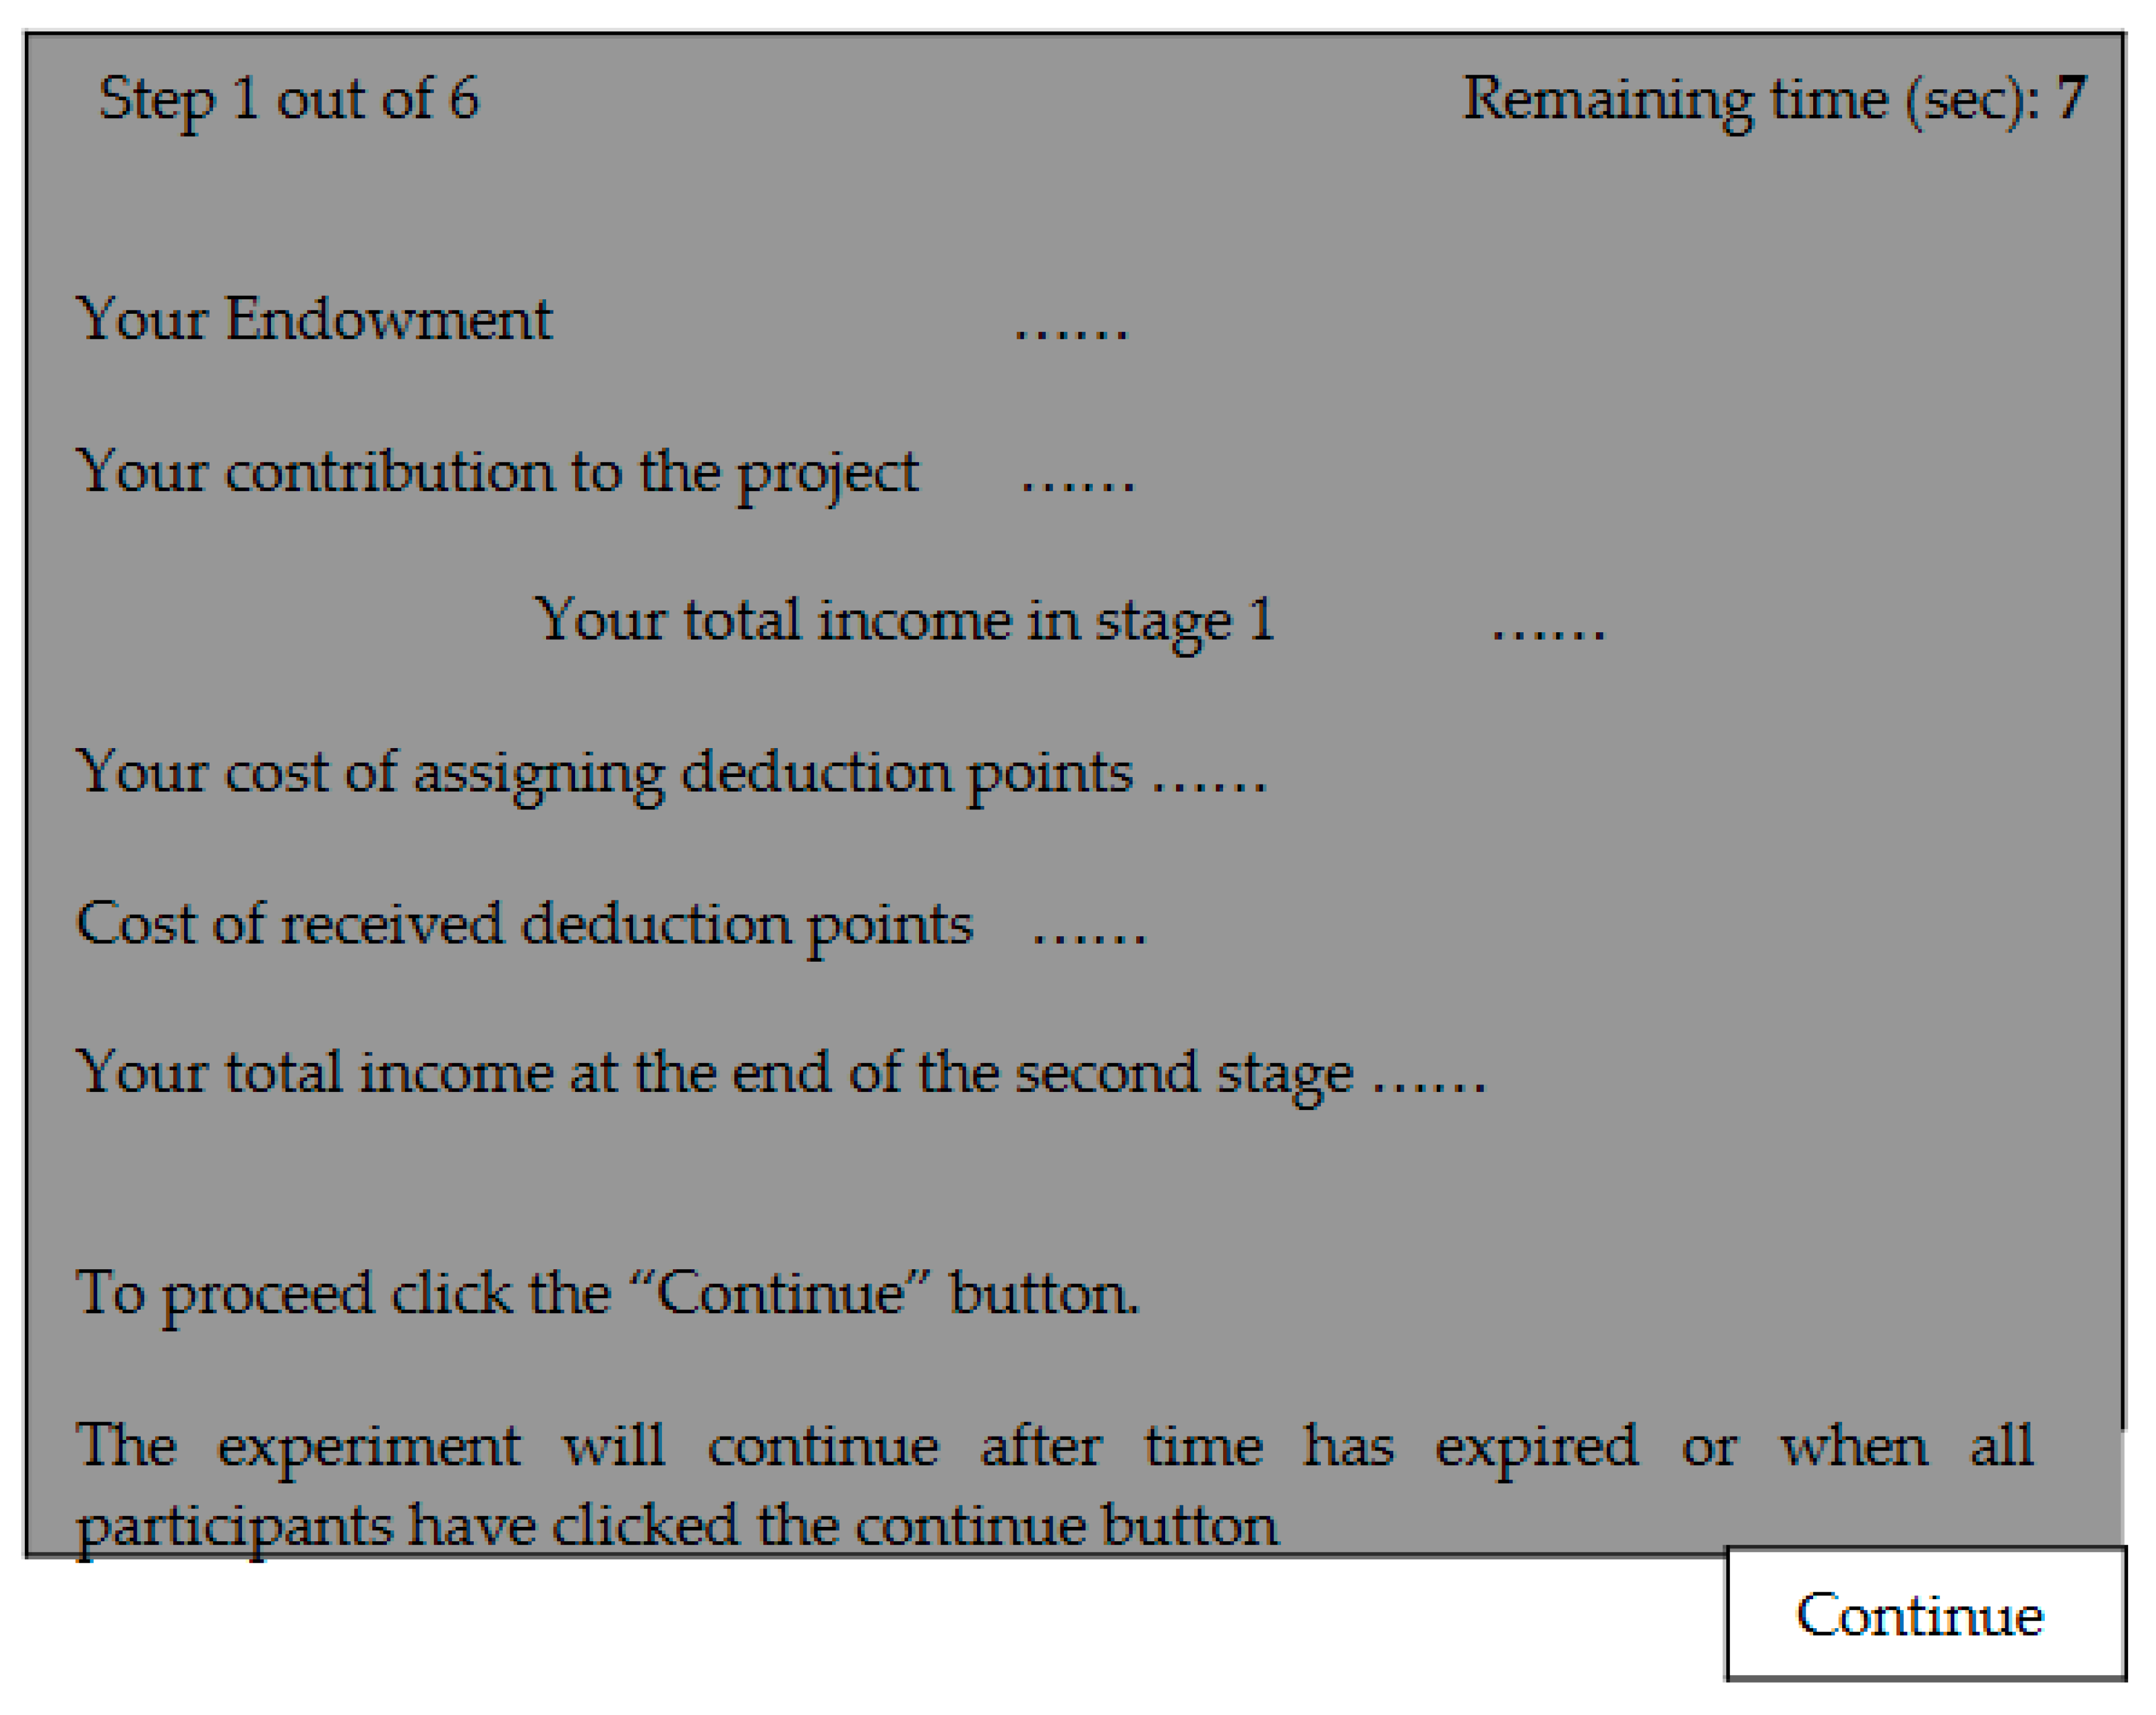
After all participants have made their decision, your income from the period will be displayed on the following screen:
Figure A4.
Fourth screen.

After you have viewed the income screen, the period is over and the next period commences.
Now please complete the questions on the next sheet. They serve as a test of your understanding of payoff calculations. If you have any questions please raise your hand. When everyone has completed the questions correctly we will begin the decision-making part of the experiment”.
Appendix A.2. Questions
Each group member has an endowment of 20 money units. Suppose nobody (including you) contributes any money units to the project. What is:
Your first stage income? (20 − ___) + (0.4 × ___) = ___.
The first stage income of the other group members? (20 − ___) + (0.4 × ___) = ___.
Each group member has an endowment of 20 money units. Suppose you contribute 20 money units to the project. All other group members contribute 20 money units each to the project. What is:
Your first stage income? (20 − ___) + (0.4 × ___) = ___.
The first stage income of the other group members? (20 − ___) + (0.4 × ___) = ___.
Each group member has an endowment of 20 money units. Suppose you contribute 10 money units to the project. All other members contribute a total of 30 money units to the project.
What is your first stage income? (20 − ___) + (0.4 × ___) = ___.
Suppose at the second stage you assign the following deduction points to your three other group members: −9, −5, and 0.
What are the total costs of your assigned deduction points? ______.
What are your costs if you assign a total of 0 deduction points? _______.
By how many money units will the income of another player be reduced if you assign to him (-5) deduction points?
Appendix A.3. Instructions for the No-Punishment Phase in the ‘Partners’ Treatment
“This part of the experiment also contains six periods. It is identical in all aspects to the previous part, except that it does not include a possibility for assigning deduction points. Like in the previous part, in each period your total income in this part is equal to:
(20 − your contribution to the project) + 0.4 × (total contributions to the project)
The income of each group member from the project is calculated in the same way.
When the six periods of this part of the experiment are completed, the experiment will end and you will receive the sum of your income in the two parts of the experiment.
Your total profit in the experiment will be equal to:
Your total income from the first six periods + your total income from the second six periods + 10 NIS 2 for your participation in the experiment
When the experiment ends, please wait patiently for the experimenter, who will call you and pay you your profits in the experiment.
When you have finished reading the instructions, please wait until the rest of the participants in the experiment finish reading. The second part of the experiment will begin after all the participants have finished reading the instructions”.
Appendix B. Investment in Punishment as Function of the Difference between the Punished and the Punishing Group Members
We performed Tobit regressions with punishment points as the dependent variable and the difference between the punished and the punishing group members as the independent variable. In the ‘partners’ treatment, the reported robust standard errors are clustered on groups as the independent units of observations (S1), and in the ‘strangers’ treatment, the reported standard errors are clustered on sessions as the independent units of observations.
The points assigned in the ‘partners’ treatment for punishing cooperators are best explained by the punisher’s contribution and the mean contribution of others. The lower the punisher’s contribution, the more points he or she assigned to punishing cooperators (regression coefficient of −0.334, p < 0.0001). Correspondingly, participants assigned more points to punishing cooperators when the mean contribution of the two members in their group was higher (regression coefficient of 0.307, p < 0.0001). This finding indicates that participants punish cooperators more when high contributions are more frequent. As could be expected, punishment of cooperators also correlated positively with the contribution of the punished group member (regression coefficient of 0.087, p < 0.05). In the ‘strangers’ treatment, the punishment of cooperators was negatively associated with the punisher’s contribution (regression coefficient of −0.083), but this association was only marginally significant (p = 0.054).
For the punishment of free riders (negative deviations), the analysis revealed that for both treatments, the relationship between the assigned punishment points and the deviation between the punished and the punishing group members was positive and statistically significant (for the ‘partners’ treatment, the regression coefficient = 0.078, z = 2.92, p = 0.003; for the ‘strangers’ treatment, the regression coefficient = 0.180, z = 5.82, p< 0.0001). Conversely, we observe different patterns of punishing cooperators (non-negative deviations) in the two treatments. As the figure shows, in the ‘partners’ treatment, the more the cooperators contributed relative to the punishing group members, the higher the points assigned to punishing them. We detected no similar relationship for the ‘strangers’ treatment. Tobit regressions support these observations. In the ‘partners’ treatment, the detected relationship between the points assigned for punishing cooperators and the deviation between the punished and the punishing group members was positive and statistically significant (regression coefficient = 0.277, z = 8.15, p < 0.0001). By contrast, in the ‘strangers’ treatment, the regression analysis revealed that the relationship between the above-mentioned variables was not significant (regression coefficient = 0.029, z = 0.79, p = 0.43).
10 NIS = $2.6
Appendix C. Frequencies and Relative Frequencies of Four Punishment Strategies across the Sixteen Participant Pools Investigated in Hermann et al. (2008)
The top figure in each cell, in first four rows of Table A1 indicates the percentage of participants who used the corresponding strategy. The figure below indicates the participants’ number, and the two figures below it indicate the mean contribution and net profit of participants using the strategy correspondingly.

Table A1.
Frequencies and relative frequencies of four punishment strategies across the sixteen participant pools investigated in Hermann et al. (2008).
Table A1.
Frequencies and relative frequencies of four punishment strategies across the sixteen participant pools investigated in Hermann et al. (2008).
| City | Punishment Strategy | Total | |||
|---|---|---|---|---|---|
| NoPun | PunOnlyFR | PunCoop | Pun2Way | ||
| Boston (18) | 23 | 25 | 2 | 6 | 56 |
| 41.07% | 44.64% | 3.57% | 10.71% | ||
| 18.46 | 18.37 | 12.55 | 16.35 | ||
| 28.85 | 27.72 | 26.27 | 25.81 | ||
| Copenhagen (17.7) | 22 | 32 | 5 | 9 | 68 |
| 32.35% | 47.06% | 7.35% | 13.24% | ||
| 19.06 | 17.99 | 18.22 | 13.42 | ||
| 29.87 | 27.38 | 27.96 | 23.14 | ||
| St. Gallen (16.7) | 20 | 41 | 7 | 28 | 96 |
| 20.83% | 42.71% | 7.29% | 29.17% | ||
| 17.12 | 18.00 | 13.24 | 15.48 | ||
| 27.76 | 26.54 | 25.84 | 22.28 | ||
| Zurich (16.2) | 16 | 45 | 6 | 25 | 92 |
| 17.39% | 48.91% | 6.52% | 27.17% | ||
| 17.35 | 16.68 | 16.42 | 14.36 | ||
| 28.70 | 25.27 | 28.08 | 21.86 | ||
| Nottingham (15) | 10 | 28 | 5 | 13 | 56 |
| 17.86% | 50.00% | 8.93% | 23.21% | ||
| 15.76 | 16.30 | 9.56 | 13.76 | ||
| 28.11 | 24.67 | 19.30 | 21.55 | ||
| Seoul (14.7) | 13 | 38 | 3 | 30 | 84 |
| 15.48% | 45.24% | 3.57% | 35.71% | ||
| 17.22 | 15.46 | 9.27 | 13.05 | ||
| 26.83 | 24.75 | 18.99 | 22.32 | ||
| Bonn (14.5) | 13 | 31 | 4 | 12 | 60 |
| 21.67% | 51.67% | 6.67% | 20.00% | ||
| 12.51 | 15.92 | 13.73 | 13.18 | ||
| 25.49 | 24.65 | 26.61 | 20.46 | ||
| Melbourne (14.1) | 7 | 21 | 1 | 11 | 40 |
| 17.50% | 52.50% | 2.50% | 27.50% | ||
| 13.03 | 14.11 | 14.90 | 14.78 | ||
| 23.83 | 23.56 | 19.52 | 22.03 | ||
| Chengdu (13.9) | 9 | 56 | 5 | 26 | 96 |
| 9.38% | 58.33% | 5.21% | 27.08% | ||
| 16.49 | 15.06 | 11.36 | 10.90 | ||
| 28.71 | 24.42 | 24.70 | 20.89 | ||
| Minsk (12.9) | 16 | 19 | 5 | 28 | 68 |
| 23.53% | 27.94% | 7.35% | 41.18% | ||
| 15.77 | 14.36 | 6.90 | 11.40 | ||
| 26.71 | 18.46 | 16.66 | 17.87 | ||
| Samara (11.7) | 16 | 46 | 8 | 82 | 152 |
| 10.53% | 30.26% | 5.26% | 53.95% | ||
| 13.38 | 14.14 | 9.23 | 10.29 | ||
| 21.84 | 20.34 | 18.62 | 15.58 | ||
| Dniprop. (10.9) | 6 | 13 | 6 | 19 | 44 |
| 13.64% | 29.55% | 13.64% | 43.18% | ||
| 10.15 | 13.13 | 8.03 | 10.47 | ||
| 19.89 | 20.74 | 18.81 | 17.33 | ||
| Muscat (9.9) | 5 | 6 | 8 | 33 | 52 |
| 9.62% | 11.54% | 15.38% | 63.46% | ||
| 3.98 | 15.27 | 4.39 | 11.16 | ||
| 19.14 | 9.69 | 12.27 | 9.63 | ||
| Istanbul (7.1) | 7 | 25 | 8 | 24 | 64 |
| 10.94% | 39.06% | 12.50% | 37.50% | ||
| 4.97 | 9.62 | 4.74 | 5.995 | ||
| 19.41 | 18.99 | 15.24 | 14.79 | ||
| Riyadh (6.9) | 10 | 9 | 4 | 25 | 48 |
| 20.83% | 18.75% | 8.33% | 52.08% | ||
| 6.82 | 8.79 | 2.86 | 6.93 | ||
| 17.48 | 14.95 | 16.25 | 11.65 | ||
| Athens (5.7) | 5 | 10 | 5 | 24 | 44 |
| 11.36% | 22.73% | 11.36% | 54.55% | ||
| 7.00 | 8.03 | 0 | 5.65 | ||
| 19.80 | 17.96 | 0.11 | 12.57 | ||
| Total | 198 | 445 | 82 | 395 | 1120 |
Appendix D
Figure A5.
Mean contributions (in MUs) of different punisher types in the no-punishment and punishment phases for representative cities with high, moderate, and low contributions.
Figure A5.
Mean contributions (in MUs) of different punisher types in the no-punishment and punishment phases for representative cities with high, moderate, and low contributions.

References
- Fehr, E.; Gächter, S. Altruistic punishment in humans. Nature 2002, 415, 137–140. [Google Scholar] [CrossRef] [PubMed]
- Fehr, E.; Fischbacher, U. The nature of human altruism. Nature 2003, 425, 785–791. [Google Scholar] [CrossRef] [PubMed]
- Fehr, E.; Fischbacher, U. Social norms and human cooperation. Trends Cogn. Sci. 2004, 8, 185–190. [Google Scholar] [CrossRef]
- Sutter, M.; Haigner, S.; Kocher, M.G. Choosing the carrot or the stick? Endogenous institutional choice in social dilemma situations. Rev. Econ. Stud. 2010, 77, 1540–1566. [Google Scholar] [CrossRef] [Green Version]
- Weber, T.O.; Weisel, O.; Gächter, S. Dispositional free riders do not free ride on punishment. Nat. Commun. 2018, 9, 2390. [Google Scholar] [CrossRef] [PubMed]
- Burton-Chellew, M.; Guerin, C. Decoupling altruistic punishment: Immune punishers learn to not cooperate, but still punish hypocritically (unpublished manuscript). SocArXiv 2021. [Google Scholar] [CrossRef]
- Hermann, B.; Thöni, C.; Gächter, S. Antisocial punishment across societies. Science 2008, 319, 1362–1367. [Google Scholar] [CrossRef] [PubMed]
- Gintis, H. Punishment and cooperation. Science 2008, 319, 1345–1346. [Google Scholar] [CrossRef]
- O’Gorman, R.; Henrich, J.; Van Vugt, M. Constraining free riding in public goods games: Designated solitary punishers can sustain human cooperation. Proc. R. Soc. 2009, 276, 323–329. [Google Scholar] [CrossRef] [Green Version]
- Gintis, H. Strong reciprocity and human sociality. J. Theor. Biol. 2000, 206, 169–179. [Google Scholar] [CrossRef] [Green Version]
- Gintis, H.; Bowles, S.; Boyd, R.; Fehr, E. Explaining altruistic behavior in humans. Evol. Hum. Behav. 2003, 24, 153–172. [Google Scholar] [CrossRef] [Green Version]
- Fehr, E.; Gintis, H. Human motivation and social cooperation: Experimental and analytical foundations. Annu. Rev. Sociol. 2007, 33, 43–64. [Google Scholar] [CrossRef] [Green Version]
- Lohse, J.; Waichman, I. The effects of contemporaneous peer punishment on cooperation with the future. Nat. Commun. 2020, 11, 1–8. [Google Scholar] [CrossRef] [PubMed] [Green Version]
- Fehr, E.; Fischbacher, U.; Gächter, S. Strong reciprocity, human cooperation, and the enforcement of social norms. Hum. Nat. 2002, 13, 1–25. [Google Scholar] [CrossRef] [PubMed] [Green Version]
- Bowles, S.; Gintis, H. The evolution of strong reciprocity: Cooperation in heterogeneous populations. Theor. Popul. Biol. 2004, 65, 17–28. [Google Scholar] [CrossRef]
- Fischbacher, U. z-Tree: Zurich toolbox for ready-made economic experiments. Exp. Econ. 2007, 10, 171–178. [Google Scholar] [CrossRef] [Green Version]
- Tobin, J. Estimation of relationships for limited dependent variables. Econometrica 1958, 26, 24–36. [Google Scholar] [CrossRef] [Green Version]
- Schnedler, W. Likelihood estimation for censored random vectors. Econom. Rev. 2005, 24, 195–217. [Google Scholar] [CrossRef]
- Liang, K.Y.; Zeger, S.L. Longitudinal data analysis using generalized linear models. Biometrika 1986, 73, 13–22. [Google Scholar] [CrossRef]
- Rotnitzky, A.; Jewell, N.P. Hypothesis testing of regression parameters in semiparametric generalized linear models for cluster correlated data. Biometrika 1990, 77, 485–497. [Google Scholar] [CrossRef]
- Fehr, E.; Schmidt, K.M. A theory of fairness, competition, and cooperation. Q. J. Econ. 1999, 114, 817–868. [Google Scholar] [CrossRef]
- Gächter, S.; Herrmann, B. Reciprocity, culture and human cooperation: Previous insights and a new cross-cultural experiment. Philos. Trans. R. Soc. B Biol. Sci. 2009, 364, 791–806. [Google Scholar] [CrossRef] [Green Version]
- Bruhin, A.; Janizzi, K.; Thöni, C. Uncovering the heterogeneity behind cross-cultural variation in antisocial punishment. J. Econ. Behav. Organ. 2020, 180, 291–308. [Google Scholar] [CrossRef]
- Mekvabishvili, R. Georgia Leads in Prosociality: Comparison to Cross-Cultural Economic Experiment. Econ. Bus. 2021, 13, 140–149. [Google Scholar]
- Parks, C.; Stone, A.B. The desire to expel unselfish members from the group. J. Personal. Soc. Psychol. 2010, 99, 303–310. [Google Scholar] [CrossRef] [Green Version]
- Kawamura, Y.; Kusum, T. Altruism does not always lead to a good reputation: A normative explanation. J. Exp. Soc. Psychol. 2020, 90, 104021. [Google Scholar] [CrossRef]
- Xueheng, L.; Lucas, M.; Van Dolder, D. Conditional Punishment: Descriptive Social Norms Drive Negative Reciprocity; CeDEx Discussion Paper Series, No. 2020-05; The University of Nottingham, Centre for Decision Research and Experimental Economics (CeDEx): Nottingham, UK, 2020. [Google Scholar]
- Gintis, H.; Henrich, J.; Bowles, S.; Boyd, R.; Fehr, E. Strong reciprocity and the roots of human morality. Soc. Justice Res. 2008, 21, 241–253. [Google Scholar] [CrossRef]
- Carpenter, J.; Bowles, S.; Gintis, H.; Hwang, S.-H. Strong reciprocity and team production: Theory and evidence. J. Econ. Behav. Organ. 2009, 71, 221–232. [Google Scholar] [CrossRef]
- Fehr, E.; Schneider, F. Eyes are on us, but nobody cares: Are eye cues relevant for strong reciprocity? Proc. R. Soc. B Biol. Sci. 2010, 277, 1315–1323. [Google Scholar] [CrossRef] [PubMed] [Green Version]
- Hardin, G. The tragedy of the commons. Science 1968, 162, 1243–1248. [Google Scholar]
- Dugatkin, L.A.; Wilson, D. Rover: A strategy for exploiting cooperators in a patchy environment. Am. Nat. 1991, 138, 687–701. [Google Scholar] [CrossRef]
- Boyd, R.; Richerson, P.J. Punishment allows the evolution of cooperation (or anything else) in sizable groups. Ethol. Sociobiol. 1992, 13, 171–195. [Google Scholar] [CrossRef]
- Lomborg, B. Nucleus and shield: The evolution of social structure in the iterated prisoner’s dilemma. Am. Sociol. Rev. 1996, 61, 278–307. [Google Scholar] [CrossRef]
- Aktipis, C.A. Know when to walk away: Contingent movement and the evolution of cooperation. J. Theor. Biol. 2004, 231, 249–260. [Google Scholar] [CrossRef]
- Kurzban, R.; Houser, D. Experiments Investigating Cooperative Types in Humans: A Complement to Evolutionary Theory and Simulations. Proc. Natl. Acad. Sci. USA 2005, 102, 1803–1807. [Google Scholar] [CrossRef] [PubMed] [Green Version]
- Rand, D.G.; Armao, I.V.J.J.; Nakamaru, M.; Ohtsuki, H. Anti-social punishment can prevent the co-evolution of punishment and cooperation. J. Theor. Biol. 2010, 265, 624–632. [Google Scholar] [CrossRef] [Green Version]
Figure 1.
Mean contribution for ‘partners’ (a) and ‘strangers’ (b) as functions of period in the punishment and the no-punishment phases.
Figure 1.
Mean contribution for ‘partners’ (a) and ‘strangers’ (b) as functions of period in the punishment and the no-punishment phases.

Figure 2.
Mean expenditures on punishment (in points/round) as functions of the deviation of the contribution of the punished group member from the contribution of the punishing member. The bars corresponding to negative deviations depict mean points allocated to punish free riders, and the bars corresponding to non-negative deviations depict mean points allocated to antisocial punishment.

Figure 3.
Mean expenditures on punishing free riders and cooperators.

Figure 4.
Mean contributions of punisher types in the no-punishment and punishment phases.

Figure 5.
Relative frequencies of the four punishment strategies in Haifa (A) and in Zurich (B).

Figure 6.
(a) Relationship between the fractions of contribution in the punishment phase, and the fractions of strong reciprocators out of the total number of punishers. (b) Relationship between the fractions of earnings and the fraction of strong reciprocators out of the total number of punishers.
Figure 6.
(a) Relationship between the fractions of contribution in the punishment phase, and the fractions of strong reciprocators out of the total number of punishers. (b) Relationship between the fractions of earnings and the fraction of strong reciprocators out of the total number of punishers.

Table 1.
Results of Tobit regression analyses coefficients (& Std. Err) on the points assigned to punishment as the dependent variable.
Table 1.
Results of Tobit regression analyses coefficients (& Std. Err) on the points assigned to punishment as the dependent variable.
| Punishment of Free Riders | Punishment of Cooperators | |||
|---|---|---|---|---|
| Explanatory Variable | ||||
| Partners | Strangers | Partners | Strangers | |
| Received punishment in t − 1 | −0.124 | 0.126 ** | −0.057 | 0.084 |
| (0.069) | (0.044) | (0.068) | (0.052) | |
| Punished contribution | −0.203 **** | −0.366 **** | 0.087 * | 0.017 |
| (0.033) | (0.046) | (0.038) | (0.037) | |
| Punisher Contribution | −0.015 | 0.101 ** | −0.344 **** | −0.0802 † |
| (0.034) | (0.036) | (0.034) | (0.042) | |
| Mean contribution of others | 0.121 **** | 0.021 | 0.307 **** | −0.031 |
| (0.031) | (0.037) | (0.037) | (0.041) | |
| Constant | 0.194 | 0.015 | −2.634 **** | −1.458 * |
| (0.526) | (0.631) | (0.616) | (0.612) | |
| p | 0.000 | 0.000 | 0.000 | 0.002 |
| n | 152 | 342 | 145 | 252 |
† p = 0.054, * p < 0.05, ** p < 0.01, **** p < 0.0001.
Table 2.
Relative frequencies, punishment investments, and contributions by punisher’s type.
| Punisher Types | ||||||||
|---|---|---|---|---|---|---|---|---|
| Variable | Non-Punishers | Punishers of Free Riders | Punishers of Cooperators | Punishers of Free Riders & Cooperators | ||||
| Partners | Strangers | Partners | Strangers | Partners | Strangers | Partners | Strangers | |
| n = 21 | n = 27 | n = 20 | n = 38 | n = 2 | n = 6 | n = 22 | n = 42 | |
| Relative | ||||||||
| Frequency | 32.3% | 23.9% | 30.8% | 33.6% | 3.1% | 5.3% | 33.8% | 37.2% |
| Punishment | 1.60 | 2.46 | 3.92 | 1.75 | 2.92 (*) | 5.91 (**) | ||
| (MU/period) | - | - | (1.66) | (2.62) | (1.77) | (1.26) | (1.96) | (5.31) |
| Contribution | 14.56 | 7.64 | 12.94 | 12.88 | 12.5 | 8.72 | 9.96 | 8.14 |
| (MU) | (5.96) | (5.38) | (5.96) | (3.92) | (4.01) | (5.01) | (5.34) | (3.41) |
(*) The 2.92 MUs/period consists of 1.34 MUs/period for punishing free riders plus 1.58 MUs/period for punishing cooperators. (**) The 5.91 MUs/period consists of 2.81 MUs/period for punishing free riders plus 3.10 MUs/period for punishing cooperators. Seven observations in each treatment, corresponding to cases in which a group member had no opportunity to use either type of punishment, were deleted.
Table 3.
Relative frequencies of punisher types in participant pools from representative cities with high and low cooperation (data source: Hermann et al., Science, 2008).
Table 3.
Relative frequencies of punisher types in participant pools from representative cities with high and low cooperation (data source: Hermann et al., Science, 2008).
| City | Punisher Types | Total | |||
|---|---|---|---|---|---|
| Non-Punishers | Punishers of Free Riders | Punishers of Cooperators | Upward/Downward Punishers | ||
| Boston | 41% | 45% | 4% | 10% | 100% |
| (high cooperation) | (23) | (25) | (2) | (6) | (56) |
| 18.46 | 18.37 | 12.55 | 16.35 | 18 | |
| Copenhagen | 32.35% | 47.06% | 7.35% | 13.24% | 100% |
| (high cooperation) | (22) | (32) | (5) | (9) | (68) |
| 19.06 | 17.99 | 18.22 | 13.42 | 17.7 | |
| Riyadh | 20.83% | 18.75% | 8.33% | 52.08% | 100% |
| (low cooperation) | (10) | (9) | (4) | (25) | (48) |
| 6.82 | 8.79 | 2.86 | 6.93 | 6.9 | |
| Athens | 11.36% | 22.73% | 11.36% | 54.55% | 100% |
| (low cooperation) | (5) | (10) | (5) | (24) | (44) |
| 7.00 | 8.03 | 0 | 5.65 | 5.7 | |
Publisher’s Note: MDPI stays neutral with regard to jurisdictional claims in published maps and institutional affiliations. |
© 2021 by the authors. Licensee MDPI, Basel, Switzerland. This article is an open access article distributed under the terms and conditions of the Creative Commons Attribution (CC BY) license (https://creativecommons.org/licenses/by/4.0/).
Share and Cite
MDPI and ACS Style
Suleiman, R.; Samid, Y. Punishment Strategies across Societies: Conventional Wisdoms Reconsidered. Games 2021, 12, 63. https://0-doi-org.brum.beds.ac.uk/10.3390/g12030063
AMA Style
Suleiman R, Samid Y. Punishment Strategies across Societies: Conventional Wisdoms Reconsidered. Games. 2021; 12(3):63. https://0-doi-org.brum.beds.ac.uk/10.3390/g12030063
Chicago/Turabian StyleSuleiman, Ramzi, and Yuval Samid. 2021. "Punishment Strategies across Societies: Conventional Wisdoms Reconsidered" Games 12, no. 3: 63. https://0-doi-org.brum.beds.ac.uk/10.3390/g12030063
Note that from the first issue of 2016, this journal uses article numbers instead of page numbers. See further details here.