
Pledges of Commitment and Cooperation in Partnerships

1
Department of Economics, University of Zurich, Schönberggasse 1, Zurich CH 8001, Switzerland
2
School of Economics, University of Adelaide, Adelaide SA 5005, Australia
*
Author to whom correspondence should be addressed.
Games 2016, 7(1), 4; https://0-doi-org.brum.beds.ac.uk/10.3390/g7010004
Submission received: 26 October 2015
/
Revised: 1 January 2016
/
Accepted: 5 January 2016
/
Published: 20 January 2016
(This article belongs to the Special Issue Experimental Studies of Social Dilemma Games)
Abstract
:We use experimental methods to investigate whether pledges of commitment can improve cooperation in endogenously-formed partnerships facing a social dilemma. Treatments vary in terms of the individual’s: (1) opportunity to commit to their partner; (2) the cost of dissolving committed partnerships; and (3) the distribution of these dissolution costs between partners. Our findings show that pledges of commitment alone can increase cooperation and welfare in committed partnerships. The introduction of relatively large and equally split costs yields similar gains. In contrast, when costs to dissolve committed partnerships fall solely on the individual choosing to break up, pledges of commitment fail to improve cooperation and welfare.
JEL Classification:
C92; D03; D83; H411. Introduction
We conduct an experimental study to investigate how pledges of commitment influence cooperation in a social dilemma with endogenously-formed partnerships. The social dilemma we study is a modification of the standard linear voluntary contribution mechanism (VCM) ([1]).1 The VCM provides a simple framework that allows for a straightforward measurement of self-interested versus partnership-orientated behaviour. We augment the standard design by periodically introducing commitment and regrouping phases.2 In commitment phases, subjects in uncommitted partnerships simultaneously choose whether to pledge commitment to their partner. When both partners choose to commit, a committed partnership forms. Both subjects remain in a committed partnership until the end of the game or until one (or both) chooses to dissolve the partnership during a regrouping phase. In regrouping phases, subjects choose whether to stay in their current partnership or to dissolve the partnership and be rematched to a new partner. Subjects whose partnership has been dissolved are rematched to new partners according to their preferences using the stable marriage mechanism ([8]).
Our experimental design allows us to disentangle the effects of the two interrelated parts a pledge of commitment entails: the pledge itself and the costs of dissolving a committed partnership. A pledge of commitment by itself could serve to increase cooperation through signalling cooperative intentions or through serving a reassuring role. However, the formation of a committed partnership rarely involves only costless, mutual pledges of commitment. Costs are typically incurred when the partnership fails and needs to be dissolved. When dissolution costs are present, pledging commitment indicates a willingness to bear a cost if the partnership is unsuccessful. This potentially strengthens the credibility of a pledge of commitment, leading to higher cooperation levels.
We also want to understand the role of the size and distribution of dissolution costs that are incurred by committed partners. Holding the distribution of costs between partners fixed, the effect of an increase in the total cost of dissolution on cooperation is ambiguous. A partner may increase contributions to avoid being broken up with and the resulting higher costs. On the other hand, choosing to dissolve a partnership is more costly, decreasing the probability a subject dissolves the partnership, providing their partner an incentive to cooperate less. The distribution of costs between partners upon dissolution should also play a role in determining cooperation levels among committed partners. When the cost burden falls asymmetrically on the instigator of the dissolution, he may be less likely to dissolve, perceiving costs of dissolution too high or the distribution unfair. Anticipating this reluctance, there is a scope for partners to behave opportunistically by decreasing cooperation.
Qualitative aspects of the experimental design seem well suited to stylized features of the marriage market and some business partnerships. In the marriage market, individuals learn about the cooperativeness of their partner in an initial dating stage and may decide to pledge commitment through marriage. Dissolving a marriage through divorce is often costly, and the size and distribution of these costs may fall differently in each relationship. Our set-up speaks to how and whether these costs may influence the ultimate success of the relationship. Business partnerships can also be thought of as an in-kind social dilemma with costly dissolution, where partners trade-off work to enhance the value of the company versus working for oneself or shirking. Dissolving these partnerships may either be cost-free via informal agreements or costly via lost investments and/or costs to retrieve these investments. These costs may fall unevenly if one partner is more invested than the other or equally if investment levels are similar for each partner.
Our results show that pledges of commitment by themselves are associated with increases in cooperation in committed partnerships and translate into improvements in welfare. The increase in cooperation comes via an ability for partners to signal cooperative intentions. Once committed, subjects act on these intentions with high contributions. When dissolution is costly, we find that committed partnerships featured higher contributions when the breakup cost was equally shared. The introduction of these costs meant that fewer subjects were willing to commit, limiting the gains in welfare. Welfare gains are only found when the total dissolution burden is relatively high. Few committed partnerships increased contributions in response to the threat of costly breakups, bringing welfare to a level equal to when committed partnerships were costless to dissolve. In contrast, committed partnerships are less cooperative than partnerships in a “commitment-free” benchmark when costs to dissolve the partnership fall asymmetrically on the instigator of the breakup. Subjects use the reluctance of their partner to dissolve to decrease contributions and free ride, leaving committed partnerships caught in a low contribution trap.
2. Research Questions
The objectives of the study are two-fold. The first objective is general: to investigate whether pledges of commitment can increase and sustain cooperation when partnership formation is endogenous. We are interested in whether a pledge itself is enough to increase cooperation and whether the presence of costs to dissolve the partnership leads to further benefits.
Research Question 1. Do pledges of commitment increase cooperation in endogenously-formed partnerships?
Research Question 2. Does the presence of dissolution costs further increase the cooperation of committed partnerships?
The second, more focussed objective is to investigate how cooperation is influenced by the size and distribution of costs attached to dissolving committed partnerships. Along the cost dimension, we vary the size and distribution of the dissolution costs between partners. We are interested in how changes in the total cost burden, holding distribution fixed, influence the cooperation of committed partnerships. We also study the effect of asymmetries in the distribution for a fixed cost burden on cooperative behaviour.
Research Question 3. How important is the total size of the cost to dissolve a committed partnership in influencing cooperation?
Research Question 4. Do asymmetric dissolution costs effect cooperation in committed partnerships?
3. Experiment Design
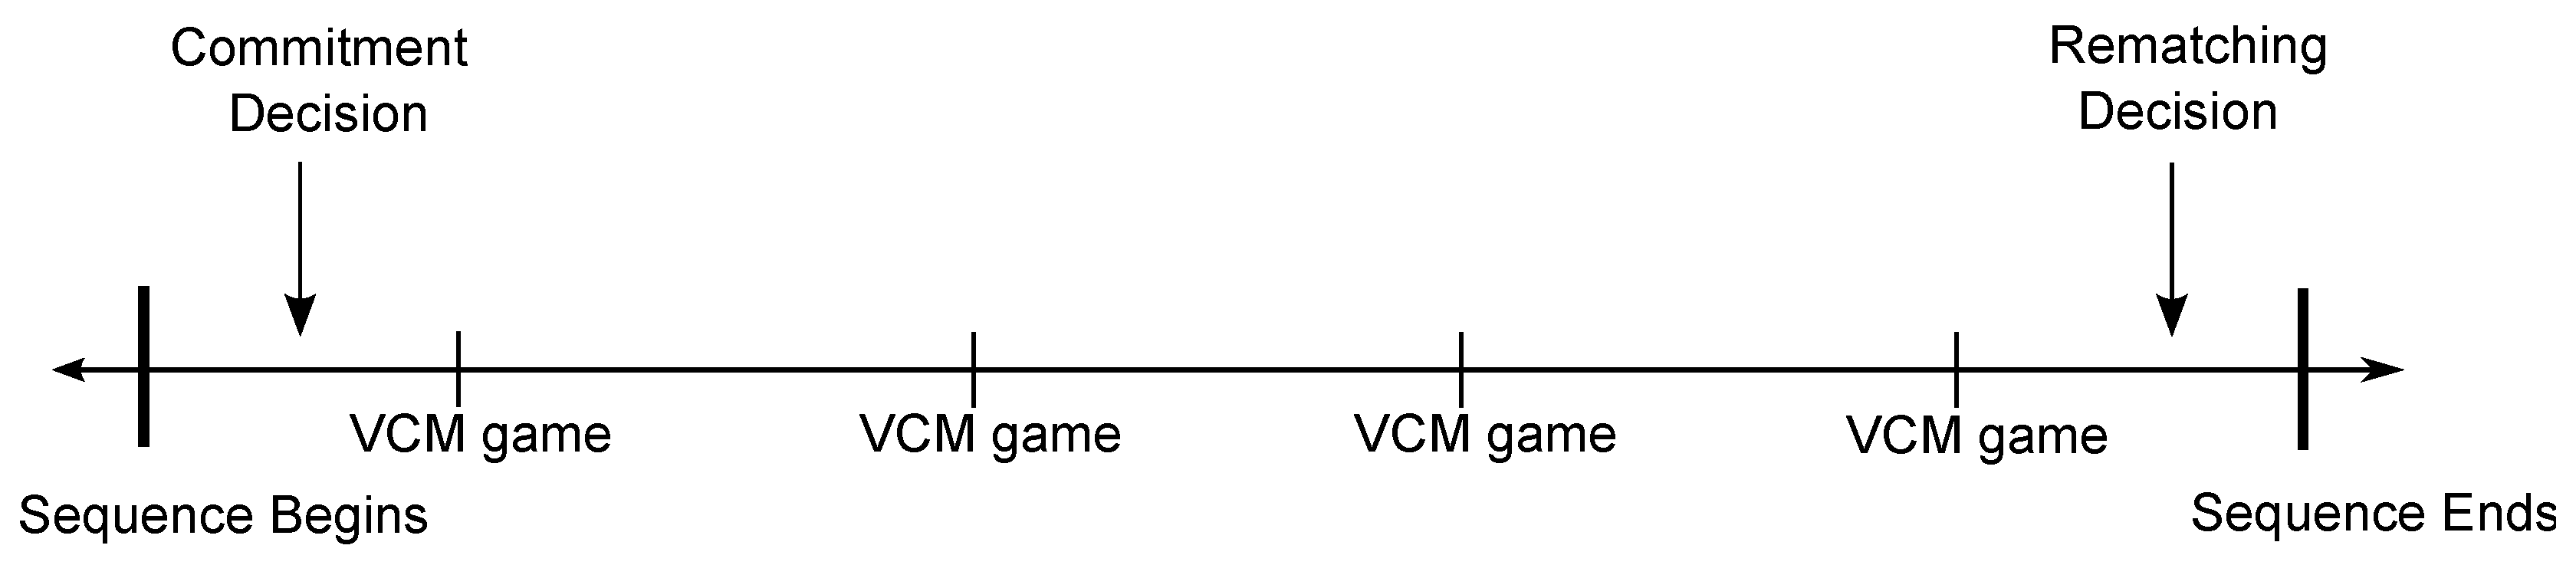
Each session features 32 periods of interaction, divided into eight sequences of four periods. In each sequence, all partnerships play four identical linear VCM games.3 At the conclusion of a sequence, subjects decide to dissolve their current partnership or remain together for the subsequent sequence. Subjects whose partnership is dissolved face a preference input and regrouping phase. Those in partnerships that did not dissolve enter directly into the next sequence. In experimental treatments, subjects in new or existing uncommitted partnerships face a commitment decision at the beginning of a sequence, prior to the VCM stages. In one control treatment, we remove the commitment phase at the beginning of the sequence. An additional control treatment also removes the commitment phase and replaces the endogenous regrouping protocol with random matching. Figure 1 graphically illustrates the order of play in a typical sequence.
Figure 1.
Timeline of a typical sequence in the game.

We now explain the three decision stages subjects face in each sequence, starting with the VCM.
3.1. The Voluntary Contribution Mechanism
The parametric structure of the VCM draws heavily on [8] and [6]. At the beginning of each period, subjects are endowed with 100 units of experimental currency. A subject chooses how to allocate the endowment between a private account, which is his or hers to keep, and a partnership account, which yields profit for both partners. We refer to the amount allocated to the partnership account as the subject’s contribution. Each unit contributed to the group account, , generates units of profit for each partner. The profit arising to each individual from the partnership’s contributions is . Payoffs are symmetric across partners, and allocation decisions are made simultaneously. The subject’s profit from each VCM stage is:
After the contribution decisions have been made, they are revealed to both partners, and the game continues. Each partner is informed about the total contribution to the partnership account, the individual contributions of both partners and their own profit from that period.
The payoff structure generates a social dilemma, because the net return from contributing one unit into the partnership’s account is negative (), whilst the net social return of one unit contributed is positive (). Average contributions are an indicator for a partnership’s success at overcoming the social dilemma because aggregate partnership welfare (W) increases linearly with the average contribution of each partner,
3.2. Pledges of Commitment
Subjects in experimental treatments face a commitment decision at the beginning of each sequence of four VCM games. Each partner in a newly-formed partnership or surviving uncommitted partnership has the opportunity to pledge commitment to their current partner. Subjects are asked simultaneously whether they want to pledge commitment to their partner. If both partners choose to pledge commitment, a committed partnership is formed. Partners were informed of the outcome and remained in a committed partnership until it was dissolved in a regrouping phase or the experiment ended. In all other situations, subjects remained in an uncommitted partnership. When one partner wanted to commit and the other did not, the willing partner was informed that his or her counterpart was “not willing to commit right now.” If both partners decided not to commit, both were informed of the outcome. Subjects then progressed to the next four VCM periods.
3.3. Regrouping
At the conclusion of each sequence, all subjects could be regrouped. In one control treatment, all subjects were regrouped randomly by the computer and continued onto the next sequence. In all other treatments, subjects could choose to dissolve their current partnership and be regrouped.4 A partnership was dissolved if one or both partners chose to dissolve. Subject’s whose partnership dissolved enter into a pool of “singles” to be regrouped. There was no cost of dissolving an uncommitted partnership. The cost of dissolving committed partnerships varied across treatments, as shown in Table 1.
All “single” subjects were regrouped according to the stable marriage algorithm [10]. Subjects were shown information about the average contributions from the previous sequence of four VCM games of “single” subjects to form preferences over potential partners.5 Subjects ranked potential partners in order of desirability.6 When the ranking process was complete, the matching algorithm used these preferences to produce a stable matching. Subjects were informed that they had been regrouped and entered into the next sequence without information about with whom they had been matched. They could only use indirect inference by observing their partner’s contributions over the next sequence.
The mechanism underlying group formation is quite complex. For this reason, instructions provided to subjects do not fully explain how the algorithm works to avoid confusion and noisy regrouping behaviour. The regrouping procedure is described in the instructions as follows:78
“The computer will collect the rankings from every ‘single’ and rematch all ‘singles’ according to these rankings. The partner you are matched with is determined by your preferences and the preferences of all other ‘singles.’ The computer is programmed to give you the best partner available.”

| Treatment | Cost to Dissolve | Share of Cost Paid by Each Partner | |||||
|---|---|---|---|---|---|---|---|
| No. of Sessions | No. of Subjects | Endogenous Regrouping | Option to Commit | Committed Partnership | Unilateral Dissolution | Bilateral Dissolution | |
| Random Matching | 2 | 30 | No | No | - | - | - |
| No Commitment | 3 | 56 | Yes | No | - | - | - |
| Costless Pledge | 3 | 58 | Yes | Yes | 0 | - | |
| Asymmetric Cost | 3 | 60 | Yes | Yes | 400 | Instigator pays $400 | Both pay $200 |
| Other pays $0 | |||||||
| Shared Low Cost | 3 | 50 | Yes | Yes | 400 | Both pay $200 | Both pay $200 |
| Shared High Cost | 3 | 60 | Yes | Yes | 800 | Both pay $400 | Both pay $400 |
3.4. Treatments
We implement six treatments to investigate the research questions posed in Section 2. Treatment differences are summarized in Table 1. The Random Matching treatment and No Commitment treatment serve as controls. Four experimental treatments add periodic commitment opportunities to the No Commitment treatment and vary in the cost structure of dissolving committed partnerships.
Differences in contribution behaviour between No Commitment and Costless Pledge identify how a pure pledge of commitment influences cooperation in endogenously-formed partnerships (Research Question 1). Remaining differences between Costless Pledge and other experimental treatments highlight the importance of dissolution costs in enhancing cooperation (Research Question 2). Comparing cooperation levels between Shared Low Cost and Shared High Cost isolates the role of the total cost burden (Research Question 3). Finally, the role of asymmetry in costs is seen by comparing Shared Low Cost and Asymmetric Cost (Research Question 4).
3.5. Implementation
We conducted seventeen sessions, two sessions of the Random Matching treatment and three sessions for all other treatments described in Table 1. Between 16 and 20 subjects participated in each session, for a total of 314 participants. All sessions were conducted at the Adelaide Laboratory for Experimental Economics (AdLab) at the University of Adelaide. The experiment was computerized, and scripts were programmed using the z-Tree platform [12]. Subjects were mainly undergraduate and graduate students from a variety of majors at the University of Adelaide recruited using the online recruitment system ORSEE [13]. Approximately thirty percent of participants were majoring in commerce, economics or finance. Of the remaining seventy percent, most participants were from an engineering, law or science background. Fifty percent of participants were female. No subject participated in more than one session of the experiment. On average, sessions lasted 90 minutes including initial instruction and payment of subjects. Subjects earned an average of .9
4. Results
4.1. Average Contributions
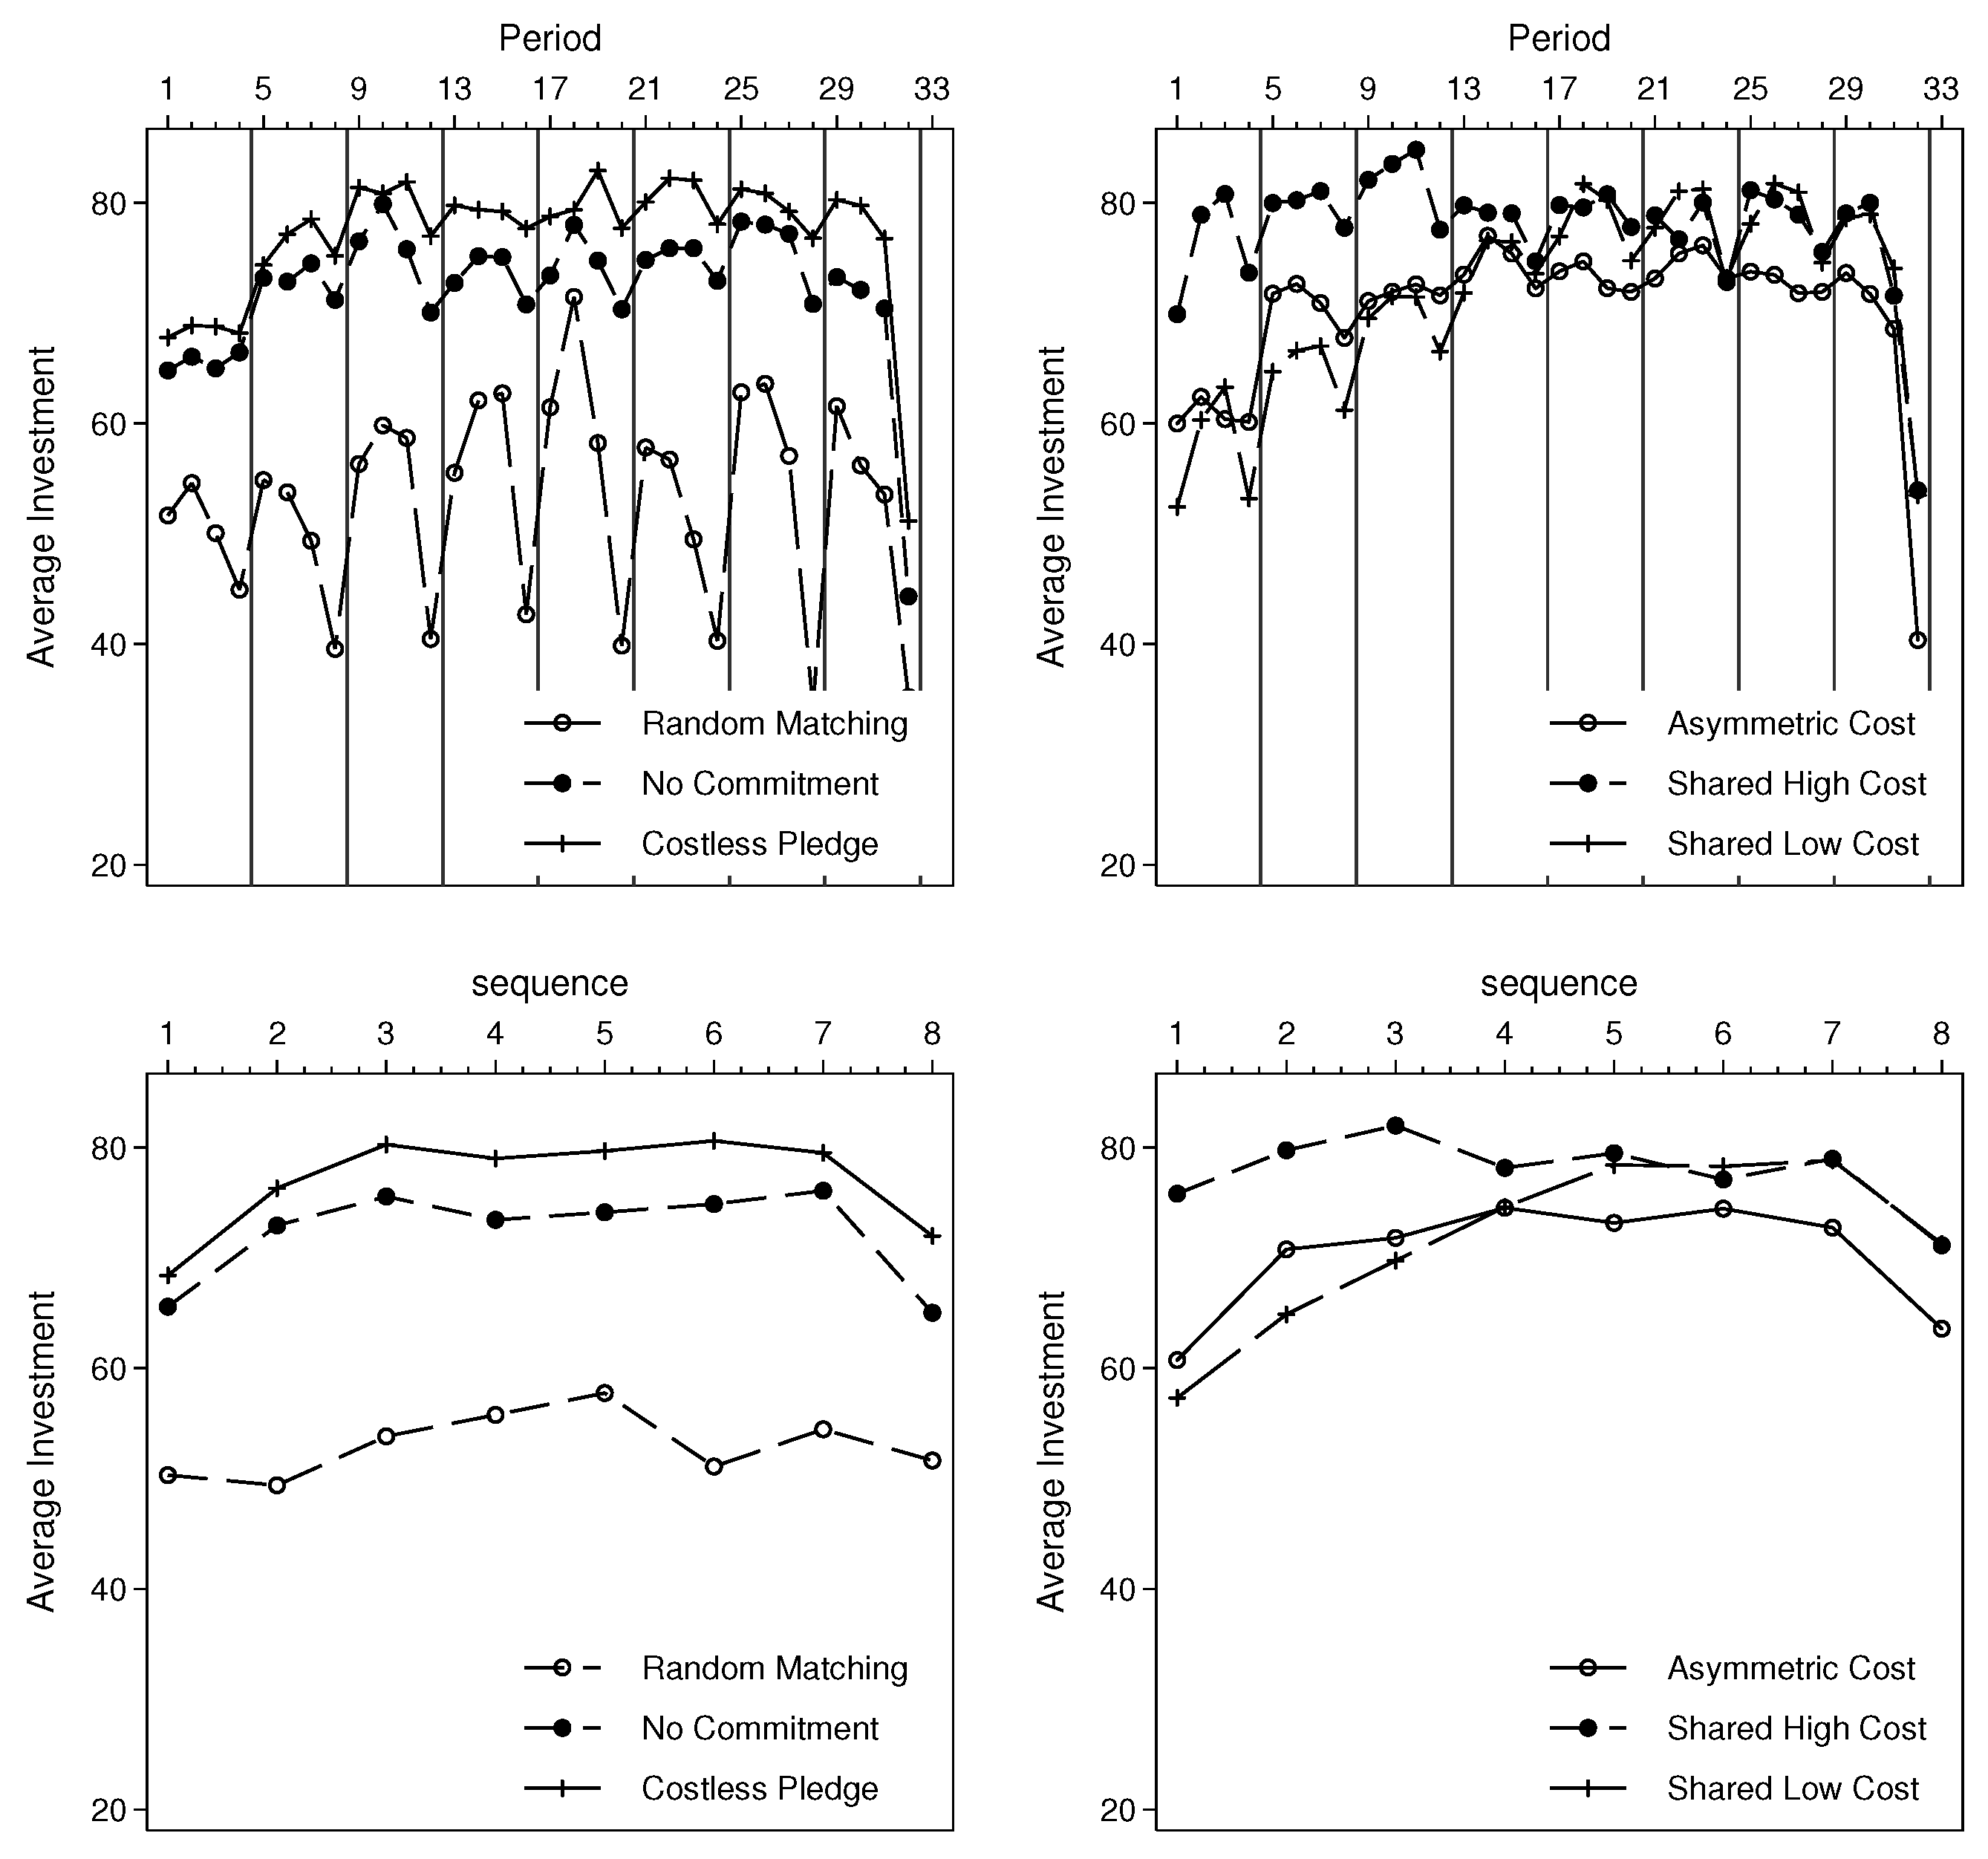
Figure 2 illustrates the time path of individual contributions averaged across subjects in each of the six treatments. The top panels show average contributions by period. Average contributions per sequence of four periods are shown in the lower panels. Table 6 in the Appendix shows the corresponding average contributions by sequence for each treatment along with the overall average. Added to this table are the median and the standard deviation of contributions. We observe substantial differences in contributions between treatments. Average contributions are highest in the Shared High Cost and Costless Pledge treatments (77.81 and 76.98, respectively), followed in turn by the No Commitment (72.21), Shared Low Cost (71.68), Asymmetric Cost (70.21) and Random Matching (53.03).
Mann–Whitney pairwise statistical tests comparing the contributions between treatments yield the results shown in Table 2. The unit of observation is the average contribution of individual subjects per sequence.10 The results confirm what was seen graphically in Figure 2: contributions are highest in the Costless Pledge and Shared High Cost treatments. There is no statistical difference in contributions between these two treatments overall. Contributions in Shared Low Cost are below those in No Commitment over the first four sequences, but similar over the last four sequences. There is no difference in contributions between the No Commitment and Asymmetric Cost treatment. All treatments with endogenous regrouping feature higher contributions than Random Matching.
Observation 1. Overall cooperation is highest in the Costless Pledge and Shared High Cost treatments and lowest under Random Matching. In the Asymmetric Cost and No Commitment treatments, contributions are similar, lying above Random Matching, but below the best performing treatments. In the Shared Low Cost treatment, cooperation gradually increases to a level equal to the No Commitment treatment.
Figure 2.
Average individual contributions by treatment.

| No Commitment | Costless Pledge | Asymmetric Cost | Shared Low Cost | Shared High Cost | |
|---|---|---|---|---|---|
| All Sequences | |||||
| Random Matching | |||||
| No Commitment | - | ||||
| Costless Pledge | - | - | |||
| Asymmetric Cost | - | - | - | ||
| Shared Low Cost | - | - | - | - | |
| Sequences 1–4 | |||||
| Random Matching | |||||
| No Commitment | - | ||||
| Costless Pledge | - | - | |||
| Asymmetric Cost | - | - | - | ||
| Shared Low Cost | - | - | - | - | |
| Sequences 5–8 | |||||
| Random Matching | |||||
| No Commitment | - | ||||
| Costless Pledge | - | - | |||
| Asymmetric Cost | - | - | - | ||
| Shared Low Cost | - | - | - | - |
Notes: The absolute value of the z-statistic reported is for the Mann–Whitney U-test that average individual contributions per sequence (of four periods) are equal between treatments. Significance levels: ; ; .
Higher contributions do not necessarily translate one-to-one with higher welfare because of the payoff reducing costs associated with partnership dissolution in some treatments. To assess whether dissolution costs effect the welfare ranking, we run the same Mann–Whitney U-tests as above on average sequence profits for each treatment. The results of these tests yield the efficiency rankings displayed in Table 3. These rankings highlight that Shared High Cost and Costless Pledge yield equal gains in efficiency and are the only treatments that outperform the No Commitment treatment over the duration of the experiment.
| All Sequences | Sequences1–4 | Sequences 5–8 | |||
|---|---|---|---|---|---|
| Ranking | Treatment | Ranking | Treatment | Ranking | Treatment |
| 1 | Shared High Cost | 1 | Shared High Cost | 1 | Shared High Cost |
| 1 | Costless Pledge | 2 | Costless Pledge | 1 | Costless Pledge |
| 3 | Shared Low Cost | 2 | Asymmetric Cost | 3 | Shared Low Cost |
| 3 | Asymmetric Cost | 2 | No Commitment | 3 | Asymmetric Cost |
| 3 | No Commitment | 5 | Shared Low Cost | 3 | No Commitment |
| 6 | Random Matching | 6 | Random Matching | 6 | Random Matching |
Notes: Ranking based on Mann–Whitney U-test results that average individual profits per sequence (of four periods) are equal between treatments.
In the remaining subsections, we dig deeper into the data to explain how these efficiency differences arise. Next, we look at cooperation levels for committed and uncommitted partners in each treatment. We then turn to analyse differences in the proportion of committed partnerships by treatment. Finally, we investigate the dissolution decisions of subjects.
4.2. Commitment Status and Contributions
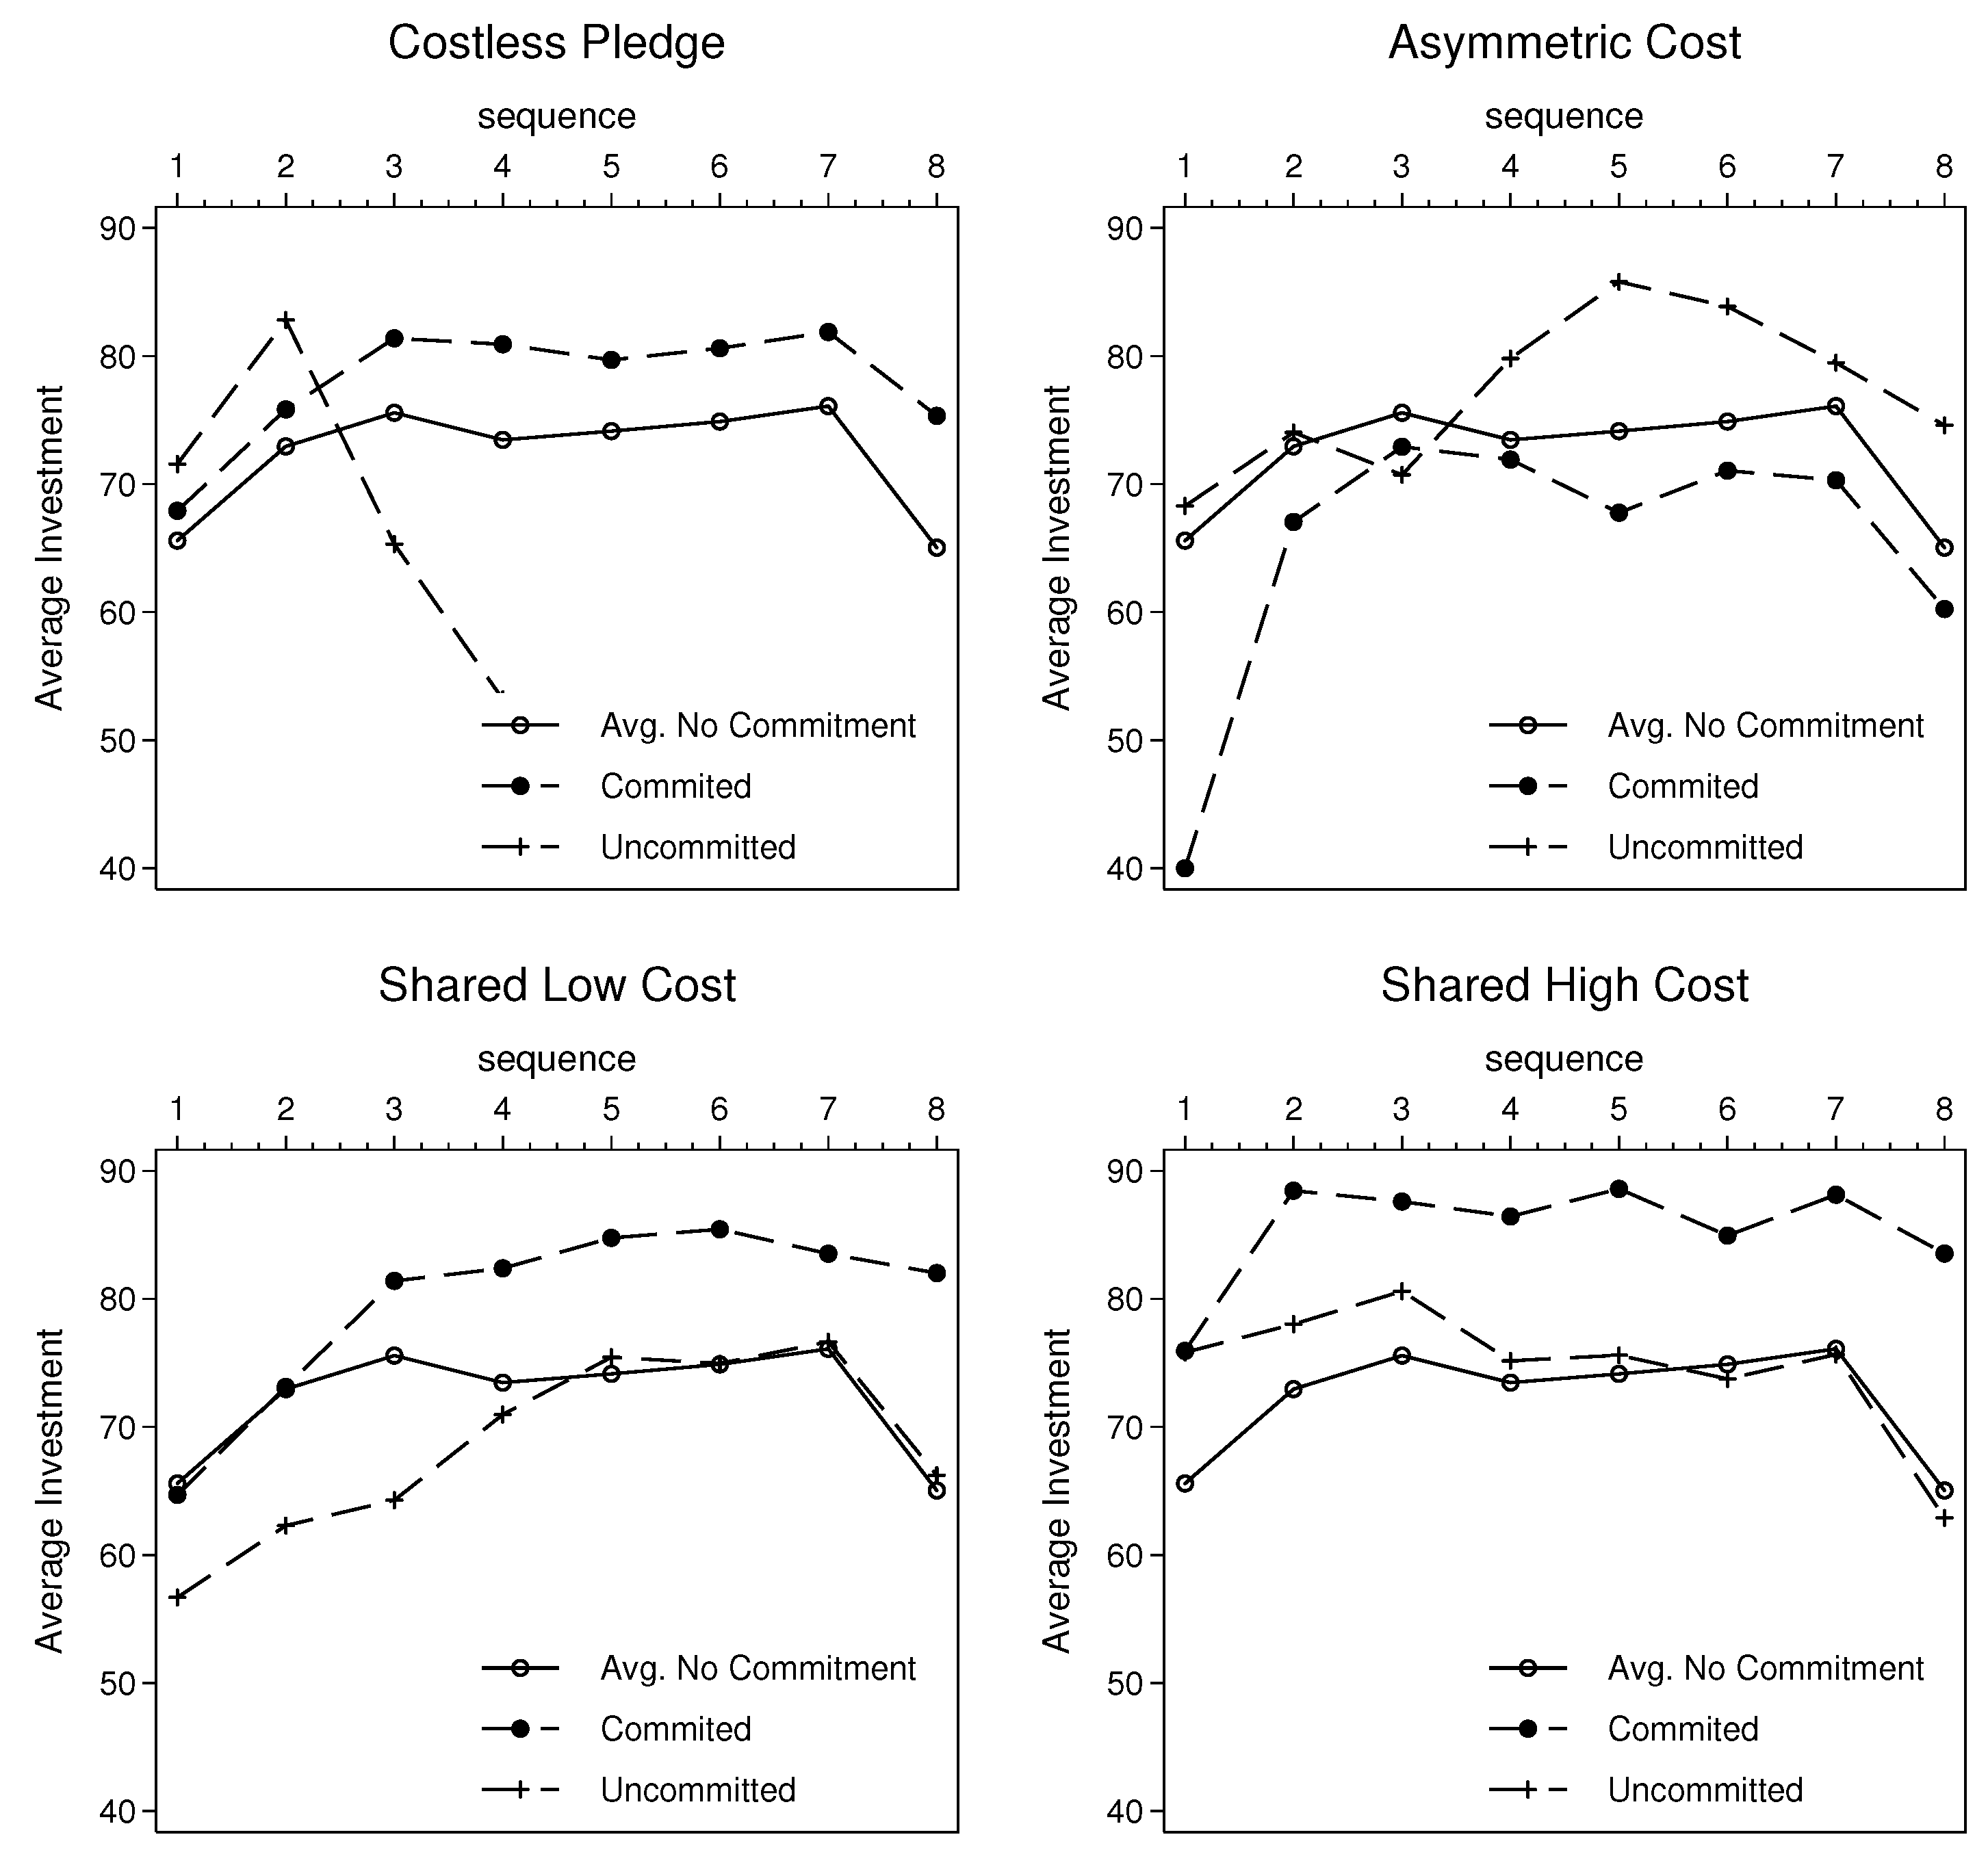
Figure 3 disaggregates average contribution profiles for committed and uncommitted subjects in each experimental treatment by sequence. In each panel, the average contribution of subjects in the No Commitment treatment is included as a reference. Table 7 in the Appendix presents the average contributions by treatment and sequence corresponding to Figure 3. The figure clearly documents that committed partnerships are associated with higher average contributions than uncommitted partnerships for all treatments, except Asymmetric Cost. Contributions of committed partners also lie above the No Commitment benchmark.
To tease out the relative effectiveness of commitment on increasing contributions of committed subjects between treatments, we run a series of Mann–Whitney U-tests. The unit of observation is the average contribution level of a subject within a sequence. Table 4 presents the results for all sequences and those disaggregated into the first and last four sequences. The results show that contributions of committed subjects are similar in Costless Pledge, Shared Low Cost and shared hight cost. We cannot reject the null hypothesis of equal average contributions of committed subjects in all pairwise tests between Costless Pledge, Shared Low Cost and Shared High Cost. This confirms what we see graphically in Figure 3. We can also see that the Asymmetric Cost treatment is the least successful of all treatments in getting committed subjects to overcome the social dilemma.
Observation 2. Contributions of committed partners are higher than a No Commitment benchmark when there are no costs to dissolve committed partnerships, or these costs fall equally. There is no treatment difference in the contributions of committed subjects between Costless Pledge, Shared Low Cost and Shared High Cost. Committed subjects in Asymmetric Cost perform the worst, with contributions lower than subjects in the No Commitment reference.
This result provides a first glance at the mechanisms driving the treatment differences in overall cooperation and efficiency. The gain in efficiency documented in Observation 1 in Shared High Cost, and Costless Pledge is driven by the higher contributions of committed subjects. However, this increase in cooperation alone cannot fully explain the efficiency result, because it does give rise to the rankings in Table 3. In particular, it cannot explain why Shared Low Cost does not perform better than No Commitment in terms of treatment level welfare. We now look to commitment rates and dissolution decisions to provide further evidence of the mechanisms at work.
Figure 3.
Average contributions by commitment status and sequence.

| Asymmetric Cost | Shared Low Cost | Shared High Cost | |
|---|---|---|---|
| All Sequences | |||
| Costless Pledge | |||
| Asymmetric Cost | - | ||
| Shared Low Cost | - | - | |
| Sequences 1–4 | |||
| Costless Pledge | |||
| Asymmetric Cost | - | ||
| Shared Low Cost | - | - | |
| Sequences 5–8 | |||
| Costless Pledge | |||
| Asymmetric Cost | - | ||
| Shared Low Cost | - | - |
Notes: The absolute value of the z-statistic reported is for the Mann–Whitney U-test that average individual contributions per sequence (of four periods) are equal between treatments. Significance levels: ; ; .
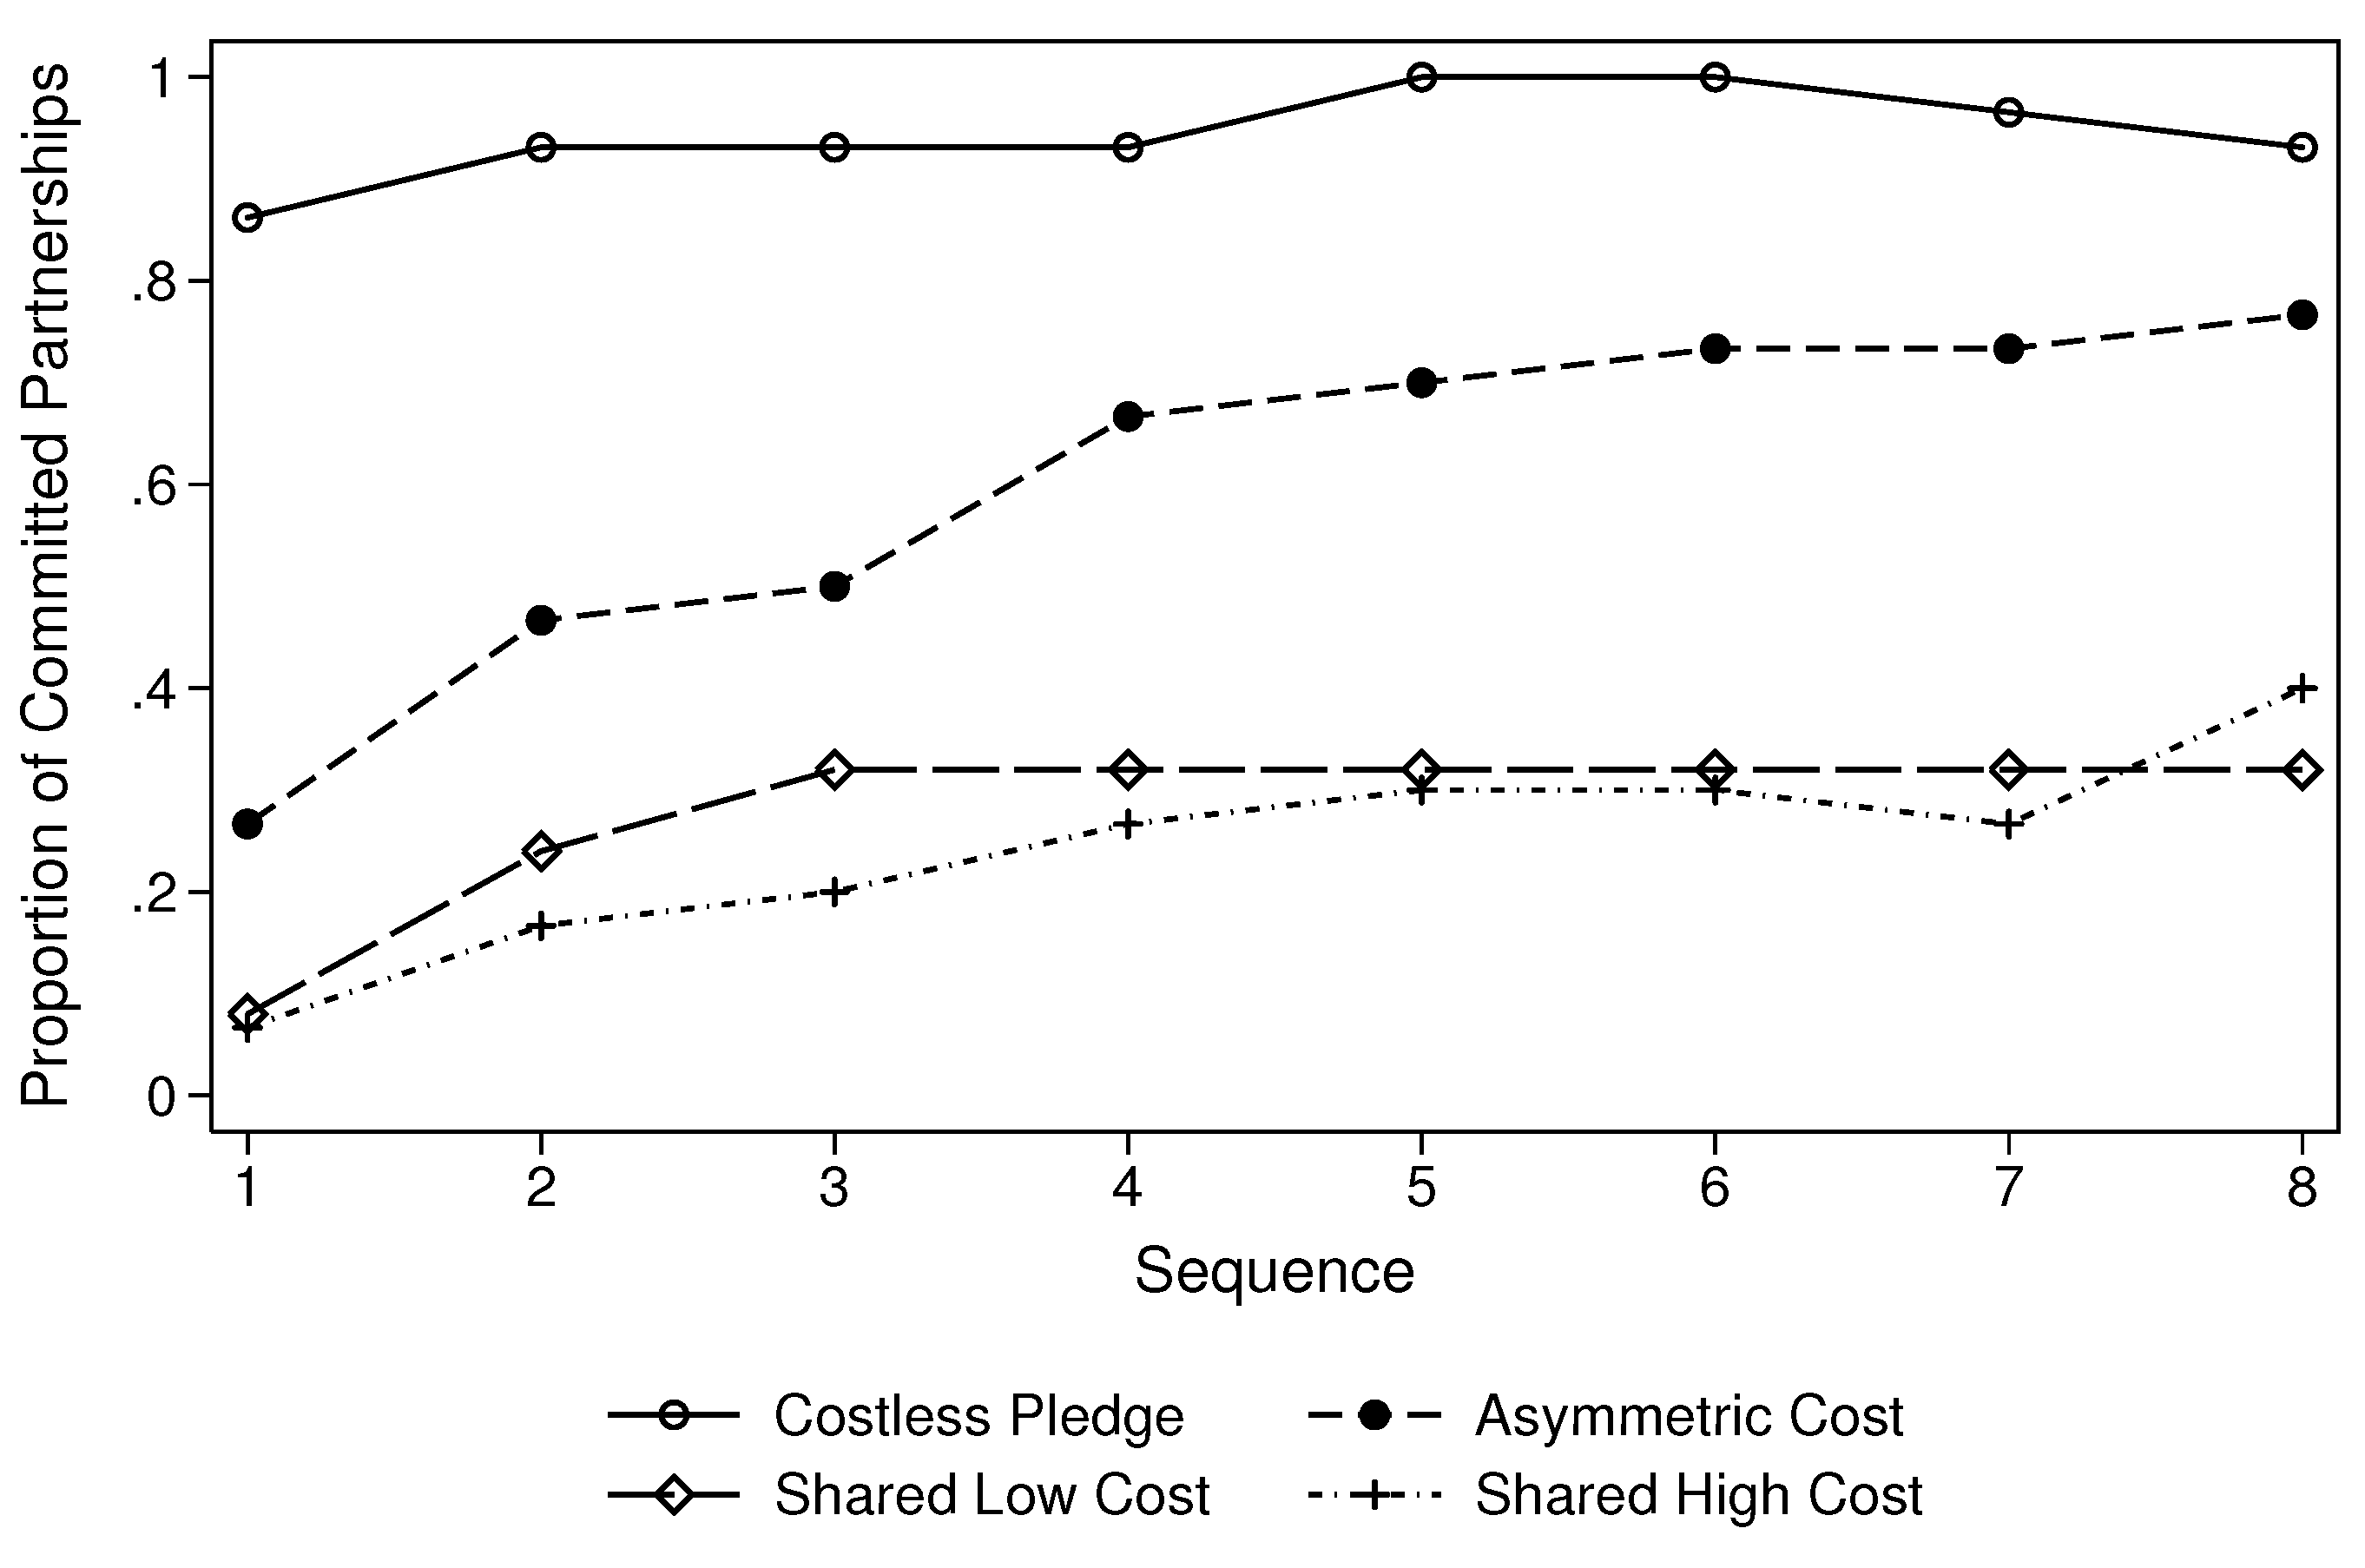
4.3. Proportion of Committed Partnerships
The proportion of committed partnerships across treatments and sequences is shown in Figure 4. The proportion is highest in the Costless Pledge treatment, staying above eighty percent in all sequences. A test of proportions confirms that the commitment rate is higher in Costless Pledge than any other treatment ( for all pairwise comparisons). In Sequences 5 and 6, every partnership in Costless Pledge is committed.
Figure 4.
Proportion of committed partnerships by treatment.

Variations in the distribution of dissolution costs between partners leads to significantly different proportions of committed partnerships. The proportion is higher in Asymmetric Cost, where only the partner choosing to dissolve a committed partnership pays a cost, compared to treatments where the dissolution costs are equally shared between partners ( for pairwise tests of proportions compared to Shared Low Cost and Shared High Cost respectively). There is no significant difference between Shared Low Cost and Shared High Cost, where the distribution of costs remains constant.
Observation 3. Partnerships are most likely to be committed when there are no costs to dissolving unsuccessful partnerships. The distribution of dissolution costs matter; there are more committed partnerships when costs are borne only by partners who instigate dissolution compared to when costs are equally shared by both partners.
Observations 2 and 3 suggest that treatment differences in overall efficiency documented in Table 3 are driven in part by composition effects. Whilst average contributions were similar in Costless Pledge and Shared Low Cost, there are less committed partnerships in Shared Low Cost. The low proportion of high contributing committed partnerships means that these cooperation gains did not translate into treatment level welfare gains in Shared Low Cost. At the same time, the high proportion of committed partnerships in Costless Pledge mean the cooperation increase did translate into treatment level welfare gains. This gain was similar in magnitude to that in Shared High Cost.
This high proportion of committed partnerships in Costless Pledge combined with the gains in cooperation in committed partnerships provide evidence that costless pledges serve to signal or reassure a partner of cooperative intentions. Furthermore, these pledges are effective in leading to higher cooperation levels in committed partnerships because partners act on these intentions when partnership formation is endogenous. This stands in contrast to [14], who show that structured pledges of commitment are ineffective at increasing cooperation under exogenous regrouping protocol.
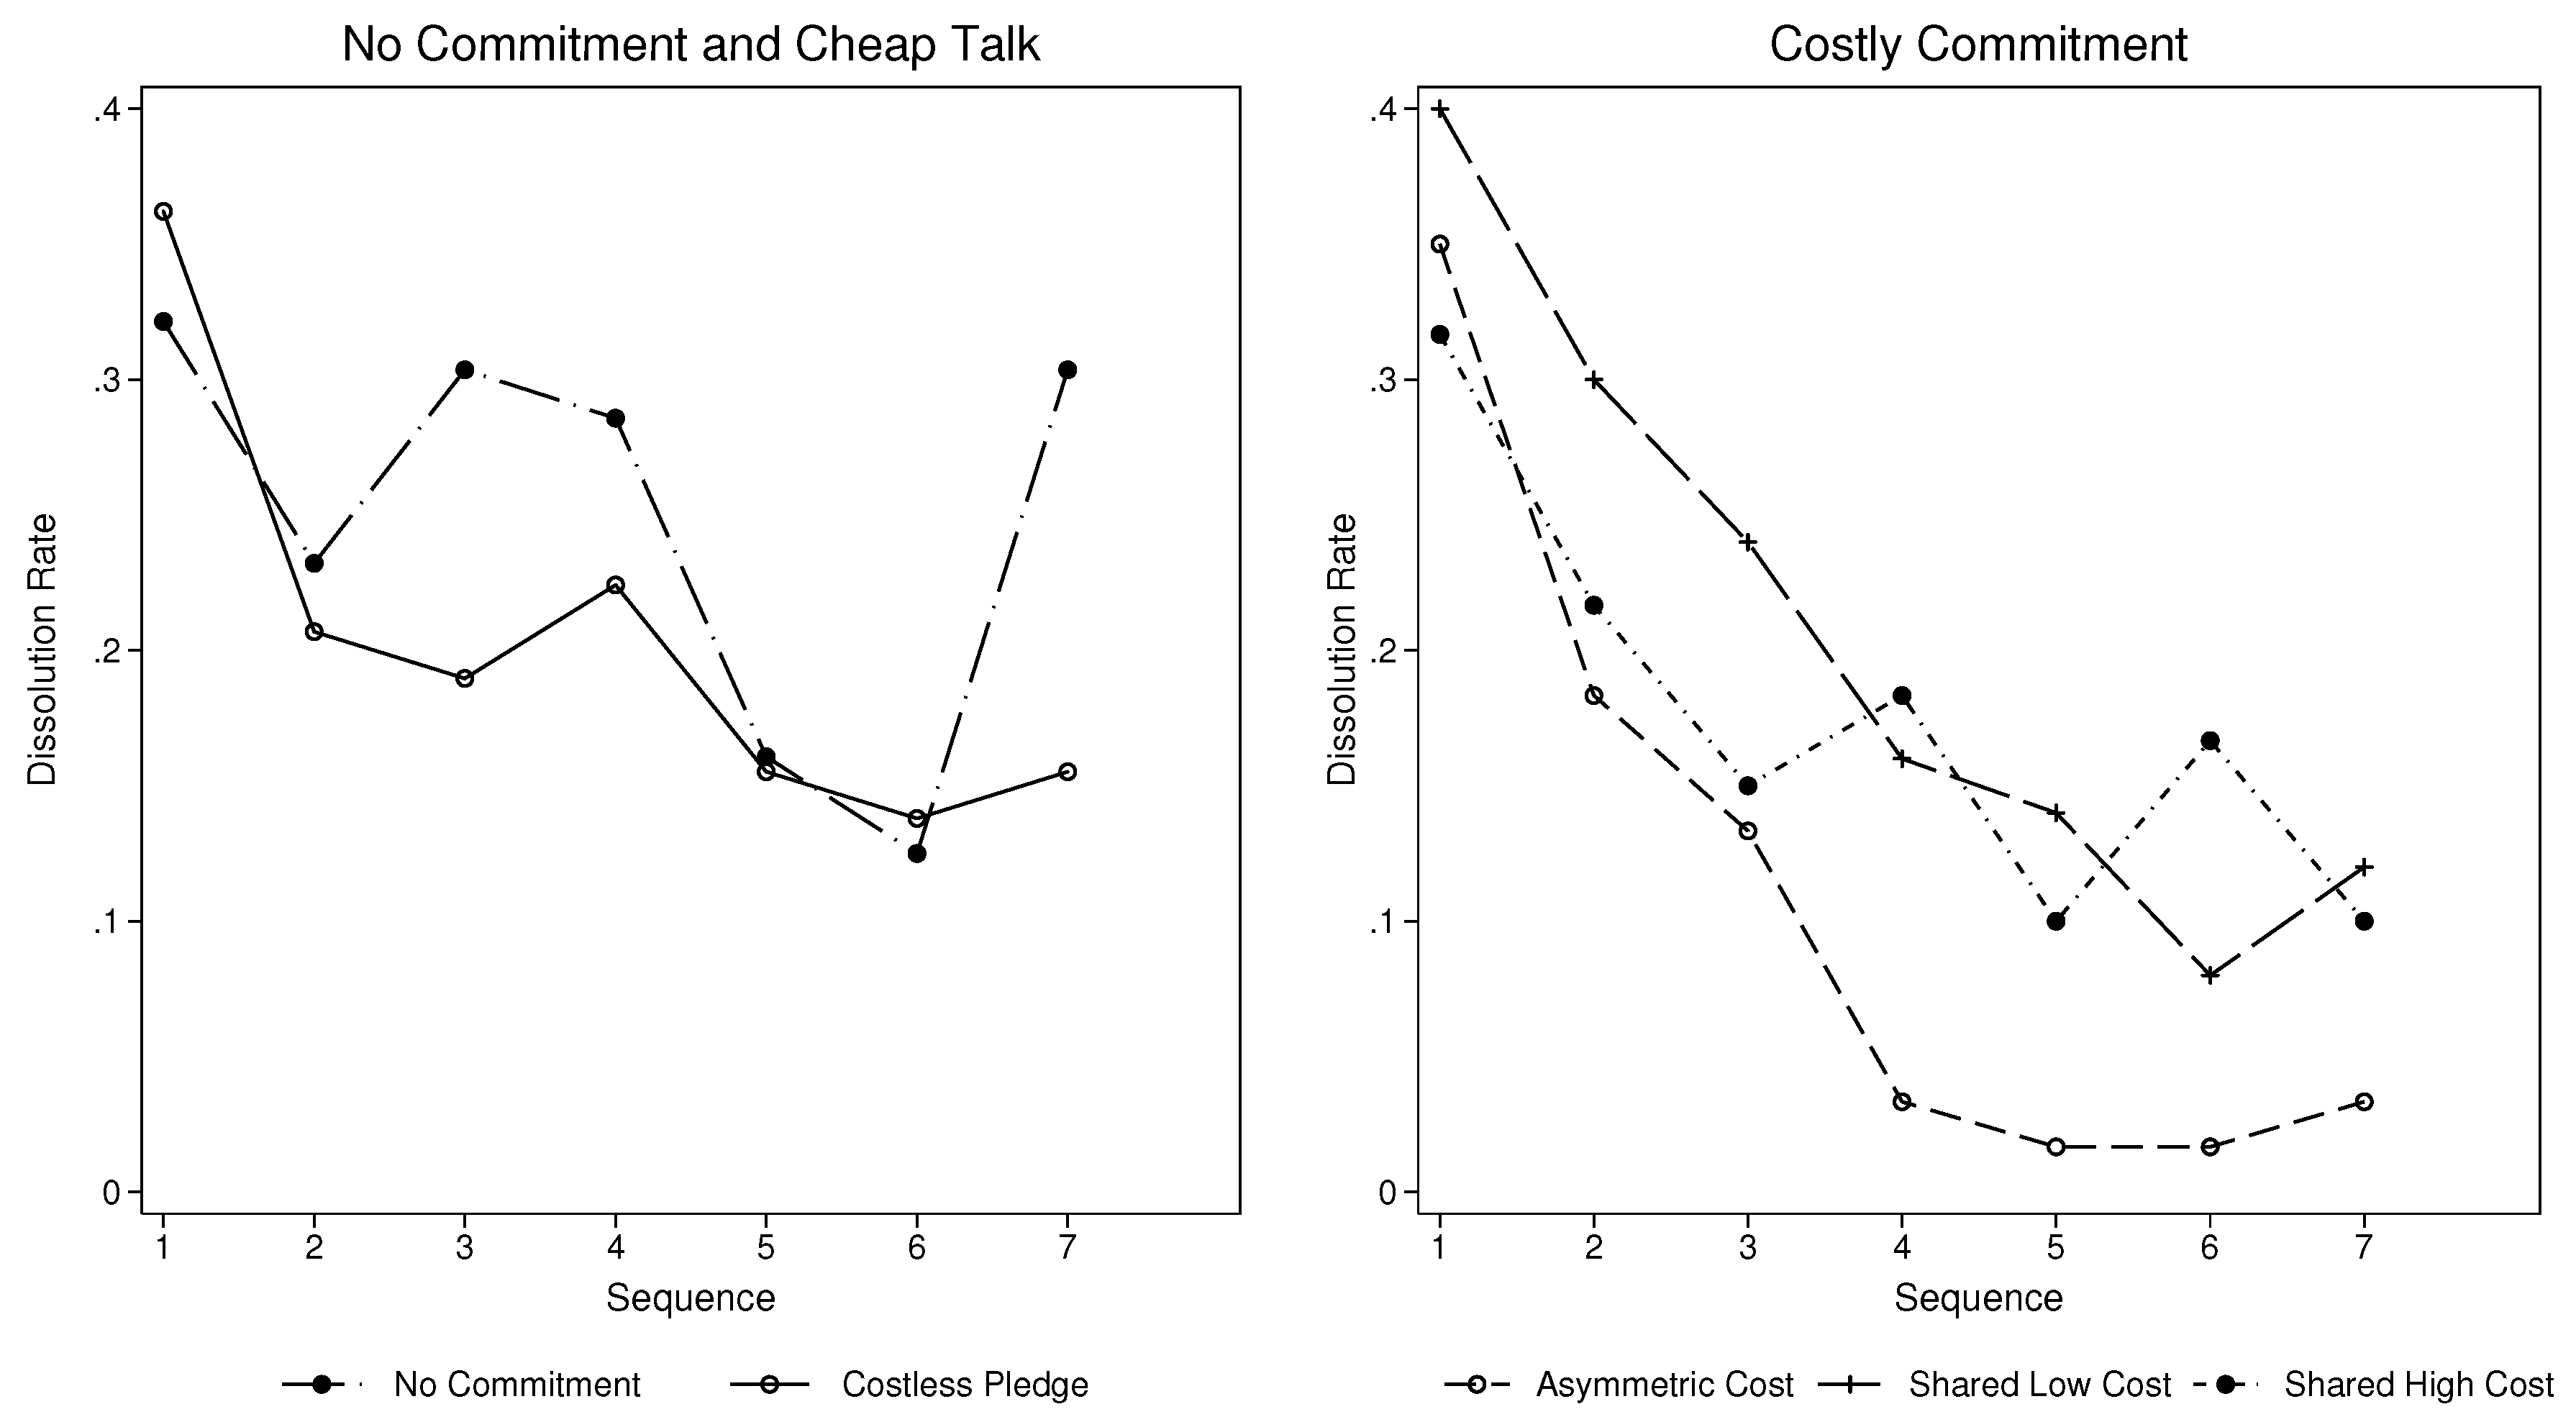
4.4. Partnership Dissolution
We now turn to analyse partnership dissolution decisions.11 Dissolution rates by treatment and sequence are plotted in Figure 5. The left panel documents the fraction of partnerships that are dissolved in the No Commitment and Costless Pledge treatments. Dissolution rates for treatments where dissolving a committed partnership is costly are shown in the right panel. We can see that the introduction of commitment opportunities decreases the aggregate dissolution rate.12 These treatment differences in dissolution rates documented in Figure 5 are a combination of two effects: the direct effect of commitment and an indirect effect through changes in contributions. To disentangle the two effects, we estimate a random effects linear probability model. The dependent variable in the regression is the dissolution decision of each subject in a regrouping phase.13 The regression coefficients are reported in Table 5.
Figure 5.
Partnership dissolution rates by treatment and sequence.

| (1) | (2) | (3) | |
|---|---|---|---|
| Pr(Dissolve) | RELPM | RE LPM | RE LPM |
| Treatment Indicators | |||
| Costless Pledge | 0.198 *** | 0.165 ** | 0.169 ** |
| (0.0740) | (0.0738) | (0.0745) | |
| Asymmetric Cost | −0.000536 | −0.0216 | −0.0248 |
| (0.0372) | (0.0374) | (0.0392) | |
| Shared High Cost | −0.00159 | −0.00807 | −0.00617 |
| (0.0324) | (0.0324) | (0.0334) | |
| Shared Low Cost | −0.0292 | −0.0320 | −0.0347 |
| (0.0345) | (0.0345) | (0.0354) | |
| No Commitment | reference treatment | ||
| Commitment Effects | |||
| Commit × Costless Pledge | −0.222 *** | −0.188 *** | −0.192 *** |
| (0.0710) | (0.0708) | (0.0710) | |
| Commit × Asymmetric Cost | −0.252 *** | −0.216 *** | −0.205 *** |
| (0.0359) | (0.0365) | (0.0372) | |
| Commit × Shared High Cost | −0.131 *** | −0.107 ** | −0.106 ** |
| (0.0450) | (0.0451) | (0.0457) | |
| Commit × Shared Low Cost | −0.116 *** | −0.101 ** | −0.0953 ** |
| (0.0447) | (0.0446) | (0.0451) | |
| Contributions controls | |||
| Own Max | 0.0192 *** | 0.0183 *** | 0.0176 *** |
| (0.00526) | (0.00524) | (0.00530) | |
| Own Min | −0.0229 *** | −0.0212*** | −0.0215 *** |
| (0.00354) | (0.00354) | (0.00356) | |
| Partner Max | −0.0323 *** | −0.0334 *** | −0.0334 *** |
| (0.00510) | (0.00507) | (0.00510) | |
| Partner Min | −0.0286 *** | −0.0270 *** | −0.0264 *** |
| (0.00347) | (0.00347) | (0.00349) | |
| Constant | 0.676 *** | 0.742 *** | 0.716 *** |
| (0.0396) | (0.0426) | (0.0550) | |
| Sequence Dummies | YES | YES | |
| Demographics | YES | ||
| % Pred | 0.88 | 0.78 | 0.78 |
| 0.121 | 0.121 | 0.124 | |
| 0.298 | 0.296 | 0.296 | |
| 0.323 | 0.332 | 0.336 | |
| Observations | 1988 | 1988 | 1988 |
| Number of Subjects | 284 | 284 | 284 |
Standard errors in parentheses, clustered at the session level. *** p < 0.01; ** p< 0.05; * p< 0.1
Looking first at the coefficients on treatment indicators, only the Costless Pledge coefficient is significantly different from zero. In all other treatments, the introduction of commitment opportunities has no effect on the dissolution decisions of uncommitted subjects. Uncommitted subjects in Costless Pledge are more likely to dissolve because these (few) uncommitted partnerships were unsuccessful at achieving cooperation, so subjects were dissolving their partnerships, frequently anticipating re-matching to a more cooperative partner. The negative coefficients on the commitment-treatment interactions show subjects in committed partnerships are less likely to dissolve their partnership than their uncommitted counterparts in the same treatment. Compared to the reference treatment, No Commitment, subjects in committed partnerships that are costly to dissolve are less likely to break up their partnership. This is not true for Costless Pledge, where committed subjects are equally to dissolve as subjects in No Commitment. The distribution of dissolution costs plays an important role in the dissolution decision. For a given contribution profile, committed subjects are 10.7% less likely to dissolve their partnership in Asymmetric Cost compared to Shared Low Cost. This difference is statistically significant at the 5% level. There is no difference in dissolution rates between Shared Low Cost and Shared High Cost.
Observation 4. The introduction of costly pledges of commitment decreases the likelihood that committed partners choose to dissolve their partnership, but have no effect on uncommitted partnerships. Dissolution rates are lowest when the cost burden falls solely on the partner choosing to dissolve, but are no different when we scale up the cost holding the distribution constant. Costless pledges have no effect on dissolution decisions of committed subjects compared to a setting where commitment opportunities are not available.
The decline in the likelihood of dissolution in Asymmetric Cost illustrates the potential mechanism driving the ineffectiveness of commitment to increase cooperation in the treatment. Upon committing to a partnership, a subject (correctly) anticipates that his or her partner is unwilling to choose to dissolve the partnership and bear the high costs alone, perceiving the cost too high or the distribution unfair. In response, the subject begins to free-ride on his or her partner, decreasing contributions. If his or her partner is a conditional cooperator, he or she in turn responds by decreasing cooperation [15,16]. As a result, the partnership becomes trapped in a low cooperation state with both partners reluctant to dissolve. This suggests that the relatively large presence of committed partnerships in the treatment explains the lower treatment efficiency. Despite the low contributing committed partnerships, treatment efficiency in Asymmetric Cost does not fall below the No Commitment benchmark. In this treatment, uncommitted partnerships use the threat of costless dissolution to maintain high levels of cooperation, mitigating the decline.
The regression results also highlight a difference in the mechanisms driving the cooperation gains in Costless Pledge and Shared High Cost. In the Costless Pledge treatment, we have documented evidence that pledges can be used to signalling cooperative intentions. Despite this signal and the rise in contributions, we do not see a decrease in partnership dissolution in this treatment relative to No Commitment. This contrasts with Shared High Cost, where we see a substantial decline in breakups of committed partnerships. We interpret this result as an alternative mechanism driving welfare gains in this treatment. Although fewer subjects choose to commit in Shared High Cost, those that enter committed partnerships remain with their partner for longer. Cooperation is sustained in these partnerships, unlike Asymmetric Cost, because partners respond to the threat of credible dissolution by keeping contributions high.
5. Conclusions
We report on a set of experiments that were designed to investigate if pledges of commitment enhance cooperation in endogenously-formed partnerships. The design isolates the role of the pledge of commitment separately from the effect of costs incurred by partners when their partnership is dissolved. Our results show that pledges by themselves can yield increases in cooperation within committed partnerships and are welfare improving. In the Costless Pledge treatment, more than 80 percent of all partnerships feature mutual pledges of commitment. These partnerships have higher rates of cooperation than a benchmark treatment where commitment opportunities are removed. The results suggest that pledges of commitment serve to signal cooperative intentions. Furthermore, once subjects are committed, they coordinate on higher contributions.
A specific focus of the experiment was to analyse how the size and distribution of costs attached to dissolving committed partnerships influence cooperation. In this dimension, our results emphasize the importance of costs being split between subjects when partnerships are dissolved. In two treatments where the costs were equally split between partners, we documented higher cooperation levels in committed partnerships. In these cases, we found a similar increase in cooperation among committed partnerships compared to the Costless Pledge regime. For the Shared High Cost treatment, this translated into welfare gains of a similar magnitude to Costless Pledge. However, the adverse effect the introduction of commitment had on uncommitted subjects in early sequences plus the small number of committed partnerships meant no welfare gains were present in Shared Low Cost. In Asymmetric Cost, where costs fell solely on the instigator of the breakup, cooperation levels fell. In this treatment, subjects anticipated the reluctance of their partner to dissolve the relationship and to bear all of the financial cost by free-riding.
Our results show that pledges of commitment by themselves, and with high and equally-shared dissolution costs, increase welfare in endogenously-formed partnerships. When the total cost burden of equally-shared costs is too low or costs fall only on instigators of breakups, we find no effect on treatment level welfare. This stands in contrast to the previously-studied notions of costly sanctions [17] and monetary punishment [18,19,20] that have mixed effects on welfare [21] and can be welfare decreasing. Furthermore, there is limited evidence that costly sanctioning and punishment schemes are widely used outside laboratory environments [22], unlike voluntary association and notions of commitment to a partnership. We document that group formation when combined with pledges of commitment can increase cooperation and welfare to a level similar to the best performing punishment treatments [23]. This increase in cooperation comes at both zero cost with pure pledges and at a one-to-one ratio when dissolution costs are equally shared, in contrast to the most effective punishment schemes that rely on ratios above one-to-three.
Acknowledgments
We thank the Editor, Ananish Chaudhuri, and two anonymous referees for their comments that improved the manuscript. We also thank attendees at the 2011 Australasian Meeting of the Econometric Society, 2011 Australian Conference of Economists, 2011 Australia and New Zealand Workshop for Experimental Economics, Ben Greiner, Changxia Ke and Virginie Masson, for useful comments on earlier versions of this paper. We gratefully acknowledge Mickey Chan and Nok Shatragram, who assisted in programming and running sessions of the experiment.
Author Contributions
Lachlan Deer contributed to the design of the experiment, ran the experimental sessions, performed the statistical analysis, interpreted results and wrote the manuscript. Ralph-C. Bayer contributed to the design of the experiment, interpreted results and wrote the manuscript.
Conflicts of Interest
The authors declare no conflict of interest.
Appendix
Appendix Tables: Contribution Behaviour
| Sequence | ||||||||||
|---|---|---|---|---|---|---|---|---|---|---|
| Treatment | 1 | 2 | 3 | 4 | 5 | 6 | 7 | 8 | Total | |
| Random Matching | Mean contr. | 50.32 | 49.39 | 53.83 | 55.77 | 57.76 | 51.09 | 54.47 | 51.63 | 53.03 |
| Median contr. | 50.00 | 50.00 | 50.00 | 59.50 | 60.00 | 50.00 | 50.00 | 50.00 | 50.00 | |
| SD | 33.00 | 37.96 | 36.39 | 34.47 | 36.69 | 36.37 | 36.66 | 38.86 | 36.31 | |
| No Commitment | Mean contr. | 65.58 | 72.95 | 75.57 | 73.46 | 74.14 | 74.88 | 76.09 | 65.03 | 72.21 |
| Median contr. | 70.00 | 85.00 | 82.00 | 80.00 | 80.00 | 80.00 | 90.50 | 72.50 | 80.00 | |
| SD | 34.69 | 30.84 | 28.35 | 27.56 | 28.78 | 28.28 | 28.87 | 36.48 | 30.86 | |
| Costless Pledge | Mean contr. | 68.41 | 76.31 | 80.28 | 79.01 | 79.69 | 80.61 | 79.53 | 71.99 | 76.98 |
| Median contr. | 80.00 | 90.00 | 100.00 | 100.00 | 100.00 | 100.00 | 100.00 | 100.00 | 100.00 | |
| SD | 33.73 | 30.57 | 26.22 | 29.51 | 29.94 | 29.87 | 31.66 | 38.40 | 31.64 | |
| Asymmetric Cost | Mean contr. | 60.74 | 70.77 | 71.82 | 74.54 | 73.18 | 74.47 | 72.75 | 63.59 | 70.21 |
| Median contr. | 60.00 | 80.00 | 87.50 | 95.00 | 100.00 | 100.00 | 100.00 | 82.50 | 90 | |
| SD | 35.53 | 34.39 | 34.99 | 32.87 | 34.07 | 34.08 | 37.54 | 41.65 | 35.99 | |
| Shared Low Cost | Mean contr. | 57.31 | 64.89 | 69.76 | 74.62 | 78.43 | 78.31 | 78.85 | 71.28 | 71.68 |
| Median contr. | 55.00 | 70.00 | 80.00 | 80.00 | 90.00 | 90.0 | 90.00 | 90.00 | 80 | |
| SD | 30.10 | 30.68 | 30.87 | 28.35 | 26.43 | 26.87 | 25.62 | 34.06 | 30.04 | |
| Shared High Cost | Mean contr. | 75.83 | 79.76 | 82.00 | 78.17 | 79.50 | 77.10 | 78.99 | 71.15 | 77.81 |
| Median contr. | 90.00 | 100.00 | 100.00 | 100.00 | 100.00 | 100.00 | 100.00 | 100.00 | 100.00 | |
| SD | 28.73 | 30.36 | 29.58 | 33.09 | 30.58 | 32.84 | 30.55 | 38.39 | 31.98 | |
| Sequence | |||||||||||
|---|---|---|---|---|---|---|---|---|---|---|---|
| Treatment | 1 | 2 | 3 | 4 | 5 | 6 | 7 | 8 | Total | ||
| No Commitment | All Subjects | Mean Contr. | 65.58 | 72.95 | 75.57 | 73.46 | 74.14 | 74.88 | 76.09 | 65.03 | 72.21 |
| SD | 34.69 | 30.85 | 28.35 | 27.56 | 28.76 | 28.28 | 28.87 | 36.48 | 30.86 | ||
| Costless Pledge | Committed | Mean Contr. | 67.91 | 75.83 | 81.39 | 80.93 | 79.70 | 80.61 | 81.88 | 75.33 | 78.10 |
| SD | 33.80 | 30.87 | 25.24 | 28.43 | 29.94 | 29.87 | 29.54 | 36.52 | 30.89 | ||
| Uncommitted | Mean Contr. | 71.56 | 82.81 | 65.31 | 53.19 | - | - | 13.75 | 26.88 | 58.18 | |
| SD | 33.64 | 26.01 | 34.57 | 32.48 | - | - | 13.02 | 35.58 | 37.81 | ||
| Asymmetric Cost | Committed | Mean Contr. | 39.98 | 67.04 | 72.92 | 71.91 | 67.76 | 71.05 | 70.30 | 60.24 | 66.96 |
| SD | 34.68 | 35.52 | 32.25 | 34.87 | 35.81 | 35.72 | 38.37 | 42.16 | 37.40 | ||
| Uncommitted | Mean Contr. | 68.28 | 74.04 | 70.73 | 79.81 | 85.81 | 83.88 | 79.48 | 74.59 | 75.23 | |
| SD | 32.80 | 33.16 | 37.63 | 27.91 | 25.71 | 27.21 | 34.55 | 38.24 | 33.15 | ||
| Shared Low Cost | Committed | Mean Contr. | 64.69 | 73.13 | 81.41 | 82.39 | 84.77 | 85.44 | 83.53 | 82.02 | 81.51 |
| SD | 23.49 | 23.56 | 21.87 | 22.63 | 22.01 | 19.62 | 20.19 | 25.25 | 22.54 | ||
| Uncommitted | Mean Contr. | 56.67 | 62.28 | 64.27 | 70.96 | 75.44 | 74.96 | 76.65 | 66.23 | 67.86 | |
| SD | 30.57 | 32.25 | 32.98 | 30.06 | 27.85 | 29.14 | 27.61 | 36.50 | 31.68 | ||
| Shared High Cost | Committed | Mean Contr. | 75.94 | 88.45 | 87.60 | 86.44 | 88.60 | 84.94 | 88.14 | 83.54 | 86.11 |
| SD | 21.23 | 18.04 | 17.83 | 23.03 | 18.98 | 24.39 | 21.50 | 33.59 | 24.18 | ||
| Uncommitted | Mean Contr. | 75.82 | 78.03 | 80.60 | 75.16 | 75.60 | 73.75 | 75.66 | 62.88 | 75.10 | |
| SD | 29.23 | 32.01 | 31.73 | 35.64 | 33.68 | 35.39 | 32.66 | 39.26 | 33.71 | ||
References
- Isaac, R.; McCue, K.F.; Plott, C.R. Public goods provision in an experimental environment. J. Public Econ. 1985, 26, 51–74. [Google Scholar] [CrossRef]
- Chaudhuri, A. Sustaining cooperation in laboratory public goods experiments: A selective survey of the literature. Exp. Econ. 2011, 14, 47–83. [Google Scholar] [CrossRef]
- Ledyard, J.O. Public goods: A survey of experimental research. In The Handbook of Experimental Economics; Kagel, J.H., Roth, A.E., Eds.; Princeton University Press: Princeton, NJ, USA, 1995. [Google Scholar]
- Ahn, T.; Isaac, R.M.; Salmon, T.C. Coming and going: Experiments on endogenous group sizes for excludable public goods. J. Public Econ. 2009, 93, 336–351. [Google Scholar] [CrossRef]
- Ahn, T.K.; Isaac, R.M.; Salmon, T.C. Endogenous group formation. J. Public Econ. Theory 2008, 10, 171–194. [Google Scholar] [CrossRef]
- Coricelli, G.; Fehr, D.; Fellner, G. Partner selection in public goods experiments. J. Confl. Resolut. 2004, 48, 356–378. [Google Scholar] [CrossRef]
- Page, T.; Putterman, L.; Unel, B. Voluntary association in public goods experiments: Reciprocity, mimicry and efficiency. Econ. J. 2005, 115, 1032–1053. [Google Scholar] [CrossRef]
- Bayer, R.C. Cooperation in partnerships: The role of breakups and reputation. J. Inst. Theor. Econ. 2005, in press. [Google Scholar]
- Hauk, E.; Nagel, R. Choice of partners in multiple two-person prisoners’ dilemma games: An experimental study. J. Confl. Resolut. 2001, 45, 770–793. [Google Scholar] [CrossRef]
- Gale, D.; Shapley, L.S. College admissions and the stability of marriage. Am. Math. Mon. 1962, 69, 9–15. [Google Scholar] [CrossRef]
- Bayer, R.C. Cooperation in Partnerships: The Role of Breakups and Reputation; School of Economics Working Papers 2011–22; University of Adelaide, School of Economics: Adelaide, Australia, 2011. [Google Scholar]
- Fischbacher, U. z-Tree: Zurich toolbox for ready-made economic experiments. Exp. Econ. 2007, 10, 171–178. [Google Scholar] [CrossRef]
- Greiner, B. Subject pool recruitment procedures: Organizing experiments with ORSEE. J. Econ. Sci. Assoc. 2015, 1, 114–125. [Google Scholar] [CrossRef]
- Camera, G.; Casari, M.; Bigoni, M. Communication, Commitment, and Deception in Social Dilemmas: Experimental Evidence; Purdue University Economics Working Papers 1236; Purdue University, Department of Economics: West Lafayette, IN, USA, 2010. [Google Scholar]
- Fischbacher, U.; Gaechter, S. Social preferences, beliefs, and the dynamics of free riding in public goods experiments. Am. Econ. Rev. 2010, 100, 541–556. [Google Scholar] [CrossRef]
- Fischbacher, U.; Gaechter, S.; Fehr, E. Are people conditionally cooperative? evidence from a public goods experiment. Econ. Lett. 2001, 71, 397–404. [Google Scholar] [CrossRef]
- Masclet, D.; Noussair, C.; Tucker, S.; Villeval, M.C. Monetary and nonmonetary punishment in the voluntary contributions mechanism. Am. Econ. Rev. 2003, 93, 366–380. [Google Scholar] [CrossRef]
- Fehr, E.; Gaechter, S. Cooperation and punishment in public goods experiments. Am. Econ. Rev. 2000, 90, 980–994. [Google Scholar] [CrossRef]
- Fehr, E.; Gaechter, S. Altruistic punishment in humans. Nature 2002, 415, 137–140. [Google Scholar] [CrossRef] [PubMed]
- Ostrom, E.; Walker, J.; Gardner, R. Covenants with and without a sword: Self-governance is possible. Am. Political Sci. Rev. 1992, 86, 404–417. [Google Scholar] [CrossRef]
- Tan, F. Punishment in a linear public good game with productivity heterogeneity. De Economist 2008, 156, 269–293. [Google Scholar] [CrossRef]
- Guala, F.; Mittone, L. Experiments in economics: External validity and the robustness of phenomena. J. Econ. Methodol. 2005, 12, 495–515. [Google Scholar] [CrossRef]
- Nikiforakis, N.; Normann, H.T. A comparative statics analysis of punishment in public-good experiments. Exp. Econ. 2008, 11, 358–369. [Google Scholar] [CrossRef]
- 2Previous studies of endogenous group formation [4,5,6,7,8] find that the introduction of endogenous group formation increases cooperation and welfare when compared to exogenous regrouping protocols (see [9] for an exception to this result). Our focus is different: we ask whether the addition of pledges of commitment in an endogenous group formation setting can provide additional increases in cooperation and welfare.
- 3Our experiment uses a public goods game with two-person groups rather than the more common four-player groups. This design choice is to simplify the interpretation of pledges of commitment and dissolution. In our two-player set-up, pledges of commitment can be interpreted as a pledge to one person and dissolution decisions as the result of the behaviour of one person: the subject’s partner. This simplification is not possible in larger groups, where decisions are made in response to group behaviour, and is not solely attributable to the decisions made by one group member. We find similar improvements in welfare between exogenous and endogenous group formation protocols in our partner treatments compared to the existing literature using four-player or more groups, indicating that effects on cooperation in our treatments may be generalizable to larger groups.
- 4In Period 1 of each session, “types” and an initial grouping were randomly determined by the computer. Each initial grouping features two partners, each of a different type. In a regrouping phase, only subjects with different types could form a partnership. Subjects could only see potential partners who were of a different type from themselves.
- 5The decision to provide information on the average contributions of subjects over the previous sequence reflects an important compromise. When only contribution history from the previous sequence is used as information in regrouping phases, subjects are able to escape any reputation attained during sequences that occurred earlier. The advantage of the approach implemented is that both accidents and interactions with low contributing partners are removed from a subject’s history quickly.
- 7See [11] for a discussion of the performance stable marriage mechanism in a linear VCM with endogenous regrouping. He explains the workings of the mechanism to the subjects using almost identical language and finds that subjects generally base their preferences on contribution levels, ranking potential partners based on their contribution history.
- 8Sample instructions from the experiment can be found in the Online Appendix.
- 9Accumulated earnings were converted to Australian dollars at the predetermined exchange rate of at the end of each session.
- 10If we use individual contributions per period, all differences are significant at . In the Mann–Whitney U-tests using sequence averages across all periods, we have 240 independent observations for Random Matching, 448 for No Commitment, 464 for Costless Pledge, 480 for Asymmetric Cost, 400 for Shared High Cost and 480 for Shared High Cost. Dividing the sequences into the first- and second-half of the treatment means the number of independent observations by treatment is divided by a factor of two.
- 11In the experiment, we asked subjects to type free-form messages after dissolving their partnership to explain the reason for their decision. Nearly all subjects respond that they choose to dissolve the partnership because investments were not high enough. This response is the most common across treatments. Some subjects also respond that because they proposed to commit and the other partner did not, they chose to dissolve
- 12Pairwise comparisons between No Commitment and both Costless Pledge and Shared Low Cost reveal treatment differences at the 10% significance level (test of proportions, for shared cost and for Costless Pledge). Treatment differences are significant at the 1% level between No Commitment and both Asymmetric Cost and Shared High Cost, respectively. Across treatments where subject can choose to commit, the partnership dissolution rate in Asymmetric Cost is lower than in all other treatments ( for all pairwise comparisons). There is no significant difference in overall dissolution rates between the Costless Pledge, Shared Low Cost and Shared High Cost treatments ( for all pairwise comparisons).
- 13Treatment indicators are included as independent variables, as are interactions between commitment status and the treatment indicator. The reference treatment is No Commitment, where pledges of commitment were not available to subjects. We add the minimum and maximum contribution of a subject and their partner over a sequence as controls for contributions to isolate the direct effect of commitment. Sequence indicators are added to control for time effects and subject demographics, such as age, gender and study major, are added as additional controls.
© 2016 by the authors; licensee MDPI, Basel, Switzerland. This article is an open access article distributed under the terms and conditions of the Creative Commons by Attribution (CC-BY) license (http://creativecommons.org/licenses/by/4.0/).
Share and Cite
MDPI and ACS Style
Deer, L.; Bayer, R.-C. Pledges of Commitment and Cooperation in Partnerships. Games 2016, 7, 4. https://0-doi-org.brum.beds.ac.uk/10.3390/g7010004
AMA Style
Deer L, Bayer R-C. Pledges of Commitment and Cooperation in Partnerships. Games. 2016; 7(1):4. https://0-doi-org.brum.beds.ac.uk/10.3390/g7010004
Chicago/Turabian StyleDeer, Lachlan, and Ralph-C. Bayer. 2016. "Pledges of Commitment and Cooperation in Partnerships" Games 7, no. 1: 4. https://0-doi-org.brum.beds.ac.uk/10.3390/g7010004
Note that from the first issue of 2016, this journal uses article numbers instead of page numbers. See further details here.