Article

Emotion at Stake—The Role of Stake Size and Emotions in a Power-to-Take Game Experiment in China with a Comparison to Europe

by
Ronald Bosman
1,
Heike Hennig-Schmidt
2,* and
Frans Van Winden
3
1
PGO Risk Management for Financial Institutions, VU University, Amsterdam 1081 HV, The Netherlands
2
Bonn Econ Lab, Department of Economics, University of Bonn, Bonn 53113, Germany
3
CREED—Amsterdam School of Economics, University of Amsterdam, 1018 WB Amsterdam, The Netherlands
*
Author to whom correspondence should be addressed.
Submission received: 14 January 2017 / Revised: 14 March 2017 / Accepted: 15 March 2017 / Published: 20 March 2017

Abstract

:
This paper experimentally investigates how monetary incentives and emotions influence behavior in a two-player power-to-take game (PTTG). In this game, one player can claim any part of the other's endowment (take rate), and the second player can respond by destroying any part of his or her own endowment. The experiment is run in China. We further compare our findings with the behavior of two European subject pools. Our results give new insights regarding emotion regulation. Even though stake size does not appear to matter for take rates and destruction rates, it does matter for the reaction function of the responder regarding the take rate. When stakes are high, there is less destruction for low and intermediate take rates, and more destruction for high take rates, compared to relatively low stakes. Under low incentives, ‘hot’ anger-type emotions are important for destruction, while ‘cool’ contempt becomes prominent under high monetary incentives. These results suggest emotion regulation in the high-stake condition. Moreover, emotions are found to fully mediate the impact of the take rate on destruction when stakes are low, whereas they only partially do so if stakes are high. Comparing the low-stakes data for China with existing European data, we find similarities in behavior, emotions and emotion intensities, as well as the full mediation of the take rate by emotions. We find some differences related to the type of emotions that are important for destruction. Whereas anger and joy are important in both, in addition, irritation and fear play a role in China, while this holds for contempt in the EU.

1. Introduction

That people respond to changes in incentives concerns one of the most basic assumptions in economic theory [1,2]. In experimental economics incentives are an important issue in the discussion about the validity of experimental results. In many experiments the financial incentives offered to subjects are relatively modest. This raises the question whether experimental results are valid outside the laboratory where incentives are often much larger. A growing number of experimental studies have therefore focused on the role of incentives, for example in the context of dictator, ultimatum, trust and public good games. Early meta-studies (e.g., [3,4,5,6]) found that financial incentives matter, in particular for judgmental tasks, but not so much for other domains like bargaining, games and markets. In such domains, incentives typically have no effect on mean performance or behavior, although the variance is usually somewhat reduced by larger incentives. A recent review on dictator games [7], however, finds a small effect of higher incentives on reducing the willingness to give: dictators keep more, not only in absolute, but also in relative terms. Oosterbeek et al. [8] conclude in their meta-study of ultimatum games that bigger financial incentives do not affect the share offered, but reduce rejection rates. More recent ultimatum bargaining experiments provide mixed evidence.1 Testing the effect of stake sizes in trust games, Johnson and Mislin [13] in a meta study did not find an impact. However, the authors point out that [14]—the only study with substantial incentives—reports that the amount sent decreases significantly when the financial incentives were increased. In a public goods experiment by Kocher et al. [15], stake size did not have any significant effect on cooperation and punishment.
This paper aims to contribute to this literature by studying whether incentives affect retaliation and the role of emotions in that context. As our workhorse, we use a two-player power-to-take game (PTTG) where people are deprived of part or all of their endowments. The basic version of the game consists of two stages. First, one player (the take authority) can claim any part of the other player’s endowment—the take rate. Next, the second player (the responder) can react by destroying part or all of her endowment, which is then lost for both. The responder can only destroy her own prior-to-the-take endowment and not that of the take authority. In addition, responders self-report the intensity of a set of positive and negative emotions when being informed about the take rate. Experimental work of Bosman and van Winden [16] and various follow-up studies2 found that emotions are important for destruction in such settings and that they affect destruction in a non-linear way (see also [26] for an overview). The question of how the size of the endowment influences the underlying emotion process and, possibly, behavior in PTTG is a novel feature of our study. Bigger incentives may cause responders to experience negative emotions more intensely, which may then lead to more destruction. Our main research question, therefore, is whether stakes matter for emotional experience and behavior in the power-to-take game.
The interplay between incentives and emotional experience in situations captured by the PTTG is an important research topic with regard to emotion regulation. Our research is relevant for improving our knowledge on whether the anticipation of high compared to low monetary losses through retaliating makes people less emotional and reduces retaliation, thus making them more ‘rational’. Emotion regulation “refers to the processes by which individuals influence which emotions they have, when they have them, and how they experience and express these emotions” ([27], p. 275). Well-researched regulation strategies are cognitive reappraisal, i.e., reinterpreting the meaning of a stimulus to change one’s positive or negative emotional response to it [28], and expressive suppression in which a person tries to inhibit ongoing negative or positive emotion-expressive behavior [29]. In addition, automatic emotion regulation has been reported [30]. See [29] for a review on emotion regulation research; cf. also Tamir [31,32,33] for recent overviews. In all of these studies and in those subsequently mentioned, subjects are instructed to use a specific regulation strategy.
In economic contexts, the role of emotion regulation strategies has only recently gained attention. In particular, individual decision-making under risk and uncertainty has been studied. Heilman et al. [34], for instance, find that deliberate cognitive reappraisal increases risk taking by effectively reducing the experience of negative emotions, which does not hold for expressive suppression. These effects are found with laboratory-induced as well as with naturally occurring negative emotions. Martin and Delgado [35] report a reduction of risky choice behavior in a gambling task when participants regulate their emotions after being instructed to think of a calming event. One of the very few papers studying interactive decision-making is Grecucci et al. [36]. In an ultimatum game experiment, the authors find that negative emotions stemming from unfair offers are subject to regulation. Rejection rates increase (decrease) relative to a neutral condition depending on whether responders are instructed to interpret the proposers’ intentions and behaviors in a more (less) negative way.
Our experiment also involves interactive decision-making. However, we do not instruct subjects to use a specific regulation strategy. We, in contrast, analyze regulation as described by Mesquita and Frijda ([37] (p. 783): “… regulation of one emotion takes place to the extent that the other emotion gains power or intensity”. That is, we study in the PTTG whether emotions found significant for destruction under low incentives lose impact while other emotions spontaneously gain significance under high stakes.
We have run our power-to-take game experiment in China. From a practical point of view, this makes the experiment less costly, since wages are much lower in China. In this way, it was possible to give subjects significant financial incentives in the high-stakes treatment. Take authorities, for instance, that could earn at least 52% of the average monthly urban net income and 135% of the monthly rural net income3. The experiment also allows studying possible differences in emotional experience and behavior between a Chinese and a European subject pool. Previous experiments on the power-to-take game were run in Western countries only. To compare Chinese to Westerners, we use data collected in a previous study by of Bosman et al. [17] for the EU (Netherlands and Austria). Information on possible cultural differences is relevant from an emotion-regulation point of view as well as from a globalization perspective. Only recently, research has focused on the fact that context—in particular culture—matters with regard to emotion regulation [32,38,39,40]. For instance, the negative impact of emotion suppression tends to be moderated in Asian cultures ([41], see also [42]) as, different from the American-European value system, the core regulation goal of the Chinese value system is downregulation of both positive and negative emotions in order to maintain interpersonal harmony [43]. As to globalization, cooperation between China and EU countries in, for example, business and politics or in terms of global governance in international institutions will only be successful if mutual understanding of each other’s behavior, motivations and underlying emotional background is increased. For challenges with regard to the role of emotions in inter-cultural interactions, see e.g., [44]. Our study aims to contribute also in this respect.
Our main findings are as follows. First, there is no evidence that take and destruction rates differ between the low-stake treatment and the high-stake treatment in China. Second, our results give new insights on emotion regulation: even though stakes do not matter for taking and destruction, they do matter for the probability of destruction as a function of the take rate, which differs between the two treatments. Specifically, for take rates lower than 80%. The probability of destruction is lower when stakes are high than when they are low, while for take rates above 80%, the opposite holds. Under low incentives, ‘hot’ Anger-type emotions are important for destruction, while ‘cool’ Contempt is prominent under high stakes. These results suggest emotion regulation in the high-stake condition. Third, the take rate triggers the same set of emotions. Fourth, emotions mediate the impact of the take rate on destruction: fully, when stakes are low, and partially, when stakes are high. In the latter case, we observe an additional negative shift towards less destruction (treatment effect) together with an increasing effect of the take rate (interaction effect). Finally, comparing the low-stakes data for China with existing European data, we find many similarities but also some differences. Similarities exist in behavior, the experience of different emotions, the emotional intensities evoked by the take rate, and the (full) mediation by emotions of the impact of the take rate on destruction. There is only weak support for Chinese participants experiencing (negative) emotions less intensely compared to the European subject pool. Some differences exist, however, regarding destruction. Whereas Anger and loss of Joy are important in both subject pools, in addition, Irritation and Fear further help explain destruction in China when stakes are low, while Contempt does so in the case of Europe.
The remainder of the paper is organized as follows. In Section 2, we discuss our research questions and present our experimental design and procedures. In Section 3, the results are presented, and Section 4 concludes the paper.

2. Research Questions, Experimental Design and Procedures

2.1. Research Questions

Our main research question is whether stakes matter for emotional experience and behavior in a power-to-take game. Emotions typically arise when a person evaluates an event as relevant for his or her interests. If interests are promoted, positive emotions result. If interests are jeopardized, negative emotions arise. Positive emotions, like Joy or Relief, are experienced as pleasurable, whereas negative emotions, such as Anger or Contempt, are experienced as painful. Emotions have a direct hedonic impact. An important feature of emotions is that they are ‘cognitively impenetrable’: one cannot choose to have or not have emotions, given certain stimuli or events that are relevant for one’s interests ([45]). Another important feature of emotions is that they imply an action tendency (urge) to approach or avoid (‘fight or flight’; see [46,47] for first describing this phenomenon). Brain scientists have found that, during emotional activity, different neural networks in the limbic system (the feeling part of the brain) are involved, which interact with neural systems in the cortex (the thinking part of the brain) [48]. Furthermore, emotional responses to external stimuli are faster than cognitive (cortical) responses. In particular, when the intensity of an emotion is high, it may progressively seize command over rational deliberation; in other words, emotions influence people’s immediate behavior more than appears to be normatively justified [49].
How does all this relate to stake size in the power-to-take game? When the stakes increase, two effects potentially play a role. On the one hand, individuals may become more emotional when the same share of money is taken from them, increasing the propensity to destroy. In particular, Anger-type of emotions are expected to play a role here. On the other hand, destruction becomes more costly (and less efficient) when the stakes are high. This might give individuals an incentive not to destroy due to downregulation of emotions or because of switching to emotions that induce them to cool down (e.g., [50,51]). Whether the opposing forces will cancel out is hard to say in advance, as one of these forces may dominate the other. The experiment will shed more light on this mechanism.
Our second research interest is concerned with the question of whether culture matters in the PTTG. Two issues are of importance here. One relates to whether differences in emotional experience and behavior between Chinese and European participants exist in the power-to-take game. Since there is evidence of a universal set of primary emotions (see the overviews by Russell and Yik [52,53]4), there is a priori no reason to expect major differences between Chinese and European subjects. However, differences have been found to exist, for example, concerning the absolute intensity levels attributed to expression and perception of emotions [54] as well as with regard to regulation processes [55,56]. Chinese are assumed to control their emotions rather well [42,52,57,58]. They are more likely to report using suppression than individuals from European backgrounds [59]. Whether this would result in different emotional experience and behavior is explored in this study as well.
A second reason why studying possible differences in behavior and emotions in a cross-cultural context is important is that globalization has brought European countries much closer to China than before. This is not only due to intensive economic and business relations but also to the need to work together on global challenges such as climate change, in the areas of public health, law enforcement but also in terms of global governance in international institutions, e.g., [60]. Matsumoto and Hwang [56] emphasize the important role of emotions regarding challenges to cooperation in inter-cultural interactions. Whether or not such efforts are successful heavily depends on the parties’ mutual understanding, of each other’s goals, behavior, motivations (e.g., Hennig-Schmidt and Walkowitz [61]) and underlying emotional background. Our study aims to make a contribution to such a better understanding.

2.2. Experimental Design and Procedures

As our vehicle of research, we use the two-player power-to-take game. One player can be considered as the ‘take authority’, who is paired to another player, the ‘responder’. Each participant in the experiment has an endowment, Ei. The game has two stages. At the first stage, the randomly chosen take authority decides on the so-called take rate t ∊ (0, 1), which is the part of the responder’s endowment Eresp that will be transferred to the take authority after the second stage. At the second stage, the only action the responder can take is to decide on d ∊ (0, 1), the part of Eresp that will be destroyed. For the take authority, the payoff of the game is thus equal to the transfer: t × (1 − d)Eresp, generating total earnings from the experiment of: Etake + t × (1 − d)Eresp. For the responder, the payoff equals: (1 − t) × (1 − d)Eresp, which also determines this player’s total earnings. Note that the responder can only destroy her own prior-to-the-take endowment (Eresp) and not that of the take authority (Etake)5. Furthermore, it follows that only if t = d = 0 will experimental earnings for both players be equal to the initial endowment; otherwise, the responder will always get less than Eresp, whereas the take authority gets at least Etake. The standard game theoretic model, assuming rational selfish players, predicts that the responder will not destroy any of her endowment if the take rate is less than 100%. She is indifferent between all percentages of destruction if the take rate is 100%. Anticipating this behavior, the take authority will take virtually all of the responder’s endowment (except for an epsilon).
We have three treatments: CHINA LOW, CHINA HIGH and EU. CHINA LOW and CHINA HIGH were conducted at Sichuan University, Chengdu (P. R. China). EU was run at two European universities, half of the sessions at the University of Amsterdam (The Netherlands) and the other half at the University of Innsbruck (Austria).6 All sessions in all countries were run according to the same procedural protocol. Table 1 summarizes the parameters of the three treatments.
In the EU, subjects’ endowment was 15 Dutch guilders/90 Austrian Schillings (approximately EURO 7). In China, the endowment was 30 Yuan (RMB) in CHINA LOW, and 300 Yuan in CHINA HIGH (approximately EURO 4 and EURO 40, respectively, at the time of the experiment). In both regions the endowments of the take authority and the responder were identical (Eresp = Etake). Independent of their earnings in the experiment, subjects received a show-up fee of approximately EURO 7 in EU and EURO 4 (30 RMB) in both CHINA LOW and HIGH. We chose the show-up fee to be equal to the responders’ endowment in the low-stakes treatments to compensate them for the time they spent in the experiment in case take authorities deprived them of their total endowment. For reasons of comparability, we paid the same show-up fee also in CHINA HIGH.
Before subjects played the one-shot power-to-take game, they were randomly divided into two groups. One group was referred to as participants A (the take authorities) and the other as participants B (the responders). Then, a native experimenter read the instructions followed by two individual exercises to check participants’ understanding of the game. The game was framed as neutral as possible, avoiding any suggestive terms like, e.g., take authority7. Subsequently, random pairs of one responder and one take authority were formed by letting take authorities draw a coded envelope. The envelope contained a form on which the endowment of both participant A and participant B was stated. The take authorities then had to fill in a take rate8 and put the form back in the envelope. After having collected the envelopes, we asked the take authorities to report their expectation of what the responder would do. The envelopes were brought to the matched responders who filled in the percentage of their endowments to be destroyed. The envelopes containing the forms were then returned to the take authorities for their information.
We finally asked subjects to fill out questionnaires with, for the responders, questions concerning their prior expectation of the take rate, and, for all subjects, the emotions they experienced when they learned about the decision of the other player. Moreover, participants also answered questions regarding their motivations and social background. After having completed the questionnaires, envelopes were collected and brought to the cashier, who paid out the subjects in private.
Emotions were measured in the following way. We used a list of nine emotions—Anger, Contempt, Envy, Fear, Irritation, Joy, Sadness, Shame, and Surprise9. These emotions have been found to be basic in both cultures [54,63]. We asked subjects to report the experienced intensity of each emotion on a 7-point scale, ranging from “no emotion at all” to “high intensity of the emotion”. Note that besides Anger-types of emotions—which we expect to be relevant in this context—several other negative and positive emotions are included in order to avoid ‘pushing’ subjects in a particular direction.
In total, 224 subjects took part in the experiment, almost all undergraduate students. Furthermore, 144 Chinese students participated in two sessions at Sichuan University, Chengdu (China), half of them in CHINA LOW and the other half in CHINA HIGH. Eighty European students participated, half of them at the University of Amsterdam (The Netherlands) and the other half at the University of Innsbruck (Austria). Sessions were run in Innsbruck in November 1999, in Amsterdam in January 2000, and in Chengdu in August 2002. Slightly more than half of the subjects were students of economics. The others were students from various other fields. Including the show-up fee, subjects on average earned EURO 13 in EU, EURO 7 (RMB 57) in CHINA LOW and EURO 37 (RMB 296) in CHINA HIGH. The stakes in HIGH were rather substantial. According to the official statistical data, the monthly net income in urban Chengdu in 2000 was about EURO 80 (637 RMB), and, for rural Chengdu, it was EURO 30 (244 RMB).10 As take authorities’ payoffs in CHINA HIGH ranged from 330 to 574 RMB, they earned between 52% and 90% of the urban and between 135% and 235% of the monthly rural net income in 2000. Responders were paid between 30 to 300 RMB. They earned from 5% to 47% of the urban and from 12% to 123% of the monthly rural net income in 2000. The whole experiment took about 75 minutes in EU and 110 minutes in China11.

3. Results

In this section, we first present the behavioral results concerning take rates and destruction rates (Section 3.1). Then, we analyze experienced emotions (Section 3.2) and their mediating role between taking and destroying (Section 3.3). Finally, we discuss differences between our Chinese and EU subject pools (Section 3.4).

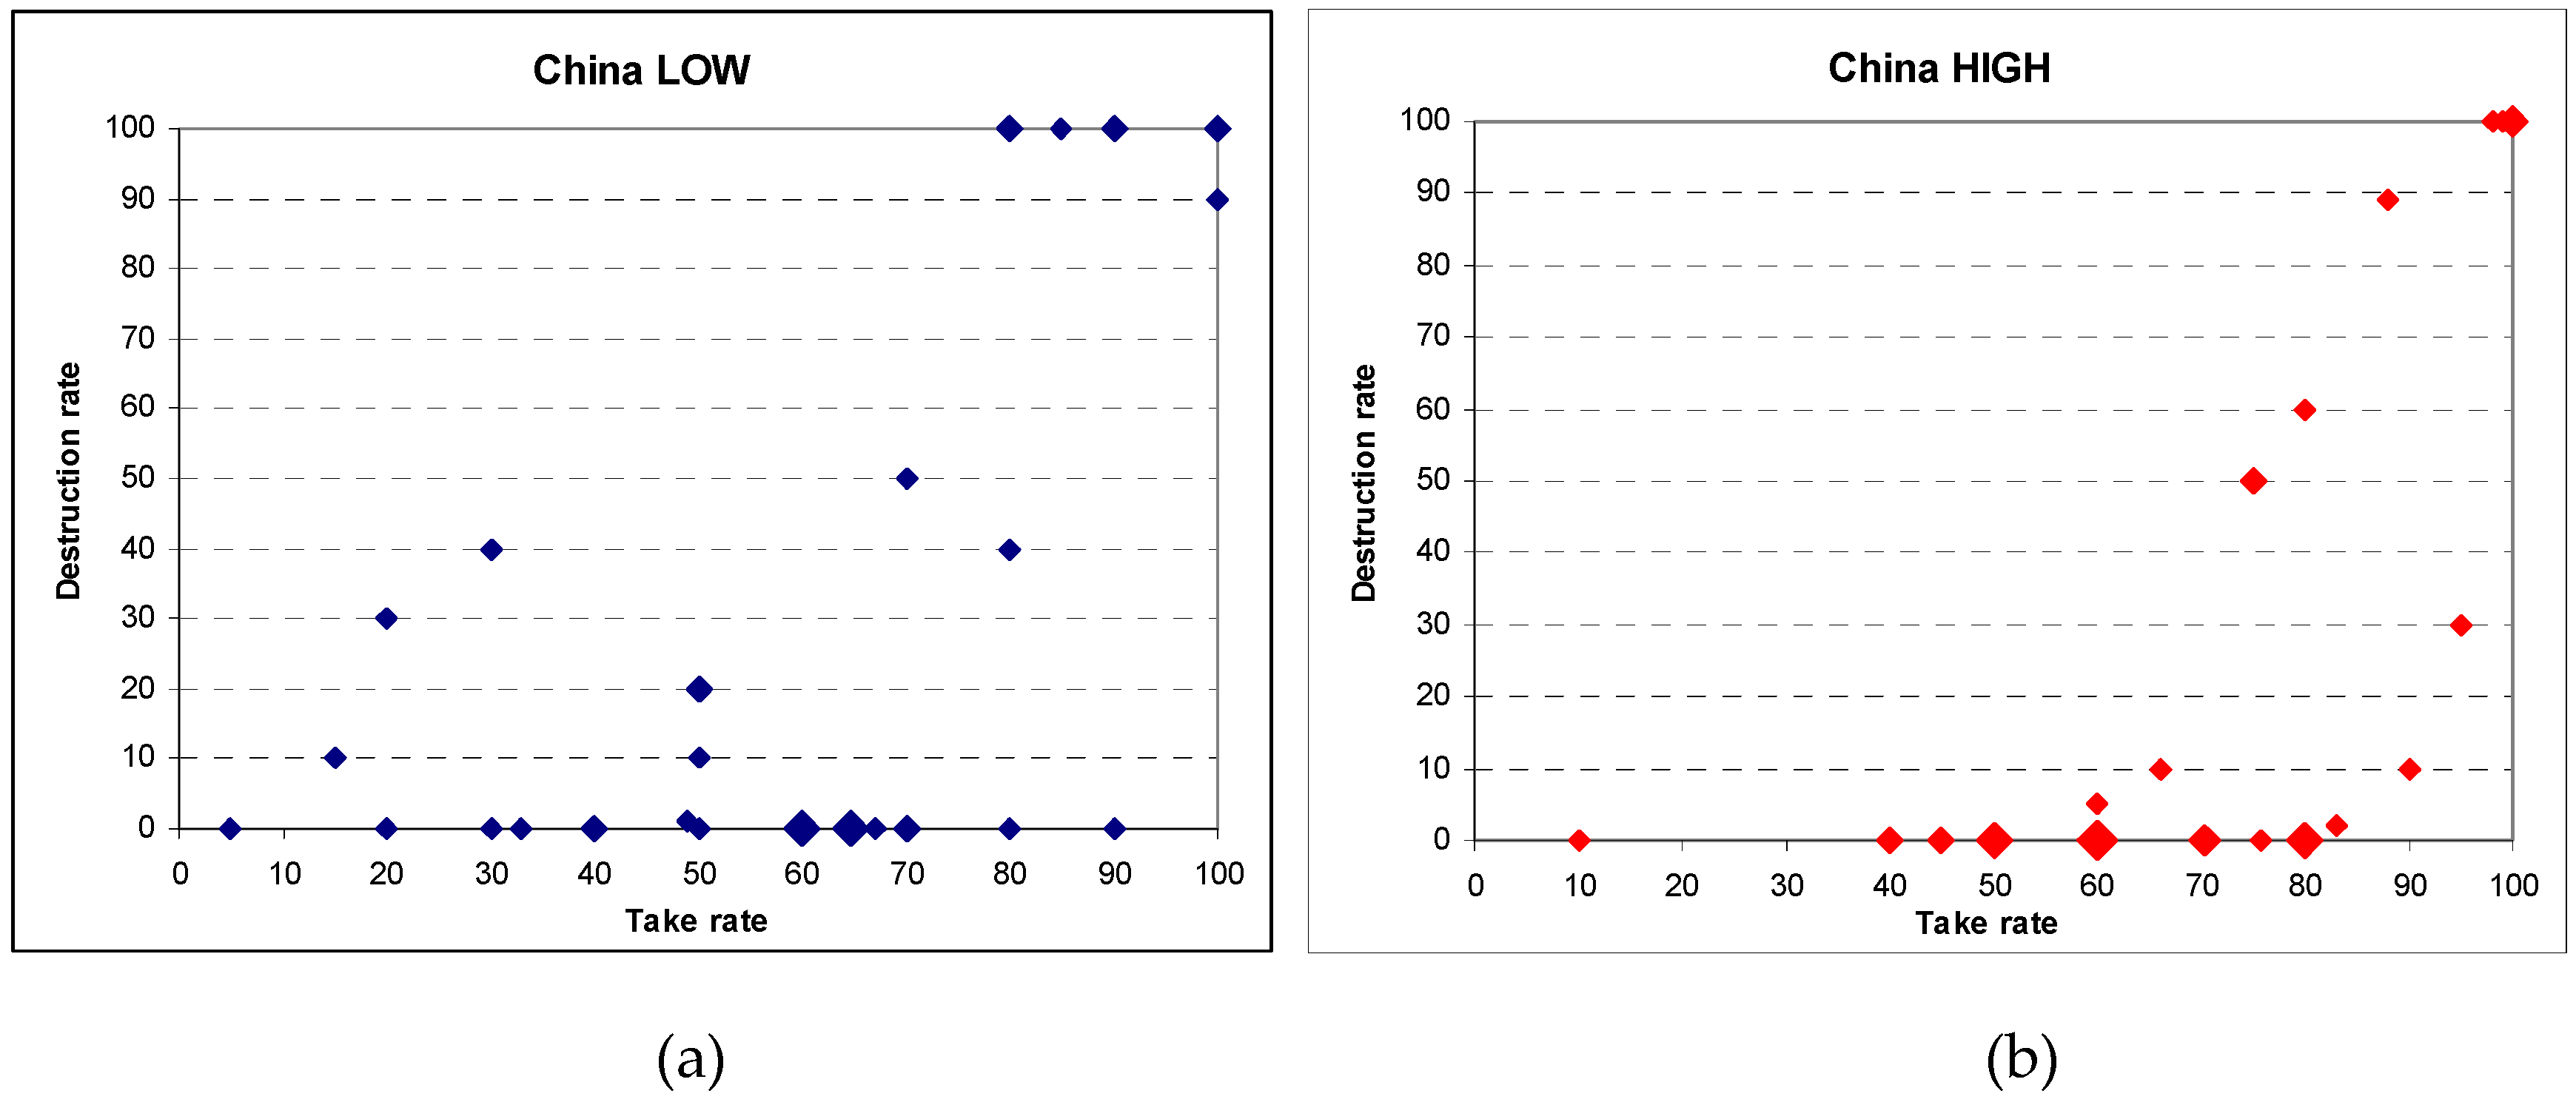
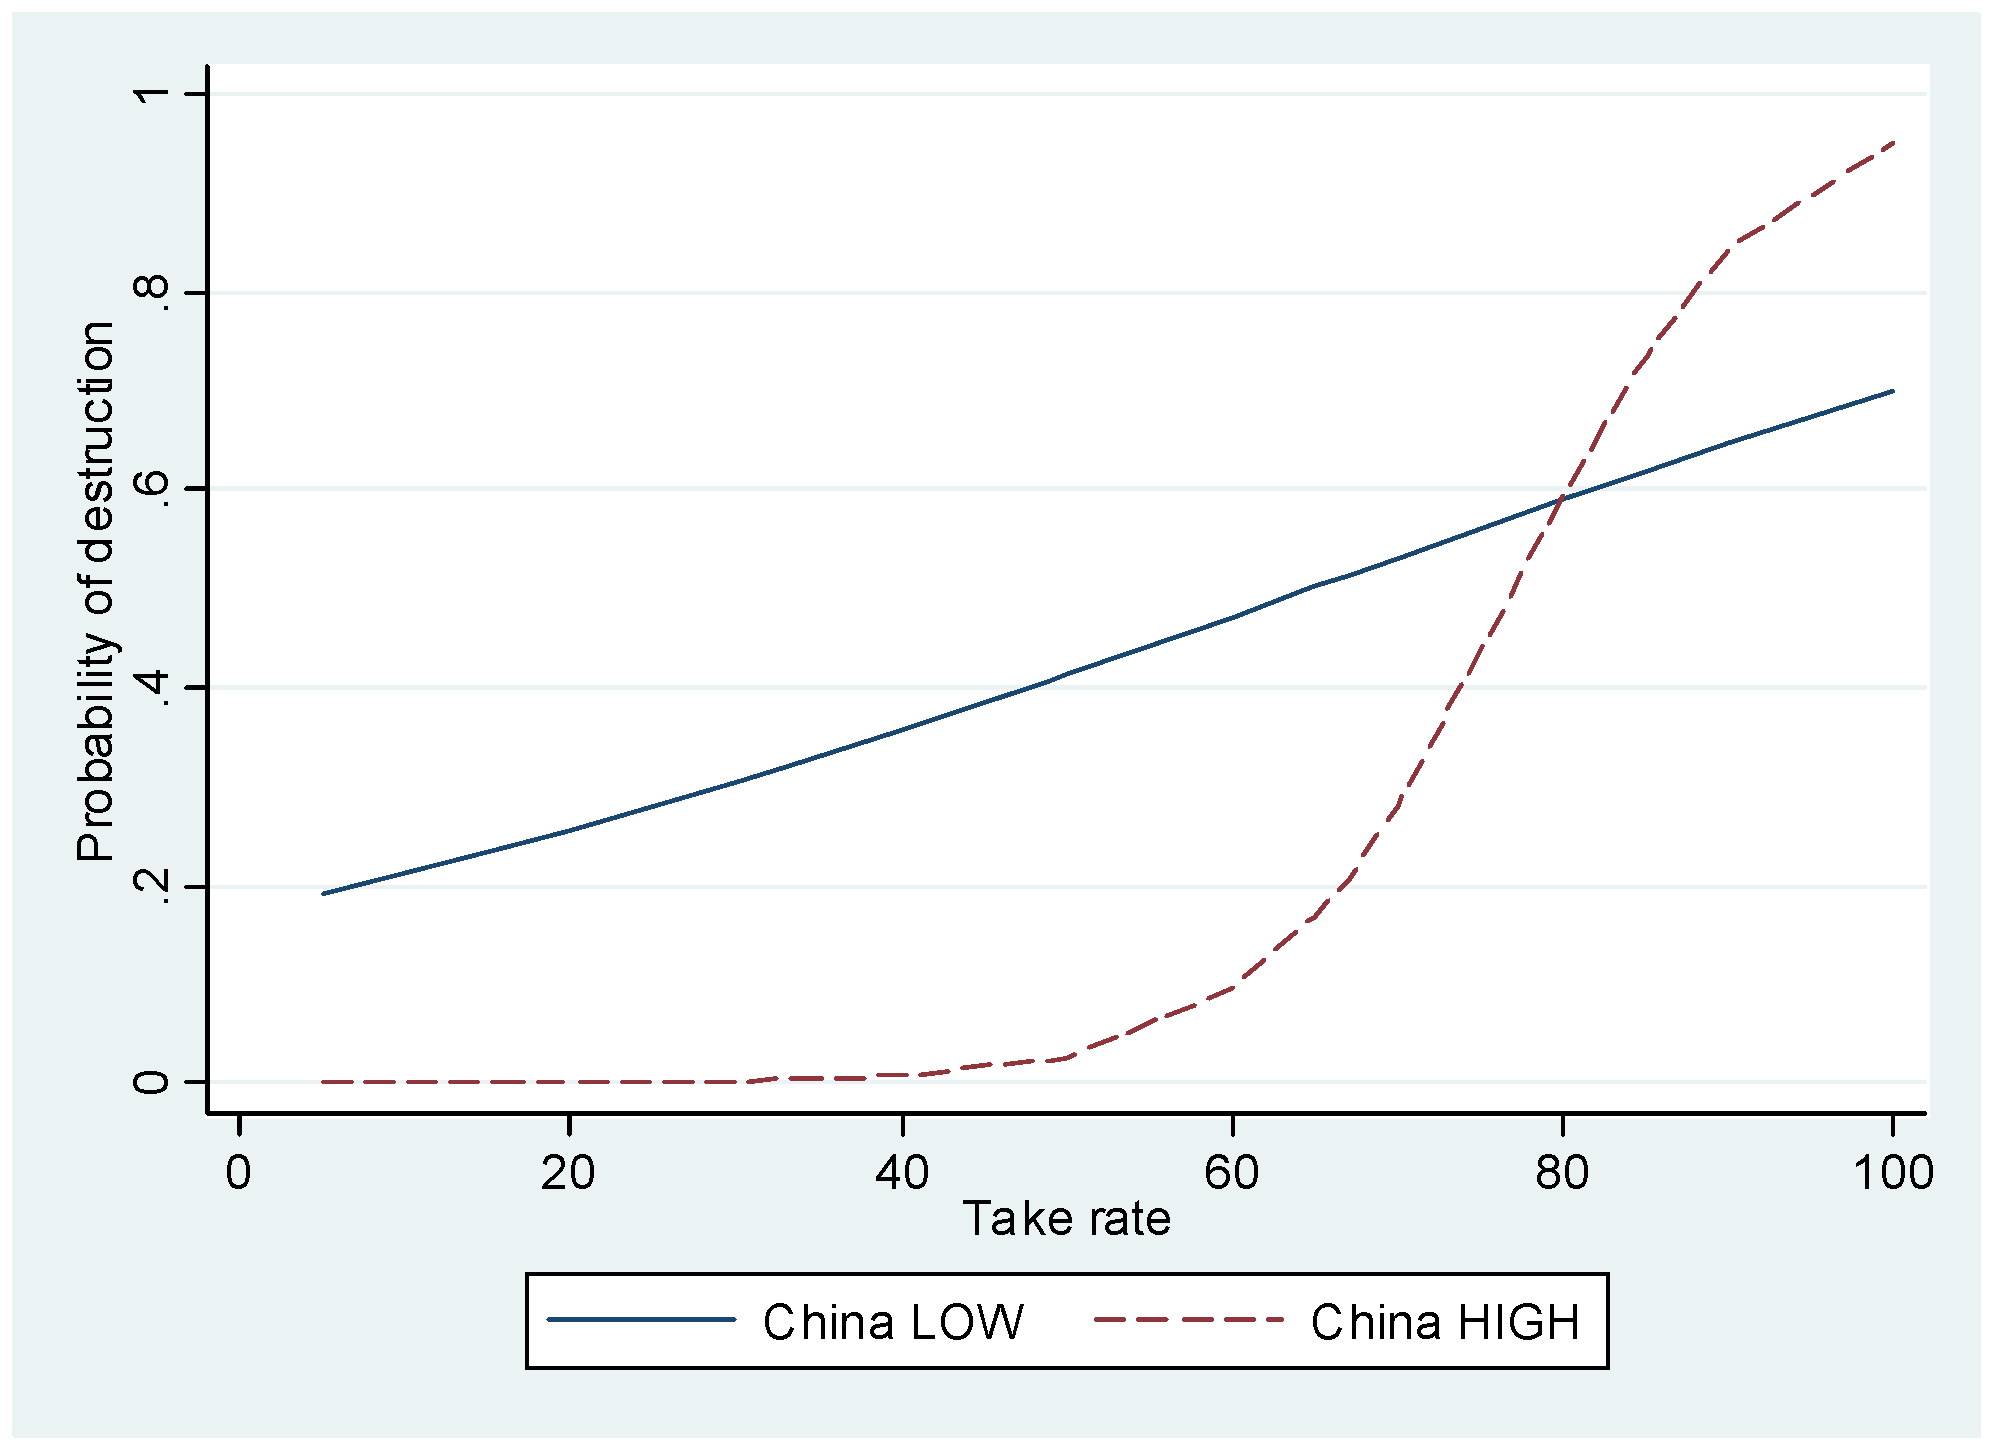
3.1. Behavior: Take Rates and Destruction Rates

We first look at behavior in CHINA LOW and CHINA HIGH. A summary of the data on take and destruction rates is given in Table A1 of Appendix A. Figure 1 shows a scatter plot of take and destruction rates in the two treatments.
Overall, there appears to be quite some variation in behavior. In CHINA LOW, take rates range from 5% to 100%, with an average rate of 59%. The median rate equals 63%. The average take rate in CHINA HIGH is 69%, about 10 percentage points higher than in CHINA LOW. The median is 70%. Given our relatively small sample sizes, we use non-parametric tests to test for possible differences between experimental conditions12. A Mann–Whitney U-test and a Kolmogorov–Smirnov test render no significant difference in take rates (p = 0.12 and p = 0.38, respectively). Note that, throughout the paper, we use two-tailed tests if not denoted otherwise.
In both CHINA LOW and CHINA HIGH, destruction rates d range from 0% to 100%. In CHINA LOW, responders on average destroy 28% of their endowment, while, in CHINA HIGH, they destroy about six percentage points less (22%). The median destruction rate is zero in both treatments. The difference in destruction rates is not significant (Mann–Whitney U-test, p = 0.47). Note that the fraction of responders who destroy (part of) their endowment is considerable, amounting to 47% in CHINA LOW and 39% in CHINA HIGH. Furthermore, 53% of the destroyers in CHINA LOW choose to destroy 50% or more; in CHINA HIGH, this ratio is even higher at 64%. Clearly, neither take authorities nor responders behave according to the standard economic model, which predicts taking nearly everything and destroying nothing.
Although the variance in CHINA LOW is larger than in CHINA HIGH for both the take rate (661.05 vs. 436.15) and the destruction rate (1637.39 vs. 1417.27), this difference is not statistically significant (variance ratio test, p = 0.11 and p = 0.34, respectively). Furthermore, we have looked at Cohen’s d for size effects between CHINA LOW and HIGH. This statistic shows that none of the size effects for both the take rate and the destruction rate are large (d = −0.42 and 0.15, respectively).
Result 1.
There is no evidence of distributional differences in take and destruction rates between CHINA LOW and CHINA HIGH.
For a first assessment of the relation between the take rate and the probability of destruction, we run a simple binary logit regression with destruction as the dependent and the take rate t as the independent variable. We find that t has a positive and significant impact on destruction (see also Table 2). The coefficients for t are significantly different between CHINA LOW and CHINA HIGH (p < 0.01). This also holds for the intercept dummy (p < 0.01).
Figure 2 graphically shows the relationship between take rate and probability of destruction for CHINA LOW and CHINA HIGH separately. For low and intermediate take rates, the destruction probability is higher in CHINA LOW than in CHINA HIGH. Noticeably, in the latter, the probability of destroying is zero for take rates up to 40%. The take rate’s marginal effect on destruction becomes larger in CHINA HIGH relative to CHINA LOW when the take rate is larger than 60%. At a take rate of around 80%, the destruction probability in CHINA HIGH gets higher than in CHINA LOW.
Result 2.
The probability of destruction differs between CHINA LOW and CHINA HIGH. Specifically, for take rates lower than 80%, the probability of destruction is lower in CHINA HIGH than in CHINA LOW; for take rates above 80%, the opposite holds.
Previous research on the power-to-take game found that expectations, in particular the violation of expectations, matters for destruction. Responders whose expectations regarding the take rate turned out to be optimistic typically destroyed part or all of their income (see [16,17,18]). The idea behind this mechanism is that frustrated expectations, which may be related to a social norm, motivate a responder to punish the take authority. Surprisingly, in CHINA LOW and CHINA HIGH, expectations do not play any significant role for destruction. When expectations are included in the above-mentioned binary logit regression, they turn out to be insignificant (p = 0.63 and p = 0.23 in, respectively, CHINA LOW and CHINA HIGH).13
This holds for both the expected take rate as well as for the difference between the take and expected take rate. Possibly, the weight attached to expectations or social norms relating to what constitutes a reasonable (fair) take rate differs between the Chinese and the European subject pools, where previous power-to-take experiments were run. Chinese may have lower trust than Westerners in what may happen. For explanations that may apply see e.g., [66,67,68,69,70,71]. See also Section 3.4 on differences between the Chinese and EU subject pools.

3.2. Experienced Emotions

In this Section, we analyze experienced emotions and the relationship to take and destruction rates. Table 3 shows the average scores of experienced emotions ordered according to their intensity. Anger and Irritation are prominent in both CHINA LOW and HIGH. All emotions show a higher intensity in CHINA HIGH than in CHINA LOW, but only Sadness, Envy and Fear do so significantly when taken separately (Mann–Whitney U-test, p < 0.05).
We next focus on the relation between take rate and experienced emotion. For each emotion, we estimated an ordered logit model, with emotion intensity as the dependent variable and the take rate as the explanatory variable. The intensity of negative (positive) emotions is positively (negatively) related to the take rate (Table 4). We found the same set of positive and negative emotions to be significant in CHINA LOW and CHINA HIGH. In addition, the estimated coefficients are very similar. We cannot reject the hypothesis that coefficients for the shared negative emotions are the same. The coefficients for Joy differ marginally (p = 0.052), suggesting that when the stakes are high, the negative impact of t on experienced Joy is higher.
When destruction is regressed on emotion, Anger-type emotions and Joy are significant in both treatments (Table 5). Note that the (negative) coefficient of Joy is significantly larger in CHINA HIGH (p < 0.05, Chi2 test), which suggests that responders in CHINA HIGH react more strongly to self-reported changes in Joy than those in CHINA LOW. Contempt appears to be important for destruction in CHINA HIGH but not in CHINA LOW, where, instead, Irritation, Anger and Fear are influential. Apparently, when stakes get higher responders become less motivated by Fear and Irritation and more by Contempt.
Result 3.
The same set of emotions is triggered by the take rate. High monetary incentives generate stronger emotions experienced by the responder. Joy appears to be important in both CHINA LOW and CHINA HIGH—with a larger impact on destruction in HIGH—whereas Anger-type emotions and Fear matter in the former but Contempt in the latter.

3.3. Are Emotions Mediators?

A key question regarding the role of emotions is whether the impact of the take rate on destruction is mediated by emotions, and, if so, whether the association between take rate and destruction can be completely accounted for by the mediating impact of emotions or leaves a role for the take rate as such.
Mediation of the impact of t on d via emotions requires that the following conditions hold (see e.g., [72]): (i) t influences d; (ii) emotions influence d; (iii) t influences emotions; (iv) when both emotions and t are included in the regression, the coefficient of t loses significance and impact. If, in (iv), the coefficient of t remains significant, there is so-called partial mediation. In the previous Sections, we have provided evidence that conditions (i)–(iii) are satisfied. Therefore, we will now concentrate on the remaining condition (iv).
Condition (iv) requires including emotions in the regression in order to analyze their mediation effect. To this end, we follow the subsequent four-step procedure: (1) remember that, in Section 3.2, we have determined, via a regression across subjects, which emotions play a significant role for destruction (see Table 5). This procedure is appropriate given our truly one-shot game. (2) The regression coefficients measuring the estimated impact of each significant emotion provide weights at the subject pool level. Estimation on the subject pool level is preferable because it avoids fitting at the individual level. (3) These weights are then used at the individual level to get for each subject an individual index—the Emotion Aggregate (EA)—that captures the aggregated impact of the respective significant emotions on an individual’s destruction. One might understand EA as an index of an individual’s emotional motivation to destroy. (4) Finally, the individual Emotion Aggregates valid for each treatment are used in the regressions to test for the mediating effect of emotions.
Applying the above procedure to our data, we find as Emotion Aggregate for CHINA LOW: EA (LOW) = (0.42/1.58) × Irritation + (0,27/1.58) × Anger − (0.46/1.58) × Fear − (0.43/1.58) × Joy, and for CHINA HIGH: EA (HIGH) = (0.42/1.27) × Contempt − (0.85/1.27) × Joy. The EA-components differ between CHINA LOW and HIGH. As observed before, in both treatments, Joy plays an important role for destruction. However, while Anger-type emotions and Fear are important in LOW, it is Contempt that has a significant impact in HIGH. It seems that, under high stakes, different emotional dynamics have to be accounted for.
We find a clear positive correlation between EA and t (Spearman coefficient: CHINA LOW 0.53, CHINA HIGH 0.56; both significant at p < 0.01) as well as between EA and d (0.53 and 0.60, respectively; both significant at p < 0.01).
To explore the mediating role of EA, we perform an ordered logit regression on the pooled data of CHINA LOW and CHINA HIGH with destruction as the dependent variable and t and EA as explanatory variables (see Table 2).
We find that both t and EA have a significant impact on destruction (models 1 and 2), and their impact remains significant when both are included in the regression (model 3), suggesting partial mediation. Three other variables are added to capture the possible effect of higher monetary stakes: an intercept dummy (CHINA-HIGH, which is 1 for CHINA HIGH and 0 otherwise), an interaction term regarding this dummy and t (CHINA-HIGH × t), and an interaction term of this dummy and EA (CHINA-HIGH × EA). Adding the intercept dummy for CHINA HIGH only does not change the picture in terms of significance but shows lower destruction in CHINA HIGH (model 4), which is consistent with our findings from Figure 2. This is corroborated when adding the interaction term of this dummy and t, which further reveals a loss in significance and impact for the baseline take rate together with a significant impact of t on destruction in CHINA HIGH (model 5). Interestingly, adding the interaction term of the stake dummy and EA does not have any effect, indicating that the impact of emotions is not diminished in CHINA HIGH.
To summarize, it turns out that the best-fitted model includes the emotion aggregate EA, a dummy for stake, and the interaction term of stake and take rate. Emotions fully mediate destruction in CHINA LOW and partially in CHINA HIGH, as also the monetary incentives directly matter in the latter case. When stakes are high, there is initially less destruction, but when the take rate increases, destruction increases. We thus find that condition (iv) is partially fulfilled while conditions (i)–(iii) are satisfied.
Result 4.
Emotions captured by the EA-index fully mediate destruction in CHINA LOW and partially in CHINA HIGH.
So why is there for low take rates more destruction in CHINA LOW, but for higher take rates (t > 80%) more destruction in CHINA HIGH (see also Figure 2)? An explanation of this pattern is related to the specific emotions that play a role when the incentives are increased. Note that Contempt rather than Anger is the single negative emotion explaining destruction in CHINA HIGH, whereas Anger and Irritation play a role in CHINA LOW. According to research by Fischer and Giner-Sorolla [50], the core feature of Contempt is to look down on the targets and to try to ignore or exclude them. Matsumoto and Hwang [56] stress that contempt concerns a moral or ethical superiority, elicited by violations of moral codes, which in our case could be interpreted as causing a big loss to responders by taking in CHINA HIGH. Fischer and Roseman [73] report that contempt may develop out of previously experienced anger and a perceived lack of control over the behavior of the other person. Furthermore, contempt is characterized as ‘cool’ rather than ‘hot’ [50]. The authors suggest that Contempt might work to suppress or pre-empt other more socially and personally costly emotions, such as Hatred, Anger, or Frustration and it may have a self-regulatory function. Therefore, in CHINA HIGH, subjects who were confronted with the (more costly) high stake may have regulated their Anger and Irritation into a relatively cool Contempt, which would explain the lower destruction at take rates up to t = 0.8. At higher take rates, subjects become significantly more negatively emotionally motivated (higher EA, particularly driven by lower Joy), which might then explain the change into higher destruction rates. Note that, in particular, driven by lower Joy, EA in CHINA HIGH is significantly higher at t > 80% compared to t < 80% (p < 0.008 for both EA and Joy, Wilcoxon signed ranks test), while we find no significant effect for Contempt (p = 0.326).

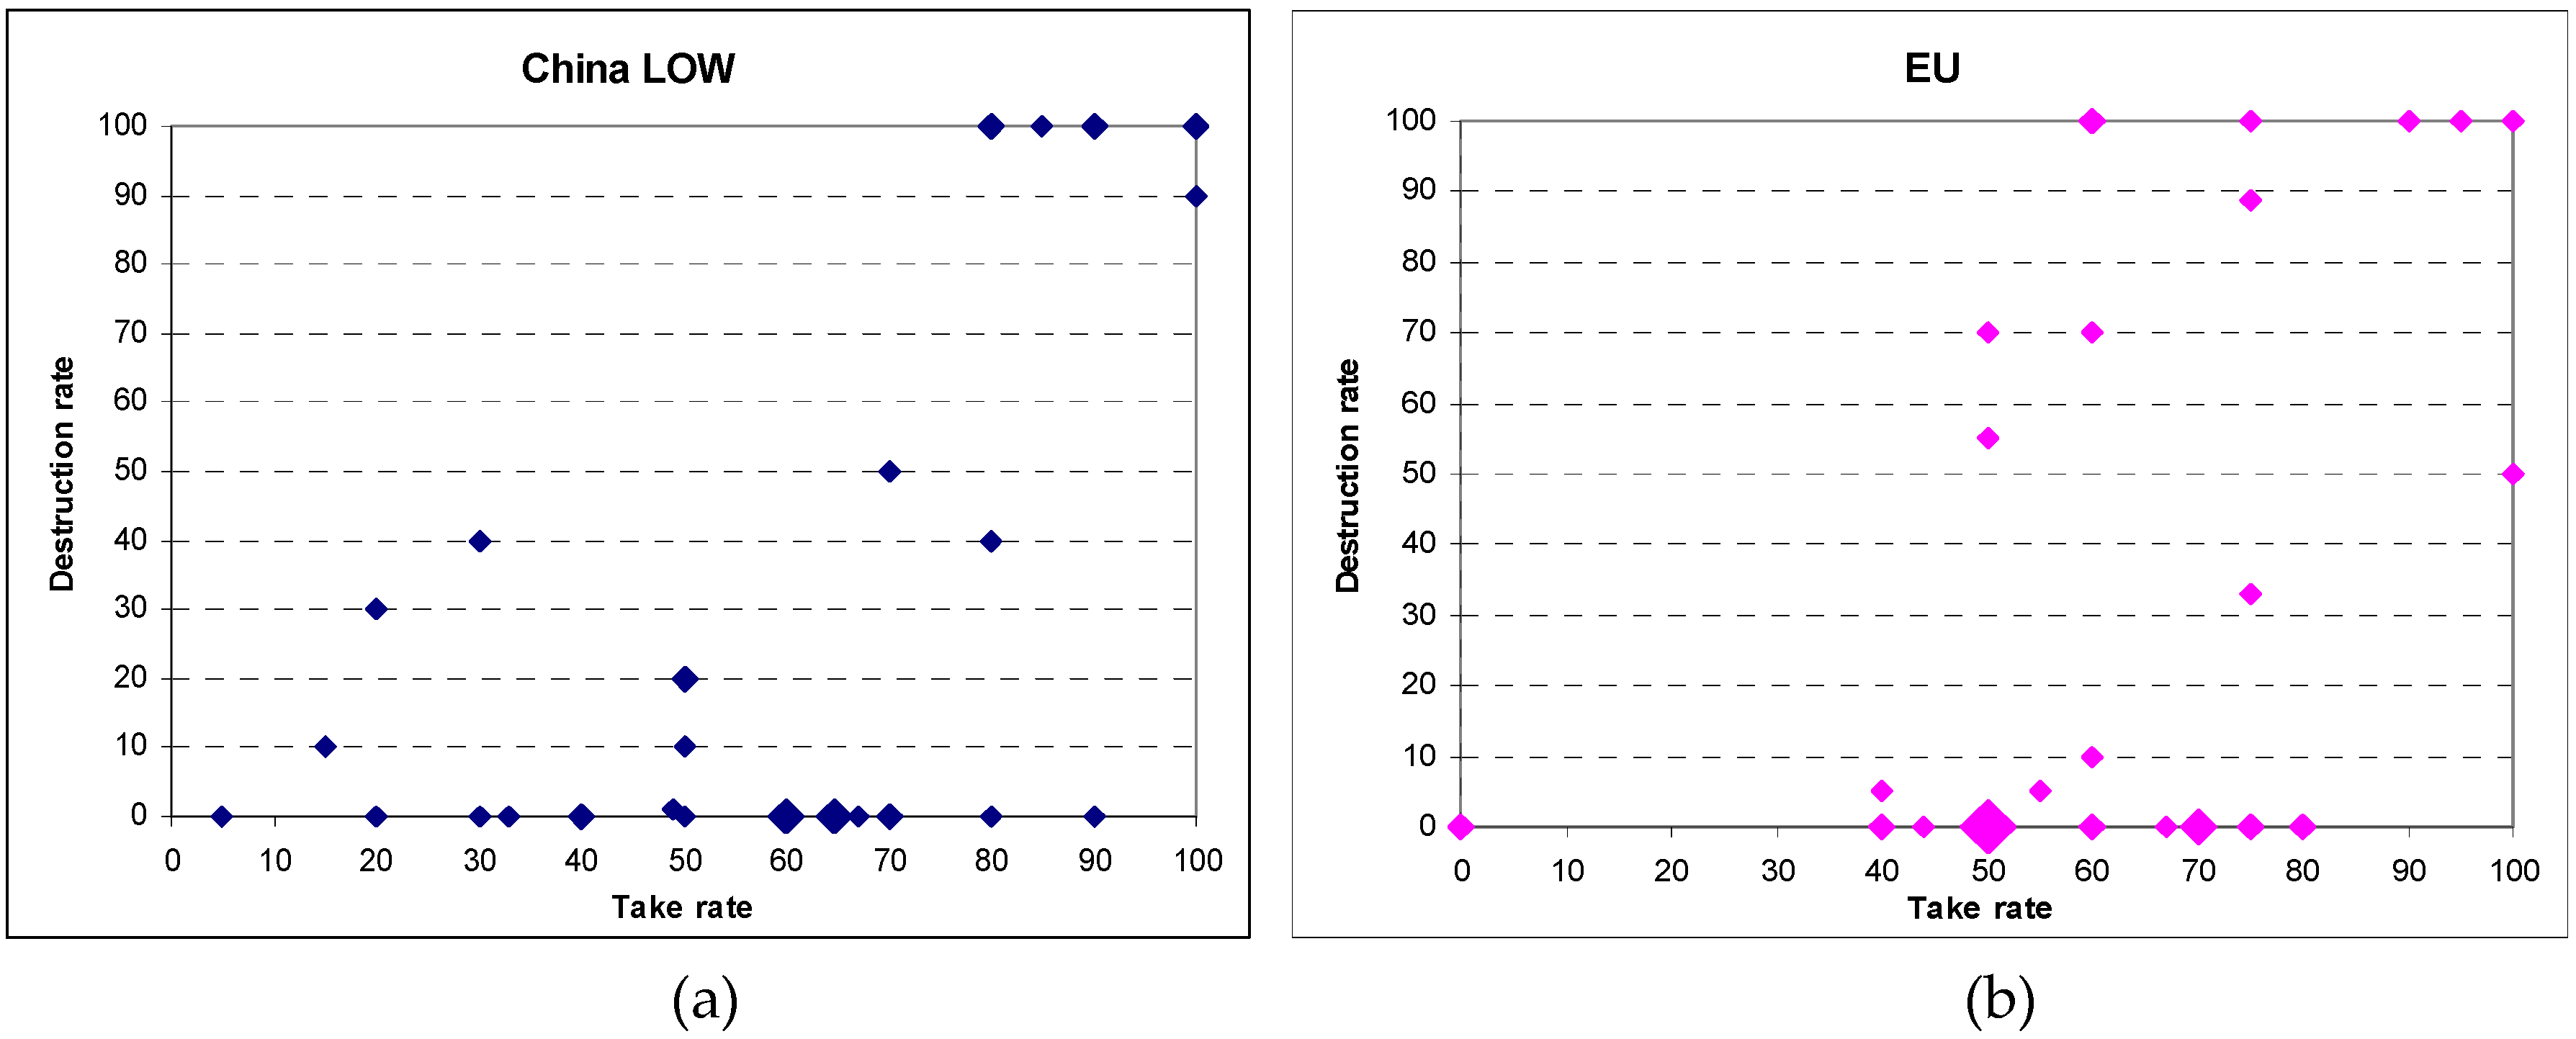
3.4. Behavioral Differences between the Chinese and the EU Subject Pools

Our experiment offers the opportunity to explore whether behavior and emotions differ between our Chinese and the two Western subject pools. As noted before, previous experiments on the power-to-take game were run in Western countries only. We have compared the data from [17]—conducted in Austria and The Netherlands and denoted as EU—with CHINA LOW where stakes are comparable in size.

3.4.1. Behavior: Take Rates and Destruction Rates

A summary of the data on take and destruction rates in EU and CHINA LOW is given in Table A1 of Appendix A. Figure 3 shows a scatter plot of take and destruction rates in the two treatments. In EU, the range of take rates is similar as in CHINA LOW, going from 0% to 100%. The average take rate in EU is 60% (median: 60%). There is no evidence that the take rates differ between CHINA LOW and EU (p = 0.98, Mann–Whitney U-test). In addition, a Kolmogorov–Smirnov test shows that we cannot reject the hypothesis that the distributions of take rates are the same (p = 0.54). Furthermore, we have looked at Cohen’s d for size effects between CHINA LOW and EU. This statistic shows that overall size effects are very small for both take rates and destruction rates (d = −0.02 and d = 0.09, respectively). Although the distributions of take rates are similar, the rates in EU are more clustered around 50%. In fact, 27.5% of the take authorities in EU choose a rate of exactly 50% while in China the corresponding figure is 11% only.
In both CHINA LOW and EU, destruction rates d range from 0% to 100%. In CHINA LOW, responders on average destroy 28% of their endowment. The median destruction rate is zero. In EU, average destruction is somewhat lower at 25% (median: 0%). The difference in destruction rates is not significant (p = 0.475, Mann–Whitney U-test).
A binary logit regression with destruction as the dependent and the take rate as the independent variable shows that the impact of the take rate is significant (see also Table 6). Coefficients for t are not significantly different between EU and CHINA LOW (p = 0.30, Chi2 test), while only a weakly significant difference in intercepts is observed (p = 0.09).
Result 5.
There is no evidence of distributional differences in take and destruction rates between CHINA LOW and EU. The take rate has a similar positive impact on destruction in both subject pools.

3.4.2. Experienced Emotions and Mediation Analysis

The first and third columns in Table 3 show the intensity scores of experienced emotions in CHINA LOW and EU, ranked from high to low intensity. Overall, the ranking of emotions is quite similar. Envy, however, appears to be somewhat of an exception. It is ranked relatively high in EU but low in China and the level of Envy is significantly higher in EU (Mann–Whitney U-test, p < 0.01). Anger, Irritation, Surprise and Contempt are prominent in both regions. Fear and Joy score higher in CHINA LOW than in EU. Fear is the only emotion that has been experienced more strongly in CHINA LOW than in EU, yet the difference is only weakly significant (Mann–Whitney U-test, p = 0.08).
We next look at the relation between the take rate and experienced emotions. For each emotion, we estimated again an ordered logit model, with emotion intensity as the dependent variable and the take rate as the explanatory variable (Table 4). The intensity of negative (positive) emotions is positively (negatively) related to the take rate. We found the same set of emotions, related to Anger and Joy, to be significant in both CHINA LOW and EU. Moreover, the estimated coefficients are very similar. In fact, we cannot reject the hypothesis that coefficients are the same in CHINA LOW and EU.
When destruction is regressed on emotion, Anger and Joy are significant in both regions (Table 5).14 Note that the (negative) coefficient of Joy is significantly larger in EU (p < 0.05, Chi2 test). In addition, Contempt appears to be important for destruction in EU but not in CHINA LOW, where instead Irritation and Fear play a role. Apparently, in EU, responders are more motivated by Contempt and less by Fear and Irritation.
Result 6.
In both CHINA LOW and EU, the intensity of negative (positive) emotions is positively (negatively) related to the take rate. The same set of emotions, involving Anger and Joy, is related to the take rate in both subject pools. In CHINA LOW as well as in EU, Anger and Joy are important for destruction. In addition, Contempt appears to be important for destruction in EU but not in CHINA LOW, where Irritation and Fear are influential instead.
Applying the procedure described in Section 3.3 to our data, we find as Emotion Aggregate for EU:EA(EU) = (0.46/1.58) × Anger + (0.43/1.58) × Contempt ‒ (0.69/1.58) × Joy. We cannot reject the hypothesis that the estimated coefficients regarding EA are the same in EU and CHINA LOW (p = 0.66, Chi2 test)
Mediation analysis according to the procedure described in Section 3.3 shows that in EU emotions fully mediate destruction (see Table 6, model 4) as the EA-index keeps its significant impact while the take rate loses significance and impact. Conditions (i)–(vi) are, thus, satisfied. No additional impact is found via the interaction terms (Table 6, models 5–6).
Result 7.
Emotions fully mediate destruction in EU (as in CHINA LOW).

4. Discussion

We have studied the impact of emotions in a power-to-take experiment with relatively small and large monetary incentives in China. We also compared behavior and experienced emotions between subjects in China and Europe (Netherlands and Austria).
Our study was not conducted without limitations. The first one concerns assessing responders’ emotions by self-reports and after having made their destruction decision. Self-reports can be unreliable and, when obtained in retrospect, they may also reflect emotional changes due to other factors than the take rate (see [44] for related arguments). One might argue that a more straightforward way would have been to ask for participants’ emotions at the time of deciding on the destruction rate and we acknowledge this limitation. We, however, decided on the timing as we did because our main interest is in destruction rates, i.e., in whether and if so how much of their own endowment subjects destroy. We did not want to distract their attention from this decision by first asking for the self-reported emotions, which might not only have decreased their spontaneous impulse for destruction but also have influenced this decision by prior deliberation. The timing of questionnaires involves a tradeoff, in our case between eliciting potentially biased destruction or biased emotion data. We decided for the latter keeping in mind that the findings with regard to the self-reported emotional experience have to be interpreted with this caveat.
Another limitation has to do with considerations of statistical power. Given our sample sizes, it is at least thinkable that some effects, for example, the absence of a significant difference in take and destruction rates between CHINA LOW and CHINA HIGH, turned out insignificant due to a lack of statistical power. It is noted, however, that none of the tested effect sizes is large and that the absence of effects is in line with other experimental studies comparing stakes (see the literature review in the Introduction). Furthermore, in incentivized experimental research—in particular, when subjects are paid high stakes that amount to possible earnings of at least half of the average monthly urban net income and more than an average monthly rural net income in Chengdu—there are financial constraints to the number of participants in such an experiment. Still, our sample sizes are in line with many other incentivized and non-incentivized laboratory experiments published in refereed journals.

5. Conclusions

Our results show that subtle interactions between monetary incentives and behavior have to be taken into account. Even though overall behavior in the two treatments in China is similar and we find no evidence that average (median) take rates and destruction rates differ, the reaction function of the responder appears to be contingent on monetary incentives: for take rates lower than (above) 80%, the probability of destruction is lower (higher) in CHINA HIGH than in CHINA LOW. Moreover, we find that, with conventional monetary incentives (a low stake), emotions fully mediate the impact of the take rate on destruction, whereas this is only partially so in the case of a high stake. The explanation we offer is that emotion regulation in the sense of [53] is increased by larger incentives: ‘cool’ Contempt is substituted for ‘hot’ Anger [40], which makes the responder more restrained when it comes to destroying his or her endowment. However, this only appears to work up to a certain point (a take rate of 80%). Beyond that point, this regulation seems to wear out [45], and a more emotional action tendency is followed, which, in our setting, is driven by reduced Joy. Apparently, larger stakes need not make responders more ‘rational’ in the sense that they (on average) destroy less, as suggested by the findings of [8] for ultimatum games and by Rabin’s reciprocity model [74].
Furthermore, our data show similarities but also some differences between the CHINA LOW and the EU subject pools. We find similarities in behavior (take rates as well as destruction rates), the experience of emotions, the emotions and emotional intensities evoked by the take rate, and the (full) mediation by emotions of the impact of the take rate on destruction. However, whereas Anger and loss of Joy are important for destruction in both subject pools, Irritation and Fear further help explain destruction in CHINA LOW, while this holds for Contempt in EU. The European participants may have curbed part of their Anger feeling in a self-regulatory way by turning it into Contempt. In this respect, they seem somewhat similar to the participants in CHINA HIGH, also regarding the observed larger negative impact of Joy on destruction. However, in contrast with the EU (with monetary incentives similar to CHINA LOW), emotions only partially mediate the impact of the take rate on destruction in CHINA HIGH, which would seem to be due to the difference in stake size.
Our findings that combine behavioral dynamics and emotion analysis provide new insights that may contribute to the development of a better understanding of the role of emotion and of emotion regulation in economic decision making, in particular with regard to situations where the emotions of anger and contempt matter.

Acknowledgments

We are grateful to Zhu-Yu Li for providing the opportunity to run the experiment at Sichuan University, Chengdu. We are further grateful to Chaoliang Yang for valuable research assistance as well as for translating instructions and questionnaires and his assistance in running the experiment. We thank Hong Geng, Fang-Wen Li, Wan-Bo Lu and Jing Yu for their support in conducting the experiment and Ying Wang and Ying Shen for transcribing the questionnaire entries. We thank Tamar Kugler for critical comments as well as two anonymous referees for insightful suggestions and remarks all of which improved the paper substantially. Helpful suggestions were also given by participants attending the following meetings: SABE Behavioral Economics Conference in New York 2007, ACCER Workshop on Cross-Cultural Experimental Economics Research in Duisburg 2014, CESifo Workshop on Behavioral Political Economy in Venice 2014, Annual Meeting of Verein für Socialpolitik, Augsburg, 2016, Annual Meeting of the Economic Science Association in Tucson 2016. Financial support by the EU-TMR Research Network ENDEAR and by Deutsche Forschungsgemeinschaft are gratefully acknowledged as well as a fellowship at Käte Hamburger Kolleg/Centre for Global Cooperation (Duisburg) and support by IRECOHEX (University of Oslo) for Heike Hennig-Schmidt while working on the paper.

Author Contributions

R. Bosman, H. Hennig-Schmidt and Frans van Winden contributed equally to all parts of the paper.

Conflicts of Interest

The authors declare no conflict of interest.

Appendix A

Table A1. Summary of behavioral data.
EUCHINA LOWCHINA HIGH
Case (#)t (%)d (%)Case (#)t (%)d (%)Case (#)t (%)d (%)Case (#)t (%)d (%)
1002100415077100
25002240042151078400
3500234052320079400
45002440044203080450
55002544045304081450
65055265004630082500
7500275004730083500
85002850704833084500
960100295004940085500
10600305555040086600
1160100316005149187600
1267032607052502088605
1370033601053502089600
147003470054501090600
15750357005550091600
167533367588.856600926610
1775100378005760093700
1875038901005860094700
1980039100505965095700
20951004010010060650967550
61650977550
6267098750
6370099800
647050100800
65700101800
6680401028060
6780100103800
68800103832
69801001058889
70851001069010
71901001079530
729010010898100
7390010999100
74100100110100100
75100100111100100
7610090112100100
Mean 59.9 24.7 59.4 28.1 69.322.4
(s.d.) (21.2)(39.3) (25.7)(40.5) (20.9)(37.6)
Median 60.00 62.50 700
Note: Data of EU are taken from Bosman et al. [17]. Etake = Eresp = 15 guilders/90 Schilling/30 (300) Chinese Yuan (RMB). t: take rate; d: part of Eresp destroyed by the responder; cases are ordered by the take rate. Cases 1–20 refer to Amsterdam, 21–40 to Innsbruck, 41–76 to CHINA LOW and 77–112 to CHINA HIGH. Numbers in parentheses are standard deviations.

Appendix B. Instructions for Treatment China LOW

Note: Text in [brackets] refers to treatment China HIGH, in {} to treatment EU. In [[double brackets]] clarifying notes are found not provided to participants.

Show-Up Fee

The show-up fee is 30 Yuan {Euro 4} for all participants in the experiment. You will receive the show-up fee, independently of the decisions taken in the experiment. The show-up fee is to be included in the calculation of your individual earnings at the end of the experiment.

Two Phases of the Experiment

The experiment consists of two phases. In phase 1, each participant A must make a decision whereas in phase 2, each participant B must make a decision. Every participant, be it A or B, makes only one decision. No other decisions will follow.
Phase 1: Participant A chooses a percentage
Each participant A will be paired with a participant B by letting each participant A draw an envelope. Each envelope among others contains a different code. By means of these codes, each participant A will be paired with just one participant B. Because of this procedure, participants A as well as participants B remain anonymous. No other participant will find out during or after the experiment with whom he or she is paired. In the envelope, you will also find a form with a black-framed block that must be filled in by participant A, and a gray-framed block that must be filled in by participant B (see sample form).
Each participant A and each participant B receives an endowment of 30 [300] Yuan {Euro 7}. In the black-framed block of participant A, you will find the endowments of participant A and of participant B. Participant A must then choose a percentage and fill this in on the black-framed block of the form. This percentage determines how much of participant B’s endowment of 30 [300] Yuan {Euro 7} after phase 2 should be transferred to participant A. The percentage chosen by participant A must be an integer between 0 and 100 including these numbers.
After having filled in the form, each participant A must put it back into the envelope. We will then collect the envelopes and transfer them to the participant B that is paired with the respective participant A.
Phase 2: Participant B chooses a percentage
In this phase, participant B must fill in on the form which percentage of his/her endowment should be destroyed. What is left after destruction is participant B’s remaining endowment. The percentage chosen by participant B must be an integer between 0 and 100 including these numbers. The transfer from participant B to participant A will be based on the endowment of participant B that is left after destruction, i.e., participant B’s remaining endowment. I will clarify the above terms by means of an example shortly. {The previous sentence was not provided in EU}. Participant B must transfer the percentage of his/her remaining endowment to participant A that was chosen by participant A.
After having filled the percentage of destruction into the grey-framed block, participant B has to put the form back into the envelope. We then will collect the envelopes and return them to the paired participant A for his/her information.

Example for Determining the Individual Total Earnings at the End of the Experiment

[[In the following, we give examples for CHINA LOW only.]] An example is going to clarify the procedure. Remember that each participant gets an endowment of 30 Yuan. Suppose that in the first phase of the experiment, participant A decides that 60% of participant B’s total earnings shall be transferred to participant A. In the second phase, participant B can destroy part or all of his/her endowment. Suppose participant B decides to destroy 0%. The transfer from participant B to participant A amounts to 18 Yuan (60% of 30 Yuan).
The total earnings of participant B at the end of the experiment are calculated as follows:
Show up fee 30 Yuan
+ Remaining endowment(100% − 0%) × 30 Yuan = 30 Yuan+30 Yuan
– Transfer60% × (100% − 0%) × 30 Yuan = 18 Yuan–18 Yuan
Total earnings 42 Yuan
The total earnings of participant A at the end of the experiment are calculated as follows:
Show up fee 30 Yuan
+ Initial endowment +30 Yuan
+ Transfer60% × (100% − 0%) × 30 Yuan = 18 Yuan+18 Yuan
Total earnings 78 Yuan
Suppose now that participant B in the above example decided not to destroy 0% but 50% of his/her own endowment. The individual total earnings of participant B at the end of the experiment are now calculated as follows:
Show up fee 30 Yuan
+Remaining endowment(100% − 50%) × 30 Yuan = 15 Yuan+15 Yuan
–Transfer60% × (100% − 50%) × 30 Yuan = 9 Yuan–9 Yuan
Total earnings 36 Yuan
The total earnings of participant A at the end of the experiment are now calculated as follows:
Show up fee 30 Yuan
+Initial endowment +30 Yuan
+Transfer60% × (100% − 50%) × 30 Yuan = 9 Yuan+9 Yuan
Total earnings69 Yuan

Further Information

Filling in the form
The decisions of both participant A and participant B are filled in on a form, a sample of which you have been provided with. You must only use the pens we gave you. In case any other pen is used to fill in a form, this form will be invalid and you will receive no payment at the end of the experiment. If you want to make any calculations, please use the calculator we gave you.
Payment
After participant A has been informed on participant B’s decision in phase 2, the envelope containing the form will be collected and brought to the cashier. The cashier determines the payment of each participant with the help of the form and the codes that are linked to the seats. After having filled in some questionnaires, the participants will go one by one to receive their total earnings. The cashier is not present during the experiment. This procedure guarantees anonymity with regard to who earned what and also the experimenter cannot assign any earnings to specific participants. Please take the card indicating your seat number when you are being paid.
Exercises
In order to familiarize yourself with the experiment, we now ask you to complete two exercises. You will have to complete the form for a hypothetical situation and to calculate the corresponding total earnings. During the exercises, you are not matched with another participant. The total earnings from the exercises will not be paid to you. After having finished the exercises, you again will have the opportunity to ask questions. Then, the experiment will start.
Finally
We would like to stress again that the pairing of participants A with participants B is anonymous. You will neither during nor after the experiment find out with whom you are matched. In order to guarantee anonymity between participants A and B, we will install a sight protection. Instructions will be available during the experiment. Please complete some short questionnaires during the experiment. Please enter your seat number into each of the questionnaires. As we do not know which seat number is assigned to which participant, we also guarantee anonymity with regard to the questionnaires. At the end of the experiment, please leave the room one by one and proceed to being paid.
Please stay quietly in your seat and do not communicate with other participants before you have left the room.
Decision Form
Code: ……
Participant A fills in this block:
Endowment participant A: 30 [300] Yuan {Euro 7}.
Endowment participant B: 30 [300] Yuan {Euro 7}.
I (participant A) decide that ……… % of the endowment of participant B will be transferred to me.
Participant B fills in this block:
I (participant B) destroy ……… % of my endowment.

References

  1. Gneezy, U.; Rustichini, A. Pay enough or don’t pay at all. Q. J. Econ. 2000, 115, 791–810. [Google Scholar] [CrossRef]
  2. Andersen, B.S.; Ertac, S.; Gneezy, U.; Hoffman, M.; List, J.A. Stakes matter in ultimatum games. Am. Econ. Rev. 2011, 101, 3427–3439. [Google Scholar] [CrossRef]
  3. Jenkins, G.D., Jr.; Mitra, A.; Gupta, N.; Shaw, J.D. Are financial incentives related to performance? A meta-analytic review of empirical research. J. Appl. Psych. 1998, 83, 777–787. [Google Scholar] [CrossRef]
  4. Camerer, C.F.; Hogarth, R.M. The effects of financial incentives in economics experiments: A review and capital-production-labor framework. J. Risk Uncertain. 1999, 18, 7–42. [Google Scholar] [CrossRef]
  5. Hertwig, R.; Ortmann, A. Experimental practices in economics: A methodological challenge for psychologists? Behav. Brain Sci. 2001, 24, 383–403. [Google Scholar] [PubMed]
  6. Camerer, C.F. Behavioral Game Theory; Princeton University Press: Princeton, NJ, USA, 2003. [Google Scholar]
  7. Engel, C. Dictator games. A meta study. Exp. Econ. 2011, 14, 583–610. [Google Scholar] [CrossRef]
  8. Oosterbeek, H.; Sloof, R.; de Kuilen, G. Cultural differences in ultimatum game experiments: Evidence from a meta-analysis. Exp. Econ. 2004, 7, 171–188. [Google Scholar] [CrossRef]
  9. Novakova, J.; Flegr, J. How much is our fairness worth? The effect of raising stakes on offers by proposers and minimum acceptable offers in dictator and ultimatum games. PLoS ONE 2013, 8. [Google Scholar] [CrossRef] [PubMed]
  10. Munier, B.; Zaharia, C. High stakes and acceptance behavior in ultimatum bargaining. Theor. Decis. 2002, 53, 187–207. [Google Scholar] [CrossRef]
  11. Carpenter, J.; Verhoogen, E.; Burks, S. The effect of stakes in distribution experiments. Econ. Lett. 2005, 86, 393–398. [Google Scholar] [CrossRef]
  12. List, J.A.; Cherry, T. Examining the role of fairness in high stakes allocation decisions. J. Econ. Behav. Organ. 2008, 65, 1–8. [Google Scholar] [CrossRef]
  13. Johnson, N.D.; Mislin, A.A. Trust games: A meta-analysis. J. Econ. Psychol. 2011, 32, 865–889. [Google Scholar] [CrossRef]
  14. Johansson-Stenman, O.; Mahmud, M.; Martinsson, P. Does stake size matter in trust games? Econ. Lett. 2005, 88, 365–369. [Google Scholar] [CrossRef]
  15. Kocher, M.; Martinsson, P.; Visser, M. Does stake size matter for cooperation and punishment? Econ. Lett. 2008, 99, 508–511. [Google Scholar] [CrossRef]
  16. Bosman, R.; van Winden, F. Emotional hazard in a power-to-take game experiment. Econ. J. 2002, 112, 146–169. [Google Scholar]
  17. Bosman, R.; Sutter, M.; van Winden, F. The impact of real effort and emotions in the power-to-take game. J. Econ. Psychol. 2005, 26, 407–427. [Google Scholar] [CrossRef]
  18. Bosman, R.; Hennig-Schmidt, H.; van Winden, F. Exploring group decision making in a power-to-take experiment. Exp. Econ. 2006, 9, 35–51. [Google Scholar] [CrossRef]
  19. Ben-Shakhar, G.; Bornstein, G.; Hopfensitz, A.; van Winden, F. Reciprocity and emotions in bargaining using physiological and self-report measures. J. Econ. Psychol. 2007, 28, 314–323. [Google Scholar] [CrossRef]
  20. Reuben, E.; van Winden, F. Social ties and coordination on negative reciprocity: The role of affect. J. Public Econ. 2008, 92, 34–53. [Google Scholar] [CrossRef]
  21. Sutter, M.; Bosman, R.; Kocher, M.G.; van Winden, F. Gender pairing and bargaining—Beware the same sex! Exp. Econ. 2009, 12, 318–331. [Google Scholar] [CrossRef]
  22. Reuben, E.; van Winden, F. Fairness perceptions and prosocial emotions in the power to take game. J. Econ. Psychol. 2010, 31, 908–922. [Google Scholar] [CrossRef]
  23. Galeotti, F. An experiment of waiting time and punishing behavior. Econ. Bull. 2013, 33, 1383–1389. [Google Scholar]
  24. Grosskopf, B.; López-Vargas, K. On the Demand for Expressing Emotions. Working Paper. Exeter: University of Exeter, UK, 2014. Available online: http://econweb.umd.edu/~lopez-vargas/Grosskopf_LopezVargas_2014.pdf (accessed on 13 January 2017).
  25. Galeotti, F. Do negative emotions explain punishment in power-to-take game experiments? J. Econ. Psychol. 2015, 49, 1–14. [Google Scholar] [CrossRef]
  26. Van Winden, F. Political economy with affect: On the role of emotions and relationships in political economics. Eur. J. Polit. Econ. 2015, 40, 298–311. [Google Scholar] [CrossRef]
  27. Gross, J.J. The emerging field of emotion regulation: An integrative review. Rev. Gen. Psychol. 1998, 2, 271–299. [Google Scholar] [CrossRef]
  28. Ochsner, K.N.; Gross, J.J. The cognitive control of emotion. Trends Cogn. Sci. 2005, 9, 242–249. [Google Scholar] [CrossRef] [PubMed]
  29. Gross, J.J. Emotion regulation: Conceptual and empirical foundations. In The Handbook of Emotion Regulation, 2nd ed.; Guilford Press: New York, NY, USA, 2014; pp. 3–20. [Google Scholar]
  30. Mauss, I.B.; Cook, C.L.; Gross, J.J. Automatic emotion regulation during anger provocation. J. Exp. Soc. Psychol. 2007, 43, 698–711. [Google Scholar] [CrossRef]
  31. Tamir, M. The Maturing Field of Emotion Regulation. Emot. Rev. 2011, 3, 3–7. [Google Scholar] [CrossRef]
  32. Aldao, A.; Tul, M.T. Putting emotion regulation in context. Curr. Opin. Psychol. 2015, 3, 100–107. [Google Scholar] [CrossRef]
  33. Seeley, S.H.; Garcia, E.; Mennin, D.S. Recent advances in laboratory assessment of emotion regulation. Curr. Opin. Psychol. 2015, 3, 58–63. [Google Scholar] [CrossRef]
  34. Heilman, R.M.; Crisan, L.G.; Houser, D.; Miclea, M.; Miu, A.C. Emotion Regulation and Decision Making Under Risk and Uncertainty. Emotion 2010, 10, 257–265. [Google Scholar] [CrossRef] [PubMed]
  35. Martin, L.N.; Delgado, M.R. The Influence of Emotion Regulation on Decision-making under Risk. J. Cogn. Neurosci. 2011, 23, 2569–2581. [Google Scholar] [CrossRef] [PubMed]
  36. Grecucci, A.; Giorgetta, C.; van’t Wout, M.; Bonini, N.; Sanfey, A.G. Reappraising the Ultimatum: An fMRI Study of Emotion Regulation and Decision Making. Cereb. Cortex. 2013, 23, 399–410. [Google Scholar] [CrossRef] [PubMed]
  37. Mesquita, B.; Frijda, N.H. An emotion perspective on emotion regulation. Cogn. Emot. 2011, 25, 782–784. [Google Scholar] [CrossRef] [PubMed]
  38. De Leersnyder, J.; Boiger, M.; Mesquita, B. Cultural regulation of emotion: Individual, relational, and structural sources. Front. Psychol. 2013. [Google Scholar] [CrossRef] [PubMed]
  39. Mesquita, B.; De Leersnyder, J.; Albert, D. The cultural regulation of emotions. In The Handbook of Emotion Regulation, 2nd ed.; Guilford Press: New York, NY, USA, 2014; pp. 284–301. [Google Scholar]
  40. Fischer, A.H. Contempt: A hot feeling hidden under a cold jacket. In Re-Constructing Emotional Spaces—From Experience to Regulation; Trnka, R., Balcar, K., Kuska, M., Eds.; College of Psychosocial Studies Press: Prague, Czech Republic, 2011; pp. 77–88. [Google Scholar]
  41. Butler, E.A.; Lee, T.L.; Gross, J.J. Emotion Regulation and Culture: Are the Social Consequences of Emotion Suppression Culture-Specific? Emotion 2007, 7, 30–48. [Google Scholar] [CrossRef] [PubMed]
  42. Matsumoto, D. Cultural influences on the perception of emotion. J. Cross Cult. Psychol. 1989, 20, 92–105. [Google Scholar] [CrossRef]
  43. Sang, B.; Deng, X.; Luan, Z. Which emotional regulatory strategy makes Chinese adolescents happier? A longitudinal study. Int. J. Psychol. 2014, 49, 513–518. [Google Scholar] [CrossRef] [PubMed]
  44. Matsumoto, D.; Hwang, H.C. Cooperation and competition in intercultural interactions. Int. J. Intercult. Rel. 2011, 35, 677–685. [Google Scholar] [CrossRef]
  45. Frijda, N.H. The Emotions; Cambridge University Press: Cambridge, UK, 1986. [Google Scholar]
  46. Cannon, W.B. Bodily Changes in Pain, Hunger, Fear, and Rage; Appleton and Company: New York, NY, USA, 1922. [Google Scholar]
  47. Cannon, W.B. The autonomic nervous system: An interpretation. Lancet 1930, 215, 1109–1115. [Google Scholar]
  48. LeDoux, J.E. The Emotional Brain; Simon and Schuster: New York, NY, USA, 1996. [Google Scholar]
  49. Loewenstein, G.; Lerner, J.S. The role of affect in decision-making. In Handbook of Affective Sciences; Davidson, R.J., Scherer, K.R., Goldsmith, H.H., Eds.; Oxford University Press: New York, NY, USA, 2003; pp. 619–642. [Google Scholar]
  50. Fischer, A.; Giner-Sorolla, R. Contempt: Derogating Others While Keeping Calm. Emot. Rev. 2016, 8, 346–357. [Google Scholar] [CrossRef]
  51. Mauss, I.B.; Evers, C.; Wilhelm, F.H.; Gross, J.J. How to Bite Your Tongue without Blowing Your Top: Implicit Evaluation of Emotion Regulation Predicts Affective Responding to Anger Provocation. Pers. Soc. Psychol. B 2006, 32, 1–14. [Google Scholar] [CrossRef] [PubMed]
  52. Russell, J.A.; Yik, M.S.M. Emotions among the Chinese. In Handbook of Chinese Psychology; Bond, M.H., Ed.; Oxford University Press: Oxford, NY, USA, 1996; pp. 166–188. [Google Scholar]
  53. Mesquita, B.; Frijda, N.H. Cultural variations in emotions: A review. Psychol. Bull. 1992, 112, 179–204. [Google Scholar] [CrossRef] [PubMed]
  54. Shaver, P.R.; Wu, S.; Schwartz, J.C. Cross-cultural similarities and differences in emotion and representation. A prototype approach. In Review of Personality and Social Psychology; Clark, M.S., Ed.; Sage: Newbury Park, CA, USA, 1992; Volume 13, pp. 175–212. [Google Scholar]
  55. Shao, B.; Doucet, L.; Caruso, D.R. Universality versus Cultural Specificity of Three Emotion Domains: Some Evidence Based on the Cascading Model of Emotional Intelligence. J. Cross-Cult. Psychol. 2015, 46, 229–251. [Google Scholar] [CrossRef]
  56. Matsumoto, D.; Hwang, H. The Role of Contempt in Intercultural Cooperation. Cross-Cult. Res. 2015, 49, 439–460. [Google Scholar] [CrossRef]
  57. Yang, K.-S. Chinese personality and its change. In The Psychology of Chinese People; Bond, M.H., Ed.; Oxford University Press: Oxford, NY, USA, 1986; pp. 106–170. [Google Scholar]
  58. Wu, D.Y.H. Chinese childhood socialization. In Handbook of Chinese Psychology; Bond, M.H., Ed.; Oxford University Press: Oxford, NY, USA, 1996; pp. 143–154. [Google Scholar]
  59. Ford, B.Q.; Mauss, I.B. Culture and emotion regulation. Curr. Opin. Psychol. 2015, 3, 1–5. [Google Scholar] [CrossRef] [PubMed]
  60. Shambaugh, D.; Sandschneider, E.; Hong, Z. From honeymoon to marriage: Prospects for the China–Europe relationship. In China–Europe Relations—Perceptions, Policies and Prospects; Shambaugh, D., Sandschneider, E., Hong, Z., Eds.; Routledge: Abingdon, UK, 2008; pp. 303–337. [Google Scholar]
  61. Hennig-Schmidt, H.; Walkowitz, G. Negotiations among Chinese and Germans—An Experimental Case Study. Homo Oecon. 2015, 32, 451–488. [Google Scholar]
  62. Andreoni, J.; Castillo, M.; Petrie, R. What do bargainers’ preferences look like? Experiments with a convex ultimatum game. Am. Econ. Rev. 2003, 93, 672–685. [Google Scholar] [CrossRef]
  63. Ekman, P. An argument for basic emotions. Cogn. Emot. 1992, 6, 169–200. [Google Scholar] [CrossRef]
  64. Chengdu Bureau of Statistics. Chengdu Statistical Year Book; Chengdu Bureau of Statistics: Chengdu, China, 2015.
  65. Chengdu Government. 2015 Statistical Bulletin of Chengdu Economic and Social Development. Chengdu, China, 2015. Available online: http://www.cdstats.chengdu.gov.cn/detail.asp?ID=89559&ClassID=020705 (accessed on 19 December 2016). [Google Scholar]
  66. Hsu, F.L.K. Americans and Chinese: Passage to Differences, 3rd ed.; University of Hawaii Press: Honolulu, HI, USA, 1981. [Google Scholar]
  67. Bond, M.H.; Hwang, K.-K. The social psychology of Chinese people. In The Psychology of Chinese People; Bond, M.H., Ed.; Oxford University Press: Oxford, NY, USA, 1986; pp. 211–266. [Google Scholar]
  68. Leung, K. The role of beliefs in Chinese culture. In Handbook of Chinese Psychology; Bond, M.H., Ed.; Oxford University Press: Oxford, NY, USA, 1996; pp. 247–262. [Google Scholar]
  69. Hofstede, G. Cultures Consequences. Comparing Values, Behaviors, Institutions, and Organizations across Nations, 2nd ed.; Sage Publications, Inc.: Thousand Oaks, CA, USA, 2001. [Google Scholar]
  70. Nisbett, R.E.; Peng, K.; Choi, I.; Norenzayan, A. Culture and systems of thought: Holistic vs. analytic cognition. Psychol. Rev. 2001, 108, 291–310. [Google Scholar] [CrossRef] [PubMed]
  71. Nisbett, R.E.; Norenzayan, A. Culture and cognition. In Stevens Handbook of Experimental Psychology: Cognition, 3rd ed.; Pashler, H., Medin, D.L., Eds.; John Wiley & Sons: New York, NY, USA, 2002; pp. 561–597. [Google Scholar]
  72. MacKinnon, D.P.; Fairchild, A.J.; Fritz, M.S. Mediation analysis. Annu. Rev. Psychol. 2007, 58, 593–614. [Google Scholar] [CrossRef] [PubMed]
  73. Fischer, A.H.; Roseman, I.J. Beat Them or Ban Them: The Characteristics and Social Functions of Anger and Contempt. J. Pers. Soc. Psychol. 2007, 93, 103–115. [Google Scholar] [CrossRef] [PubMed]
  74. Rabin, M. Incorporating fairness into game theory and economics. Am. Econ. Rev. 1993, 83, 1281–1302. [Google Scholar]
  • 1A field experiment in India involving stakes up to a little more than participants’ average yearly income ([2]) revealed offer proportions significantly lower in the higher stakes compared to the lowest stakes treatment. For responders, rejection rates were significantly lower in the former than in the latter, with those under low stakes being in the range of the existing literature. [9] report similar findings on dictator and ultimatum game experiments with rather high, though hypothetical, stakes. Munier and Zaharia [10] observe responders’ lowest acceptable offers to be proportionally lower in the high-stake condition. No evidence for an effect was found by Carpenter et al. [11] (dictator and ultimatum games) and List and Cherry [12] (dictator game) who provided stakes up to 100$ in the US that are still relatively much lower than in Anderson et al. [2].
  • 2E.g., Bosman et al. [17] study whether having to earn the endowment by real effort influences behavior compared to a no-effort setting. Bosman et al. [18] analyze a group version of the power-to-take game. Ben-Shakhar et al. [19] employ physiological measures of emotional arousal as well as self-report measures of emotional responses. Reuben and van Winden [20] investigate how social ties influence behavior in a three-player PTTG with one take authority and two responders. The impact of gender and gender pairing is studied by Sutter et al. [21]. Reuben and van Winden [22] examine how proposers adjust their behavior depending on their fairness perceptions, experienced emotions, and their interaction with responders. Galeotti [23] study the impact of waiting time on economic decision-making in a PTTG. Grosskopf and López-Vargas [24] analyze the impact the demand for expressing emotions has on behavior. Galeotti [25] studies whether negative emotions can explain punishment in PTTG experiments.
  • 3Take that authorities actually earned up to 90% of the urban and up to 235% of the average rural monthly income.
  • 4According to Mesquita and Frijda [53] (p. 198), “there appears to exist a universally human set of emotion reaction modes both at the central level (modes of action readiness) and at that of specific responses (facial expression, voice intonation (…)).”
  • 5In this respect, the power-to-take game differs from the convex ultimatum game by Andreoni et al. [62].
  • 6Data regarding EU are taken from Bosman et al. [17]. No behavioral differences across countries in EU were found. We, therefore, pooled the data.
  • 7For instructions, see Appendix B. Instructions for China were translated into Chinese using the back translation method. Full instructions in Chinese as well as the script of the experimental protocol are available from the authors upon request.
  • 8To facilitate the task for the participants, we asked them to put in a percentage of B’s endowment to be taken or to be destroyed; see the instructions in Appendix B. We, therefore, report and analyze percentages throughout the paper.
  • 9In the study of Bosman et al. [17], eleven emotion names were used. Two of those emotions—Happiness and Jealousy—were skipped in the present study due to substantial differences in their meaning in China and Europe.
  • 10Chengdu Bureau of Statistics [64], see also Chengdu Government [65]. According to the same sources, in 2015, the monthly net income in urban (rural) Chengdu was 2.790 (1.475) RMB.
  • 11For each treatment in China, we ran only one session with 72 subjects. It, therefore, took longer than in EU to individually answer participants’ questions and check the exercises, to collect and distribute take authorities’ and responders’ decisions to their counterparts, and to have the subjects fill in the final questionnaires.
  • 12When using an independent samples t-test, in LOW and HIGH, a minimum power of 0.6 requires a sample size of n = 4 and n = 29 for take rates and destruction rates, respectively. For EU and LOW, the corresponding sample sizes are n = 621 and n = 36.
  • 13Note that some responders reported not to have any expectation. Therefore, the number of observations is smaller when expectations are included in the binary logit regression (n = 27 for LOW, and n = 24 for HIGH).
  • 14In both regions, Anger and Irritation are correlated suggesting that these emotions refer to a similar underlying emotion.
Figure 1. Take rates and destruction rates in CHINA LOW (a) and CHINA HIGH (b). Note: The size of symbols is proportional to the underlying number of observations.
Games 08 00017 g001
Figure 2. Take rates and probability of destruction in CHINA LOW and CHINA HIGH. Note: The figure shows take rate and probability of destruction in CHINA LOW and CHINA HIGH based on binary logit regressions for each treatment separately.
Games 08 00017 g002
Figure 3. Take rates and destruction rates in CHINA LOW (a) and EU (b). Note: The size of symbols is proportional to the underlying number of observations. EU data are from Bosman et al. [17].
Games 08 00017 g003
Table 1. Experimental treatments.
TreatmentSessionsEndowmentShow-UpNumber of
AbbreviationRun in FeeIndependent ObservationsTake AuthoritiesResponders
CHINA LOWChinaEURO 4 (30 RMB)EURO 4 (30 RMB)363636
CHINA HIGHChinaEURO 40 (300 RMB)EURO 4 (30 RMB)363636
EUNetherlands/AustriaEURO 7EURO 7404040
Table 2. CHINA LOW and HIGH: Impact of take rate and emotions on destruction (pooled data).
ModelChina LOW and HIGH pooled
(1)(2)(3)(4)(5)(6)
Dependent: Variable Destruction
Take rate t0.061 ***
(0.014)
0.049 ***
(0.015)
0.055 ***
(0.016)
0.033 *
(0.017)
0.033 *
(0.018)
Emotion aggregate (EA) 1.180 ***
(0.251)
0.969 ***
(0.262)
0.898 ***
(0.270)
0.865 ***
(0.278)
0.920 **
(0.355)
CHINA-HIGH –0.588
(0.562)
–6.953 **
(2.879)
–7.157 **
(2.992)
CHINA-HIGH × t 0.085 **
(0.037)
0.087 **
(0.038)
CHINA-HIGH × EA −0.139
(0.540)
Observations727272727272
Pseudo R20.1130.1360.1890.1940.2220.222
Note: Ordered logit regression. Binary logit regressions provide qualitatively similar results. Standard errors in parentheses. * p < 0.10; ** p < 0.05; *** p < 0.01.
Table 3. Ranking of averaged experienced emotions.
CHINA LOWCHINA HIGH EU
EmotionIntensityEmotionIntensityEmotionIntensity
Surprise3.14 (0.326)Anger3.58 (0.387)Anger3.88 (0.353)
Anger2.89 (0.399)Irritation3.30 (0.386)Irritation3.58 (0.368)
Irritation2.64 (0.364)Sadness3.19 (0.371)Surprise3.43 (0.312)
Contempt2.61 (0.364)Envy3.17 (0.299)Envy3.18 (0.309)
Joy2.58 (0.291)Fear2.97 (0.315Contempt2.93 (0.348)
Sadness2.28 (0.313)Surprise2.83 (0.342)Sadness2.33 (0.278)
Fear2.17 (0.299)Contempt2.83 (0.366)Joy2.15 (0.255)
Envy1.86 (0.262)Joy2.72 (0.292)Fear1.40 (0.128)
Shame1.22 (0.120)Shame1.61 (0.216)Shame1.40 (0.185)
Note: Average scores of experienced emotions ordered according to their intensity. Standard errors in parentheses.
Table 4. Relation between the responders’ emotion intensity and the take rate.
CHINA LOWCHINA HIGHEU
EmotionCoefficient of tEmotionCoefficient of tEmotionCoefficient of t
Irritation0.05 ***Irritation0.04 **Irritation0.03 **
Anger0.04 ***Anger0.05 ***Anger0.08 ***
Contempt0.04 ***Contempt 0.04 **Contempt0.03 *
Joy−0.04 ***Joy−0.05 ***Joy−0.04 ***
Note: Ordered logit regression. Binary logit regressions provide qualitatively similar results. Emotion intensity is the dependent variable. Standard errors in parentheses. * p < 0.10; ** p < 0.05; *** p < 0.01.
Table 5. Relation between responders’ destruction and emotions.
CHINA LOWCHINA HIGHEU
EmotionCoefficient of EmotionEmotionCoefficient of EmotionEmotionCoefficient of Emotion
Anger0.27 **Contempt0.42 **Anger0.46 ***
Irritation0.42 **Joy−0.85 ***Contempt0.43 ***
Joy−0.43 ** Joy−0.69 *
Fear−0.46 **
Note: Ordered logit regression. Binary logit regressions provide qualitatively similar results. Destruction is the dependent variable. Standard errors in parentheses. * p < 0.10; ** p < 0.05; *** p < 0.01.
Table 6. China LOW and EU: Impact of take rate and emotions on destruction (pooled data).
ModelChina LOW and EU Pooled
(1)(2)(3)(4)(5)(6)
Dependent variable: Destruction
Take rate t0.046 ***
(0.012)
0.034 **
(0.014)
0.027 *
(0.014)
0.027*
(0.016)
0.027
(0.017)
Emotion aggregate (EA) 0.675 ***
(0.178)
0.461 **
(0.192)
0.790 ***
(0.243)
0.791 ***
(0.247)
0.806 **
(0.342)
EU −1.516 **
(0.603)
–1.449
(1.754)
−1.475
(1.804)
EU × t −0.001
(0.026)
−0.000
(0.029)
EU × EA −0.030
(0.030)
Observations767676767676
Pseudo R20.0720.0700.0980.1270.1270.127
Note: Ordered logit regression. Binary logit regressions provide qualitatively similar results. Standard errors in parentheses; * p < 0.10; **p < 0.05; *** p < 0.01.

