
Gender, Emotions, and Tournament Performance in the Laboratory

Eastern Connecticut State University, Department of Economics, Willimantic, CT 06226, USA
Games 2017, 8(3), 26; https://0-doi-org.brum.beds.ac.uk/10.3390/g8030026
Submission received: 17 May 2017
/
Revised: 13 June 2017
/
Accepted: 20 June 2017
/
Published: 28 June 2017
(This article belongs to the Special Issue Behavior Regulation and Conflicted Emotions: Theory and Experimental Evidence)
Abstract
:Individuals face competitive environments daily, and it is important to understand how emotions affect behavior in these environments and resulting economic consequences. Using a two-stage laboratory experiment, I analyze the role of reported emotions in tournament performance and assess how the behavioral response differs across genders. The first stage serves to induce emotions, while the second stage presents the subject with a one-on-one winner-take-all tournament with the individual who generated the feeling, using a real-effort task. Ultimately, I show that women respond to the negative feelings more strongly than men. I find that women increase performance when experiencing negative emotions, while male performance remains unaffected. Remarkably, there is no gender gap in tournament performance when there are negative emotions.
1. Introduction
Many employees face competition within the workplace. Job promotions, awards such as employee of the month or incentive pay for top performers are a few of the common tournament structures employed in many workplaces.1 Additionally, employee interaction outside of the workplace is increasingly common.
A study recently published by Millennial Branding found that individuals between the ages of 18 and 29 are friends with an average of 16 co-workers on Facebook.2 Garcia et al. (2013) [3] cite determined personal history as a potential influence on competitive behavior. The authors note that situational factors can come into play where comparison and competitiveness are found within what the authors label “Social Category Fault Lines.”
I use a controlled laboratory setting to enhance the understanding of how emotions towards other individuals affect tournament performance, as well as how the behavioral findings may differ across genders. Behavioral responses to emotions, tournament performance and gender differences have been studied separately, but there is little research that combines all three of these variables. My study adds to the body of research in that it aims to assess emotion, tournament performance and gender differences simultaneously.
While individual emotions can be significantly dynamic and complex outside the laboratory, the anonymity of the laboratory allows me to observe the specific impact of laboratory induced emotions on individual behavior in the presence of competition and how the impact on behavior differs across genders. Specifically, I test how negative interpersonal experiences affect performance in competitive situations, while controlling for the level of negativity and gender. My study provides a setting in which women are found to respond positively to the presence of a tournament while men are unaffected.
I conducted a two-stage laboratory experiment. In the first stage, a four-person public goods game was used to generate a range of emotions. Subjects observed the individual contribution decisions of all group members. I then asked them to state their feeling about each group member on a scale of one to five, where one indicated strongly negative feelings and five reflected strongly positive feelings. The second stage consisted of a one-on-one tournament using a real-effort task where the assigned opponent is a group member from the public goods game. The opponent remained the same for all five rounds of the tournament, and subjects were informed about the selected opponent’s identity prior to the start of the tournament. Between tournament rounds, subjects were informed whether their number of completed tasks exceeded the number of completed tasks of their opponent, but not how many tasks the opponent completed.
By comparing individual performance in the tournament across the reported feelings, I determined if and how emotions affect tournament performance. Specifically, the experiment investigated if an individual who was matched with an opponent he rated as strongly negative responded with increased performance, compared to an individual matched with a less negatively rated opponent. Additionally, because gender may affect tournament behavior, the study tested how behavior differs between men and women, particularly while controlling for the level of emotion. I found that strongly negative emotions positively affect performance for women but not for men. This observed difference is not due to a difference in the intensity of the generated emotion across genders. As with all laboratory experiments, follow-up experiments and replications are important for confirming and validating the conclusions drawn.
In previous studies, Fehr and Gächter (2000a, 2002) [4,5] show that strong negative emotions bring about a desire to punish free-riding in public goods games and, if given the opportunity, subjects choose to undertake costly punishment a significant portion of the time, even when there is no direct monetary benefit to the subject.
In a survey on observed reciprocity in the literature, Fehr and Gächter (2000b) [6] mention numerous other studies also suggesting that negative reciprocity arises out of a desire to punish “hostile intentions” (e.g., Rabin, 1993 [7]; Blount, 1995 [8]; Dufwenberg and Kirchsteiger, 2004 [9]; and Falk and Fischbacher, 2006 [10]). In my study, punishment takes the form of increased effort in a real effort task so as to increase the probability of winning the tournament and therefore the other person losing the tournament.
While emotions can influence individual behavior, the effect of this influence may differ between men and women. Bettencourt and Miller (1996) [11] show through a meta-analysis that while unprovoked males are more aggressive than unprovoked females, this difference is significantly reduced when both genders are provoked. In a review of the literature on gender differences, Croson and Gneezy (2009) [12] note many observed differences between men and women that are consistent across the data; however, the data on gender differences in public good contributions is mixed. They state that some studies show that women are more pro-social in a public goods game than men (e.g., Seguino, Stevens, and Lutz, 1996 [13]), whereas other studies find the opposite (e.g., Brown-Kruse and Hummels, 1993 [14]; Sell and Wilson, 1991 [15]; and Solow and Kirkwood, 2002 [16]). The authors note that psychological research indicates that women are more sensitive to social cues and therefore may respond differently depending on the experimental design. In my study, I look at how emotions affect behavioral responses to a tournament environment, specifically when these emotions are connected to the other individuals in the tournament.
Combining gender differences and tournament performance, Gneezy, Niederle, and Rustichini (2003) [17] demonstrate that males respond more strongly than females to a tournament environment by increasing effort while female effort remains unchanged or decreases across piece-rate versus tournament environments. Similarly, in a study of elementary school children, Gneezy and Rustichini (2004) [18] assess the running speed of boys and girls in both competitive and noncompetitive environments. They find no difference in running speed between boys and girls in the noncompetitive environment, but do find a significant increase in the running speed of the boys when presented as a competition. The running speed of the girls did not change significantly, thus creating a significant gender gap in competition performance. Additionally, in a study assessing gender differences in tournament entry decisions, Niederle and Vesterlund (2007) [19] show that, when given the option of compensation from either a piece-rate scheme or a tournament, males choose the tournament environment significantly more than females. The authors show that even when the tournament may be beneficial for high performing females, women tend to avoid competitive tasks. In contrast, a recent study by Cassar, Wordofa, and Zhang (2016) [20] finds that the gender gap in tournament selection is erased when incentives benefit one’s child such as workplace daycare as opposed to monetary. This recent study provides evidence that there may not be an actual difference in preference for competition between males and females but rather that in the right environment and with properly aligned incentives, women can be enticed to compete as vigorously as men. Additionally, a difference in beliefs about future performance may be responsible for the observed difference in tournament entry rates across genders rather than a difference in preference for competition. Using a female stereotyped task, I find no difference in tournament entry rates across genders while I do find a difference in tournament entry rates across genders using a male stereotyped task (Halladay, 2016) [21]. This suggests a difference in beliefs about future performance is the channel through which differences in tournament entry rates across genders operates.
To the best of my knowledge, Gneezy and Imas (2014) [22] is the only experiment combining emotion and tournament performance. The authors find that with a strength-based task, anger improves performance. However, their all-male subject pool does not allow for the analysis of gender differences.
2. Materials and Methods
The experiment takes place in two stages. The first stage presents a situation that can trigger feelings in the laboratory, both positive and negative, while the second stage is a tournament.3 Participants do not learn about the nature of the second stage until after the conclusion of the first stage.
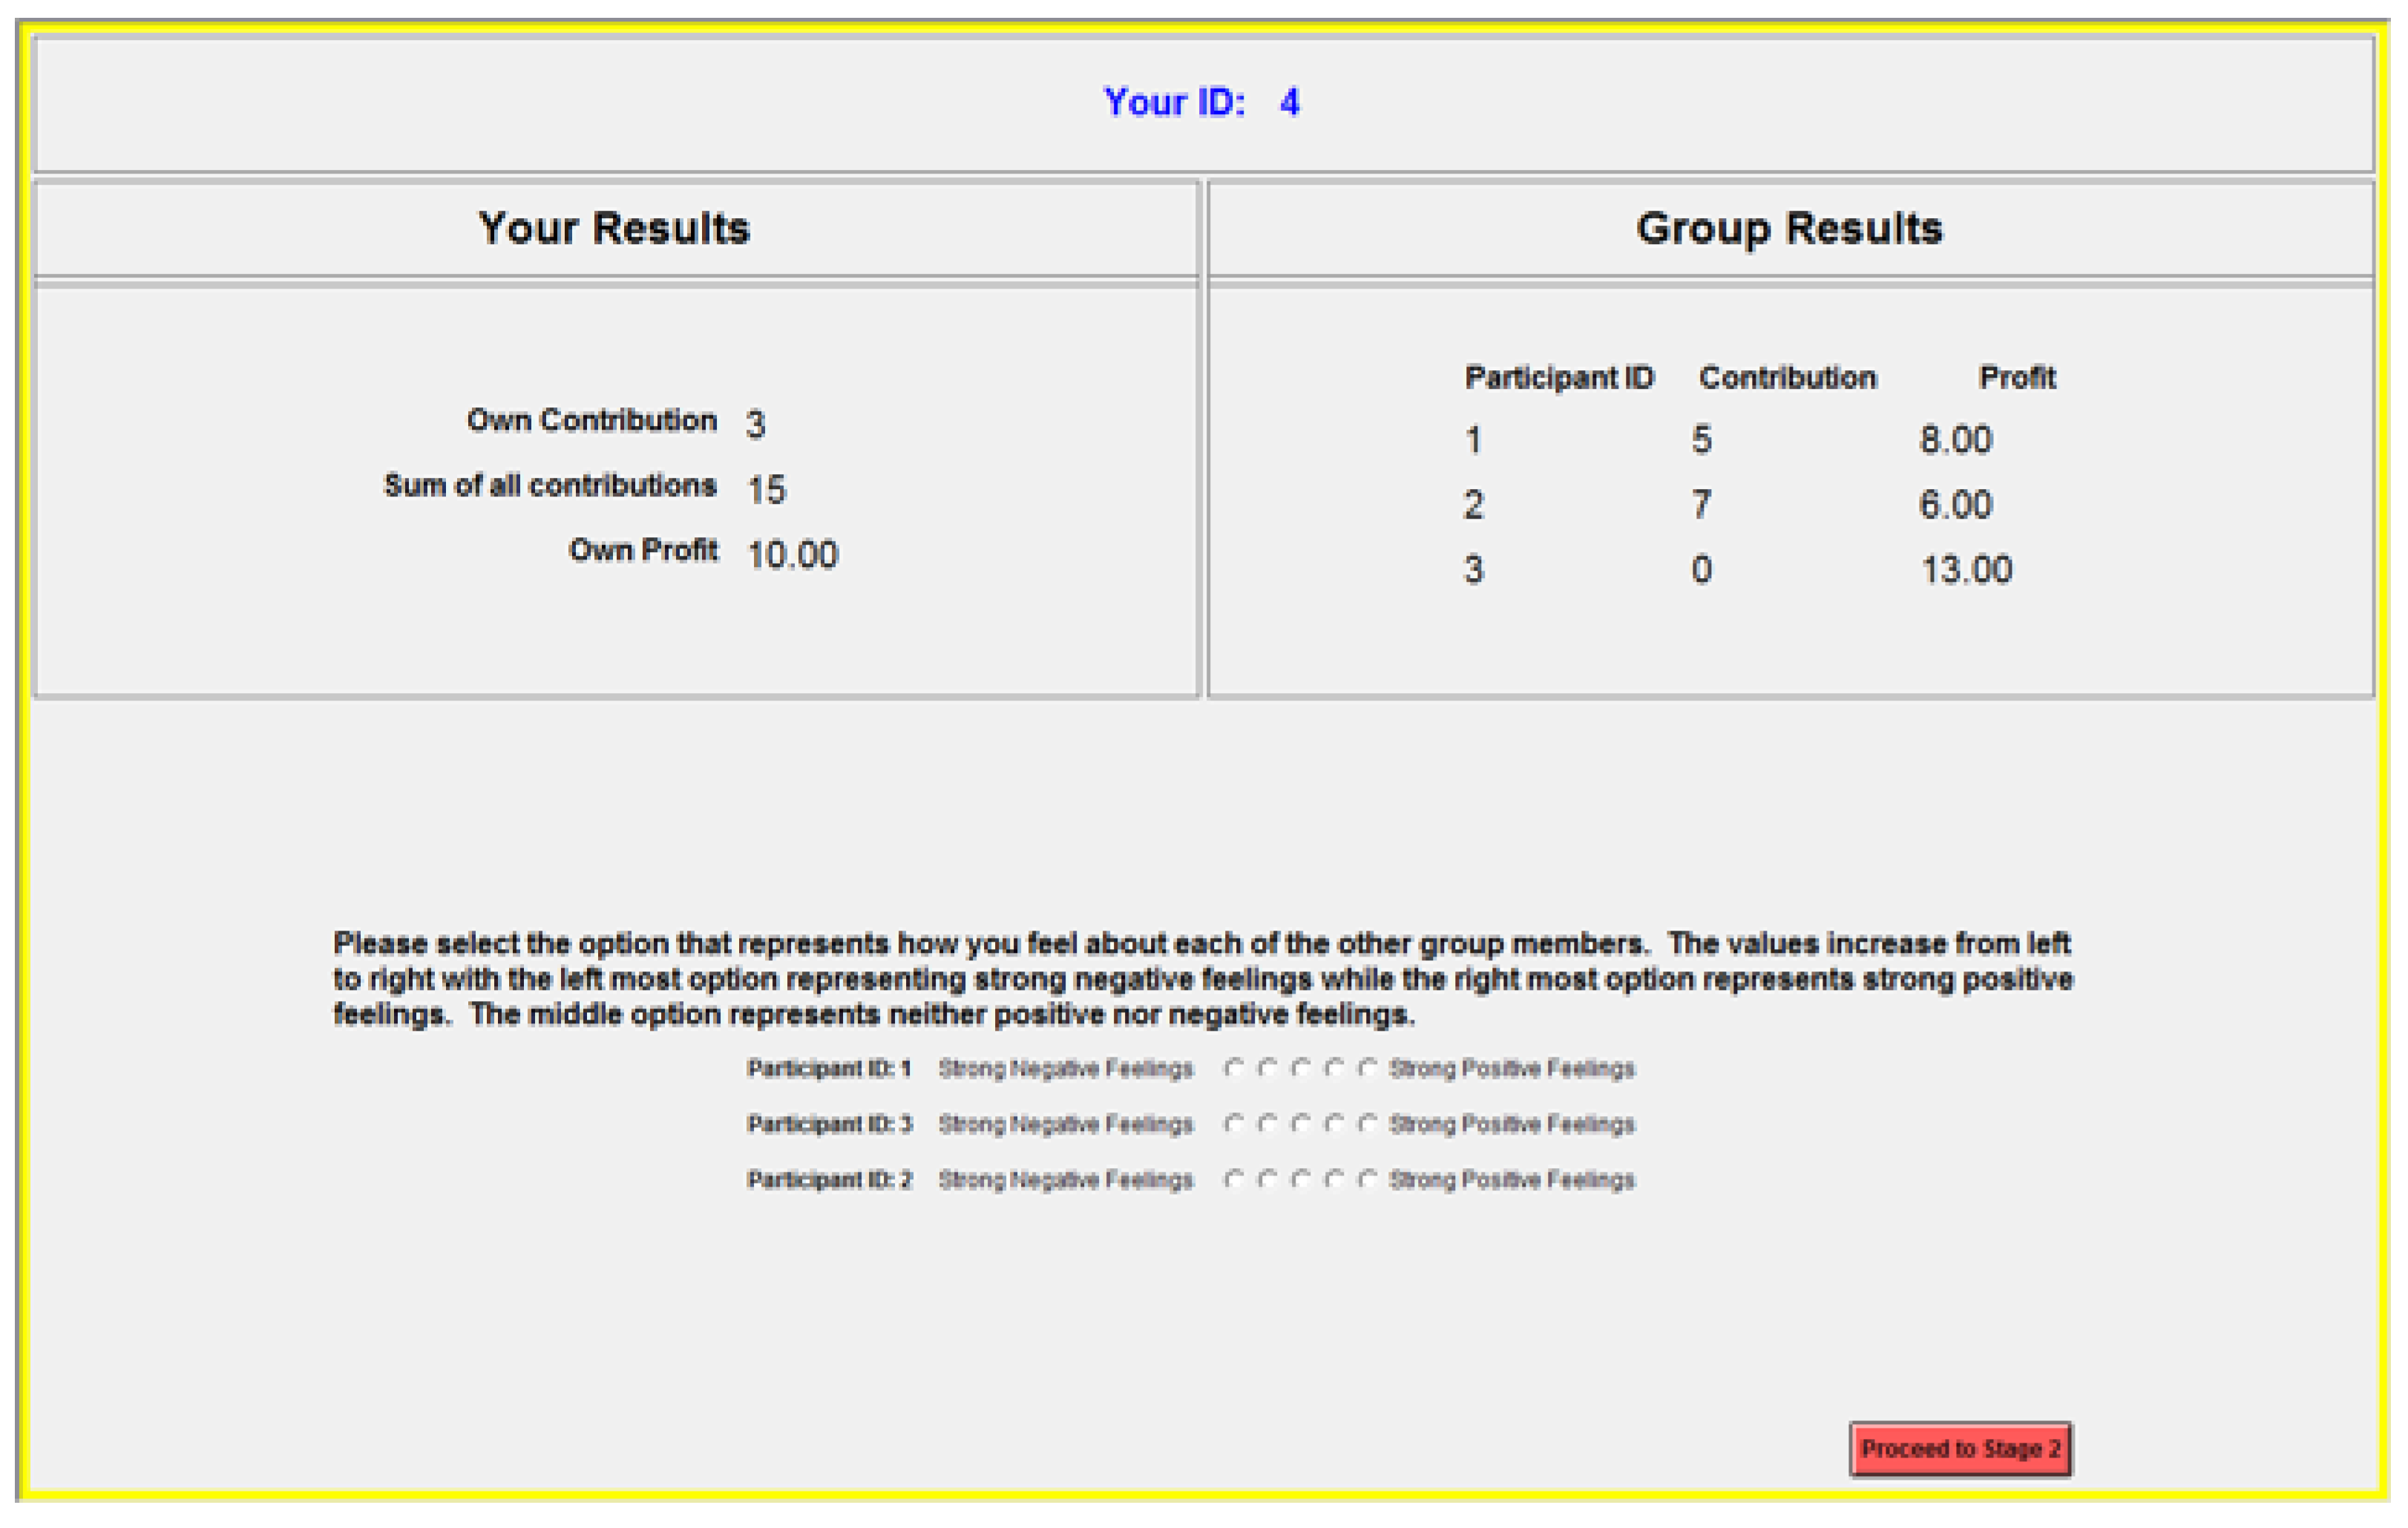
In the first stage, experimental subjects are randomly placed into groups of four to play a one-shot public goods game with voluntary contributions. Prior to the allocation stage, subjects learn how to calculate payoffs through a series of examples. Furthermore, I require that subjects successfully calculate payoffs for two hypothetical scenarios on their own before the first stage begins. Subjects start with $7.00, total contributions are multiplied by 1.6, and then distributed equally to all group members. Additionally, subjects are told that all contribution decisions will be revealed to the group with identification by subject ID numbers. After allocation choices, subjects learn their own payoffs and the contributions and payoffs of the other three group members. Subsequently, subjects provide feedback about their feelings regarding the other three group members using a five-point scale. A rating of one indicates strongly negative feelings, and a rating of five indicates strongly positive feelings. A rating of three denotes neutral feelings, neither positive nor negative. I include the neutral feelings rating option in the event that a subject does not feel they can rate a group member. A screen shot of this zTree screen can be found in the Appendix.
For the second stage, I match each participant with one other participant from their original group of four for five rounds of a slider task using a tournament payment scheme (Gill and Prowse, 2013) [23]. Participants are informed about the subject ID (e.g., Person 1) of the selected individual on the instructions screen for the second stage.
I followed essentially the same procedures as Charness and Villeval (2009, AER) [24]. This design is also similar to many studies that use a matching groups protocol (e.g., Charness, 2000 [25]; Greiner and Vittoria Levati, 2005 [26]; Charness, Fréchette, and Qin, 2007 [27]).
After reading the instructions, but before beginning the tournament, I remind subjects of the results of the first stage and the ratings they assigned to each group member. In each of the five rounds, participants have 90 seconds to complete as many slider tasks as possible. A slider bar is complete if the subject slides the marker exactly to the halfway position (50). Initially, subjects see a screen displaying 48 slider bars. If the subject completes all 48 slider bars within the 90 s, I give subjects an additional 48 slider bars to complete to ensure performance is not constrained. As the round progresses, the screen displays how many sliders the subject has successfully completed. A screen shot depicting this zTree screen can be found in the Appendix. A participant wins the tournament round if he completed more slider tasks than his opponent. At the end of each round, each participant learns whether he won the tournament but not how many tasks the matched person completed. Participants were told that one of the five tournament rounds would be randomly selected for payment in addition to the public goods game payoff. If the participant won the selected round, he receives $2.50. Total payment consisted of the payoff from the first stage and the result of the tournament. Subjects earned $8.36 on average from the public goods game.
My design follows a between-subjects design. I conducted three treatments: positive feelings (PF), negative feelings (NF) and median feelings (MF). In the PF treatment, individuals were matched with the group member they rated most positively, while in the NF treatment, individuals were matched with the group member they rated most negatively. In the MF treatment, individuals were matched with the group member they rated intermediately compared to the other two group members.4 Treatments did not vary within sessions.
This experiment was programmed in z-Tree (Fischbacher, 2007 [28]). All sessions took place in the Experimental and Behavioral Economics Laboratory at the University of California, Santa Barbara. I used the University’s ORSEE system to recruit subjects, and all were current students. A total of 180 students participated. I ran a total of 12 sessions with each session having either 12 or 16 subjects (three or four groups). 64 subjects participated in the PF treatment, 72 participated in the NF treatment, and 44 participated in the MF treatment. No subject participated in more than one session or more than one treatment. Average earnings were $9.84 and each session lasted approximately 45 min. A set of instructions can be found in the Appendix.
2.1. Hypotheses
This experiment addresses two main hypotheses about how individuals behave in a competitive environment with someone with whom they have some recent experience. Rational economic theory suggests that effort in the competition should be unaffected by the results of the first stage unless first stage contributions to the public goods game are informative about the opponent’s second stage performance/effort choice. If, for example, individuals who are viewed as strongly negative are also more likely to exert higher levels of effort, opponents might respond to the higher expected effort levels by also increasing their own effort.
Will the opportunity to compete with an individual who has generated negative feelings for a subject lead to increased performance? This kind of behavior would be evidence of negative reciprocity. Previous studies show that in public goods games, individuals will punish free riders if given the chance, even when punishment is costly (Fehr and Gächter, 2000a [4]). Though this experiment does not allow for direct punishment, subjects can increase performance as a means of punishing a non-cooperator. While previous work has focused on punishment through reducing one’s own payoff, another form of punishment is increasing one’s probability of winning a tournament and thus reducing the payoff of the other individual through increased real effort. In another experiment allowing for sanctions, Fehr and Ficshbacher (2004) [29] find that negative emotions drive sanctioning decisions that promote more pro-social behavior. Additionally, Kahneman, Knetsch, and Thaler (1986) [30] find evidence of punishment through indirect reciprocity when subjects chose to forgo a larger payoff for themselves to punish an individual who had previously acted unfairly. In an experiment that allows subjects to retaliate against each other, Bolle et al. (2010) [31] find that when subjects can vent their frustration and anger, social inefficiencies are reduced. As seen in Garcia et al. (2013) [3], the history between two parties can significantly affect competitive behavior. The first stage of this experiment may indirectly draw “social category fault lines” dividing cooperators and free-riders. It is plausible to consider that given an individual’s negative feelings, these emotions may ’light a fire’, so that he may seek to ’let off steam’, or desire to reestablish dominance, all resulting in increased performance. However, I will be unable to distinguish if this observed increase in performance arises in part from being previously hurt financially by someone, or in part from being matched with someone who harms you by violating a social norm.
Previous research also demonstrates that it is much easier to find evidence of negative reciprocity than evidence of positive reciprocity. The lack of evidence of positive reciprocity in their data led Charness and Rabin (2002) [32] to not even include positive reciprocity as an explanation for behavior in their model. In an experimental labor market, Charness (2004) [33] finds strong evidence of negative reciprocity when employer-assigned wages are low, but no significant evidence of positive reciprocity when employer-assigned wages are high. Additionally, Offerman (2002) [34] provides evidence that individuals respond more strongly to negative intentions as opposed to positive intentions as the result of a self-serving bias. Individuals tend to view positive outcomes as a positive reflection of themselves while they tend to view negative outcomes as a negative reflection of others. Fehr and Gächter (2000a) [4] demonstrate through punishment in a public goods game that “...there is a large drop in punishments if an individual’s contribution is close to the average...Thus, the more an individual’s contribution falls short of the average the more she gets punished.” If low contributions are viewed more negatively, consistent with Fehr and Gächter, I hypothesize that I should only observe the increase in performance for individuals competing with someone toward whom they have strongly negative feelings. Succinctly:
Hypothesis 1.
The number of completed slider tasks will be decreasing in one’s rating of his opponent.
Gneezy and Rustichini (2004) [18], find no gender differences in speed when children run alone but do find that boys outperform girls when running in mixed-gender pairs providing further evidence that males tend to be more responsive to competitive environments. Additionally, Buser and Dreber (2014) [35] show that under a piece-rate payment scheme, men significantly outperform women in the slider task. Therefore, with the combination of the male dominant task and the competition driven male performance, I hypothesize that men will outperform women independent of emotion. To summarize:
Hypothesis 2.
The number of completed slider tasks will be higher for men than for women, holding reported emotion constant.
Lastly, previous research yields inconsistent evidence regarding which gender will be most affected by the emotions. Eckel and Grossman (2005) [36] find that women are more likely to punish unfair behavior than men. In contrast, Christensen et al. (1983) [37] find evidence that in romantic relationships, males exhibit a stronger self-serving bias, and they may be more apt to engage in negative reciprocity. Hence, there is no clear prediction about behavior in this respect.
3. Results
My subject pool was 43.64% male. Subjects contributed an average of $2.25 (32% of the endowment) during the public goods game. The average rating of feelings towards the matched opponent over all treatments was 2.9 and the average assigned rating across all group members was 2.89.5 Table 1 presents the breakdown of opponent ratings by treatment, while Table 2 presents the breakdown of opponent ratings by gender. Average tournament performance was 25.07 tasks across all five rounds.
Finding 1: Higher (lower) contributions do lead to higher (lower) ratings:
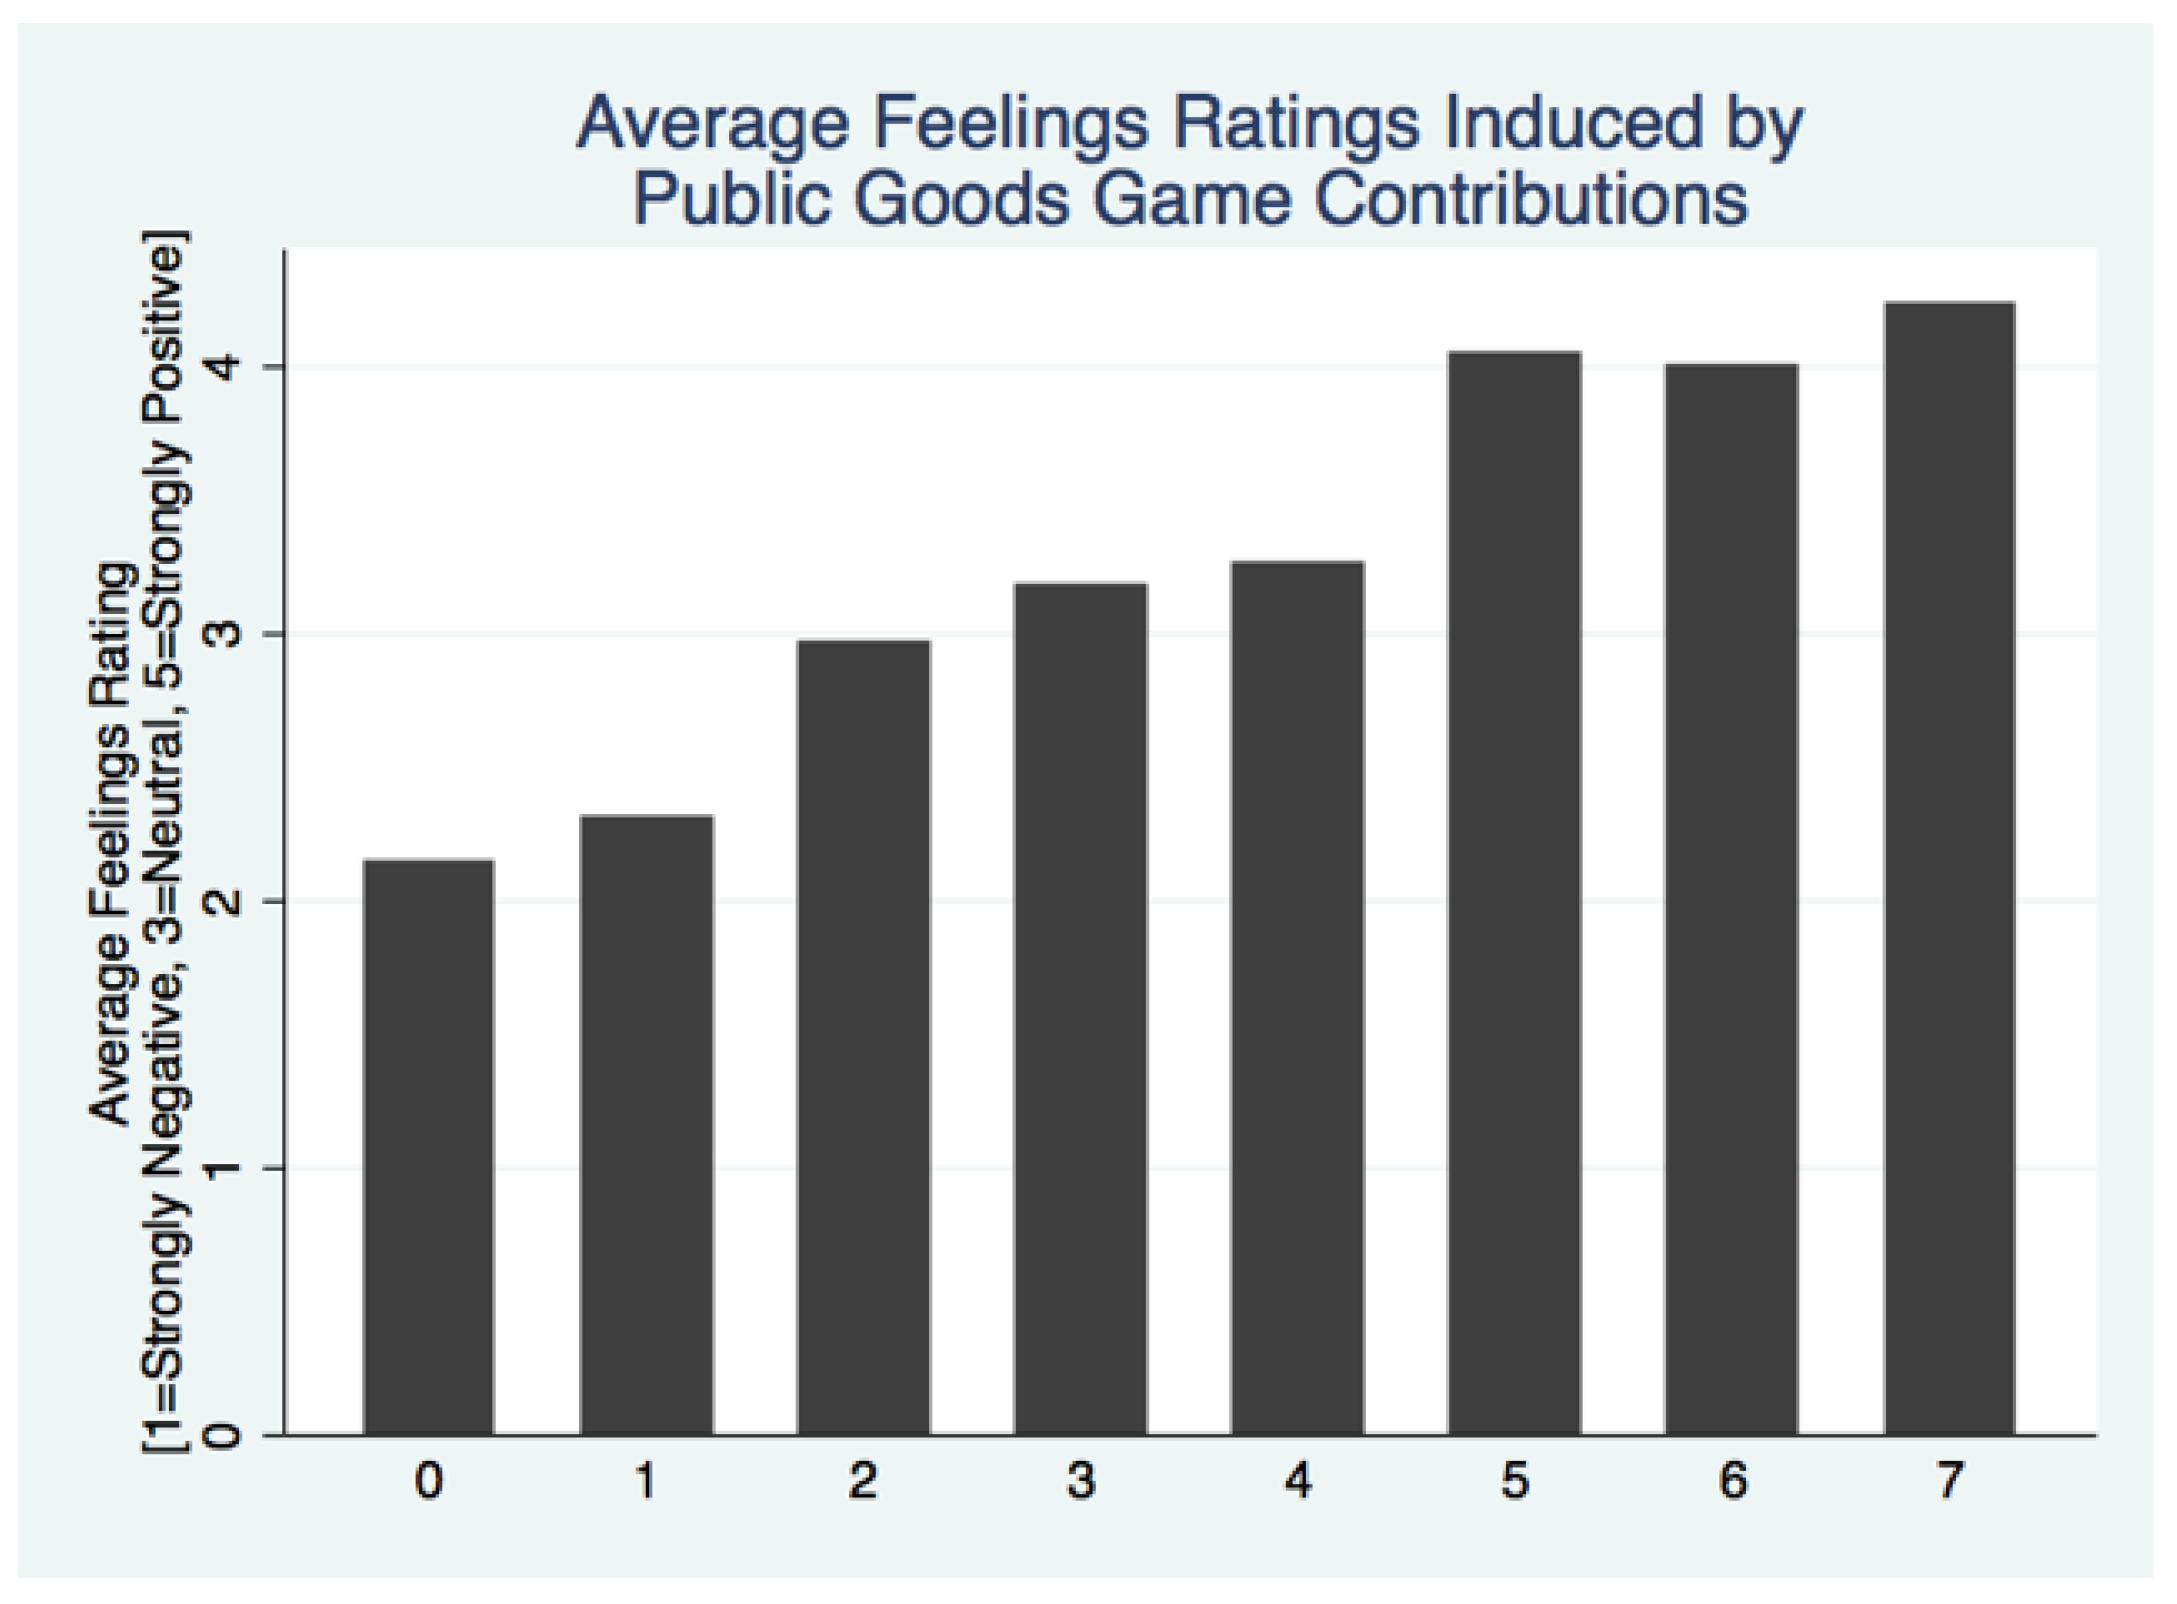
My data confirm that individuals view low contributions negatively. There is a clear positive relationship between contribution and average rating assigned as shown in Figure 1. A test of correlation between contribution and rating assignment affirms the relationship that subjects negatively view low contributions (, p < 0.0000). Using Figure 2, I check for average contribution given a rating across genders to determine if there is a gender difference when assigning ratings based on contribution levels. Confirmed by pair-wise t-tests, there is no evidence that women and men have different thresholds for assigning a specific rating. Figure 3 suggests that contributions that fall below the group average are viewed negatively, while contributions matching or exceed the group average are viewed positively, further evidence that lower contributions lead to lower ratings.
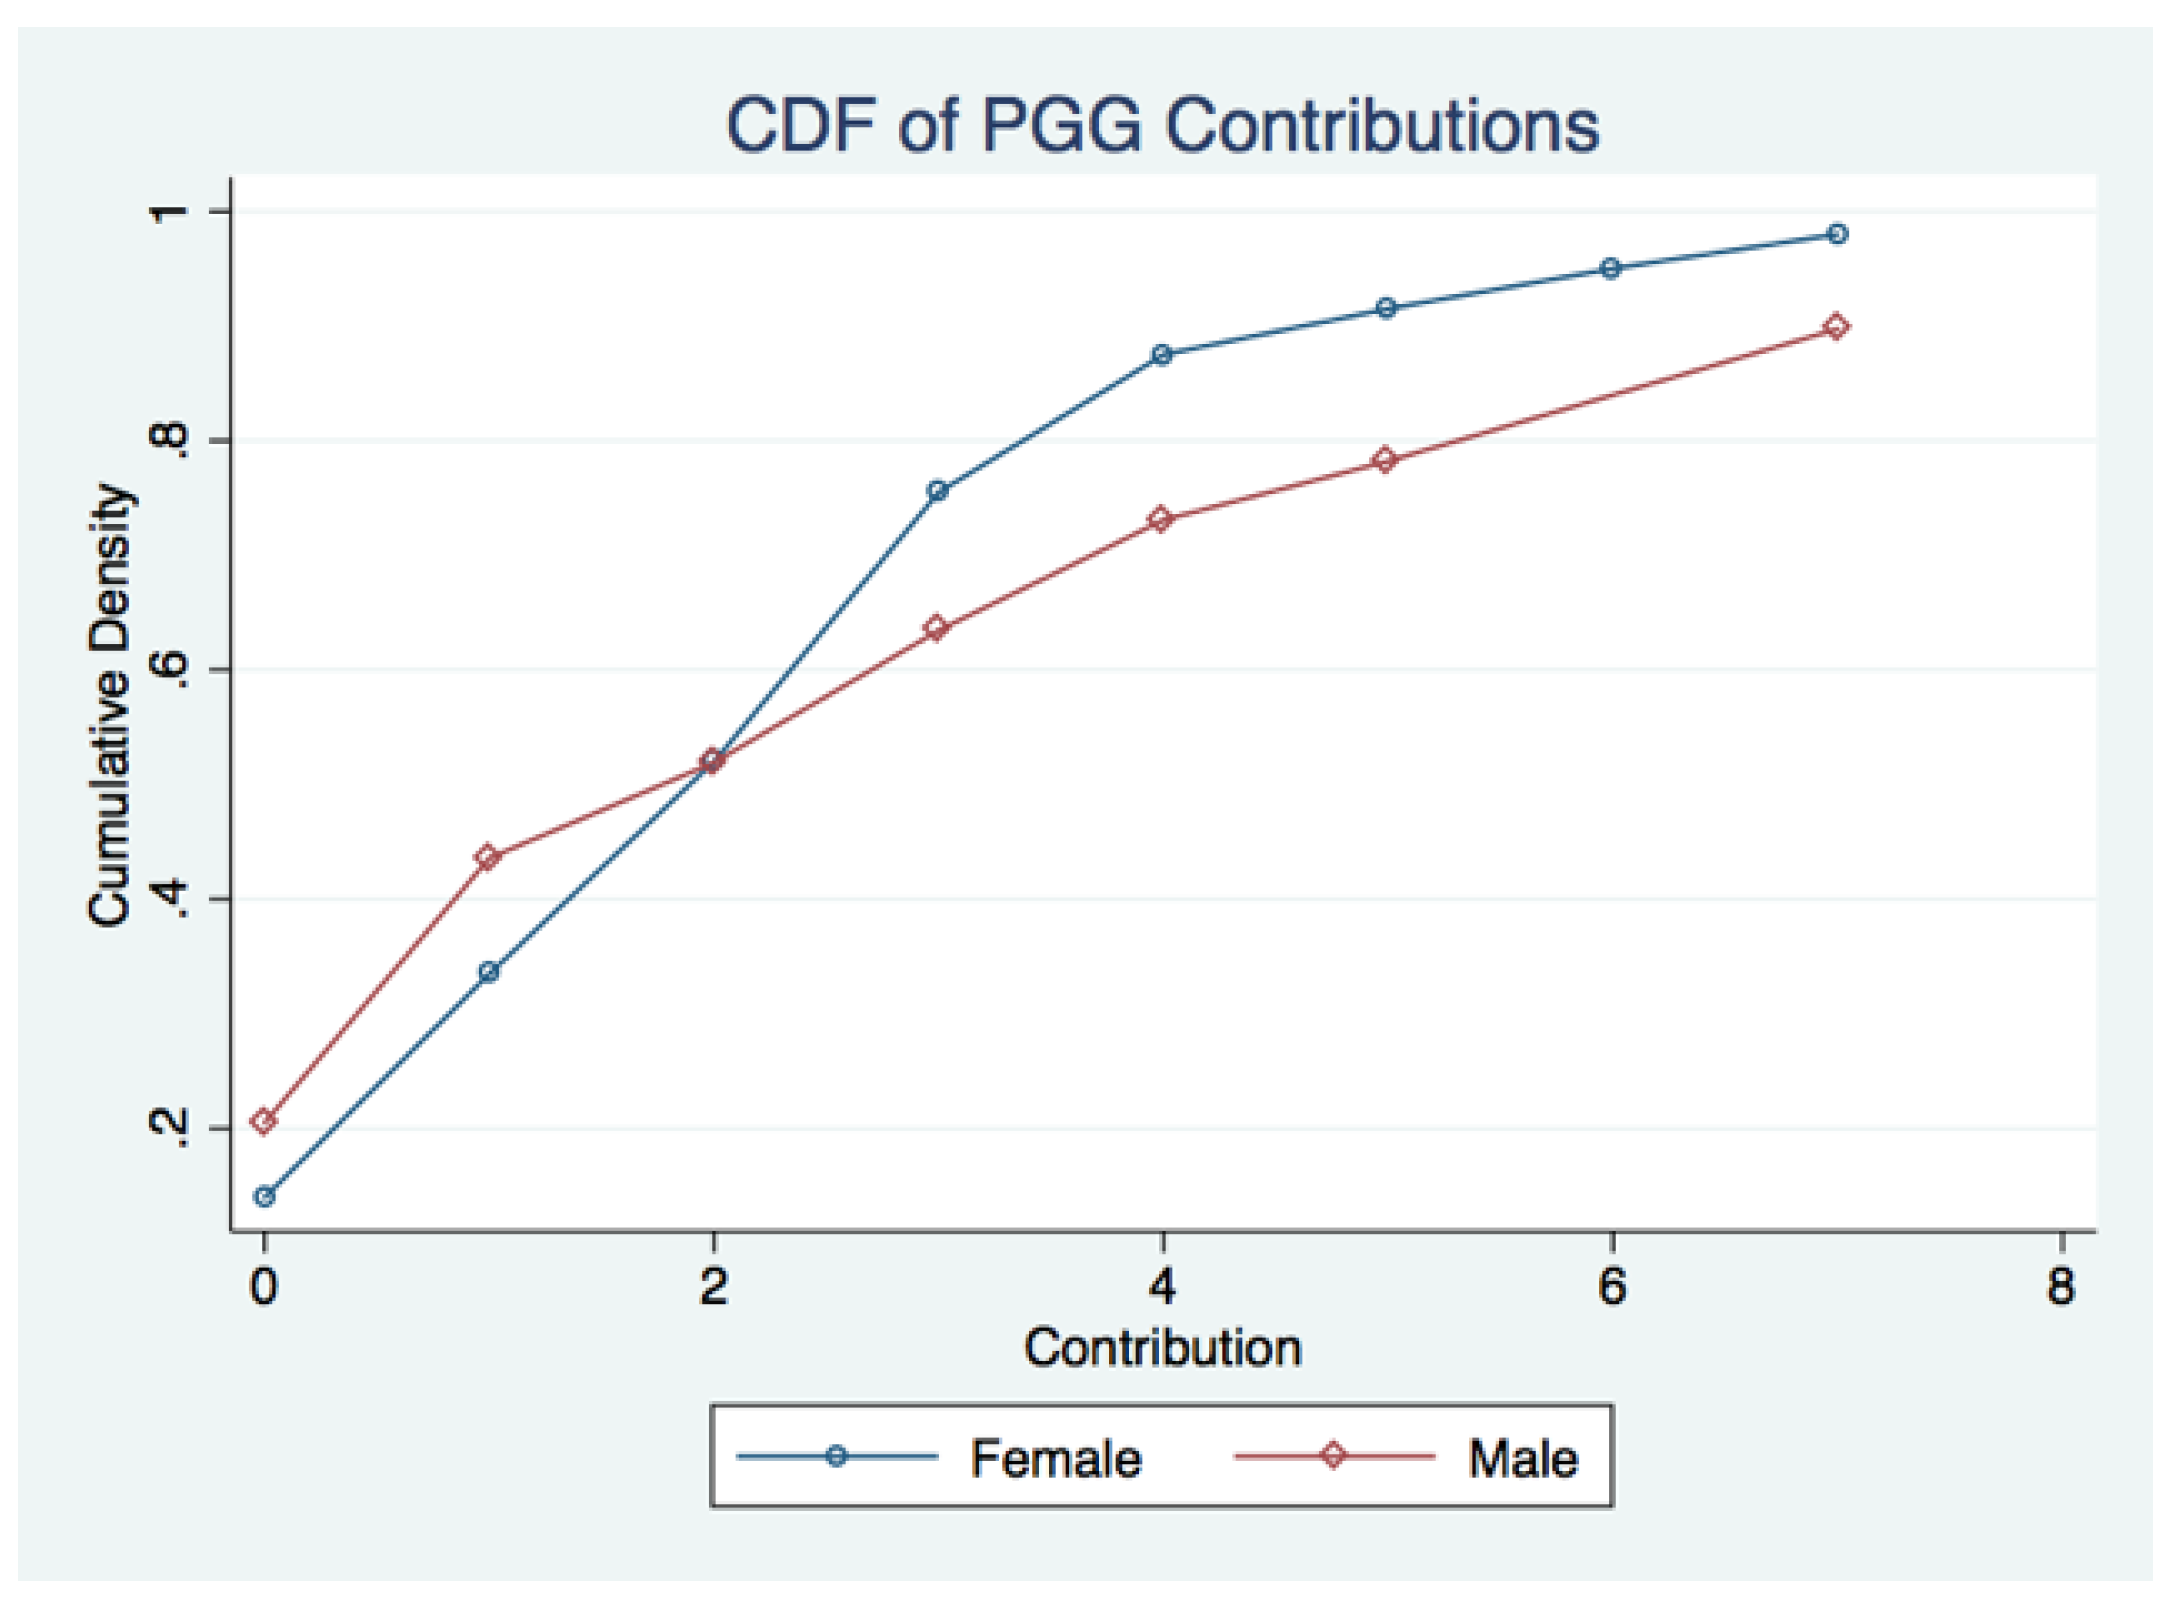
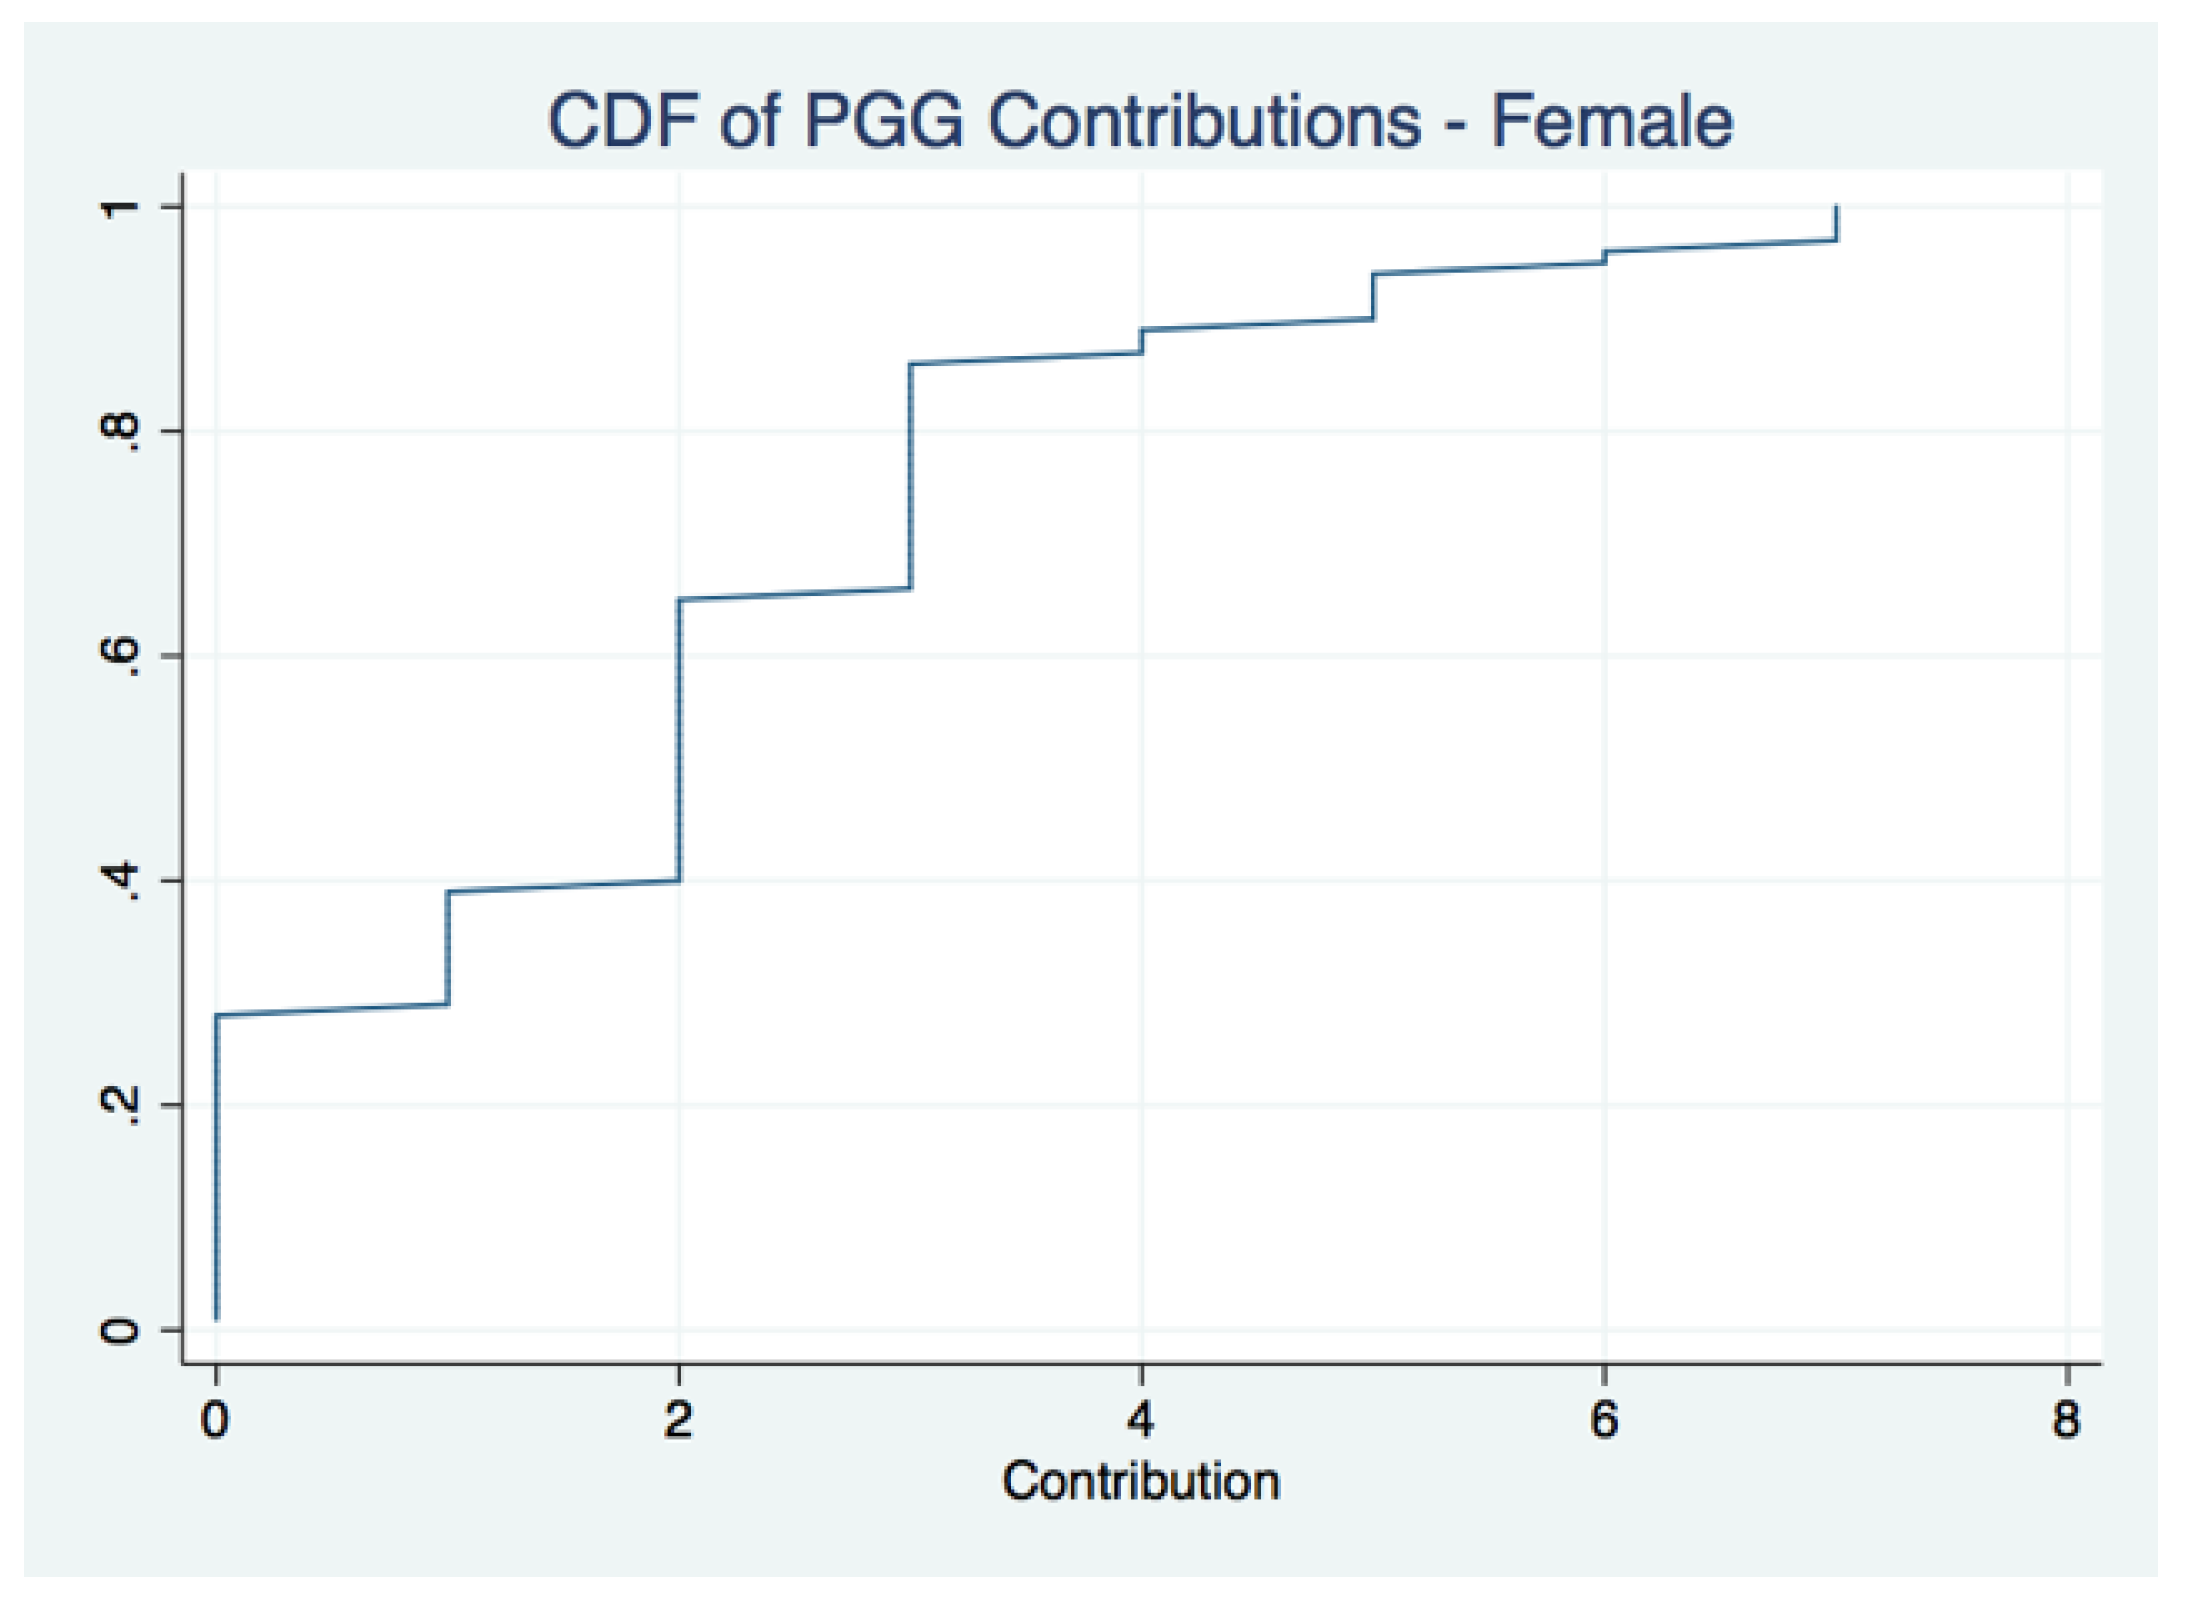
Figure 4 illustrates that there is also no gender difference in contributions to the first stage public goods game. A Kolmogorov-Smirnov test used to detect a difference in the distribution of public goods game contributions for men and women is not significant (p = 0.147) and therefore there is no evidence that there exists a gender difference in the distribution of contributions. Furthermore, a test of the equality of means for average public goods game contributions can also not be rejected (p = 0.170). I find no evidence that average contributions differ across genders.
Because subjects receive feedback between tournament rounds, the forthcoming analysis will proceed using only data from the first period in order to avoid learning and feedback effects. Dechenaux et al. (2015) [38] note that research on feedback in tournaments is complicated and varied. There is no set conclusion on the effect of feedback across all experimental environments. In fact, the effect of feedback is quite sensitive to the specific environment including incentive structure, timing of feedback, structure of feedback, number of rounds, etc. For example, Gneezy and Rustichini (2004) [18] demonstrate that in the presence of relative performance feedback, the performance of boys increased while the performance of girls was unaffected. Using International Tennis Federation data, David Wozniak (2012) [39] finds that while males are influenced by performance over many periods and their behavior seems to reflect a belief in a “hot hand”, females are influenced by their most recent tournament performance. Additionally, previous work in psychology has shown that women view their success as the result of good luck while men view their success as the result of their own ability. Further, research has shown that emotional responses tend to die out over time, and therefore the all period analysis may fail to capture the behavioral responses tied to the reported emotions. Grimm and Mengel (2011) [40] find that low ultimatum game offers are accepted 60 to 80% of the time when subjects are given a ten minute delay prior to the rejection decision, whereas these low offers are only accepted 20% of the time without a delay. An additional concern about the confounds of the all period analysis is that it will be impossible to disentangle the behavioral responses due to the first stage induced emotions and the behavioral responses due to the feedback induced emotions. Not only will the emotions from the first stage diminish, but it will be unclear when and to what extent the feedback emotions take over.6 While the results using only period one and all five periods are relatively consistent, it is clear that the results from all five rounds are potentially confounded due to the between round feedback and the time elapsed.7
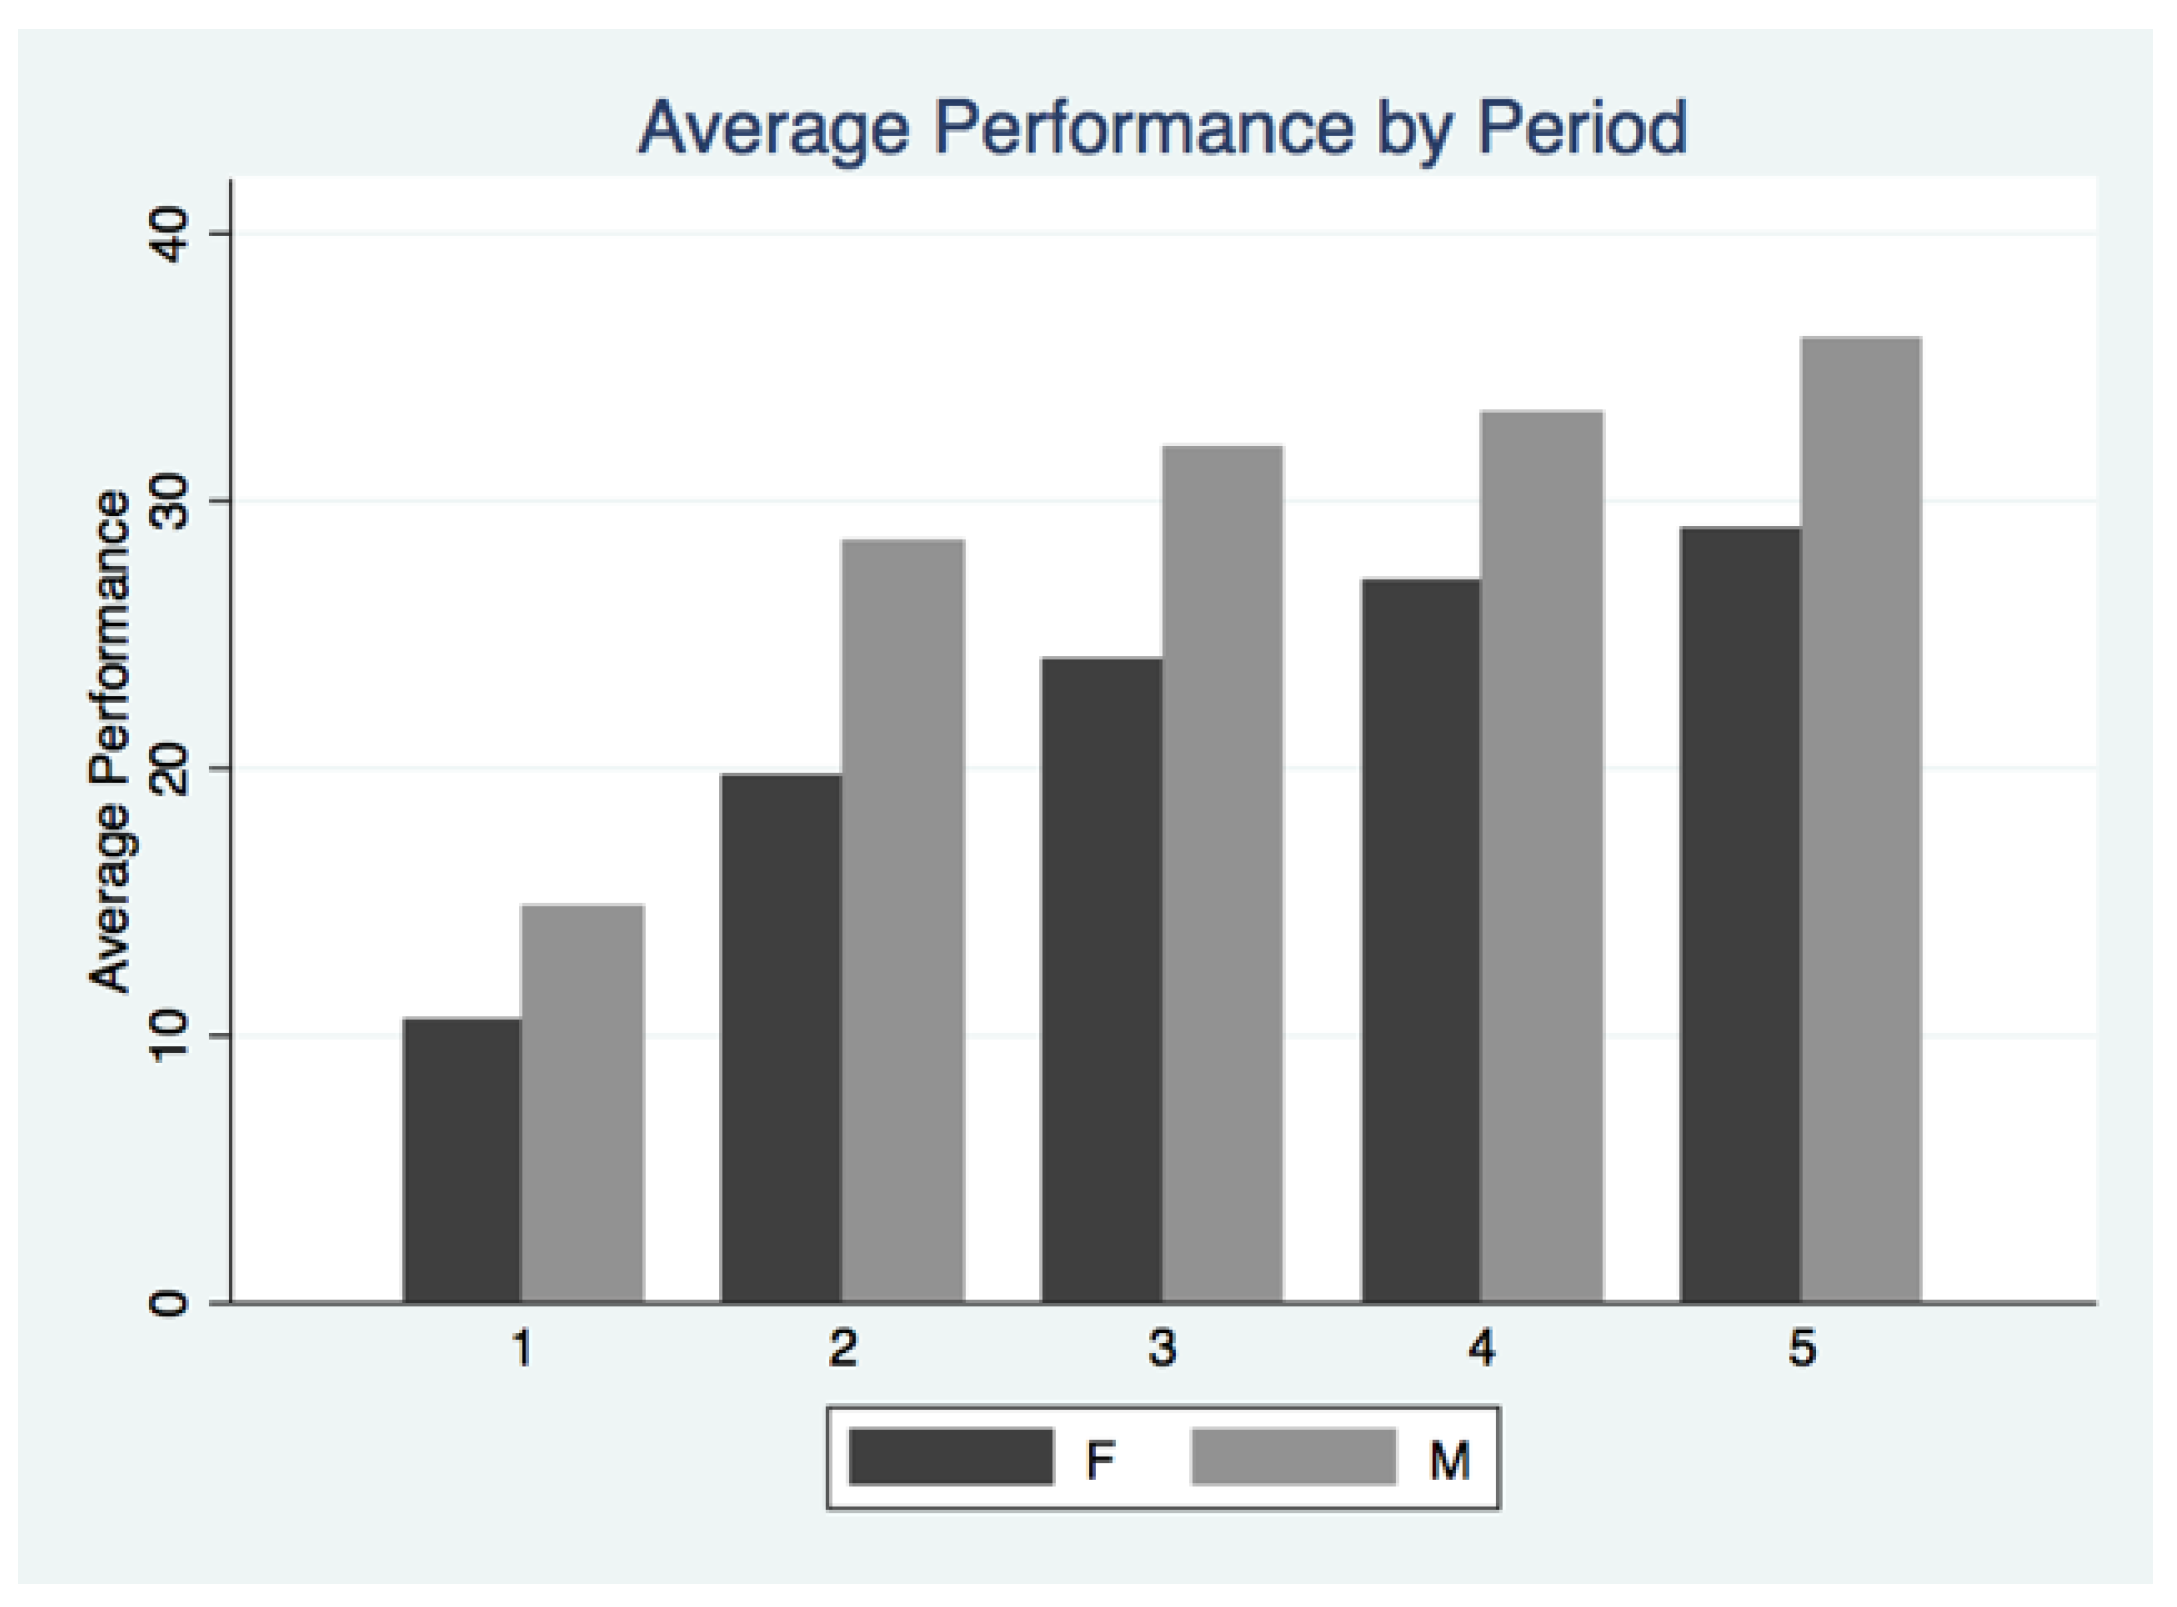
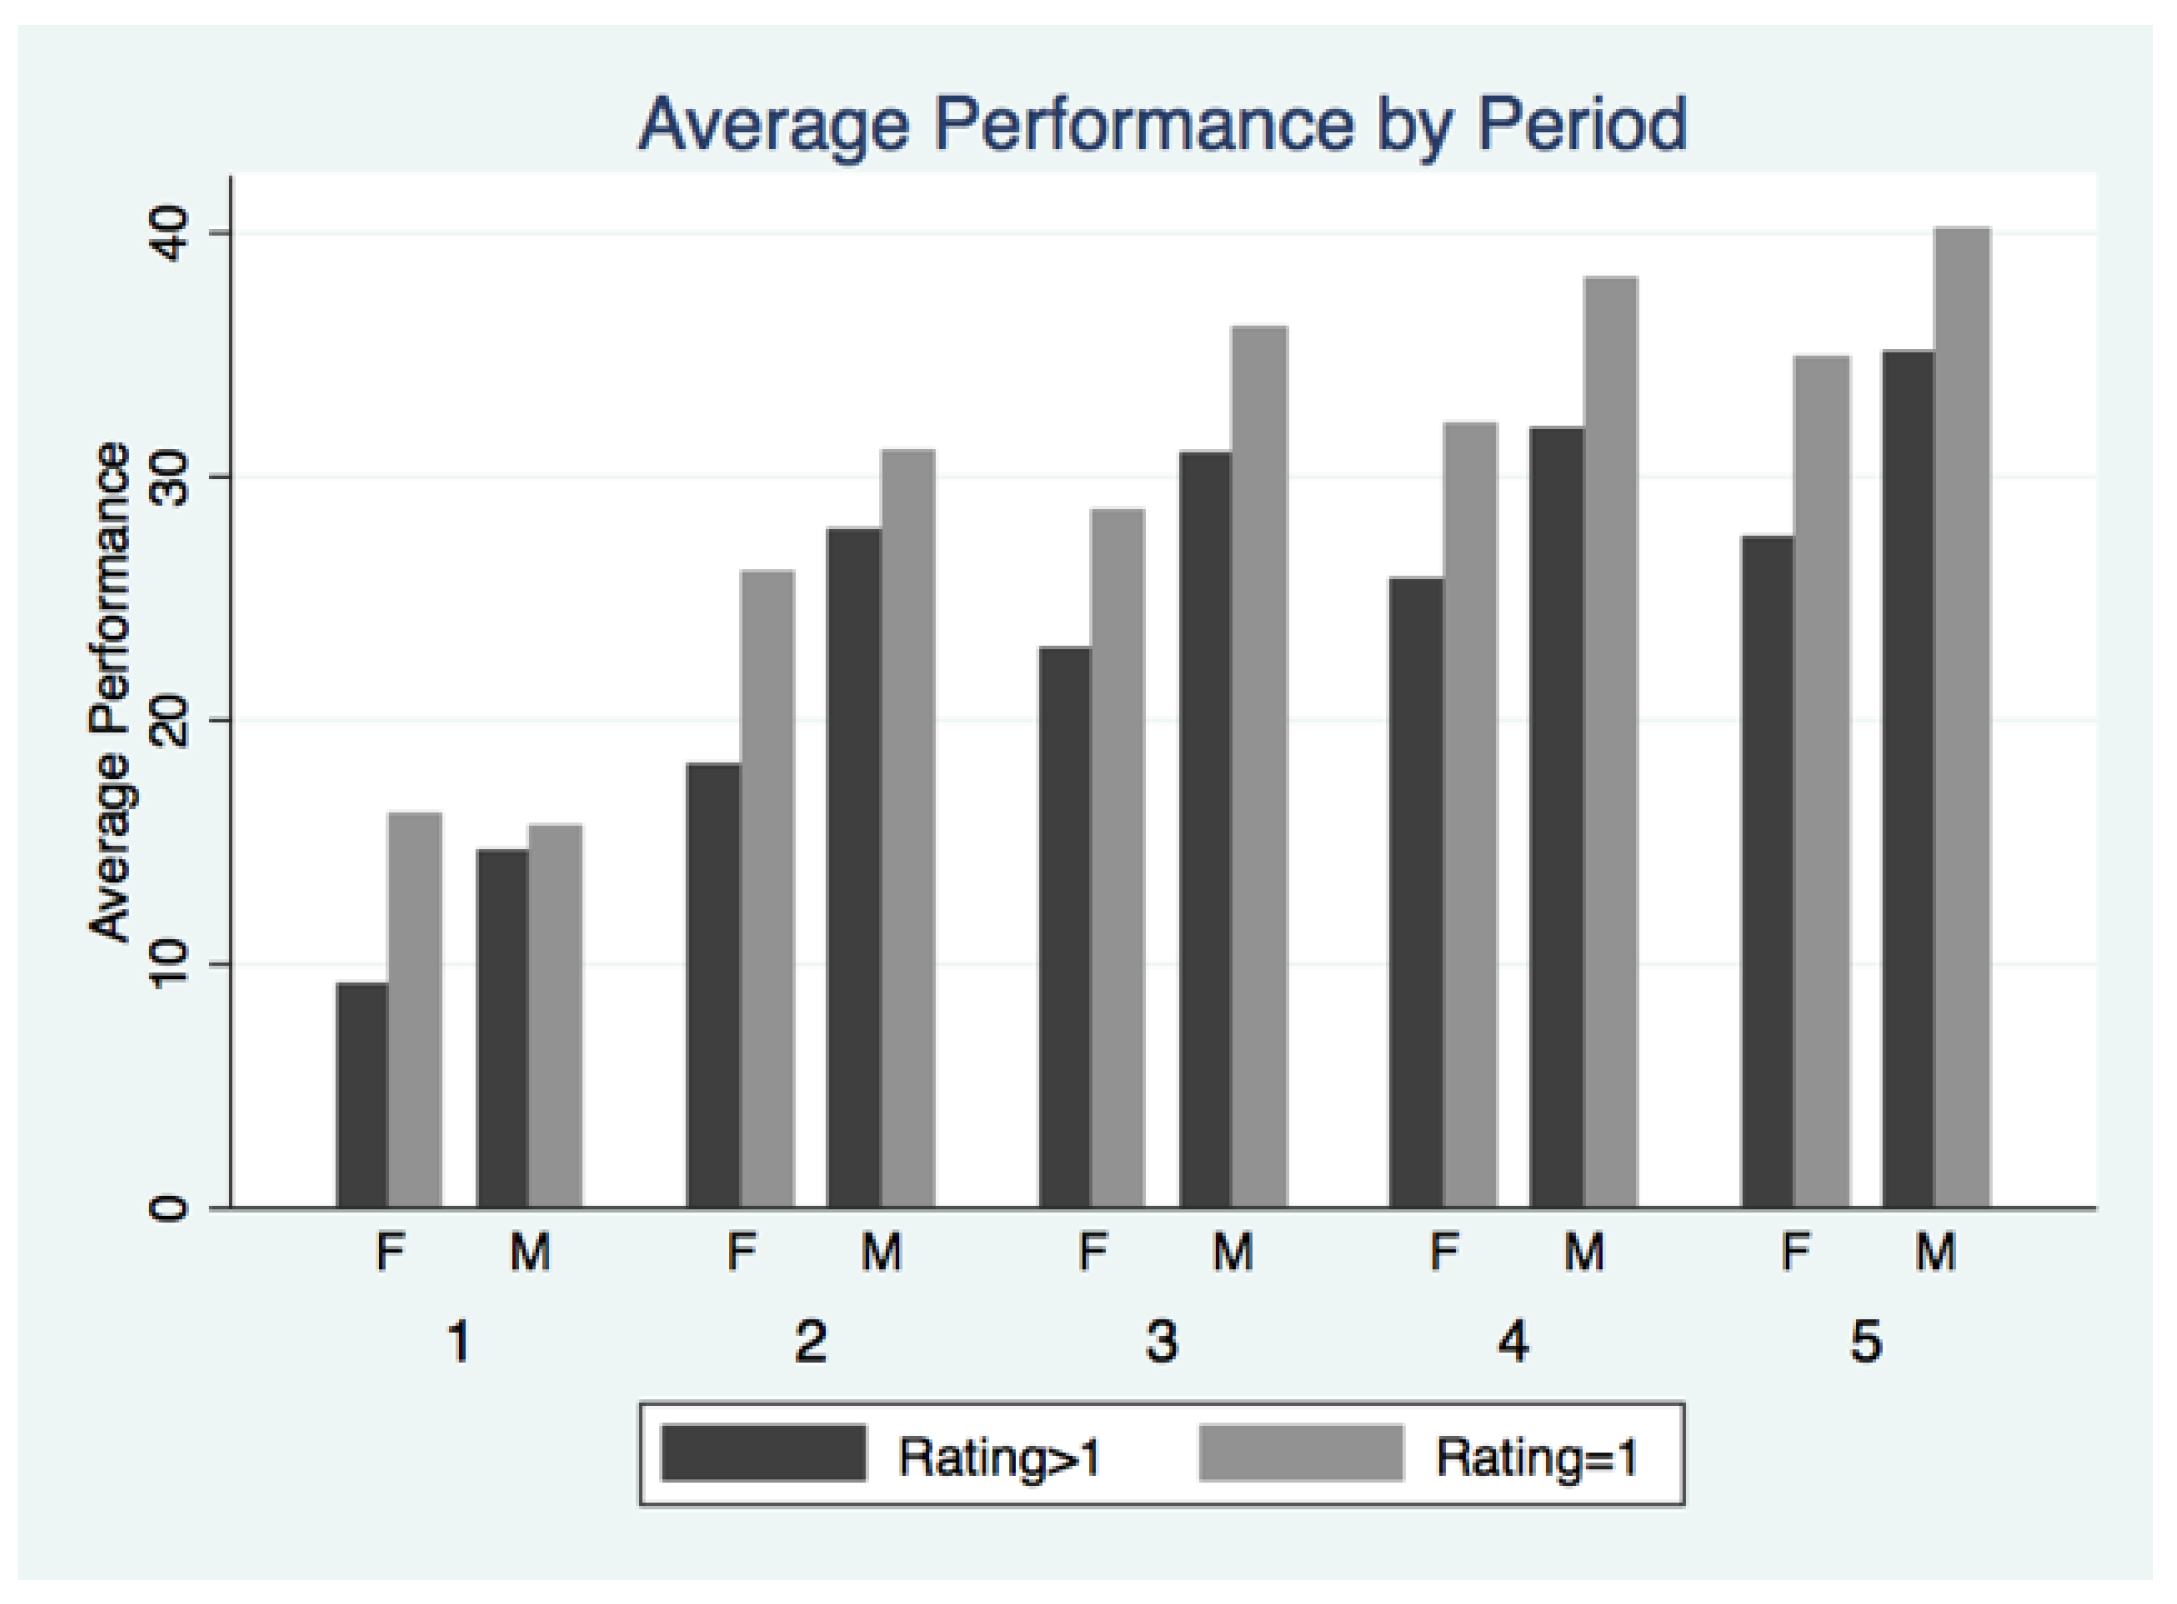
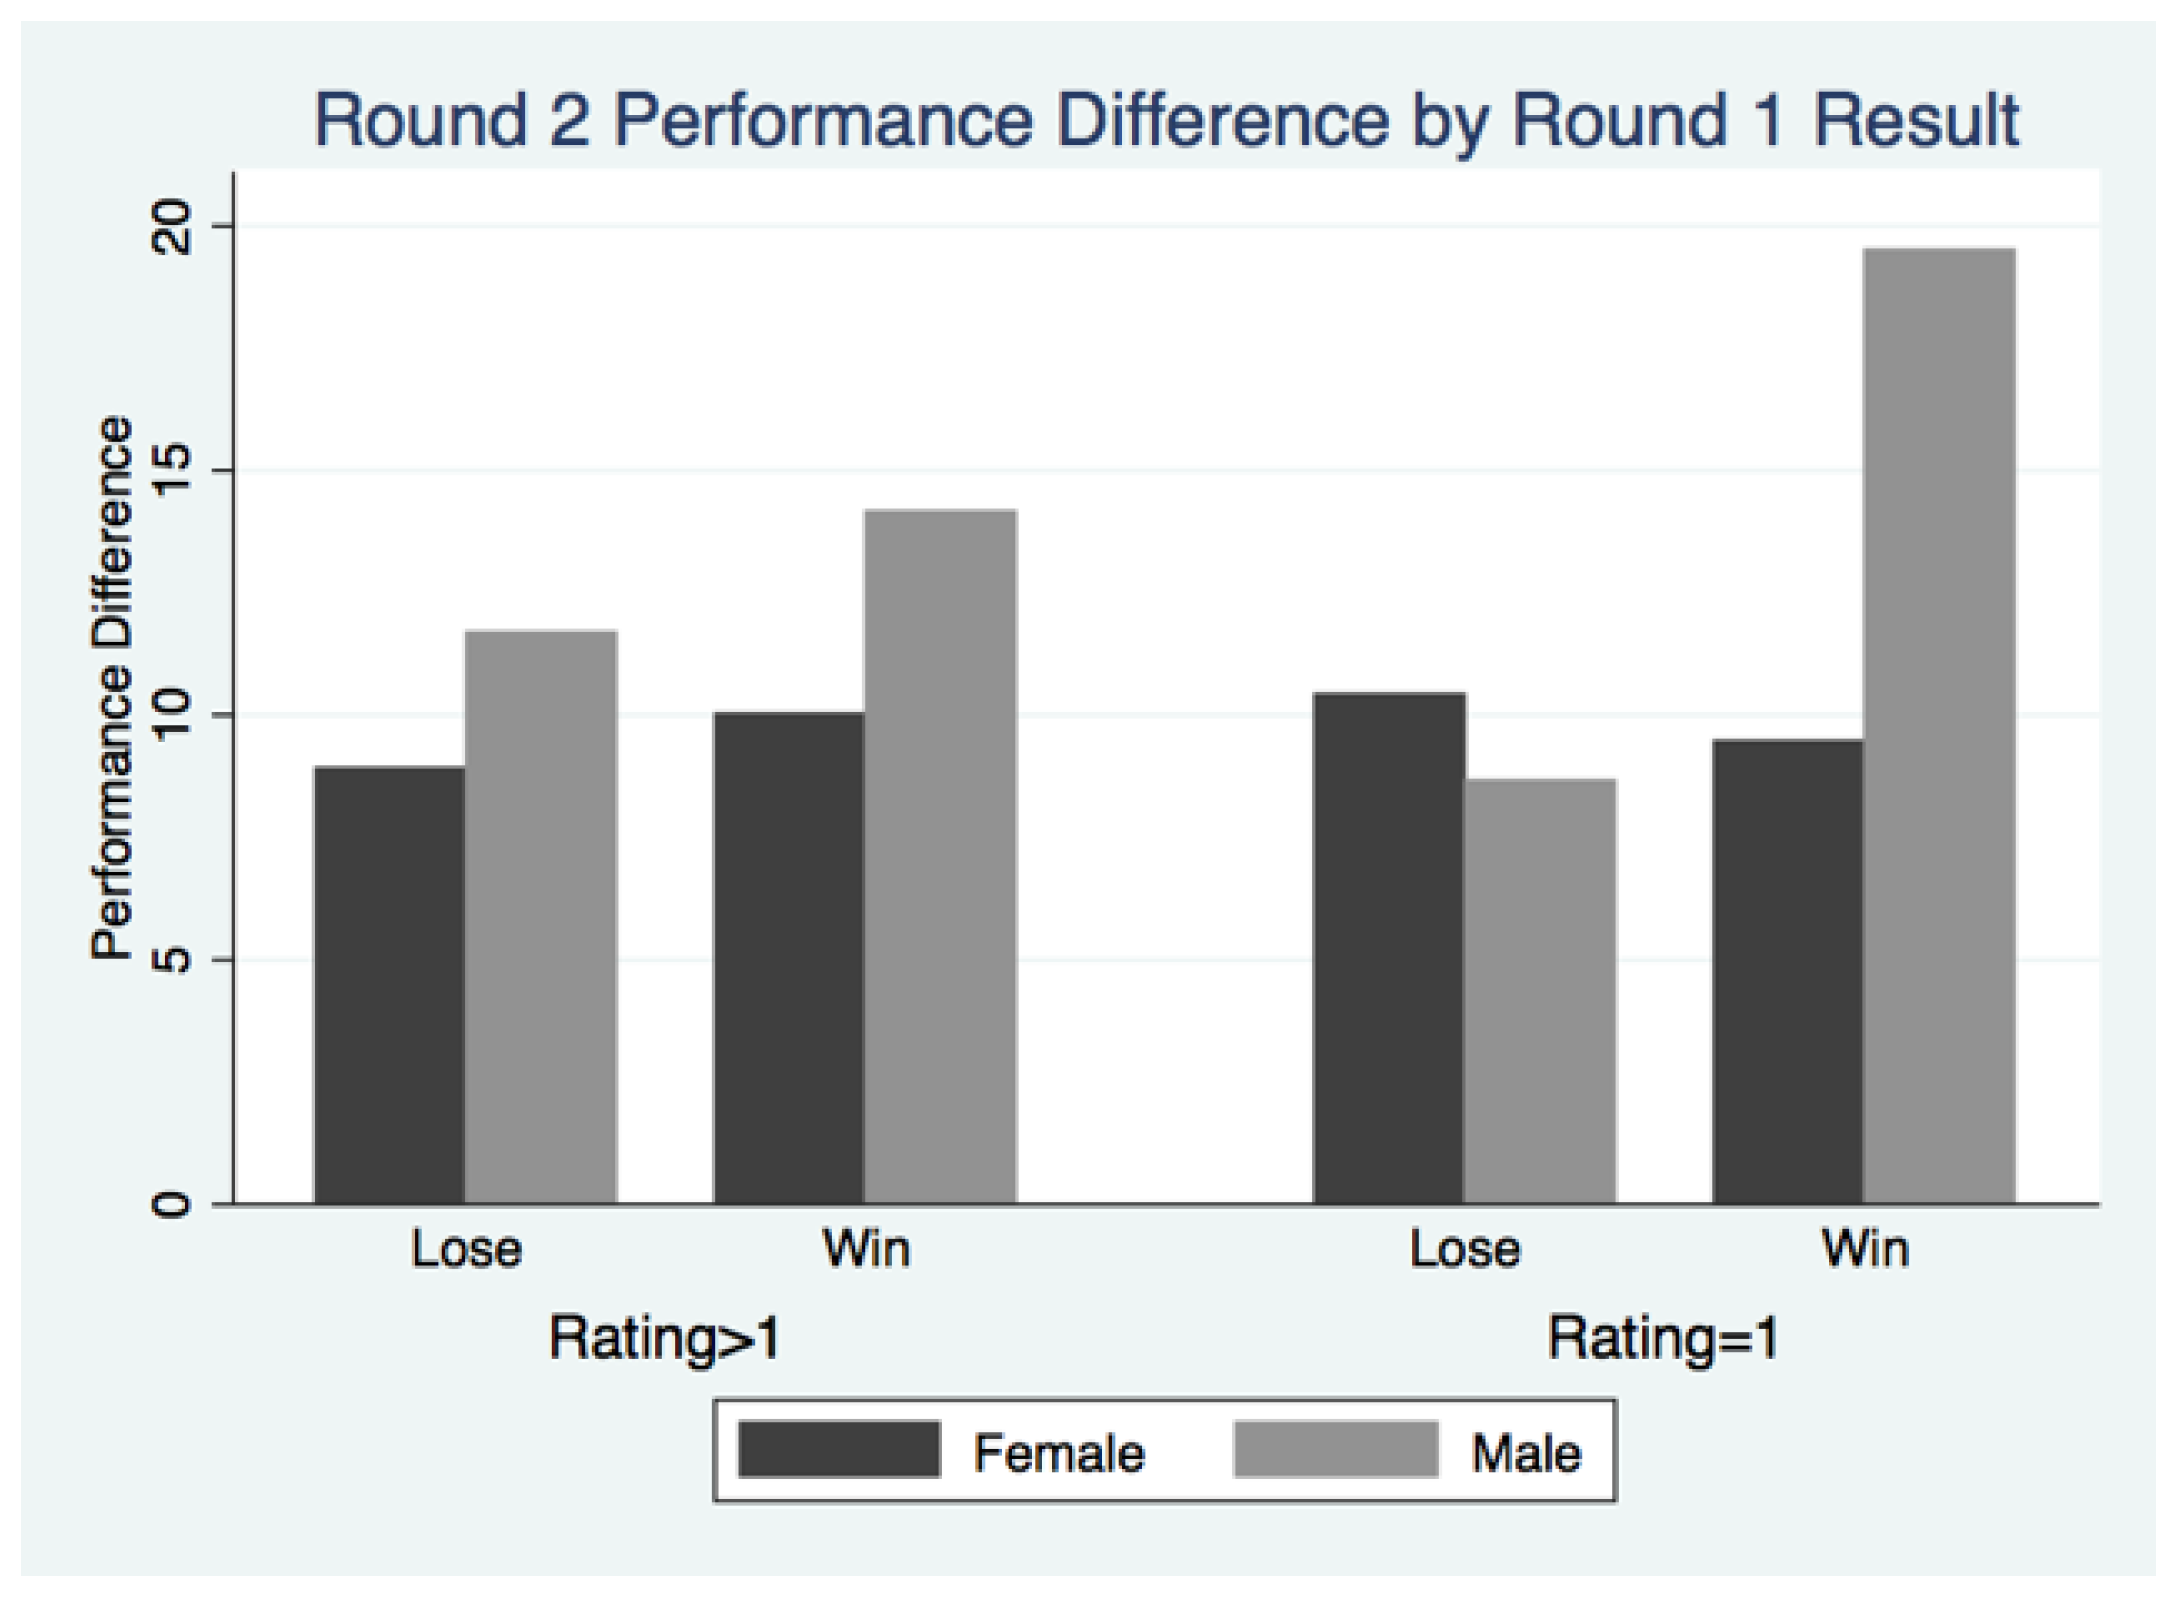
As illustrated in Figure 5 and Figure 6, men significantly outperform women in every round when aggregating all subjects regardless of opponent rating. For subjects with an opponent rated strongly negative, there is no statistically significant gender gap in performance for each round. For the subjects without an opponent rated strongly negative, men outperform women in every round. Because of the between round feedback, interpreting the evolution of performance across rounds can be very complex as one needs to control for the history of feedback. For this specific study, I do not have a sufficient number of observations to fully separate individuals by the entire feedback history and then provide meaningful analysis. Instead, I will focus on the behavioral responses in Round 2 after subjects receive their first between round feedback.8 Figure 7 depicts the results for Round 2 and illustrates the varying responses to feedback across genders. Similar to the finding of Gneezy and Rustichini (2004) [18], men increase performance in Round 2 after the feedback significantly more than women (p = 0.002). When paired with a liked individual, men and women respond similarly regardless of relative performance feedback (p = 0.610 and p = 0.452). When paired with a disliked individual, women respond similarly regardless of the relative performance feedback (p = 0.767). When paired with a disliked individual, men who win Round 1 significantly increase effort in the next round compared to men who lost round 1 (p = 0.038). These results further emphasize the contamination concerns of the all-period analysis. The remaining analysis using all five rounds is available in the Appendix.
While Table 3 illustrates there is an effect when running the regression analysis using the randomly assigned treatment, the effects are weaker because, as shown in Table 1, there are still subjects matched in the tournament with an individual assigned the strongly negative rating despite being in the MF or PF treatments. Therefore, using the treatment variable is a much noisier, however still significant, signal of reported feelings.9 The average opponent rating in the NF treatment was 2.06, 3.12 in the MF treatment, and 3.73 in the PF treatment. All three of these pair-wise tests of the equality of means are significant (p ≤ 0.008). It does appear that the treatment captured a difference in opponent ratings but is clearly a noisier signal. The remaining analysis will group data into bins by assigned opponent rating as opposed to treatment.10
Finding 2: Performance is higher for individuals competing with someone rated as strongly negative:
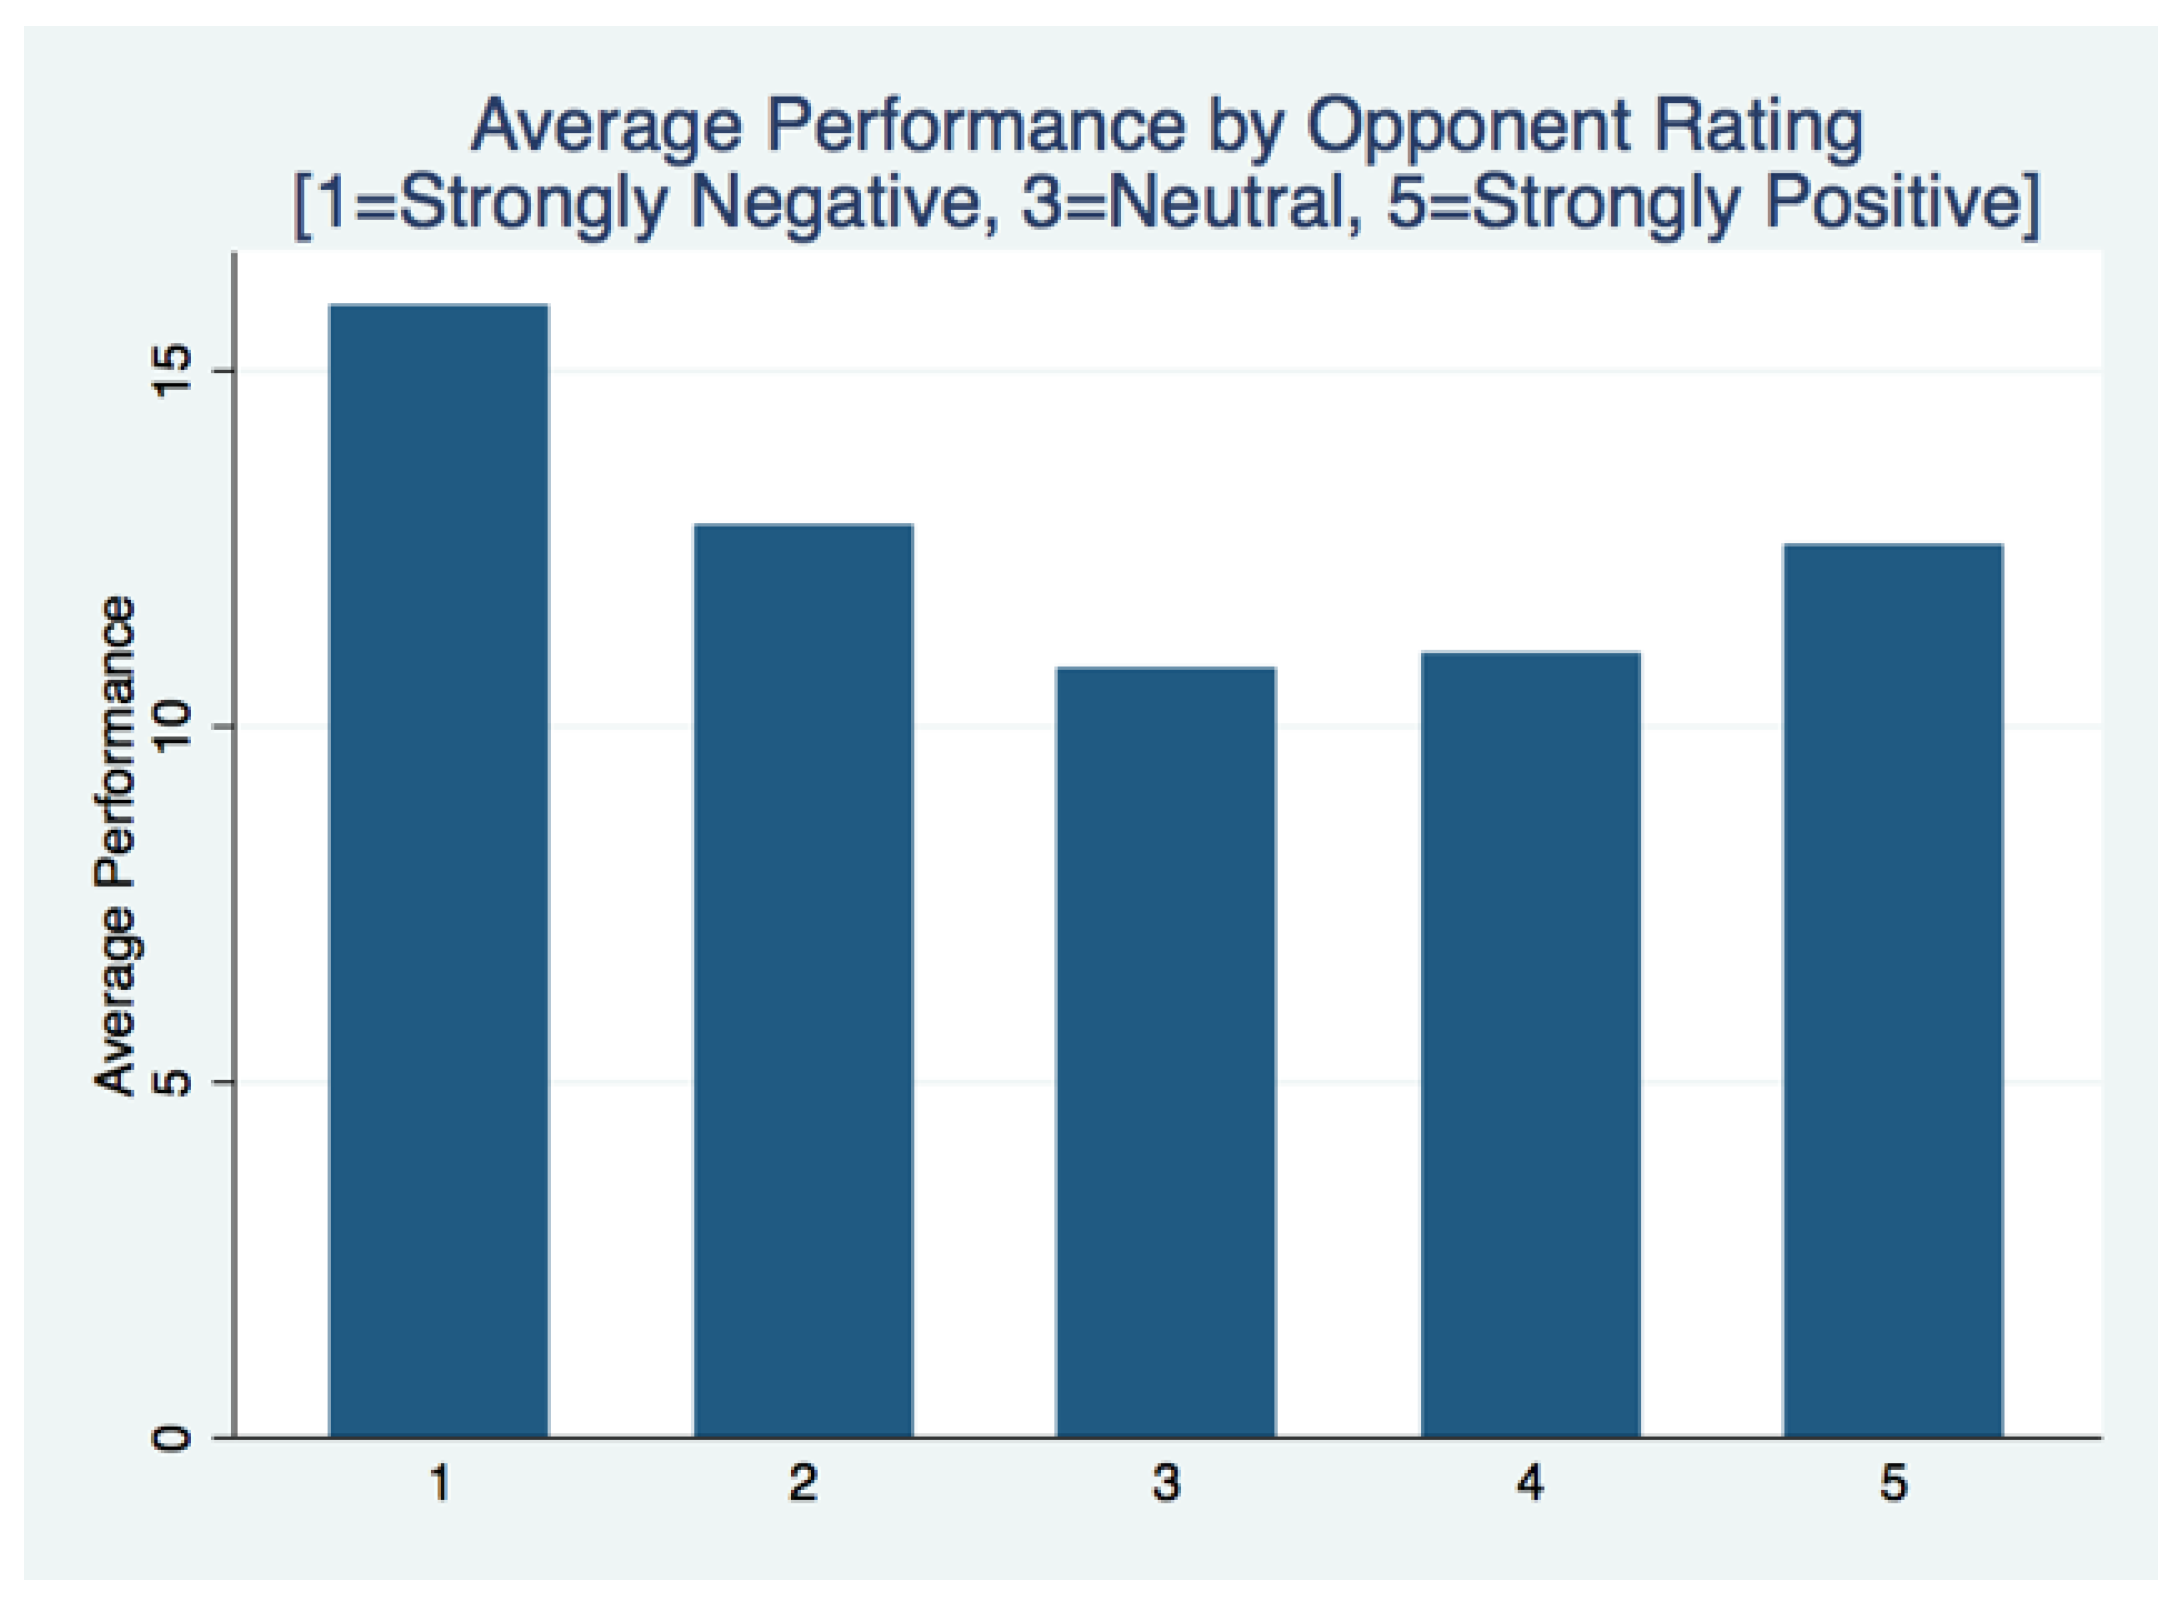
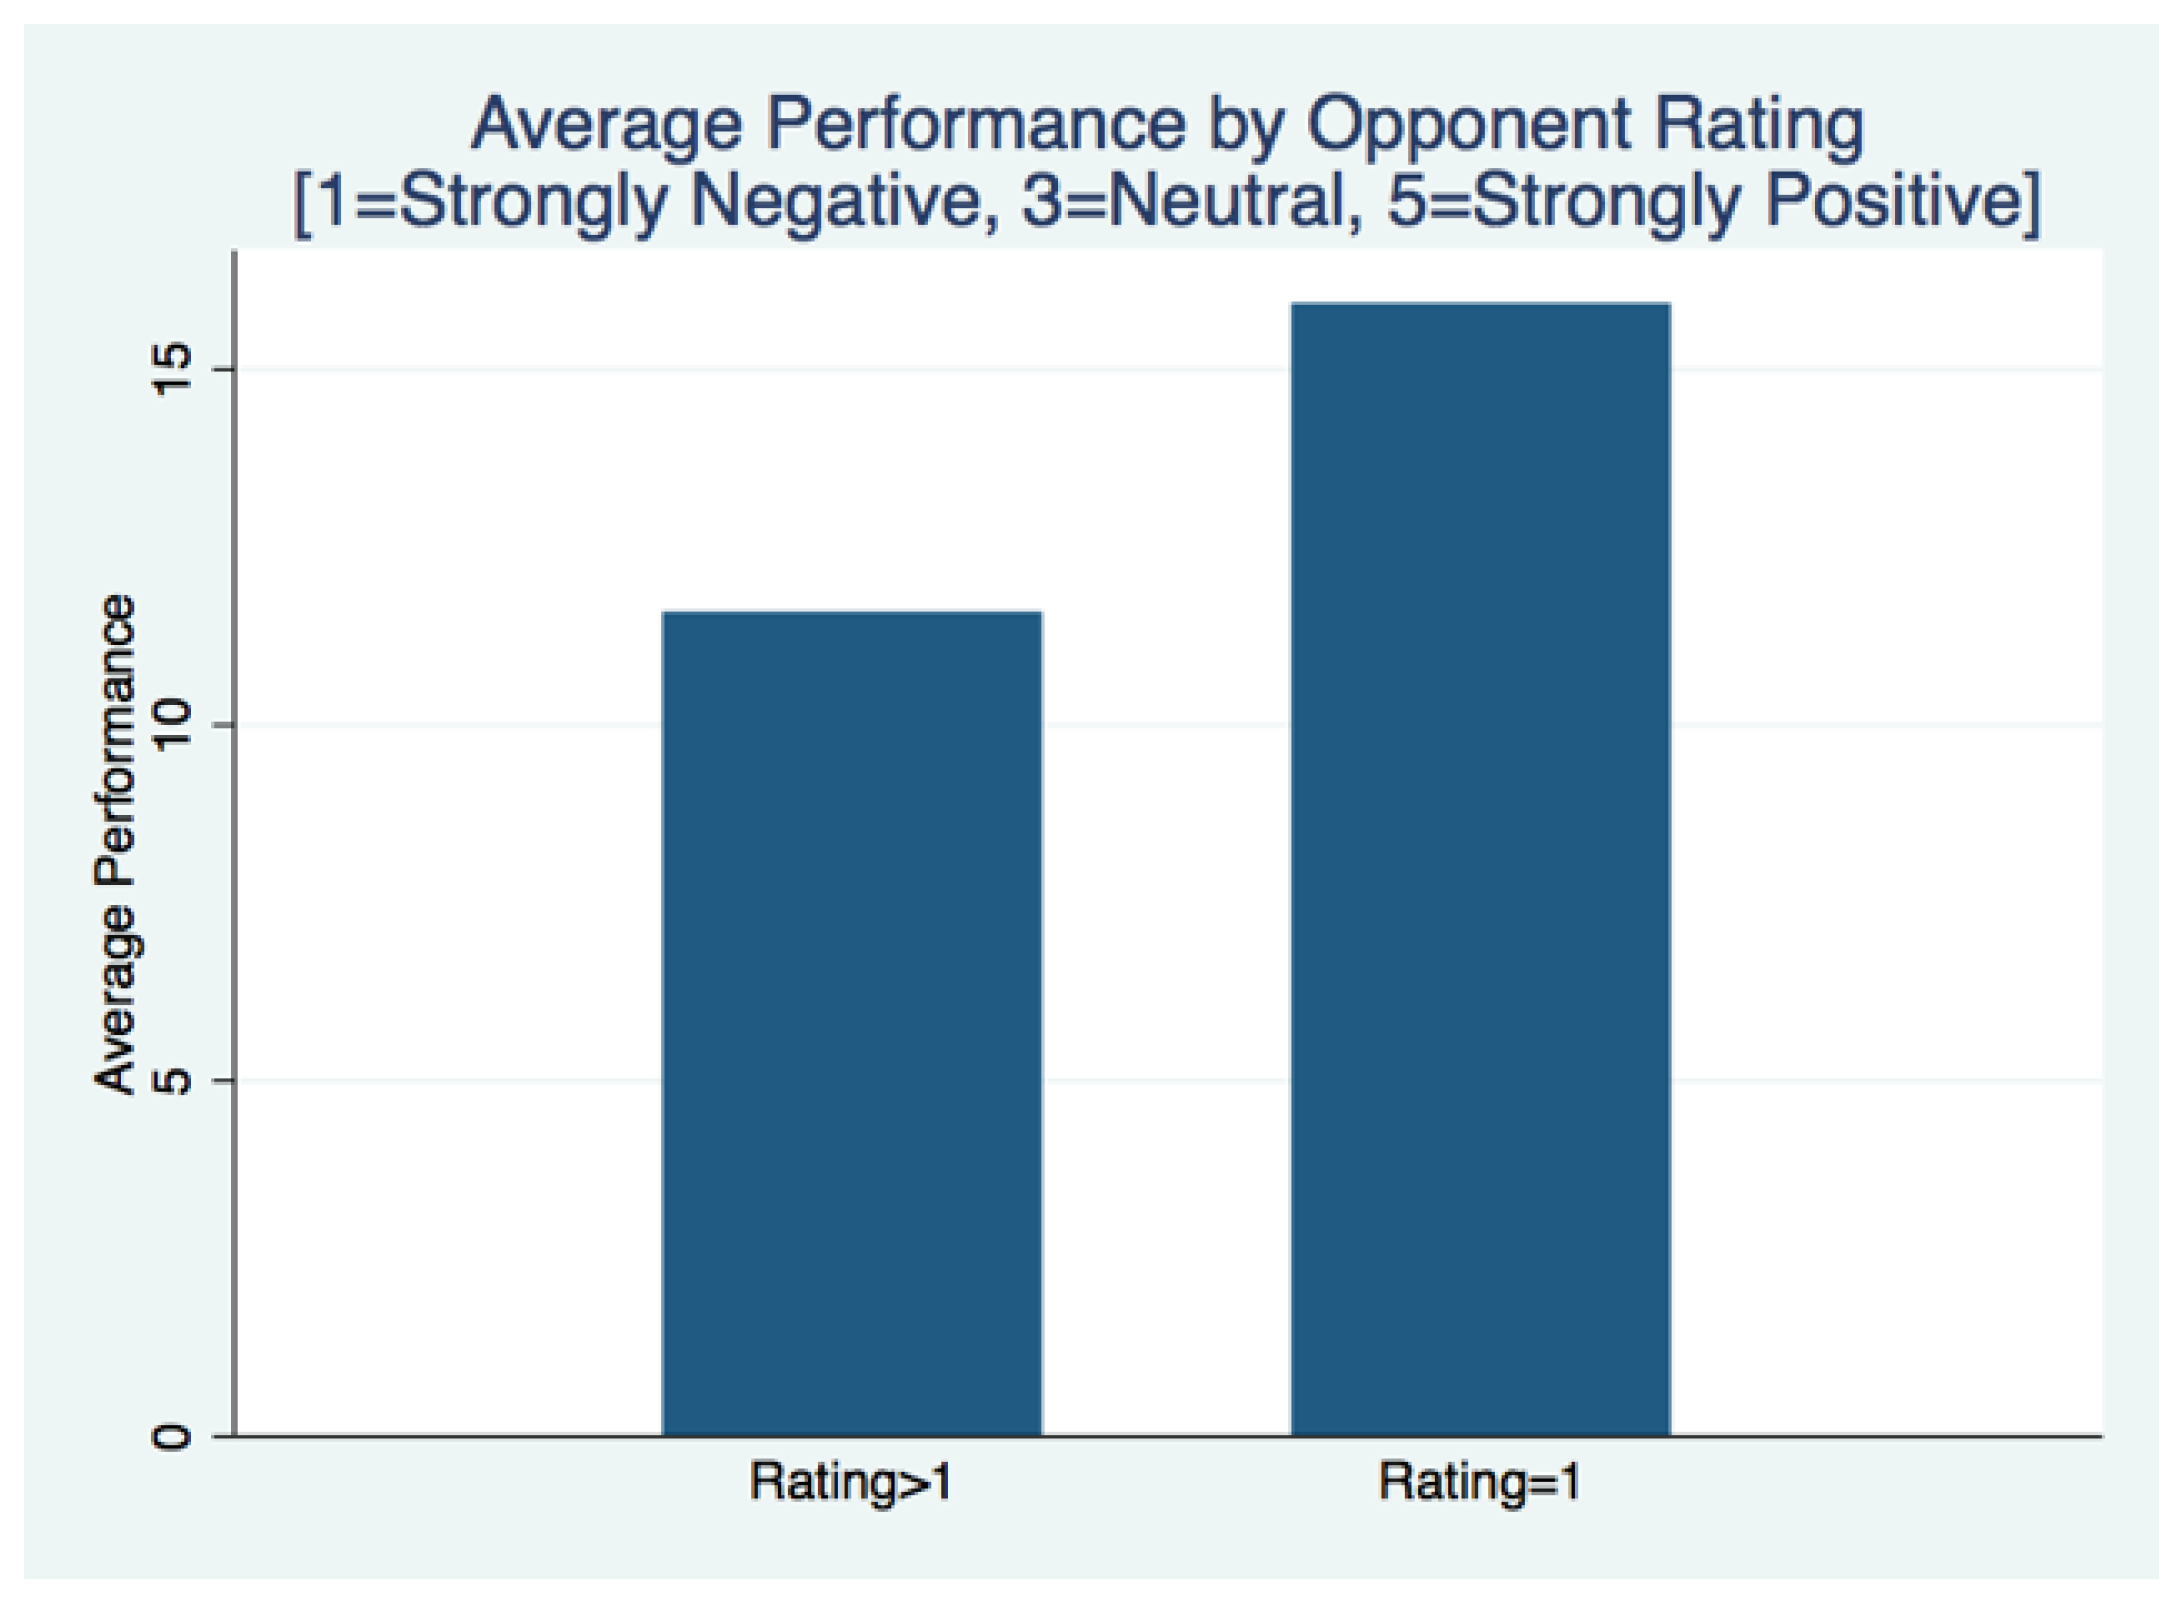
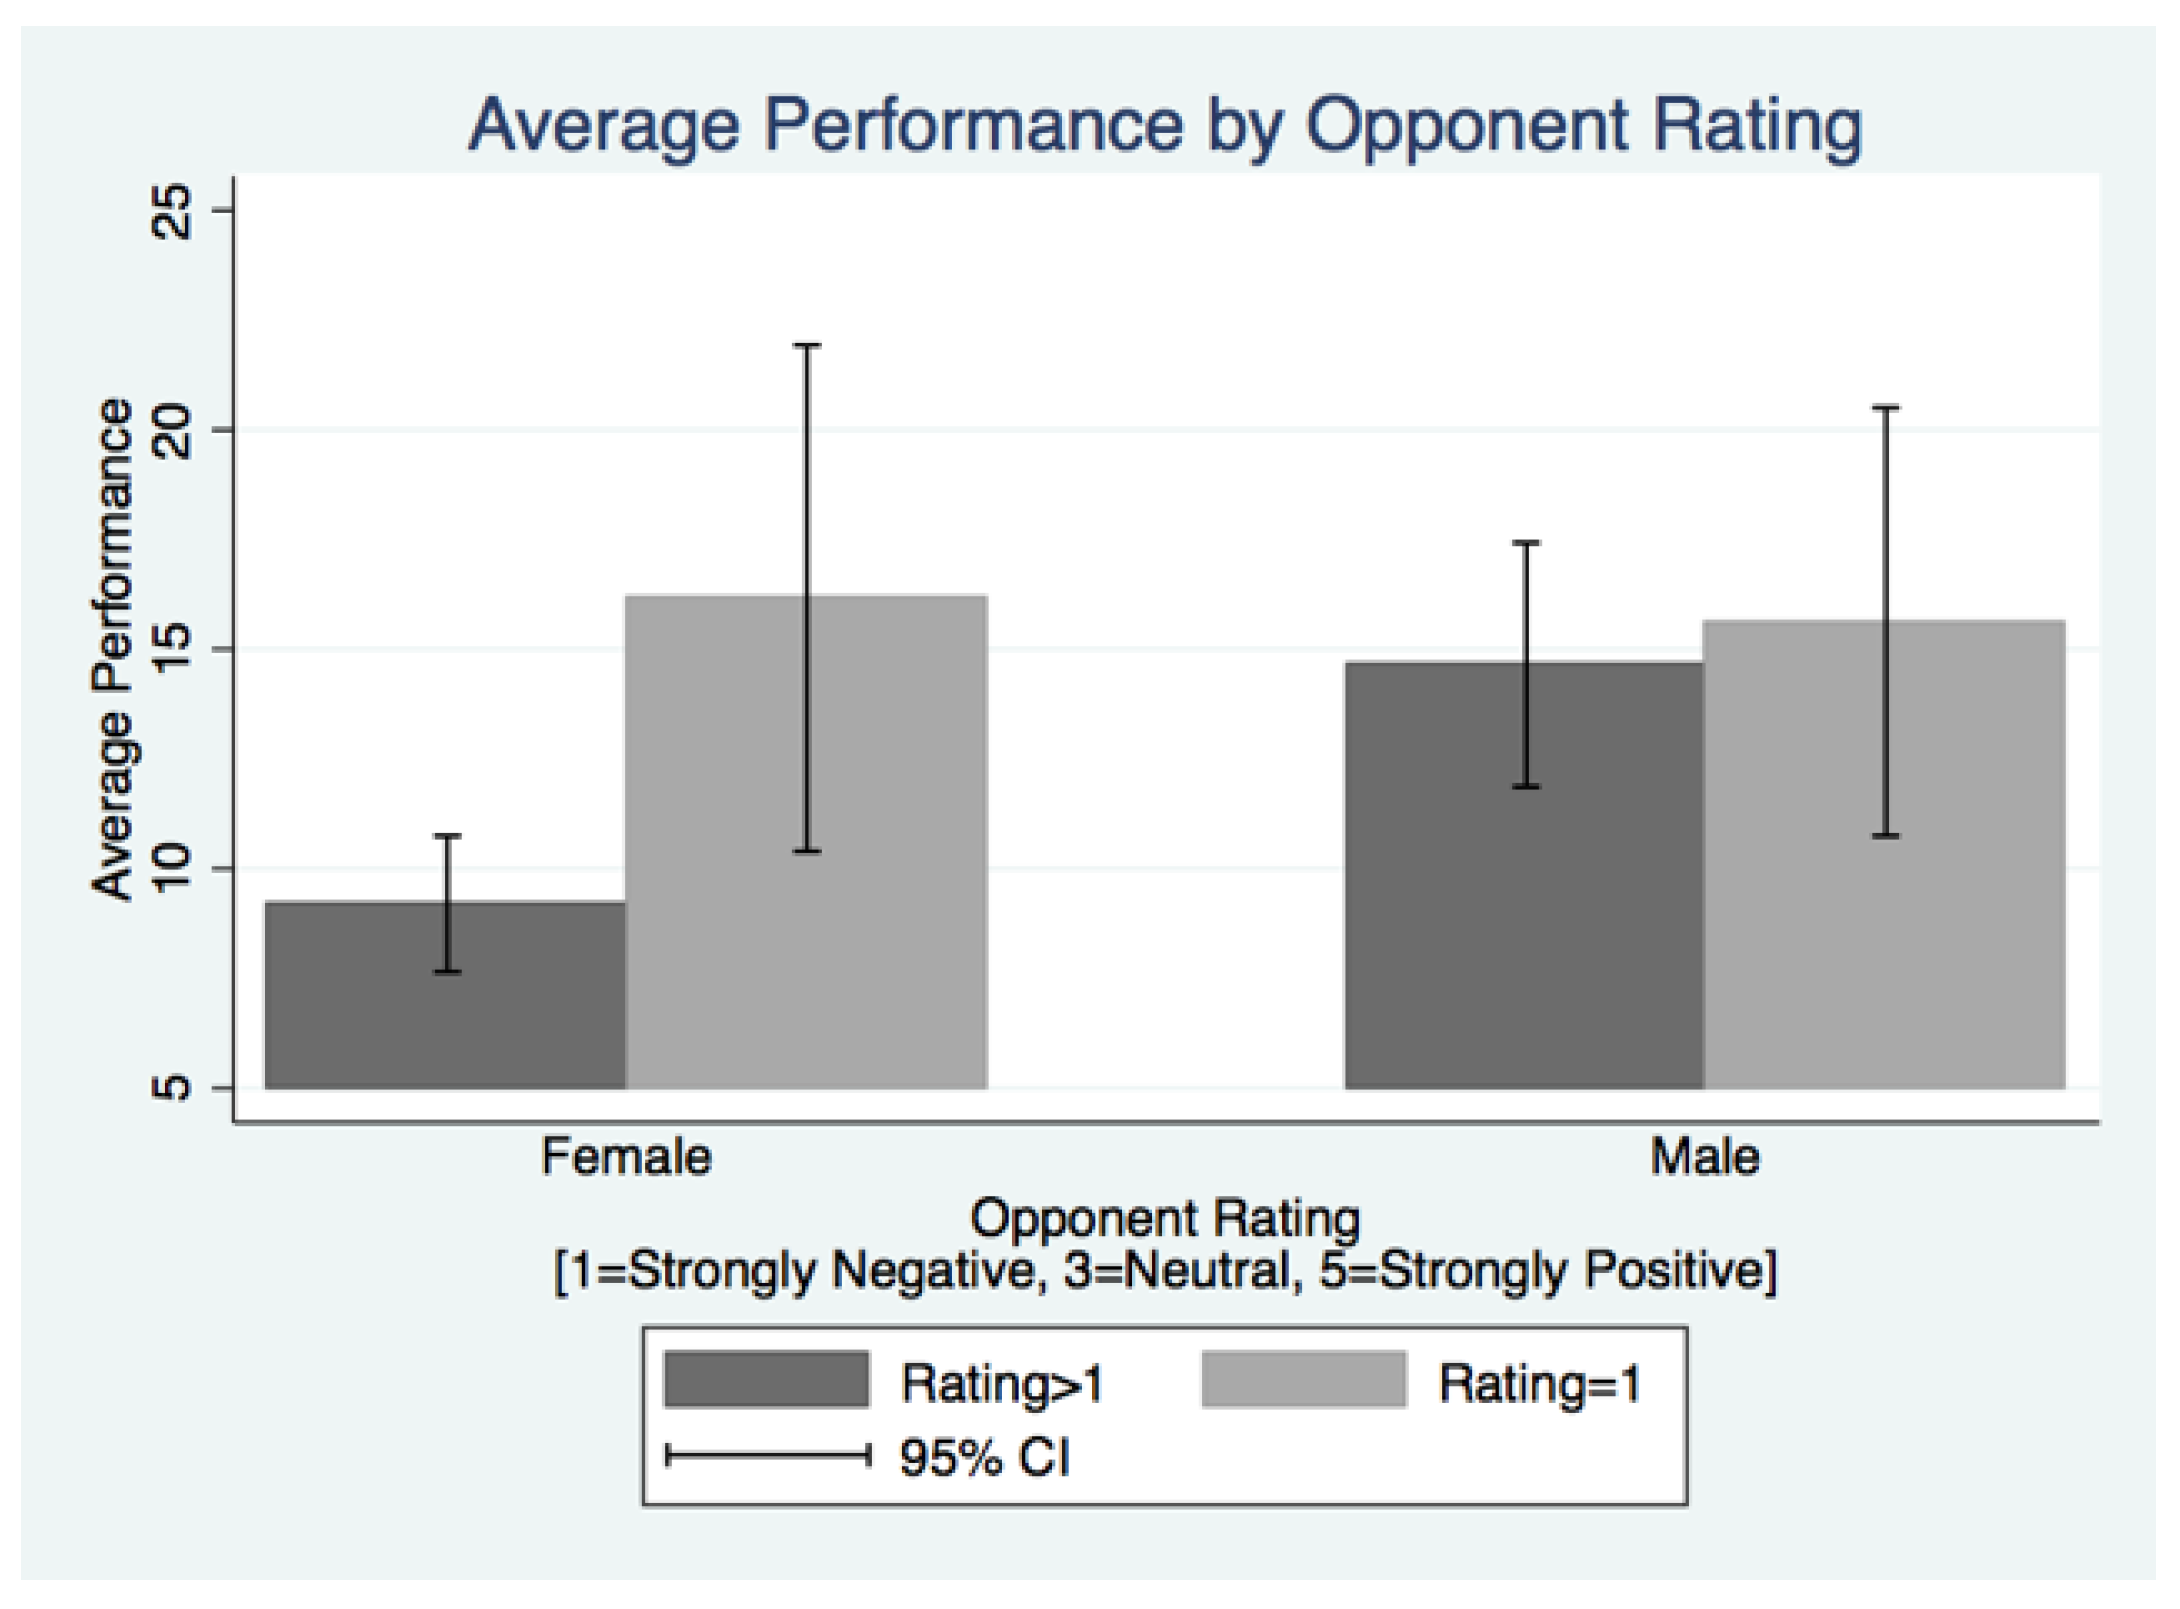
Not controlling for gender, average performance is higher for individuals whose opponents received ratings of one (strongly negative feelings) compared to ratings two through five.11 For the individuals matched with an opponent rated one, average performance was 15.91. For opponents rated two through five, average performance was 12.79, 10.79, 11.00 and 12.54, respectively. This sharp increase in performance is illustrated in Figure 8, and a two-sided t-test comparing the difference in performance for subjects matched with an opponent who received a rating of one versus grouping subjects matched with opponents who received ratings greater than one (Figure 9) is significant (p = 0.0169).12 I have evidence that strongly negative personal history significantly increases competitive behavior.
These results are in line with Fehr and Gächter (2000a) [4] where punishment and negative emotions both intensify the larger the negative deviation from the group average. In Figure 3, I demonstrated that ratings of one and two pertained to below-average contributions while ratings three through five reflected above-average contributions. Keeping with Fehr and Gächter (2000a) [4], I would expect to see punishment when the contributions are below average, but not necessarily when the contribution is close to the group average. The average group deviation for opponents rated strongly negative (a rating of one) was −$1.80 and the deviation for opponents rated somewhat negative (a rating of two) was −$1.08. Both of these values are significantly different from zero and negative, however, in terms of potential contribution values, because subjects were restricted to contributing whole numbers, a deviation of one from the group average does not seem to indicate a significant deviation. Therefore similar to Fehr and Gächter (2000a) [4], I would not expect to see an increase in effort for individuals matched with subjects rated somewhat negative.13 However, it seems plausible that because the range of potential contributions was only [0,7] inclusive, a deviation of roughly two from the group average would be viewed much more significantly. As with Fehr and Gächter (2002) [5], this is where I would expect to see the increase in punishment. These results support Hypothesis 1 that performance will increase when competing with someone about whom you feel strongly negative.
Finding 3: Performance only increases significantly when the behavior of the opponent is particularly flagrant:
Using a Kruskal-Wallis test for a difference in median performance among individuals competing with subjects rated two through five, I find that there is no difference in effort among these four groups (p = 0.4168). Additionally, a Kruskal-Wallis test for a difference in median performance across all ratings is marginally significant, suggesting at least one of the medians differs (p = 0.0813). It must be then that this difference lies in the median performance of individuals competing with an opponent viewed strongly negative. Pairwise t-tests tests produce relatively consistent results with the mean performance of individuals competing with a subject rated one being significantly different than subjects rated three, four or five (p = 0.0229, p = 0.0554, p = 0.1781, respectively). The p-value on the two-sided t-test comparing average performance of individuals with opponents rated one and opponents rated two is insignificant at 0.2062. This may very well be due to the small sample sizes in each of the rating bins. All t-tests comparing opponents of ratings two through five could not reject the null hypothesis of no difference in average performance. Behavior appears to differ when the emotions involved are strongly negative, supporting Hypothesis 1.
Finding 4: Male performance is higher than female performance:
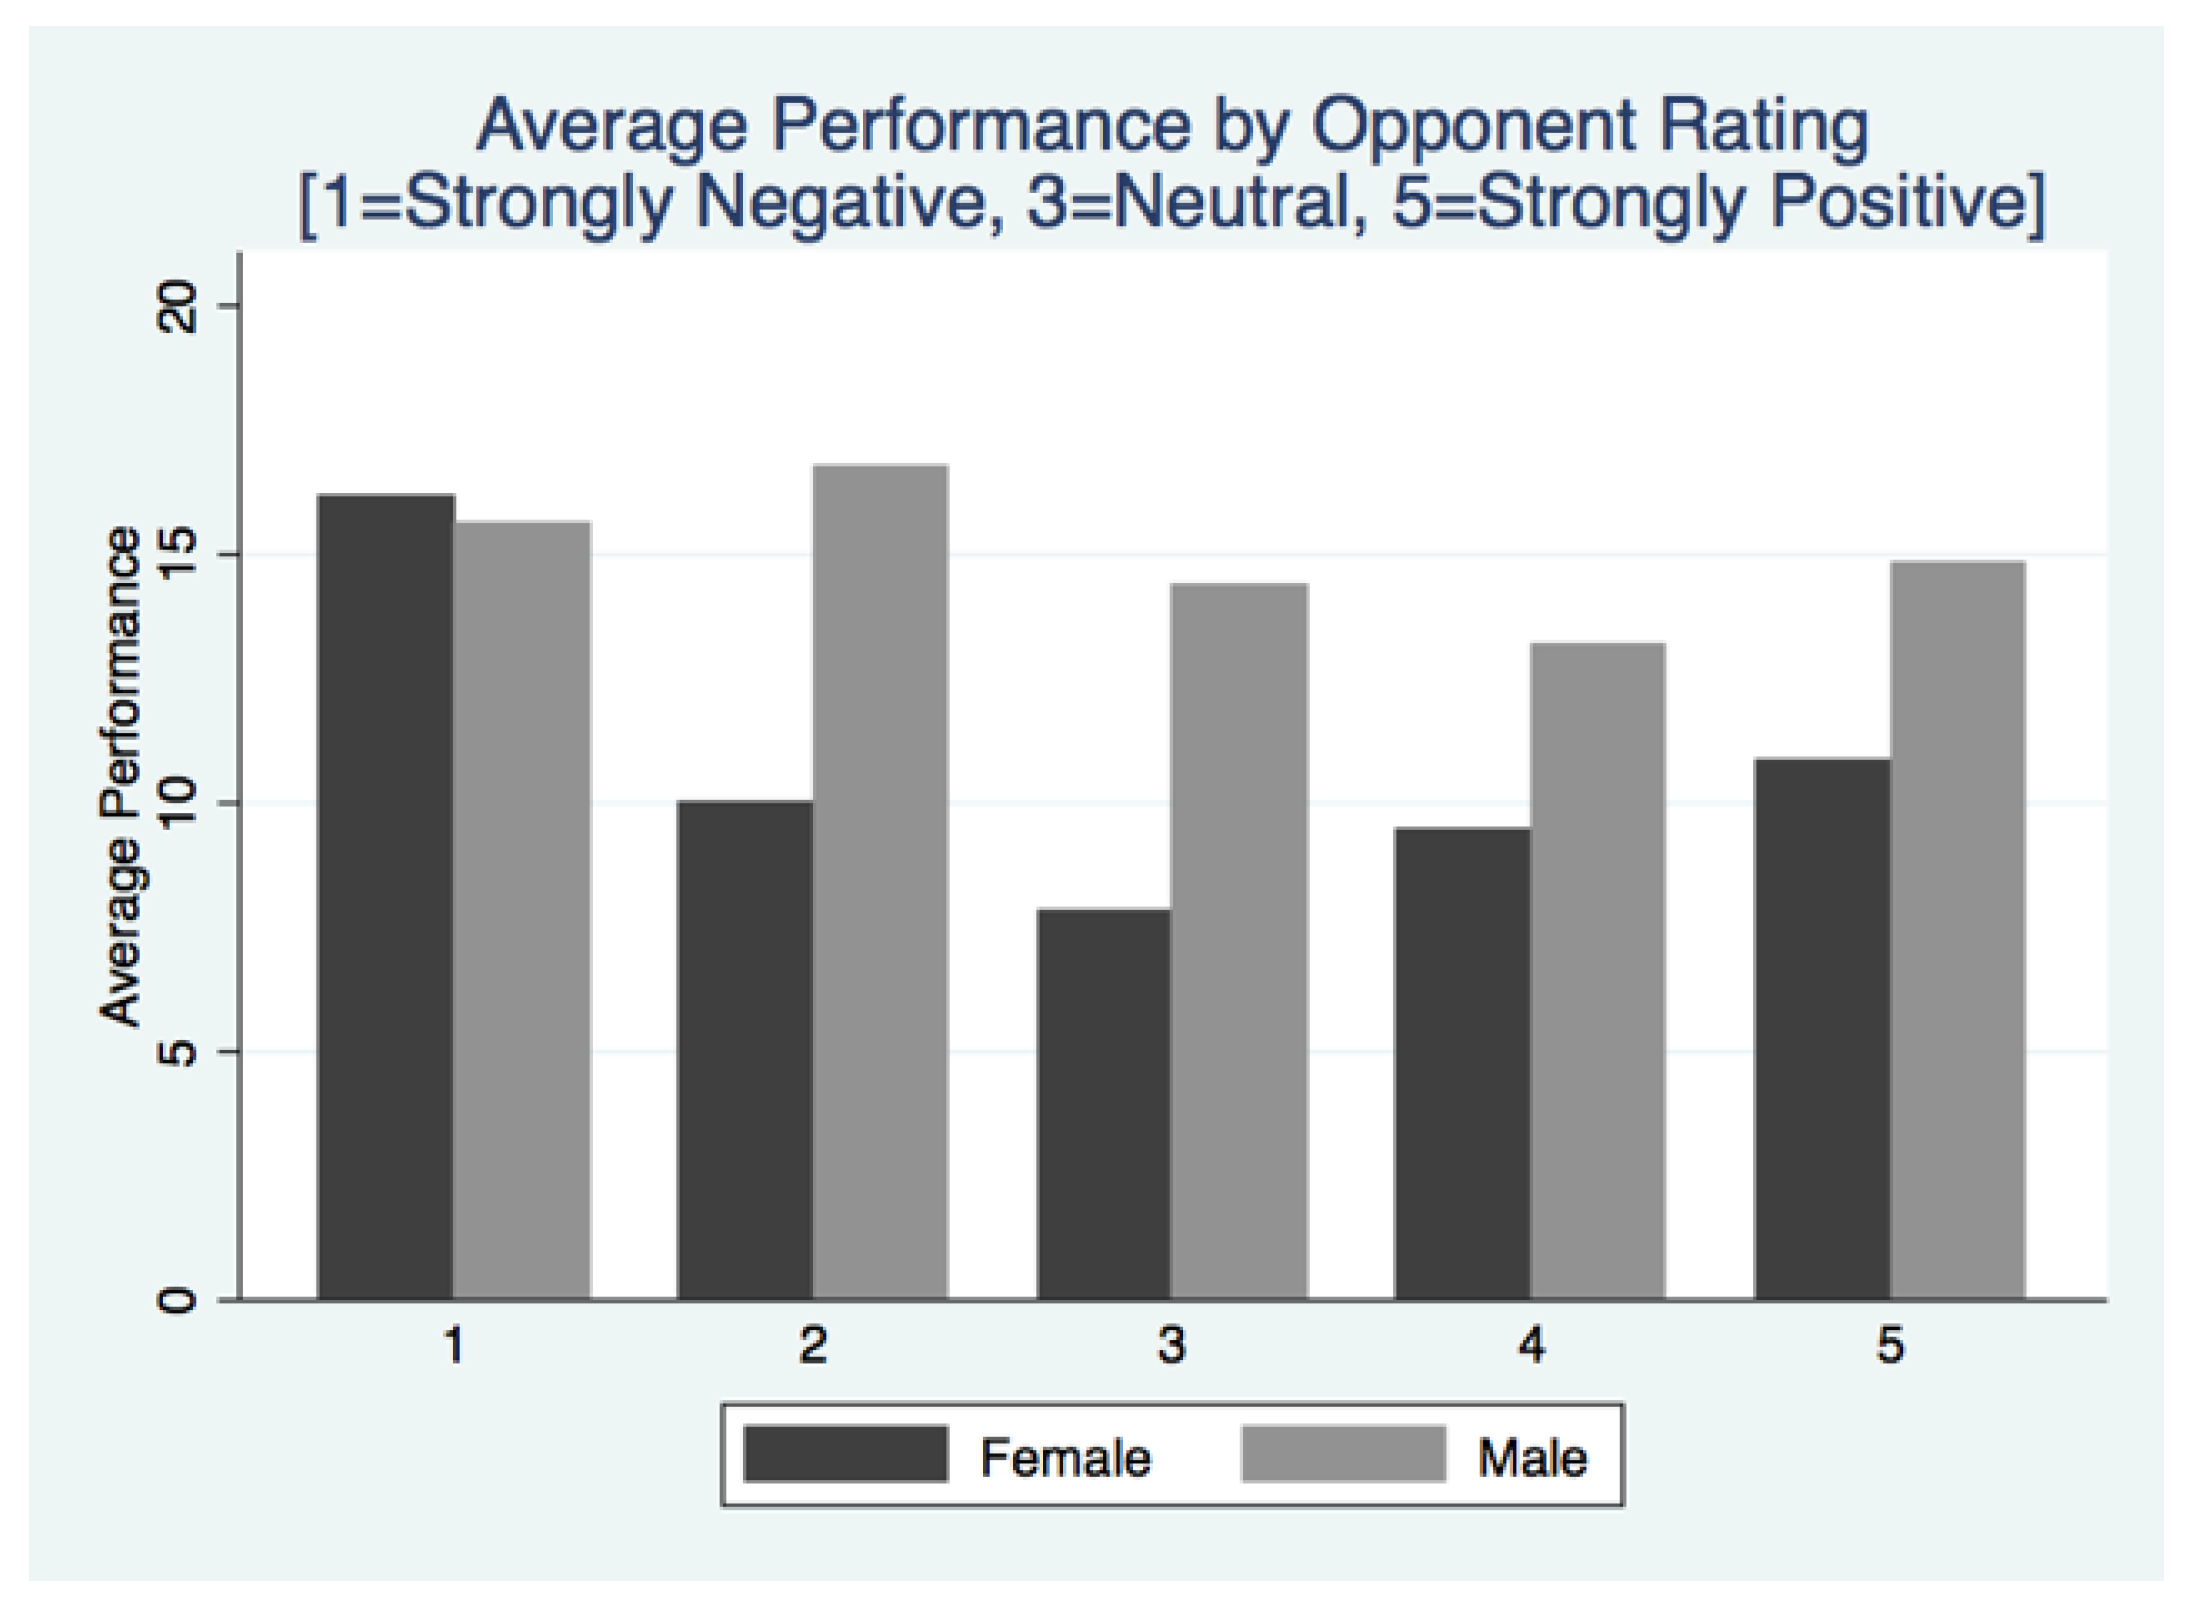
Looking at average effort by gender, my data supports the hypothesis that men have higher performance in the tournament. Average male performance is 14.85 tasks while average female performance is 10.52 tasks. This difference is significant using a two-sided t-test (p = 0.0030). The creators of the slider task, Gill and Prowse, provide evidence that within their subject pool, male and female behavior was not significantly different. By the final round, men completed 25.75 tasks on average while women complete 26.83 tasks on average. Figure 10 corroborates this finding, illustrating that male performance is above the performance of females for every reported emotion other than strongly negative emotions.
Finding 5: Women respond more strongly to negative emotions:
Figure 11 allows a comparison in performance for opponent ratings of one versus ratings above one by gender. The t-tests in Table 4 illustrate five results. All p-values presented in Table 4 are two-sided unless otherwise specified. Male performance rises by 0.98 tasks (p = 0.7430) on average when the emotions are strongly negative while female performance rises by 6.96 tasks (p = 0.0012) on average in response to the strongly negative emotions. In the absence of strongly negative emotions, males perform 5.45 tasks (p = 0.0004) more than females, however, with strongly negative emotions, this difference falls to 0.53 tasks (p = 0.8850). All of these results hold as well using a Fisher’s exact test on the difference in medians. The gender gap in competition performance is eliminated in the presence of this strongly negative emotional stimulus. Women seem to be responding to the emotion more significantly than men. This notion is confirmed by the difference-in-differences estimate provided in the regression results of Column 4 on Table 5 (p = 0.098). The observed increase in performance when competing with a negatively viewed opponent appears to be purely driven by the female response as male performance is unaffected. Though men are more competitive across the board, negative emotions appear to evoke a “competitive fire” in women. A similar analysis comparing performance across subjects who were “badly wronged” in the public goods game can be found in the Appendix.
Lastly, it is worth noting that aggregate performance is significantly higher for pairs with one member viewed strongly negative. In pairs with an opponent assigned a rating of one, aggregate performance is 4.4 tasks higher than in pairs without. This difference is marginally significant using a two-sided t-test (p = 0.0846).
Regressions in Table 5 support the above results. All regressions included session dummy variables and demographic variables including whether a subject had been in an economics experiment previously, if the subject was an economics/accounting major, and standard errors were clustered at the session level. By including both session dummy variables and clustering on the session level I am essentially producing the first stage of the Donald and Lang (2007) [45] two-step correction in the presence of a small number of clusters. I do not need to worry about the second stage because the second stage yields coefficient estimates for coefficients of interest that are session specific of which I have none.
In Model (1), I created a dummy variable for opponents rated one or two (strongly negative and somewhat negative, respectively), and another dummy variable for opponents rated four or five (somewhat positive and strongly positive, respectively). I left those with an opponent rated three (neither positive nor negative feelings) as the reference group. Neither of these coefficients were significant which is not surprising given the graphical evidence above demonstrating that this performance increase is found only for those individuals competing with someone rated strongly negative.
I used Model (2) to include dummy variables for all the rating categories, leaving the neither positive nor negative category as the reference group. The strongly negative category was the only close to significant coefficient (p = 0.103) when compared to the reference group using a two-sided hypothesis test, and is significant at the 10% level using a one-sided test. Subjects competing with a strongly disliked (rating of one) individual completed roughly four additional tasks compared to subjects competing with an individual with a rating of three.
This confirms the pattern in Figure 8, where the only spike in performance was evident with individuals whose opponents were viewed as strongly negative. The positive coefficient for strongly negative feelings is marginally insignificant using a two-sided test (p = 0.117), however with a one-sided hypothesis test like the one of interest, I would obtain a significant coefficient at the 10% level. It appears that something is masking the observed increase in performance such as a gender difference driven by an increase in female performance. A simple difference-in-differences should clear this up.
I included an interaction term between the dummy variable for male and the dummy variable for strongly negative feelings to test if the reaction to emotional stimulus was different for men and women. The negative and significant coefficient provides evidence that given an individual is competing with someone viewed as strongly negative, women increase performance by roughly six tasks more than men in the presence of the emotional stimulus. This result corroborates Figure 11 and the t-tests presented in Table 4 that females are driving the increase in performance and are much more responsive to the negative emotions. Interestingly, as shown in Figure 11, as well, male performance is unaffected by the negative emotional stimulus. This can be demonstrated by the summation of the coefficients on the strongly negative dummy variable and the new interaction variable. These two coefficients essentially cancel each other out, illustrating that males’ performance is not altered by the presence of these negative emotions. Using a Wald test for the summation of these two coefficients, the hypothesis that the coefficients on the strongly negative dummy and the interaction of the strongly negative dummy with the gender dummy cancel each other out cannot be rejected (p = 0.9802).
4. Discussion
My data confirm that when competing with a person towards which one has strongly negative emotions, there is evidence that individual performance increases substantially. Specifically, an increase in female performance drives the observed overall performance increase. This suggests that individuals use the tournament environment as an opportunity to retaliate with matched individuals who they previously experienced negatively. Individuals are willing to undertake costly effort in order to increase their own performance as a means of increasing the probability of a win, suggesting the presence of negative reciprocity.
One possible explanation for the increase in demonstrated performance may be a rational response of individuals who expect negatively rated opponents to compete more vigorously. Average opponent effort by ratings one through five was 12.23, 11.83, 10.54, 14.9 and 12.92, respectively. There is no difference in the distribution of opponent performance levels by opponent rating using a Kruskal-Wallis test (p = 0.6507), therefore there does not seem to be evidence that the increase in effort is driven by a rational response to work harder with a poorly rated individual. Additionally, using an ANOVA, we cannot reject that there is no difference in average opponent performance across opponent ratings (p = 0.4715). While the figure of interest is the performance of individuals rated one, both tests show that there is no evidence that the effort of opponents rated one (strongly negative) is significantly higher than opponents of any other rating (two through five). Because effort levels do not differ by opponent rating, this suggests that the emotional channel is driving the increase in effort.
On the other hand, the increase in performance could be driven by something unique about subjects willing to rate another individual as strongly negative. While 39% of subjects assigned at least one other participant a “strongly negative” rating, not all of these subjects were matched with the specific individual assigned the low rating. Because I observe these subjects across all opponent ratings but do not observe the increase in performance across all opponent ratings, my results do not appear due to something special about subjects who give ratings of strongly negative. Additionally, a test of a correlation between an indicator for whether subjects assigned at least one strongly negative rating and the subject’s own effort is significant (, p-value = 0.0385). However, when I restrict this test to only subjects who never competed with the individual assigned the strongly negative rating, the significance disappears (, p-value = 0.4370). If my results were driven by a concern that there is something unique about individuals willing to assign low ratings, this correlation test would have remained significant even for individuals not competing with the subject with the low rating.
Another possible explanation is that individuals with low profit from the first stage may increase effort in order to increase the probability of winning the tournament thus increasing total payoff. There is no difference in average first stage profit between individuals competing with a strongly negative opponent (rating = 1) and those competing with a somewhat negative opponent (rating = 2) (p = 0.9570). Consequently, if effort were driven by a concern for profit, one would expect to observe an increase in effort in both of these two groups. However, as showed above, the increase in effort was only evident for the individuals competing with a strongly negative opponent. Therefore, it does not appear that the increase in effort is driven by a concern for increasing one’s profit, again, providing evidence that emotions are driving the result.
My difference-in-differences estimate is robust to multiple specifications. Including opponent’s public goods game contribution as a control does little to my difference-in-differences estimate and it remains significant (0.093), even increasing slightly in significance. Controlling for opponent’s public goods game contributions allows me to say that the reported emotions have predictive power over and above proxying for opponent contribution. Replacing subject contribution with subject first stage profit and including opponent’s public goods game contribution as a control, again does little to my difference-in-differences estimate, again, slightly increasing it’s significance (p = 0.087). By including subject’s first stage profit, I can be more sure that income effects are not driving my results.
Regardless of the behavioral motivation, my results suggest that the motivation is largely extrinsic due to the significant increase in performance when competing with an individual rated strongly negative. Though there may be some component of effort that is intrinsic in nature, if the motivation was purely intrinsic such as if individuals viewed the slider task as fun, I would not expect to observe a significant difference in behavior among individuals or a significant treatment effect.
Researchers may argue that a four-person public goods game may make it difficult to establish feelings based on direct intentions. For example, a player may have contributed zero, but the other group members rate this person positively because the choice was seen as the “smart” thing to do. However, given my results and the correlation between contribution and rating, that possibility does not seem to have affected my results. Alternatively, the other group members may rate this person negatively because they are “envious” of not making the same decision rather than “angry”. I cannot differentiate between “envious” and “angry” individuals beyond that both emotions have a negative connotation. Eliciting intensities of specific emotions with both positive and negative affect would be an interesting extension.
5. Conclusions
Competitive environments are found throughout our everyday lives and are present in many workplace settings. Examples include “Employee of the Month” rewards or a ranking system that sets a company hierarchy used for determining pay raises. My experiment examines if and how emotions play a role in competitive exchanges.
My findings indicate that performance increases significantly when an individual competes with a strongly disliked group member, as the mean performance in the case of strongly negative reported feelings is higher than all pairings. I have also shown that women appear more responsive to the presence of negative feelings in this particular competitive setting. Given that women are generally more averse to competition, workplace programs that take into account interpersonal relationships may be able to counteract this demonstrated aversion towards competition.
Future work on this topic would benefit from determining the true nature of the generated feelings such as “anger”, “envy”, “remorse”, etc., to help underpin what is truly driving the increase in performance including whether this increase in arising from being wronged financially or from observing an individual violate a social norm. It would also be of interest to determine whether this increase would exist if the violation of the social norm or financial wronging was realized indirectly. Furthermore, observing a closing of the gender gap in this unique environment further emphasizes the need for additional work analyzing other environments that may also close this gap. As mentioned throughout the paper, follow-up experiments and replications with larger sample sizes can help confirm the current results.
I have shown that negative emotions can increase effort in a tournament environment. Additionally, I have shown that the increase in effort cannot be driven by a rational increase in effort due to individuals expecting to encounter increased opponent effort. Furthermore, women increase their work effort in response to negative emotions and actually embrace the tournament environment, suggesting that under the right circumstances, women can be induced to compete as hard as men.
While it seems intuitive that a positive emotional environment is good for performance, my results in this paper provide an example where the opposite is true: negative feelings towards co-workers raise performance. Combining this tendency to respond with increased effort in the presence of negative emotions and the result that women embrace competition, employers need not worry as much about the potential for soured relationships outside of the workplace negatively impacting productivity inside the workplace.
Acknowledgments
The author would like to thank Gary Charness for his support, advice and suggestions throughout this project.
Conflicts of Interest
The author declares no conflict of interest.
Appendix A. Effect of Being “Badly Wronged”
While the previous analysis has centered on the impact of the subjects’ feelings towards their opponent on their tournament performance, the following analysis will focus on the impact of being “badly wronged” on tournament performance in the first period. I will define a subject as being badly wronged if he contributed at least four more in the public goods game than his opponent. I chose this cutoff because it represents the 90th percentile of differences between own and opponent public goods game contributions. Essentially, those who are “badly wronged” consist of the 10% of subjects who faired worst in the public goods game. This seems like a practical and intuitive threshold for categorizing subjects as “badly wronged.”
Table A1 presents t-tests, as well as Fisher’s exact test of medians comparing performance between subjects who were and were not badly wronged in the public goods game. All p-values presented in Table A1 are two-sided unless otherwise specified. Overall, there is a significantly difference in tournament performance between individuals who were and were not badly wronged as evident in the test of medians (p = 0.039). Male performance appears unaffected by being badly wronged as the number of completed tasks rises by 1.03 (p = 0.7676) on average and the median number of completed tasks rises by 2.00 (p = 1.00). The effect of being badly wronged on female tournament performance is marginally significant when looking at the test for a difference in medians. Badly wronged females complete 4.59 more tasks on average than not badly wronged females and the difference in medians is 5.00 (p = 0.102). If we look at the one-sided p-value instead because we are interested in an increase in performance, the difference in means is significant at the 10% level (p = 0.085).14 There is no difference in male and female tournament performance for those subjects who were badly wronged, however there is a significant difference between male and female tournament performance for subjects who were not badly wronged. Males who were badly wronged complete 0.90 more tasks than badly wronged females on average (p = 0.7941), while there is no difference in the median number of completed tasks for badly wronged males and females. Males who were not badly wronged complete 4.46 more tasks than badly wronged females on average (p = 0.0047), while the difference in the median number of completed tasks for not badly wronged males and females is 3.00 (p = 0.010).
While the results using reported feelings and being badly wronged do not exactly mirror each other, the signs of the statistics remain consistent and tell a consistent story that the increase in female performance is driving the overall increase and the gender gap in tournament performance is eliminated.

Table A1.
Difference in means: subject was badly wronged (contributed at least 4 more than assigned opponent).
Table A1.
Difference in means: subject was badly wronged (contributed at least 4 more than assigned opponent).
| Group 1 | Group 1 | Group 2 | Group 2 | Difference in Means | Difference in Medians |
|---|---|---|---|---|---|
| Mean Perf. | Mean Perf. | (p-Value) | (p-Value) | ||
| All Subjects (Not Badly Wronged) | 12.10 | All Subjects (Badly Wronged) | 15.41 | 3.31 | 4.00 ** |
| (0.1814) | (0.039) | ||||
| Males (Not Badly Wronged) | 14.70 | Males (Badly Wronged) | 15.73 | 1.03 | 2.00 |
| (0.7676) | (1.00) | ||||
| Females (Not Badly Wronged) | 10.24 | Females (Badly Wronged) | 14.83 | 4.59 | 5.00 |
| (0.2049) | (0.102) | ||||
| Females (Badly Wronged) | 14.83 | Males (Badly Wronged) | 15.73 | 0.90 | 0.00 |
| (0.7941) | (1.00) | ||||
| Females (Not Badly Wronged) | 10.24 | Males (Not Badly Wronged) | 14.70 | 4.46 *** | 3.00 *** |
| (0.0047) | (0.010) |
p-values in parentheses. ** p < 0.05, *** p < 0.01.
Appendix B. All Period Analysis
Between tournament rounds, subjects were informed whether or not they won the previous round. While they were not informed about how many tasks their opponent completed, informing subjects about the results prior to additional rounds may influence behavior.
This difference in information processing appears to muddle the true effect of the emotions on tournament performance, however, the general trends in male and female performance are maintained. Table A2 shows that over all five periods, subjects competing with an opponent who was rated as strongly negative completed 5.82 tasks more than subjects who completed against a differently rated individual. This difference is highly significant (p = 0.0000). Consistent with the first period of data analysis, females respond strongly to the emotion through a significant increase in performance of 6.95 tasks (p = 0.0000). While male and female performance differs significantly when competing with an individual not viewed as strongly negative (p = 0.0000), this gender gap in tournament performance is significant reduced in the presence of strongly negative emotions and is only significant at the 10% level. (p = 0.0711). While male performance appeared unaffected by the emotions in the period one analysis, male performance appears to differ significantly at the 5% level when assessing all five periods (p = 0.0409). The last two results differ slightly from the period one analysis and may be the result of the varying influences of relative performance feedback for men and women. There may even be an interaction between emotions and the processing of relative performance that are confounding the results using all five periods of data. Positive feedback may spur men to compete hard for multiple periods while positive feedback for women may be significantly more transitory. Women may view a successful round as a “fluke”, while men will see it as a direct result of their efforts. However, the general results still hold using either analysis, but it is easy to see that an analysis with only the first period of data is much cleaner and without potential confounds.
Table A3 presents the regression analyses using all five periods of data. As with the previous analysis, all regressions included session dummy variables and demographic variables. Additionally, I included period dummy variables to account for any learning across periods. Standard errors were clustered at the session level.
The majority of the period one analysis results hold including the significant effect of gender and opponents rated strongly negative on tournament performance. The difference-in-differences estimates are no longer significant using all five periods of data but this is very possibly due to the potential autocorrelation in the standard errors due to the between round feedback. Because I am looking at the differing responses to the emotion across genders, the fact that men and women process and respond to feedback differently can significantly influence behavior and thus coefficient values as well as standard errors and the resulting hypothesis tests.
Additionally, if the regressions in Table A3 are run including a dummy variable equal to one if the individual won the previous tournament round and zero otherwise, in all specifications, the only other significant predictors of subject effort are public goods game contribution, a gender dummy variable, and the “win" dummy variable. More specifically, positive feedback after the previous round results in a significant increase in effort in the following round. These additional regressions provide more concrete evidence that the role of the feedback eliminates the effect of the emotions and therefore the period one analysis is ideal for answering the current research question.
Table A2.
Difference in means: all periods.
| Group 1 | Group 1 | Group 2 | Group 2 | Difference in Means |
|---|---|---|---|---|
| Mean Perf. | Mean Perf. | (p-Value) | ||
| All Subjects (Rating ) | 23.90 | All Subjects (Rating = 1) | 29.73 | 5.82 *** |
| (0.0000) | ||||
| Males (Rating > 1) | 28.04 | Males (Rating = 1) | 32.21 | 4.17 ** |
| (0.0409) | ||||
| Females (Rating > 1) | 20.75 | Females (Rating = 1) | 27.70 | 6.95 *** |
| (0.0000) | ||||
| Females (Rating = 1) | 27.70 | Males (Rating = 1) | 32.21 | 4.51* |
| (0.0711) | ||||
| Females (Rating > 1) | 20.75 | Males (Rating > 1) | 28.04 | 7.29 *** |
| (0.0000) |
p-values in parentheses. * p < 0.10, ** p < 0.05, *** p < 0.01.
Table A3.
OLS regression results: all periods.
| (1) | (2) | (3) | (4) | |
|---|---|---|---|---|
| Completed | Completed | Completed | Completed | |
| Slider Tasks | Slider Tasks | Slider Tasks | Slider Tasks | |
| Subject Contribution | 0.838 * | 0.735 | 0.652 | 0.640 |
| (0.454) | (0.459) | (0.454) | (0.456) | |
| Male | 6.732 ** | 6.684 ** | 6.646 ** | 7.162 ** |
| (2.503) | (2.570) | (2.553) | (2.762) | |
| Negative Feeling Dummy | 0.634 | |||
| (2.283) | ||||
| Positive Feeling Dummy | 1.013 | |||
| (1.663) | ||||
| Strongly Negative | 3.165 | 3.633 * | 4.732 | |
| (2.341) | (1.826) | (3.167) | ||
| Somewhat Negative | −1.641 | |||
| (2.372) | ||||
| Somewhat Positive | 0.532 | |||
| (2.955) | ||||
| Strongly Positive | 1.705 | |||
| (3.601) | ||||
| Strongly Negative * Male | −2.463 | |||
| (4.285) | ||||
| Constant | 7.079 ** | 6.969 ** | 6.802 ** | 6.686 ** |
| (2.918) | (2.881) | (2.722) | (2.724) | |
| 0.2949 | 0.3027 | 0.3002 | 0.3011 | |
| N | 889 | 889 | 889 | 889 |
| Session Dummies | Yes | Yes | Yes | Yes |
| Period Dummies | Yes | Yes | Yes | Yes |
| Demographics | Yes | Yes | Yes | Yes |
* p < 0.10, ** p < 0.05. p-values are two-sided. Standard errors in parentheses. Standard errors are clustered by session.
Appendix C. Instructions and Screen Shots
Welcome: Thank you for choosing to participate in this experiment on decision-making. You will be paid for your participation in cash, privately at the end of the experiment. What you earn depends partly on your decisions and the decisions of the other participants and partly on chance. Please turn off pagers, mp3 devices and cell phones now.
The entire experiment will take place through the computer and there will be no interaction with participants seated at other computers. Please do not talk or in any way try to communicate with other participants during the experiment. This experiment consists of two stages. I first describe Stage 1 and I’ll give you instructions for Stage 2 once Stage 1 is over. I will review the instructions with you. Please follow along on your screen and click the "Next" button when told. If at any point you have a question, please do not hesitate to raise your hand, and I will be by to answer your question. Please refrain from communicating with any of the other participants.
Stage 1 instructions:
In the first stage you will be randomly placed in a group of four. In this stage you will each be given $7. You must decide how much of your $7 to allocate to the group account while keeping the rest for yourself. You can choose any whole number between zero and seven, inclusive. After each group member has chosen an allocation, the money in the group account will be multiplied by 1.6 and then distributed evenly among group members.
Your payoff from the first stage is the sum of what you kept from your $7 and your portion of the group account.
After the money is divided, each person’s allocation decision will be shown to all group members listed by ID number (please note your ID number at the top of your screen in blue). Here are a few examples to make sure you understand.
Example A1.
One person contributes $7 and the other three contribute nothing.
In this scenario, the individual who contributed everything will receive $2.80.
The other three who contributed nothing will receive $9.80.
Example A2.
Everyone contributes $7.
In this scenario, all individuals will receive $11.20.
Example A3.
Two people contribute $7 and the other two contribute nothing.
In this scenario, the individuals who contributed everything will receive $5.60.
The other two who contributed nothing will receive $12.60.
Example A4.
Everyone contributes $0.
In this scenario, all individuals receive their initial $7.00 endowment.
Example A5.
One person contributes $2, one contributes $5, one contributes $0, and one contributes $7.
In this scenario, the individual who contributed $2 will receive $10.60.
The individual who contributed $5 will receive $7.60.
The individual who contributed nothing will receive $12.60.
The individual who contributed everything will receive $5.60.
You will now be asked to calculate the payoffs for two other potential scenarios in order to check your understanding. Once you have completed the questions, please wait for the other participants to finish as well. Once all participants have finished, the first stage will begin.
Stage 2 instructions:
The second stage will consist of five 1.5-min (90 s) rounds. In this stage, 48 slider bars ranging from 0 to 100 will appear on your screen. Your task is to successfully slide as many bars as you can to the half way mark (50) in the 1.5 min (90 s). If you complete all 48 slider bars before time is up, a screen with an additional 48 slider bars will appear for you to work on. You can use any combination of the mouse and keyboard to complete the task. You will be paired with an individual from your group in the first stage, and you will know the ID number of the individual with whom you are now paired. You will be paired with this individual for all five rounds. The screen will display the number of successfully completed tasks as the period progresses. One of the five rounds will be selected at random for payment. The winner (the individual who completes the most tasks successfully among the pair) of the selected round will earn $2.50. In the case of a tie, the winner will be selected at random.
Appendix D. For Online Publication
Figure A1.
Public goods game results and emotion elicitation.

Figure A2.
Slider task screenshot.

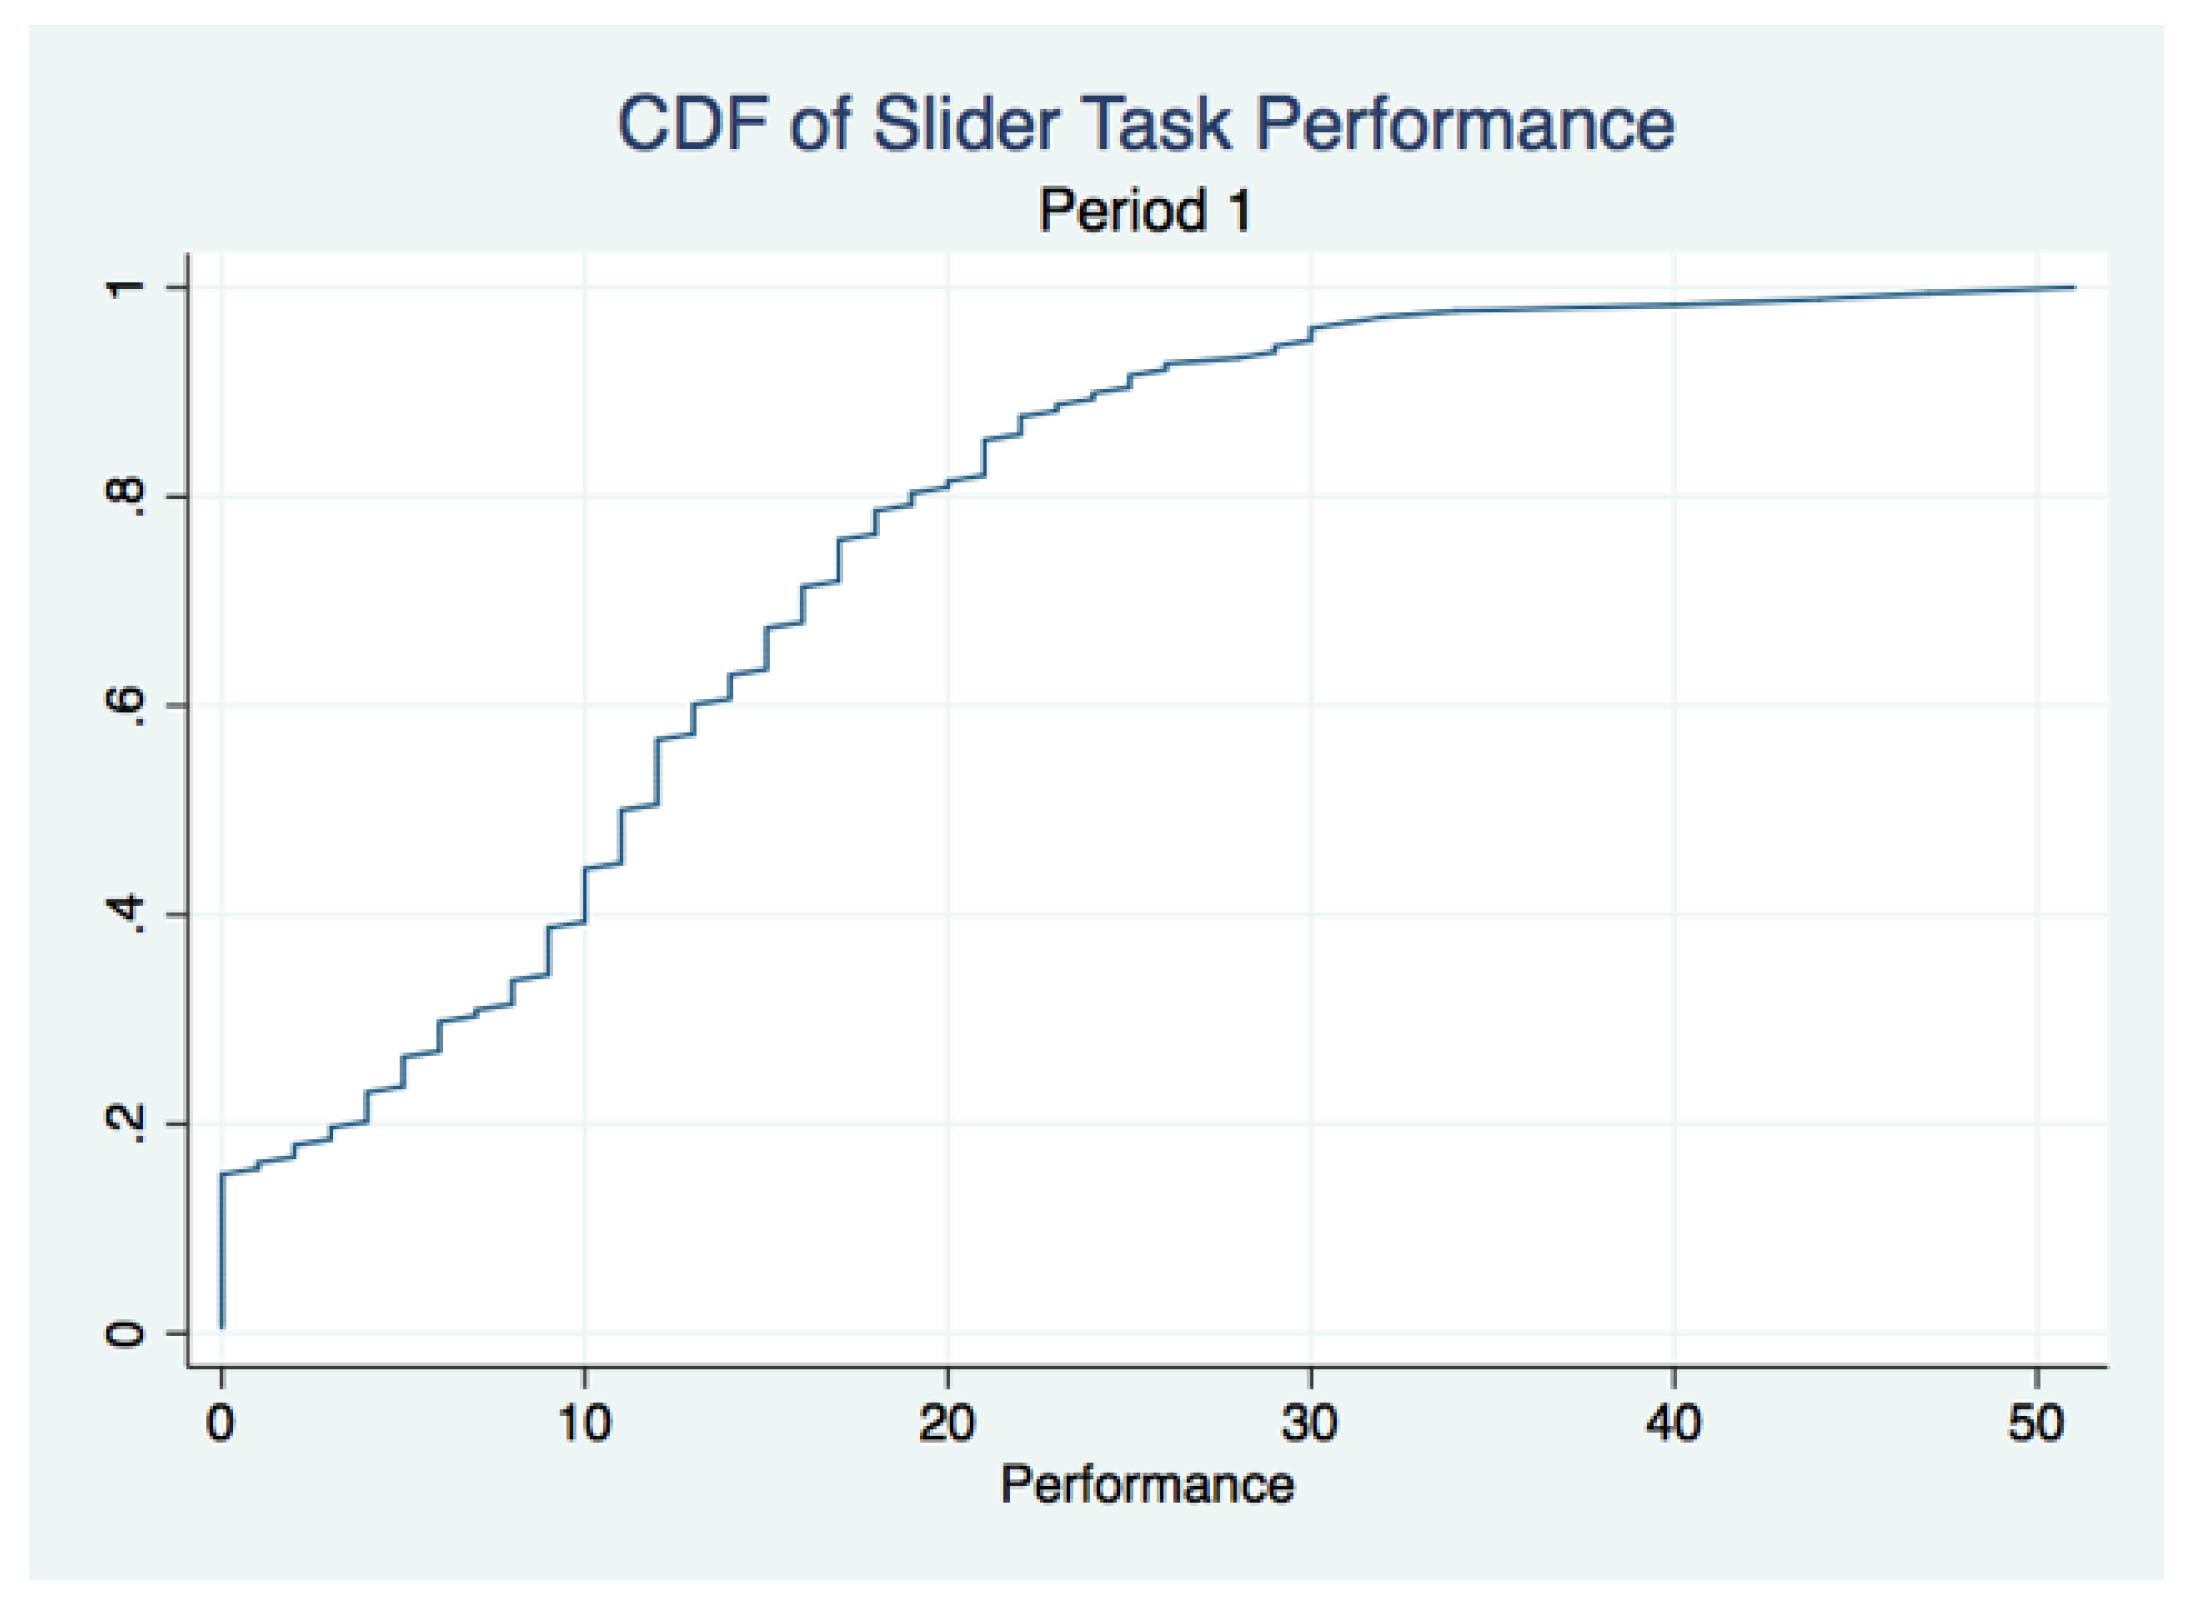
Figure A3.
Cumulative density function of slider task performance in Period 1.

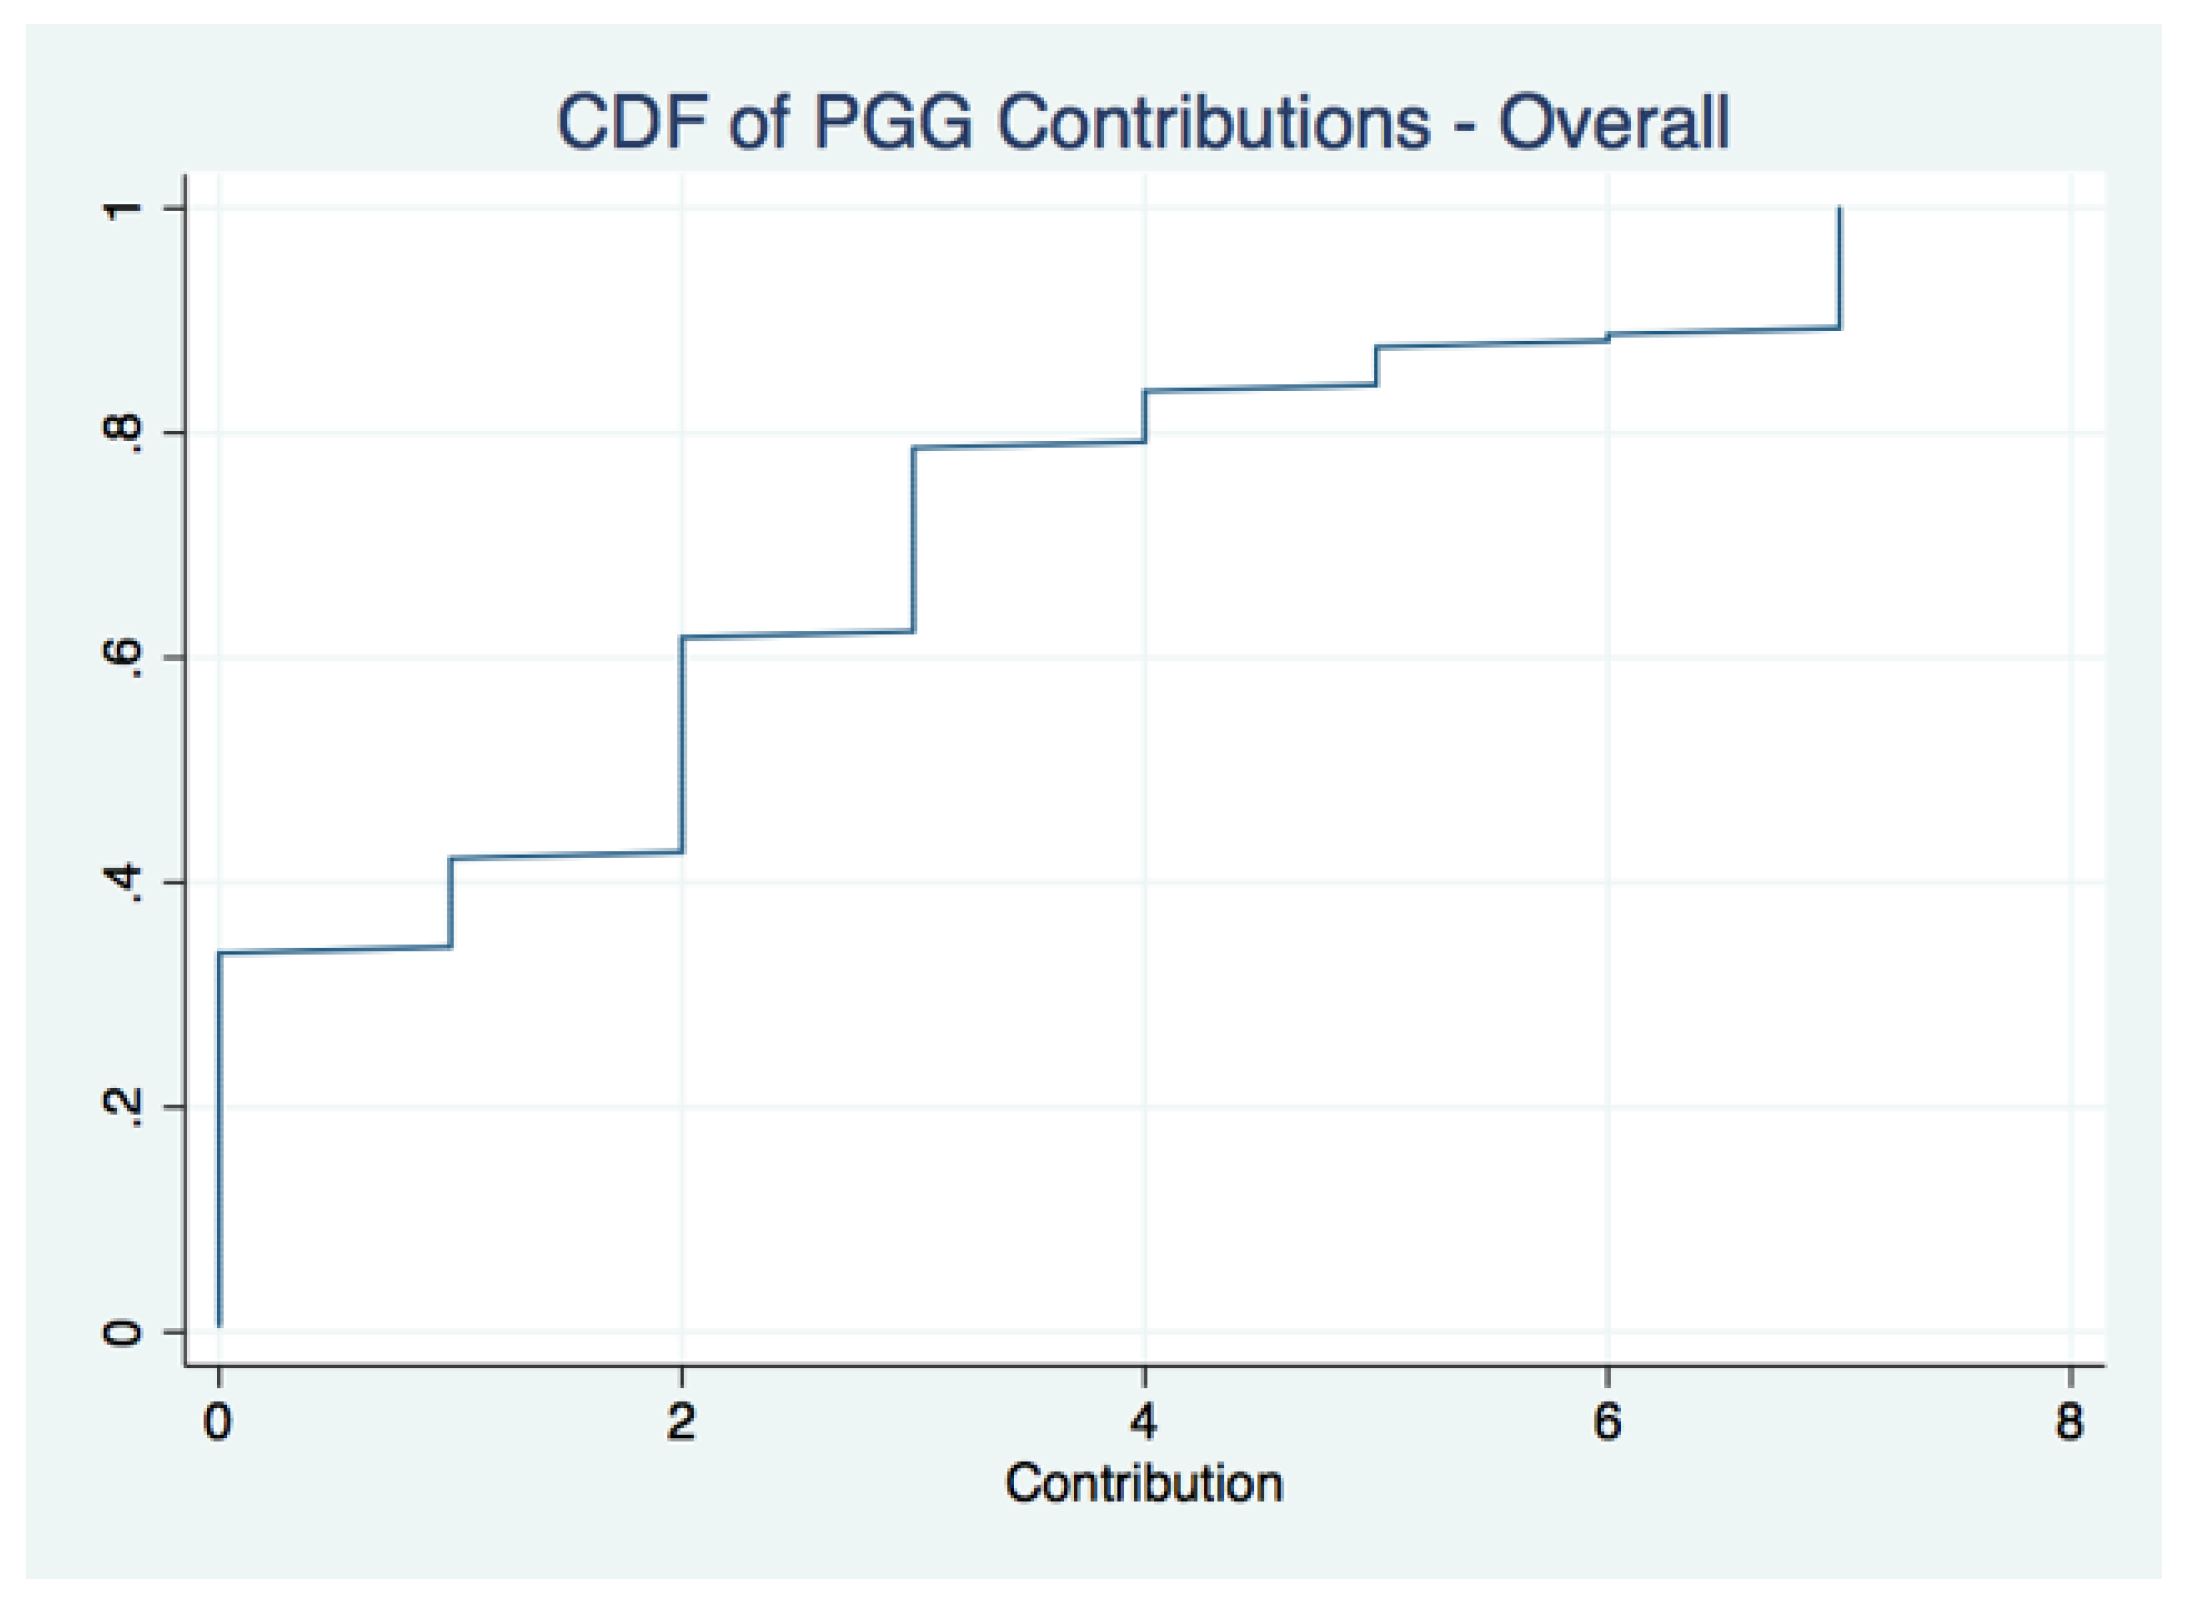
Figure A4.
Cumulative density function of public goods game contributions: all subjects.

Figure A5.
Cumulative density function of public goods game contributions: females.

Figure A6.
Cumulative density function of public goods game contributions: males.

References
- Cowgill, B. Competition and Productivity in Employee Promotion Contests; Working Paper; Columbia University: New York, NY, USA, 2015. [Google Scholar]
- Vanderkam, L. Can Coworkers Be Facebook Friends? Available online: http://www.cbsnews.com/news/can-coworkers-be-facebook-friends/ (accessed on 25 March 2016 ).
- Garcia, S.M.; Tor, A.; Schiff, T.M. The Psychology of Competition: A Social Comparison Perspective. Perspect. Psychol. Sci. 2013, 8, 634–650. [Google Scholar] [CrossRef] [PubMed]
- Fehr, E.; Gächter, S. Cooperation and Punishment in Public Goods Experiments. Am. Econ. Rev. 2000, 90, 980–994. [Google Scholar] [CrossRef]
- Fehr, E.; Gächter, S. Altruistic Punishment in Humans. Nature 2002, 415, 137–140. [Google Scholar] [CrossRef] [PubMed]
- Fehr, E.; Gächter, S. Fairness and Retaliation: The Economics of Reciprocity. J. Econ. Perspect. 2000, 14, 159–181. [Google Scholar] [CrossRef]
- Rabin, M. Incorporating Fairness into Game Theory and Economics. Am. Econ. Rev. 1993, 83, 1281–1302. [Google Scholar]
- Blount, S. When Social Outcomes aren’t Fair: The Effect of Causal Attributions on Preferences. Org. Behav. Hum. Decis. Process. 1995, 63, 131–144. [Google Scholar] [CrossRef]
- Dufwenberg, M.; Kirchsteiger, G. A Theory of Sequential Reciprocity. Games Econ. Behav. 2004, 47, 268–298. [Google Scholar] [CrossRef]
- Falk, A.; Fischbacher, U. A Theory of Reciprocity. Games Econ. Behav. 2006, 54, 293–315. [Google Scholar] [CrossRef]
- Bettencourt, B.A.; Miller, N. Gender Differences in Aggression as a Function of Provocation: A Meta-Analysis. Psychol. Bull. 1996, 119, 422–447. [Google Scholar] [CrossRef] [PubMed]
- Croson, R.; Gneezy, U. Gender Differences in Preferences. J. Econ. Lit. 2009, 47, 448–474. [Google Scholar] [CrossRef]
- Seguino, S.; Stevens, T.; Lutz, M.A. Gender and Coopertive Behavior: Economic Man Rides Alone. Fem. Econ. 1996, 2, 1–21. [Google Scholar] [CrossRef]
- Brown-Kruse, J.; Hummels, D. Gender Effects in Laboratory Public Goods Contribution: Do Individuals Put Their Money Where Their Mouth Is? J. Econ. Behav. Org. 1993, 22, 255–267. [Google Scholar] [CrossRef]
- Sell, J.; Wilson, R.K. Levels of Information and Contributions to Public Goods. Soc. Forces 1991, 70, 107–124. [Google Scholar] [CrossRef]
- Solow, J.L.; Kirkwood, N. Group Identity and Gender in Public Goods Experiments. J. Econ. Behav. Org. 2002, 48, 403–412. [Google Scholar] [CrossRef]
- Gneezy, U.; Niederle, M.; Rustichini, A. Performance in Competitive Environments: Gender Differences. Q. J. Econ. 2003, 118, 1049–1074. [Google Scholar] [CrossRef]
- Gneezy, U.; Rustichini, A. Gender and Competition at a Young Age. Am. Econ. Rev. 2004, 94, 377–381. [Google Scholar] [CrossRef]
- Niederle, M.; Vesterlund, L. Do Women Shy Away From Competition? Do Men Compete Too Much? Quart. J. Econ. 2007, 122, 1067–1101. [Google Scholar] [CrossRef]
- Cassar, A.; Wordofa, F.; Zhang, Y.J. Competing for the benefit of offspring eliminates the gender gap in competitiveness. Proc. Natl. Acad. Sci. USA 2016, 113, 5201–5205. [Google Scholar] [CrossRef] [PubMed]
- Halladay, B. Perception Matters: The Role of Task Gender Stereotype on Confidence and Tournament Selection. Available online: https://drive.google.com/file/d/0B12KspYJXnKccWdId3BuaEE4Q0U/view (accessed on 28 June 2017).
- Gneezy, U.; Imas, A. Materazzi effect and the strategic use of anger in competitive interactions. Proc. Natl. Acad. Sci. USA 2014, 111, 1334–1337. [Google Scholar] [CrossRef] [PubMed]
- Gill, D.; Prowse, V. A Novel Computerized Real Effort Task Based on Sliders. Available online: https://pdfs.semanticscholar.org/2f4b/34b2b6b751a8a56626d4607c2b0d9a9a899a.pdf (accessed on 28 June 2017).
- Charness, G.; Villeval, M.C. Cooperation and Competition in Intergenerational Experiments in the Field and in the Laboratory. Am. Econ. Rev. 2009, 99, 956–978. [Google Scholar] [CrossRef]
- Charness, G. Self-Serving CheapTalk: A Test Of Aumann’s Conjecture. Games Econ. Behav. 2000, 33, 177–194. [Google Scholar] [CrossRef]
- Greiner, B.; Levati, M.V. Indirect reciprocity in cyclical networks: An experimental study. J. Econ. Psychol. 2005, 26, 711–731. [Google Scholar] [CrossRef]
- Charness, G.; Fréchette, G.R.; Qin, C.Z. Endogenous transfers in the Prisoner’s Dilemma game: An experimental test of cooperation and coordination. Games Econ. Behav. 2007, 60, 287–306. [Google Scholar] [CrossRef]
- Fischbacher, U. z-Tree: Zurich toolbox for ready-made economic experiments. Exp. Econ. 2007, 10, 171–178. [Google Scholar] [CrossRef]
- Fehr, E.; Fischbacher, U. Social norms and human cooperation. TRENDS Cogn. Sci. 2004, 8, 185–190. [Google Scholar] [CrossRef] [PubMed]
- Kahneman, D.; Thaler, R.H.; Knetsch, J.L. Fairness and the Assumptions of Economics. J. Bus. 1986, 59, 285–300. [Google Scholar] [CrossRef]
- Bolle, F.; Tan, J.H.W.; Zizzo, D.J. Vendettas. Am. Econ. J. Microecon. 2014, 6, 93–130. [Google Scholar] [CrossRef]
- Charness, G.; Rabin, M. Understanding Social Preferences with Simple Tests. Quart. J. Econ. 2002, 117, 817–869. [Google Scholar] [CrossRef]
- Charness, G. Attribution and Reciprocity in an Experimental Labor Market. J. Labor Econ. 2004, 22, 665–688. [Google Scholar] [CrossRef]
- Offerman, T. Hurting hurts more than helping helps. Eur. Econ. Rev. 2002, 46, 1423–1437. [Google Scholar] [CrossRef]
- Buser, T.; Dreber, A. The Flipside of Comparative Payment Schemes. Manag. Sci. 2015, 62, 2626–2638. [Google Scholar] [CrossRef]
- Eckel, C.C.; Grossman, P.J. The relative price of fairness: Gender differences in a punishment game. J. Econ. Behav. Org. 1996, 30, 143–158. [Google Scholar] [CrossRef]
- Christensen, A.; Sullaway, M.; King, C.E. Systematic error in behavioral reports of dyadic interaction: Egocentric bias and content effects. Behav. Assess. 1983, 5, 129–140. [Google Scholar]
- Dechenaux, E.; Kovenock, D.; Sheremeta, R.M. A survey of experimental research on contests, all-pay auctions and tournaments. Exp. Econ. 2015, 18, 609–669. [Google Scholar] [CrossRef]
- Wozniak, D. Gender differences in a market with relative performance feedback: Professional tennis players. J. Econ. Behav. Org. 2012, 83, 158–171. [Google Scholar] [CrossRef]
- Grimm, V.; Mengel, F. Let me sleep on it: Delay reduces rejection rates in ultimatum games. Econ. Lett. 2011, 111, 113–115. [Google Scholar] [CrossRef]
- Kräkel, M. Emotions in Tournaments. J. Econ. Behav. Org. 2008, 67, 204–214. [Google Scholar] [CrossRef]
- Cotton, C.; McIntyre, F.; Price, J. Gender differences in repeated competition: Evidence from school math contests. J. Econ. Behav. Org. 2013, 86, 52–66. [Google Scholar] [CrossRef]
- Araujo, F.A.; Carbone, E.; Conell-Price, L.; Dunietz, M.W.; Jaroszewicz, A.; Landsman, R.; Lamé, D.; Vesterlund, L.; Wang, S.W.; Wilson, A.J. The slider task: An example of restricted inference on incentive effects. J. Econ. Sci. Assoc. 2015, 2, 1–12. [Google Scholar] [CrossRef]
- Erkal, N.; Gangadharan, L.; Koh, B.H. What Motivates Participants in Real-Effort Tasks: Is It the Journey or the Destination? Available online: http://www.contests-conference-2016.qut.edu.au/documents/151201-abstract(2).pdf (accessed on 28 June 2017).
- Donald, S.G.; Lang, K. Inference with Difference-in-Differences and Other Panel Data. Rev. Econ. Stat. 2007, 89, 221–233. [Google Scholar] [CrossRef]
| 1 | Using a survey of 15,000 employed Americans, re-weighted to match the census tracts, Bo Cowgill (2015) [1] finds that roughly 77% of Americans face intra-worker competition that is a significant component of wage determination. Cowgill points out that a significant number of large firms is known to use some form of tournament for promotions. A few of the listed firms include Adobe, AIG, Amazon, American Express, Cisco Systems, Conoco, Dow Chemical, Enron, Expedia, Facebook, Ford, General Electric, GlaxoSmithKline, Goldman Sachs, Goodyear Tire, Google, Hewlett-Packard, IBM, Intel, LendingTree, Lucent, Microsoft, Motorola, Sun Microsystems Valve and Yahoo. |
| 2 | Furthermore, CBS News [2] noted that “work and life are a mishmash now.” |
| 3 | Previous research provides evidence that the public goods game environment successfully generates emotions (Fehr and Gächter, 2002) [5]. |
| 4 | For example, I rate my three group members 1, 4 and 5. In the PF treatment, I would be matched with the individual I rated a five. In the NF treatment, I would be matched with the individual I rated a one. In the MF treatment, I would be matched with the individual I rated a four. If two individuals received the same rating, one was randomly assigned as the opponent. |
| 5 | This slight difference is due to unequal treatment sizes. I had 72 subjects in the negative feelings treatment, 64 subjects in the positive feelings treatment, and 42 subjects in the middle feelings treatment. My goal was to have the same number of subjects in the negative feelings treatment as the positive feelings treatment, but based on no-show subjects and the need for groups of 4 for the public goods game, I ended up having two extra groups in the negative feelings treatment compared to the positive feelings treatment. Because changes in behavior tend to observable at the extremes, I planned on less subjects in the middle feelings treatment. |
| 6 | Kräkel (2008) [41] provides evidence that relative performance feedback induces emotions. |
| 7 | |
| 8 | Future work with more observations can definitely expand on this analysis to further understand the role of feedback in the behavioral responses including any gender differences. |
| 9 | Suppose a subject is in a group with individuals who all contribute their entire endowment. This subject is most likely going to report positive feelings for all group members. Therefore, even if this subject is in the negative feelings treatment, they did not experience negative feelings and should therefore not be grouped with other individuals who did. |
| 10 | These bins do not have a large number of subjects and thus may suffer from lack of power and may be just suggestive. Follow-up experiments with more subjects can confirm these results. |
| 11 | Araujo et al. (2015) [43] and Erkal et al. (2016) [44] find very little evidence of behavioral responses to changing incentives on the slider task both in a piece-rate environment and in a tournament environment. Additionally, Erkal et al. (2016) [44] note that competitiveness is not shown the be motivating any behavioral response. An experimenter might therefore find a null result while in fact the null result is just due to the characteristics of the chosen task. The fact that I do observe a large increase in performance on the slider task for a group of subjects suggests that this jump stems from the emotional response. |
| 12 | Regressing performance on opponent rating, I find a marginally significant and negative trend using a two-sided test (p = 0.082), further demonstrating the increase in performance when competing with an opponent one rated as strongly negative. |
| 13 | Some of this ambiguity can be further refined through replication experiments with more subjects. |
| 14 | There were only six females who were categorized as “badly wronged” and this small sample size could be what is responsible for the large p-values. |
Figure 1.
Persons who contributed more in the public goods game generated more positive emotions in others.
Figure 1.
Persons who contributed more in the public goods game generated more positive emotions in others.

Figure 2.
Persons who contributed more in the public goods game generated more positive emotions in both males and females. There is no difference in ratings assigned by males and females conditional on opponent contribution to the public goods game.
Figure 2.
Persons who contributed more in the public goods game generated more positive emotions in both males and females. There is no difference in ratings assigned by males and females conditional on opponent contribution to the public goods game.

Figure 3.
Negative deviations from the average group contribution generated negative emotions while positive deviations from the average group contribution generated neutral or positive emotions.
Figure 3.
Negative deviations from the average group contribution generated negative emotions while positive deviations from the average group contribution generated neutral or positive emotions.

Figure 4.
There is no difference in average male and female public goods game contributions nor is there a difference in the distribution of male and female public goods game contributions.
Figure 4.
There is no difference in average male and female public goods game contributions nor is there a difference in the distribution of male and female public goods game contributions.

Figure 5.
Men outperform women in every round when aggregating all subjects.

Figure 6.
Men outperform women in every round when the opponent rating is not strongly negative. There is no gender gap in performance when the opponent rating is strongly negative.
Figure 6.
Men outperform women in every round when the opponent rating is not strongly negative. There is no gender gap in performance when the opponent rating is strongly negative.

Figure 7.
Men increase performance significantly more than women after relative performance feedback.
Figure 7.
Men increase performance significantly more than women after relative performance feedback.

Figure 8.
Average performance increases significantly when one strongly dislikes their opponent (assigned a rating of one).
Figure 8.
Average performance increases significantly when one strongly dislikes their opponent (assigned a rating of one).

Figure 9.
Average performance increases significantly when one strongly dislikes their opponent (assigned a rating of one).
Figure 9.
Average performance increases significantly when one strongly dislikes their opponent (assigned a rating of one).

Figure 10.
Average performance increases significantly when one strongly dislikes their opponent (assigned a rating of one).
Figure 10.
Average performance increases significantly when one strongly dislikes their opponent (assigned a rating of one).

Figure 11.
The increase in female performance in the presence of the strongly negative emotions is driving the overall observed performance increase.
Figure 11.
The increase in female performance in the presence of the strongly negative emotions is driving the overall observed performance increase.

Table 1.
Opponent rating by treatment.
| Opponent Rating | ||||||
|---|---|---|---|---|---|---|
| Treatment | 1 | 2 | 3 | 4 | 5 | Overall |
| Negative Feelings | 27 | 19 | 22 | 3 | 1 | 72 |
| Middle Feelings | 4 | 6 | 16 | 13 | 3 | 42 |
| Positive Feelings | 4 | 4 | 19 | 15 | 22 | 64 |
| Overall | 29 | 57 | 31 | 26 | 178 | |
Table 2.
Opponent rating by gender.
| Opponent Rating | ||||||
|---|---|---|---|---|---|---|
| Gender | 1 | 2 | 3 | 4 | 5 | Overall |
| Female | 19 | 17 | 31 | 18 | 15 | 100 |
| Male | 16 | 12 | 26 | 13 | 11 | 78 |
Table 3.
OLS regression results.
| Completed | |
|---|---|
| Slider Tasks | |
| Subject Contribution | 0.832 * |
| (0.425) | |
| Male | 4.302 ** |
| (1.732) | |
| Negative Feelings Treatment | 1.167 ** |
| (0.410) | |
| Positive Feelings Treatment | −2.070 ** |
| (0.780) | |
| Constant | 6.958 *** |
| (1.880) | |
| 0.1284 | |
| N | 178 |
| Session Dummies | Yes |
| Demographics | Yes |
* p < 0.10, ** p < 0.05, *** p < 0.01. p-values are two-sided. Standard errors in parentheses. Standard errors are clustered by session.
Table 4.
Difference in means.
| Group 1 | Group 1 | Group 2 | Group 2 | Difference in Means | Difference in Medians |
|---|---|---|---|---|---|
| Mean Perf. | Mean Perf. | (p-Value) | (p-Value) | ||
| All Subjects (Rating >1) | 11.56 | All Subjects (Rating = 1) | 15.91 | −4.35 ** | 4.00 ** |
| (0.0169) | (0.023) | ||||
| Males (Rating > 1) | 14.65 | Males (Rating = 1) | 15.63 | −0.98 | 2.00 |
| (0.7430) | (0.401) | ||||
| Females (Rating > 1) | 9.20 | Females (Rating = 1) | 16.16 | −6.96 *** | 4.00 * |
| (0.0012) | (0.073) | ||||
| Females (Rating = 1) | 16.16 | Males (Rating = 1) | 15.63 | 0.53 | 1.00 |
| (0.8850) | (1.00) | ||||
| Females (Rating > 1) | 9.20 | Males (Rating > 1) | 14.65 | −5.45 *** | 3.00 *** |
| (0.0004) | (0.004) |
p-values in parentheses. * p < 0.10, ** p < 0.05, *** p < 0.01.
Table 5.
OLS regression results.
| (1) | (2) | (3) | (4) | |
|---|---|---|---|---|
| Completed | Completed | Completed | Completed | |
| Slider Tasks | Slider Tasks | Slider Tasks | Slider Tasks | |
| Subject Contribution | 0.679 * | 0.607 | 0.647 | 0.621 |
| (0.357) | (0.370) | (0.386) | (0.375) | |
| Male | 4.353 ** | 4.230 ** | 4.234 ** | 5.461 ** |
| (1.778) | (1.833) | (1.799) | (1.614) | |
| Negative Feeling Dummy | 2.072 | |||
| (1.853) | ||||
| Positive Feeling Dummy | 1.419 | |||
| (1.208) | ||||
| Strongly Negative | 3.828 | 3.282 | 5.977 * | |
| (2.154) | (1.928) | (3.207) | ||
| Somewhat Negative | 0.528 | |||
| (1.979) | ||||
| Somewhat Positive | 0.801 | |||
| (2.010) | ||||
| Strongly Positive | 2.263 | |||
| (2.251) | ||||
| Strongly Negative * Male | −5.940 * | |||
| (3.289) | ||||
| Constant | 6.968 ** | 6.926 ** | 7.352 ** | 7.051 ** |
| (2.852) | (2.878) | (2.175) | (2.196) | |
| 0.1347 | 0.1456 | 0.1413 | 0.1551 | |
| N | 178 | 178 | 178 | 178 |
| Session Dummies | Yes | Yes | Yes | Yes |
| Demographics | Yes | Yes | Yes | Yes |
* p < 0.10, ** p < 0.05. p-values are two-sided. Standard errors in parentheses. Standard errors are clustered by session.
© 2017 by the author. Licensee MDPI, Basel, Switzerland. This article is an open access article distributed under the terms and conditions of the Creative Commons Attribution (CC BY) license (http://creativecommons.org/licenses/by/4.0/).
Share and Cite
MDPI and ACS Style
Halladay, B. Gender, Emotions, and Tournament Performance in the Laboratory. Games 2017, 8, 26. https://0-doi-org.brum.beds.ac.uk/10.3390/g8030026
AMA Style
Halladay B. Gender, Emotions, and Tournament Performance in the Laboratory. Games. 2017; 8(3):26. https://0-doi-org.brum.beds.ac.uk/10.3390/g8030026
Chicago/Turabian StyleHalladay, Brianna. 2017. "Gender, Emotions, and Tournament Performance in the Laboratory" Games 8, no. 3: 26. https://0-doi-org.brum.beds.ac.uk/10.3390/g8030026
Note that from the first issue of 2016, this journal uses article numbers instead of page numbers. See further details here.