NOM (HA and FA) Reduction in Water Using Nano Titanium Dioxide Photocatalysts (P25 and P90) and Membranes


Silesian University of Technology, Faculty of Energy and Environmental Engineering, 44-100 Gliwice, Poland
Catalysts 2020, 10(2), 249; https://0-doi-org.brum.beds.ac.uk/10.3390/catal10020249
Submission received: 22 November 2019
/
Revised: 11 February 2020
/
Accepted: 13 February 2020
/
Published: 19 February 2020
(This article belongs to the Special Issue Photocatalytic Degradation of Organic Wastes in Water)
Abstract
:This study examined the removal of natural organic substances (humic acids-HA, and fulvic acids-FA) from model solutions using photocatalysis and ultrafiltration. The effect of two nano titanium dioxide types (P25 and P90) with different active surface areas and two UV lamps (low-pressure and medium-pressure) on the effectiveness of FA and HA removal during photocatalysis was tested. An integrated photocatalytic + ultrafiltration system was also analyzed to determine the effectiveness of FA and HA removal and the changes in the relative permeate flux (Ultrafiltration Membrane Fouling-UF). We observed that photocatalysis using the P90 nano titanium dioxide was more efficient than the P25 due to the larger surface area (2×). The decomposition of organic substances proceeded efficiently up to 30 min of solution exposure, and the use of a medium-pressure lamp accelerated compound decomposition relative to the low-pressure lamp. The applied photocatalysis + ultrafiltration system was characterized by a high degree of FA removal while improved hydraulic efficiency was observed during ultrafiltration.
1. Introduction
Natural organic matter (NOM) found in aquatic ecosystems is a mixture of water-soluble humic substances/solvents; these include fulvic acids (MW ≤ 2000 Da, soluble at all pH levels), humic (humus) acids (MW > 2000 Da, insoluble at pH < 2), hymatomelic acids (soluble in alcohol) and insoluble compounds called humins [1,2]. The dissolved NOM fraction accounts for approximately 80–90% of the total NOM amount in natural waters. In their structural composition, natural organic substances have methyl groups responsible for by-product formation during water chlorination and are suspected to possess carcinogenic and mutagenic properties [2,3,4]. Clearly, these and other unfavorable factors related to the occurrence of natural organic substances in water necessitate their removal from water intended for human consumption. The specific structures of humic substances suggest they are characterized by high chemical activity and can react with various organic and inorganic admixtures in natural waters. This means they may carry toxic micro-pollutants and can significantly complicate water purification technology. The most commonly used technological systems consist of classic unit processes such as coagulation, flocculation, and filtration in sand filters. None of these processes, even when they are combined with sorption on activated carbon, result in highly efficient water purification due to the significant seasonal variability of natural organic properties and a tendency for increased concentrations. Therefore, a key operation in the design and operation of water treatment processes is the need to develop advanced NOM removal methods that improve or even replace conventional water treatment methods [5].
The advanced methods of water treatment worth noting are: Advanced Oxidation Processes (AOP) (e.g., heterogeneous photocatalysis), [6] and pressure membrane processes, which are divided into low-pressure (microfiltration-MF, and ultrafiltration-UF) and high-pressure (nanofiltration-NF and reverse osmosis-RO) [1,7,8].
Heterogeneous photocatalysis uses several different semiconductors as catalysts (e.g., TiO2, ZnO, ZnS, WO3, SrTiO3) [1]. However, TiO2 is the most commonly used photocatalyst due to its high photocatalytic activity and environmentally friendly properties [9,10,11].
In practice, TiO2 powder photocatalysts are widely used in the form of suspensions with diameters in the nanometer range and combine high photocatalytic activity with chemical stability. Nevertheless, the use of a catalyst in the form of suspension requires an additional removal step from purified water [1,5]. Membrane filtration can be used for the separation of TiO2 nanoparticles from treated water, especially microfiltration (MF), ultrafiltration (UF), and nanofiltration (NF) [1,7,8,12].
The aim of the present study was to compare the photocatalytic activity of two commercially available TiO2 photocatalysts (P25, P90) used for removing natural organic substances from model aqueous solutions, containing fulvic or humic acids, in the photocatalysis process as well as an integrated photocatalysis + ultrafiltration process.
2. Results and Discussion
2.1. Adsorption of FA and HA on Nano Titanium Dioxides
The photocatalyst surface can be a decisive parameter affecting the efficiency of a photochemical reaction. Its size determines the number of active centers on which the adsorption of organic particles takes place. Titanium dioxide particles have surface OH groups which serve as adsorption sites for organic compounds. However, a disadvantage of photocatalysts with high specific surface areas is a large number of crystalline defects that favor electron recombination as well as holes, both of which contribute to a reduction in their photocatalytic activity [13]. It has been proven that the specific surface area depends on the amount and size of the amorphous and crystalline phase photocatalyst particles that occur during calcination; the photocatalytic activity of amorphous TiO2 is small and indicates that crystallinity is an important requirement [14]. Experimental studies [13] have confirmed an optimal particle size of ~10 nm for optimal photocatalytic oxidation of organic substrates.
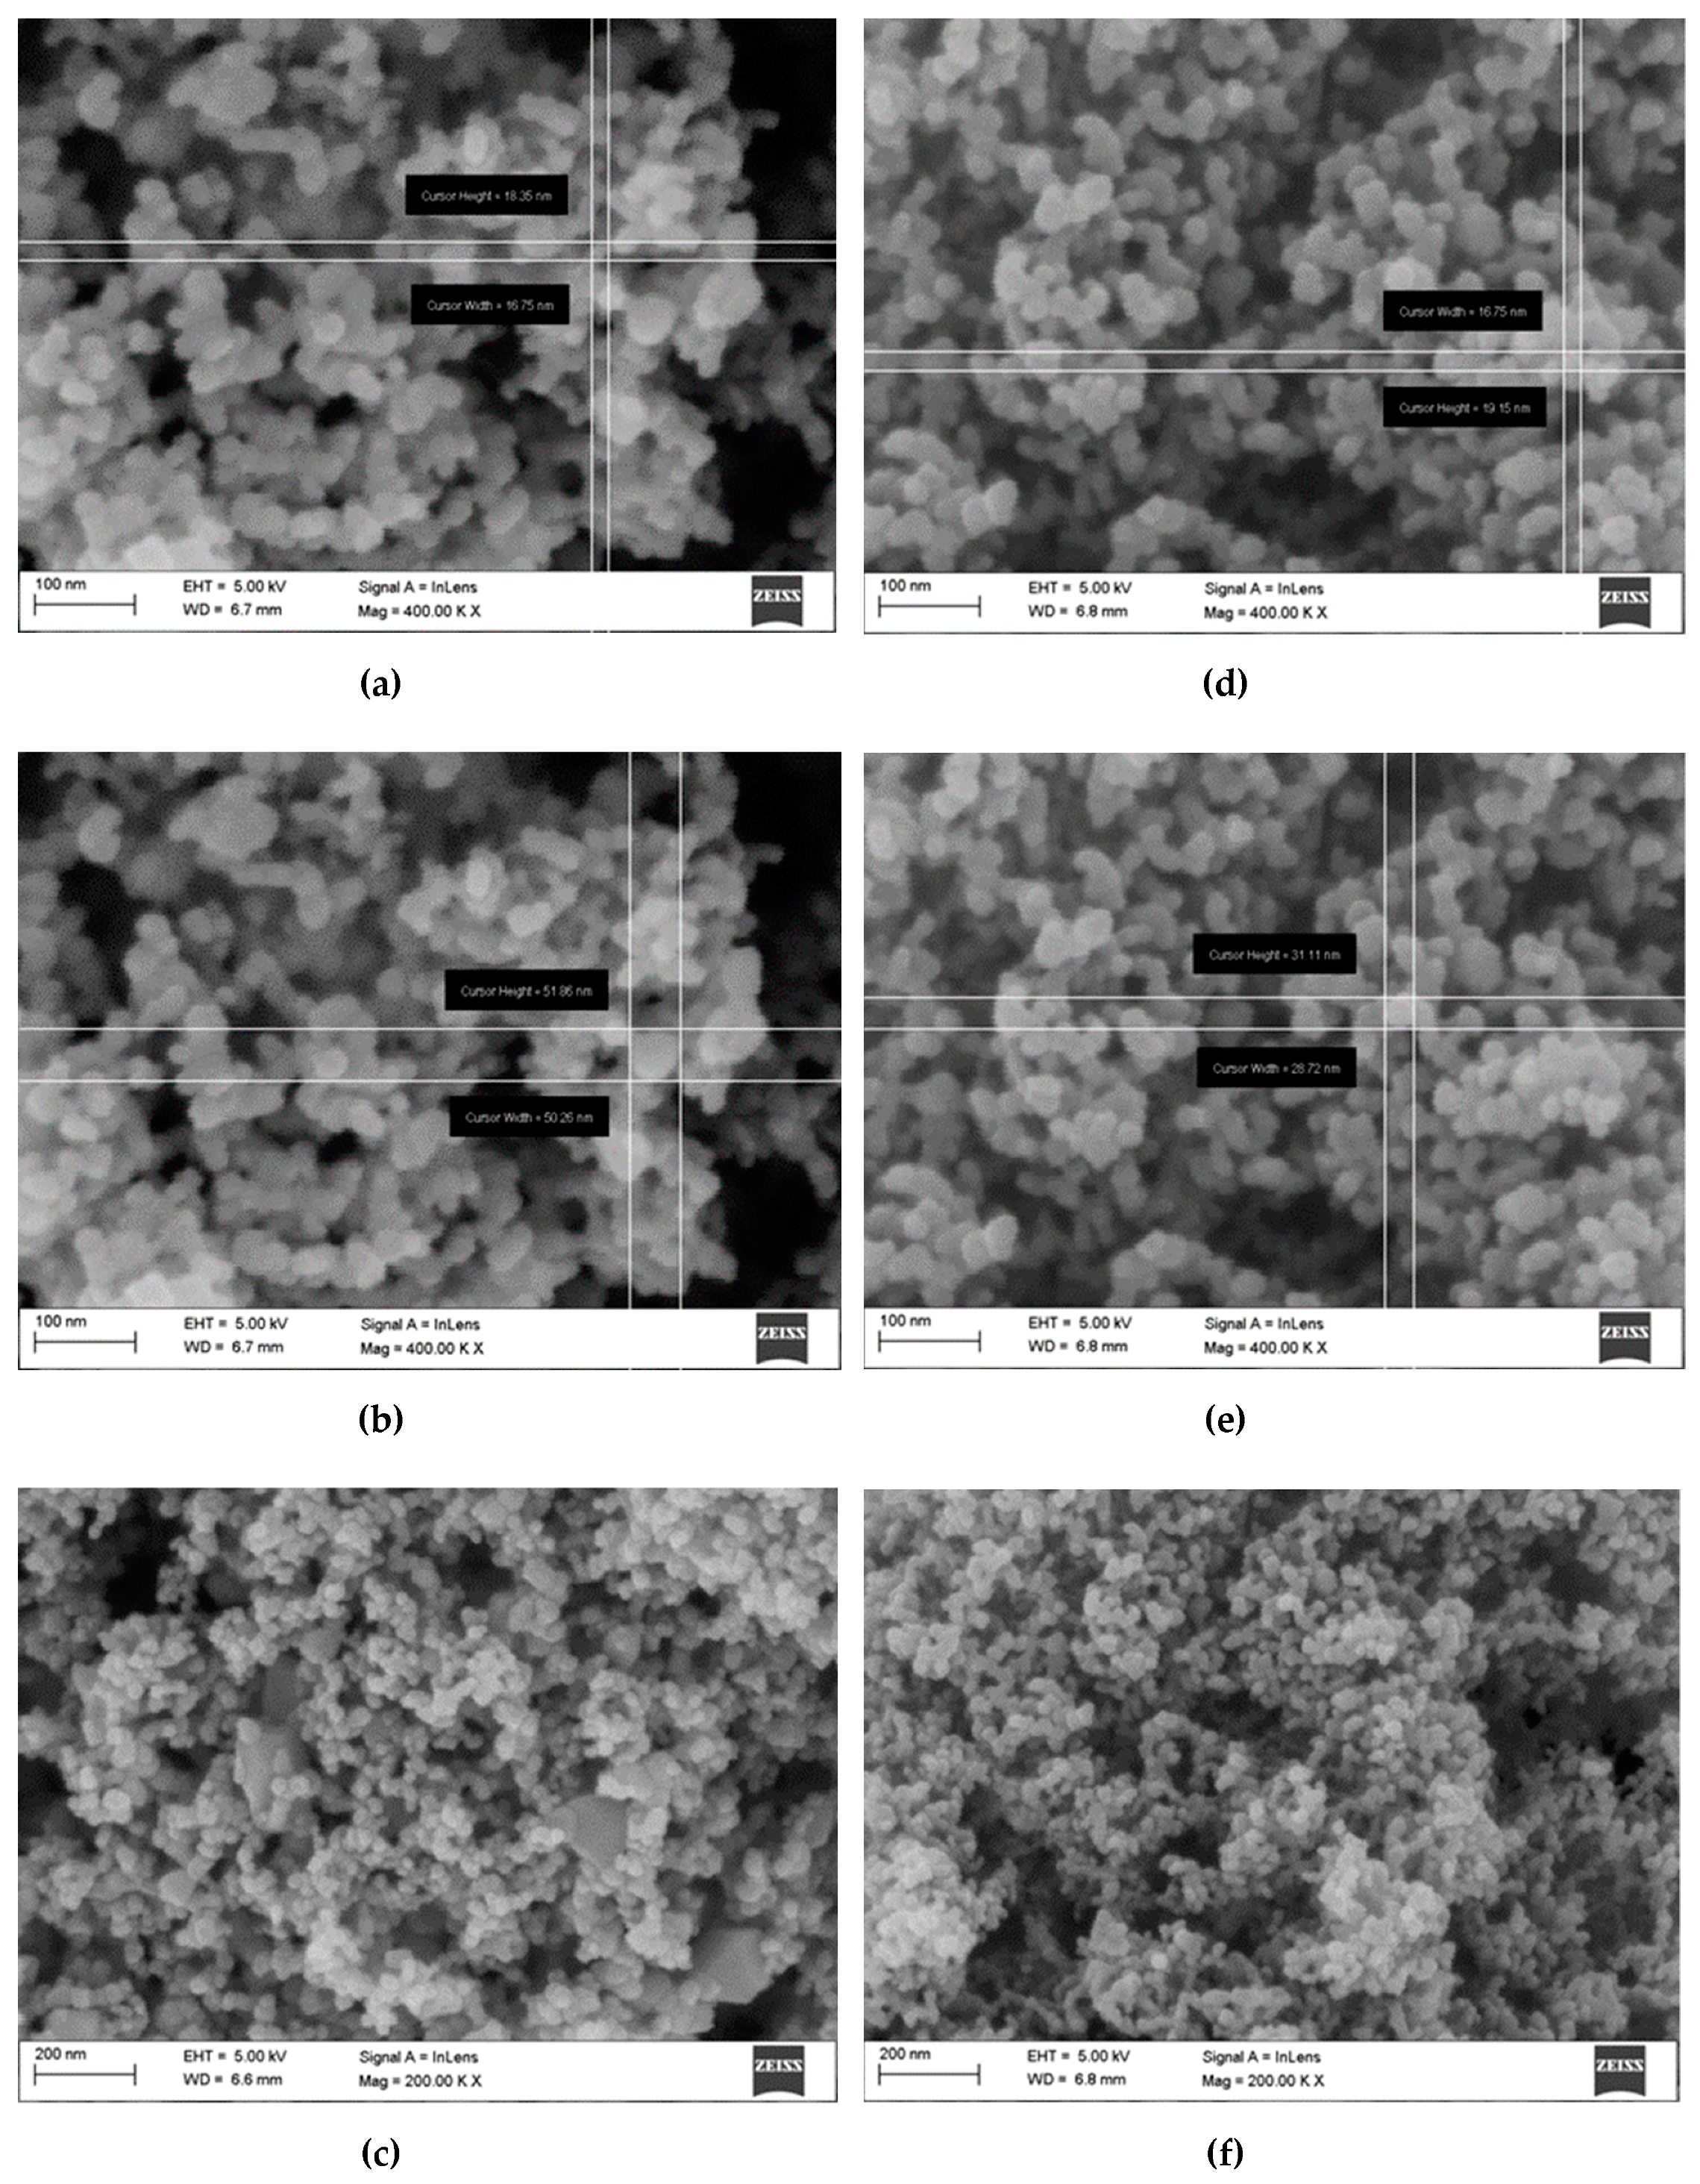
Figure 1 shows SEM images used in the studies of the P25 and P90 titanium dioxide photocatalysts characterized by surface area. Namely, the specific surface area of the P25 titanium dioxide was 50 ± 15 m2/g; the P90 had a much higher specific surface area (90 ± 20 m2/g, manufacturer’s data) [15]. Microscopic analyses confirmed the manufacturer’s specifications, as greater fragmentation of the P90 photocatalyst particles was observed (Figure 1d–f), as well as greater uniformity in size relative to the P25 photocatalyst particles (Figure 1a–c). The particle sizes measured in the P25 titanium dioxide powder ranged from 16 × 18 nm to 51 × 51 nm; the P90 particle sizes were 16 × 19 nm and 28 × 31 nm. The P25 titanium dioxide powder contained even larger particles (crystallites, Figure 1c) than the dimensions given, while no such differentiation was observed for the P90 powder (Figure 1f). It was observed that most of the particles were >10 nm, which potentially allows for optimal oxidation of organic substances [13].
In summary, the material properties of photocatalysts (ratios of anatase and rutile forms of TiO2, crystal size, surface area) may have an effect on their activity for organic substances (FA and HA) reduction.
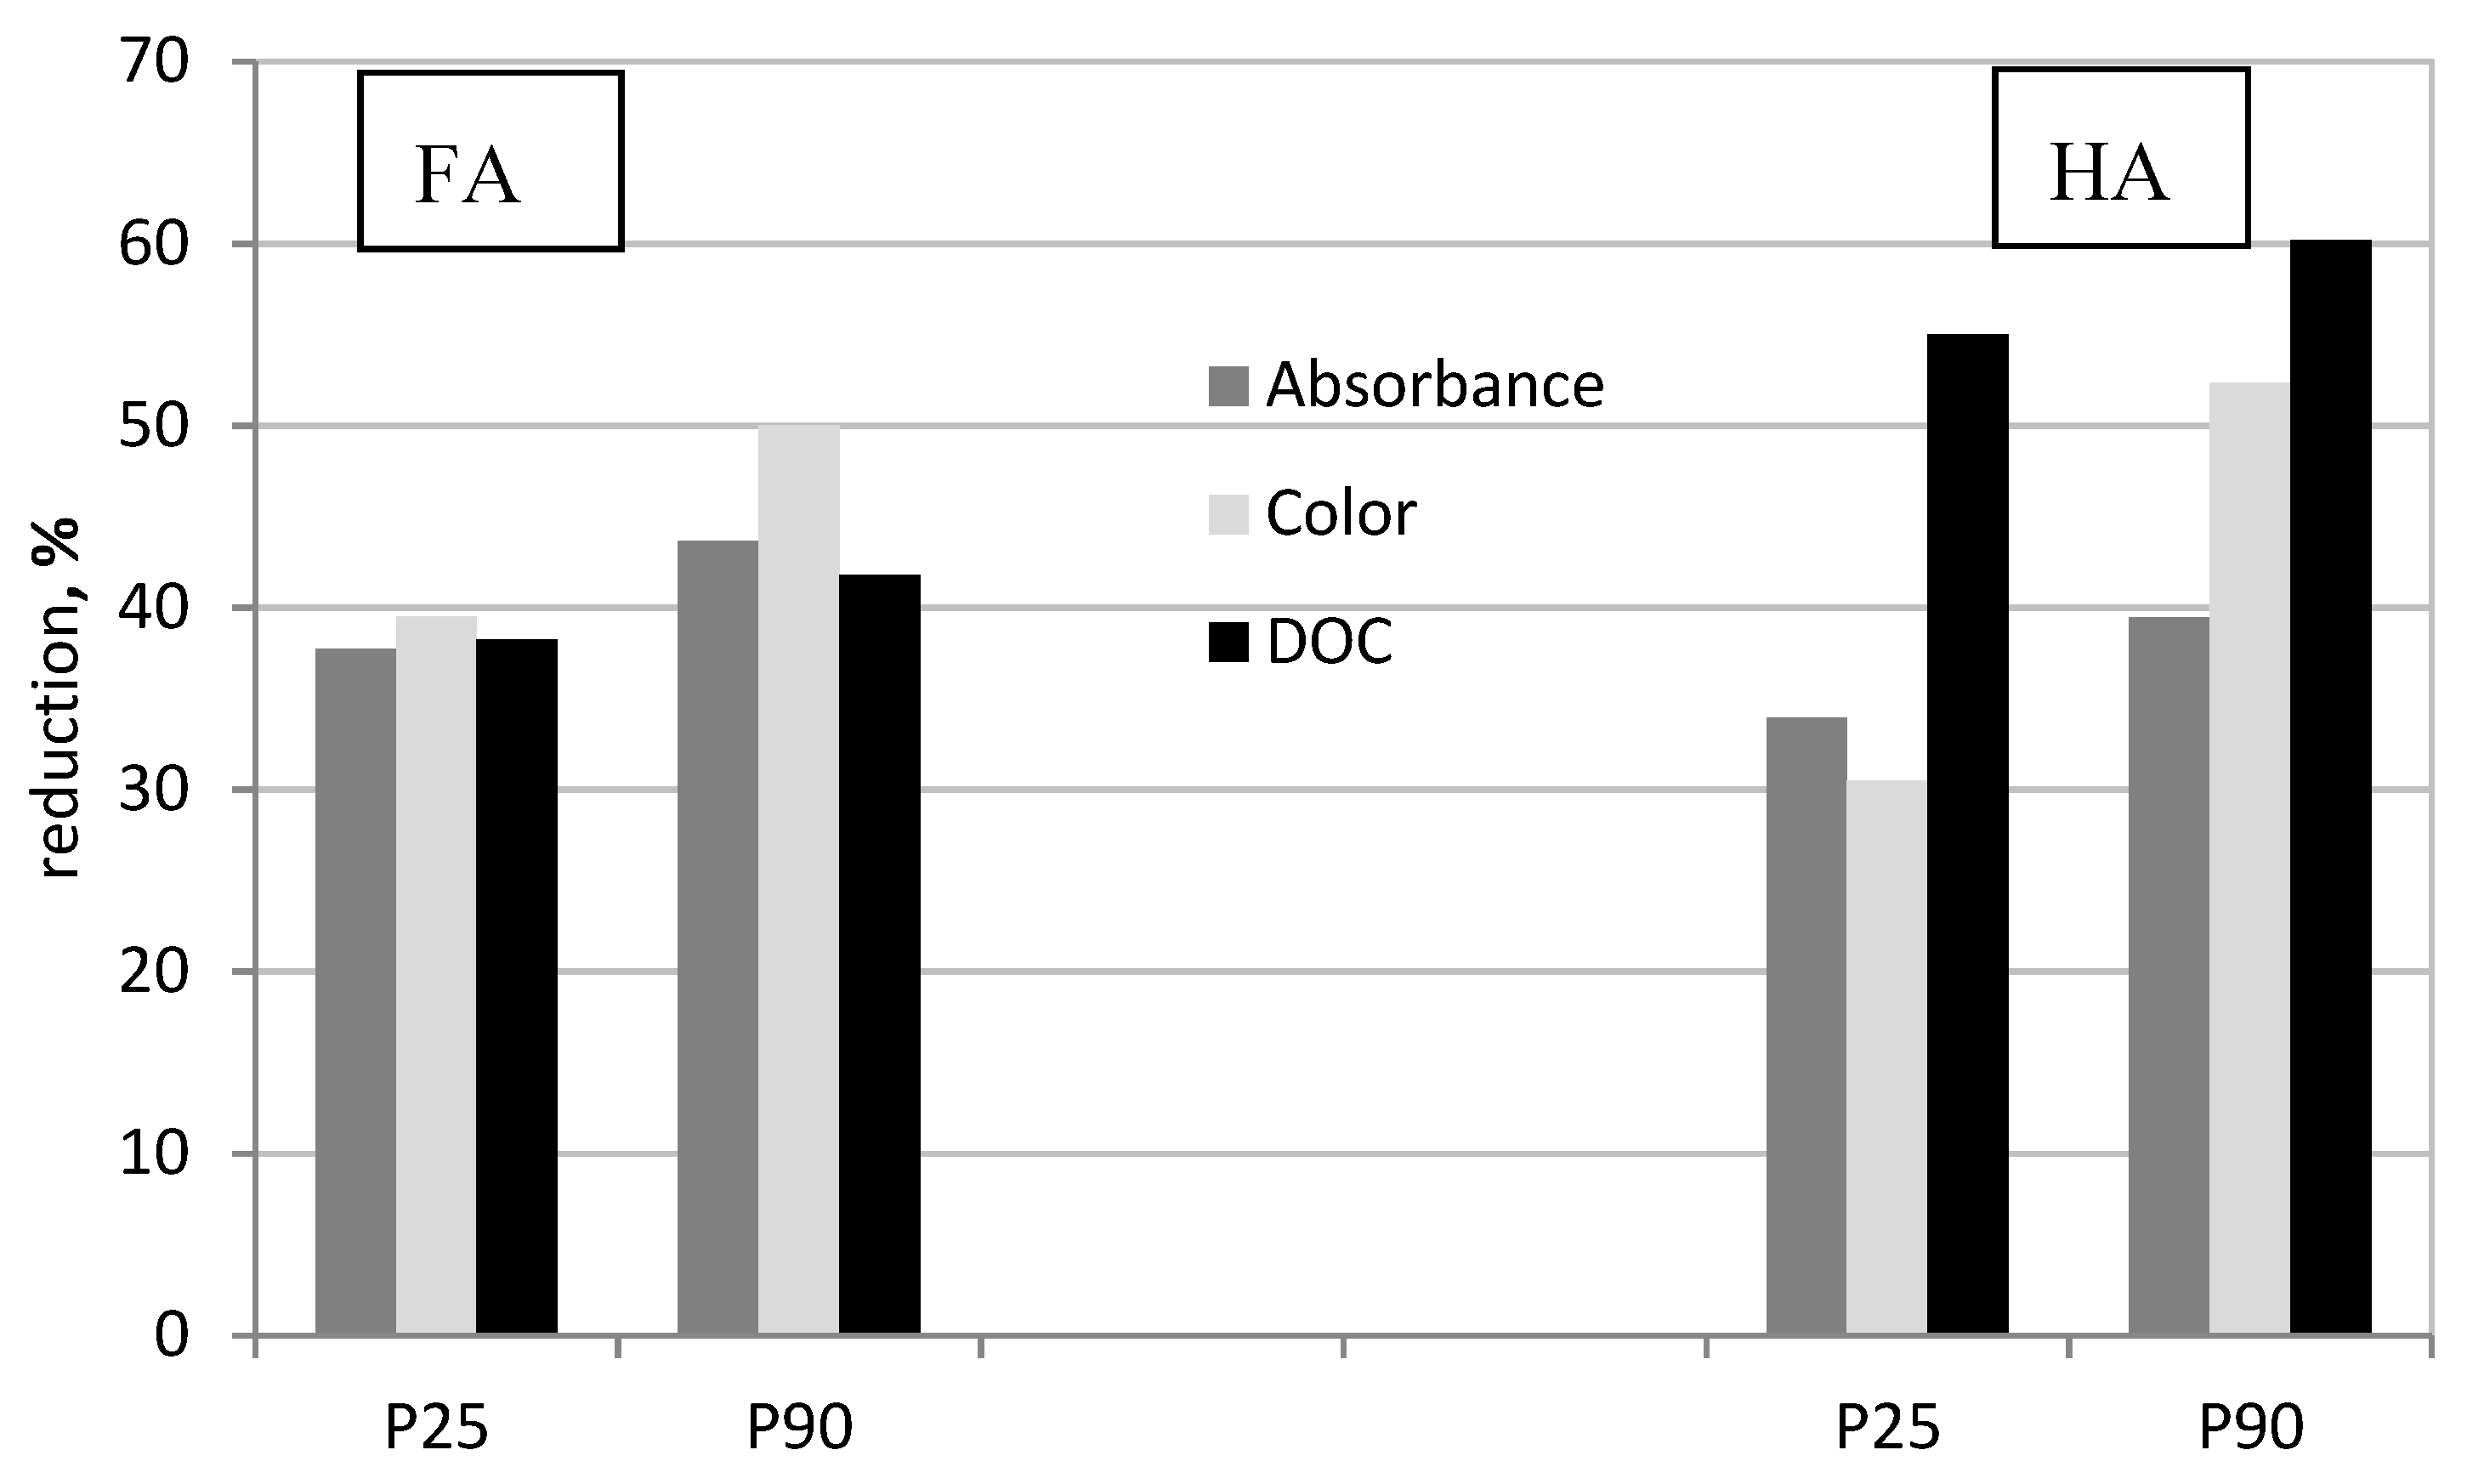
Figure 2 shows the adsorption results of fulvic and humic acids with the P25 and P90 titanium oxides in catalytic processes carried out under identical conditions.
As expected, the results show that the P90 photocatalyst’s smaller crystal size and thus, larger surface area, confirm the higher effectiveness of Fa and HA removal. The higher efficiency of the P90 photocatalyst is also dictated by the higher isoelectric point (6.6) than the P25 photocatalyst (6.4), which influences the attraction of the negatively charged FA or HA during the adsorption. For the P90 material, higher reduction results from the indicators were observed (254 nm absorbance, color and dissolved organic carbon-DOC). Humic acids were slightly better adsorbed on the P90 photocatalyst particles than fulvic acids. However, such observations were only confirmed by the DOC; absorbance was shaped at similar levels for both organic compounds and indicated that the aromatic particles were adsorbed with equal efficiency. The higher results obtained for the humic acid DOC levels show how diverse these compounds are in terms of structural composition and functional groups. Erhayem M. and Sohn M. [14] reported that humic and fulvic acid concentrations affected the stability of nano-titanium dioxides. They concluded that the adsorption of these common NOM onto nanoparticles TiO2 was similar; however, there were important structural differences.
2.2. Photocatalytic Decomposition of FA and HA
According to IUPAC, photocatalysis involves the absorption of light by a photocatalyst or substrate [16]. A photocatalyst is a substance that facilitates a reaction in the presence of light but is not consumed during that reaction. The radiation of appropriate energy may result in the photoexcitation of the catalyst with a charge transfer towards the reactants in the ground state (a sensitized reaction) or during excitation of the adsorbate with a charge transfer to the photocatalyst (catalyzed photoreaction).
The degradation rate (r) of organic substances during photocatalysis can be determined using the Langmuir-Hinshelwood (L-H) model. The rate is directly proportional to the rate of surface cover with the organic substrate (Θx) [1,16,17,18] according to Equation (1). Table 1 shows the degradation reaction rates for FA and HA. To interpret the decomposition rate, first-order reaction kinetics were used. Thus, reaction rate constants were calculated using Equation (2), while the linear dependence of ln(Ct/C0) on time was used to calculate the reaction rate constants and half-lives of natural organic substances.
where r-rate degradation, l/(m2·min); k-reaction rate constant, l/min; t-time, min; K-Langmuir’s adsorption constant; C-organic substance concentration, mg/L; Ct-organic substance concentration at time t, mg/L, C0-initial concentration of natural organic substances, mg/L.
lnCt = lnC0 − kt
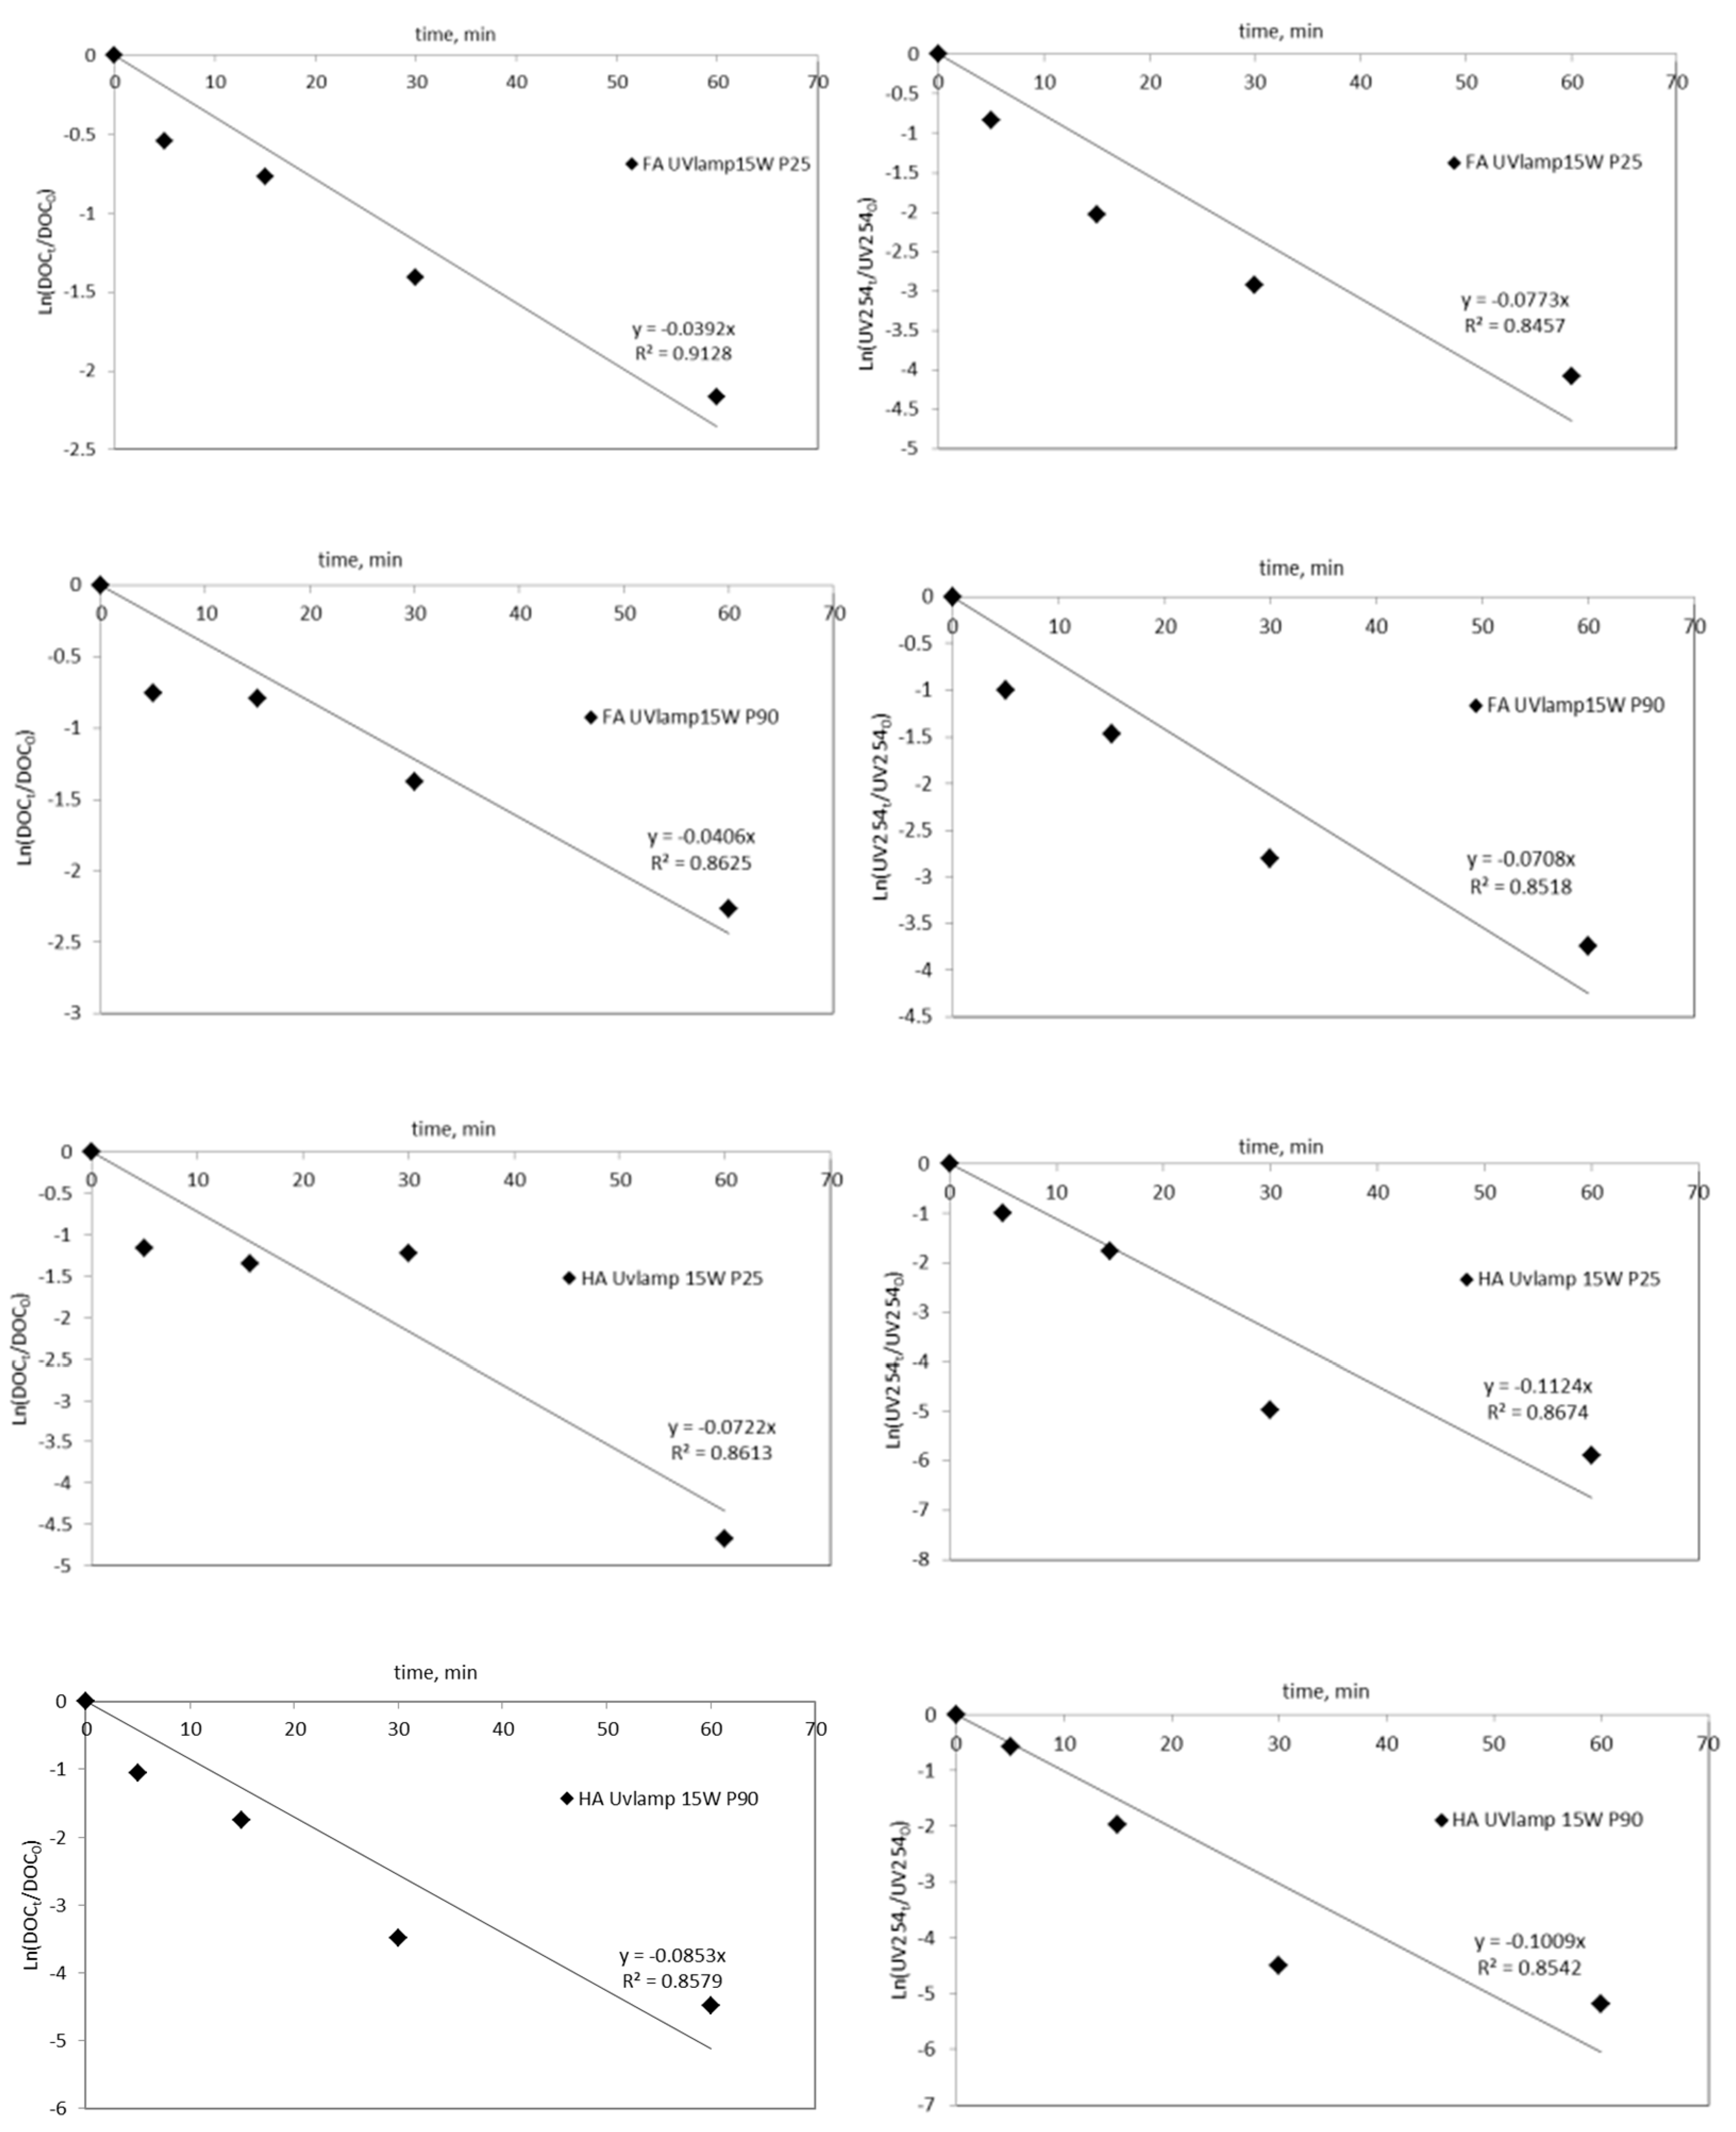
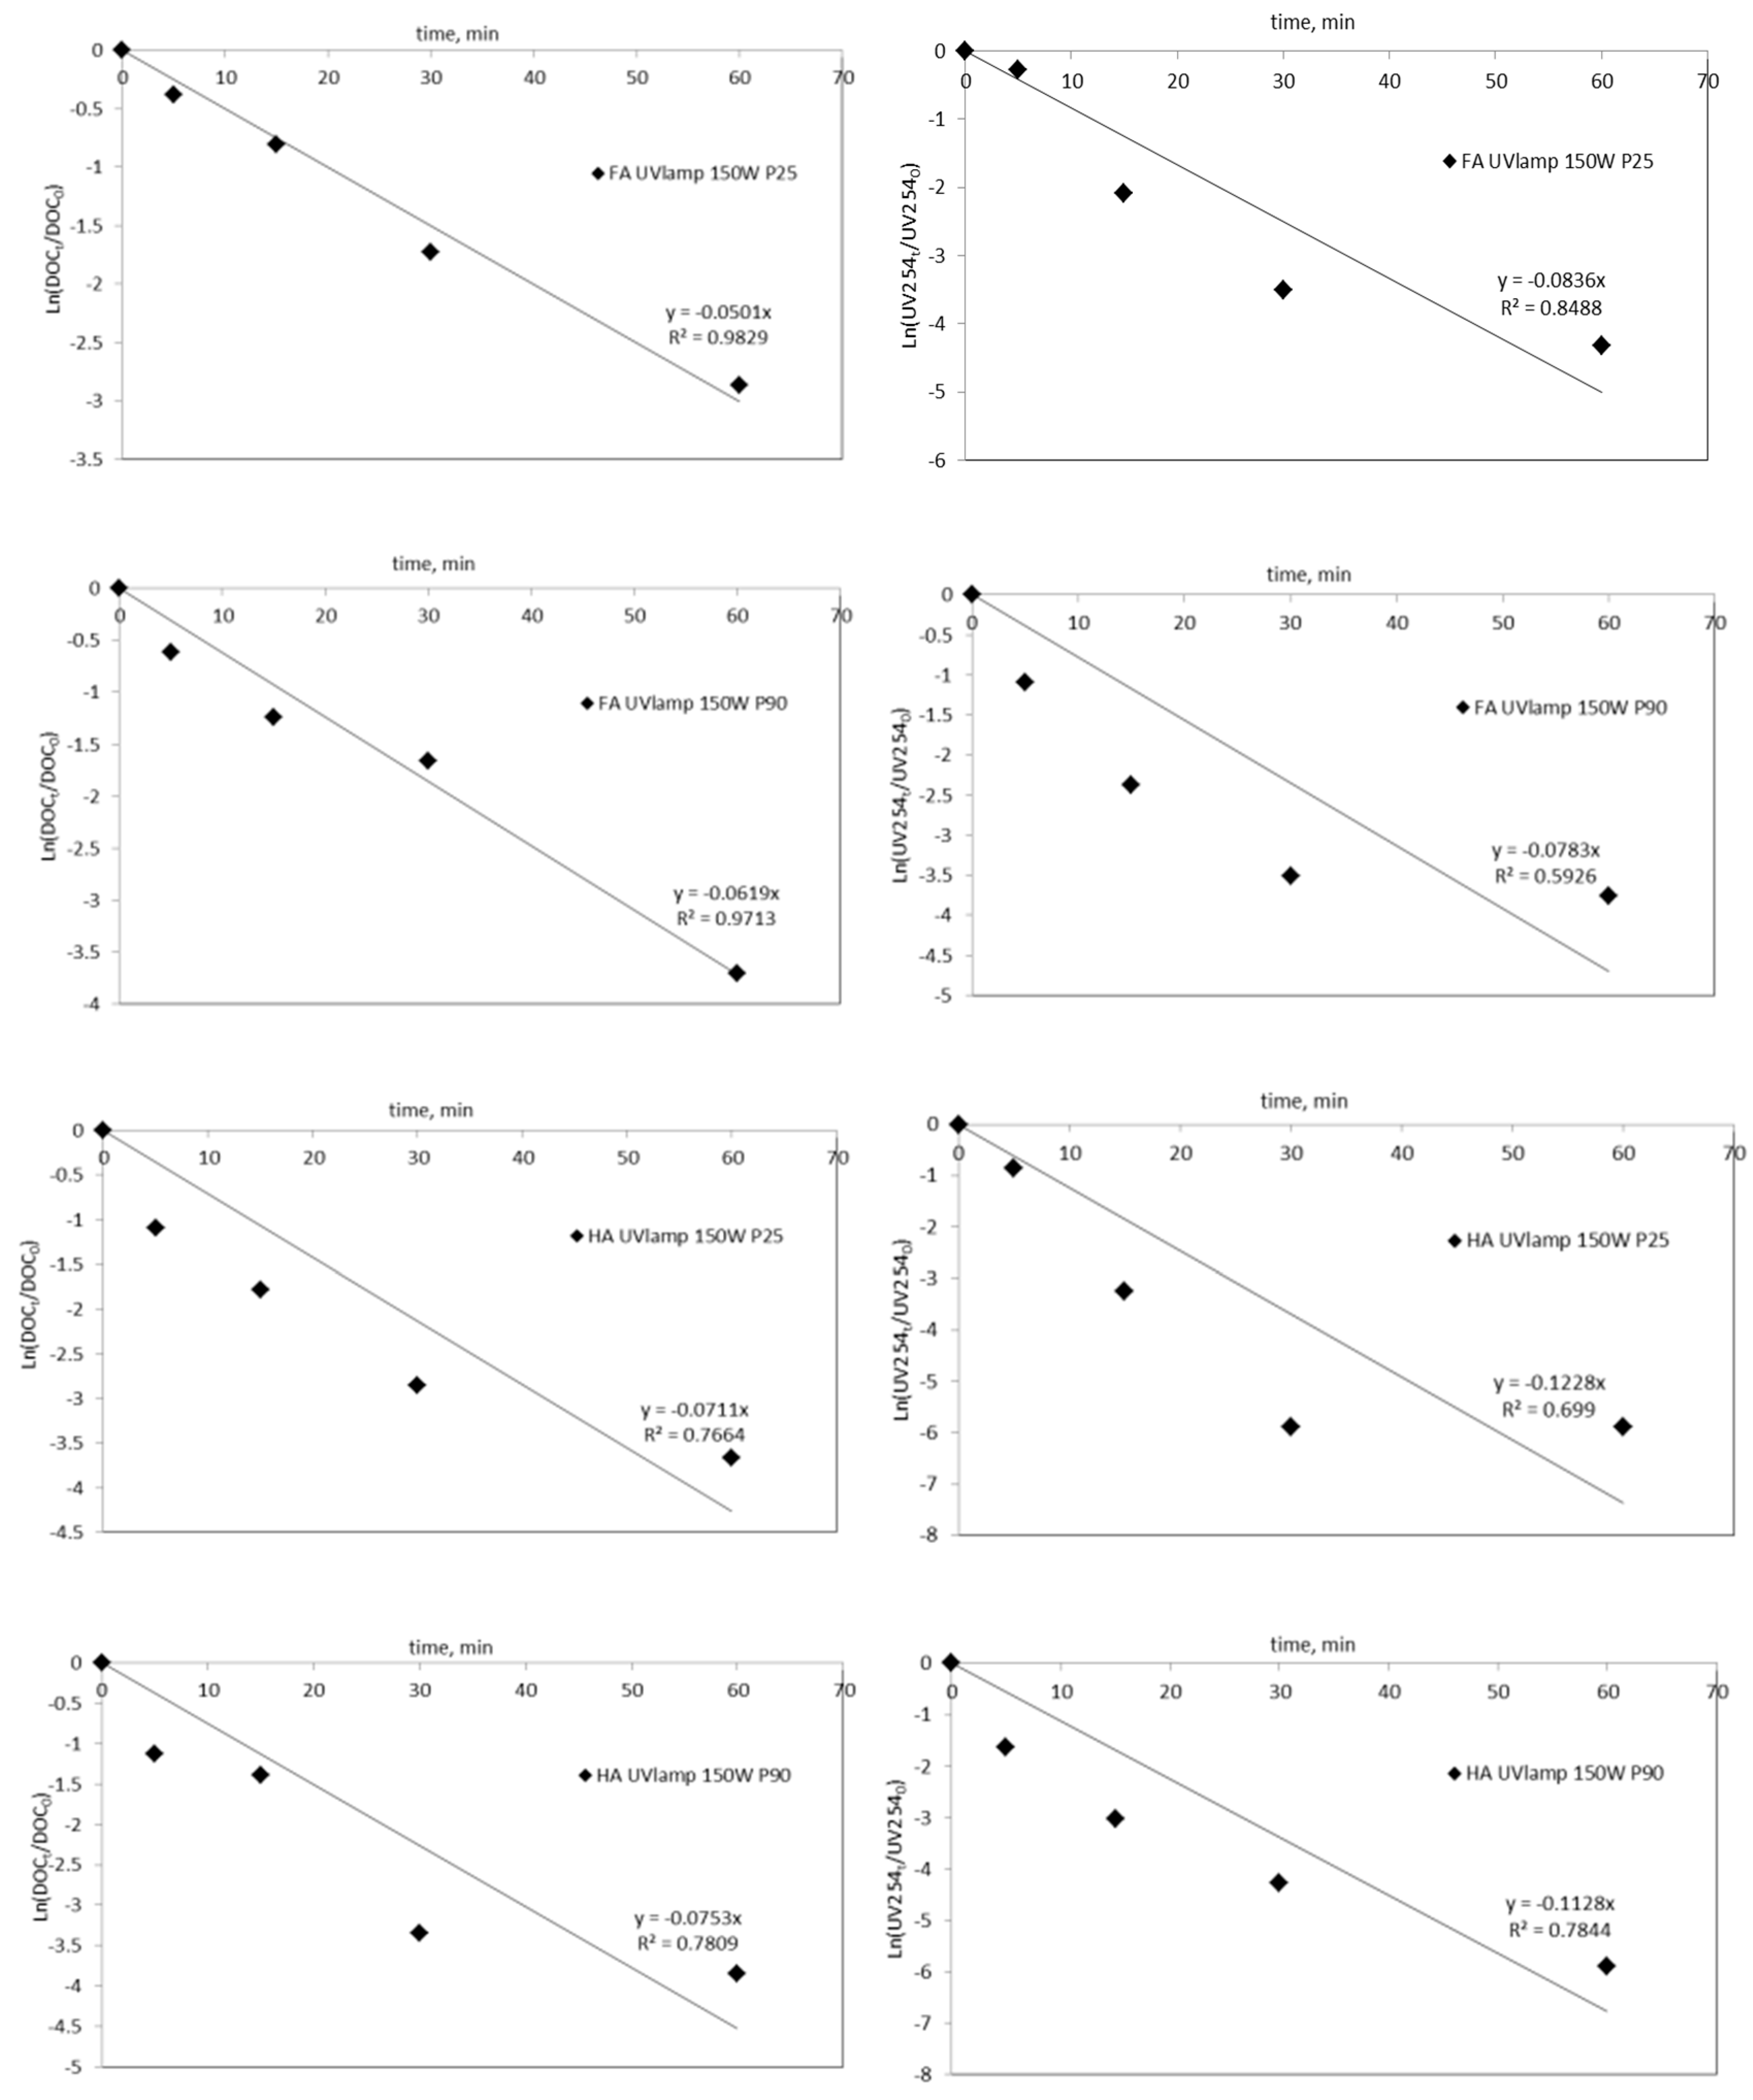
Reactor kinetics is a necessary parameter when comparing different photocatalysts. Figure 3 presents pseudo-first-order kinetics of FA and HA acids removal for two photocatalysts. Table 1 shows the photocatalytic decomposition rates of fulvic and humic acids as well as their half-lives. The samples were irradiated after 15 min of catalytic exposure, i.e., after adsorption of tested compounds on particles of the P25 and P90 surfaces; the exposure lasted for 1 h.
The analysis of the test results indicates similar decompositions during photocatalysis. A slightly shorter half-life for humic acids, a higher process efficiency using the P90 photocatalyst (this only applies to the lowering of the DOC parameter however), and a medium-pressure UV lamp were observed. The P90 has a smaller average crystal size than the P25, which results in a larger specific surface area, 90 m2/g versus 50 m2/g. The higher specific surface area of the P90 relative to the P25 provides more active sites for adsorption of the HA. Humic acids are characterized by hydrophobic properties with predominantly aromatic characteristics (carboxy groups), whereas fulvic acids are characterized by hydrophilic properties with both aromatic and aliphatic structures. Fulvic acids are more acidic than humic acids. Photocatalytic decomposition of these compounds under identical conditions and without inhibiting compounds (e.g., carbonates, Na+ [14]) proves that the degradation of aromatic structures occurs very quickly (t1/2 ~ 9 min for FA and ~6 min for HA). Organic compounds degrade to carbon dioxide and water along with intermediate products during degradation (Equation (3)).
The intermediate products feature lower reaction rates for DOC as compared to UV254 and longer half-lives. The DOC encompasses a wider range of organic compounds, including simple structures of intermediate products formed from the decomposition of more complex organic structures during photocatalysis. However, the structural complexity of humic and fulvic compounds makes it difficult to clearly identify which intermediate products form during degradation.
Interestingly, the DOC levels for the P90 photocatalyst were slightly higher for the k-rate constants and the half-lives, they were slightly shorter compared to the P25 photocatalyst. The results from irradiating at 254 nm in the absence of a photocatalyst show the opposite. This indicates a stronger absorption of UV radiation in the presence of the P90 photocatalyst deep into the surface of this nanomaterial, with a faster degradation of the adsorbed organic compounds as well as the resulting intermediates. A higher efficiency using the P90 photocatalyst has been observed by previous studies [19], except they removed nitrates from the water. The authors documented that the reduction of nitrates in the presence of the P90 was up to 77% higher than for the P25 under favorable conditions of maximum levels of UV intensity.
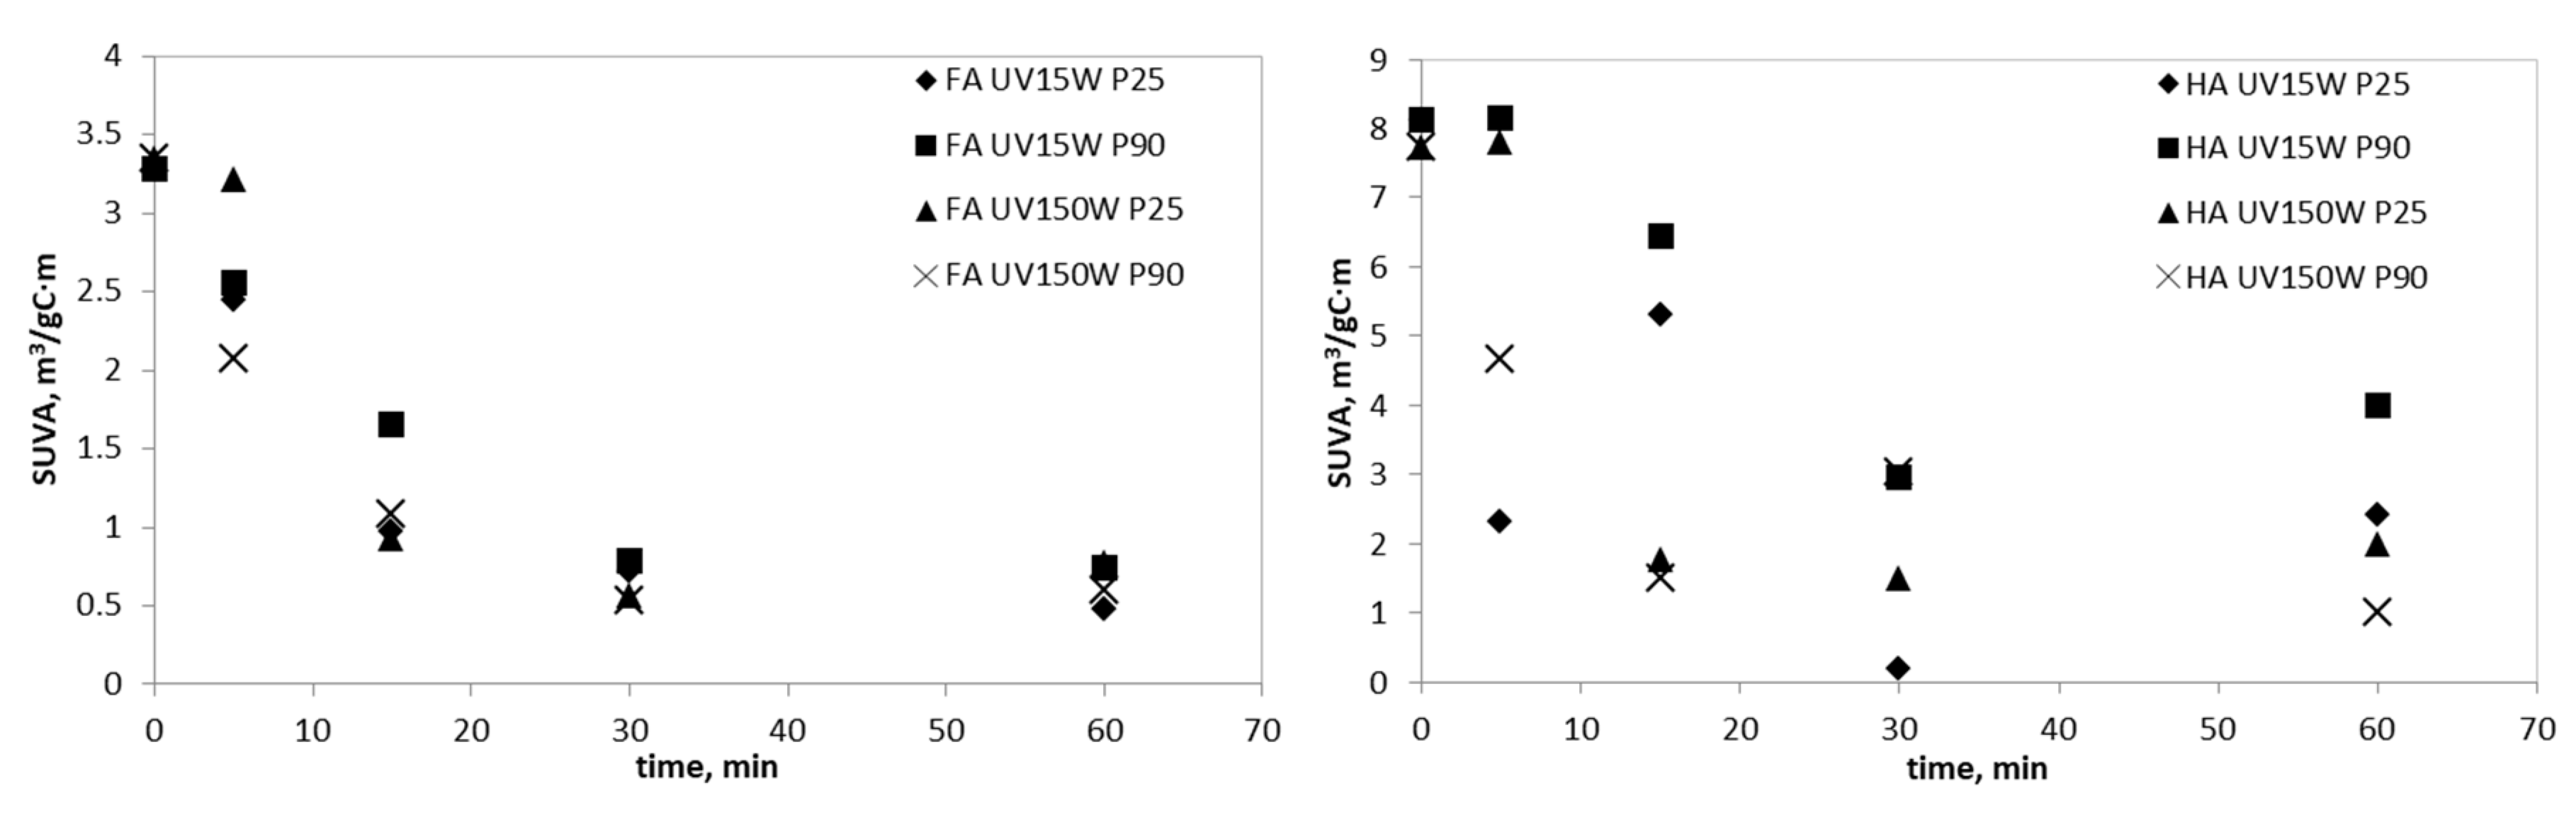
The basic parameter used in the evaluation of changes in organic substances during photocatalytic oxidation is the SUVA (Specific Ultraviolet Absorbance) value. The determination of this parameter enables us to describe hydrophilic-hydrophobic properties of organic compounds present in water. The higher the value of the SUVA parameter, the higher the share of hydrophobic organic compounds present in water. The characteristics of the model solutions show that FA and HA have an aromatic structure and a hydrophobic character, HA SUVA ca. 8.1, FA SUVA ca. 3.3 (Table 3). The photocatalysis process leads to the change in hydrophilic-hydrophobic properties of FA and HA. The value of SUVA after the process was usually below 1 m3/gC·m for FA and 2 m3/gC·m for HA (hydrophilicity domination). The change of SUVA during the photocatalysis process of FA and HA is shown in Figure 4.
2.3. The integrated Process of Photocatalysis + UF
Table 2 presents the test results obtained for the integrated system combining photocatalysis with ultrafiltration. The fulvic acids were subjected to photooxidation in the presence of the P25 and the P90 photocatalysts using a low-pressure UV lamp. After a 30 min of exposure, the reaction mixture was filtered to separate the photocatalyst from pure water.
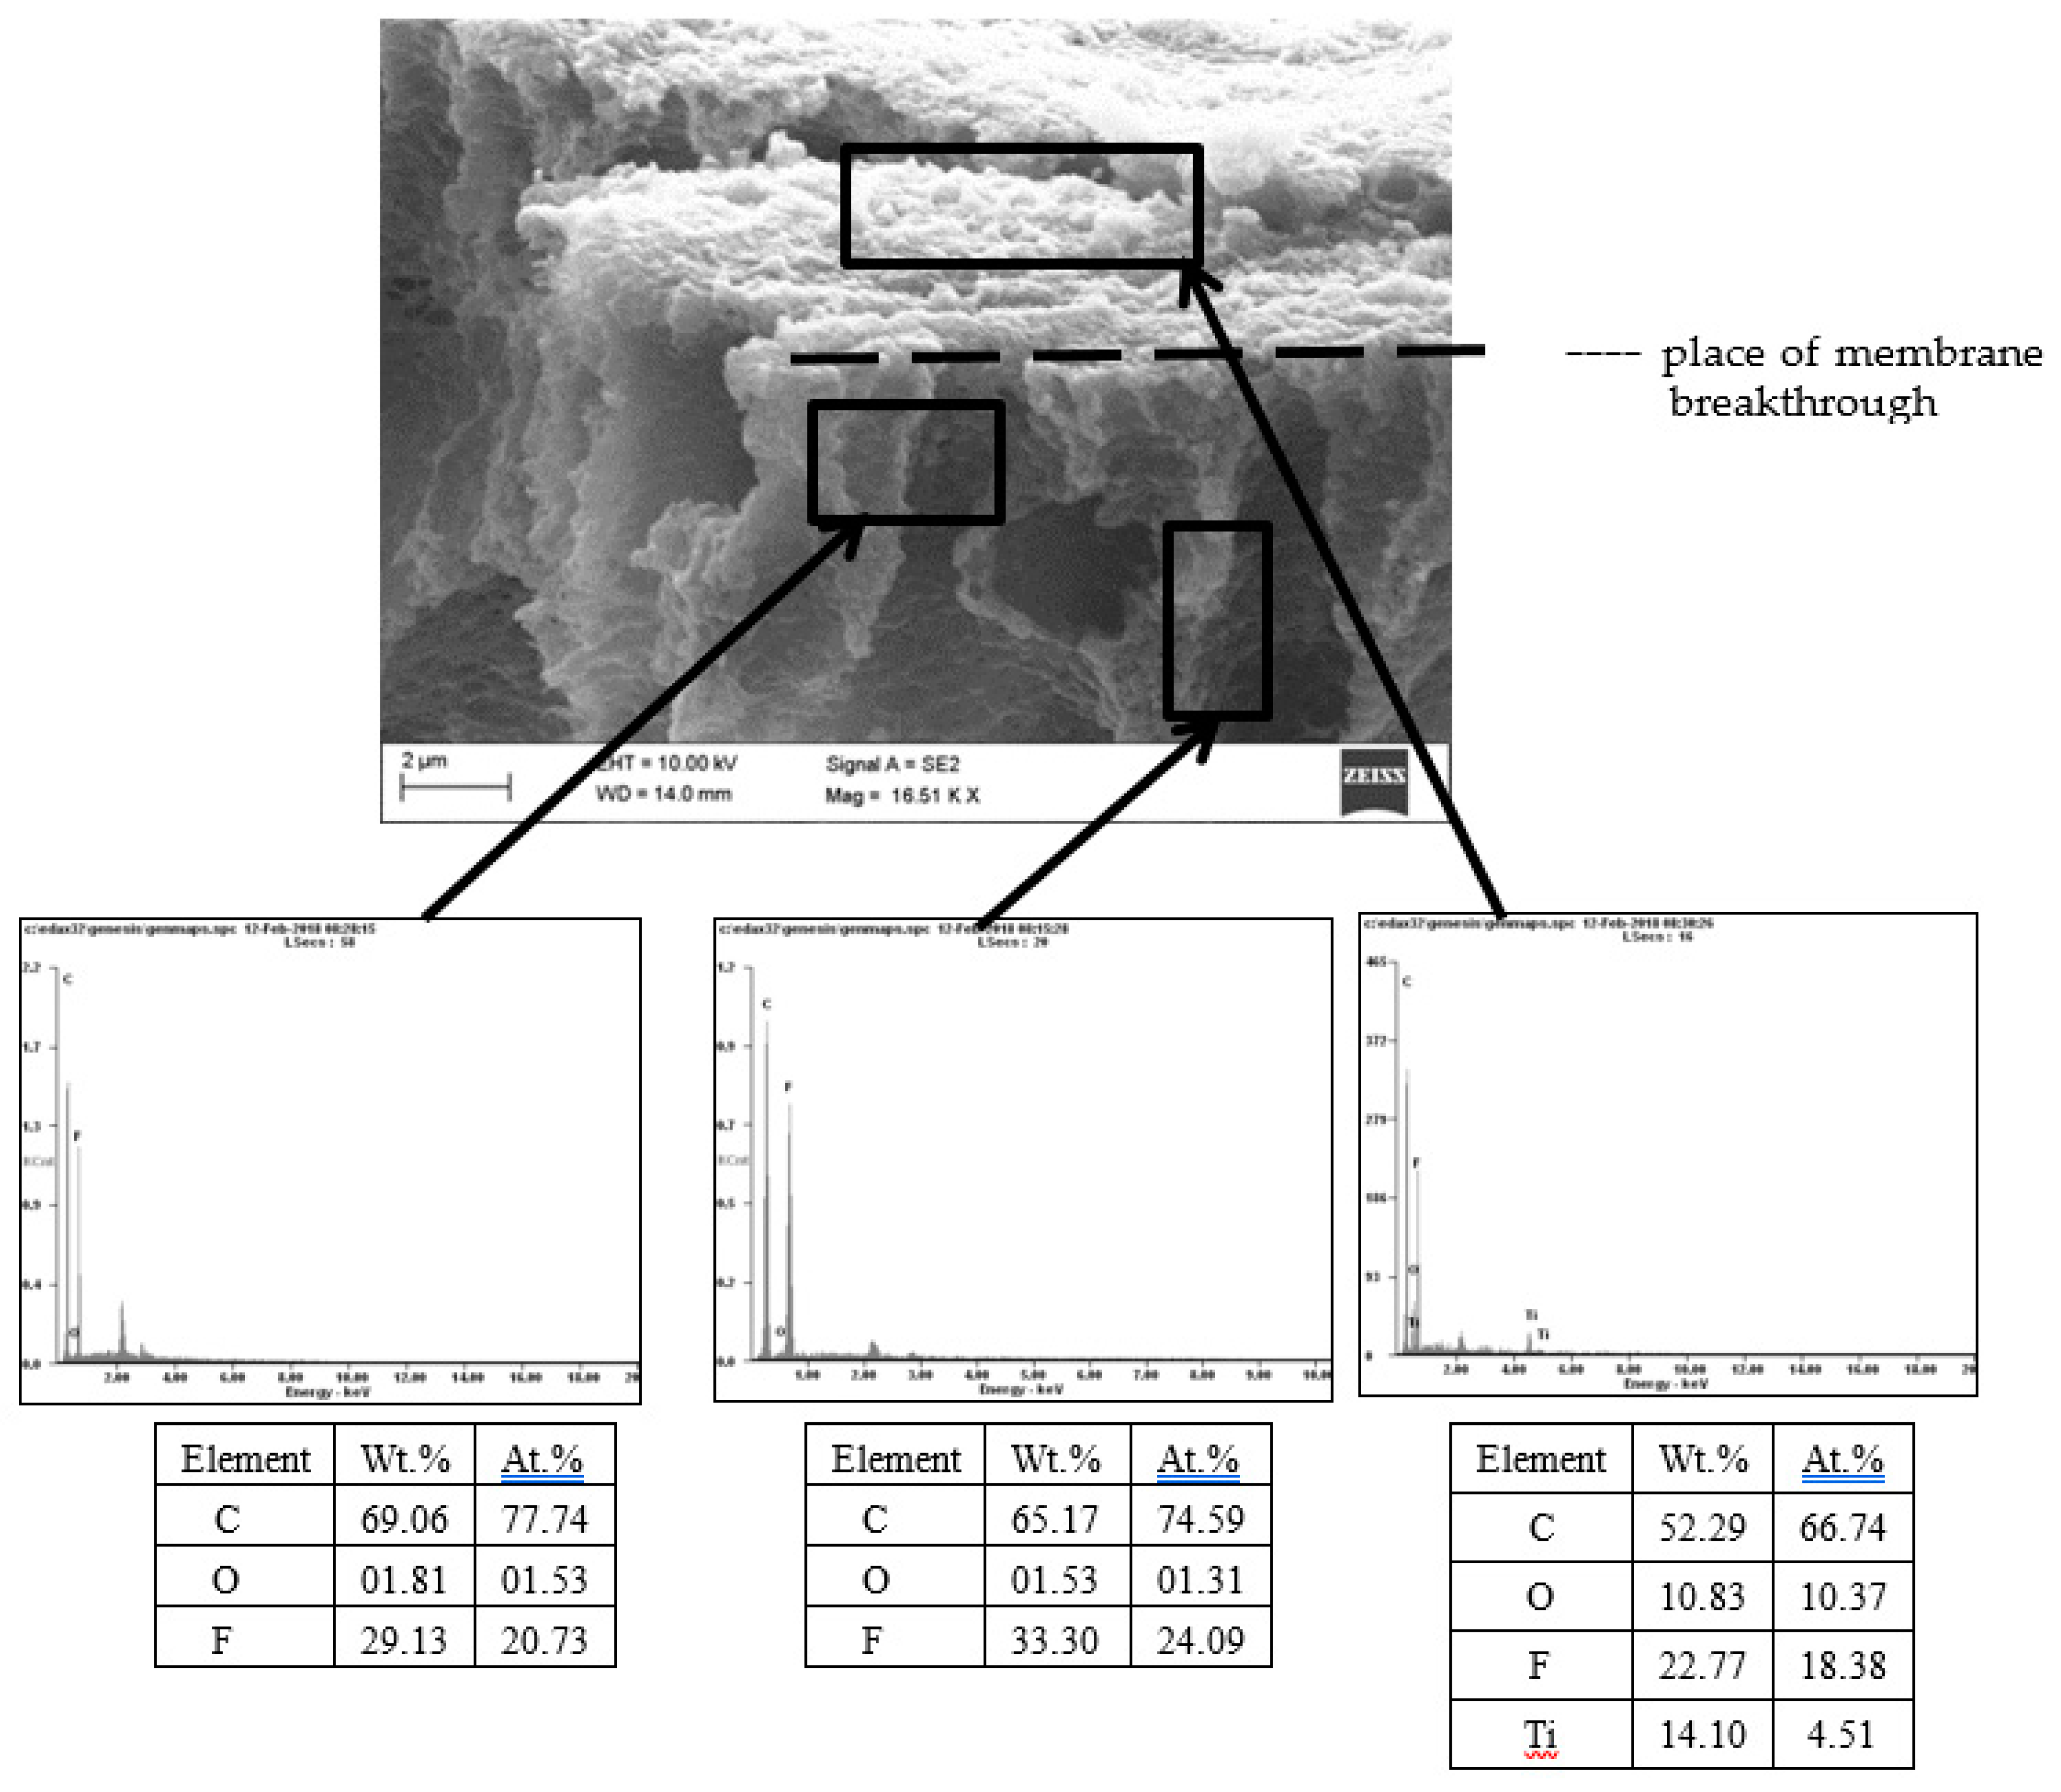
The test results indicate a high system efficiency as the values were low in the permeate, i.e., 0 mgPt/L, 0.024/0.023, 3.36/3.37 mg/L, 0.71/0.068 m3/gC·m for color, absorbance, DOC, and SUVA, respectively (photocatalysis FA (P25/P90) + UF). The unsatisfactory efficiency of FA removal was obtained for a unitary ultrafiltration process, 14 mgPt/L for color, 0.131 for absorbance, 5.43 mg/L for DOC and 2.41 m3/gC·m for SUVA, respectively. The use of the ultrafiltration membrane contributed only to separating the photocatalyst from pure water and no further cleaning of the reaction mixture took place after photocatalysis. Elemental analysis of the SEM shown in Figure 5 confirms that TiO2 particles completely remain on the membrane surface and do not adsorb into the pores.
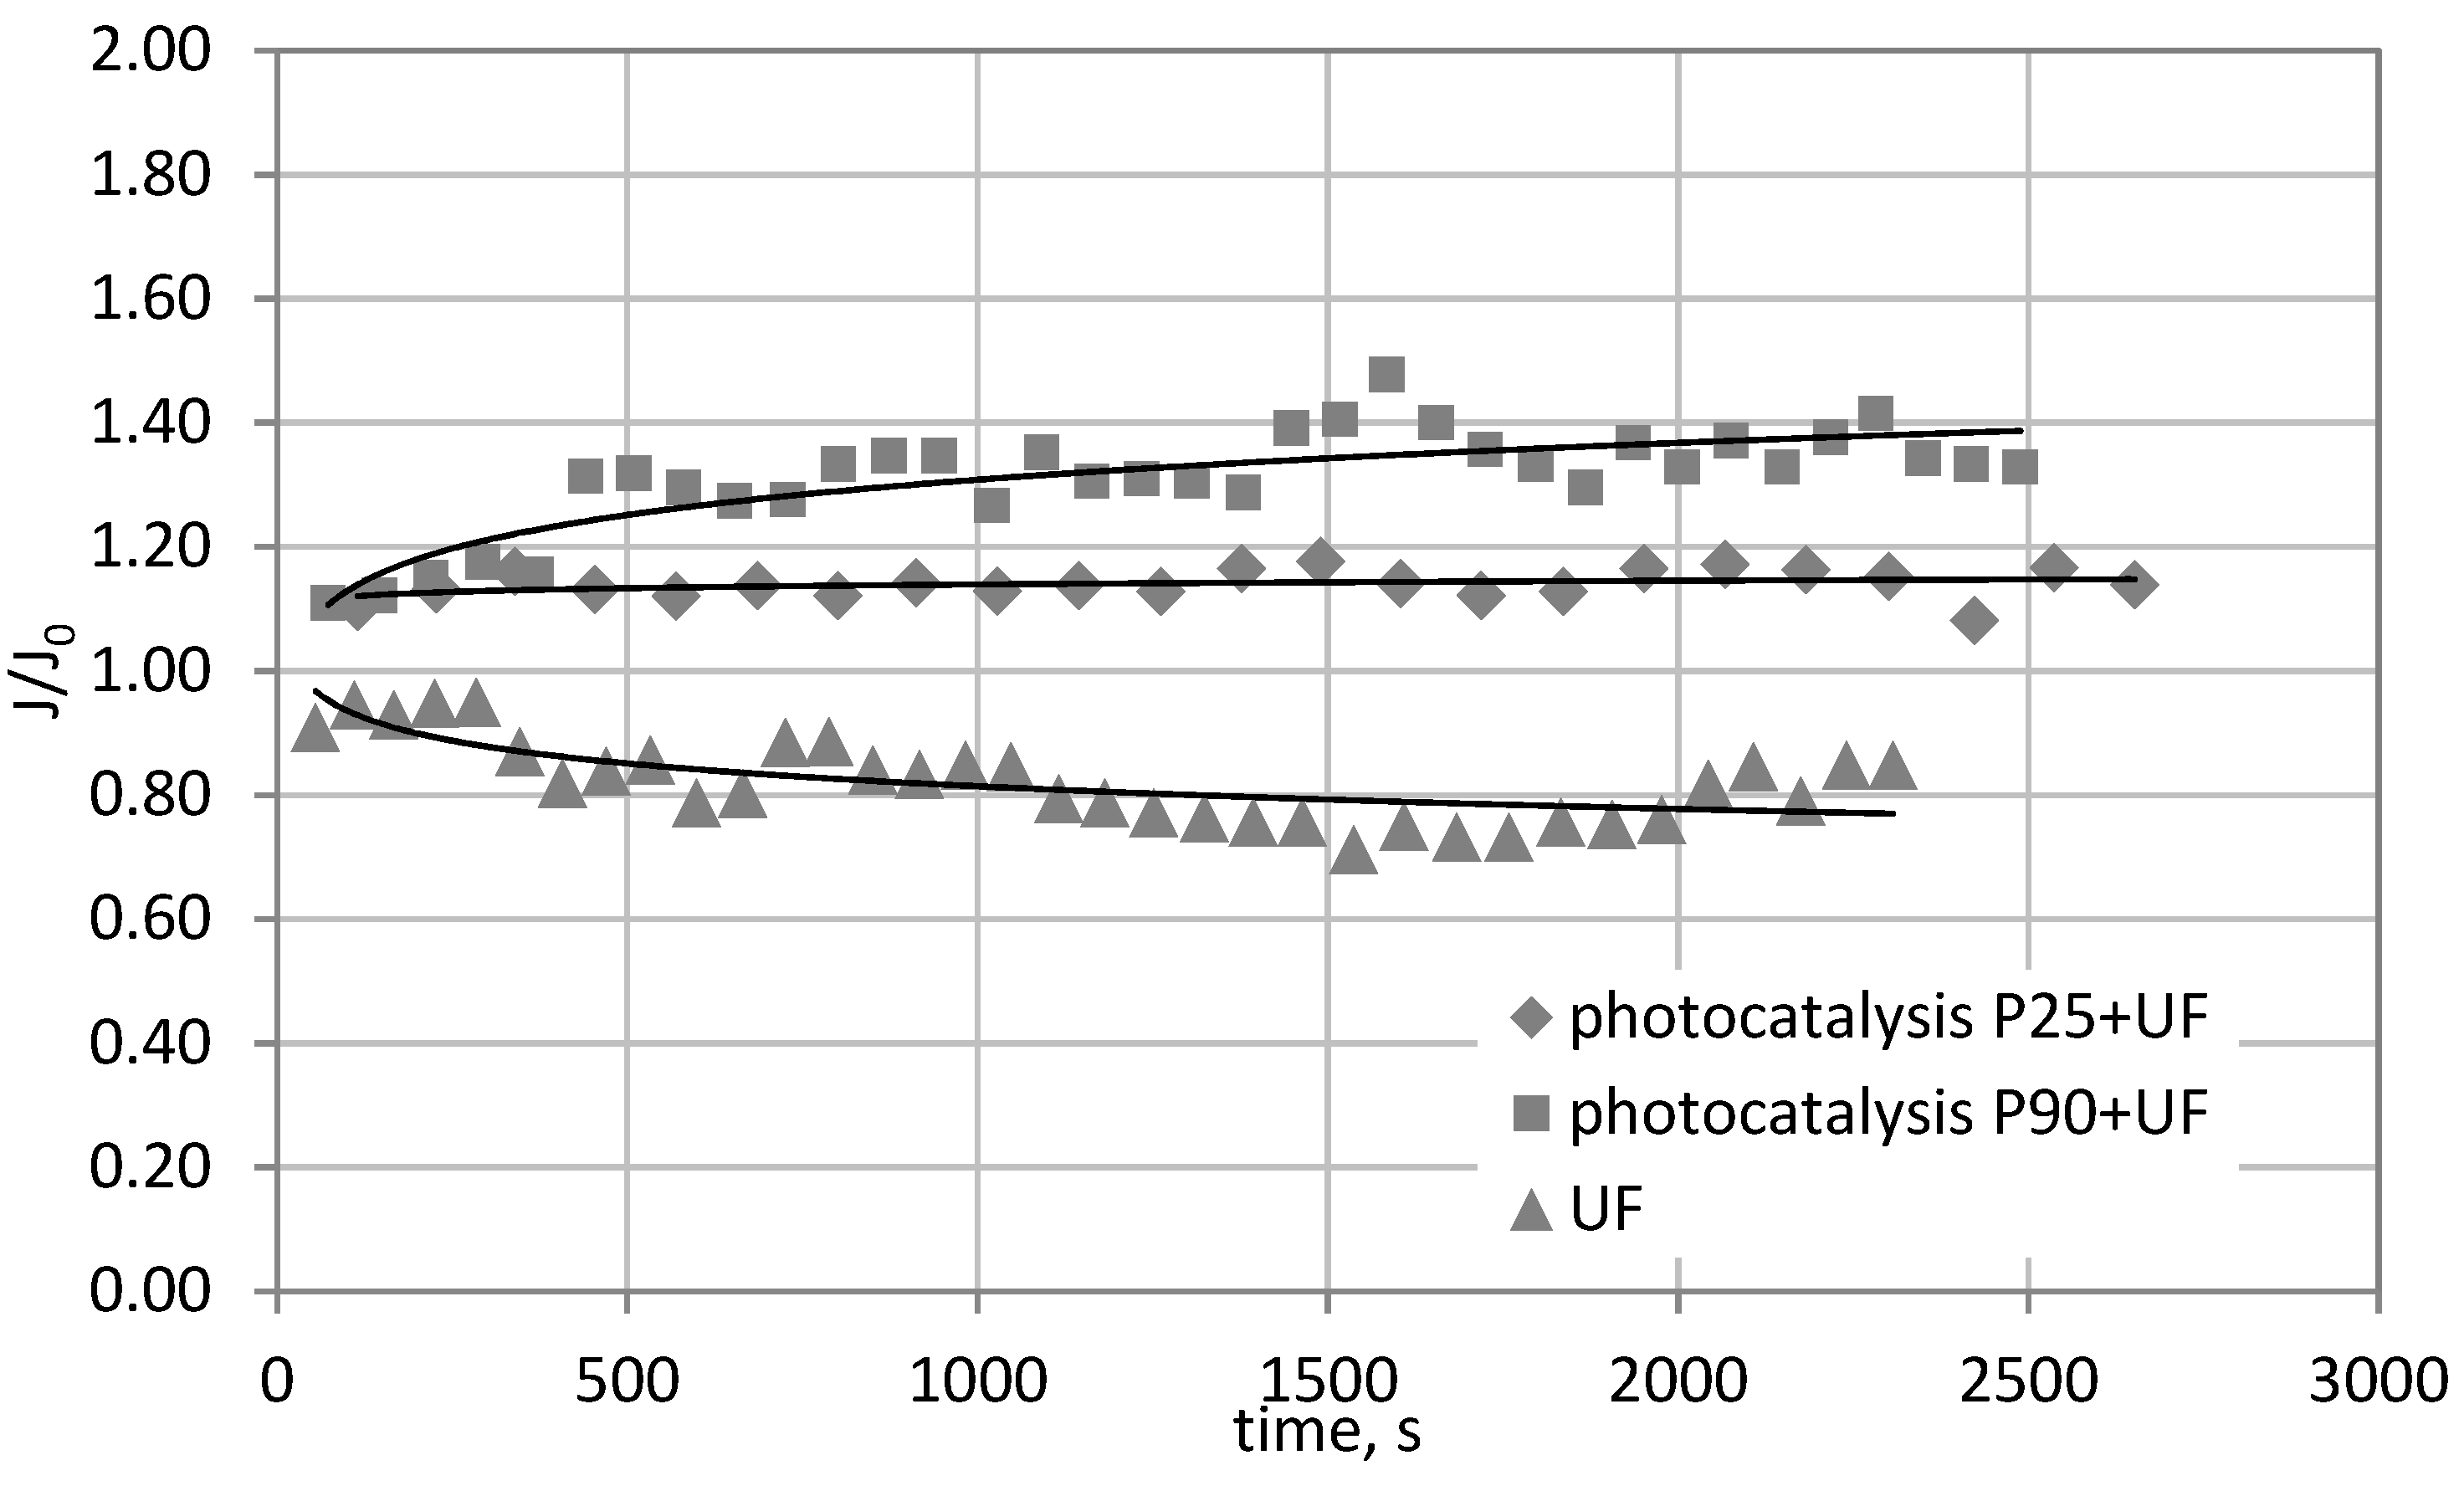
Interesting results were obtained for ultrafiltration membrane performance. During the approximately one-hour membrane filtration of the post-reaction solution with the P25 or the P90 nano titanium dioxide particles, the volumetric permeate flux increased relative to the flux measured during conditioning of the new membrane with deionized water. The changes in the relative permeate fluxes shown in Figure 6 confirm this. The relative permeate flux constitutes the J/J0 quotient, where J is the permeate flux during the filtration of the reaction solution and J0 is the flux for deionized water. When the flux value >1, the membrane performance increases with respect to conditioning the membrane with deionized water. This relationship was obtained for both filtered reaction mixtures (P25 and P90), and a higher flux was obtained for the P90. These results indicate that the photocatalyst remained entirely on the surface of the membrane (Figure 5) and changed the hydrophobic nature of the PVDF membrane, which is a highly advantageous feature of the membrane process. The efficiency of removing organic substances depends on the properly selected conditions of the photocatalytic process utilized prior to ultrafiltration. A relative flux for only ultrafiltration was shown for comparison (Figure 6), where the flux visibly decreases over time to approximately 20%. There is considerable debate on whether or not photocatalysts affect membrane fouling. This study shows that the hydraulic performance of membranes can be improved. In other work on water purification from our lab [20], a high permeate flux, which was constant and without membrane fouling, was also obtained in a photocatalytic membrane reactor in long-term work cycles (5 days) using a capillary immersion module. However, some work reported a decrease in the permeate flux through the blocking of the membrane surface [5,8]. To better understand the mechanisms of this phenomenon, detailed studies of the surface and membrane material will be conducted.
3. Materials and Methods
3.1. Water Solutions
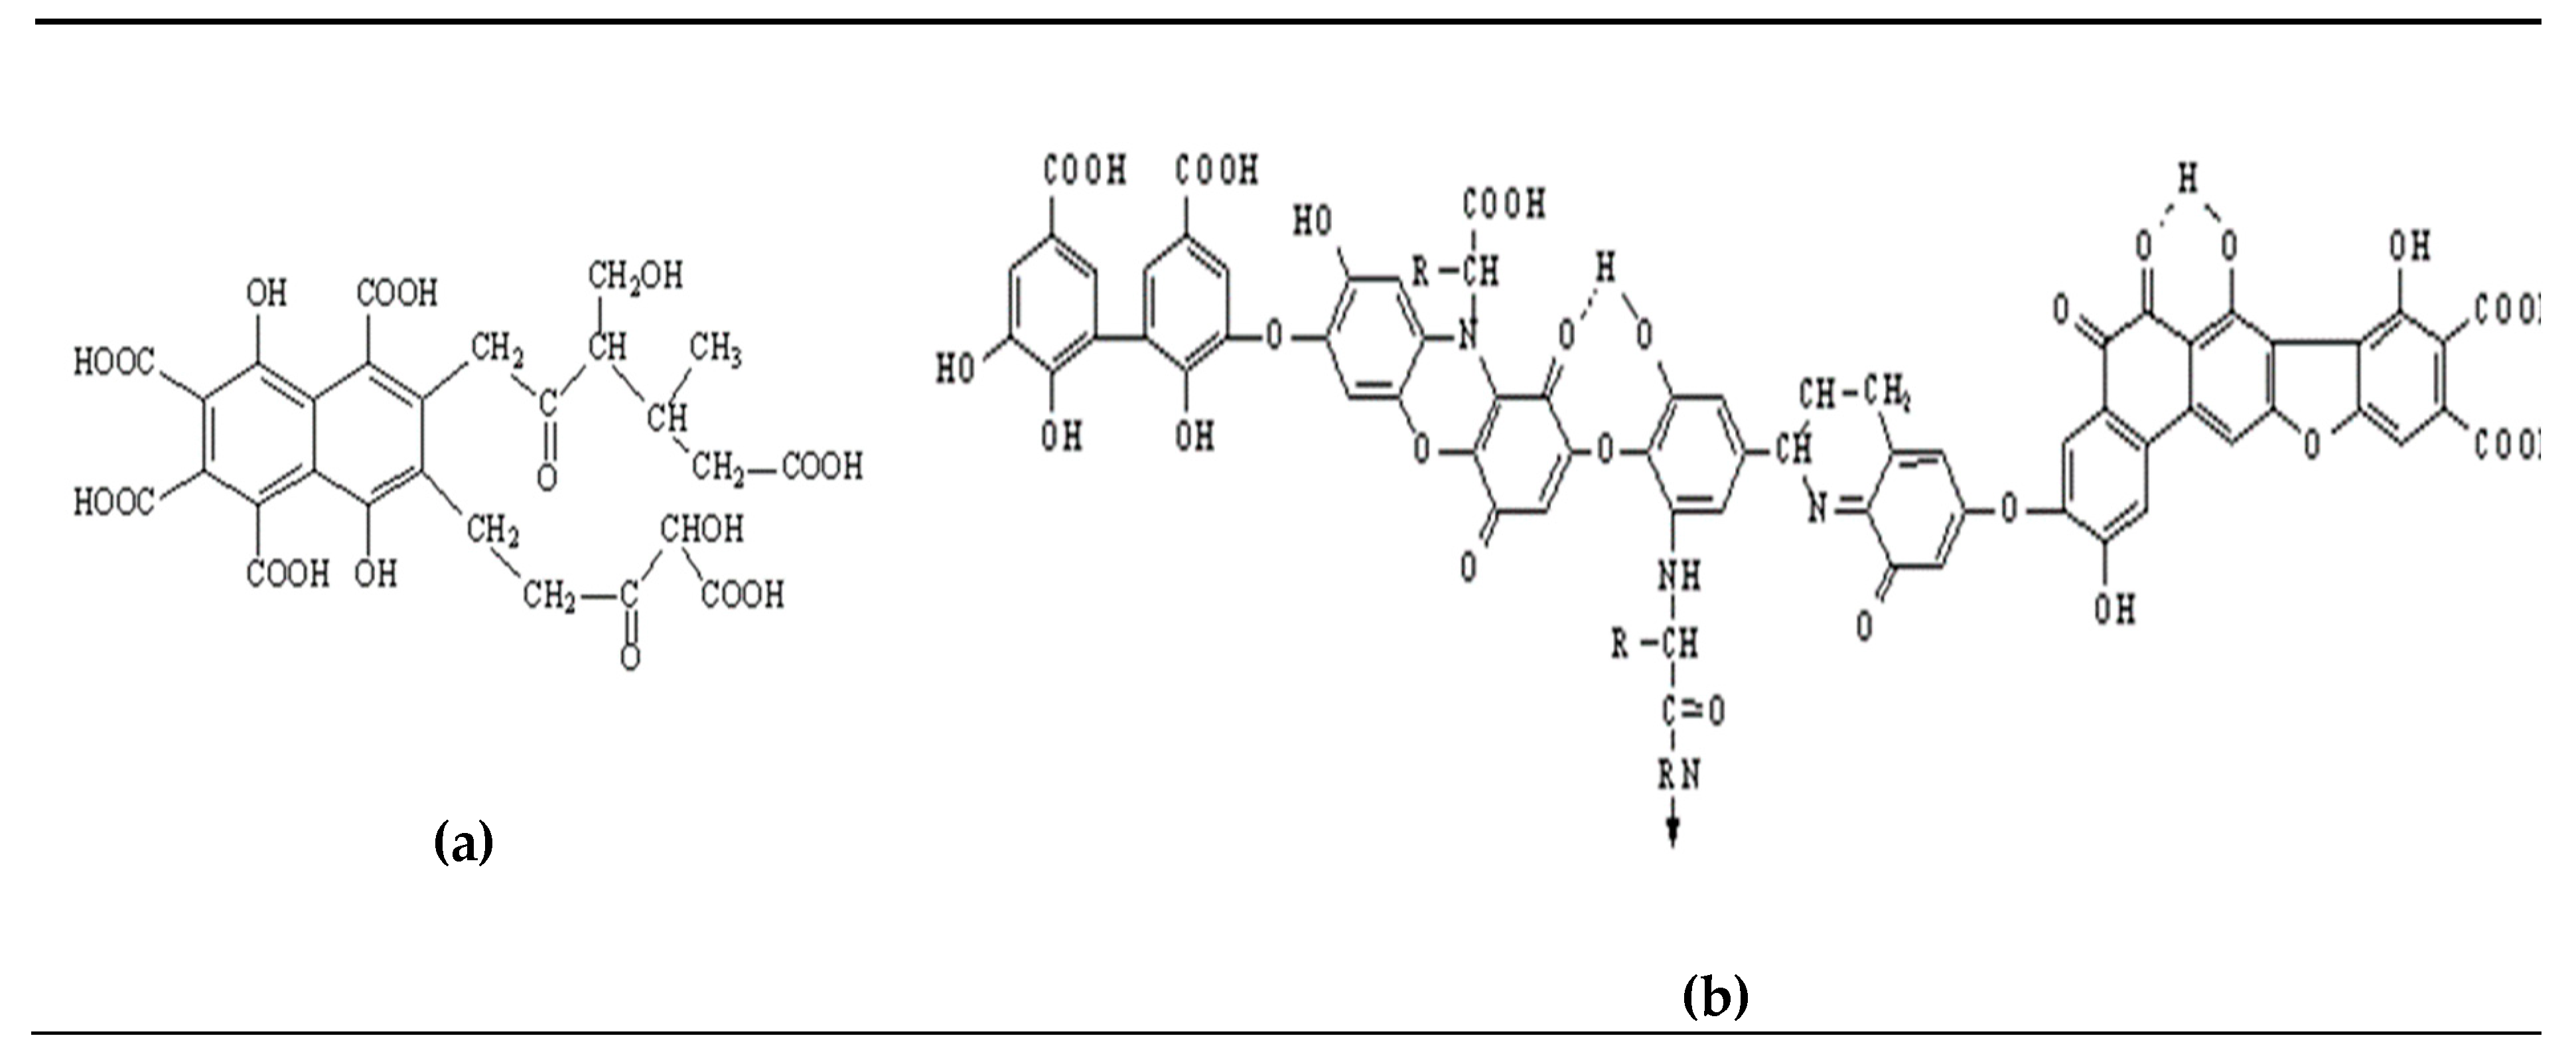
The focus of this research involved model solutions containing fulvic or humic acids, which represent natural organic matter (NOM). The model solutions (Table 3) were prepared using deionized water with humic (Sigma-Aldrich; Poznań, Poland) or fulvic (Beijing Multigrass Formulation Co. Ltd.; Beijing, China) acids (30 mg FA or HA/L). Fulvic acids are characterized by the content of dry salts ≥70%, pH range 5.5–6.5, solubility in water ≥99%, moistness ≤10% and humic acids as the sodium salt, No. H16752. The properties of both materials are listed in Table 3 and the structural formulas [12] are presented in Figure 7.
3.2. Photocatalysis
Prior to photocatalysis, catalysis was carried out for each batch portion put into the reactor (700 mL), as well as mixing the solution and photocatalyst (0.3 g/L) for 15 min with a magnetic stirrer. The reaction of the model solution with the photocatalyst was: FA + TiO2 pH = 7.05 and HA + TiO2 pH = 7.14. The samples were then introduced into a photocatalytic reactor and subjected to exposure over the following time spans: 5, 15, 30, 45 and 60 min.
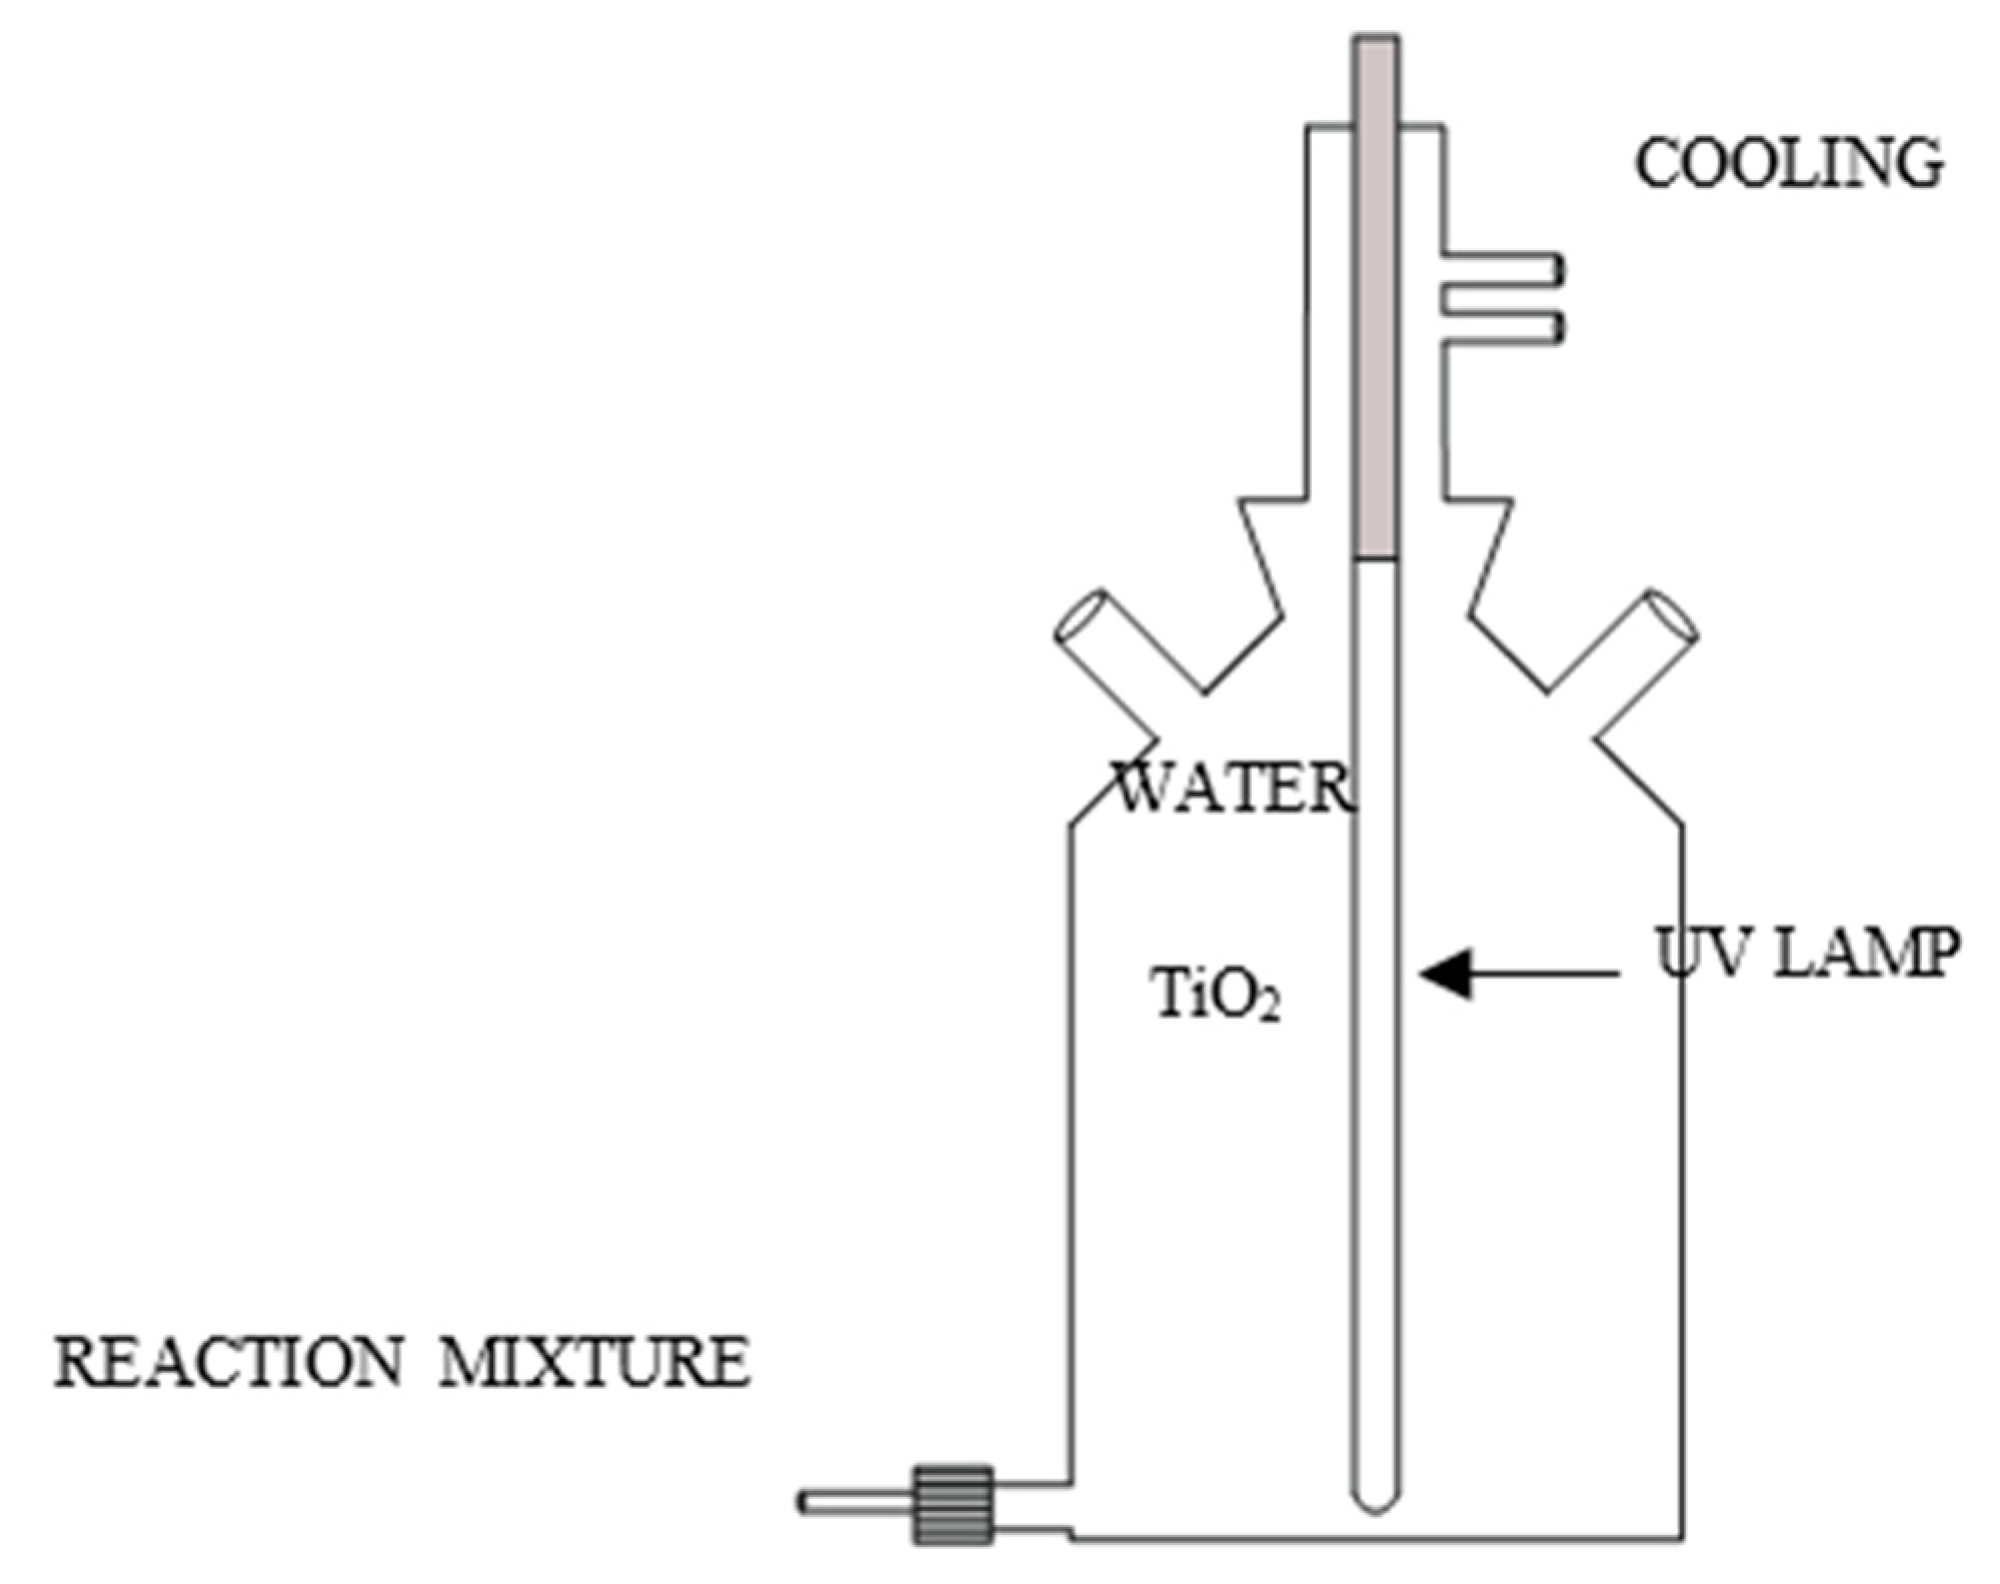
This study was conducted using a 0.7 L laboratory reactor (Heraeus, Hanau, Germany; Figure 8). Two photocatalyst types were used: TiO2 P25 and P90 (Evonik Degussa GmbH, Essen, Germany; Table 4). Two UV lamps (Heraeus, Hanau, Germany) were placed into the reactor: a low-pressure 15 W UV lamp at 254 nm and a medium-pressure 150 W UV lamp emitting from 100–340 nm. The lamps were water-cooled to maintain a constant temperature, (25 ± 2 °C). Air was continuously supplied into the reactor to mix reactor contents and supply oxygen necessary for photocatalysis. The reactor walls were covered with aluminum foil to minimize loss of UV radiation and improve the overall process.
3.3. Ultrafiltration
The post-reaction solution (after FA photocatalysis) containing TiO2, P25 and P90, after a 30 min exposure using a low-pressure UV lamp, was subjected to ultrafiltration. A unitary ultrafiltration (a control experiment with ultrafiltration only) for a raw model solution with fulvic acids (not pre-purified during photocatalysis) was also carried out for comparison. Ultrafiltration membranes made of polyvinylidene fluoride (PVDF) by GE Infrastructure Water & Process Technologies (a new membrane was used for each series) with a cut-off of 25 kDa and an active surface area of 38 cm3 were used in these studies. The membranes were tested in an Amicon membrane chamber (Millipore) in a dead-end system at 0.1 MPa transmembrane pressure. The capacity of the membrane chamber was 350 mL. The membrane process began by conditioning the new membrane with deionized water, followed by filtration of the post-reaction solution; deionized water was again filtered to determine the membrane performance changes. Each time, 350 mL of feed was poured into the membrane chamber, of which 175 mL of permeate was collected, measuring the filtration time for each 5 mL of the permeate volume. The size of the volumetric permeate flux and the efficiency of post-reaction solution purification were analyzed.
3.4. SEM Analysis Methodology
SEM images were obtained using a high-resolution scanning electron microscope SEM SUPRA 35 by ZEISS; parameters such as secondary electron detection (SE) at an acceleration voltage of 20 kV and a maximum magnification of 20,000× were applied. Sample chemical composition analyses were made using an energy dispersive roentgen spectrometer EDS by EDAX TRIDENT XM4 (Essen, Germany).
3.5. Analytical Methods
In the analyzed samples (model solutions and samples purified during the catalytic, photocatalytic, and ultrafiltration processes), the following indicator levels were determined: dissolved organic carbon (DOC) using the HiPerTOC analyzer by Thermo Electron Corporation, ultraviolet absorbance (UV 254 nm) using a CE 1021 UV/VIS spectrophotometer by Cecil Instruments, and color (Hazen scale, 340 nm) by means of a NOVA 400 spectrophotometer by Merck. Before the analyses, the samples were filtered through a Millipore 0.45 μm regenerated cellulose filter.
4. Conclusions
The adsorption of organic compounds was greater on the surface of a TiO2 P90 photocatalyst; the adsorption resulted from its much larger (2×) surface area compared to TiO2 P25.
The kinetics of the FA and HA decomposition during photocatalysis both proceeded in similar fashions. The photocatalyst and UV lamp both had an impact on photocatalytic effectiveness of FA and HA removal.
An ultrafiltration membrane made of polyvinylidene fluoride, used for separating the catalyst particles from pure water, changed its hydrophilic properties and tended to increase its hydraulic performance.
Funding
Research financed by the Ministry of Science and Higher Education budget.
Conflicts of Interest
The author declares no conflict of interest.
References
- Bodzek, M.; Rajca, M. Photocatalysis in the treatment and disinfection of water. Part I. Theoretical backgrounds. Ecol. Chem. Eng. S 2012, 19, 489–512. [Google Scholar]
- Nikolaou, A.D.; Lekkas, T.D. The role of natural organic matter during formation of chlorination by-products: A review. Acta Hydrochim. Hydrobiol. 2001, 29, 63–77. [Google Scholar] [CrossRef]
- Rajca, M.; Wlodyka-Bergier, A.; Bodzek, M.; Bergier, T. MIEX(R)DOC process to remove disinfection by-product precursors. Desalin. Water Treat. 2017, 64, 372–377. [Google Scholar] [CrossRef]
- Wlodyka-Bergier, A.; Rajca, M.; Bergier, T. Removal of halogenated by-products precursors in photocatalysis process enhanced with membrane filtration. Desalin. Water Treat. 2014, 52, 19–21. [Google Scholar] [CrossRef]
- Matilainen, A.; Sillanpää, M. Removal of natural organic matter from drinking water by advanced oxidation processes. Chemosphere 2010, 80, 351–365. [Google Scholar] [CrossRef] [PubMed]
- Leyva, E.; Moctezuma, E.; Kim, M.; Noriega, B.S.; Zarazúa, E. A Review on Chemical Advanced Oxidation Processes for Pharmaceuticals with Paracetamol as a Model Compound. Reaction Conditions, Intermediates and Total Mechanism. Curr. Org. Chem. 2018, 22, 2–17. [Google Scholar] [CrossRef]
- Athanasekou, C.P.; Romanosa, G.E.; Katsarosa, F.K.; Kordatosb, K.; Likodimosa, V.; Falarasa, P. Very efficient composite titania membranes in hybrid ultrafiltration/photocatalysis water treatment processes. J. Membr. Sci. 2012, 392, 192–203. [Google Scholar] [CrossRef]
- Huang, H.; Schwab, K.; Jacangelo, J.G. Pretreatment for low pressure membranes in water treatment: A review. Environ. Sci. Technol. 2009, 43, 3011–3019. [Google Scholar] [CrossRef] [PubMed]
- Uyguner-Demirel, C.S.; Birben, N.C.; Bekbolet, M. Elucidation of background organic matter matrix effect on photocatalytic treatment of contaminants using TiO2: A review. Catal. Today 2017, 284, 202–214. [Google Scholar] [CrossRef]
- Zangeneh, H.; Zinatizadeh, A.A.L.; Habibi, M.; Akia, M.; Hansain, I.M. Photocatalytic oxidation of organic dyes and pollutants in wastewater using different modified titanium dioxides: A comparative review. J. Ind. Eng. Chem. 2015, 26, 1–36. [Google Scholar] [CrossRef]
- Nakata, K.; Fujishima, A. TiO2 photocatalysis: Design and applications. J. Photochem. Photobiol. C Photochem. Rev. 2012, 13, 169–189. [Google Scholar] [CrossRef]
- Zularisam, A.W.; Ismail, A.F.; Salim, R. Behaviours of natural organic matter in membrane filtration for surface water treatment—A review. Desalination 2006, 194, 211–231. [Google Scholar] [CrossRef] [Green Version]
- Selvam, K.; Swaminathan, K.; Chae, K.S. Microbial decolorization of azo dyes and dye industry effluent by Fomes lividus. World J. Microbiol. Biotechnol. 2003, 19, 591–593. [Google Scholar] [CrossRef]
- Erhayem, M.; Sohn, M. Stability studies for titanium dioxide nanoparticles upon adsorption of Suwannee River humic and fulvic acids and natural organic matter. Sci. Total Environ. 2014, 468, 468–469. [Google Scholar] [CrossRef] [PubMed]
- Ewonik Industries, AG. Product Information, Aeroxide®; Ewonik Industries AG: Essen, Germany, 2015. [Google Scholar]
- Chong, M.N.; Jin, B.; Chow, C.W.K.; Saint, C. Recent developments in photocatalytic water treatment technology: A review. Water Res. 2010, 44, 2997–3027. [Google Scholar] [CrossRef] [PubMed]
- Fu, J.; Ji, M.; Zhao, Y.; Wang, L. Kinetics of aqueous photocatalytic oxidation of fulvic acids in a photocatalysis—Ultrafiltration reactor (PUR). Sep. Purif. Technol. 2006, 50, 107–113. [Google Scholar] [CrossRef]
- Montazerozohori, M.; Nasr-Esfahani, M.; Joohari, S. Photocatalytic degradation of an organic dye in some aqueous buffer solutions using nano titanium dioxide: A kinetics study. Environ. Protect. Eng. 2012, 38, 46–55. [Google Scholar]
- Doudrick, K.; Monzón, O.; Mangonon, A.; Hristovski, K.; Westerhoff, P. Nitrate Reduction in Water Using Commercial Titanium Dioxide Photocatalysts (P25, P90, and Hombikat UV100). J. Environ. Eng. 2012, 138, 852–861. [Google Scholar] [CrossRef]
- Rajca, M. The effectiveness of removal of nom from natural water using photocatalytic membrane reactors in PMR-UF and PMR-MF modes. Chem. Eng. J. 2016, 305, 169–175. [Google Scholar] [CrossRef]
- Balazs, N.; Mogyorósi, K.; Srankó, D.F.; Pallagi, A.; Alapi, T.; Oszkó, A.; Dombi, A.; Sipos, P. The effect of particle shape on the activity of nanocrystalline TiO2 photocatalysts in phenol decomposition. Appl. Catal. B 2008, 84, 356–362. [Google Scholar] [CrossRef]
Figure 1.
SEM photos of titanium nano dioxides, (a), (b) P25 (400×), (d), (e) P90 (400×), (c) P25 (200×), (f) P90 (200×).
Figure 1.
SEM photos of titanium nano dioxides, (a), (b) P25 (400×), (d), (e) P90 (400×), (c) P25 (200×), (f) P90 (200×).

Figure 2.
Results of FA and HA adsorption on the P25 and P90 titanium dioxide during catalysis (photocatalyst dose 0.3 g/L).
Figure 2.
Results of FA and HA adsorption on the P25 and P90 titanium dioxide during catalysis (photocatalyst dose 0.3 g/L).

Figure 3.
Pseudo-first-order kinetics of FA and HA acids removal (dose TiO2 0.3 g/L).


Figure 4.
The change of SUVA parameter during the photocatalysis process.

Figure 5.
SEM photo of the membrane after the photocatalysis FA (P25) + UF process and elemental analysis of membrane material and sediment on the membrane.
Figure 5.
SEM photo of the membrane after the photocatalysis FA (P25) + UF process and elemental analysis of membrane material and sediment on the membrane.

Figure 6.
Changes in the relative permeate flux over time.

Figure 7.
Structural formulas of (a) fulvic acid and (b) humic acid [12].
Figure 7.
Structural formulas of (a) fulvic acid and (b) humic acid [12].

Figure 8.
Schematic drawing of the photocatalytic reactor.


Table 1.
Reaction rate constants and FA and HA decomposition half-lives photocatalysis.
| Photocatalysis | Reaction Rate Constant, k min−1 | Determination Coefficient R2 | Half-Life, t1/2 min | |||
|---|---|---|---|---|---|---|
| DOC | UV254 | DOC | UV254 | DOC | UV254 | |
| FA UV lamp15W P25 | 39 × 10−3 | 77 × 10−3 | 0.91 | 0.84 | 17.7 | 9.0 |
| FA UV lamp15W P90 | 41 × 10−3 | 71 × 10−3 | 0.86 | 0.85 | 17.1 | 9.8 |
| HA UV lamp15W P25 | 72 × 10−3 | 112 × 10−3 | 0.86 | 0.87 | 9.6 | 6.2 |
| HA UV lamp15W P90 | 85 × 10−3 | 101 × 10−3 | 0.86 | 0.85 | 8.1 | 6.9 |
| FA UV lamp150W P25 | 50 × 10−3 | 84 × 10−3 | 0.98 | 0.85 | 13.8 | 8.3 |
| FA UV lamp150W P90 | 62 × 10−3 | 78 × 10−3 | 0.97 | 0.60 | 11.2 | 8.9 |
| HA UV lamp150W P25 | 71 × 10−3 | 123 × 10−3 | 0.77 | 0.70 | 9.7 | 5.6 |
| HA UV lamp150W P90 | 75 × 10−3 | 113 × 10−3 | 0.78 | 0.78 | 9.2 | 6.1 |
Table 2.
Efficiency of FA removal in the integrated UF and photocatalysis + UF systems.
| Process | Color, mgPt/L | Absorbance UV254 nm | DOC, mg/L | SUVA, m3/gC·m | ||||||||
|---|---|---|---|---|---|---|---|---|---|---|---|---|
| 1 | 2 | 3 | 1 | 2 | 3 | 1 | 2 | 3 | 1 | 2 | 3 | |
| Photocatalysis FA (P25) + UF | 38 | 4 | 0 | 0.292 | 0.026 | 0.024 | 9.26 | 3.32 | 3.36 | 3.15 | 0.78 | 0.71 |
| Photocatalysis FA(P90) + UF | 42 | 5 | 0 | 0.310 | 0.030 | 0.023 | 9.44 | 3.87 | 3.37 | 3.28 | 0.77 | 0.68 |
| UF only | 40 | - | 14 | 0.301 | - | 0.131 | 9.35 | - | 5.43 | 3.22 | - | 2.41 |
1-model solution; 2-reaction mixture (remaining concentration); 3-permeate (remaining concentration).
Table 3.
Characteristics of the model solutions investigated.
| Indicator, Unit | FA Model Solution | HA Model Solution |
|---|---|---|
| pH | 7.16 | 7.89 |
| Color *, mgPt/L | 38 | 134 |
| Absorbance UV254 | 0.30 | 0.72 |
| DOC, mg/L | 9.05 | 8.85 |
| TOC, mg/L | 9.87 | 9.86 |
| IC, mg/L | 0.82 | 1.01 |
| SUVA **, m3/gC·m | 3.31 | 8.14 |
* Hazen scale, mg platinum-cobalt/Liter; ** specific ultrafiolet absorbance UV254/DOC.
Table 4.
Characteristics of photocatalysts P25 and P90.
| Properties | Aeroxide TiO2 P25 | Aeroxide TiO2 P90 | Data Source |
|---|---|---|---|
| Specific surface area | 50 ± 15 m2/g | 90 ± 20 m2/g | [15] |
| pH at 4% | 3.2–4.5 | 3.2–4.5 | |
| Tamped density | 100–180 g/L | approx. 120 g/L | |
| Crystal structure * | 88% anatase, 12% rutile | 86% anatase, 14% rutile | [19] |
| Crystal size * | 16 nm anatase, 18 nm rutile | 12 nm anatase, 18 nm rutile | |
| Isoelectric point (pHIEP) | 6.4 | 6.6 |
* newer batches of P25, P90 are more active than older batches, which was attributed to more polyhedral particles in the newer batches [21].
© 2020 by the author. Licensee MDPI, Basel, Switzerland. This article is an open access article distributed under the terms and conditions of the Creative Commons Attribution (CC BY) license (http://creativecommons.org/licenses/by/4.0/).
Share and Cite
MDPI and ACS Style
Rajca, M. NOM (HA and FA) Reduction in Water Using Nano Titanium Dioxide Photocatalysts (P25 and P90) and Membranes. Catalysts 2020, 10, 249. https://0-doi-org.brum.beds.ac.uk/10.3390/catal10020249
AMA Style
Rajca M. NOM (HA and FA) Reduction in Water Using Nano Titanium Dioxide Photocatalysts (P25 and P90) and Membranes. Catalysts. 2020; 10(2):249. https://0-doi-org.brum.beds.ac.uk/10.3390/catal10020249
Chicago/Turabian StyleRajca, Mariola. 2020. "NOM (HA and FA) Reduction in Water Using Nano Titanium Dioxide Photocatalysts (P25 and P90) and Membranes" Catalysts 10, no. 2: 249. https://0-doi-org.brum.beds.ac.uk/10.3390/catal10020249
Note that from the first issue of 2016, this journal uses article numbers instead of page numbers. See further details here.