Article

Hydrothermal Synthesis of rGO-TiO2 Composites as High-Performance UV Photocatalysts for Ethylparaben Degradation

by
Miller Ruidíaz-Martínez
1,
Miguel A. Álvarez
1,*,
María Victoria López-Ramón
1,*,
Guillermo Cruz-Quesada
1,
José Rivera-Utrilla
2 and
Manuel Sánchez-Polo
2
1
Department of Inorganic and Organic Chemistry, Faculty of Experimental Science, University of Jaen, 23071 Jaen, Spain
2
Department of Inorganic Chemistry, Faculty of Science, University of Granada, 18071 Granada, Spain
*
Authors to whom correspondence should be addressed.
Submission received: 10 April 2020 / Revised: 3 May 2020 / Accepted: 6 May 2020 / Published: 8 May 2020
(This article belongs to the Special Issue Photocatalytic Degradation of Organic Wastes in Water)

Abstract

:
A series of reduced graphene oxide-TiO2 composites (rGO-TiO2) were prepared by hydrothermal treatment using graphite and titanium isopropoxide as raw materials. The structural, surface, electronic, and optical properties of the prepared composites were extensively characterized by N2 adsorption, FTIR, XRD, XPS, Raman spectroscopy, and DRS. GO was found to be effectively reduced and TiO2 to be in pure anatase phase in all composites obtained. Finally, experiments were performed to evaluate the effectiveness of these new materials as photocatalysts in the degradation of ethylparaben (EtP) by UV radiation. According to the band-gap energies obtained (ranging between 3.09 eV for 4% rGO-TiO2 to 2.55 eV for 30% rGO-TiO2), the rGO-TiO2 composites behave as semiconductor materials. The photocatalytic activity is highest with a rGO content of 7 wt % (7% rGO-TiO2), being higher than observed for pure TiO2 (Eg = 3.20 eV) and achieving 98.6% EtP degradation after only 40 min of treatment. However, the degradation yield decreases with higher percentages of rGO. Comparison with rGO-P25 composites showed that a better photocatalytic performance in EtP degradation is obtained with synthesized TiO2 (rGO-TiO2), probably due to the presence of the rutile phase (14.1 wt %) in commercial P25.

1. Introduction

Pharmaceutical and personal care products are extensively used worldwide and continuously released through wastewaters. These emerging pollutants cannot generally be removed by conventional wastewater treatment processes, and they have been found in treated waters and treatment plant sludge at low concentrations (ppb or ppm) [1].
Parabens are esters of p-hydroxybenzoic acid, with an alkyl or benzyl group, widely used as antimicrobial agents and preservatives in pharmaceutical, cosmetic, and food products [1]. The European Union has limited the concentration of parabens in cosmetic products to a maximum of 0.4% (p/p) for individual parabens and 0.8% (p/p), expressed as p-hydroxybenzoic acid, for paraben mixtures [2]. Although these composites are readily biodegradable under aerobic conditions, they can be considered as "pseudo-persistent" pollutants due to their high consumption and continuous release in the environment.
Parabens are endocrine disruptors, and their high estrogenicity has led to their implication in some cases of breast cancer [3] and male sterility [4]. Skin can also absorb parabens from cosmetic products and may cause skin allergies [4]. Parabens contain phenolic hydroxyl groups that can readily react with free chloride, producing halogenated by-products. Chlorinated parabens have been detected in wastewaters, swimming pools, and rivers, although not yet in drinking water. These chlorinated by-products are more stable and persistent than progenitor species, and further studies are needed to elucidate their toxicity [5].
Given the increasing presence of these composites in natural waters, their potentially hazardous nature, and the low effectiveness of municipal wastewater treatment processes for their removal, there is considerable research interest in developing methods for their adequate degradation in wastewaters to avoid their release into the environment. Biological treatments can achieve this objective but are slow, taking at least five days to degrade parabens [6]. Adsorption is also frequently used for this purpose [7,8,9], but it is non-destructive and merely transfers pollutants from one phase to another.
Numerous advanced oxidation processes (AOPs) have been proposed to remove parabens from waters, including the Fenton process [10,11], electrochemical oxidation [12], simple ozonation [13,14], photolytic and photocatalytic oxidation [15,16,17], photosonochemical degradation [18], and photocatalytic ozonation [19], among others. Heterogeneous photocatalysis is considered one of the most effective AOPs for organic pollutant degradation [20] due to its high percentage degradation, effective mineralization, and low cost. This process requires photocatalysts with a wide photoabsorption range, good stability, high charge separation efficiency, and excellent redox properties. It is difficult to meet these requirements using a monocomponent photocatalyst. However, composite materials, such as those formed by graphene oxide (GO) and TiO2, can overcome the limitations of monocomponent photocatalysts by increasing the charge separation and the redox capacity [21].
TiO2 is used in a wide range of applications in different fields, including energy [22] and the environment [23], thanks to its low cost, easy management, chemical stability, and good optical and electronic properties [24]; however, it has a low quantum performance, mainly due to the recombination of electron-positive hole pairs. Therefore, major efforts have been made to prepare TiO2-based composite materials that can reduce electron-positive hole recombination. Graphene and its derivatives, such as GO, have been proposed as among the most promising candidates for developing photo-efficient catalyst composites. The combination of TiO2 with graphene derivatives generates a synergic effect that potentially improves organic pollutant degradation due to improved adsorption capacity and efficient interface electron transfer between phases in the composite [25].
Numerous authors have studied TiO2 as photocatalyst to remove individual parabens from aqueous solutions [26,27,28]. Other catalysts used in paraben photodegradation have been ZnO [29], Bi4O5I2/Bi5O7I [30], CoOx/BiVO4 [31], Ag3PO4 [32], Al-doped-TiO2 [33], Fe-doped-WO3 [34], BiOI-hidrogel [35], and I-doped-Bi4O5Br2 [36].
GO/TiO2 composite materials have been used in the degradation of dyes [37,38,39], pharmaceuticals [37], and pesticides [25]. However, there has been no report to date on their use in the degradation of parabens under UV radiation.
The characteristics that determine the behavior of photocatalysts are directly related to their structure and composition. The physicochemical characterization of composite materials is essential to correlate their catalytic behavior with their structure and physicochemical properties. Numerous techniques are available for the characterization of photocatalysts, yielding extensive information on their morphological, chemical, and electronic properties [40].
With this background, the objective of this study was to obtain a series of reduced graphene oxide (rGO)-TiO2 composites with different rGO contents by means of hydrothermal synthesis. All of these materials were exhaustively characterized in order to correlate their structural, chemical, electronic, and optical properties with their photoactivity in the UV radiation-induced degradation of organic pollutants in aqueous solutions. Surface area and porosity were determined by N2 adsorption and crystalline structure by X-ray diffraction (XRD). The dispersion and chemical nature of the catalysts were studied using Fourier transforming–infrared (FTIR) spectroscopy, Raman spectroscopy, X-ray photoelectron spectroscopy (XPS), and thermogravimetric analysis (TGA). Finally, their optical properties were analyzed by diffuse reflectance spectroscopy (DRS). Ethylparaben (EtP) was selected as model pollutant to investigate and compare the photocatalytic activity of the catalysts under study and to analyze the influence of their rGO content.

2. Results

2.1. Porosity and Surface Area

The performance of a photocatalyst can be improved by increasing its surface area and pore volume, increasing the adsorption of pollutant molecules, fast transport of products, and the separation of electron-positive hole pairs. Table 1 displays the textural characteristics of rGO-TiO2 and rGO-P25 samples. TiO2 has higher SBET (81.5 m2/g), V0 (0.030 cm3/g), and V0.95 (0.375 cm3/g) values in comparison to P25 (57.0 m2/g, 0.020 cm3/g, and 0.138 cm3/g, respectively), possibly attributable to the smaller size of TiO2 nanoparticles in comparison to P25, as confirmed by XRD results. Incorporation of rGO sheets significantly increases the surface area and pore volume of composites in comparison to TiO2 alone, with the consequent decrease in mean micropore width (L0) and increase in characteristic adsorption energy (E0) as the amount of rGO in the nanocomposite is enhanced. This change in porosity takes place because the incorporation of reduced graphene oxide hampers the agglomeration of TiO2 nanoparticles, which augments the surface area. rGO-TiO2 composites have a larger surface area and porosity in comparison to rGO-P25 composites throughout the rGO% range.

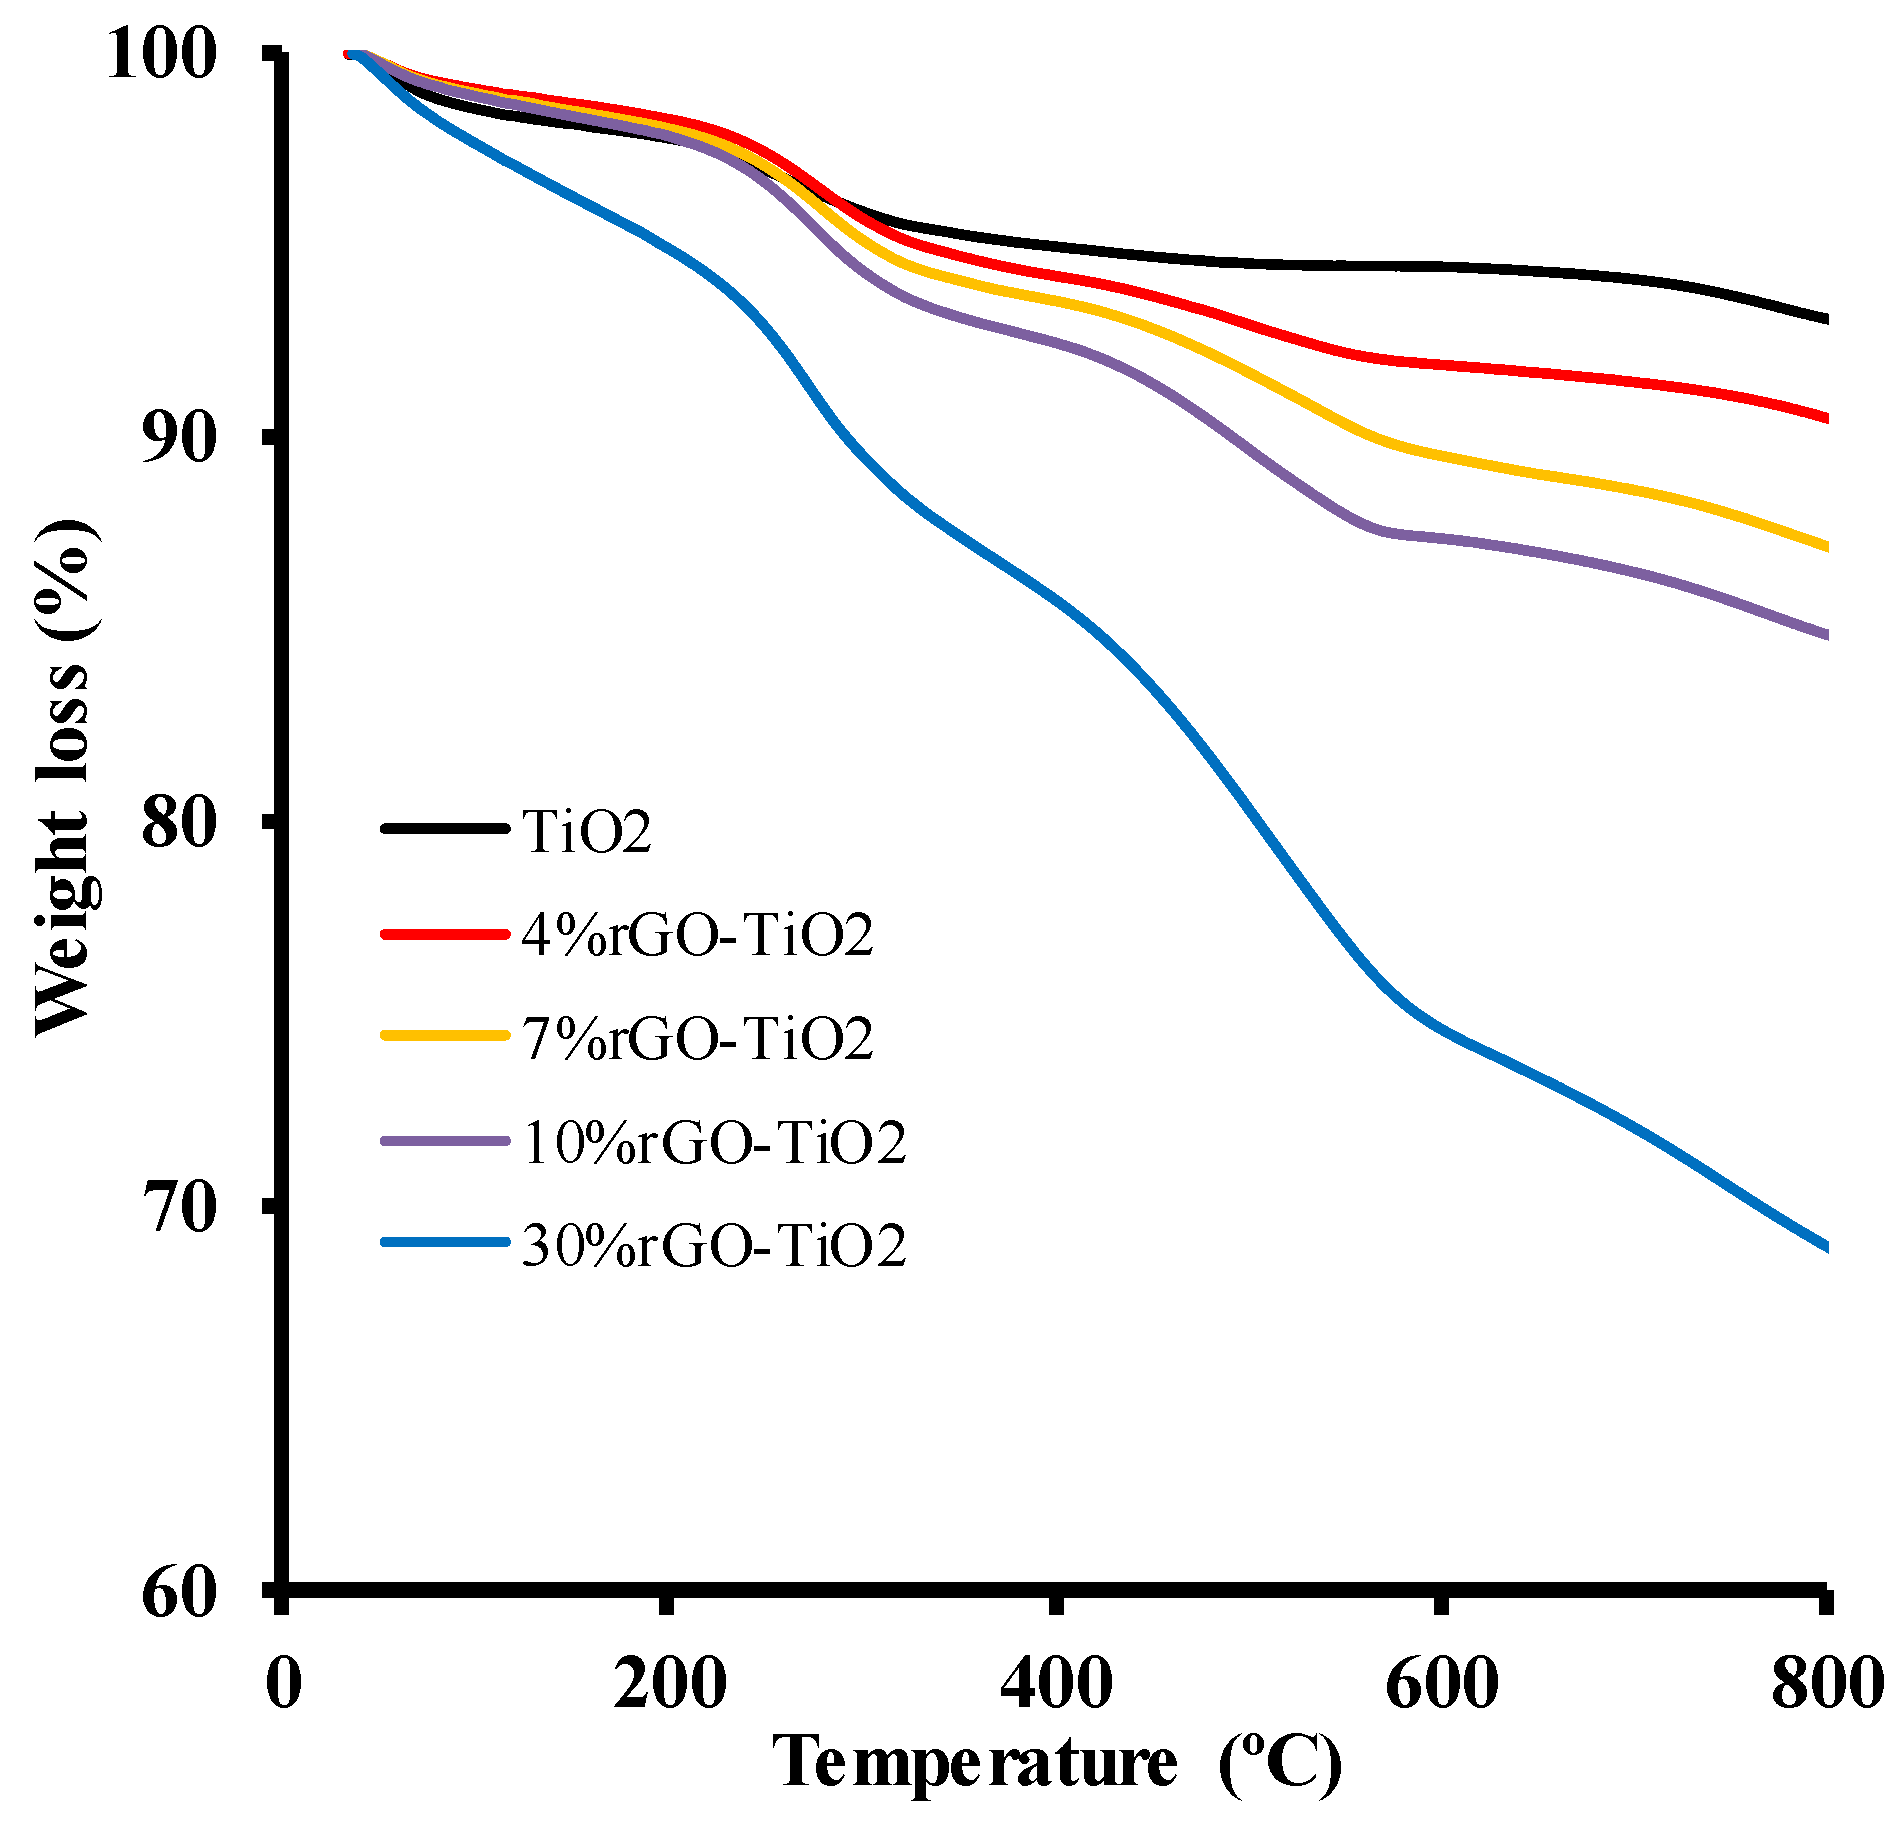
2.2. Thermogravimetric Analysis

Figure 1 depicts thermogravimetric analysis curves for TiO2 and composite materials obtained in air atmosphere up to a temperature of 800 °C, showing four mass loss regions. The curves reveal an initial mass loss from 35 to 200 °C, corresponding to dehydration and related to the elimination of adsorbed water molecules from the surface; the second loss, between 200 and 325 °C, corresponds to the decomposition of labile oxygenated groups bound to GO sheets; the third loss, between 325 and 600 °C, corresponds to the combustion of carbon and more stable oxygenated groups [37,41]; and the fourth, between 600 and 800 °C, corresponds to the dehydroxylation process. The rGO (%) content of composites was calculated by subtracting the mass loss of TiO2 alone from the mass loss of rGO-TiO2, obtaining 3.7% for 4% rGO-TiO2, 6.9% for 7% rGO-TiO2, 9.4% for 10% rGO-TiO2, and 28.3% for 30% rGO-TiO2.
Figure S1 (in Supplementary Material) depicts the thermogravimetric analysis curves for P25 and x% rGO-P25 composites. The rGO content of the composites is 4.6% for 4% rGO-P25, 7.4% for 7% rGO-P25, 10.8% for 10% rGO-P25, and 28.1% for 30% rGO-P25.

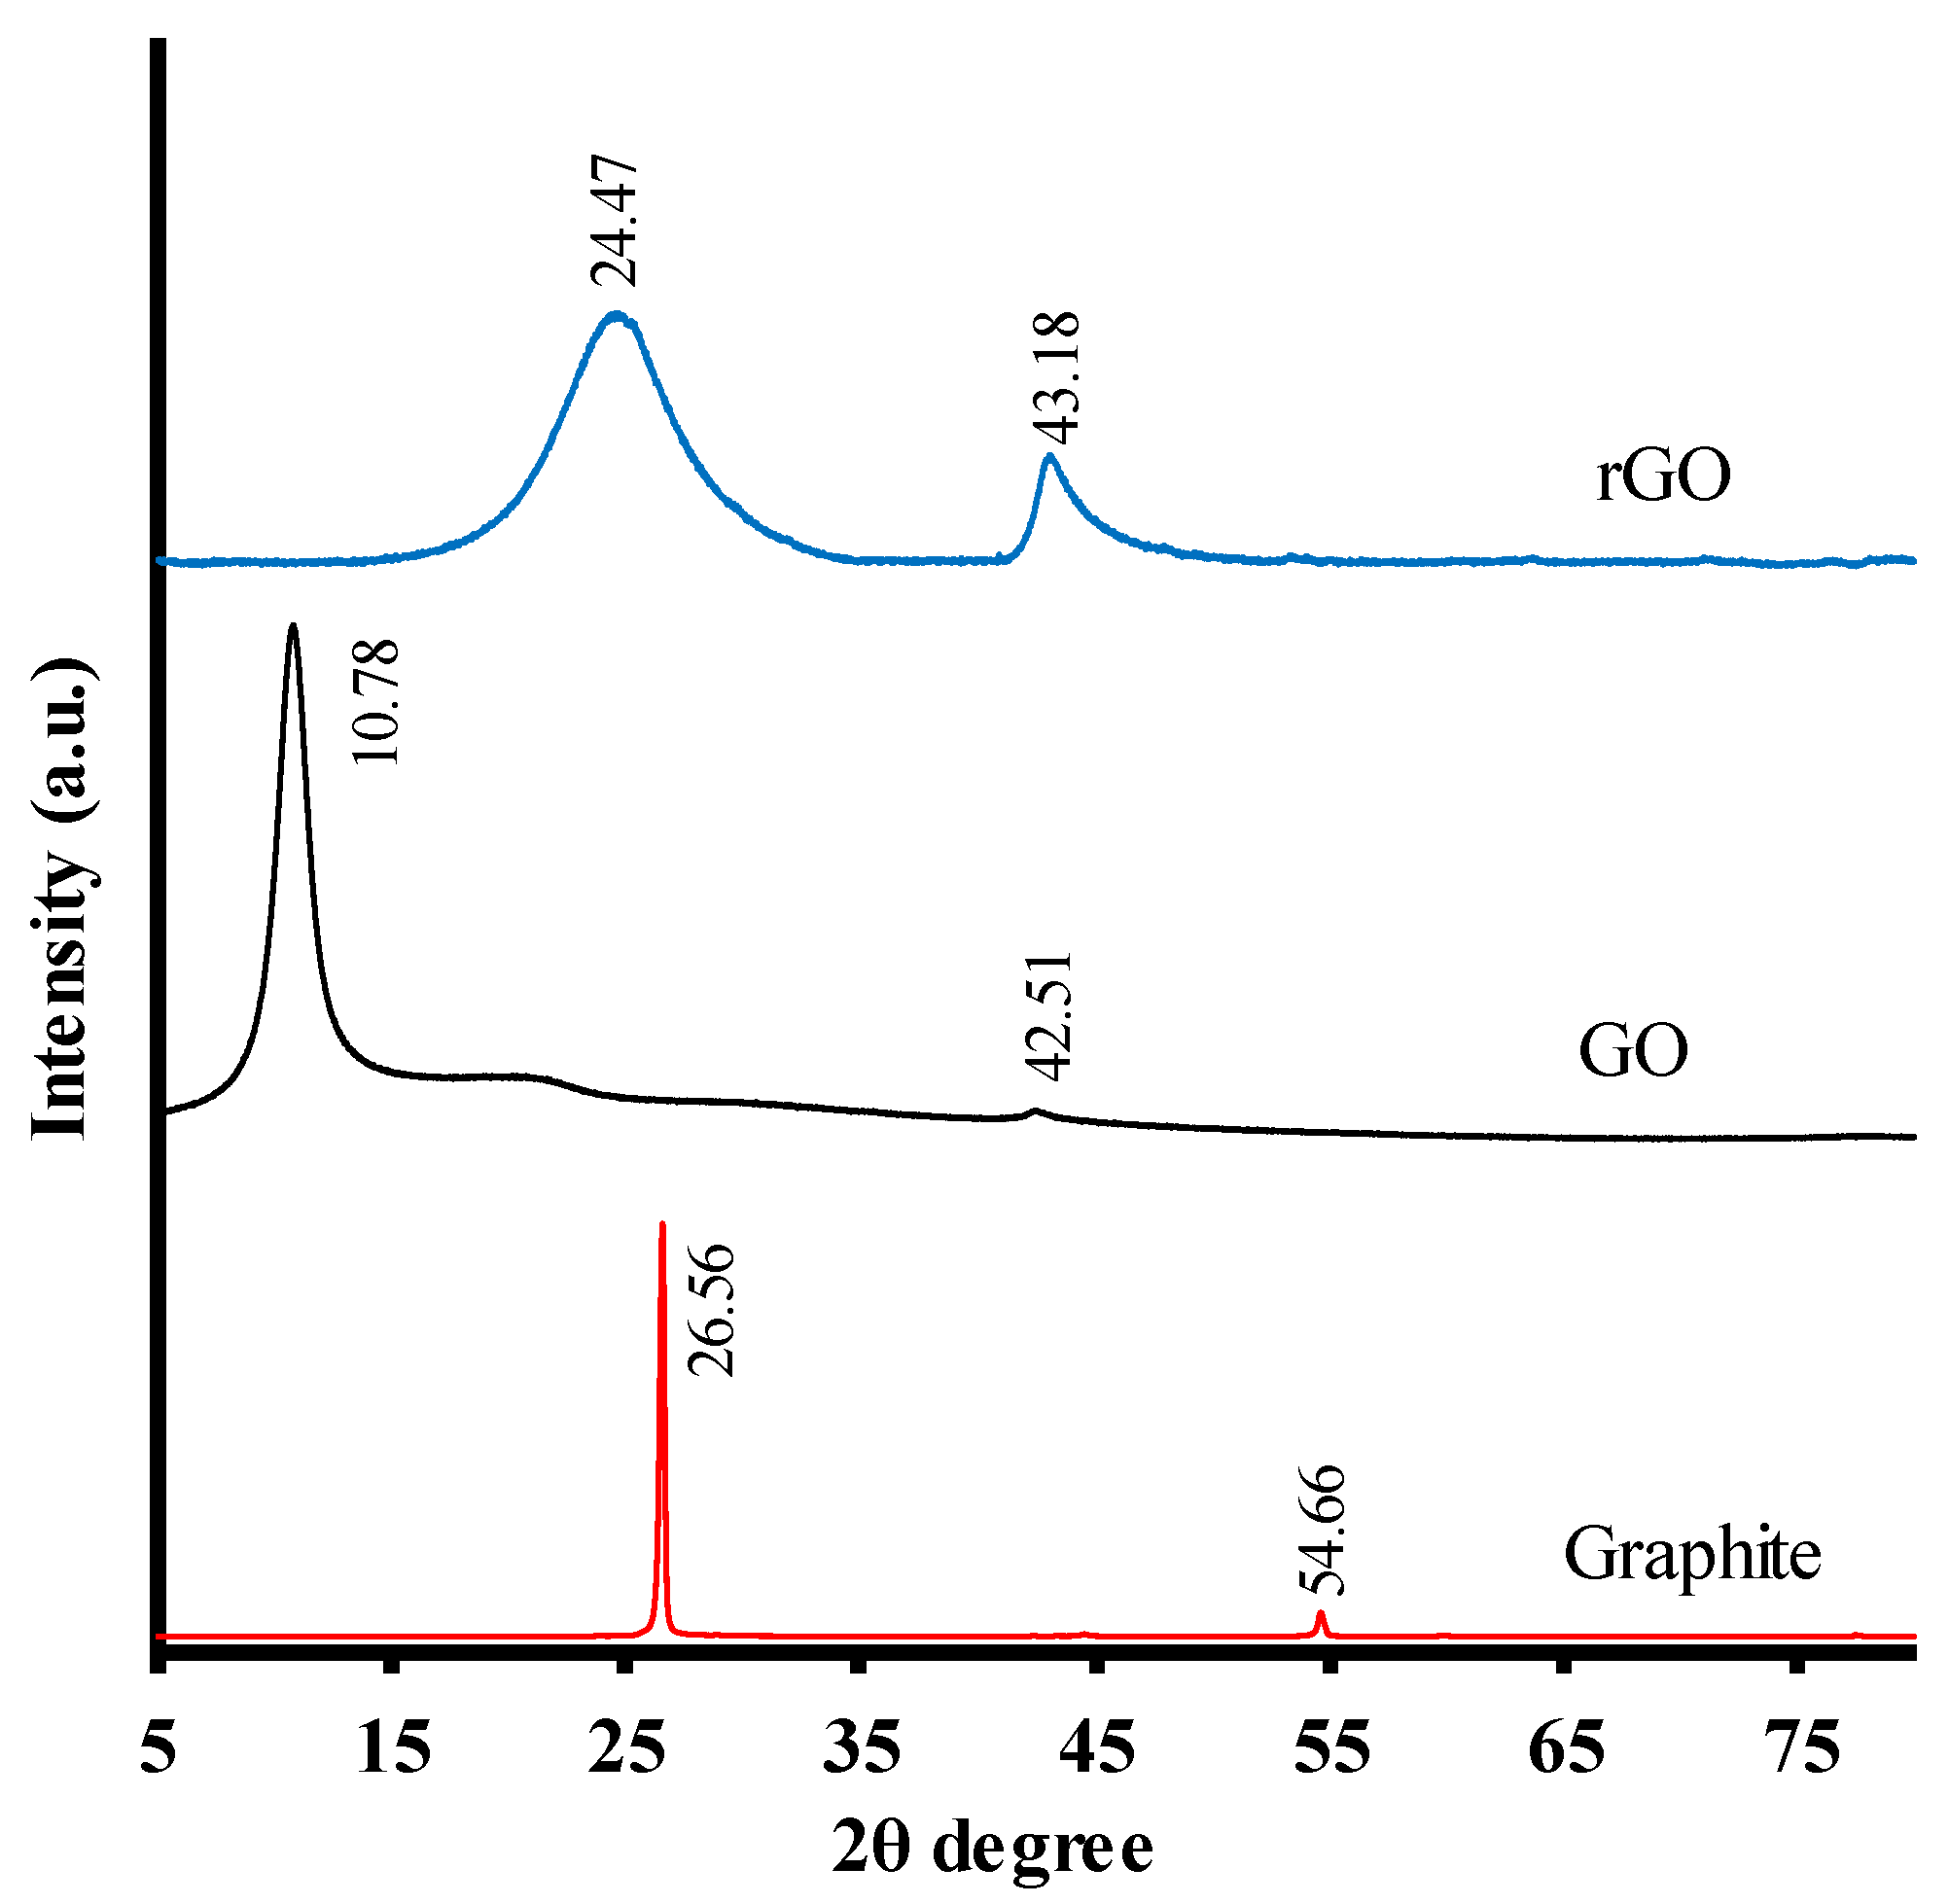
2.3. X-ray Diffraction Analysis

Figure 2 depicts the diffractograms for graphite, GO, and rGO. Graphite shows a pronounced diffraction peak centered at 2θ = 26.56°, corresponding to the (002) plane and indicating a high degree of crystallinity, with an interplanar distance of 0.336 nm (obtained by applying Bragg’s law). Graphite peaks were identified using the JCPDS file n° 75-1621.
The GO diffractogram shows only two peaks, at 10.78° and 42.51°. Differences with the graphite diffractogram indicate that the graphite structure was modified by oxidation. The peak at 26.56° (002) for graphite is shifted to 10.78° in the XRD for GO, this results from the incorporation of functional groups containing oxygen (hydroxyl, carbonyl, carboxylic, and epoxide groups) [42] in basal graphite sheets, increasing interplanar separation [43,44]. Individual GO sheets are expected to be thicker than in the original graphene due to the presence of oxygen-containing functional groups bound to both sides of the sheets and the roughness at atomic scale that arises from structural defects (sp3 bond) generated in the originally flat graphene sheets [45].
Application of the Bragg equation to the diffraction peak (001) for GO at 10.78° yields a value of 0.820 nm, more than doubling the interplanar distance in comparison to the original graphite. The intense peak at 26.56°, characteristic of graphite, is completely absent in the XRD for GO. A low intensity peak appears at 42.51°, associated with plane (100) of the honeycomb hexagonal structure of graphite, also indicating the reaction effect. This peak (100) remains after oxidation and, alongside the disappearance of 002, indicates the loss of crystallinity through the generation of defects in the structure [46].
The rGO sample diffractogram shows a wide peak centered at 24.47°, indicating a poor sheet ordering along the stacking direction [41]. This finding is related to the exfoliation and reduction of GO by the elimination of interspersed water and surface oxygenated groups. The interplanar distance is slightly larger in rGO (0.36 nm) than in graphite (0.34 nm), suggesting the presence of some residual surface oxygen groups in rGO. The band at 43.18° corresponds to the turbostratic band of disordered carbon materials [47].
The interplanar distance, d002, of the sheets in these graphene materials is calculated by applying Bragg’s law. The crystal size in direction c (D002) of these materials is calculated by applying the Scherrer equation to the peak (002). Table 2 exhibits the values for the positions of diffraction peaks (2θ), full width at half maximum (FWHM) of the peak, interplanar distance (d002), and crystal size (D002) for each material analyzed. The crystal size of graphite, with the lowest FWHM value, is substantially higher than that of GO or rGO. The size represents the approximate crystal width, which is related to the interplanar distance and allows the number of graphene sheets in the crystal to be calculated (Nsheets = D002/d002). Estimation of the number of sheets is much higher for graphite (n = 99.3) than for GO (n = 6.4) or rGO (n = 4.0).
Figure 3 depicts the X-ray diffractograms of synthesized TiO2 nanoparticles and of rGO-TiO2 composites with different percentages of rGO. Table 3 exhibits the 2θ, FWHM, and D101 values for each material. The experimental XRD pattern for TiO2 matches JCPDS file n° 21−1272, and the peaks of 2θ at 25.26° and 47.95° confirm its anatase structure. Diffractograms of the samples show no peak assigned to rutile (2θ = 27.36° and 36.02°), indicating formation of the pure anatase phase of TiO2.
We observed no peaks of rGO in any rGO-TiO2 samples (Figure 3), possibly due to their low percentages of rGO, so that they are masked by the diffraction signal for TiO2, and/or to destruction of the regular stack of GO through the intercalation of TiO2 during sample preparation [38,39,41,43,44,48,49]. In comparison to GO (Figure 2), the complete disappearance of the peak at 10.78° in all composites suggests the successful conversion of GO to rGO in the final composites [39,50].
The peak at 25.2° is slightly wider in composites than in TiO2, suggesting that the reticular structure of TiO2 is distorted by interaction with GO. The mean crystal size, calculated using the Scherrer equation for composites, is within the range of 19.7–17.6 nm, smaller than the size for TiO2 (Table 3). The smallest size is for the 7% rGO-TiO2 composite.
Figure S2 (Supplementary Material) depicts X-ray diffractograms of P25 nanoparticles and of rGO-P25 composite materials with different percentages of rGO. Table S1 lists some of the characteristics of these materials according to their diffractograms. Peaks at 2θ = 25.26° and 48.01° confirm the anatase structure. The diffractogram shows a peak at 2θ = 27.39°, assigned to rutile (JCPDS n° 88−1175) [49]. The anatase and rutile content of P25 was calculated using Equation:
XA = 100/(1 + 1.265IR/IA)
where XA is the fraction in anatase weight of the mixture, and IA and IR are the intensities of the diffraction peaks of anatase (101) and rutile (110) [51]. The XRD data indicate that the anatase:rutile ratio is 86:14. The crystal size is 20.6 nm for anatase and 19.3 nm for rutile. In composites with P25, the crystal size is changed by the presence of rGO (Table S1) [52]. The TiO2 sample prepared for this study contains 100% anatase. The anatase crystal size is larger in P25 (20.6 nm), the sample containing rutile, than in the TiO2 sample (19.9 nm).

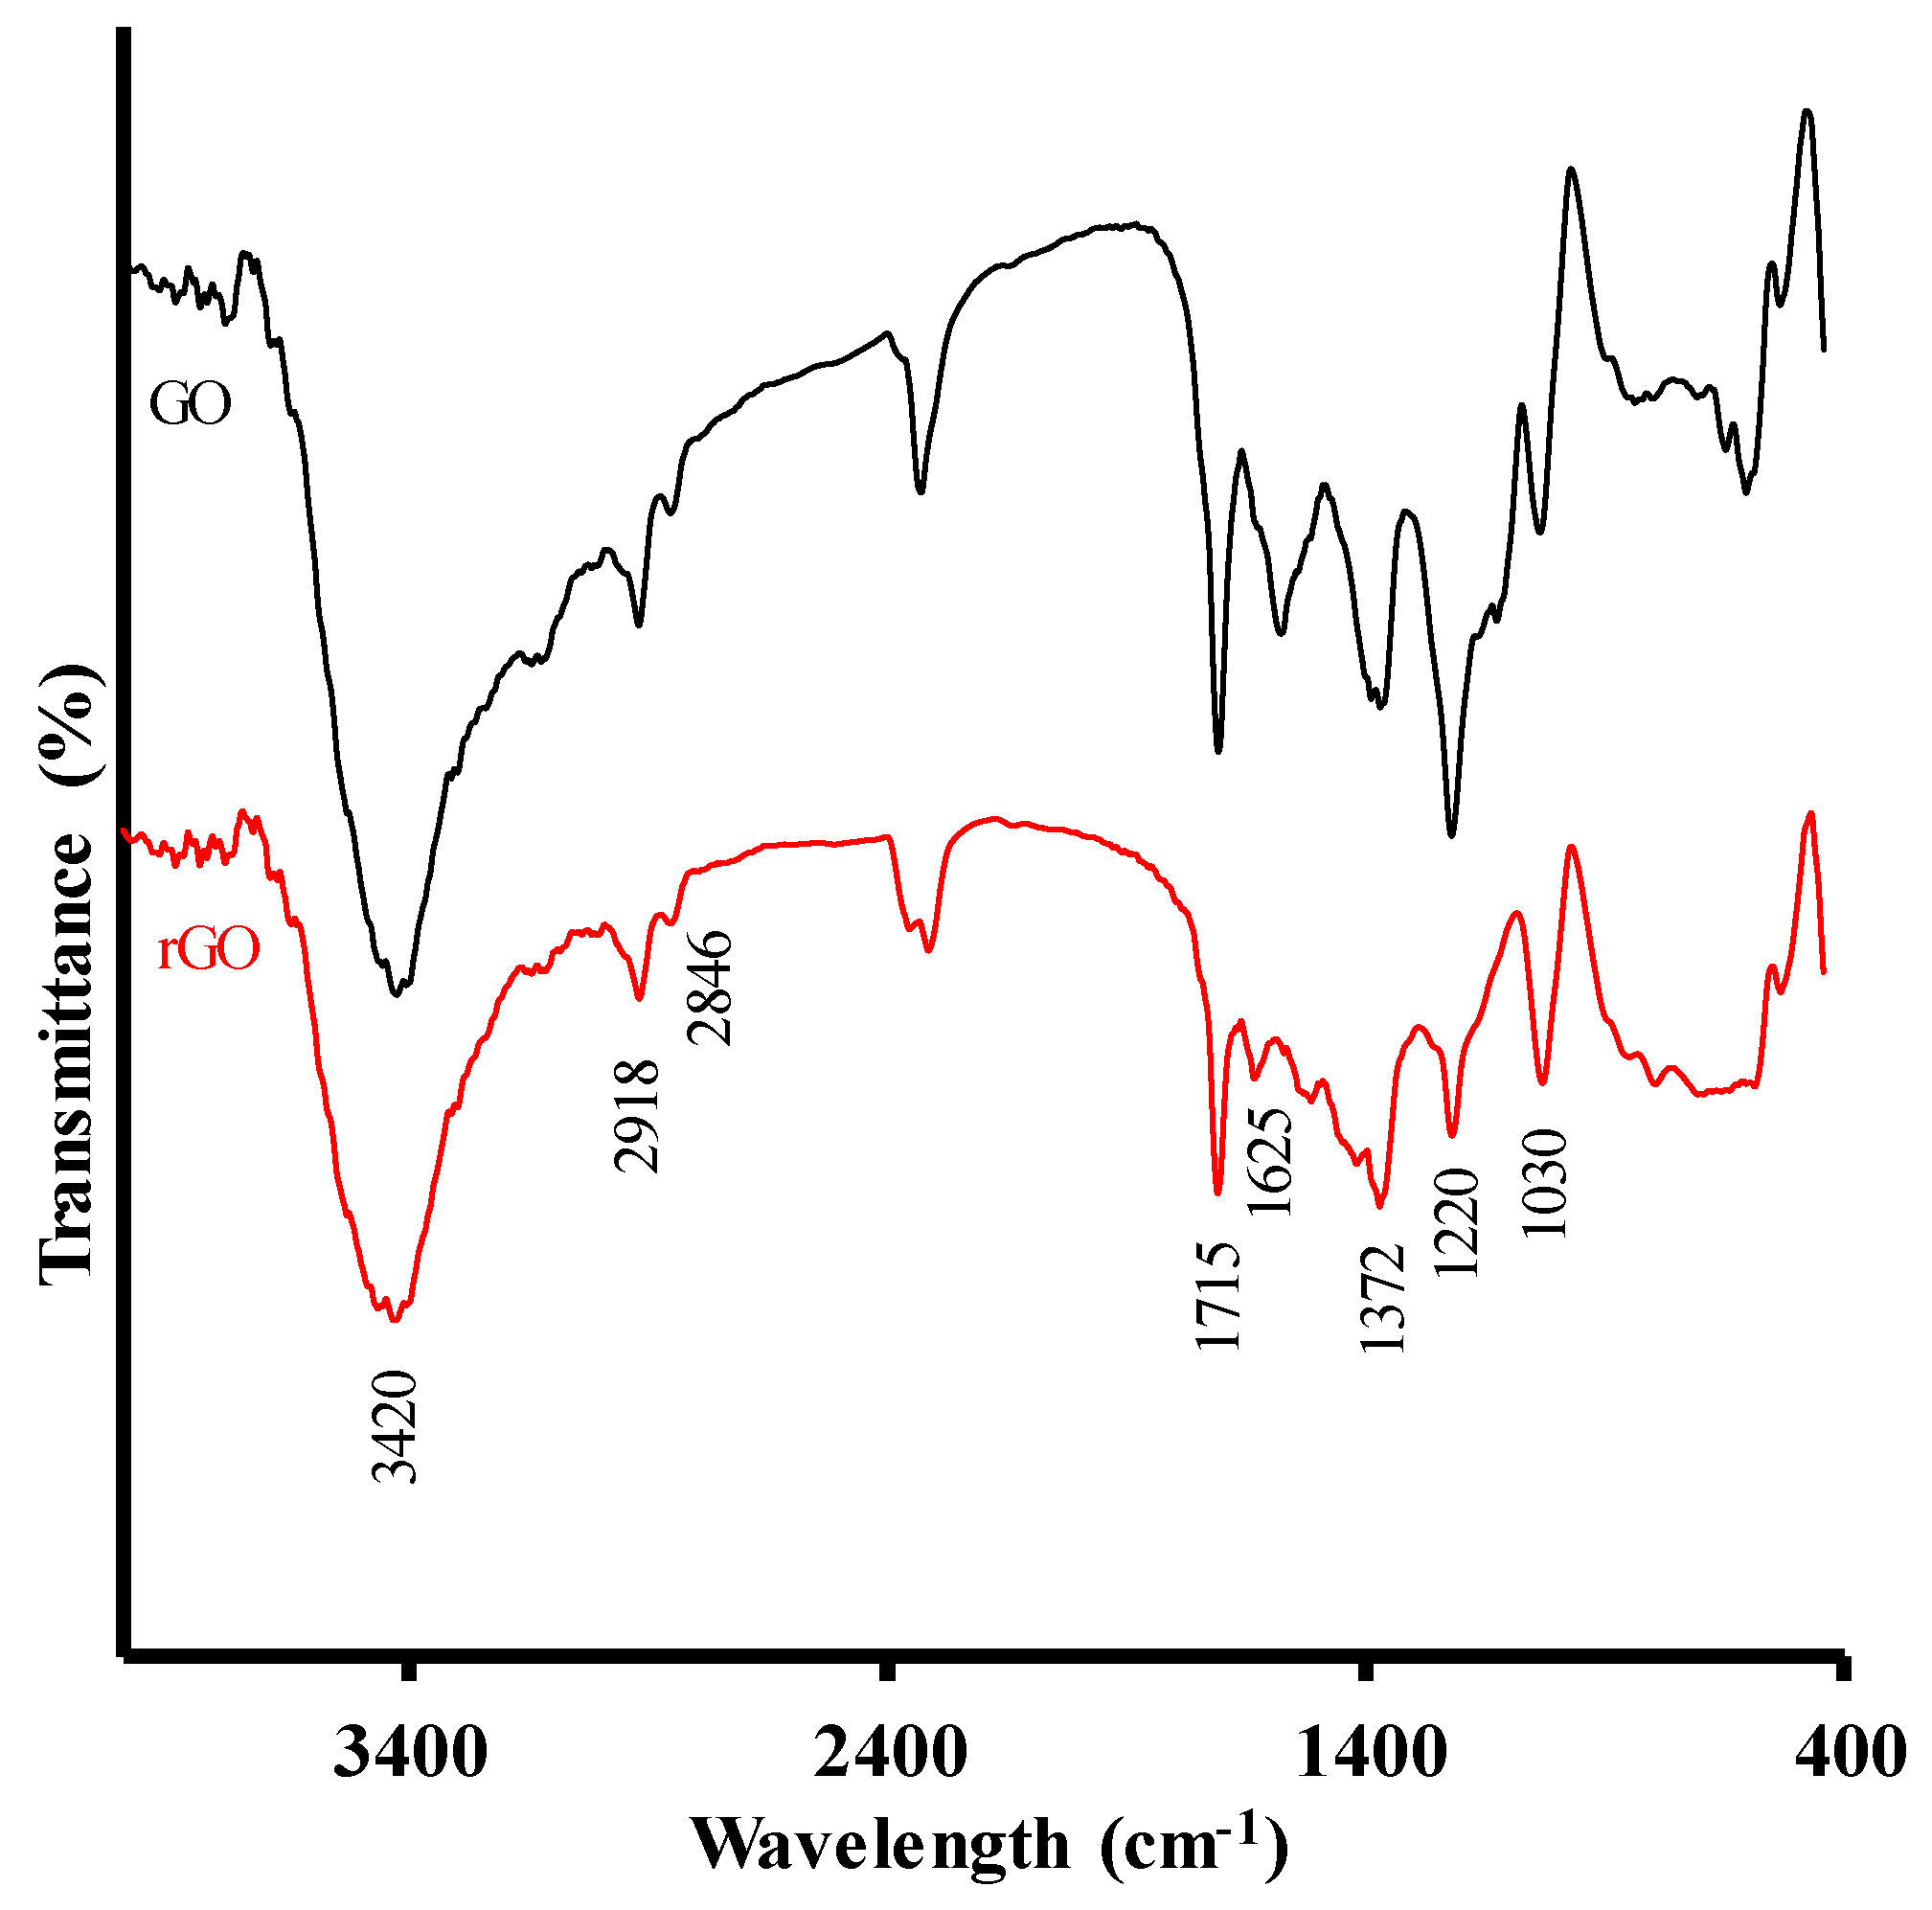
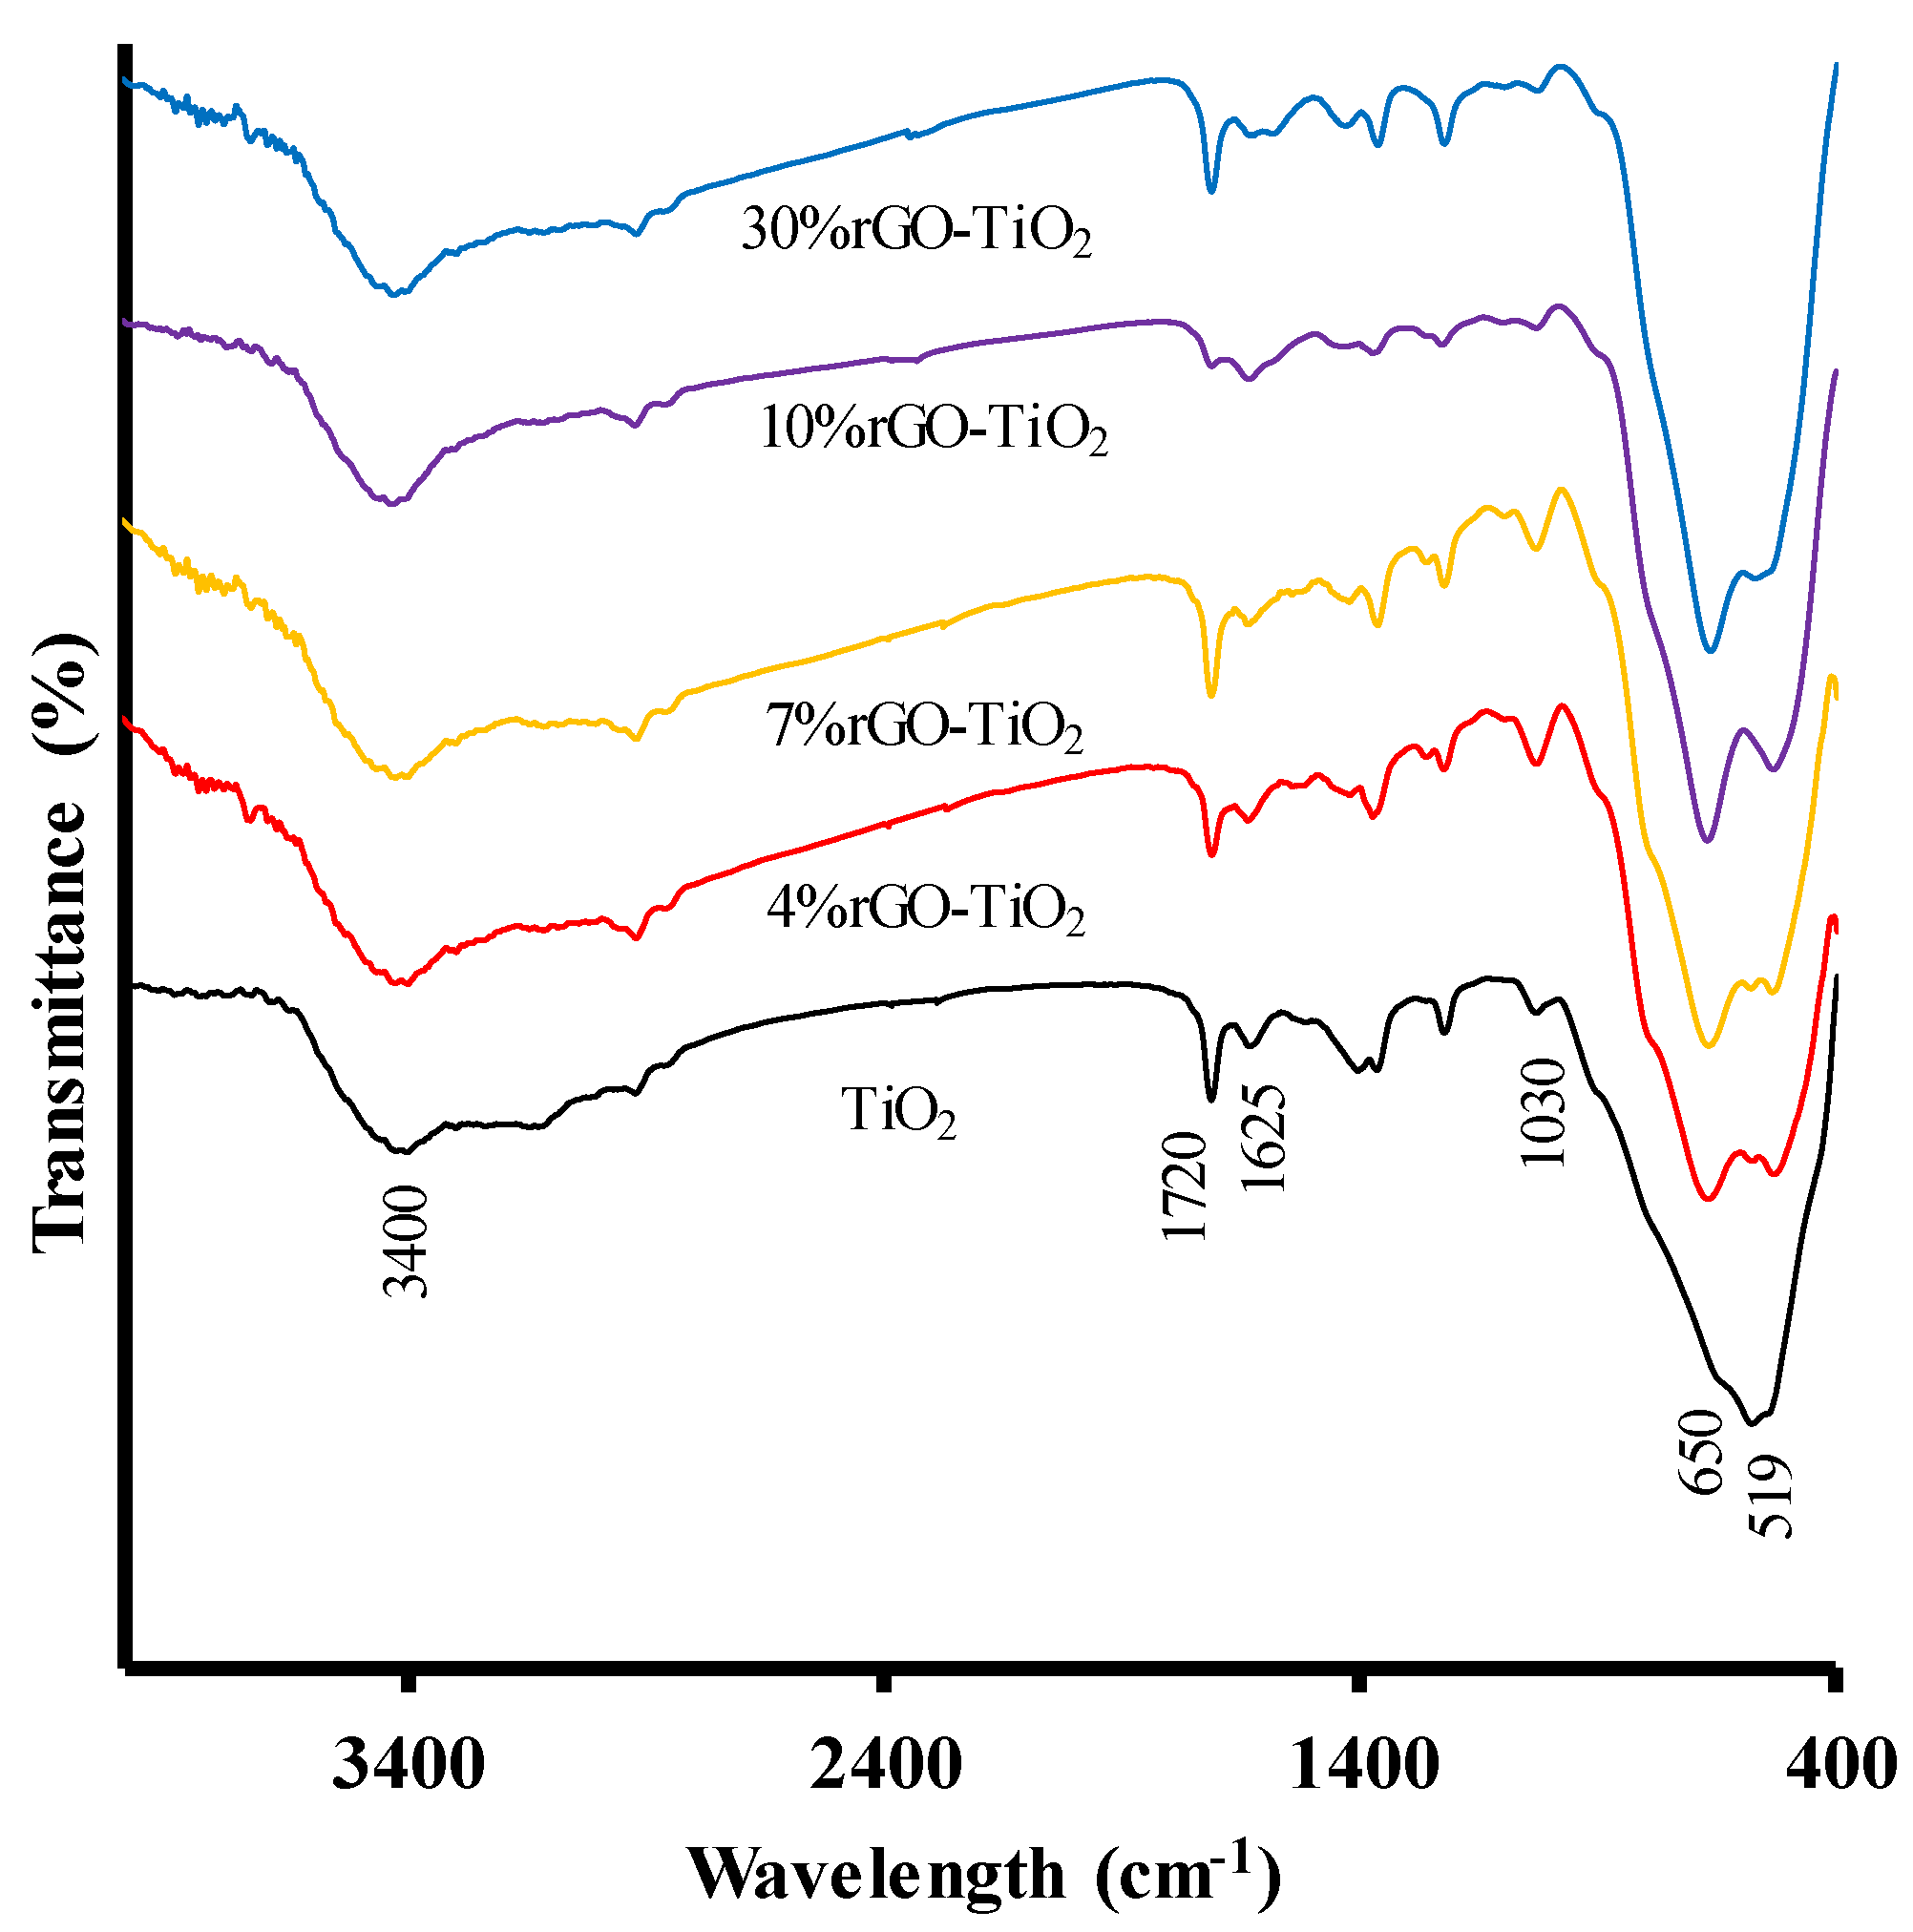
2.4. Fourier-Transform Infrared (FTIR) Spectroscopy

Infrared spectroscopy provides information on chemical composites and their structures through the molecular vibrations associated with each band. Figure 4 depicts the FTIR spectra for GO and rGO. Graphite shows no significant peaks (spectrum not shown). GO shows numerous peaks or bands of oxygenated groups [42].
There is a wide band at 3420 cm−1, corresponding to stretching vibrations of the -OH bond in C–OH groups, with possible contributions from carboxylic acids and water [25,53,54,55,56]. The small peaks at 2918 and 2846 cm−1 are attributed to stretching vibrations of CH2. The peak at 1715 cm corresponds to the stretching of carbonyl/carboxyl groups (C=O) of the carboxylic functionalities (–COOH) presumably located at the sheet edges [25,53,55,56,57,58]. The peak at 1625 cm−1 is related to stretching in the sp2 vibration plane of C=C bond [55,56]. The peak at 1372 cm−1 corresponds to bending vibrations of C–OH hydroxyl groups [25,53,57], and the peak at 1220 cm−1 to bending vibrations of epoxy groups (C–O–C) [25,53,56,57]. The peak at 1030 cm−1 corresponds to the C–O vibration of epoxy, ether, or peroxide groups [53,57]. The results obtained for GO by this technique are highly useful and complement XPS results, because it detects the presence/absence of epoxy groups, which are not differentiated from carbonyls with XPS. All the above peaks are characteristic of GO; however, in the case of rGO, the peaks at 1715, 1372, and 1030 cm−1 (attributed to vibrations of COOH, C–OH, and C–O groups, respectively) decrease in intensity due to the decomposition of these groups during hydrothermal treatment.
Figure 5 displays the IR spectra of rGO-TiO2 composites. In TiO2, the strong and wide band at 3400 cm−1 corresponds to stretching vibration of hydrogen bound to surface water molecules and hydroxyl groups. This is confirmed by the presence of a peak at 1625 cm−1 caused by bending vibration of coordinated water and Ti–OH groups [57,59]. This peak is also assigned to vibration of the aromatic ring in the GO structure within the composites. The reduced intensity of the peak in the composites at 1720 cm−1 suggests that they largely contain hydroxyl groups rather than ketone or carboxylic groups [58]. The reduction in the peak at 1030 cm−1 corresponds to oxygenated functional groups such as C–O [42].
The spectra of TiO2 and composites show peaks at 650 and 519 cm−1, attributed to vibration of Ti-O-Ti bonds in TiO2 [25,42,57,59]. Generally, broadbands or peaks below 1000 cm−1 in composites indicate a combination of Ti–O–Ti and Ti–O–C vibrations due to the chemical interaction of TiO2 with rGO [54]. The presence of Ti–O–C bonds indicates that GO, with residual carboxyl groups, strongly interacts with the surface hydroxyl groups of TiO2 nanoparticles and forms chemical bonds in the composites during hydrothermal treatment.
The absorption peaks of oxygenated functional groups such as C=O (1717 cm−1), –OH (1170 cm−1), and C–O–C (1035 cm−1) drastically decrease or even disappear in composites, indicating that TiO2 preferentially binds to rGO at these sites [25,42,55,56,57,60].
Figure S3 depicts the IR spectra of rGO-P25 composites, showing a reduced intensity of the peaks for surface groups present in rGO (Figure 4) due to the formation of bonds between P25 and rGO. Sample P25 has a wide peak at 3400 cm−1 and another at 1630 cm−1, corresponding to OH groups, and a wide band below 900 cm−1, attributed to the vibration of Ti–O–Ti bonds.

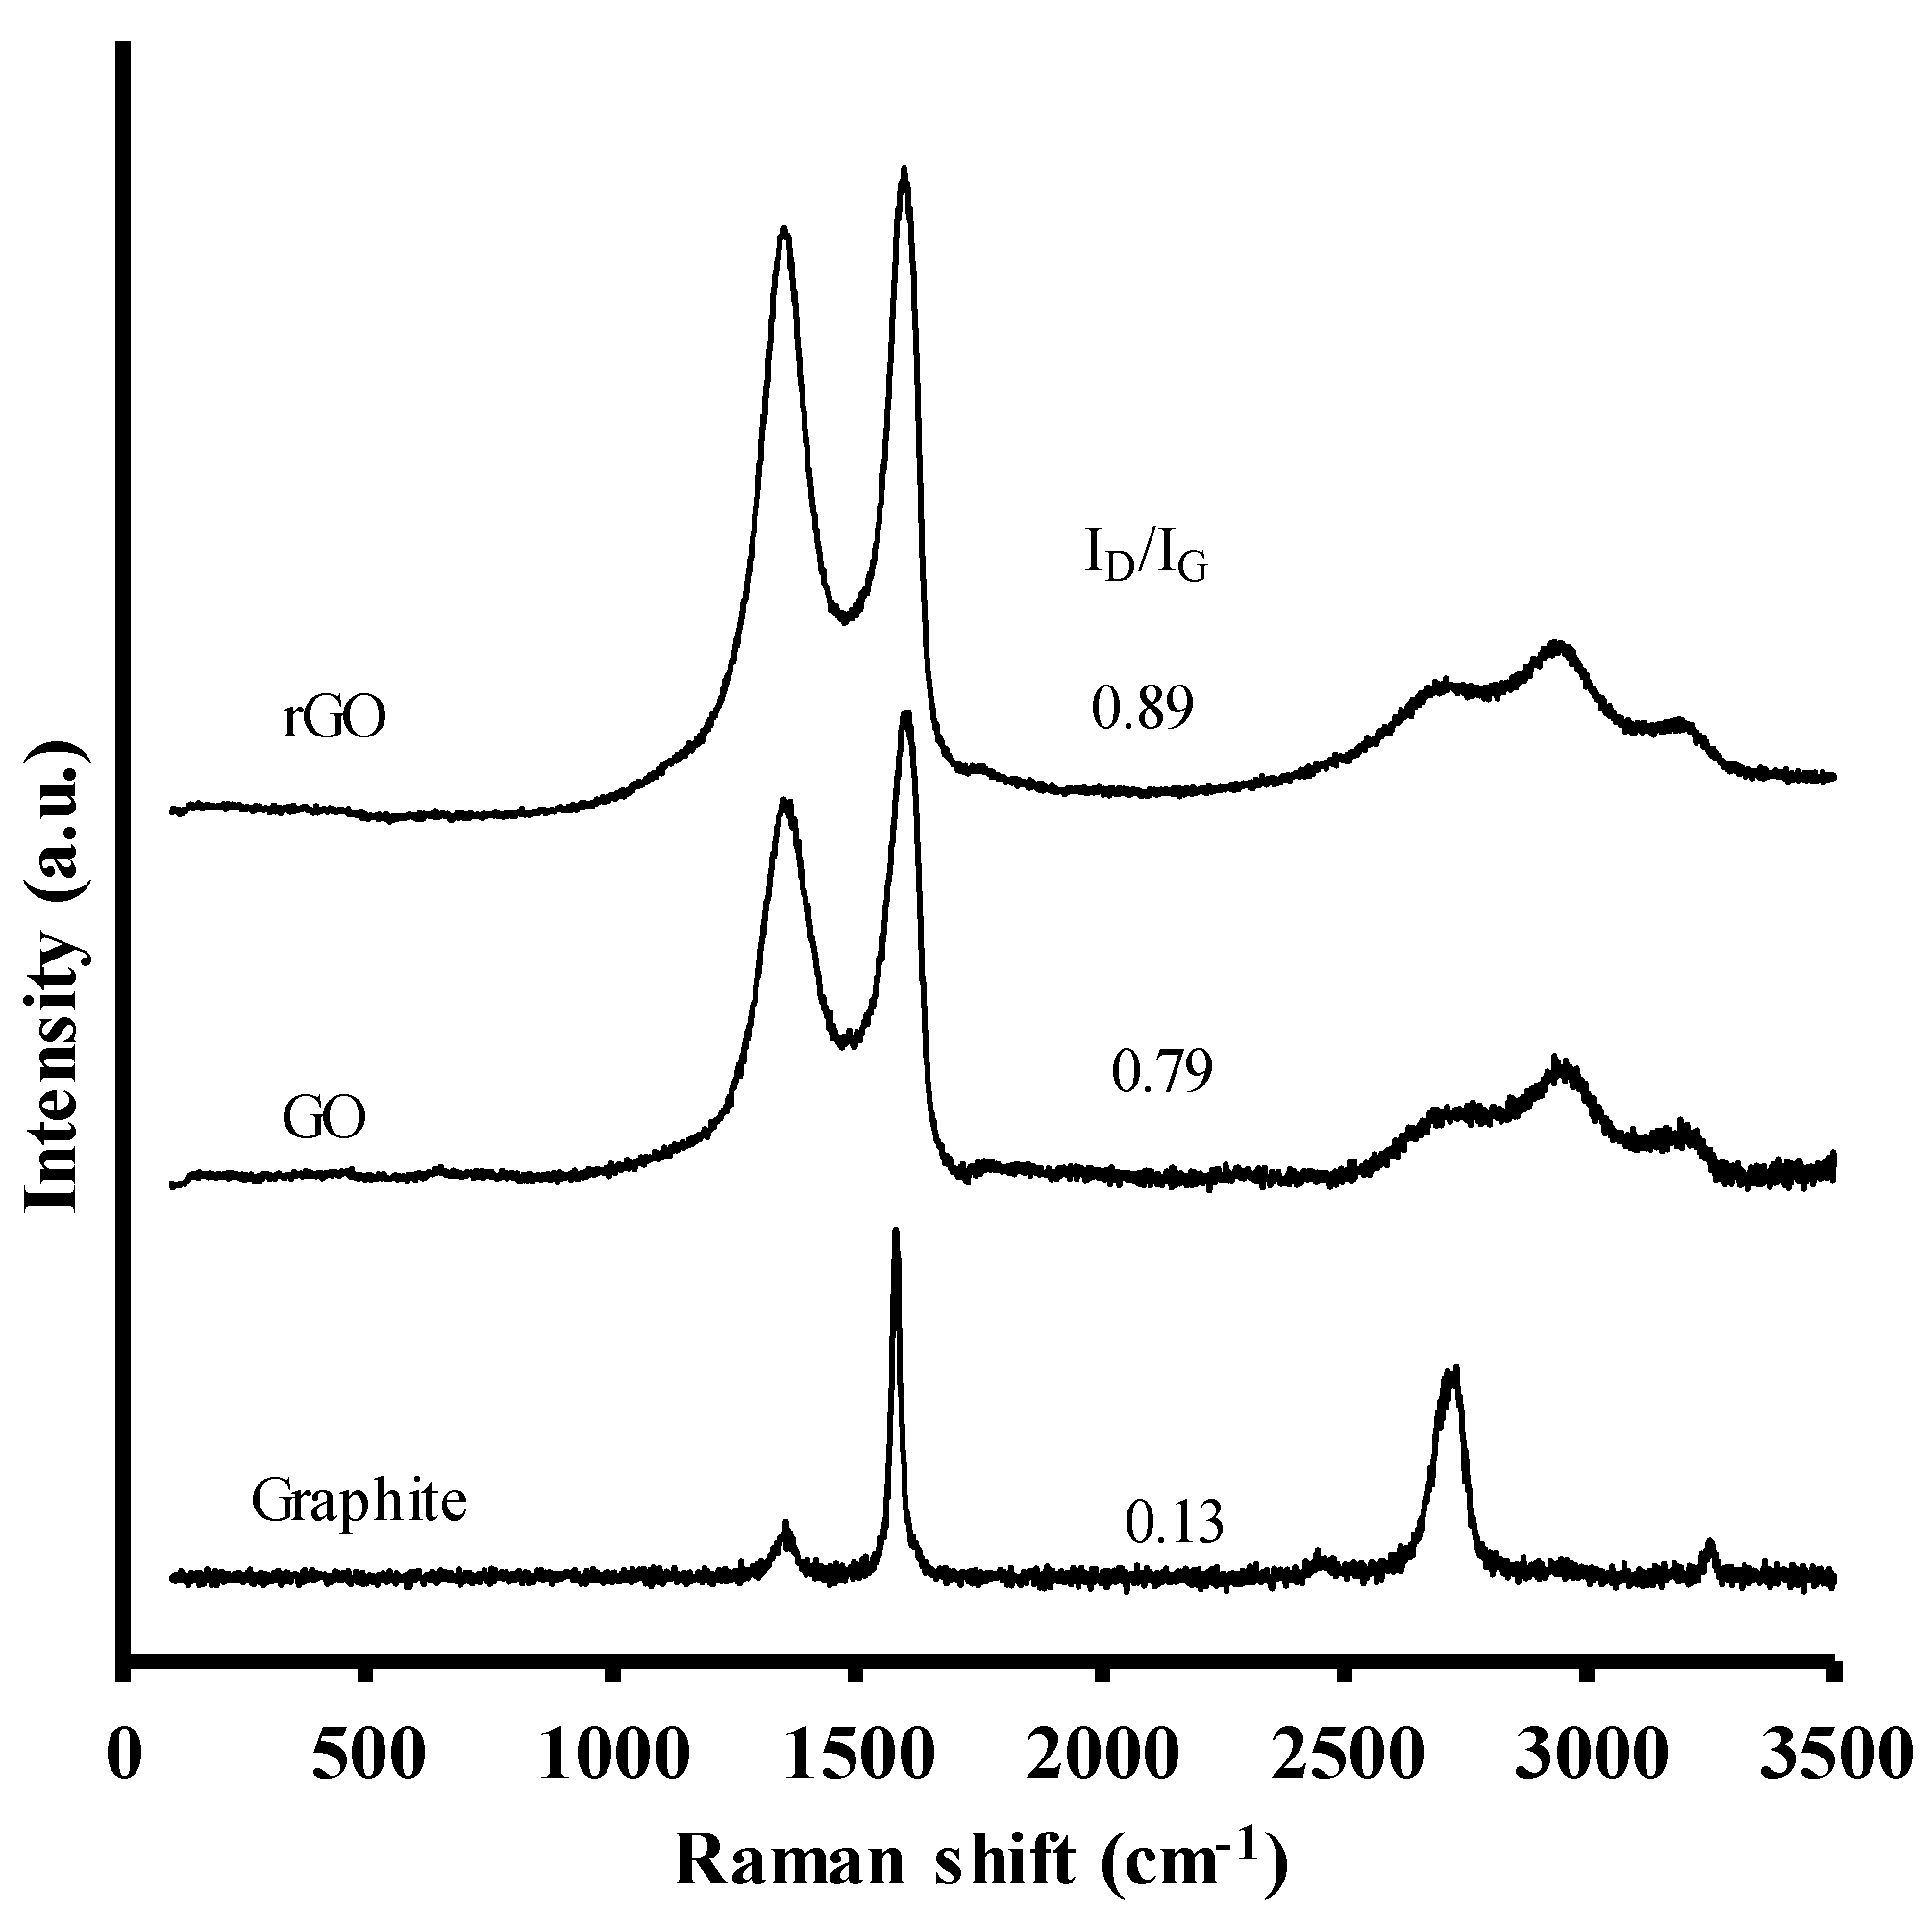
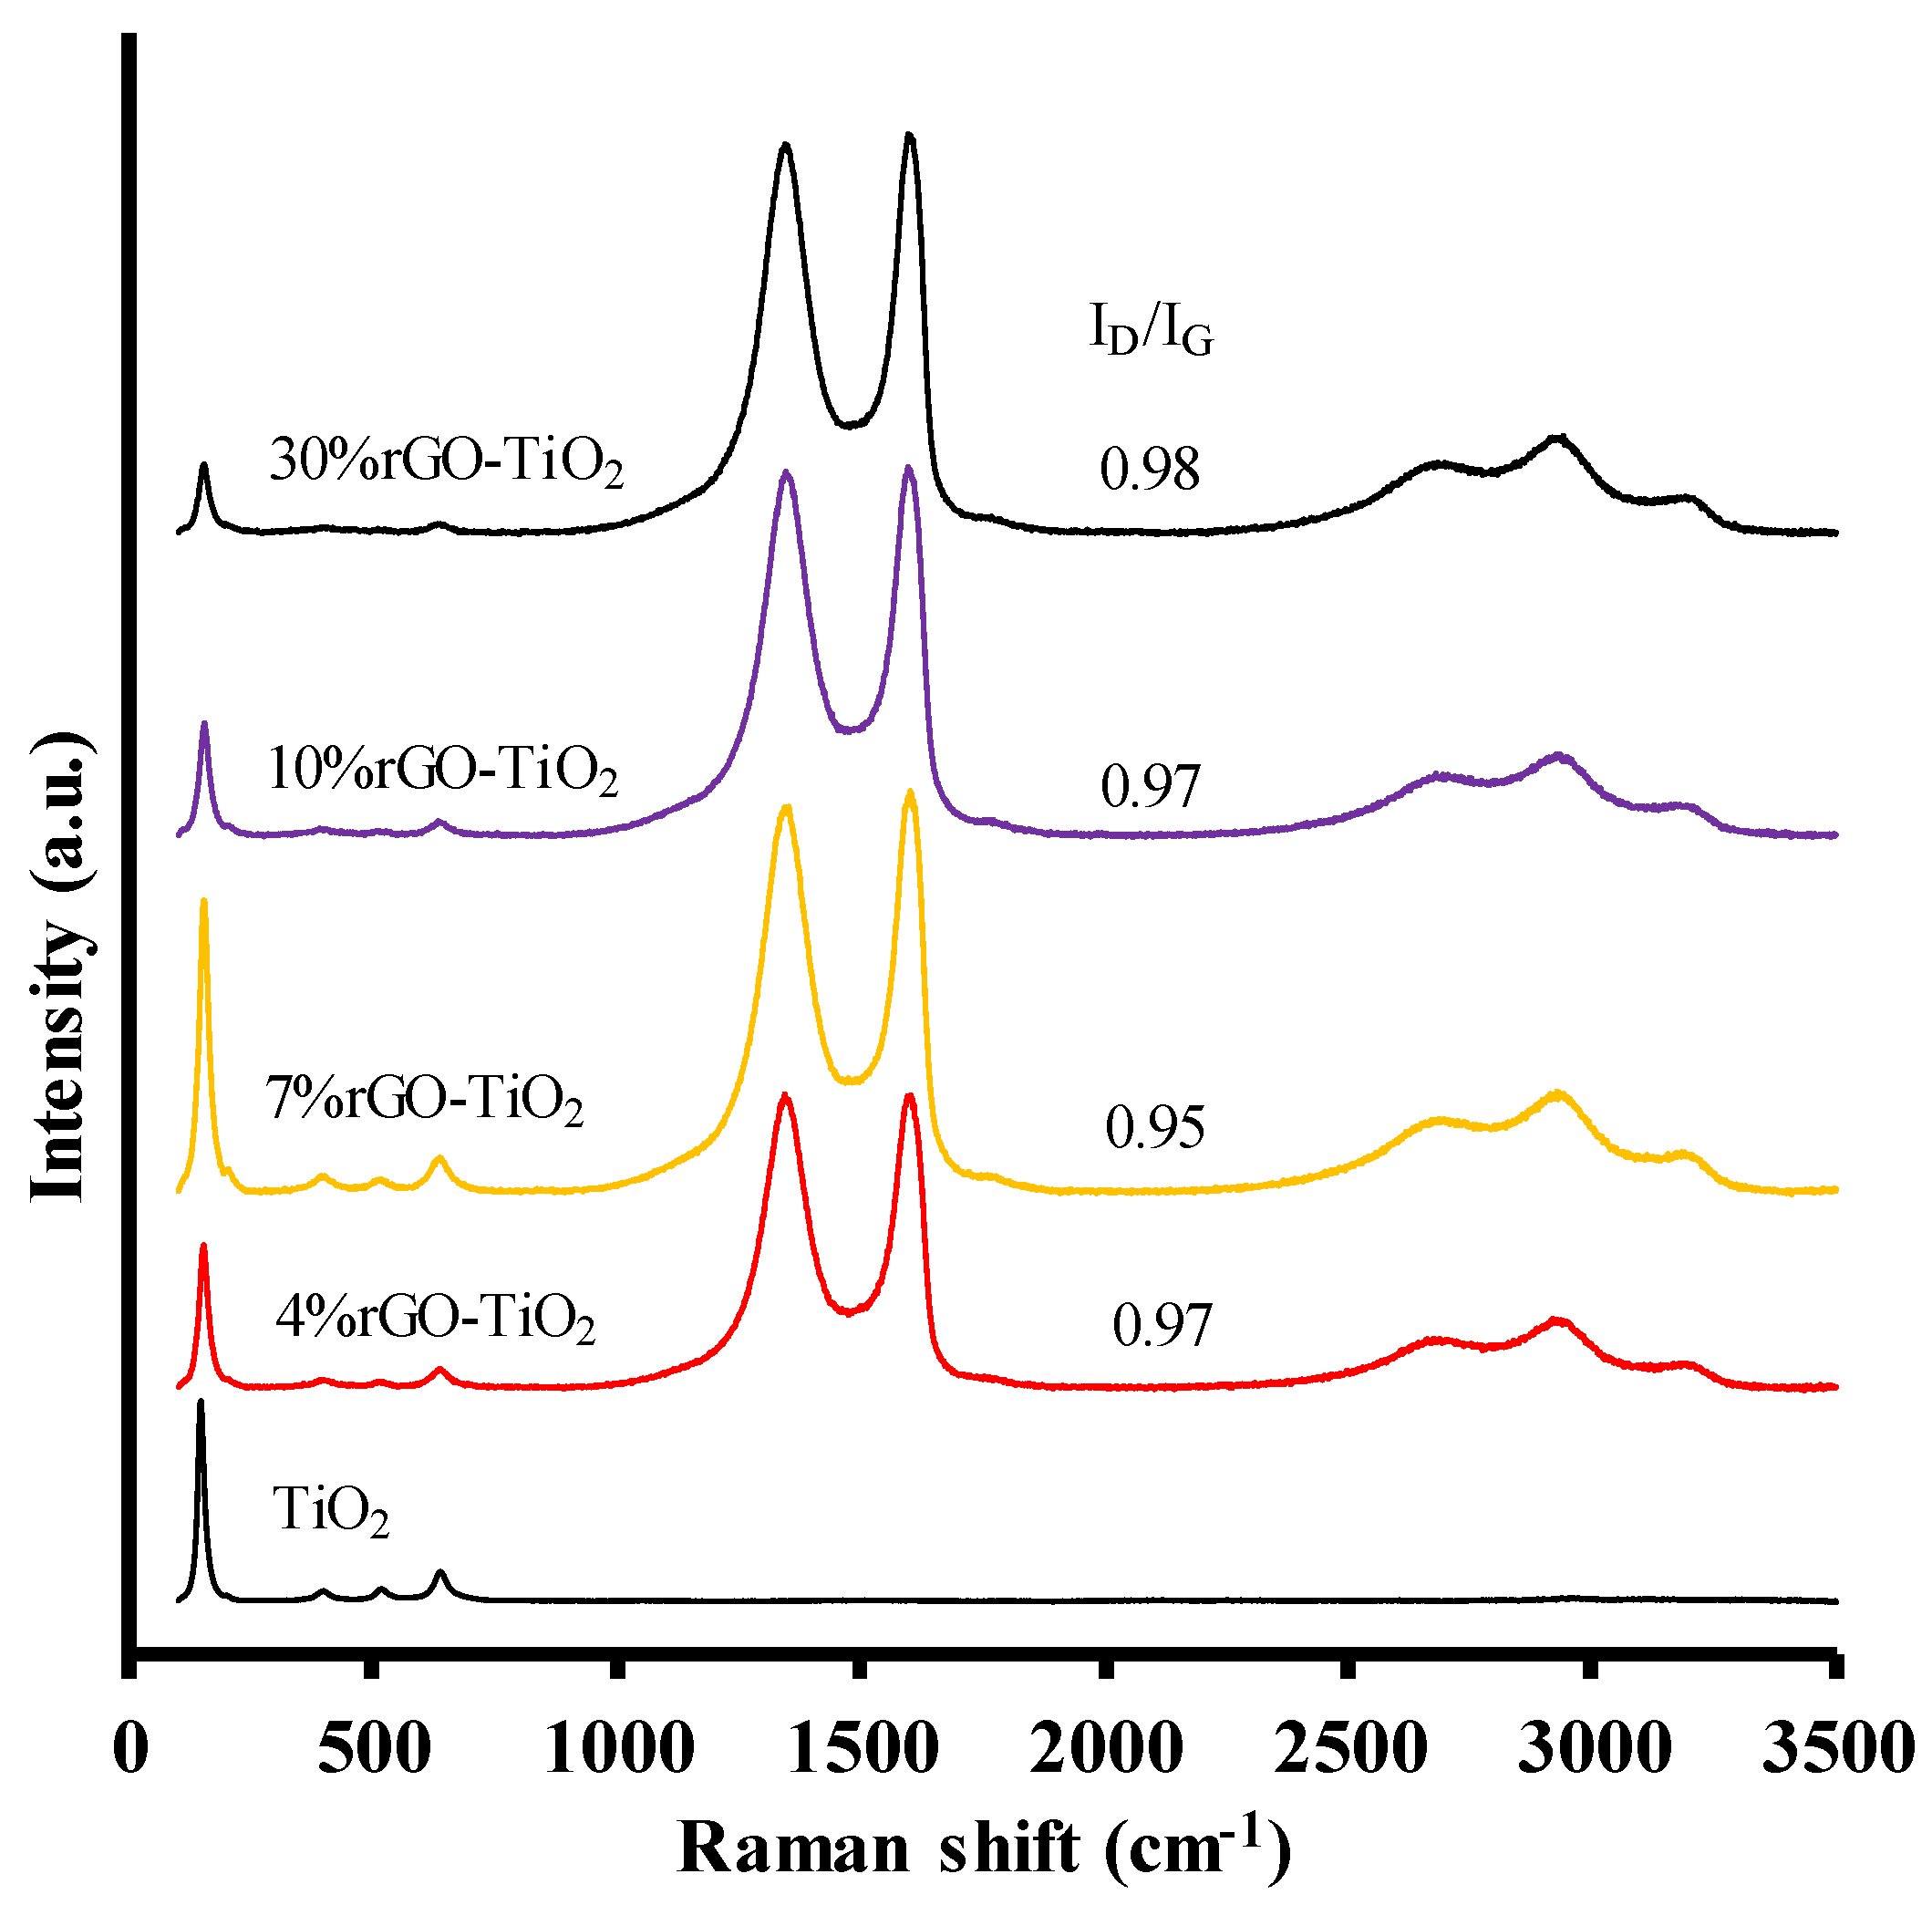
2.5. Analysis of Raman Spectroscopy

Raman spectroscopy is a powerful and non-destructive technique for characterizing the electronic and structural properties of carbon materials. In graphitic materials, the G band, at ~1575 cm−1, represents the perfect graphitic structure of carbon atom bonds with sp2 hybridization and is assigned to E2g-symmetry phonons of carbon atoms with sp2 hybridization [58]. The D band, at 1354 cm−1, is assigned to the K point of A1g-symmetry phonons and attributed to the presence of defects or disordered carbon. The G’ or 2D band, at 2700 cm−1, is assigned to the first overtone of band D. This band is not caused by defects, given that it is observed in defect-free graphitic crystals [61], but rather by other characteristics of graphitic materials. The material is highly crystalline when this band is well defined and narrow. The presence of this well-defined sign further indicates the degree of graphitization of the material. Its loss of intensity and widening are associated with increased structural disorder [61].
Figure 6 and Table 4 exhibit the Raman spectra of graphite, GO, and rGO, and the parameters obtained from their analysis. The Raman spectrum of graphite shows a highly ordered structure (high crystallinity), with well-defined peaks at 1354 cm−1 (D), 1582 cm−1 (G), and 2714 cm−1 (2D), indicating a stacked lamina structure.
After oxidation treatment, the Raman spectrum of graphite evidence structure modification, observing bands at 1359 cm−1 (D), 1600 cm−1 (G), 2715 cm−1 (2D), 2942 cm−1 (D+D’), and 3156 cm−1 (D’). The widths of D and G peaks are substantially greater than in the original graphite, indicating a lower signal and therefore lower crystallinity. In the Raman spectrum of GO, the G band is wider and shifted to higher frequencies in comparison to graphite (1582 cm−1), while a substantial increase in the D band is observed. These changes in the width and intensity of D and G peaks indicate an increase in the disorder of the graphitic sheets that form the original material. This disorder derives from the creation of defects through the incorporation of oxygenated functional groups in the basal layer or through a larger increase in the proportion of oxygenated margins [62]. The increase in the D band can be produced by: (i) an increase in the amount of disordered carbon atoms in GO, corresponding to sp3 domains; or (ii) a significant reduction in the size of sp2 domains in the layer through ultrasonic oxidation and exfoliation. This suggests the coexistence of sp2 and sp3 hybridization; i.e., GO contains crystalline and amorphous forms of carbon [63].
The presence of the D peak is mainly due to a chemical functionalization that affects numerous sp3 carbon atoms in GOs, but it is attributable to defects in carbon structures in rGOs and varies according to the density of defects and the distance between them. The removal of surface functional groups by the reduction process produces vacancies and the reorganization of atoms in the carbon structure (rings with five or seven members), among other defects.
The shift of the G peak to lower frequencies when passing from GO to rGO is due to the partial elimination of oxygenated groups. Results from GO and rGO samples indicate that oxidation was effective and that oxygenated groups have not been completely eliminated in the rGO sample.
The ratio of D band to G band intensities (ID/IG) gives the proportion of amorphous and disordered carbon (sp3) with respect to graphitic carbon (sp2), allowing comparison of the structural order among the samples. In this way, the ID/IG ratio is 0.13 for graphite, 0.79 for GO, and 0.89 for rGO. The higher ID/IG in GO results from the greater disorder of this structure, due to oxygenated functional groups produced during oxygenation of the graphite. The oxidation process endows the graphite layers and their fragmentation with a certain amorphous character. The ends of the fragments act as defects, thereby increasing the intensity of band D. These results are in agreement with previous reports [38,45]. The higher ID/IG ratio for rGO than for GO suggests a reduction in the mean size of sp2 domains after the reduction of exfoliated GO due to the elimination of oxygenated functional groups by the hydrothermal treatment. It is reasonable to consider that GO reduction causes fragmentation throughout reactive sites, producing new graphitic domains as well as large amounts of edges that act as defects, increasing the D peak [45].
The ratio between intensities is also frequently used to determine the crystal size parallel to basal planes, La, using the equation of Tuinstra and Koenig (Equation (2)) [63,64,65]:
L a ( n m ) = ( 2.4 × 10 10 ) λ l 4 ( I D I G ) 1
where λl is the laser excitation wavelength (514.5 nm).
La values are 134 nm for graphite, 21.2 nm for GO, and 18.8 nm for rGO (Table 4), within the range described in the literature [66]. A higher La value indicates an increased sp2 domain in the carbonous network.
Figure 7 and Table 5 display the Raman spectra of the synthetized composites and the parameters obtained from them. Differences are observed between rGO composites and GO (Table 4), including a systematic variation in the position/intensity of D and 2D bands, indicating its reduction. In general, their position shifts to lower wavelengths (13.7 for D band and 35.3 cm−1 for 2D band) and their intensity increases. These variations in D and 2D bands in the composites can largely be attributed to the anchoring of TiO2 nanoparticles, which act as defects on the surface of rGO sheets and preserve their structural integrity after the deposition of TiO2. Therefore, the presence of these two peaks suggests that the structure of rGO persists within the composite [48]. In addition, the ID/IG ratios in the composites (0.95–0.98) are higher than in the rGO sample (0.89), suggesting a structural disorder related to a strong interaction between TiO2 nanoparticles and rGO sheets after reduction during hydrothermal treatment [48]. It can therefore be concluded that the composites are formed by graphene nanosheets coated with TiO2 nanoparticles.
The increase in ID/IG ratio intensities from GO, rGO, to rGO-TiO2 indicates a decrease in the mean number of sp2 domains formed during the hydrothermal reaction. The increased ID/IG ratio in composite spectra also confirms the formation of rGO-TiO2 composites by the hydrothermal treatment [39,67,68]. The ID/IG ratio is 20–24% higher in the composites than in GO, and the smallest increase is in the 7% rGO-TiO2 sample.
TiO2 nanoparticles were identified in all composites by the appearance of bands at lower frequencies (100–700 cm−1). Raman active modes, A1g+2B1g+3Eg, are detected at 146 cm−1 (Eg), 197 cm−1 (Eg), 397 cm−1 (B1g), 517 cm−1 (A1g), and 638 cm−1 (Eg), indicating the presence of the anatase phase in all samples [50,69]. No peaks are observed corresponding to the rutile-to-brookite phase, in agreement with the XRD results [48].
The peaks at 144, 197, and 639 cm−1 correspond to the Eg mode of the symmetric valence vibration of the O-Ti bond; while the signal at 396 cm−1 corresponds to the B1g mode of the symmetric bending vibration O–Ti–O and the signal at 517 cm−1 to the A1g mode of the asymmetric vibration of the O–Ti bond [70].
In the composites, the band at 146 cm−1 shifts to a higher wavelength, from 146 to 153 cm−1, and widens (FHWM rises from 15 to 25 cm−1) through the interaction of TiO2 metallic ions with GO sheets [50,71] and can be attributed to the formation of Ti–O–C on the surface of composites.
Figure S4 and Table S2 exhibit the Raman spectra of rGO-P25 composites and the parameters obtained. The presence of bands at frequencies below 700 cm−1 indicates the presence of P25 nanoparticles. The ID/IG ratio is similar to that for rGO, and La values are higher than in rGO-TiO2 composites (Table 5).

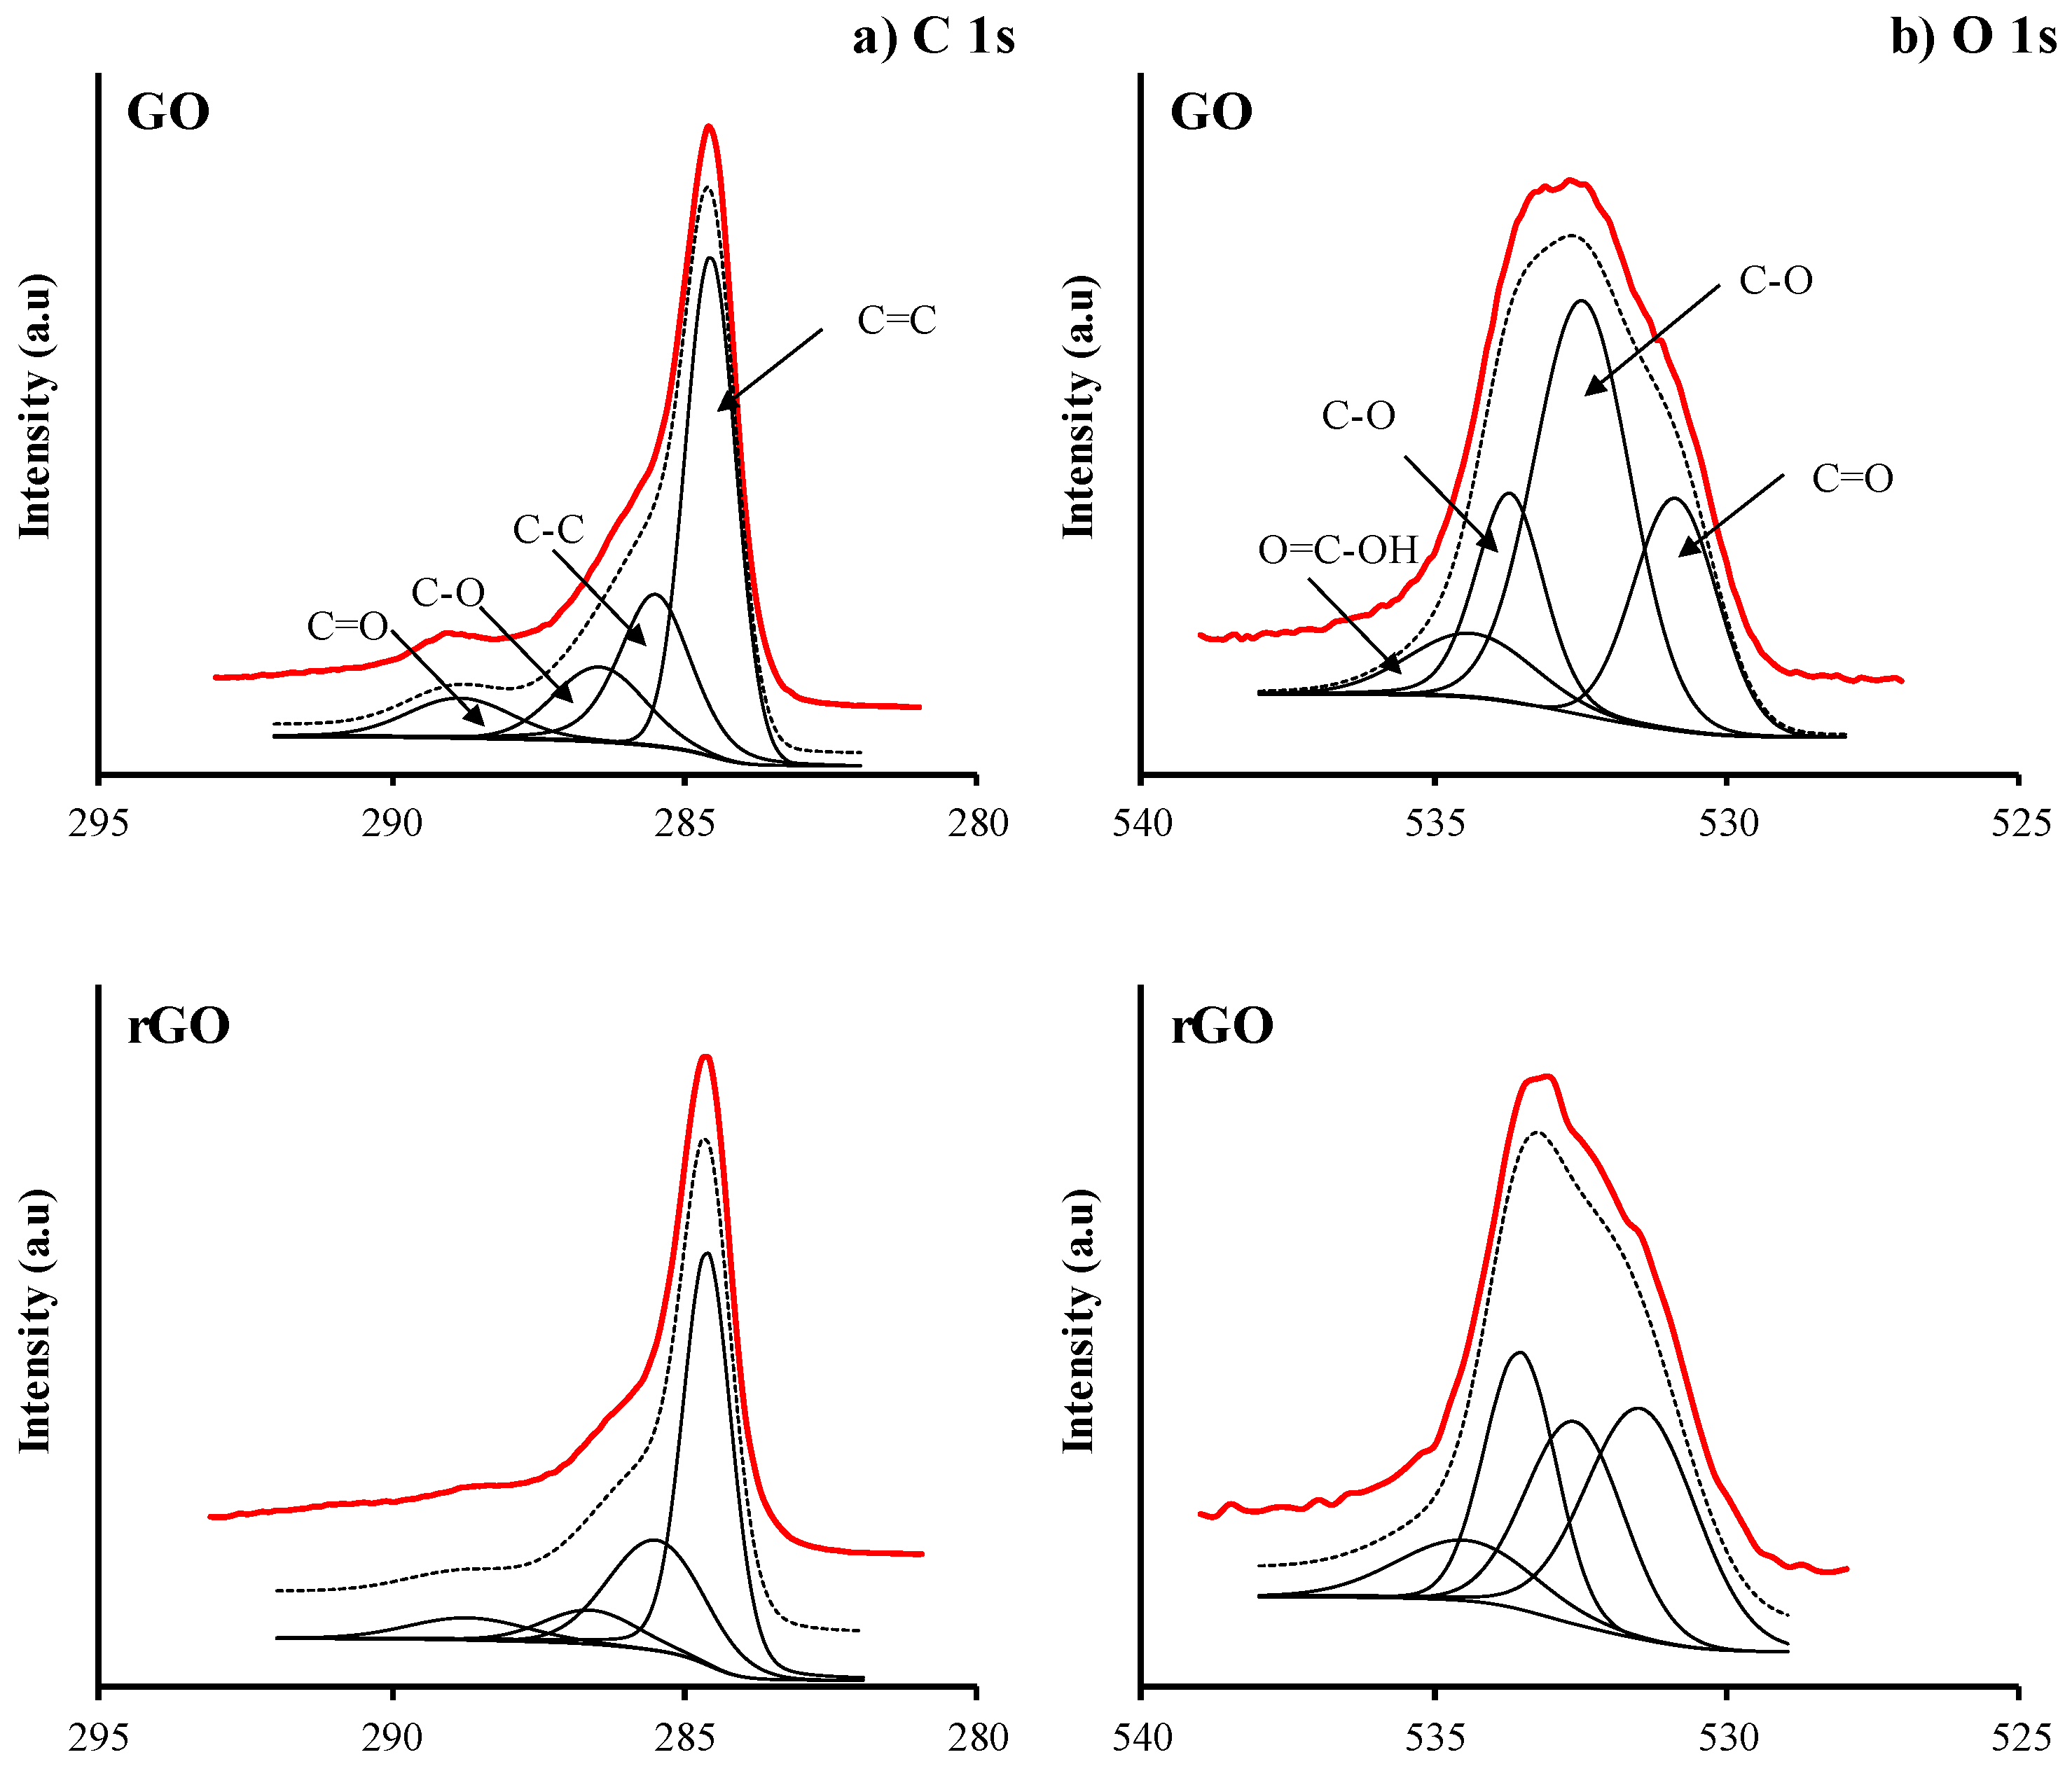
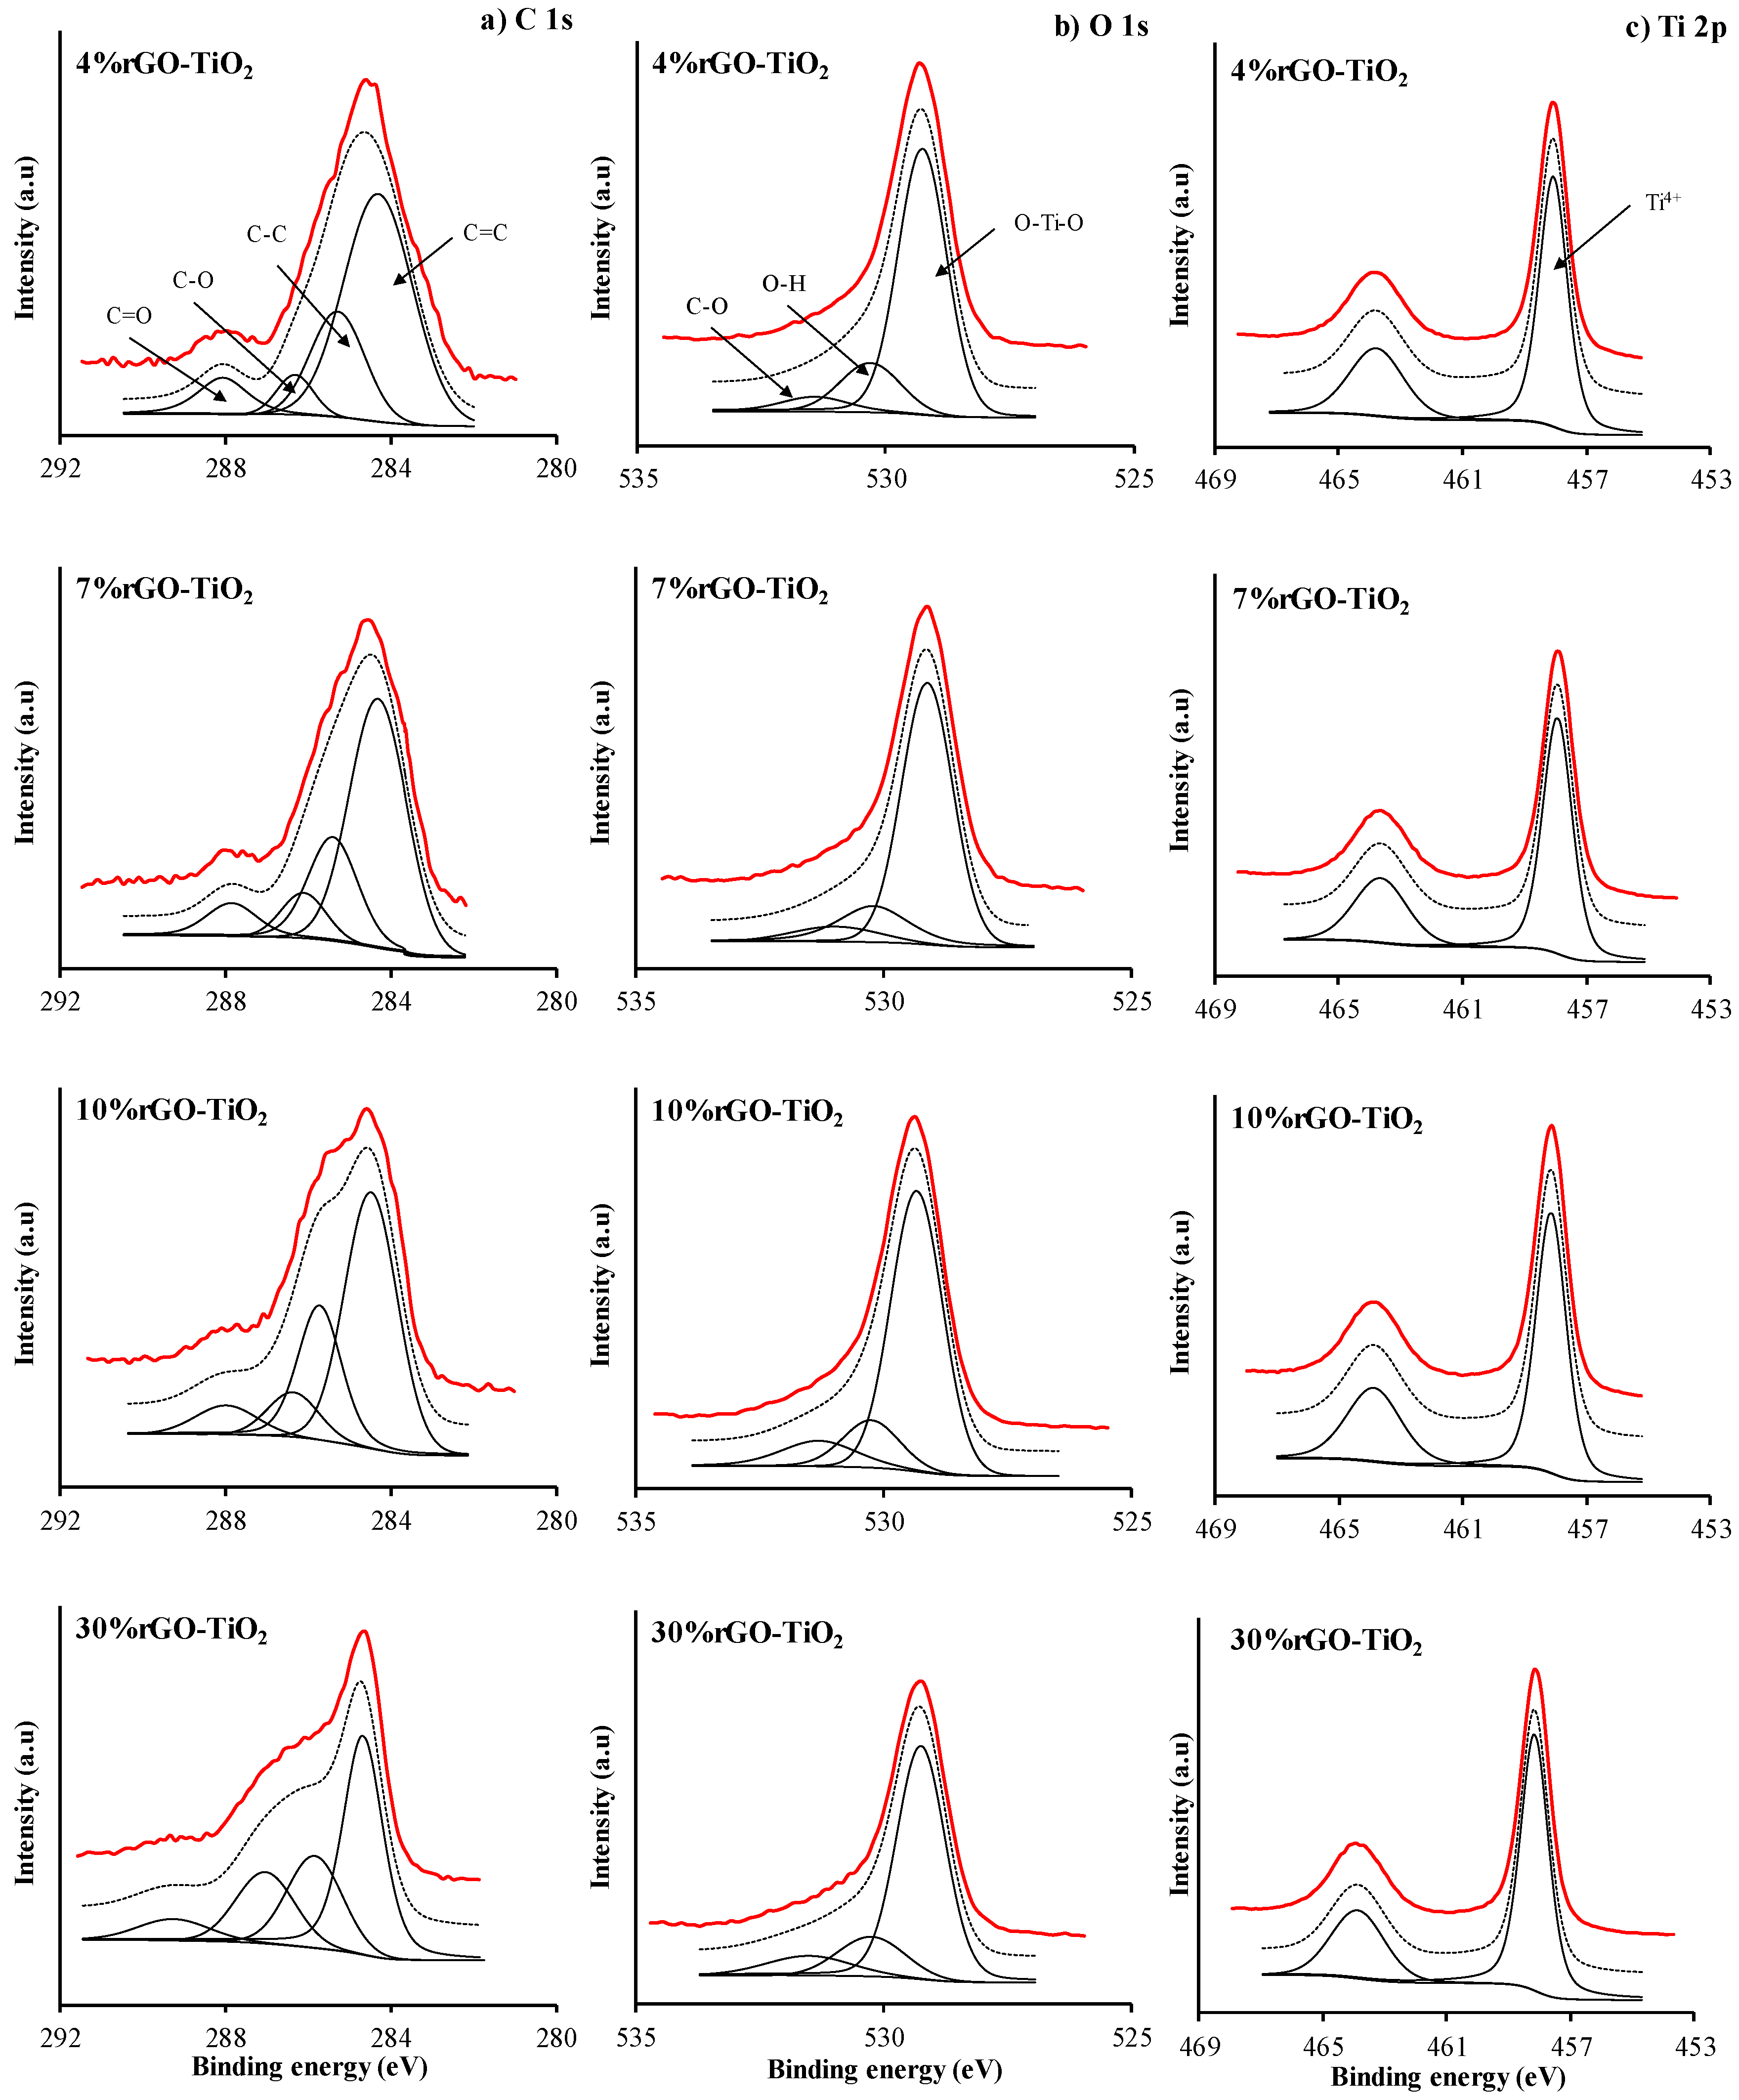
2.6. X-ray Photoelectron Spectroscopy Analysis

GO-based samples were characterized by XPS to identify functional groups. Figure 8 depicts the XPS spectra of C 1s and O 1s regions of GO and rGO samples. Table 6 lists the bond energies (BE) values, C/O ratios, and percentages of the corresponding deconvoluted peaks of C and O.
The C 1s spectrum of GO deconvolutes into four peaks corresponding to four types of carbon bond. BE at 284.6 eV is attributed to C=C sp2 bonds and BE at 285.5 eV to C–C sp3 bonds. BE at 286.5 is assigned to C–O bonds, including epoxy and hydroxyl groups, and the peak at 288.5 eV is attributed to C=O, corresponding to carbonyl and carboxyl groups [72]. The oxygen content of the GO sample is 23.3%, with a C/O ratio of 3.3, similar to previously reported values [72,73]. The main oxygenated species correspond to epoxy and hydroxyl groups in basal layers (13.8%) versus carbonyl and carboxyl groups on the edges (8.1%), as observed in Table 6.
The spectrum of O 1s of GO deconvolutes into four peaks at BEs of 531.2, 532.5, 533.7, and 534.4 eV, corresponding to C=O bonds in carbonyl or carboxyl groups, C–Oa bonds in alcohol, ether and epoxy groups, C–Ob bonds in carboxyl and ester groups, and peroxyacid or peroxyester groups, respectively.
Oxygenated species decrease in the rGO sample, as observed in the species percentages in C 1s (Table 6). The percentage of hydroxyl and epoxy groups (286.6 eV) is 42% lower than in the GO sample. C=O groups at 288.4 eV is also decreased, but by a lower percentage. These findings indicate that oxygenated groups on the edges are less easily removed during reduction than are those on basal layers. Reduction increases the percentage of C=C bonds (284.6 eV), indicating the restoration of the graphitic structure after the reduction process [72,74].
This greater decrease at 532.6 eV, C–Oa, in hydroxyl and epoxy groups versus carbonyl and carboxyl groups is also observed in the XPS spectra of O 1s (Figure 8). Removal of oxygenated groups by the reduction process is also observed in the comparison of atomic percentages of O between GO and rGO samples, which are 23.3% and 13.3%, respectively.
Figure 9 depicts the XPS spectra of C 1s, O 1s, and Ti 2p regions of rGO/TiO2 composite materials and Table 7 exhibits the bond, assignation, and quantification energies of the peaks of C 1s, O 1s, and Ti 2p regions in these samples.
Figure S5 and Table S3 of Supplementary Material show the results obtained for rGO/P25 composite materials.
The Ti 2p spectrum of composite materials shows two centered peaks at 458.1 eV, assigned to Ti 2p1/2, and 463.8 eV, assigned to Ti 2p3/2, with a separation energy of 5.7 eV, consistent with the BE values of Ti4+ in pure anatase [75]. The C 1s spectrum deconvolutes into four peaks, corresponding to C=C, C-C, C-O, and C=O bonds and BEs of 284.4, 285.4, 286.3, and 288.0 eV, respectively. Comparison between the composite materials and GO (Table 6) reveals an increased percentage of C=C and a reduced percentage of oxygenated groups. This may be due to the nucleation and growth of TiO2 nanoparticles in GO sheets, where C–O groups are consumed and partially reduced to C=C [76].
The partial reduction of GO is confirmed by calculating the ratio of peak areas for oxidized carbon to peak areas for completely reduced carbon atoms, AC-O/AC-C. Thus, the AC-O/AC-C ratio is lower in all rGO/TiO2 composite materials than in the original GO, being 0.28 for the GO sample, 0.17 for rGO, 0.18 for 4% rGO/TiO2, 0.19 for 7% rGO/TiO2, 0.21 for 10% rGO/TiO2, and 0.23 for 30% rGO/TiO2 (Table 7).
The XPS spectrum of deconvoluted O 1s shows three peaks at BEs of 529.3, 530.3, and 531.3 eV, corresponding to O2− in the TiO2 network, OH adsorbed on the surface of TiO2, and C–O groups, respectively [76].
The Ti/C ratio is 0.75 for catalyst 4% rGO-TiO2, 0.77 for 7% rGO-TiO2, 0.72 for 10% rGO-TiO2, and 0.41 for 30% rGO-TiO2 (Table 7). The Ti/C ratio is slightly higher in 7% rGO/TiO2 than in the other samples, suggesting that TiO2 nanoparticles permit superior dispersion of rGO sheets in the TiO2 matrix.

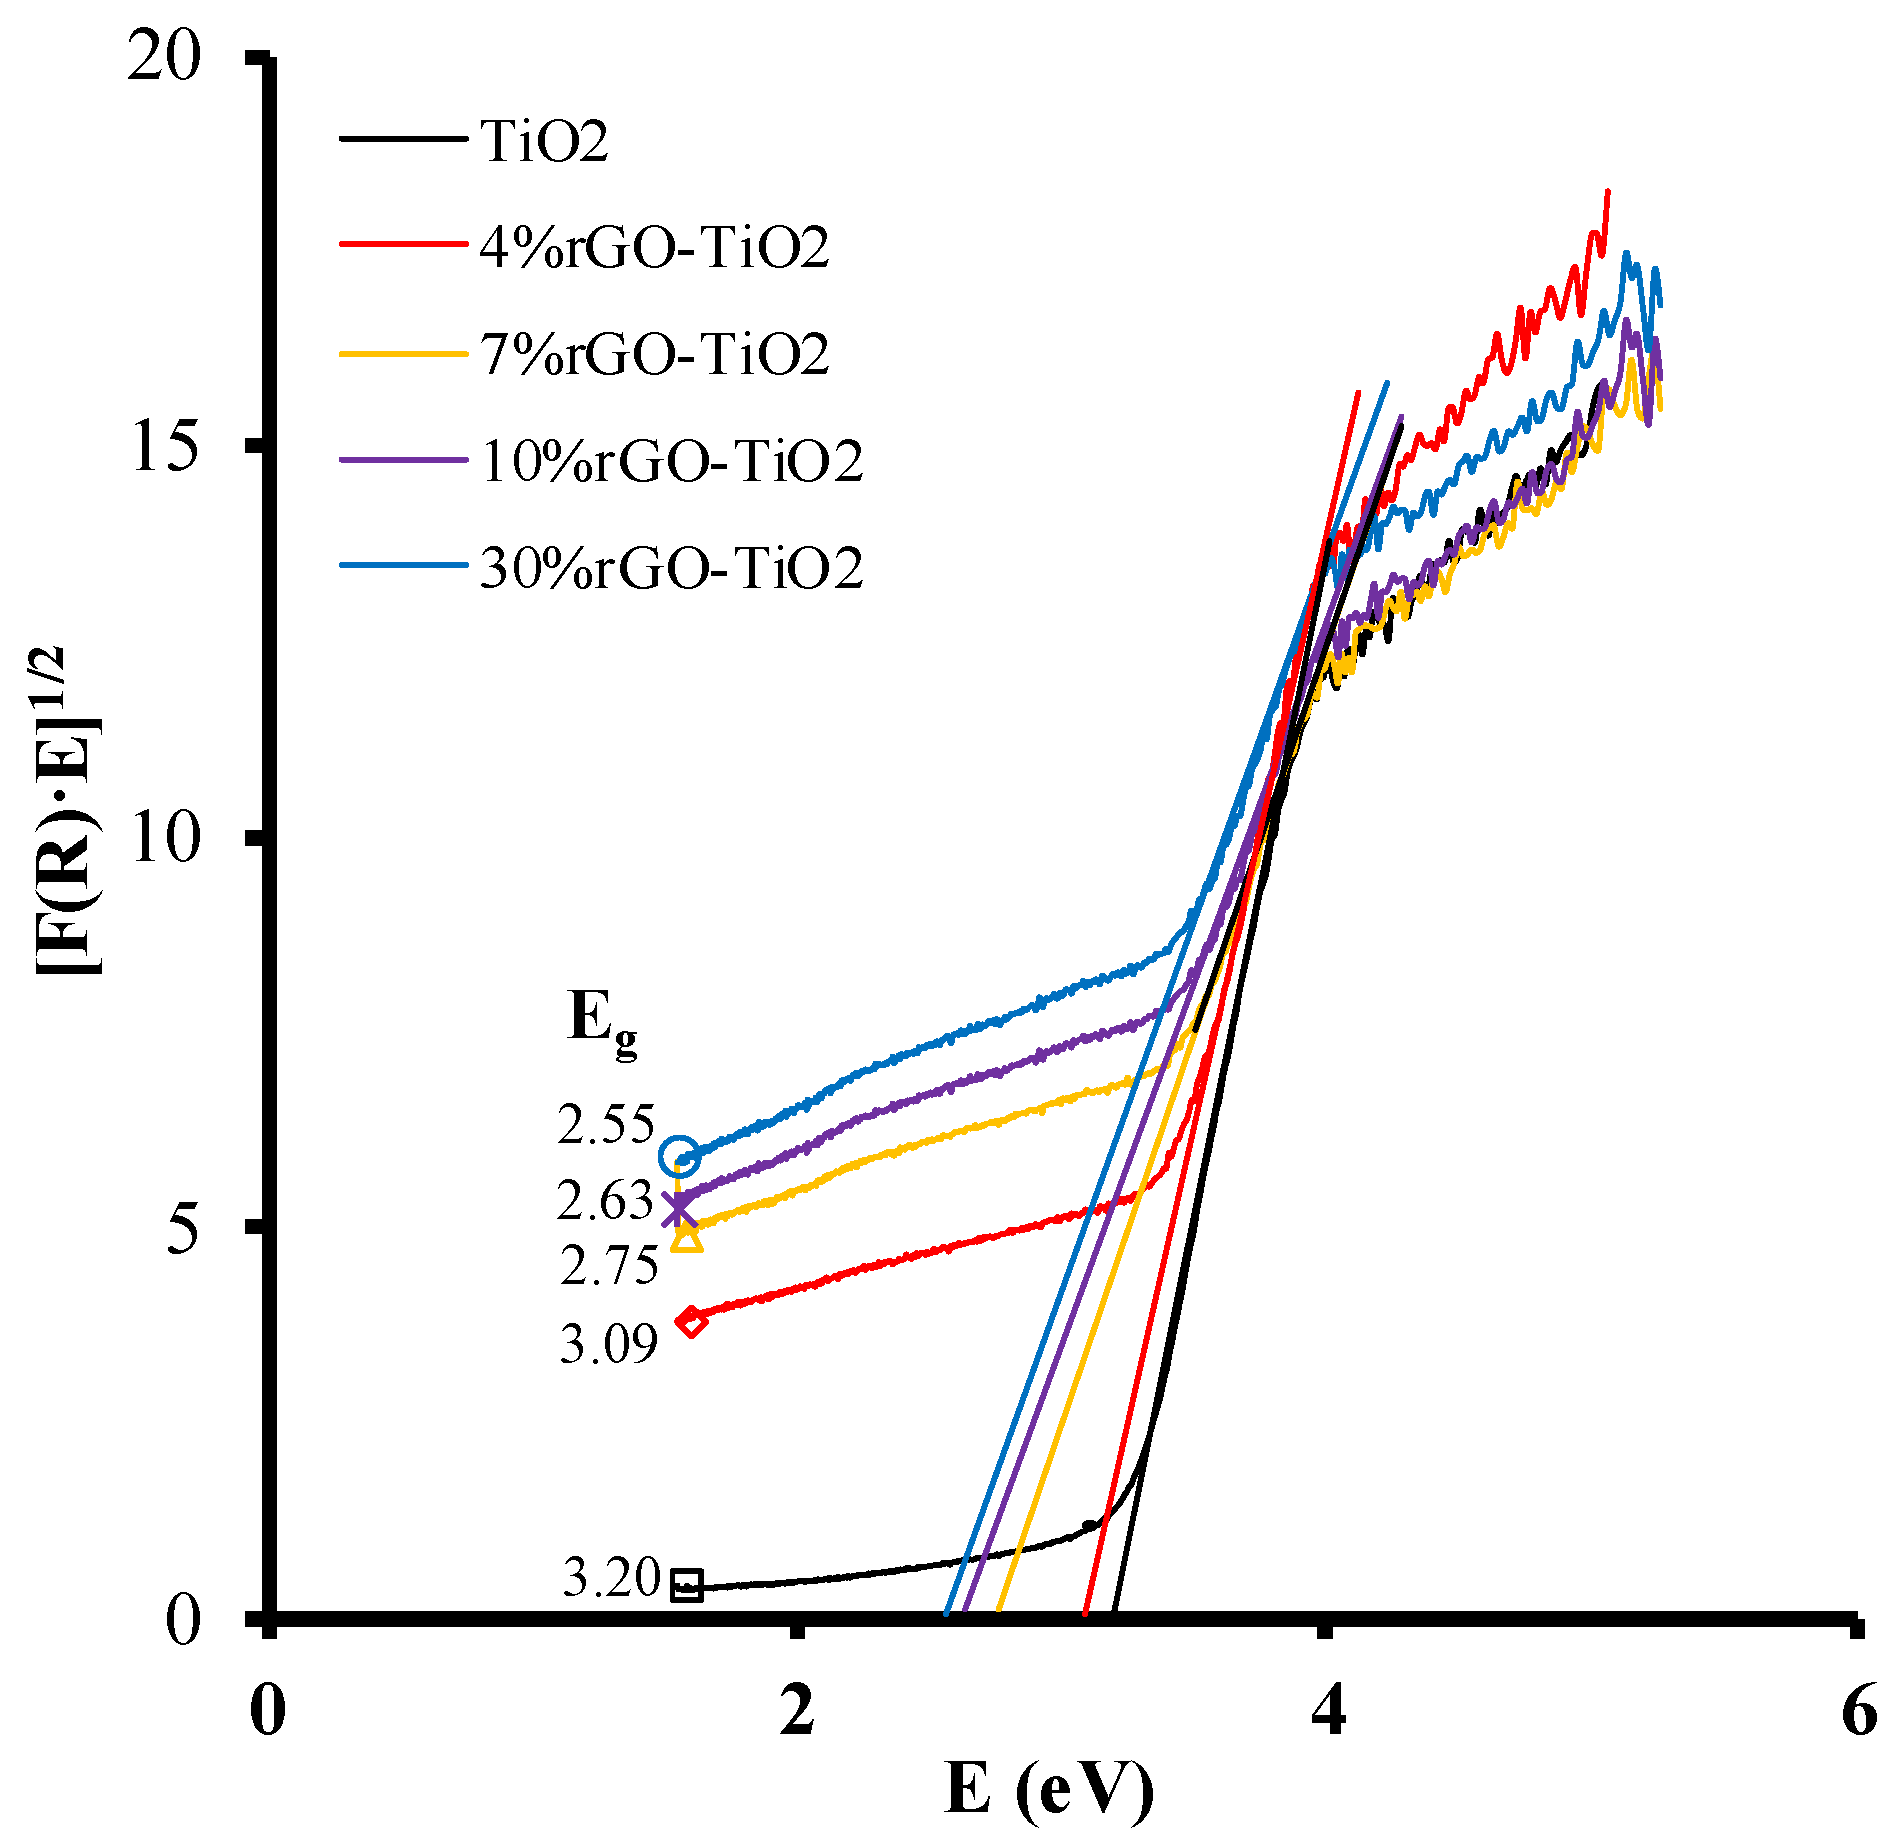
2.7. Diffuse Reflectance UV-Vis Spectroscopy Analysis

UV-Vis spectroscopy is an effective optical technique for characterizing the electronic structure of semiconductors. The electronic properties of the materials under study were analyzed by obtaining diffuse reflectance spectra (DRS), allowing calculation of the band gap energy (Eg) using Kubelka-Munk transformed function (Equation (3)) [77]:
( F ( R ) × h ν ) 1 / 2 = C ( h ν E g )
where n is the constant for the type of optical transition, with values of n = 2 for permitted indirect transitions, n = 3 for forbidden indirect transitions, n = 1/2 for permitted direct transitions, and n = 3/2 for forbidden direct transitions. The Eg value can be calculated from Equation (3), plotting (F(R) × )1/n against hν, considering n = 2 for permitted indirect transitions, as suggested by other authors [78]. Figure 10 plots the transformed Kubelka-Munk function against the energy of light. The band gap energy is 3.20 eV for TiO2, 3.09 eV for 4% rGO-TiO2, 2.75 eV for 7% rGO-TiO2, 2.63 eV for 10% rGO-TiO2, and 2.55 eV for 30% rGO-TiO2. These results demonstrate the influence of rGO on the optical characteristics of TiO2 and that an increase in percentage rGO narrows the band gap in composites. This phenomenon can be attributed to the formation of Ti–O–C bonds in the composites during hydrothermal treatment, similar to observations in other materials [37].

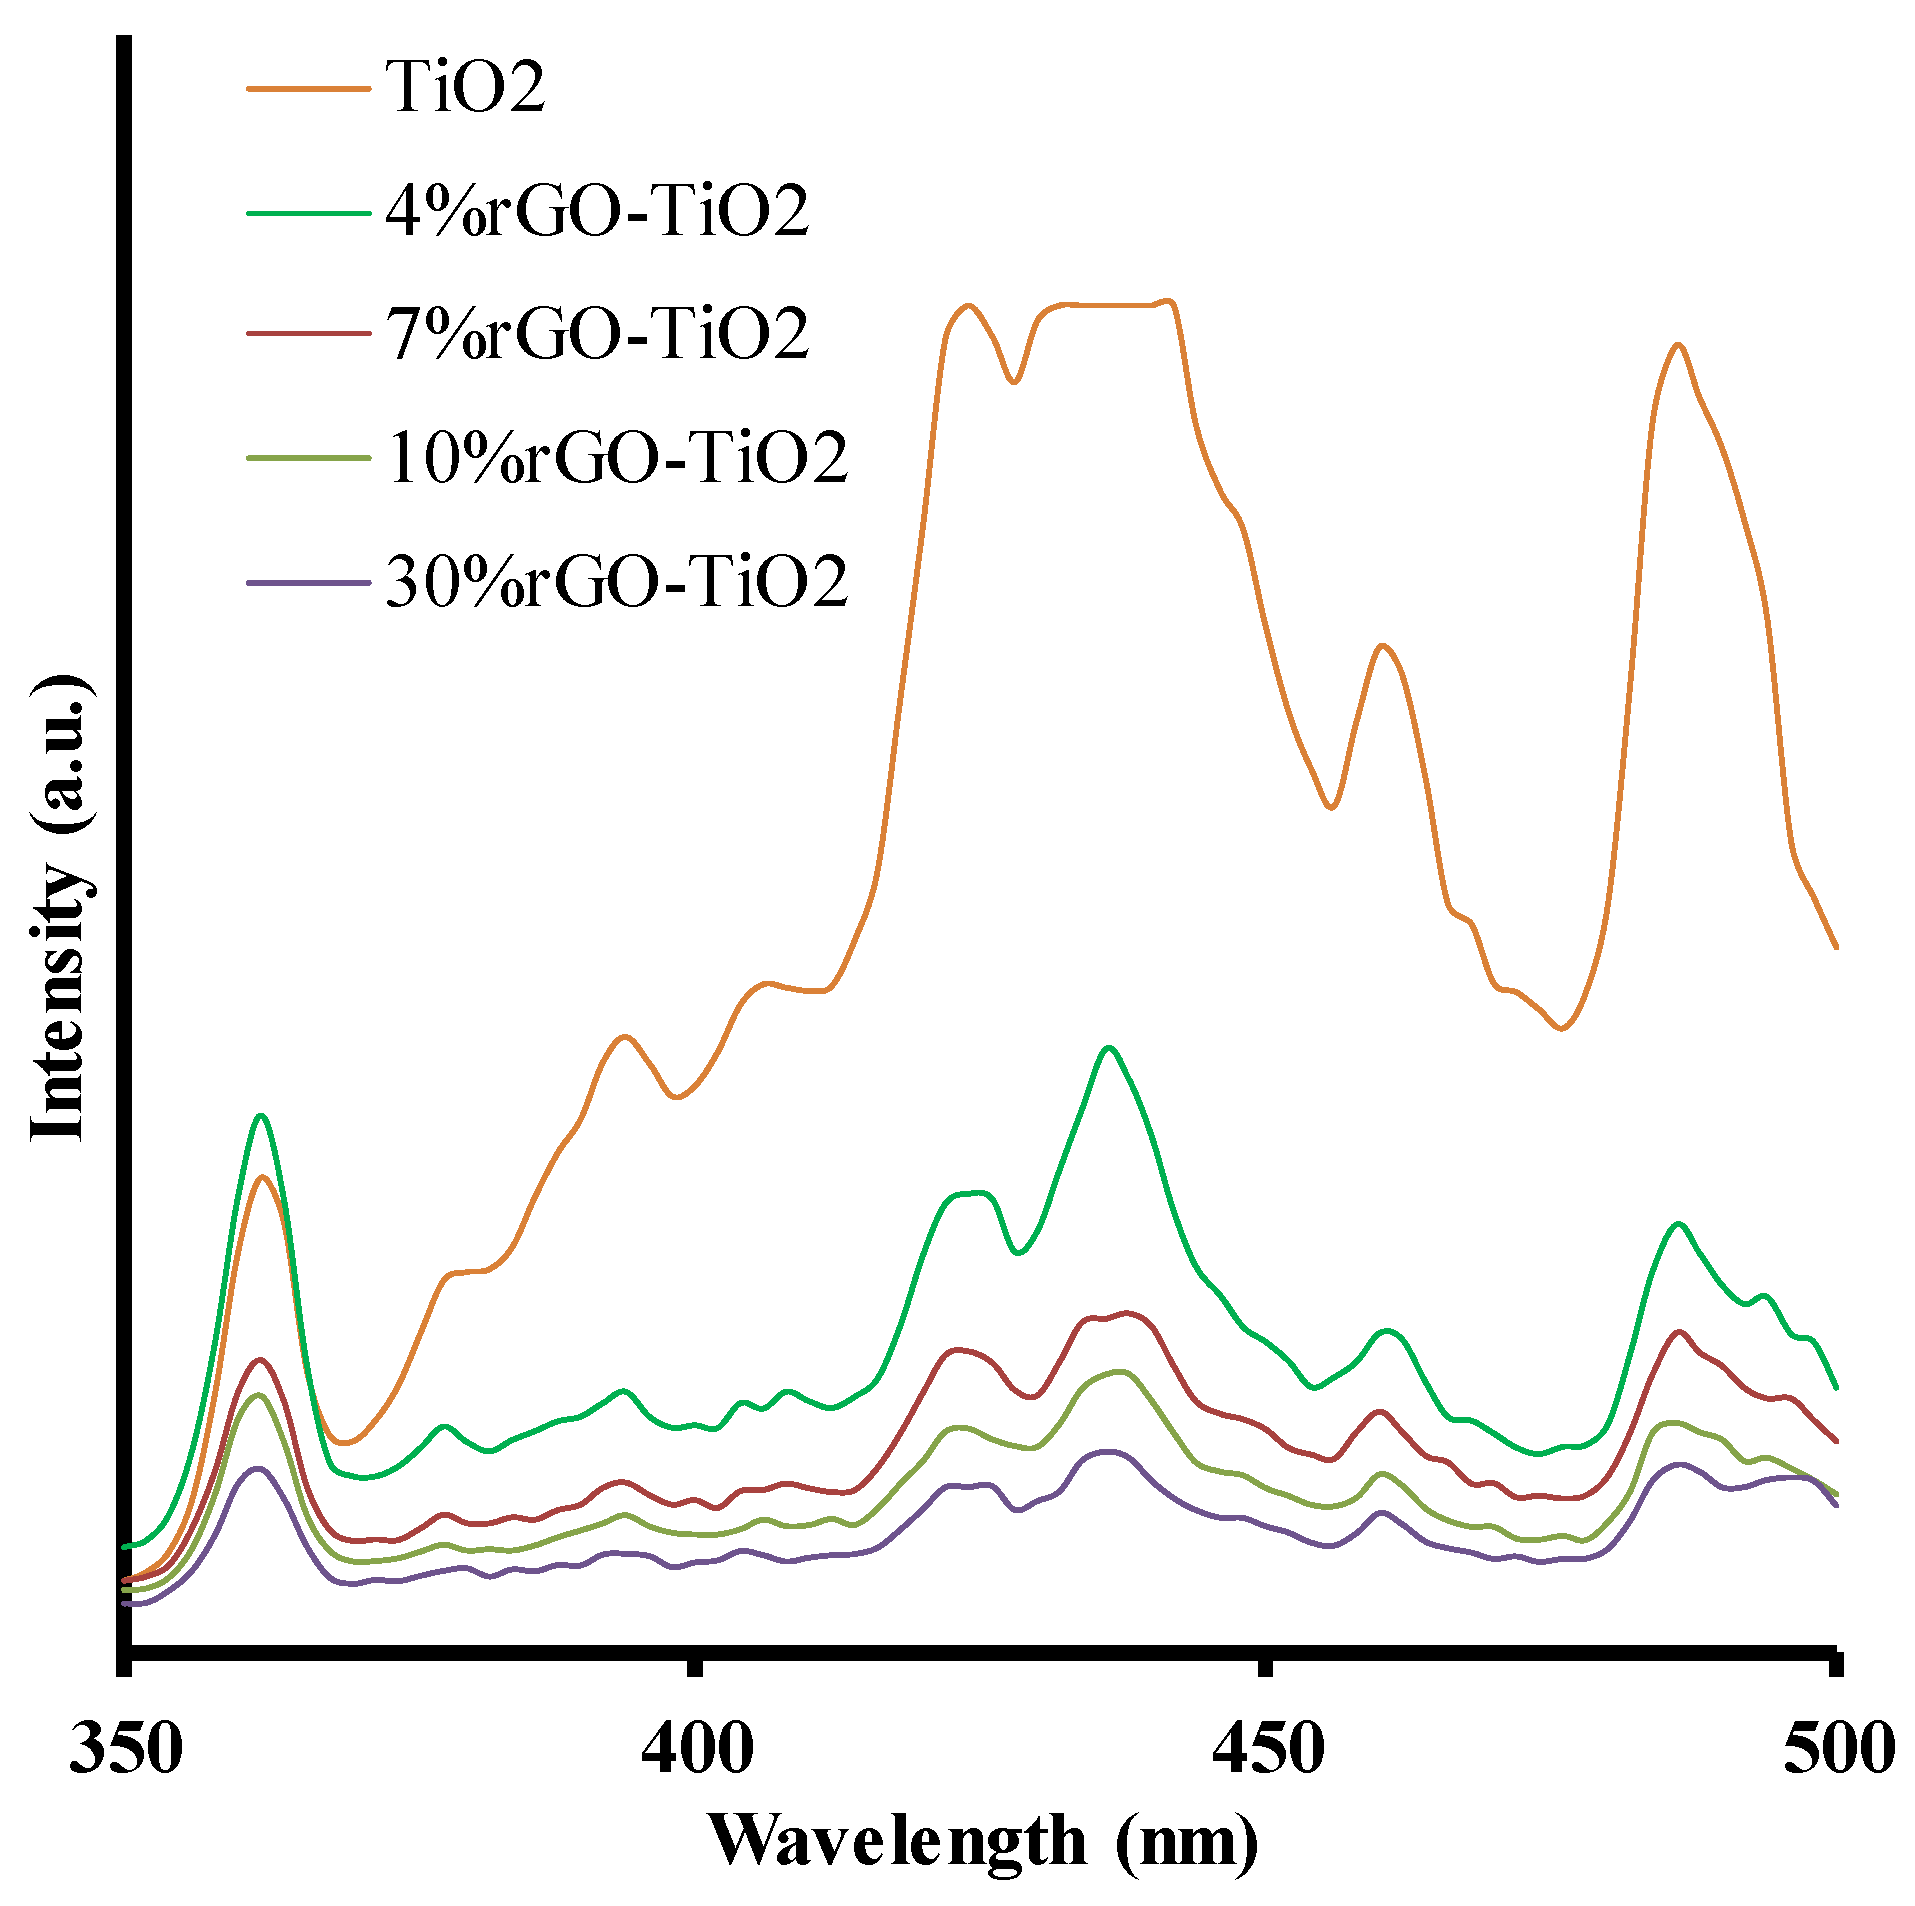
2.8. Photoluminescence Analysis

Photoluminescence is frequently used to examine the surface structure and excited status of semiconductors, as well as to analyze the recombination of their electron-hole pairs [21]. Figure 11 depicts the photoluminescence spectra of TiO2 and composite materials with different rGO percentages. The luminescence efficiency of the rGO-TiO2 composites is much lower than that of the bare TiO2, indicating the depressed recombination of the electron-hole pairs in the composites [21] due to electron transfer from excited TiO2 to rGO, hampering electron recombination [39,60]. The PL peak at 364 nm (Figure 11) is attributed to the band-to-band recombination. The band at 400–450 nm is attributed to the excitonic PL peaks trapped by surface states and defects, and the peak at 460 nm is induced by indirect recombination via oxygen defects [79].
Figure S6 in Supplementary Material shows the energy level diagram of TiO2 and rGO. The TiO2 conduction band is −4.2 eV and the valence band is −7.4 eV, while rGO has a conduction band of −4.4 eV. These levels allow photoinduced electrons to transfer from the TiO2 conduction band to rGO, which can efficiently separate photoinduced electrons and, as indicated above, prevent recombination of charge carriers in photocatalytic processes.

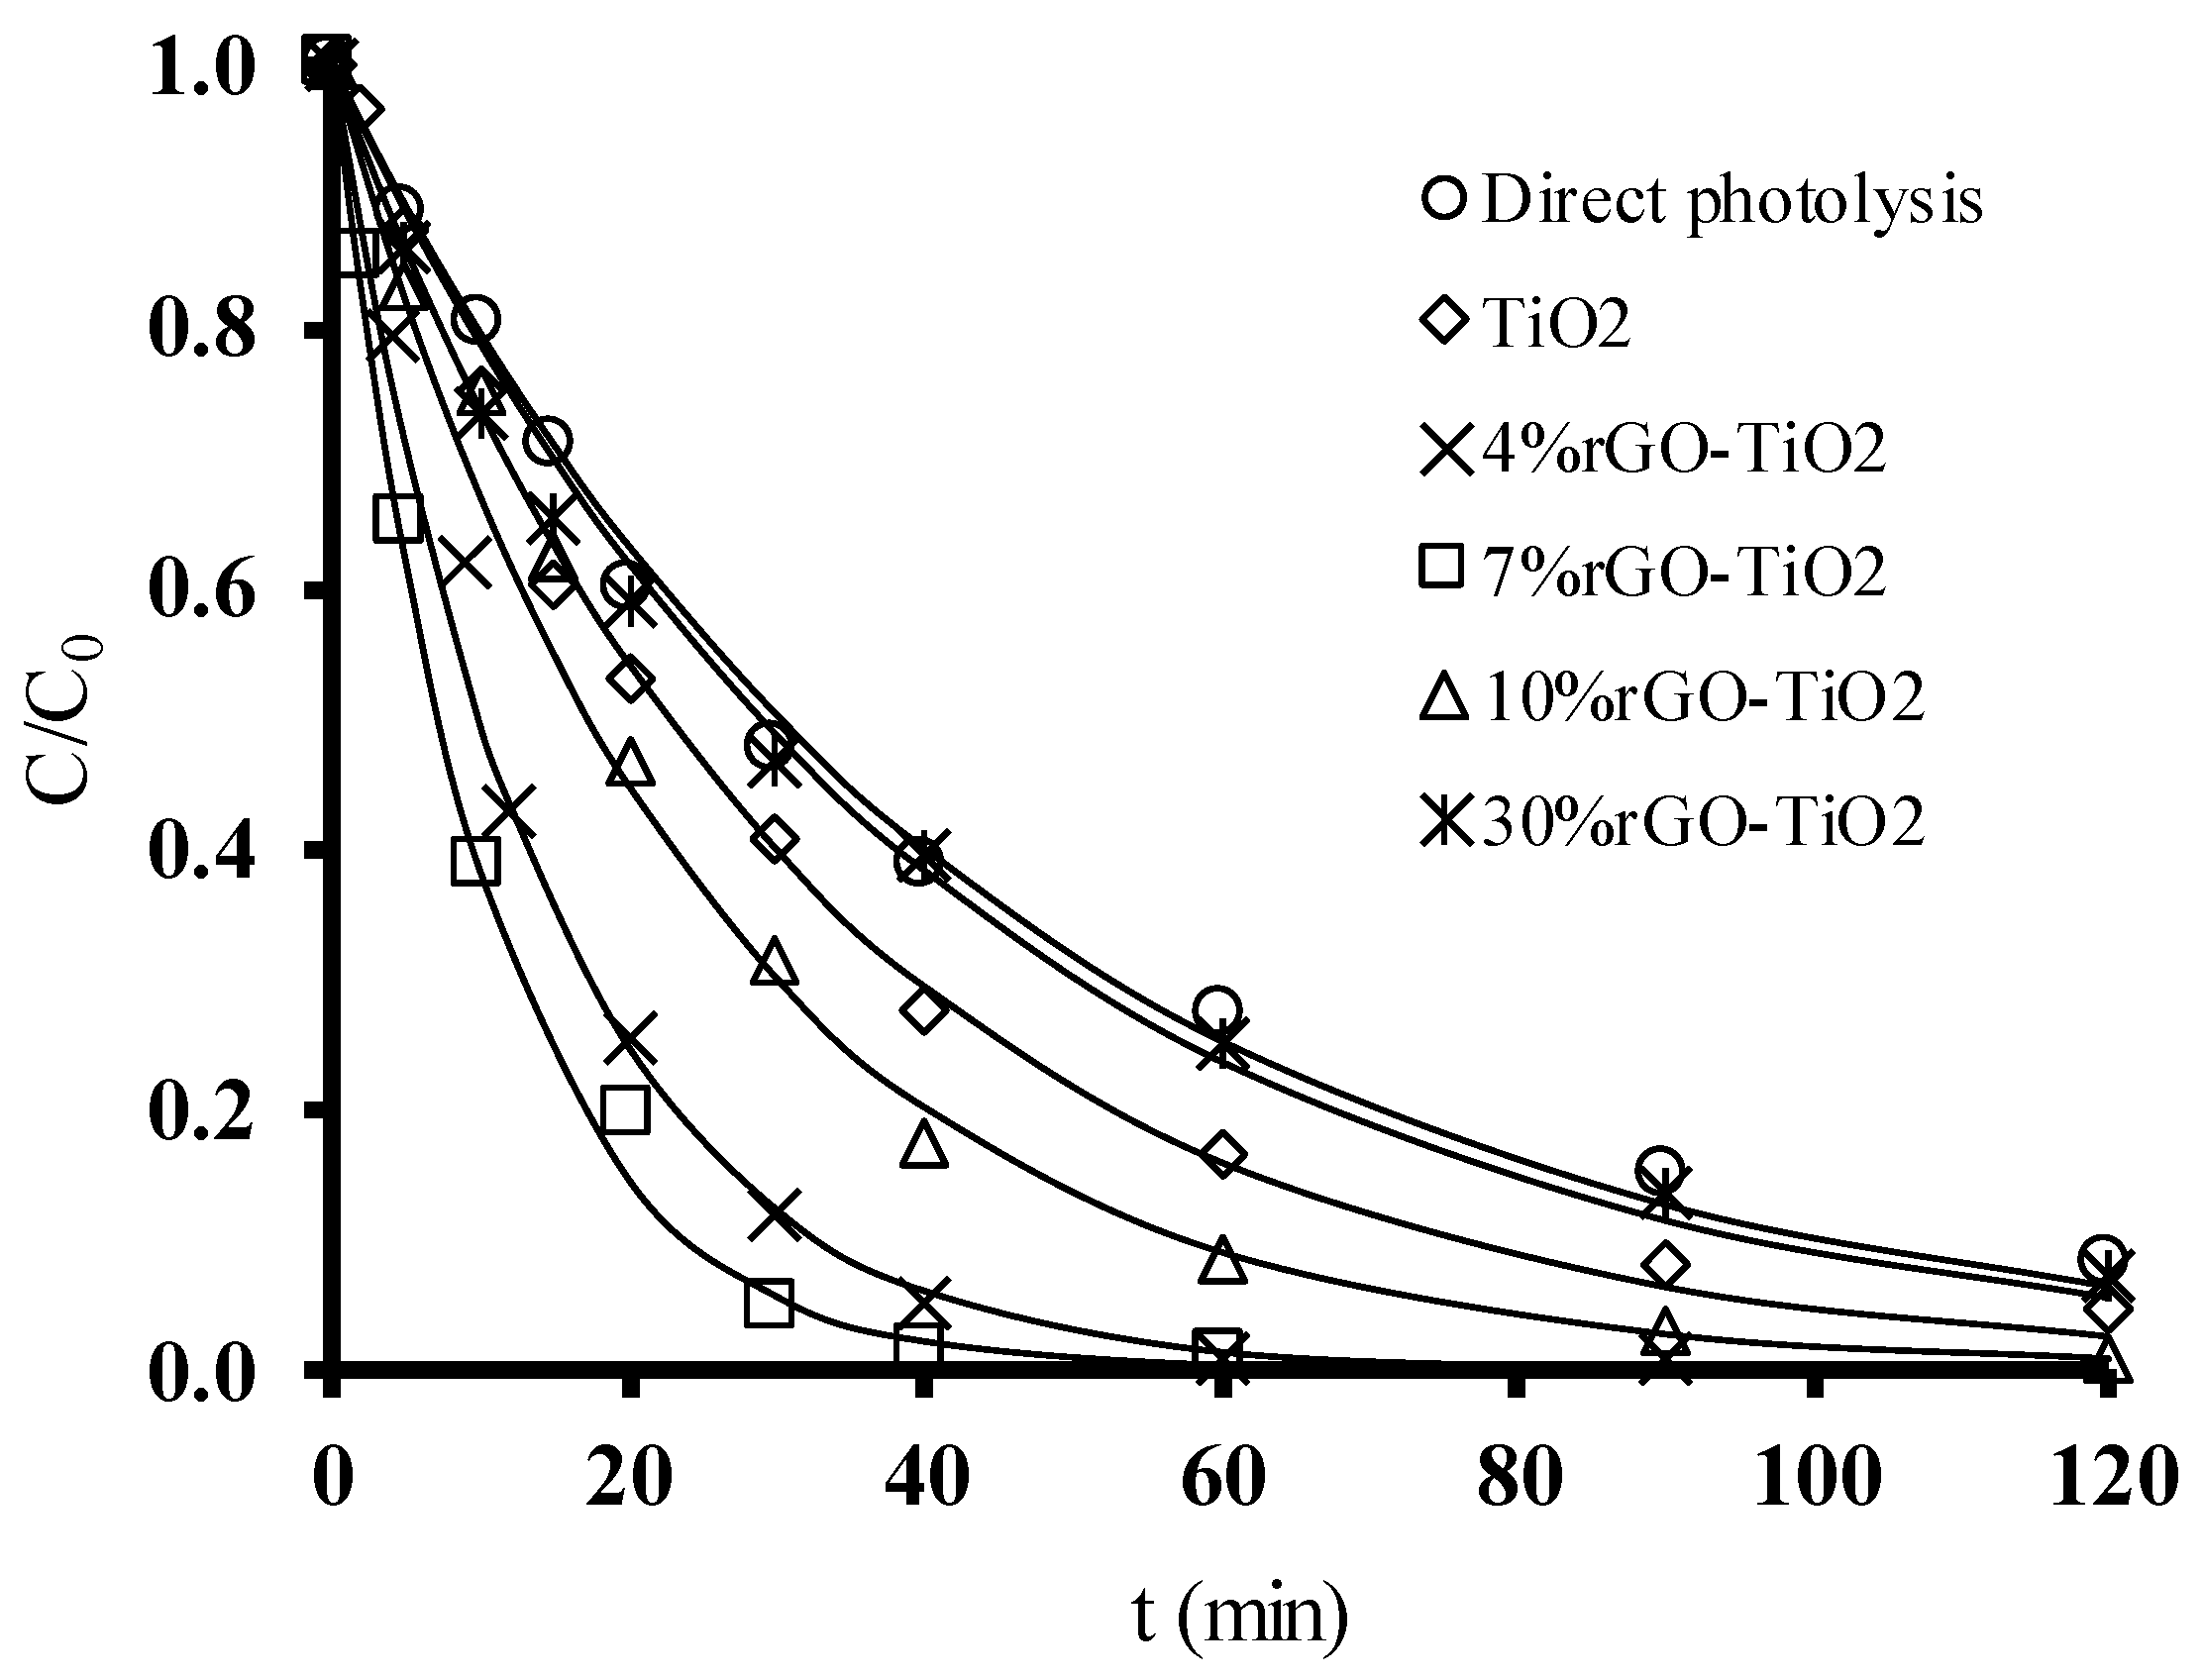
2.9. Photocatalytic Degradation of EtP

Photocatalytic processes are based on the generation of superoxide and hydroxyl radicals capable of oxidizing pollutants. The following are the main reactions involved in the photocatalytic processes of oxidation of pollutants in aqueous solution and in the presence of TiO2 [80]:
Photoexcitation TiO2 + hν → e + h+
Charge-carrier trapping of e e CB → e TR
Charge-carrier trapping of h+ h+ VB → h+ TR
Electron-hole recombination e TR + h+ VB (h+ TR) → e CB + heat
Photoexcited e scavenging (O2)ads + e → O2•−
Oxidation to HO H2O + h+ → HO + H+
Photodegradation by HO Pollutants + HO→ intermediate(s) + H2O
Direct photoholes Pollutants + h+→ intermediate(s)/degradation products
Protonation of superoxide O2•− + H+ → HO2
Co-scavenging of e HO2 + e → HO2
Formation of H2O2 HO2 + H+ → H2O2
The composites with different GO percentages obtained by hydrothermal treatment of synthesized TiO2 were used as catalysts in EtP photodegradation under UV radiation. Figure 12 depicts the photodegradation kinetics of EtP by UV radiation and in the presence of x% rGO-TiO2 composites.
Table 8 lists the results of analyzing the photodegradation kinetics, which fit a pseudo-first order kinetic model and indicate the rate of photocatalytic degradation of EtP.
Before performing the photodegradation experiments, paraben adsorption experiments were conducted on the composites under study to eliminate the contribution of adsorption to the overall EtP removal process. In addition, the effect of direct photolysis on EtP removal was studied by using UV radiation alone, which achieves 61.5% degradation after 40 min irradiation with 14.0% TOC removal (Table 8).
As observed in Table 8, the presence of TiO2 in the medium increases EtP photodegradation in comparison to direct photolysis. The percentage of rGO in the composite has a major effect on the photocatalytic performance. Based on the photodegradation rate, greater catalytic activity is observed for 7% rGO-TiO2, 4% rGO/TiO2, and 10% rGO-TiO2 composites than for TiO2 alone. The time to degrade 90% EtP decreases with the use of rGO-TiO2 composites, and is shortest (23.9 min) when the 7% rGO-TiO2 sample is used. According to the results in Table 8, the performance of EtP photocatalytic degradation decreases in the order: 7% rGO-TiO2 > 4% rGO-TiO2 > 10% rGO-TiO2 > TiO2 > 30% rGO-TiO2 > UV. At 40 min, the percentage degradation of EtP is always higher than the percentage removal of TOC, indicating that not all degraded EtP is mineralized during the catalytic degradation process, obtaining by-products with a lower molecular weight than that of EtP.
The results obtained demonstrate that the presence of rGO in the TiO2 composite considerably enhances the photocatalytic activity of TiO2, increasing the degradation rate constant from 0.031 to 0.096 min−1 in the presence of 7% rGO. The percentage degradation of EtP at 40 min is 72.5% for TiO2 and rises to 98.6% for 7% rGO-TiO2. These results evidence the positive role of rGO in EtP photodegradation. The presence of rGO sheets in the TiO2 composite favors its photocatalytic activity in the following four ways: (i) rGO sheets improve the adsorption capacity of the rGO/TiO2 composite by increasing its surface area (Table 1), thereby increasing the concentration of EtP molecules close to the active sites in TiO2 and thereby improving photodegradation; (ii) graphene is an electron acceptor due to its two-dimension π conjugation structure, and the excited electrons of TiO2 can rapidly transfer from the conduction band of TiO2 to rGO in rGO/TiO2 composites, effectively suppressing the recombination of photogenerated charge carriers and enhancing EtP degradation; (iii) rGO can act as a sensitizer by donating electrons to TiO2. These electrons are excited by UV radiation photon, generating superoxide radicals through reduction of the adsorbed molecular oxygen; in addition, positively charged rGO sheets attract TiO2 electrons and create positive holes in the valence band of TiO2, which react with the water adsorbed to generate hydroxyl radicals; and (iv) the presence of C–O–Ti bonds in composites reduces the band-gap energy to a value of 2.55 eV, as reported in Section 2.7, facilitating the transition of electrons from the valence to the conduction band and increasing the concentration of radicals generated [38,80].
The results in Table 8 demonstrate that the photocatalytic activity of composite materials depends on their rGO content. Thus, the activity increases when the rGO rises from 4 to 7% and decreases when it rises to 10%, and this decrease is much higher when the sample contains 30% rGO, with the photoactivity being lower for 30% rGO-TiO2 than for TiO2. The mass ratio of rGO to TiO2 affects the photodegradation process performance because both materials have a synergic effect on pollutant adsorption and photocatalysis. Depending on the type of composite, there is an optimal rGO/TiO2 ratio that achieves maximum pollutant degradation due to the uniformity of titanium dioxide anchoring. When this optimal rGO amount is exceeded, the performance of the process decreases, because an excess of rGO particles can cover the active sites on the TiO2 surface or act as recombination centers. This favors the aggregation of rGO-TiO2 composites, blocking light to the TiO2 surface and restricting the rGO-TiO2 contact, thereby reducing the synergic effect [31,60,80].
The above findings indicate that the optimal rGO percentage in TiO2 composites is around 7% in the present system. Comparison of characteristics of the four composite samples under study shows that 7% rGO-TiO2 has the smallest crystal size, 17.6 nm (Table 3), and the lowest ID/IG ratio, 0.95 (Table 5). These two characteristics favor the behavior of 7% rGO-TiO2, because a smaller crystal size increases the number of active sites exposed to light and a lower ID/IG value indicates a higher proportion of carbon atoms with sp2 hybridization, favoring the electronic conductivity of the sample and, therefore, its photoactivity.
With respect to the behavior of rGO-P25 composite materials, Figure S7 depicts the degradation kinetics of EtP, and Table 9 lists the values of kinetic parameters obtained. The photocatalytic activity of P25 (Table 9) is lower than that of the TiO2 prepared in this study (Table 8), and rGO-P25 composite materials are much less active in EtP photodegradation compared with rGO-TiO2.
Numerous authors have studied the reference material P25 (manufactured by Degussa but now by Evonik Industries), a mixed-phase TiO2 photocatalyst (85.9 wt % anatase and 14.1 wt % rutile), for comparison with the materials synthetized in each laboratory [81,82]. The P25 sample is a heterojunction photocatalyst of TiO2. Although anatase is commonly considered the most active phase of TiO2 in photocatalysis, it has been demonstrated that the binding of two phases (anatase with brookite or anatase with rutile) improves the photocatalytic activity in comparison to anatase alone. This improvement is attributable to its effect on the separation of charge carriers, because it traps electrons in rutile phase and minimizes electron recombination. This is similar to the heterojunction between different photocatalysts [83,84,85]. All of the present results indicate that the TiO2 prepared for this study is a more active photocatalyst for degrading EtP in comparison to commercial P25; this may be due in part to the larger surface area (Table 1) and smaller crystal size (Table 3 and Table 4) of TiO2 than of P25. These differences also make rGO-TiO2 composites more photoactive than the corresponding rGO-P25 composites.
Table S4 summarizes the most significant results reported from the literature when using other photocatalysts and UV or solar radiation for the removal of parabens from water. It can be concluded that 7% rGO-TiO2 photocatalyst is the most active in EtP photodegradation.

3. Materials and Methods

3.1. Reagents

All chemical reagents used in this study (natural graphite, potassium permanganate, sodium nitrate, hydrogen peroxide [33%], sulfuric acid, hydrochloric acid, ethanol, titanium isopropoxide, ethylparaben, and triethanolamine) were high-purity analytical grade reagents and were supplied by Sigma-Aldrich. Titanium(IV) oxide (Aeroxide P25) was purchased from Acros Organics. All solutions were prepared using ultrapure water obtained with Milli-Q equipment (18.2 MΩ cm).

3.2. Synthesis of Graphene Oxide

GO preparation was based on the modified Hummers method [37,53]. Briefly, 120 mL H2SO4 conc, 2.5 g graphite, and 2.5 g NaNO3 were added in a beaker under agitation and in a cold bath. Subsequently, 15 g KMnO4 was added very slowly in small doses at < 20 °C. The suspension was continuously agitated for 2 h at 35 °C. Next, 325 mL of water was added to the cold mixture, raising the temperature to 90 °C; 8.83 mL H2O2 33% was then added to reduce KMnO4 to soluble manganese ions, maintaining the agitation for 30 min. The oxidized material was washed with 10% HCl and the suspension was centrifuged and washed several times with water until reaching neutral pH. The resulting product was oven-dried at 60 °C for 24 h to obtain graphite oxide, which was dispersed in 250 mL water and sonicated for 1 h. The sonicated dispersion was centrifuged for 30 min at 8000 rpm to separate the non-exfoliable graphite oxide particles from the GO particles remaining in the solution.

3.3. Synthesis of rGO-TiO2 Composites

rGO-TiO2 composites were prepared using a hydrothermal method [41]. Briefly, 3.7 mL titanium isopropoxide was added to 3.3 mL triethanolamine in a 25 mL volumetric flask in order to obtain a 0.5 M Ti(IV) solution. The rGO-TiO2 composites were obtained by adding different amounts of a GO dispersion (1 mg/mL) to 42.9 mL of a water:ethanol (1:14) mixture under continuous agitation. Subsequently, 8.6 mL of the 0.5 M Ti(IV) solution was added, agitating for 24 h at room temperature to obtain a homogeneous solution, which was then placed in a 120 mL Teflon vessel within a stainless steel reactor (Parr Acid Digestion Vessel, Model 4748) and heated at 180 °C for 24 h. The resulting solid was washed three times with ethanol, centrifuged at 13,000 rpm for 10 min, and then oven-dried at 60 °C.
The composite materials obtained were designated xrGO-TiO2, with x being the GO content (4%, 7%, 10%, or 30%). Pure samples of TiO2 samples (without GO addition) and rGO were also prepared using the same experimental method (without titanium isopropoxide).
rGO-P25 composites were prepared by a simple hydrothermal method [86]. Briefly, different amounts of GO were added to a mixture of water (60 mL) and ethanol (30 mL) and sonicated for 30 min. Next, 300 mg P25 were added to the solution, which was agitated for 2 h to obtain a homogeneous mixture. This mixture was placed in a 120 mL Teflon vessel within a stainless-steel reactor (Parr Acid Digestion Vessel, Model 4748) and heated at 120 °C for 3 h to simultaneously achieve GO reduction and P25 deposition on rGO sheets. Finally, the resulting composite material was recovered by filtration, washed several times with deionized water, and dried at 70 °C for 12 h.

3.4. Characterization Techniques

Samples were texturally characterized by N2 adsorption at −196 °C with ASAP 2020 equipment (Micromeritics, Norcross, GA, USA). The BET surface area (SBET) was calculated according to the adsorption isotherms. Dubinin-Radushkevich (DR) and Stoeckli equations were applied to determine micropore volume (V0) and mean micropore width (L0). The mesopore volume was obtained as the difference in the amount of N2 adsorbed at a relative pressure of 0.95 and V0.
Thermogravimetric analysis was conducted using Mettler Toledo equipment, model TGA/DSC 1 Start System (Mettler Toledo, Columbus, Ohio, USA), heating the sample from 30 to 1000 °C in air atmosphere at a heating rate of 20 °C/min.
Powder XRD experiments were conducted in PANalytical Empyrean XRD equipment (Empyrean, Almelo, The Netherlands) using CuKα radiation. Diffractograms were analyzed by consulting the files of the International Centre for Diffraction Data (Joint Committee on Powder Diffraction Standards). Diffraction patterns were recorded between 5° and 80° (2θ) with passage size of 0.01° and integration time of 100 s.
FTIR spectra were recorded with a Bruker Vertex 70 spectrometer (Bruker, Ettlingen, Germany) in the range 4000–400 cm−1. Raman spectra were determined using a Renishaw inVia confocal Raman microscope. The excitation source was ionized Ar laser (λ = 514.5 nm) in a measurement range of 100–3500 cm−1. A 50 × microscope objective was used, and the laser power was 1 mW. Spectral lines were fitted to Lorentzian functions with OriginPro 8.6.0 (32bit) SR2 b98 (Originlab Corpotation, Northampton, USA).
XPS experiments were conducted using an X-ray photoelectron spectrometer with AlKα anode X-ray source and hemispherical electron analyzer (PHI 5000 Versa Probe II, Chanhassen, MN, USA). The X-ray source was operated at 450 W. The regions analyzed were always C 1s, O 1s, and Ti 2p. The signals for each region were deconvoluted using Gaussian-Lorentzian asymmetrical addition type functions to determine the number of components, the bond energy (BE) of peaks, and their area (quantitative analysis). The BE of the C 1s peak at 284.6 eV was considered the reference peak.
UV-Vis diffuse reflectance spectra for TiO2 and composites were obtained in the measurement range of 200–2000 nm at 25 °C. Powder samples were analyzed in a Varian Cary 4000 spectrophotometer (Varian, Mulgrave, Australia) equipped with a spherical diffuse reflectance accessory.
Photoluminescence (PL) spectroscopy characterization was performed using a CARY VARIAN (Agilent, Santa Clara, CA, USA) fluorescence spectrophotometer equipped with Xe lamp as excitation source, exciting PL spectra to 264 nm wavelength at room temperature (293 K).

3.5. Photocatalytic Experiments

Experiments were conducted to investigate the photocatalytic activity of the prepared composites in EtP degradation. They were performed in a UV laboratory reactor system 2 (UV Consulting Peschl, Mainz, Germany) equipped with medium-pressure mercury vapor lamp (TQ 150, nominal power 150 W), pouring 700 mL of EtP solution (0.3 mM) with 0.7 g/L of rGO-TiO2 into the reactor. EtP concentrations were determined at different time points using a high-performance liquid chromatograph (Thermo-Fisher) equipped with a UV800 photodiode detector (column: Hypersil GOLD 25 × 4.6 mm; mobile phase: 50:50 methanol: acidic water [0.01% HCOOH]; flow rate: 1 mL/min, injection volume: 20 μL; UV detector wavelength: 254 nm). For each experiment, the photoreactor was activated after stabilizing the lamp and controlling the temperature (25 °C), and 2 mL aliquots were then withdrawn from the reactor at different time points to measure concentrations of EtP and total organic carbon (TOC). EtP mineralization was followed by TOC measurements, as described elsewhere [87].

4. Conclusions

rGO-TiO2 composites with different percentages of rGO were successfully prepared using a simple hydrothermal method. The results obtained demonstrated the effective reduction of GO, the formation of pure anatase phase, and the formation of Ti−O−C bonds on composite surfaces. The surface area and porosity are more developed in the rGO-TiO2 composites than in the GO-P25 composites. The highest Ti/C ratio is observed for the 7% rGO-TiO2 composite, due to a superior rGO sheets dispersion in the TiO2 matrix. All rGO-TiO2 composites obtained behave as semiconductor materials (Eg ≤ 3.1 eV), and a higher percentage of rGO produces a reduction in band gap energies due to the formation of Ti–O–C bonds.
The highest photocatalytic activity for EtP degradation under UV radiation is achieved with the composite containing 7% rGO (7%rGO-TiO2), which reaches 98.6% degradation after 40 min of irradiation. However, a higher graphene content leads to the aggregation of graphene nanosheets and TiO2 nanoparticles, reducing the light absorption capacity and EtP photodegradation.
The presence of two phases (anatase and rutile) in P25, and the smaller surface area and larger crystal size in rGO-P25 versus rGO-TiO2 composites may be responsible for the lower photocatalytic activity of the former in EtP removal. In the rGO-P25 composites, photocatalytic EtP degradation reaches the maximum value with a rGO content of only 4%.
Finally, it can be concluded that this type of photoactive composites, based on rGO and TiO2 and with an adequate content of rGO, can be highly effective for the UV photodegradation of emerging organic pollutants such as parabens in water.

Supplementary Materials

The following are available online at https://0-www-mdpi-com.brum.beds.ac.uk/2073-4344/10/5/520/s1, Figure S1: Thermogravimetric analysis curves for P25 and x% rGO-P25, Figure S2: XRD patterns for rGO-P25 composites, Figure S3: FTIR spectra of P25 and rGO-P25 composites, Figure S4: Raman spectra of P25 and rGO-P25 composites, Figure S5: XPS profiles of rGO-P25 composites: (a) C 1s spectra; (b) O 1s spectra and (c) Ti 2p spectra. Continuous red line: experimental profile; discontinuous black line: fitted profile, Figure S6: Schematic diagram of the energy levels for rGO and TiO2, Figure S7: Photodegradation kinetics of EtP under UV radiation in the presence of rGO-P25 composites as a function of treatment time. [EtP]0 = 0.30 × 10⁻³ mol/L, [catalyst]0 = 0.7 g/L, Table S1: Parameters obtained from XR diffractograms: diffraction peak position (2θ), full-width at half maximum (FWHM), and crystal size (D101), Table S2: Parameters obtained from Raman spectra for P25 and rGO-P25 composites, Table S3: Ti/C, AC-O/AC-C ratios, species percentages, and bond energies (in brackets, eV) obtained by XPS analysis, Table S4: Results of the application of different photocatalysts for the removal of parabens from water [88].

Author Contributions

M.A.Á., M.V.L.-R., J.R.-U. and M.S.-P. conceived and designed the experiments; M.R.-M. and G.C.-Q. performed the experiments; M.R.-M., G.C.-Q. and M.A.Á. analyzed the data; M.A.Á., M.V.L.-R., J.R.-U. and M.S.-P. wrote the paper. All authors have read and agreed to the published version of the manuscript.

Funding

This research was funded by Spanish Ministry of Economy, Industry and Competitiveness and FEDER (grant number CTQ2016-80978-C2−1-R), Asociación Universitaria Iberoamericana de Postgrado (AUIP) and University of Jaen.

Acknowledgments

This work was supported by the Spanish Ministry of Economy, Industry and competitiveness and by FEDER (Project CTQ2016-80978-C2−1-R). M.R.-M. thanks to the Asociación Universitaria Iberoamericana de Postgrado (AUIP) and the University of Jaen for the grant awarded and the financial support.

Conflicts of Interest

The authors declare no conflict of interest.

References

  1. Albero, B.; Pérez, R.A.; Sánchez-Brunete, C.; Tadeo, J.L. Occurrence and analysis of parabens in municipal sewage sludge from wastewater treatment plants in Madrid (Spain). J. Hazard. Mater. 2012, 48, 239–240. [Google Scholar] [CrossRef] [PubMed]
  2. Council Directive 76/768/EEC of 27 July 1976. Available online: https://eur-lex.europa.eu/legal-content/EN/TXT/HTML/?uri=CELEX:31976L0768&from=EN (accessed on 17 February 2020).
  3. Gomes, J.F.; Lopes, A.; Gmurek, M.; Quinta-Ferreira, R.M.; Martins, R.C. Study of the influence of the matrix characteristics over the photocatalytic ozonation of parabens using Ag-TiO2. Sci. Total Environ. 2019, 646, 1468–1477. [Google Scholar] [CrossRef] [PubMed]
  4. Nian, P.; Peng, L.; Feng, J.; Han, X.; Cui, B.; Lu, S.; Zhang, J.; Liu, Q.; Zhang, A. Aqueous methylparaben degradation by dielectric barrier discharge induced non-thermal plasma combined with ZnO-rGO nanosheets. Sep. Purif. Technol. 2019, 211, 832–842. [Google Scholar] [CrossRef]
  5. Terasaki, M.; Makino, M.; Tatarazako, N. Acute toxicity of parabens and their chlorinated by-products with Daphnia magna and Vibrio fischeri bioassays. J. Appl. Toxicol. 2009, 29, 242–247. [Google Scholar] [CrossRef] [PubMed]
  6. Rostamifasih, Z.; Pasalari, H.; Mohammadi, F.; Esrafili, A. Heterogeneous catalytic degradation of methylparaben using persulfate activated by natural magnetite; optimization and modeling by response surface methodology. J. Chem. Technol. Biotechnol. 2019, 94, 1880–1892. [Google Scholar] [CrossRef]
  7. Chin, Y.P.; Mohamad, S.; Abas, M.R.B. Removal of parabens from aqueous solution using β-cyclodextrin cross-linked polymer. Int. J. Mol. Sci. 2010, 11, 3459–3471. [Google Scholar] [CrossRef] [Green Version]
  8. Mashile, G.P.; Mpupa, A.; Nqombolo, A.; Dimpe, K.M.; Nomngongo, P.N. Recyclable magnetic waste tyre activated carbon-chitosan composite as an effective adsorbent rapid and simultaneous removal of methylparaben and propylparaben from aqueous solution and wastewater. J. Water Process. Eng. 2020, 33, 101011. [Google Scholar] [CrossRef]
  9. Bernal, V.; Giraldo, L.; Moreno-Piraján, J.C.; Balsamo, M.; Erto, A. Mechanisms of methylparaben adsorption onto activated carbons: Removal tests supported by a calorimetric study of the adsorbent-adsorbate interactions. Molecules 2019, 24, 413. [Google Scholar] [CrossRef] [Green Version]
  10. Domínguez, J.R.; Munõz, M.J.; Palo, P.; González, T.; Peres, J.A.; Cuerda-Correa, E.M. Fenton advanced oxidation of emerging pollutants: Parabens. Int. J. Energy Environ. Eng. 2014, 5, 89. [Google Scholar] [CrossRef] [Green Version]
  11. Martins, R.C.; Gmurek, M.; Rossi, A.F.; Corceiro, V.; Costa, R.; Quinta-Ferreira, M.E.; Ledakowicz, S.; Quinta-Ferreira, R.M. Application of Fenton oxidation to reduce the toxicity of mixed parabens. Water Sci. Technol. 2016, 74, 1867–1875. [Google Scholar] [CrossRef]
  12. Frontistis, Z.; Antonopoulou, M.; Yazirdagi, M.; Kilinc, Z.; Konstantinou, I.; Katsaounis, A.; Mantzavinos, D. Boron-doped diamond electrooxidation of ethyl paraben: The effect of electrolyte on by-products distribution and mechanisms. J. Environ. Manag. 2017, 195, 148–156. [Google Scholar] [CrossRef] [PubMed]
  13. Tay, K.; Rahman, N.; Abas, M. Ozonation of parabens in aqueous solution: Kinetics and mechanism of degradation. Chemosphere 2020, 81, 1446–1453. [Google Scholar] [CrossRef] [PubMed]
  14. Pipolo, M.; Gmurek, M.; Corceiro, V.; Costa, R.; Quinta-Ferreira, M.E.; Ledakowicz, S.; Quinta-Ferreira, R.M.; Martins, R.C. Ozone-based technologies for parabens removal from water: Toxicity assessment. Ozone Sci. Eng. 2017, 39, 233–243. [Google Scholar] [CrossRef]
  15. Hansen, K.; Andersen, H. Energy effectiveness of direct UV and UV/H2O2 treatment of estrogenic chemicals in biologically treated sewage. Int. J. Photoenergy 2012, 2012, 270320. [Google Scholar] [CrossRef] [Green Version]
  16. Gmurek, M.; Rossi, A.F.; Martins, R.C.; Quinta-Ferreira, R.M.; Ledakowicz, S. Photodegradation of single and mixture of parabens-kinetic, by-products identification and cost-efficiency analysis. Chem. Eng. J. 2015, 276, 303–314. [Google Scholar] [CrossRef]
  17. Gomes, J.; Leal, I.; Bednarczyk, K.; Gmurek, M.; Stelmachowski, M.; Zaleska-Medynska, A.; Bastos, F.C.; Quinta-Ferreira, M.E.; Costa, R.; Quinta-Ferreira, R.M.; et al. Detoxification of parabens using UV-A enhanced by noble metals-TiO2 supported catalysts. J. Environ. Chem. Eng. 2017, 5, 3065–3074. [Google Scholar] [CrossRef]
  18. Daghrir, R.; Dimboukou-Mpira, A.; Seyhi, B.; Drogui, P. Photosonochemical degradation of butyl-paraben: Optimization, toxicity and kinetic studies. Sci. Total Environ. 2014, 490, 223–234. [Google Scholar] [CrossRef] [Green Version]
  19. Gomes, J.; Leal, I.; Bednarczyk, K.; Gmurek, M.; Stelmachowski, M.; Diak, M.; Quinta-Ferreira, M.E.; Costa, R.; Quinta-Ferreira, R.M.; Martins, R.C. Photocatalytic ozonation using doped TiO2 catalysts for the removal of parabens in water. Sci. Total Environ. 2017, 609, 329–340. [Google Scholar] [CrossRef]
  20. Chiu, Y.-H.; Chang, T.-F.M.; Chen, C.-Y.; Sone, M.; Hsu, Y.-J. Mechanistic insights into photodegradation of organic dyes using heterostructure photocatalysts. Catalysts 2019, 9, 430. [Google Scholar] [CrossRef] [Green Version]
  21. Tang, B.; Chen, H.; Peng, H.; Wang, Z.; Huang, W. Graphene modified TiO2 composite photocatalysts: Mechanism, progress and perspective. Nanomaterials 2018, 8, 105. [Google Scholar] [CrossRef] [Green Version]
  22. Fang, M.J.; Tsao, C.W.; Hsu, Y.J. Semiconductor nanoheterostructures for photoconversion applications. J. Phys. D Appl. Phys. 2020, 53, 143001. [Google Scholar] [CrossRef]
  23. Martins, A.S.; Marques Cordeiro-Junior, P.J.; Garcia Bessegato, G.; Fernandes Carneiro, J.; Boldrin Zanoni, M.V.; de Vasconcelos Lanza, M.R. Electrodeposition of WO3 on Ti substrate and the influence of interfacial oxide layer generated in situ: A photoelectrocatalytic degradation of propyl paraben. Appl. Surf. Sci. 2019, 464, 664–672. [Google Scholar] [CrossRef]
  24. Gomes, J.F.; Lopes, A.; Bednarczyk, K.; Gmurek, M.; Stelmachowski, M.; Zaleska-Medynska, A.; Quinta-Ferreira, M.E.; Costa, R.; Quinta-Ferreira, R.M.; Martins, R.C. Effect of noble metals (Ag, Pd, Pt) loading over the efficiency of TiO2 during photocatalytic ozonation on the toxicity of parabens. Chemengineering 2018, 2, 4. [Google Scholar] [CrossRef] [Green Version]
  25. Cruz, M.; Gomez, C.; Duran-Valle, C.J.; Pastrana-Martínez, L.M.; Faria, J.L.; Silva, A.M.T.; Faraldos, M.; Bahamonde, A. Bare TiO2 and graphene oxide TiO2 photocatalysts on the degradation of selected pesticides and influence of the water matrix. Appl. Surf. Sci. 2017, 416, 1013–1021. [Google Scholar] [CrossRef]
  26. Lin, Y.; Ferronato, C.; Deng, N.; Wu, F.; Chovelon, J.M. Photocatalytic degradation of methylparaben by TiO2: Multivariable experimental design and mechanism. Appl. Catal. B Environ. 2009, 88, 32–41. [Google Scholar] [CrossRef]
  27. Atheba, P.; Drogui, P.; Seyhi, B.; Robert, D. Photo-degradation of butyl parahydroxybenzoate by using TiO2-supported catalyst. Water Sci. Technol. 2013, 67, 2141–2147. [Google Scholar] [CrossRef]
  28. Petala, A.; Frontistis, Z.; Antonopoulou, M.; Konstantinou, I.; Kondarides, D.I.; Mantzavinos, D. Kinetics of ethyl paraben degradation by simulated solar radiation in the presence of N-doped TiO2 catalysts. Water Res. 2015, 81, 157–166. [Google Scholar] [CrossRef]
  29. Frontistis, Z.; Antonopoulou, M.; Venieri, D.; Dailianis, S.; Konstantinou, I.; Mantzavinos, D. Solar photocatalytic decomposition of ethyl paraben in zinc oxide suspensions. Catal. Today 2017, 280, 139–148. [Google Scholar] [CrossRef]
  30. Tu, S.; Lu, M.; Xiao, X.; Zheng, C.; Zhong, H.; Zuo, X.; Nan, J. Flower-like Bi4O5I2/Bi5O7I nanocomposite: Facile hydrothermal synthesis and efficient photocatalytic degradation of propylparaben under visible-light irradiation. RSC Adv. 2016, 6, 44552–44560. [Google Scholar] [CrossRef]
  31. Petala, A.; Noe, A.; Frontistis, Z.; Drivas, C.; Kennou, S.; Mantzavinos, D.; Kondarides, D.I. Synthesis and characterization of CoOx/BiVO4 photocatalysts for the degradation of propyl paraben. J. Hazard. Mater. 2019, 372, 52–60. [Google Scholar] [CrossRef]
  32. Frontistis, Z.; Antonopoulou, M.; Petala, A.; Venieri, D.; Konstantinou, I.; Kondarides, D.I.; Mantzavinos, D. Photodegradation of ethyl paraben using simulated solar radiation and Ag3PO4 photocatalyst. J. Hazard. Mater. 2017, 323, 478–488. [Google Scholar] [CrossRef] [PubMed]
  33. Kotzamanidi, S.; Frontistis, Z.; Binas, V.; Kiriakidis, G.; Mantzavinos, D. Solar photocatalytic degradation of propyl paraben in Al-doped TiO2 suspensions. Catal. Today 2018, 313, 148–154. [Google Scholar] [CrossRef]
  34. Ngigi, E.M.; Nomngongo, P.N.; Ngila, J.C. Synthesis and application of Fe-doped WO3 nanoparticles for photocatalytic degradation of methylparaben using visible-light radiation and H2O2. Catal. Lett. 2019, 145, 49–60. [Google Scholar] [CrossRef]
  35. Hu, Y.; Li, Z.; Yang, J.; Zhu, H. Degradation of methylparaben using BiOI-hydrogel composites activated peroxymonosulfate under visible light irradiation. Chem. Eng. J. 2019, 360, 200–211. [Google Scholar] [CrossRef]
  36. Xiao, X.; Lu, M.; Nan, J.; Zuo, X.; Zhang, W.; Liu, S.; Wang, S. Rapid microwave synthesis of I-doped Bi4O5Br2 with significantly enhanced visible-light photocatalysis for degradation of multiple parabens. Appl. Catal. B Environ. 2017, 218, 398–408. [Google Scholar] [CrossRef]
  37. Pastrana-Martínez, L.M.; Morales-Torres, S.; Likodimos, V.; Figueiredo, J.L.; Faria, J.L.; Falaras, P.; Silva, A.M.T. Advanced nanostructured photocatalysts based on reduced graphene oxide-TiO2 composites for degradation of diphenhydramine pharmaceutical and methyl orange dye. Appl. Catal. B Environ. 2012, 123−124, 241–256. [Google Scholar]
  38. Jiang, G.; Lin, Z.; Chen, C.; Zhu, L.; Chang, Q.; Wang, N.; Wei, W.; Tang, H. TiO2 nanoparticles assembled on graphene oxide nanosheets with high photocatalytic activity for removal of pollutants. Carbon 2011, 49, 2693–2701. [Google Scholar] [CrossRef]
  39. Alamelu, K.; Raja, V.; Shiamala, L.; Jaffar Ali, B.M. Biphasic TiO2 nanoparticles decorated graphene nanosheets for visible light driven photocatalytic degradation of organic dyes. Appl. Surf. Sci. 2018, 430, 145–154. [Google Scholar] [CrossRef]
  40. Tayel, A.; Ramadan, A.R.; El Seoud, O.A. Titanium dioxide/graphene and titanium dioxide/graphene oxide nanocomposites: Synthesis, characterization and photocatalytic applications for water decontamination. Catalysts 2018, 8, 491. [Google Scholar] [CrossRef] [Green Version]
  41. Chang, B.Y.S.; Huang, N.M.; An’amt, M.N.; Marlinda, A.R.; Norazriena, Y.; Muhamad, M.R.; Harrison, I.; Lim, H.N.; Chia, C.H. Facile hydrothermal preparation of titanium dioxide decorated reduced graphene oxide nanocomposite. Int. J. Nanomed. 2012, 7, 3379–3387. [Google Scholar]
  42. Tan, L.L.; Ong, W.J.; Chai, S.P.; Mohamed, A.R. Reduced graphene oxide-TiO2 nanocomposite as a promising visible-light active photocatalyst for the conversion of carbon dioxide. Nanoscale Res. Lett. 2013, 8, 465. [Google Scholar] [CrossRef] [Green Version]
  43. Ismail, A.A.; Geioushy, R.A.; Bouzid, H.; Al-Sayari, S.A.; Al-Hajry, A.; Bahnemann, D.W. TiO2 decoration of graphene layers for highly efficient photocatalyst: Impact of calcination at different gas atmosphere on photocatalytic efficiency. Appl. Catal. B Environ. 2013, 129, 62–70. [Google Scholar] [CrossRef]
  44. Sher Shah, M.S.A.; Park, A.R.; Zhang, K.; Park, J.H.; Yoo, P.J. Green synthesis of biphasic TiO2-reduced graphene oxide nanocomposites with highly enhanced photocatalytic activity. ACS Appl. Mater. Interfaces 2012, 4, 3893–3901. [Google Scholar] [CrossRef] [PubMed]
  45. Shen, J.; Yan, B.; Shi, M.; Ma, H.; Li, N.; Ye, M. One step hydrothermal synthesis of TiO2-reduced graphene oxide sheets. J. Mater. Chem. 2011, 21, 3415–3421. [Google Scholar] [CrossRef]
  46. Ganguly, A.; Sharma, S.; Papakonstantinou, P.; Hamilton, J. Probing the thermal deoxygenation of graphene oxide using high-resolution in situ X-ray-based spectroscopies. J. Phys. Chem. C 2011, 115, 17009–17019. [Google Scholar] [CrossRef] [Green Version]
  47. Dave, K.; Park, K.H.; Dhayal, M. Two-step process for programmable removal of oxygen functionalities of graphene oxide: Functional, structural and electrical characteristics. RSC Adv. 2015, 5, 95657–95665. [Google Scholar] [CrossRef]
  48. Morais, A.; Longo, C.; Araujo, J.R.; Barroso, M.; Durrant, J.R.; Nogueira, A.F. Nanocrystalline anatase TiO2/reduced graphene oxide composite films as photoanodes for photoelectrochemical water splitting studies: The role of reduced graphene oxide. Phys. Chem. Chem. Phys. 2016, 18, 2608–2616. [Google Scholar] [CrossRef] [Green Version]
  49. Li, J.; Zhou, S.L.; Hong, G.B.; Chang, C.T. Hydrothermal preparation of P25-graphene composite with enhanced adsorption and photocatalytic degradation of dyes. Chem. Eng. J. 2013, 219, 486–491. [Google Scholar] [CrossRef]
  50. Perera, S.D.; Mariano, R.G.; Vu, K.; Nour, N.; Seitz, O.; Chabal, Y.; Balkus, K.J. Hydrothermal synthesis of graphene-TiO2 nanotube composites with enhanced photocatalytic activity. ACS Catal. 2012, 2, 949–956. [Google Scholar] [CrossRef]
  51. Ba-Abbad, M.M.; Kadhum, A.A.H.; Mohamad, A.B.; Takriff, M.S.; Sopian, K. Synthesis and catalytic activity of TiO2 nanoparticles for photochemical oxidation of concentrated chlorophenols under direct solar radiation. Int. J. Electrochem. Sci. 2012, 7, 4871–4888. [Google Scholar]
  52. Kanta, U.-a.; Thongpool, V.; Sangkhun, W.; Wongyao, N.; Wootthikanokkhan, J. Preparations, characterizations, and a comparative study on photovoltaic performance of two different types of graphene/TiO2 nanocomposites photoelectrodes. J. Nanomater. 2017, 2017, 2758294. [Google Scholar] [CrossRef] [Green Version]
  53. Hummers, W.S.; Offeman, R.E. Preparation of graphitic oxide. J. Am. Chem. Soc. 1958, 80, 1339. [Google Scholar] [CrossRef]
  54. Li, W.Q.; Liu, X.; Li, H.X. Hydrothermal synthesis of graphene/Fe3+-doped TiO2 nanowire composites with highly enhanced photocatalytic activity under visible light irradiation. J. Mater. Chem. A 2015, 3, 15214–15224. [Google Scholar] [CrossRef]
  55. Liu, G.; Wang, R.; Liu, H.; Han, K.; Cui, H.; Ye, H. Highly dispersive nano-TiO2 in situ growing on functional graphene with high photocatalytic activity. J. Nanopart. Res. 2016, 18, 1–8. [Google Scholar] [CrossRef]
  56. Wojtoniszak, M.; Zielinska, B.; Chen, X.; Kalenczuk, R.J.; Mijowska, E. Synthesis and photocatalytic performance of TiO2 nanospheres-graphene nanocomposite under visible and UV light irradiation. J. Mater. Sci. 2012, 47, 3185–3190. [Google Scholar] [CrossRef]
  57. Sampaio, M.J.; Silva, C.G.; Silva, A.M.T.; Martínez, L.M.P.; Han, C.; Torres, S.M.; Figueiredo, J.L.; Dionysiou, D.D.; Faria, J.L. Carbon-based TiO2 materials for the degradation of Microcystin-LA. Appl. Catal. B: Environ. 2015, 170−171, 74–82. [Google Scholar] [CrossRef]
  58. Nguyen-Phan, T.D.; Pham, V.H.; Shin, E.W.; Pham, H.-D.; Kim, S.; Chung, J.S.; Kim, E.J.; Hur, S.H. The role of graphene oxide content on the adsorption-enhanced photocatalysis of titanium dioxide/graphene oxide composites. Chem. Eng. J. 2011, 170, 226–232. [Google Scholar] [CrossRef]
  59. Karaolia, P.; Michael-Kordatou, I.; Hapeshi, E.; Drosou, C.; Bertakis, Y.; Christofilos, D.; Armatas, G.S.; Sygellou, L.; Schwartz, T.; Xekoukoulotakis, N.P.; et al. Removal of antibiotics, antibiotic-resistant bacteria and their associated genes by graphene-based TiO2 composite photocatalysts under solar radiation in urban wastewaters. Appl. Catal. B Environ. 2018, 224, 810–824. [Google Scholar] [CrossRef]
  60. Long, M.; Qin, Y.; Chen, C.; Guo, X.; Tan, B.; Cai, W. Origin of visible light photoactivity of reduced graphene oxide/TiO2 by in situ hydrothermal growth of undergrown TiO2 with graphene oxide. J. Phys. Chem. C 2013, 117, 16734–16741. [Google Scholar] [CrossRef]
  61. Dresselhaus, M.S.; Jorio, A.; Hofmann, M.; Dresselhaus, G.; Saito, R. Perspectives on carbon nanotubes and graphene Raman spectroscopy. Nano Lett. 2010, 10, 751–758. [Google Scholar] [CrossRef]
  62. Kudin, K.N.; Ozbas, B.; Schniepp, H.C.; Prud’homme, R.K.; Aksay, I.A.; Car, R. Raman spectra of graphite oxide and functionalized graphene sheets. Nano Lett. 2007, 8, 36–41. [Google Scholar] [CrossRef] [PubMed]
  63. Tuinstra, F.; Koenig, J.L. Raman spectrum of graphite. J. Chem. Phys. 1970, 53, 1126–1130. [Google Scholar] [CrossRef] [Green Version]
  64. Vázquez-Santos, B.M.; Geissler, E.; László, K.; Rouzaud, J.N.; Martínez-Alonso, A.; Tascón, J.M.D. Comparative XRD, Raman, and TEM study on graphitization of PBO-derived carbon fibers. J. Phys. Chem. C 2012, 116, 257–268. [Google Scholar] [CrossRef]
  65. Pawlyta, M.; Rouzaud, J.N.; Duber, S. Raman microspectroscopy characterization of carbon blacks: Spectral analysis and structural information. Carbon 2015, 84, 479–490. [Google Scholar] [CrossRef]
  66. Brownson, D.A.C.; Kampouris, D.K.; Banks, C.E. Graphene electrochemistry: Fundamental concepts through to prominent applications. Chem. Soc. Rev. 2012, 41, 6944–6976. [Google Scholar] [CrossRef]
  67. Men, X.J.; Wu, Y.L.; Chen, H.B.; Fang, X.F.; Sun, H.; Yin, S.Y.; Qin, W.P. Facile fabrication of TiO2/Graphene composite foams with enhanced photocatalytic properties. J. Alloys Compd. 2017, 703, 251–257. [Google Scholar] [CrossRef]
  68. Najafi, M.; Kermanpur, A.; Rahimipour, M.R.; Najafizadeh, A. Effect of TiO2 morphology on structure of TiO2-graphene oxide nanocomposite synthesized via a one-step hydrothermal method. J. Alloys Compd. 2017, 722, 272–277. [Google Scholar] [CrossRef]
  69. Stengl, V.; Popelkova, D.; Vlacil, P. TiO2-graphene nanocomposite as high performace photocatalysts. J. Phys. Chem. C 2011, 115, 25209–25218. [Google Scholar] [CrossRef]
  70. Tian, F.; Zhang, Y.; Zhang, J.; Pan, C. Raman Spectroscopy: A New Approach to Measure the Percentage of Anatase TiO2 Exposed (001) Facets. J. Phys. Chem. C 2012, 116, 7515–7519. [Google Scholar] [CrossRef]
  71. Alsharaeh, E.H.; Bora, T.; Soliman, A.; Ahmed, F.; Bharath, G.; Ghoniem, M.G.; Abu-Salah, K.M.; Dutta, J. Sol-gel-assisted microwave-derived synthesis of anatase Ag/TiO2/GO nanohybrids toward efficient visible light phenol degradation. Catalysts 2017, 7, 133. [Google Scholar] [CrossRef]
  72. Pastrana-Martínez, L.M.; Morales-Torres, S.; Likodimos, V.; Falaras, P.; Figueiredo, J.L.; Faria, J.L.; Silva, A.M.T. Role of oxygen functionalities on the synthesis of photocatalytically active graphene-TiO2 composites. Appl. Catal. B Environ. 2014, 158−159, 329–340. [Google Scholar]
  73. Yang, D.; Velamakanni, A.; Bozoklu, G.; Park, S.; Stoller, M.; Piner, R.D.; Stankovich, S.; Jung, I.; Field, D.A.; Ventrice, C.A.; et al. Chemical analysis of graphene oxide films after heat and chemical treatments by X-ray photoelectron and micro-Raman spectroscopy. Carbon 2009, 47, 145–152. [Google Scholar] [CrossRef]
  74. Pulido, A.; Concepcion, P.; Boronat, M.; Botas, C.; Alvarez, P.; Menendez, R.; Corma, A. Reconstruction of the carbon sp2 network in graphene oxide by low-temperature reaction with CO. J. Mater. Chem. 2012, 22, 51–56. [Google Scholar] [CrossRef]
  75. Fan, W.; Lai, Q.; Zhang, Q.; Wang, Y. Nanocomposites of TiO2 and reduced graphene oxide as efficient photocatalysts for hydrogen evolution. J. Phys. Chem. C 2011, 115, 10694–10701. [Google Scholar] [CrossRef]
  76. Appavoo, I.A.; Hu, J.; Huang, Y.; Li, S.F.Y.; Ong, S.L. Response surface modeling of Carbamazepine (CBZ) removal by Graphene-P25 nanocomposites/UVA process using central composite design. Water Res. 2014, 57, 270–279. [Google Scholar] [CrossRef]
  77. Orellana-García, F.; Álvarez, M.A.; López-Ramón, M.V.; Rivera-Utrilla, J.; Sánchez-Polo, M. Photoactivity of organic xerogels and aerogels in the photodegradation of herbicides from waters. Appl. Catal. B Environ. 2016, 181, 94–102. [Google Scholar] [CrossRef]
  78. Chen, T.S.; Chiou, S.E.; Shiue, S.T. The effect of different radio-frequency powers on characteristics of amorphous boron carbon thin film alloys prepared by reactive radio-frequency plasma enhanced chemical vapor deposition. Thin Solid Films 2013, 528, 86–92. [Google Scholar] [CrossRef]
  79. Liu, B.; Wen, L.; Zhao, X. The photoluminescence spectroscopic study of anatase TiO2 prepared by magnetron sputtering. Mat. Chem. Phys. 2007, 106, 350–353. [Google Scholar] [CrossRef]
  80. Awfa, D.; Ateia, M.; Fujii, M.; Johnson, M.S.; Yoshimura, C. Photodegradation of pharmaceuticals and personal care products in water treatment using carbonaceous-TiO2 composites: A critical review of recent literature. Water Res. 2018, 142, 26–45. [Google Scholar] [CrossRef]
  81. Hanaor, D.A.; Sorrell, C.C. Review of the anatase to rutile phase transformation. J. Mater. Sci. 2011, 46, 855–874. [Google Scholar] [CrossRef] [Green Version]
  82. Shaham-Waldmann, N.; Paz, Y. Away from TiO2: A critical minireview on the developing of new photocatalysts for degradation of contaminants in water. Mater. Sci. Semicond. Process. 2016, 42, 72–80. [Google Scholar] [CrossRef]
  83. Ohno, T.; Tokieda, K.; Higashida, S.; Matsumura, M. Synergism between rutile and anatase TiO2 particles in photocatalytic oxidation of naphthalene. Appl. Catal. A Gen. 2003, 244, 383–391. [Google Scholar] [CrossRef]
  84. Batzill, M.; Morales, E.H.; Diebold, U. Influence of nitrogen doping on the defect formation and surface properties of TiO2 rutile and anatase. Phys. Rev. Lett. 2006, 96, 026103. [Google Scholar] [CrossRef] [PubMed]
  85. Hurum, D.C.; Agrios, A.G.; Gray, K.A.; Rajh, T.; Thurnauer, M.C. Explaining the enhanced photocatalytic activity of Degussa P25 mixed-phase TiO2 using EPR. J. Phys. Chem. B 2003, 107, 4545–4549. [Google Scholar] [CrossRef]
  86. Khalid, N.R.; Ahmed, E.; Hong, Z.; Sana, L.; Ahmed, M. Enhanced photocatalytic activity of graphene-TiO2 composite under visible light irradiation. Curr. Appl. Phys. 2013, 13, 659–663. [Google Scholar] [CrossRef]
  87. Álvarez, M.A.; Ruidíaz-Martínez, M.; Cruz-Quesada, G.; López-Ramón, M.V.; Rivera-Utrilla, J.; Sánchez-Polo, M.; Mota, A.J. Removal of parabens from water by UV-driven advanced oxidation processes. Chem. Eng. J. 2020, 379, 122334. [Google Scholar] [CrossRef]
  88. Guo, J.; Shi, H.; Huang, X.; Shi, H.; An, Z. AgCl/Ag3PO4: A stable Ag-Based nanocomposite photocatalyst with enhanced photocatalytic activity for the degradation of parabens. J. Colloid Interface Sci. 2018, 515, 10–17. [Google Scholar] [CrossRef]
Figure 1. Thermogravimetric analysis curves for TiO2 and x% rGO-TiO2.
Catalysts 10 00520 g001
Figure 2. X-ray diffractogram for graphite, GO, and rGO.
Catalysts 10 00520 g002
Figure 3. XRD patterns for rGO-TiO2 composites.
Catalysts 10 00520 g003
Figure 4. FTIR spectra of GO and rGO.
Catalysts 10 00520 g004
Figure 5. FTIR spectra of TiO2 and rGO-TiO2 composites.
Catalysts 10 00520 g005
Figure 6. Raman spectra of graphite, GO, and rGO.
Catalysts 10 00520 g006
Figure 7. Raman spectra of TiO2 and xrGO-TiO2 composites.
Catalysts 10 00520 g007
Figure 8. XPS profiles of GO and rGO: (a) C 1s spectra and (b) O 1s spectra. Continuous red line: experimental profile; discontinuous black line: fitted profile.
Catalysts 10 00520 g008
Figure 9. XPS profiles of rGO-TiO2 composites: (a) C 1s spectra; (b) O 1s spectra and (c) Ti 2p spectra. Continuous red line: experimental profile; discontinuous black line: fitted profile.
Catalysts 10 00520 g009
Figure 10. Relationship between transformed Kubelka-Munk function and light energy for TiO2 and rGO-TiO2 composites.
Catalysts 10 00520 g010
Figure 11. Photoluminescence spectra of TiO2 and rGO-TiO2 composites with different rGO percentages (excitation wavelength 264 nm).
Catalysts 10 00520 g011
Figure 12. Photodegradation kinetics of EtP under UV radiation in the presence of rGO-TiO2 composites as a function of treatment time. [EtP]0 = 0.30 × 10⁻³ mol/L, [catalyst]0 = 0.7 g/L.
Catalysts 10 00520 g012
Table 1. Textural characteristics of rGO-TiO2 and rGO-P25 composites.
SampleSBET a
(m2/g)
V0 b
(cm3/g)
V0.95 c
(cm3/g)
E0 d
(kJ/mol)
L0 e
(nm)
TiO281.50.0300.37512.91.86
4%rGO-TiO289.10.0320.28912.71.89
7%rGO-TiO297.70.0360.24214.11.70
10%rGO-TiO2106.30.0390.28214.21.69
30%rGO-TiO2141.10.0510.27315.21.58
P2557.00.0200.13815.91.52
4%rGO-P2562.00.0230.15716.11.49
7%rGO-P2566.80.0240.17116.41.46
10%rGO-P2571.40.0260.19016.81.42
30%rGO-P25115.90.0430.23617.91.37
a Surface area according to N2 adsorption isotherms at −196 °C. b Micropore volume from DR equation applied to N2 adsorption isotherms at −196 °C. c Total pore volume from N2 adsorption isotherms at −196 °C and 0.95 relative pressure. d Characteristic adsorption energy from DR equation applied to N2 adsorption isotherms at −196 °C. e Mean micropore width from DR equation applied to N2 adsorption isotherms at −196 °C.
Table 2. Data obtained from XR diffractograms on diffraction peak position (2θ), full-width at half maximum (FWHM), interplanar distance (d002), and crystal size (D002).
Carbon2θ (°)FWHM (°)D002 (nm)d002 (nm)Nsheets
Graphite26.560.2433.30.3499.3
GO10.781.535.20.826.4
rGO24.655.631.40.364.0
Table 3. Parameters obtained from XR diffractograms: diffraction peak position (2θ), full-width at half maximum (FWHM), and crystal size (D101).
Composite2θ (°)FWHM (°)D101 (nm)
TiO225.290.40919.9
4% rGO-TiO225.230.44418.3
7% rGO-TiO225.220.46417.6
10% rGO-TiO225.240.42619.1
30% rGO-TiO225.250.41419.7
Table 4. Parameters obtained from Raman spectra.
CarbonBanda D (cm−1)Banda G (cm−1)ID/IGLa
(nm)
Graphite135415820.13134.0
GO135916000.7921.2
rGO135315950.8918.8
Table 5. Parameters obtained from Raman spectra for TiO2 and xrGO-TiO2 composites.
SampleMode Eg (cm−1)Banda D (cm−1)Banda G (cm−1)ID/IGLa
(nm)
ID/IEg
TiO2146--
4% rGO-TiO2151134615970.9717.32.03
7% rGO-TiO2152134615970.9517.71.33
10% rGO-TiO2153134715960.9717.43.25
30% rGO-TiO2153134515970.9817.25.81
Table 6. C/O ratio, species percentages, bond energies (in brackets, eV), and oxygen content obtained by XPS analysis.
SampleC/OO (%)C 1s (%)
C=CC–CC–OC=O
GO3.3023.351.8(284.6)26.3(285.5)13.8(286.5)8.1(288.5)
rGO6.5213.357.8(284.6)27.6(285.5)8.0(286.6)6.7(288.4)
O 1s (%)
C=OC–OaC–ObO=C–OH
GO 23.1(531.2)48.6(532.5)18.8(533.7)9.6(534.4)
rGO 35.8(531.5)27.2(532.6)27.4(533.5)11.6(534.5)
Table 7. Ti/C, AC-O/AC-C ratios, species percentages, and bond energies (in brackets, eV) obtained by XPS analysis.
SampleTi/CAC−O/AC–C C 1s (%)
C=CC–CC–OC=O
4% rGO-TiO20.750.1862.5(284.3)22.4(285.3)6.0(286.3)9.1(288.1)
7% rGO-TiO20.770.1960.9(284.3)23.1(285.4)8.6(286.1)7.4(287.9)
10% rGO-TiO20.720.2158.0(284.5)24.3(285.7)10.1(286.4)7.6(288.0)
30% rGO-TiO20.410.2355.5(284.7)26.0(285.9)11.3(286.7)7.1(289.3)
Table 8. Experimental results obtained from EtP photodegradation under UV radiation in the presence of different rGO-TiO2 composites [EtP]0 = 0.30 × 10⁻³ mol/L, [catalyst]0 = 0.7 g/L.
Systemt1/2 a (min)t90% b (min)K c (min−1)EtP40 min d (%)TOC40 min e (%)
UV30.2100.40.02361.514.0
TiO222.475.20.03172.521.8
4% rGO-TiO210.434.40.06795.444.7
7% rGO-TiO27.223.90.09698.656.6
10% rGO-TiO217.257.40.04082.434.5
30% rGO-TiO228.996.10.02460.724.9
a Time required to halve the initial concentration of EtP. b Time required to degrade 90% of the initial concentration of EtP. c Degradation rate constant. d Percentage degradation after 40 min. e Percentage mineralization after 40 min.
Table 9. Experimental results obtained from EtP photodegradation with the UV/rGO-P25 system. [EtP]0 = 0.30×10⁻³ mol/L. [catalyst]0 = 0.7 g/L.
Systemt1/2 (min)t90% (min)k (min−1)EtP40 min (%)
UV30.2100.40.02361.5
P25 28.193.30.02564.5
4% rGO-P2521.972.90.03274.4
10% rGO-P2534.5114.60.02053.6

