Article

Solar Degradation of Sulfamethazine Using rGO/Bi Composite Photocatalysts

by
María Fernández-Perales
1,
Marisa Rozalen
1,*,
Manuel Sánchez-Polo
1,
José Rivera-Utrilla
1,
María Victoria López-Ramón
2,* and
Miguel A. Álvarez
2
1
Department of Inorganic Chemistry, Faculty of Science, University of Granada, 18071 Granada, Spain
2
Department of Inorganic and Organic Chemistry, Faculty of Experimental Science, University of Jaen, 23071 Jaen, Spain
*
Authors to whom correspondence should be addressed.
Submission received: 6 May 2020 / Revised: 15 May 2020 / Accepted: 18 May 2020 / Published: 20 May 2020
(This article belongs to the Special Issue Photocatalytic Degradation of Organic Wastes in Water)

Abstract

:
Heterogeneous photocatalysts for water decontamination were obtained by the optimized synthesis of bismuth-functionalized reduced graphene oxide (rGO/Bi) using the Hummer method and microwave treatment. Sulfamethazine (SMZ) was used as model pollutant to evaluate the photocatalytic efficacy. Photocatalysts were characterized by VP-SEM, HRTEM, XDR, XPS, RAMAN, and FTIR analyses, which confirmed the effective reduction of GO to rGO and the presence of bismuth as a crystalline phase of Bi2O3 polydispersed on the surface. Their performance was influenced by the rGO/Bi ratio, microwave temperature, and treatment time. The as-obtained 5%rGO/Bi composite had the highest photocatalytic activity for SMZ degradation under visible light irradiation (λ > 400 nm), achieving 100% degradation after only 2 h of treatment. The degradation yield decreased with higher percentages of rGO. Accordingly, the rGO/Bi catalysts efficiently removed SMZ, showing a high photocatalytic activity, and remained unchanged after three treatment cycles; furthermore, cytotoxicity tests demonstrated the nontoxicity of the aqueous medium after SMZ degradation. These findings support the potential value of these novel composites as photocatalysts to selectively remove pollutants in water treatment plants.

1. Introduction

Sulfamethazine (SMZ) is an anti-infective agent used as antibiotic in human and veterinary medicine against bacteria responsible for bronchitis and prostatic and urinary tract infections, among others. The strong antimicrobial activity, stable chemical properties, and low cost of SMZ have led to its widespread utilization [1,2]. However, prolonged exposure to low concentrations of antibiotics in water can be cytotoxic or promote resistance to bacterial strains, posing a major public health challenge [3].
Advanced oxidation processes (AOPs) have proven effective to oxidize compounds resistant to conventional biological treatments, minimizing the discharge of these contaminants into the environment [4,5]. Heterogeneous photocatalysis is an AOP that benefits from the easy preparation of photocatalysts, their reusability, and their selectivity against contaminants. Photocatalysis induced by visible light offers further advantages, given the hazard-free and sustainable nature of sunlight and its inexhaustible supply.
Graphene and its nanoderivatives have been widely studied over recent decades, and photocatalysts formed by graphene and transition metal oxides (ZnO, TiO2, CdS, ZnS, CeO2, etc.) have proven highly effective [6,7,8]. Graphene sheets act as an efficient electron acceptor, improving photoinduced charge transfer, hindering charge carrier recombination, and increasing photocatalytic activity [9]. It has been found that the utilization of reduced graphene oxide (rGO) as a solid support for the photocatalyst can modify its morphological nanostructure and energy band, changing its photocatalytic activity against different contaminants [10].
Among different metals studied in this context, bismuth has been widely selected for its good electrochemical properties, reduced cross-section for neutron absorption, nontoxicity, and low cost. However, despite the promise shown by rGO/Bi composites, there has been little research on their synthesis as supercapacitors [11,12,13,14], electroactive materials for heavy metal analysis [15,16,17,18,19], or photocatalysts for compound degradation [20,21,22,23,24]. Studies on their application as photocatalysts have emphasized the importance of the graphene synthesis method, reduction method, bismuth salt type, and rGO/Bi ratio for optimal results.
The reduced composite rGO/Bi has been produced by various methods, including chemical, thermal, or electrochemical reduction. Chemical reduction requires elimination of the reagents, which is often impossible to fully achieve, contaminating the resulting product [25]. Among methods used for thermal reduction, microwaving offers the transfer of energy in a short time period, facilitating low-cost mass production, and achieves close contact between the components [20,26,27].
With this background, the main purpose of this study was to synthesize novel high-performance photocatalysts based on Bi and rGO using the Hummer method and microwave treatment. The rGO/Bi catalysts obtained were extensively characterized to determine their structural, surface, and electronic properties. SMZ degradation by solar radiation was measured in the presence of these composites, and the cytotoxicity of their byproducts was evaluated. The reuse of the photocatalysts was also studied.

2. Results and Discussion

2.1. Characterization of Materials

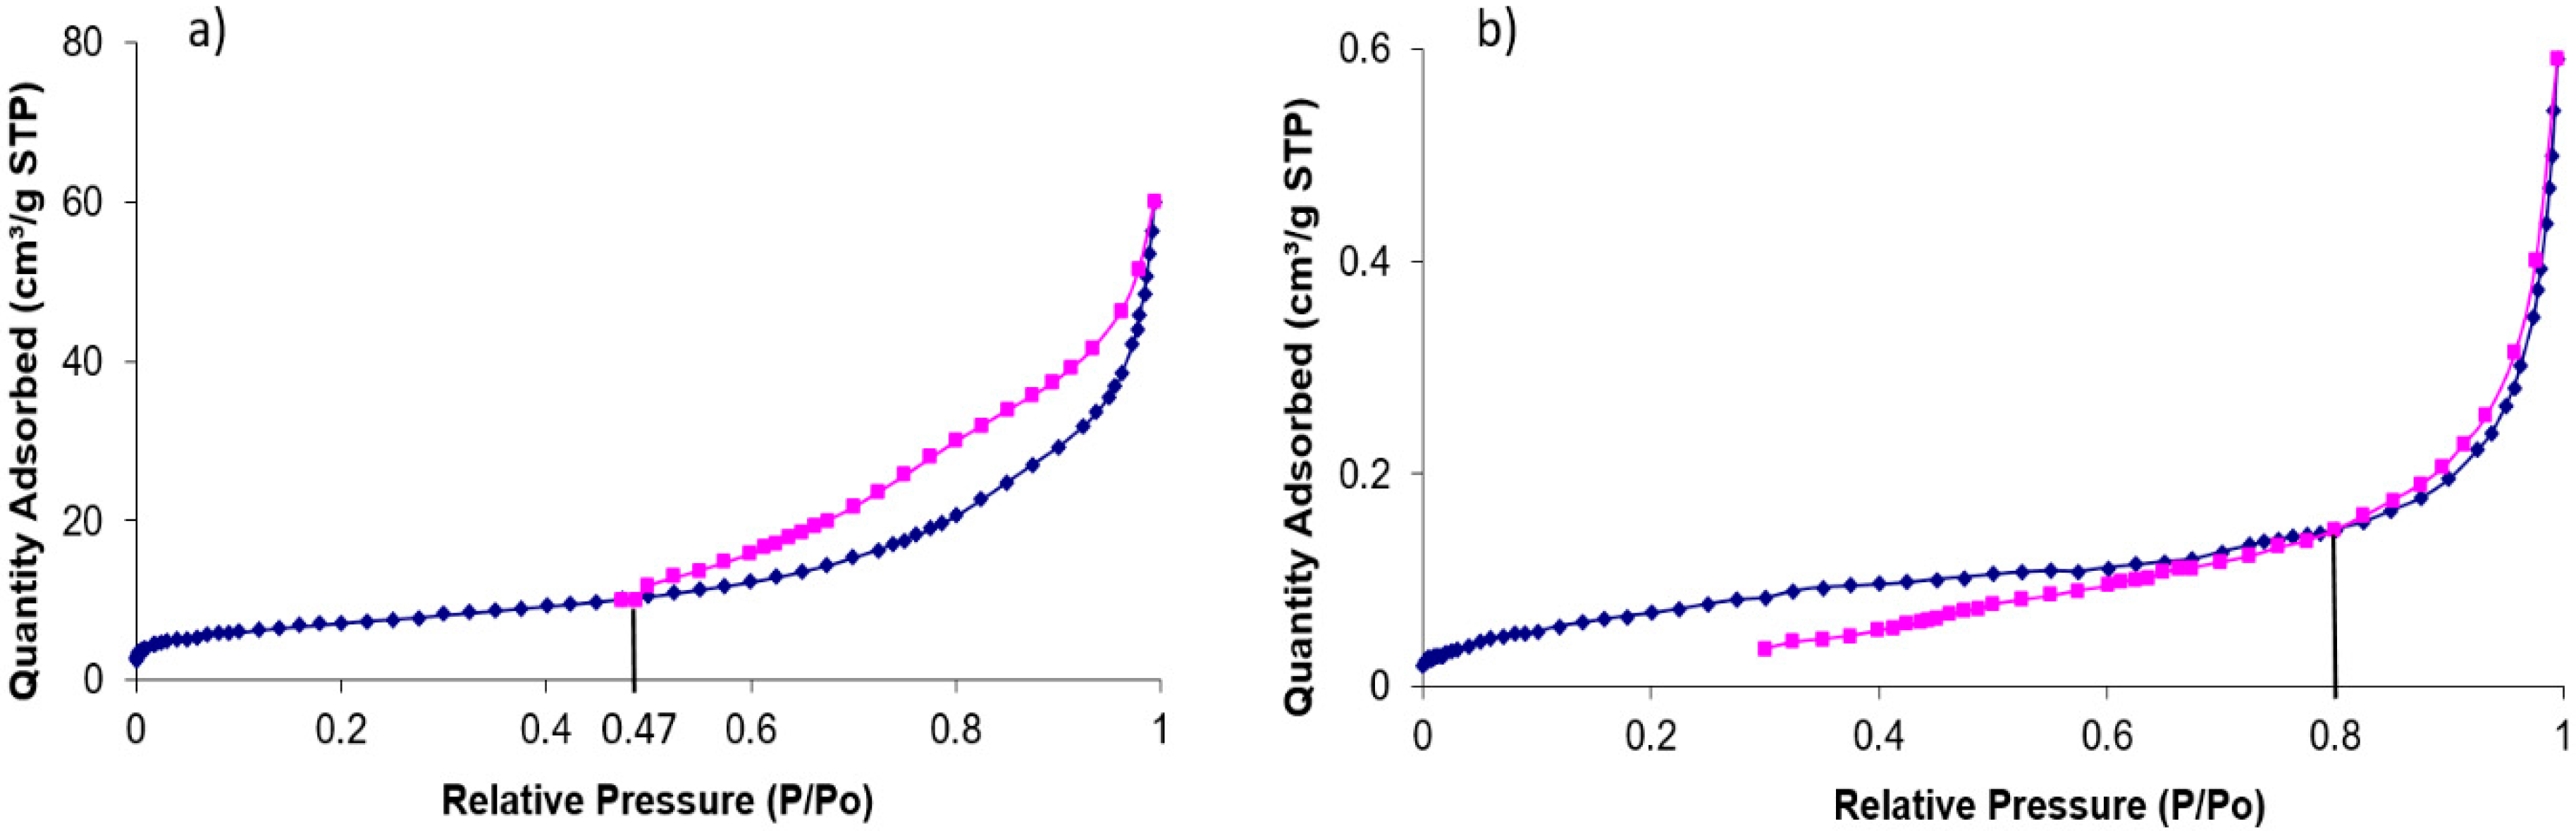
2.1.1. Surface Area Measurements

The surface area of the photocatalyst was studied because it is proportional to the active surface and therefore to the active sites where charge carriers are housed before recombination [28]. Table 1 exhibits the surface areas and pore volumes of the materials under study.
It can be observed that the original graphite has a surface area of 24 m²/g and that the synthesis of GO produces a marked increase to 114 m²/g, in agreement with Guo et al. [29]. However, reduction produces a significant decrease in surface area to 16 m²/g. Bismuth subnitrate has a very small surface area of 0.27 m²/g and is a nonporous material. The surface area of the composites ranges between 17 and 26 m²/g, in accordance with previous reports [30], and the corresponding isotherms are type IV (Figure 1), indicating that the material is not porous. The increase in surface area of the composites with respect to the original bismuth salt is due to the introduction of GO and the improved dispersion of bismuth subnitrate on the GO surface.

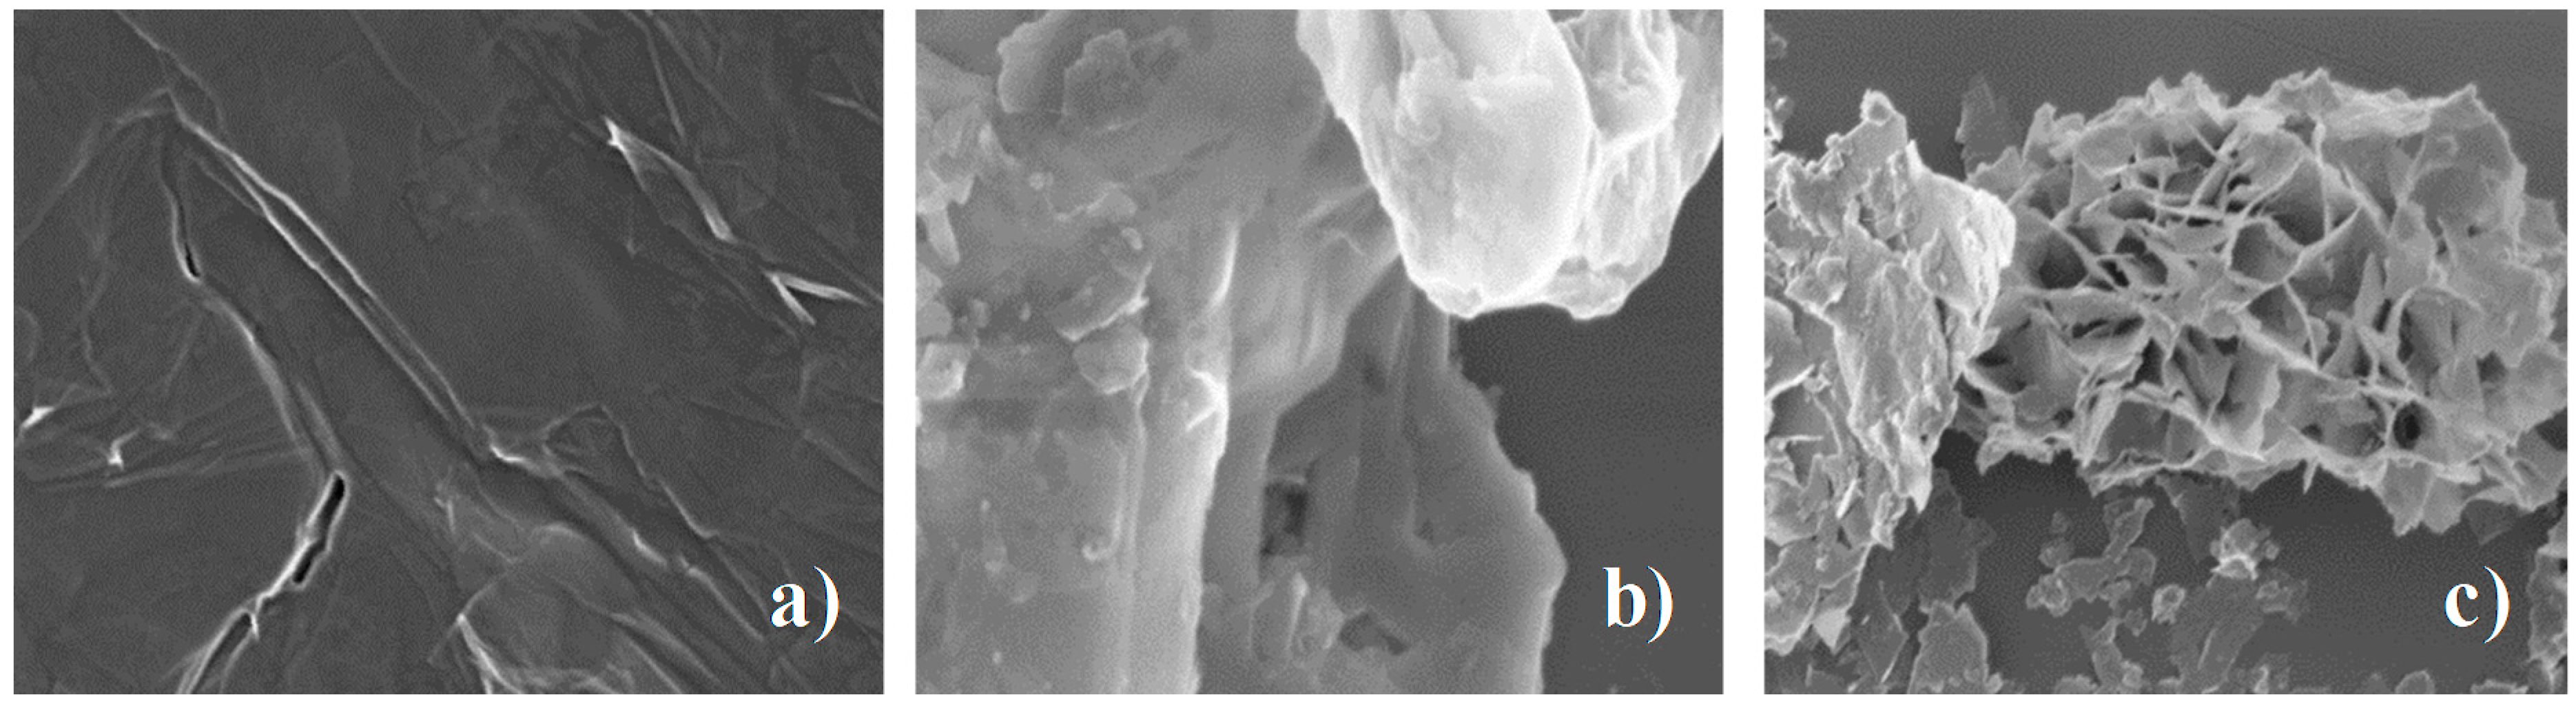
2.1.2. Morphological Structure

The microstructure of composites was characterized by VP-SEM and HRTEM. VP-SEM images of GO and 5%rGO/Bi are depicted in Figure 2 as examples. Samples were prepared in silicon wafers and observed at low voltage (5 kV) to obtain clear images. The image of GO (Figure 2a) shows a typical lamellar structure, with a few folder regions on a smooth basal plane. Images in Figure 2b,c correspond to the 5%rGO/Bi composite, in which rGO sheets are randomly ordered and the structure is stratified. Energy-dispersive X-ray spectroscopy (EDX) data (results not shown) demonstrate the presence of C, O, and Bi in this sample.
HRTEM images (Figure 3a) confirm the morphology of the composites revealed by VP-SEM and the presence of polydispersed bismuth throughout the structure (Figure 3b). The SAED image in Figure 3c also shows the presence of a crystalline phase of bismuth in the rGO matrix with d-spacings of 3.26, 2.70, and 1.95 Å, corresponding to the planes (120), (121), and (223) of Bi2O3 (JCPDS card No. 76−1730).

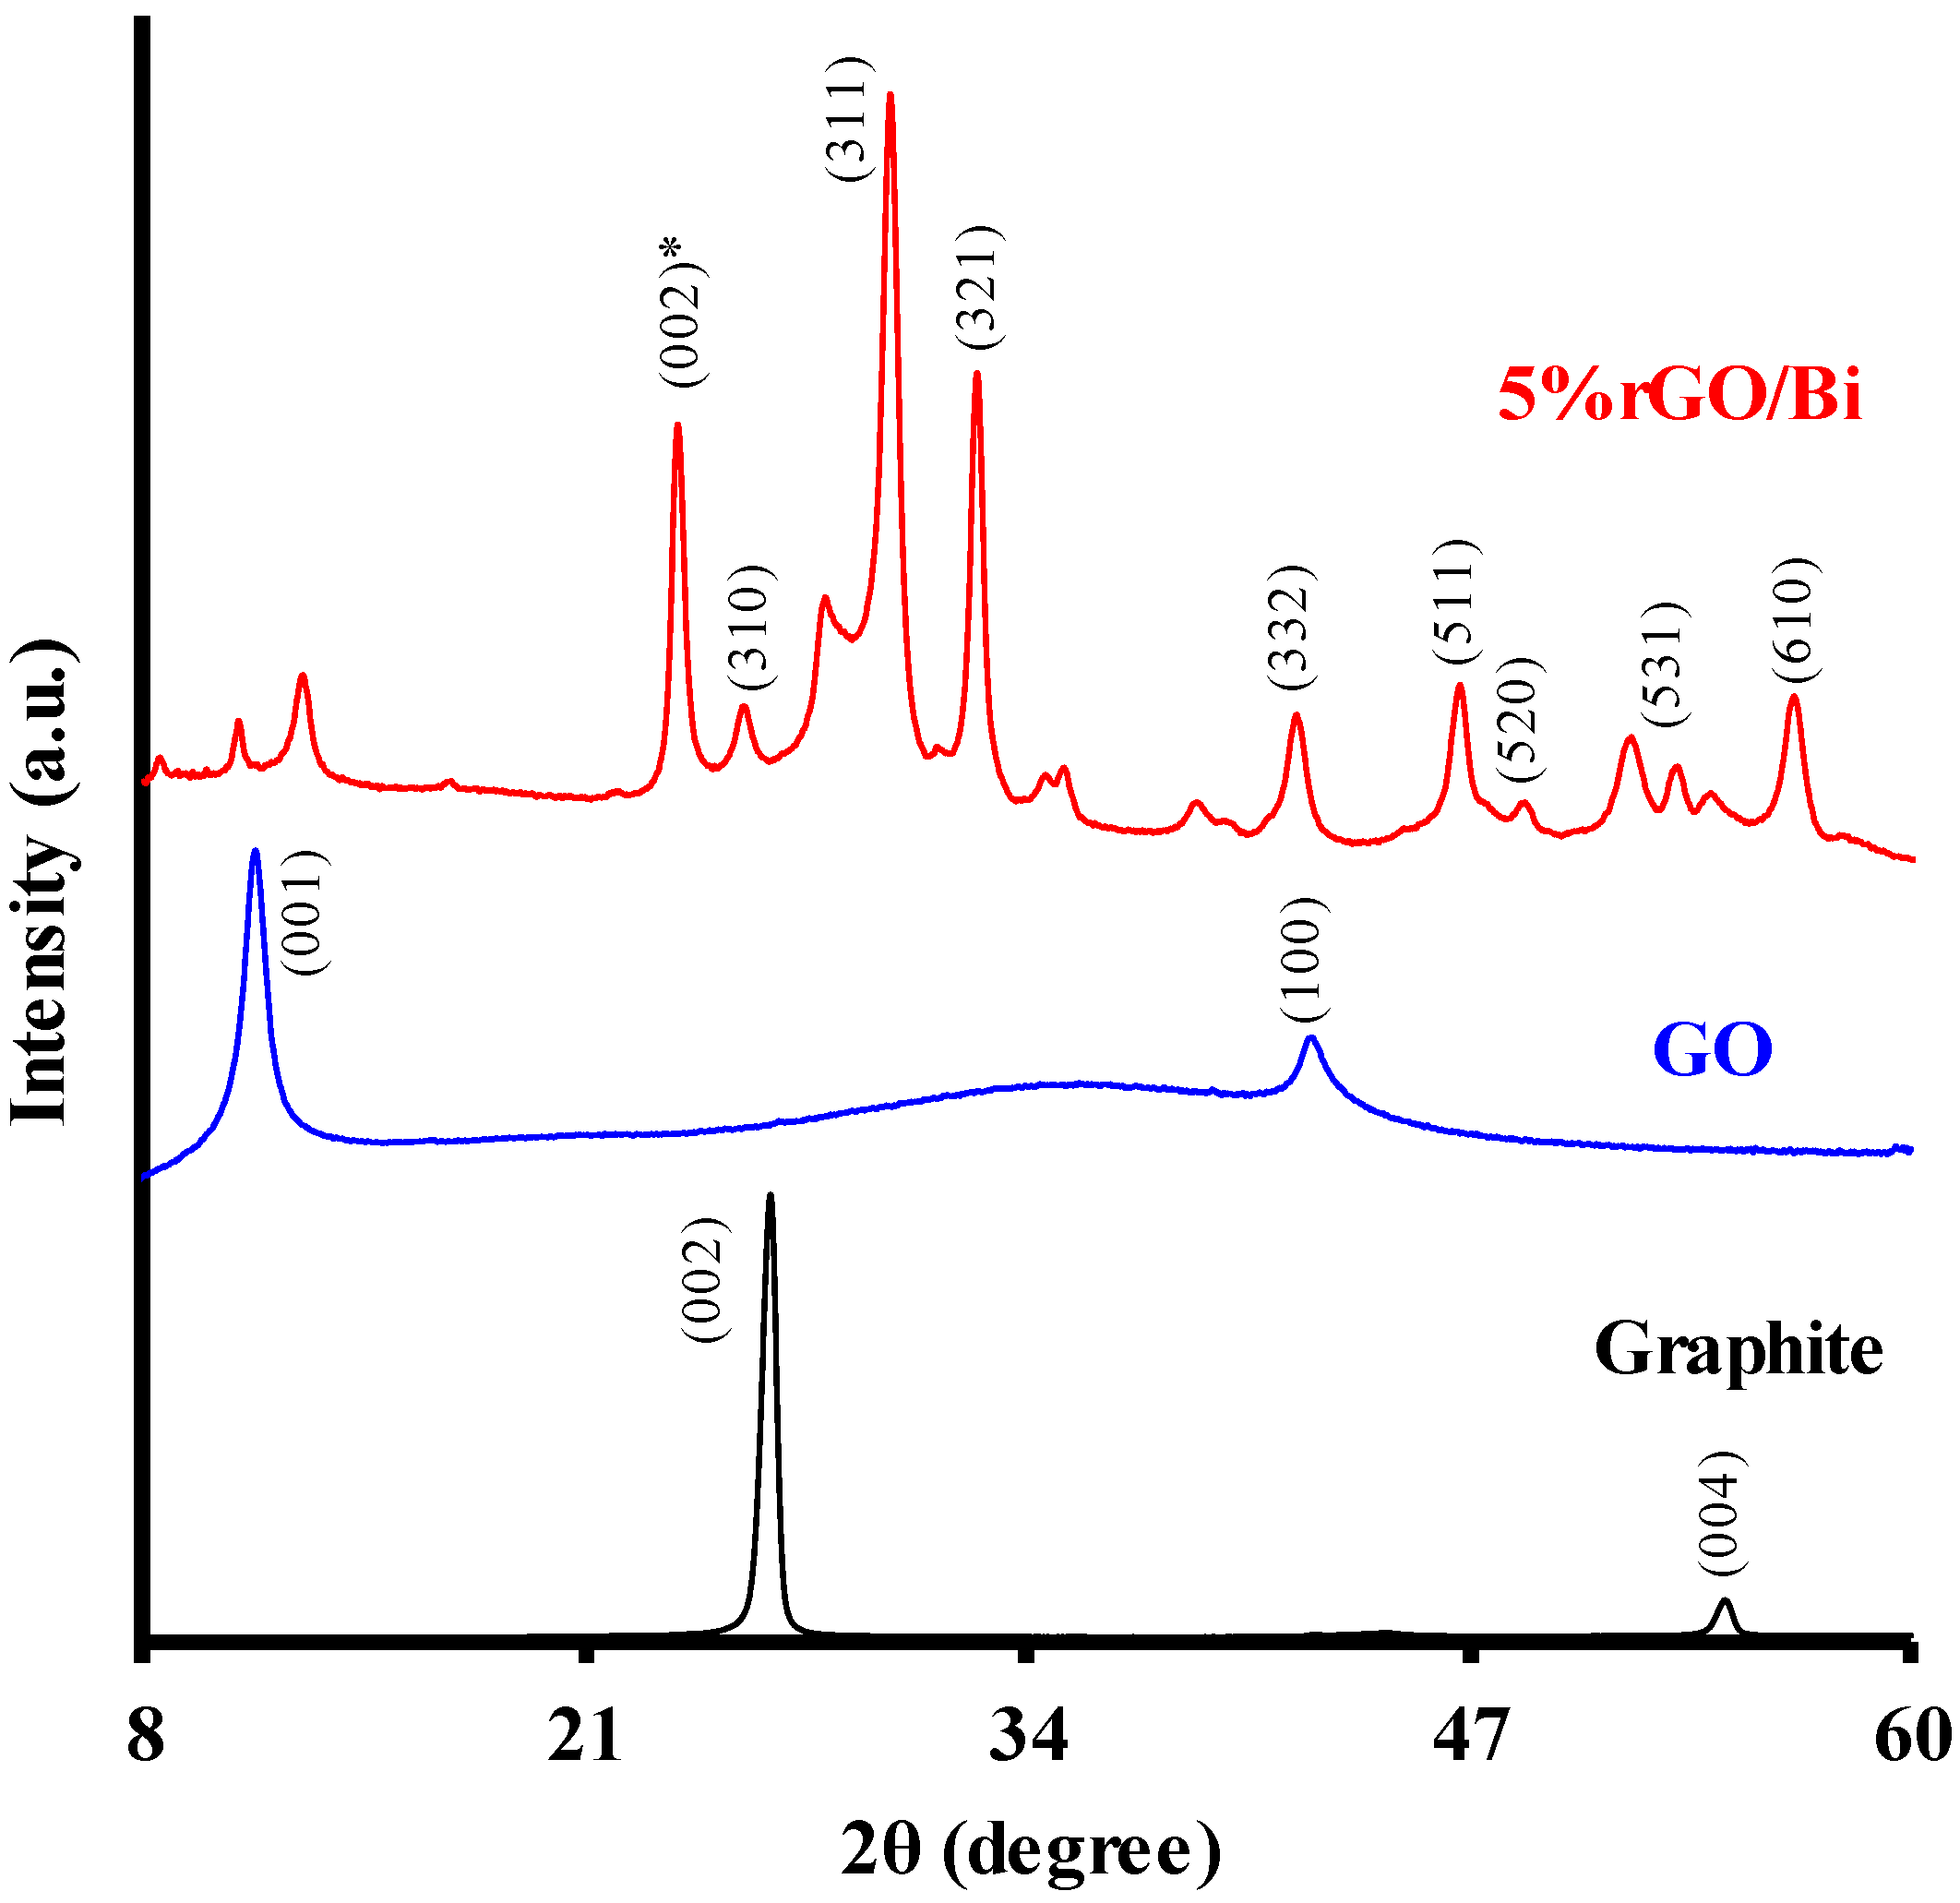
2.1.3. X-Ray Diffraction Analysis

The crystallographic nature of the resulting composites is demonstrated in the XRD patterns depicted in Figure 4, showing the transformation of graphite powder to GO as a sharp reflection at around 26.4°, corresponding to the interspacing distance between graphite layers. According to Bragg’s law, this distance is 3.37 Å, similar to previous reports [31]. After oxidation, the reflection is broader and shifts to a lower angle of around 10.24° (Figure 4), corresponding to a between-layer distance of 7.98 Å. This results from loss of the ordered lattice structure in graphite sheets due to the formation of functional oxygen groups [32].
The XRD pattern shows marked changes after the addition of Bi salt and reduction of GO. The reduction is confirmed by the plane in (002)*, characteristic of rGO, and the formation of Bi2O3 and rGO/Bi nanocomposites is demonstrated by the characteristic planes in (310), (311), (321), (332), (511), (520), (531), and (610). The diffraction pattern of Bi2O3 shows that all peaks can be indexed as the cubic crystal structure of γ-Bi2O3 (JCPDS N° 6-312), which is supported by the SAED results. Application of the Scherrer equation revealed that the average crystal size for 5%rGO/Bi composite is 17.9 nm. It should be noted that, depending on the rGO/Bi ratio, the main peak intensity decreases with higher %rGO, indicating a reduction in the crystallinity of the composites.

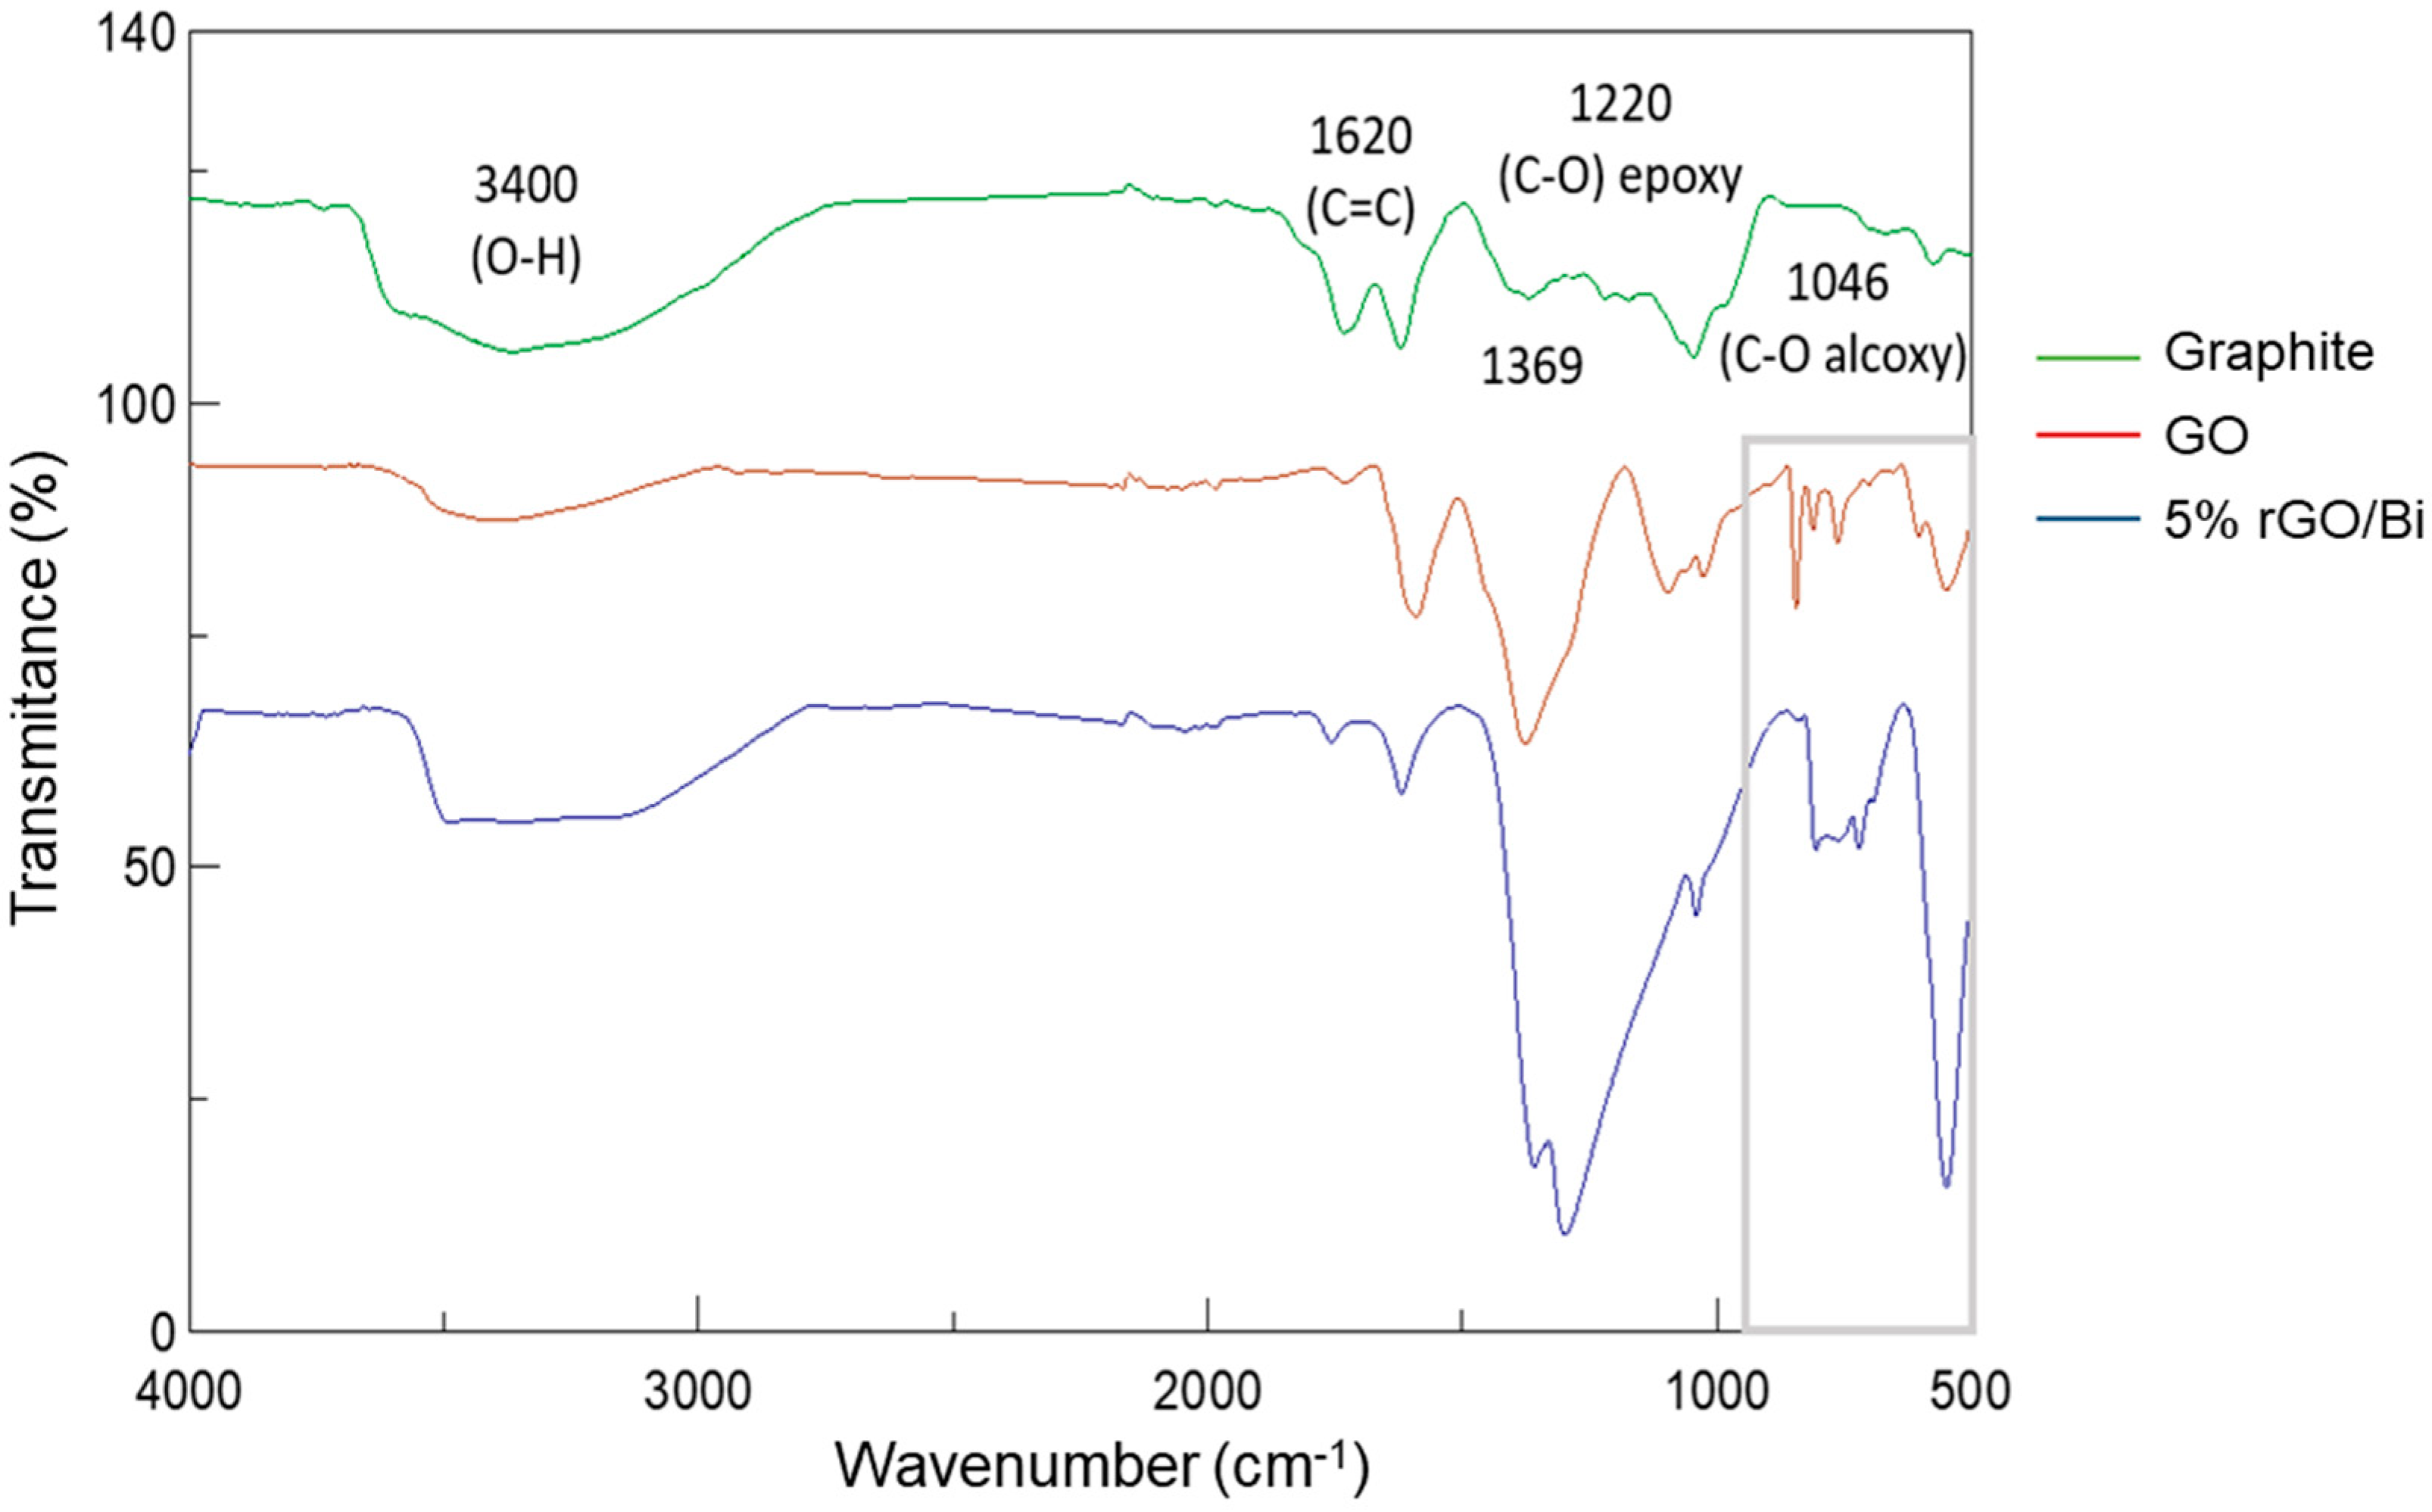
2.1.4. FTIR Spectroscopy Analysis

Figure 5 depicts the FTIR spectra of graphite, GO, and 5%rGO/Bi samples. The spectrum of GO shows a broad band of absorption at 3400 cm−1, related to the stretching and bending vibrations of O–H groups on the GO surface [33]. The bands located at 1710 and 1620 cm−1 correspond to the stretching vibrations of the C=O bonds of COOH groups and C=C bonds, respectively. The bands at 1220, 1046, 1369 cm−1 are the stretching vibration peaks of C–O (epoxy) and C–O (alkoxy) and the deformation peak of O–H, respectively, evidencing the presence on the GO of different types of oxygen-containing functional groups, including –COOH, –C–OH, –C=O, and –C–O–C.
Spectrum of the bismuth nanocomposite reveals a significant decrease in the stretching vibration of C=O groups at 1729 cm−1, confirming the disappearance of most of the oxygen functionalities in GO and its reduction. The peaks below 1000 cm−1 can be attributed to Bi–O metal–oxygen vibrations, demonstrating that bismuth is well functionalized on the rGO surface [34].

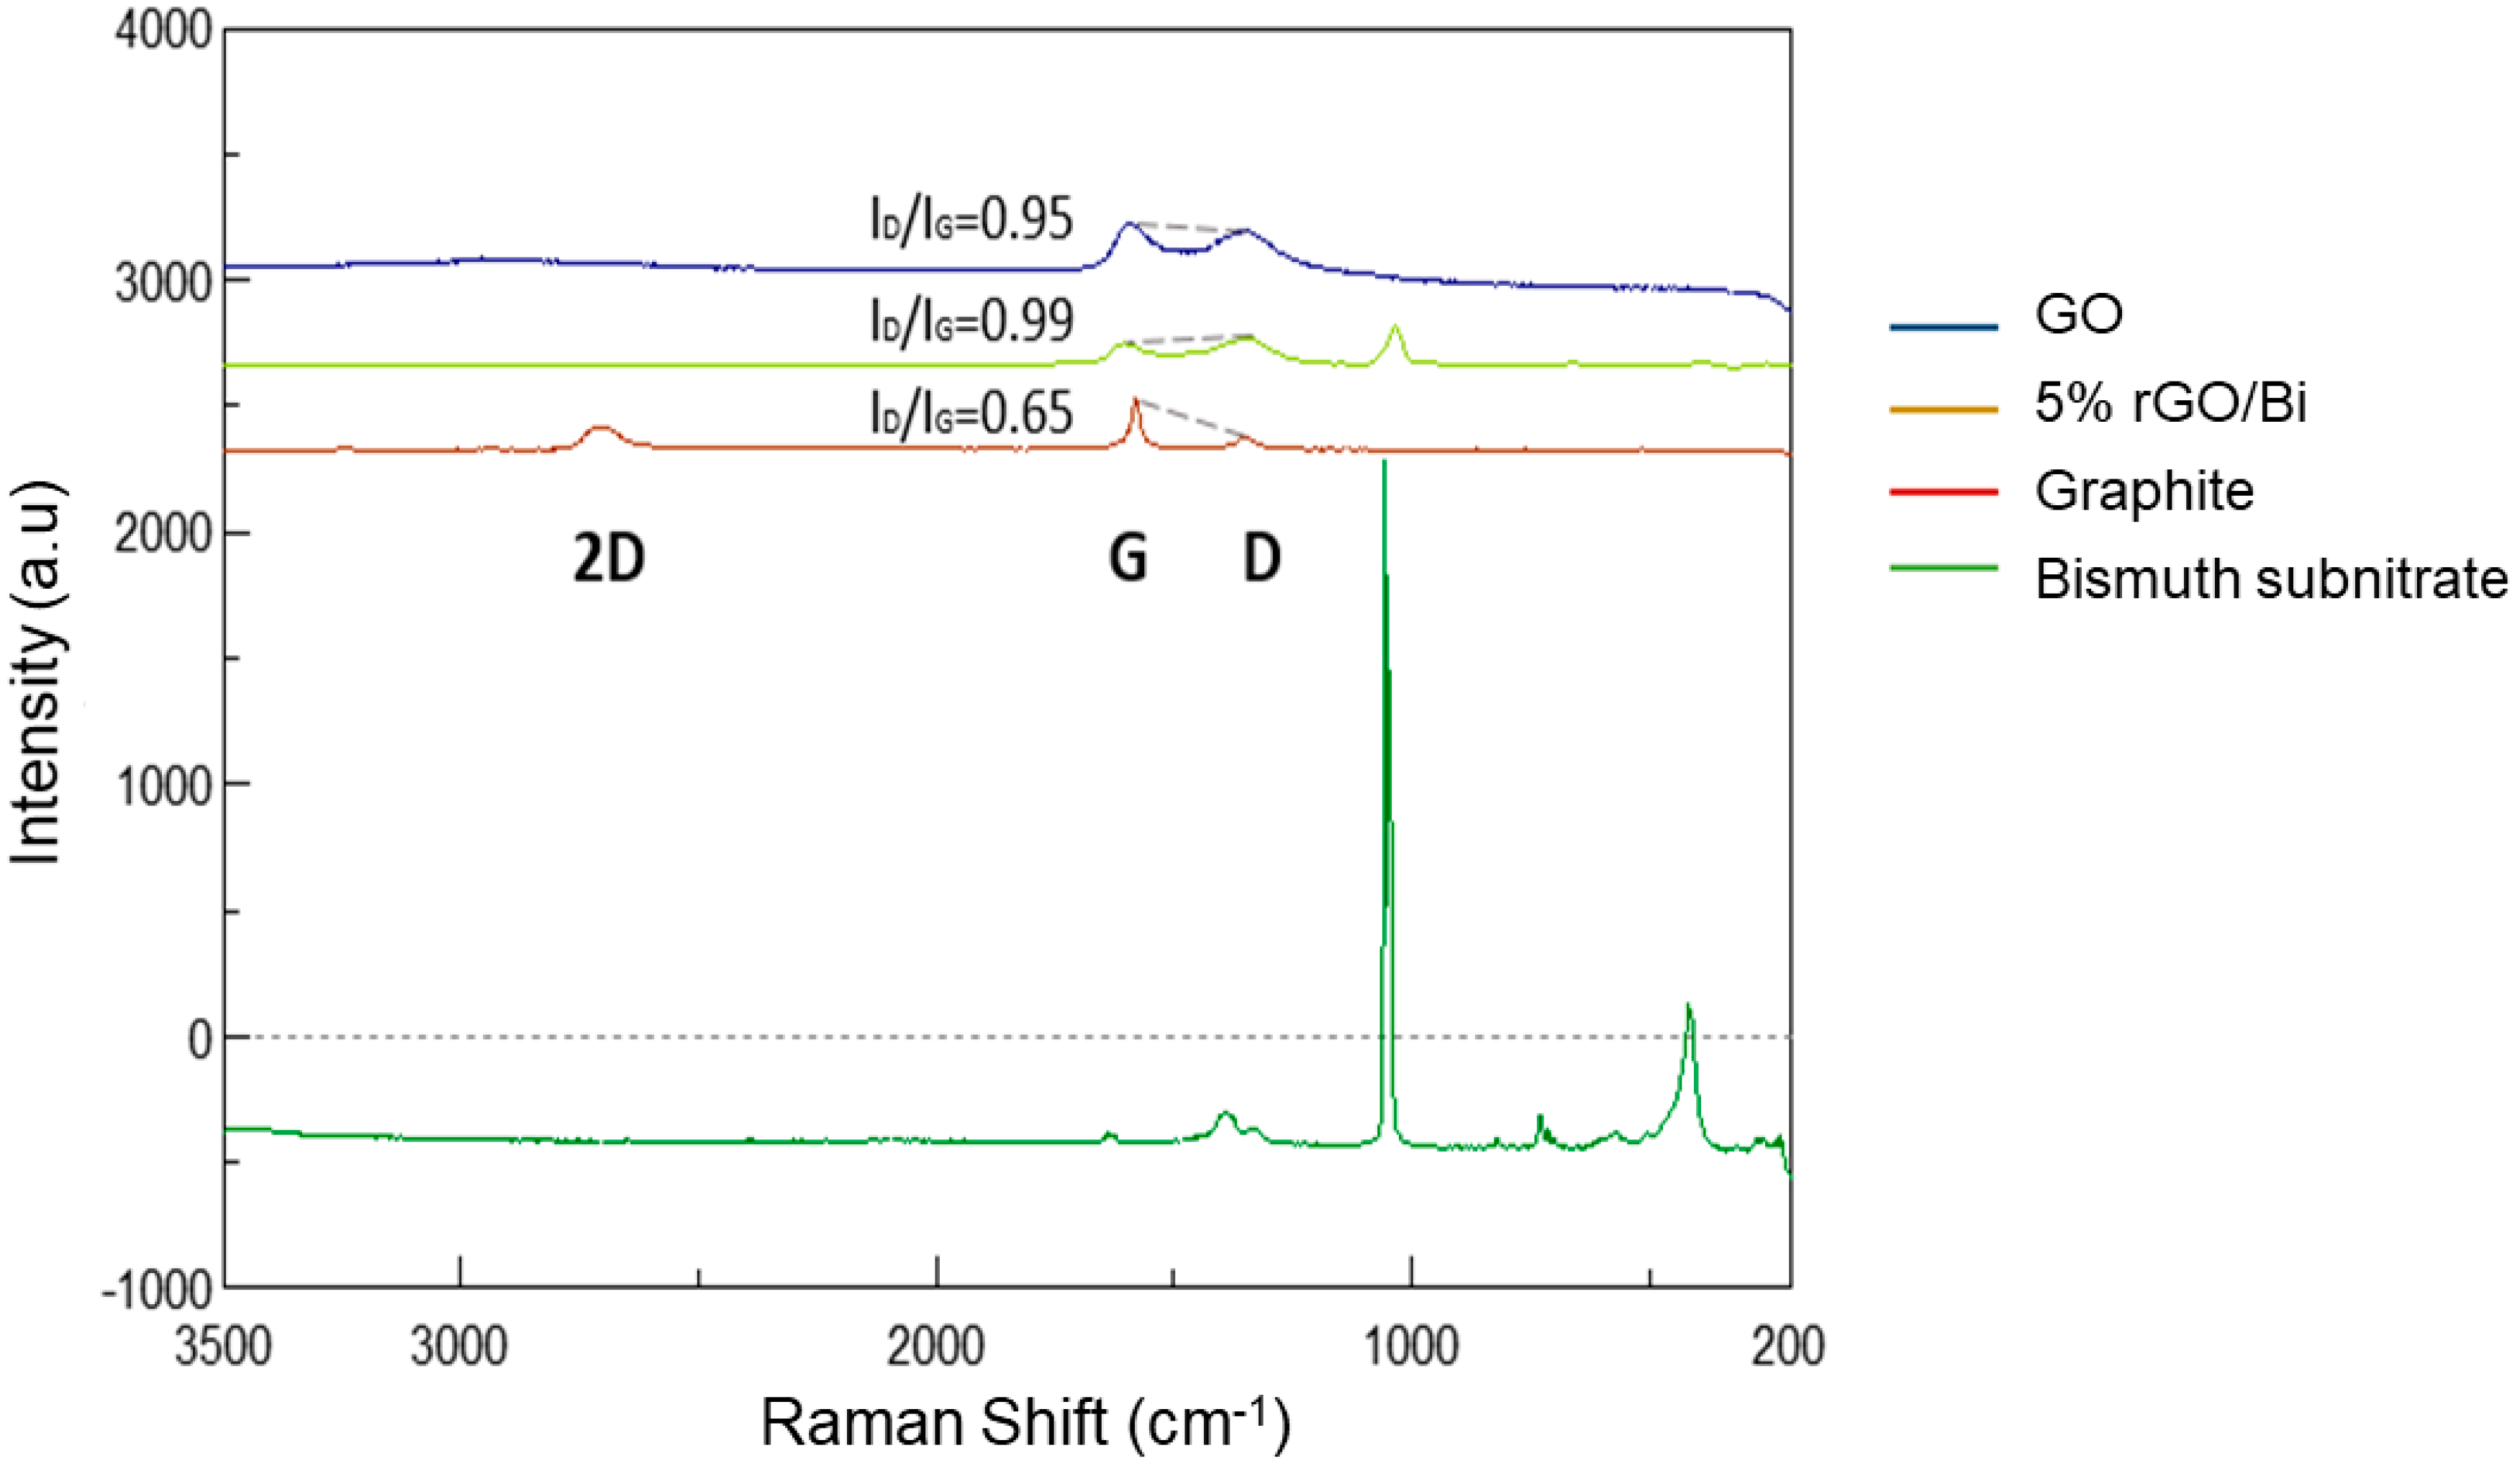
2.1.5. Raman Spectroscopy Analysis

The significant structural changes during the synthesis of rGO/Bi composites are reflected in their Raman spectra. Figure 6 depicts the Raman spectra of GO, 5%rGO/Bi, graphite, and bismuth subnitrate.
The Raman spectra of graphite have three main bands: D band at 1351 cm−1, associated with graphite defects or imperfections; G-band at around 1588 cm−1, due to interphase vibration of the graphite lattice and first-order scattering of the E2g mode [35,36]; and G’ band or 2D band at around 2707 cm−1, associated with a second-order D band and corresponding to the bulk graphite [37]. All bands undergo changes during the transformation from crystalline graphite to GO.
Graphite shows a well-defined graphitic structure due to the low ratio (0.65) of D-band intensity to G-band intensity, ID/IG. After oxidation of graphite to GO, the G band broadens and shifts to 1587 cm−1 and the D band becomes more prominent, indicating the reduced size of sp2 planes. The ID/IG ratio significantly increases to 0.95 because of the higher concentration of functional oxygen groups on its surface, with a shift from sp2 C–C to sp3 C–C bonds.
Thermal treatment of GO to obtain rGO increases the ID/IG ratio to 0.99 due to elimination of oxygen functional groups by the reducing treatment and re-establishment of the conjugate graphene network, shifting the G band to 1608 cm−1. This change indicates a decrease in the average size of sp2 domains through the reduction of exfoliated GO [38], explained by the creation of numerous new graphitic domains that are smaller than those in the exfoliated GO and have a greater number of leaves. When GO is reduced to obtain rGO/Bi composites, there is a decrease in the D band, whose maximum changes to 1332 cm−1. In addition, the band around 1031 cm−1 is associated with the inclusion of Bi [39]. These Raman spectral results are consistent with previous reports [40,41] and indicate that GO in rGO/Bi is well deoxygenated and reduced to graphene, which can accelerate electron transfer and thereby increases SMZ degradation.

2.1.6. XPS Analysis

X-ray photoelectron spectra (XPS) were also supplemented to analyze the chemical composition and surface electronic state of the composites. Figure S1 (Supplementary Material) depicts the results obtained for GO, rGO, and the 5%rGO/Bi composite. Figure S1d shows the XPS spectrum of wide sweep range, evidencing the presence of C, O, and Bi in the 5%rGO/Bi sample, with atomic concentrations of 44.25%, 38.49%, and 17.26%, respectively. The C1s signal at 284 eV is mainly due to the presence of rGO on the surface. Oxygen is efficaciously removed from the structure during the reduction process, as shown by the decrease from 36.95% to 17.57%. Figure S1a,c displays the XPS spectra in the C1s and Bi4f regions, respectively, used to evaluate the binding behavior of the main elements in the GO and rGO nanocomposite samples. The C1s spectrum of GO can be decomposed into five peaks, corresponding to C–C/C=C (284.3 eV), C–H (285.3 eV), C–O (286.7 eV), C=O (287.7 eV), and O–C=O (288.5 eV). Peaks related to C–O and C=O groups are significantly decreased in the adjusted curves of C1s regions for the rGO and synthesized composites. The contribution of sp2 C is greater after the synthesizing treatment, increasing from 29.03% for GO to 57.30% for the composites. This effect is confirmed by the Raman spectroscopy results, demonstrating that the thermal reduction of GO leads to the recovery of sp2-hybridized carbon structures.
The deconvolved XPS spectrum of O1s for 5%rGO/Bi shows three peaks at binding energies of 530.0, 531.3, and 532.3 eV, corresponding to O2 in the Bi2O3 network, adsorbed surface oxygen species (e.g., OH or O defect oxide), and CO groups, respectively.
Deconvolution of the Bi4f signal reveals the presence of two doublets, with the Bi4f7/2 component centered on 158.1 eV, corresponding to Bi(III), and 159.1 eV, attributable to the formation of Bi(V). The binding energies of Bi4f7/2 and Bi4f5/2, detected at 158.1 and 163.9 eV, respectively, are typical for Bi(III) cations. The doublet at 159.1 eV (4f7/2) and 164.1 eV (4f5/2) is attributable to Bi(V). These results suggest that the Bi2O3 phase generated by decomposition of the bismuth subnitrate interacts with oxygen during the synthesizing process, with partial oxidation of Bi(III) to Bi(V).

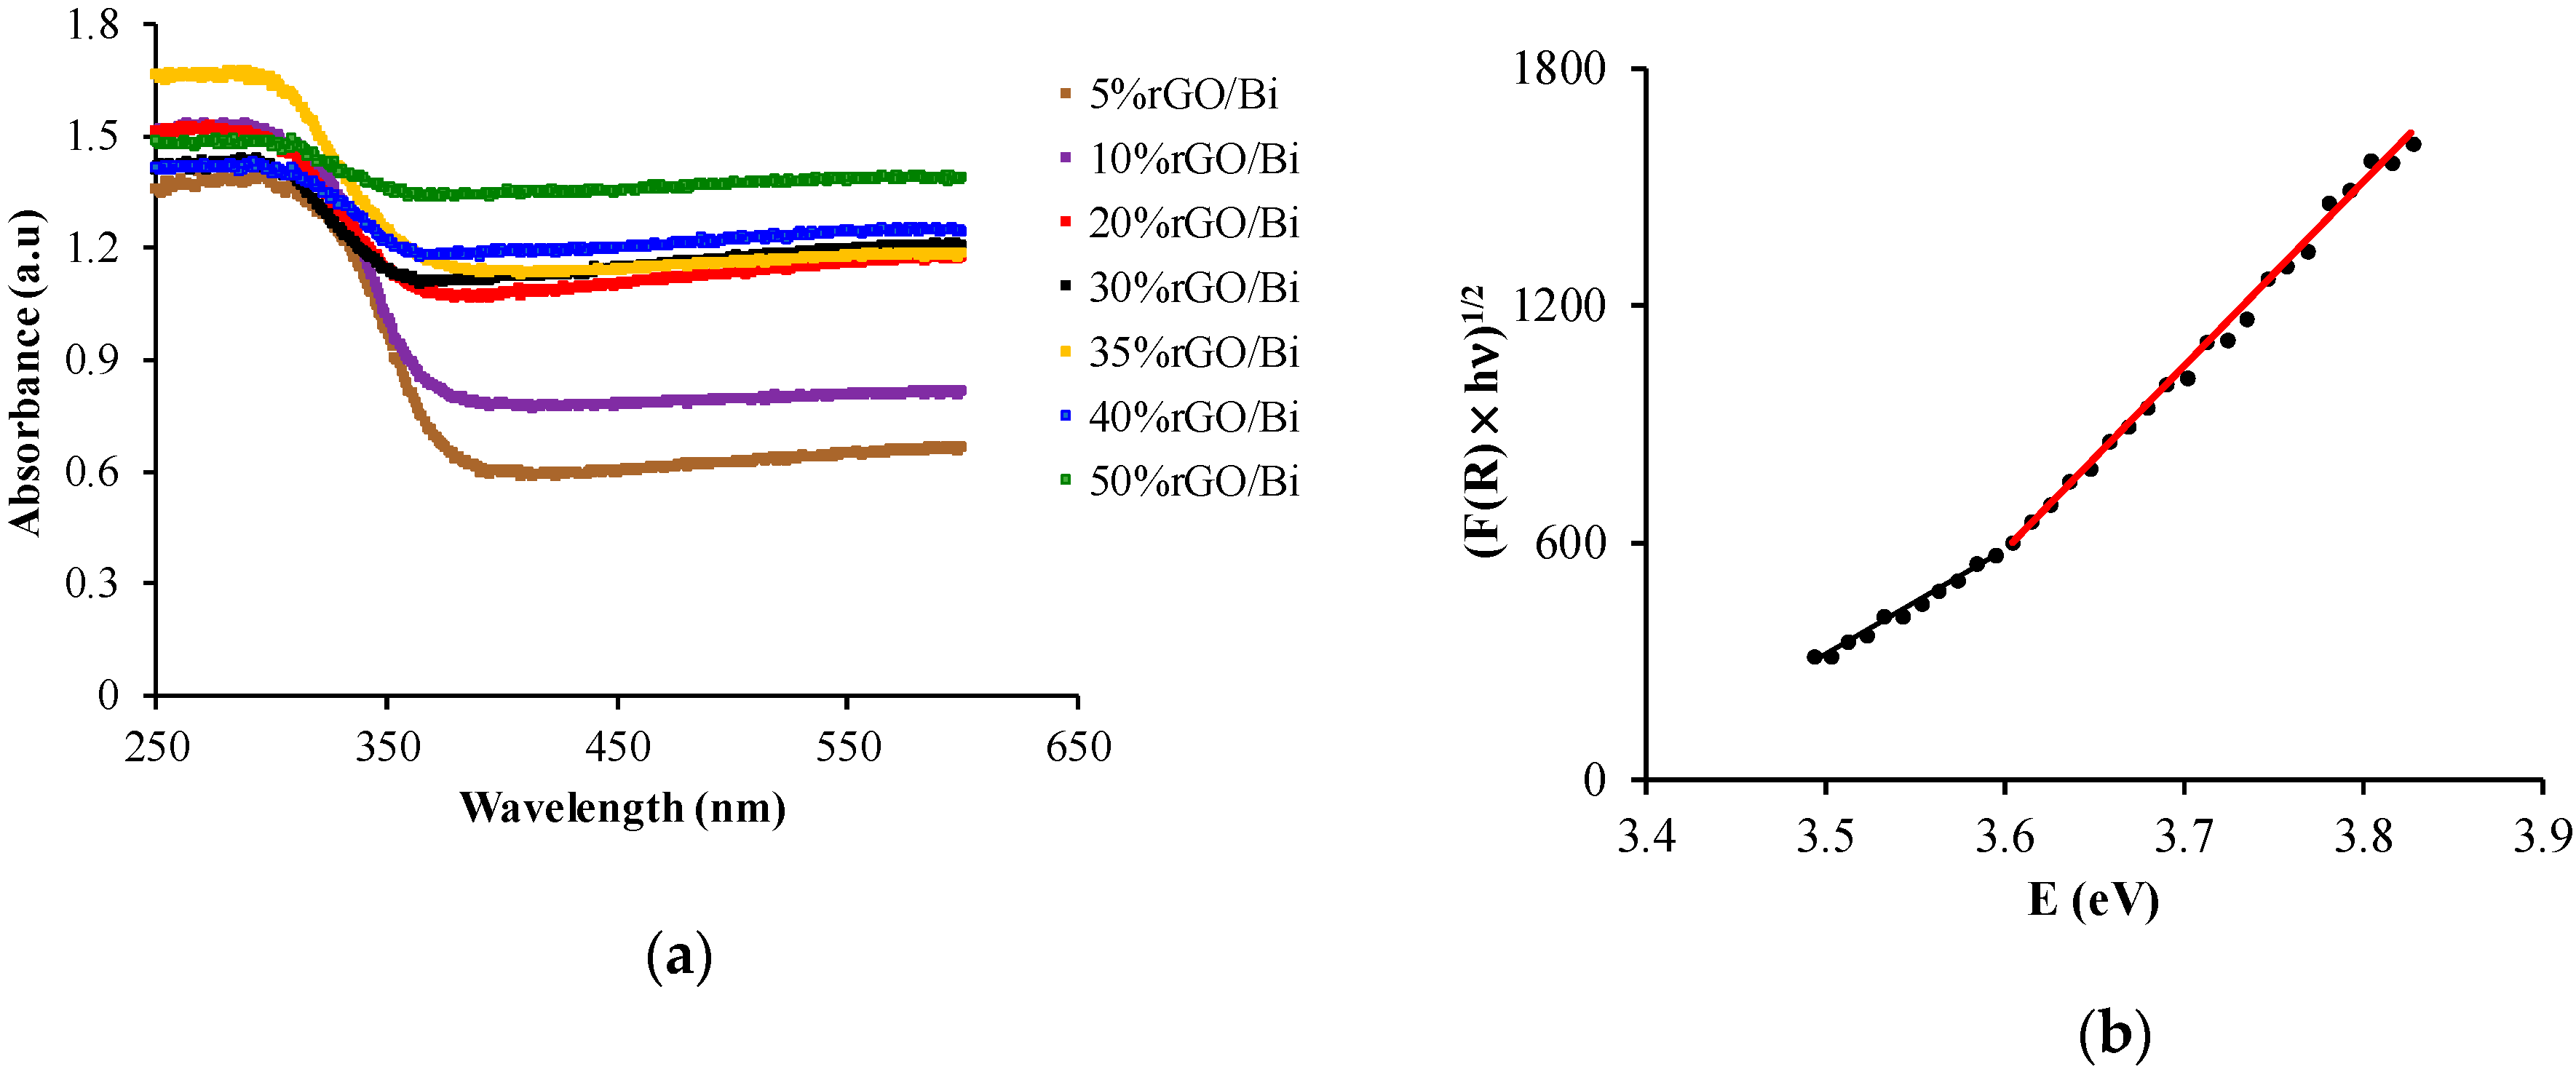
2.1.7. UV–Visible Spectra

Electronic band structures were studied by UV–Vis–IR DRS, applying the equation of Kubelka–Munk (Equation (1)) [42,43]:
F ( R ) = ( 1 R ) 2 2 R = k S
where F(R) is the Kubelka–Munk function, corresponding to absorbance; R is the reflectance of an infinite-thickness sample with respect to a standard (barium sulfate) for each measured wavelength; k is the absorption coefficient; and S is the dispersion coefficient. Assuming a constant material dispersion in the studied wavelength range, Equation (2) depends on the absorption coefficient alone, hence F(R) = α. It has been demonstrated in different transition mechanisms that the incident photons and Eg of the material always maintain the following relationship in the absorption process:
α ×   h ν = C   ( h ν E g ) n
where α is the linear absorption coefficient of the material; h is Planck´s constant (4.136 × 10⁻¹⁵ eV/s); C is the model adjustment constant; hν is the photon energy (eV); Eg is the band-gap energy (eV); and n is the optical transition constant, with values of n = 2 for permitted indirect transitions, n = 3 for forbidden indirect transitions, n = 1/2 for permitted direct transitions, and n = 3/2 for forbidden direct transitions.
The value of Eg can be determined by plotting (F(R) × )1/n against (i.e., Tauc plot). The slope obtained is extrapolated to the x-axis () to obtain the optical band gap value, considering n = 2 in accordance with a previous report [44]. In addition, a double linear adjustment was performed to minimize the adjustment error, with the Eg value being the point of intersection of the two lines [45].
UV spectrum analysis of rGO/Bi composites shows strong absorption in the ultraviolet and visible region (Figure 7a). It can also be observed that, in general, an increase in the rGO content of composites increases their absorbance, which may be due to the reintroduction of black body properties typical of graphite-like materials, indicating that GO in rGO/Bi has been well deoxygenated and reduced to graphene [46]. Besides the contribution from rGO, the absorbance is also increased by the higher surface electric charge of the oxides and the change in electron–hole pair formation during irradiation. Hence, graphene plays a multifunctional role in rGO/Bi, including enhancement of the absorption cross-section in the visible region and promotion of the interfacial charge transfer, which can provide photocatalytic active centers for pollutant degradation.
Figure 7b plots the transformed Kubelka–Munk function against light energy for sample 5%rGO/Bi as an example. Table 2 (band gap energies for rGO/Bi composites) shows that the band gap for rGO/Bi composites significantly increases with greater rGO content up to 35% rGO but then decreases at higher percentage rGO levels. These results demonstrate the influence of rGO on the optical characteristics of Bi2O3, and it can be attributed to the formation of Bi–O–C bonds in the composites during hydrothermal treatment, similar to observations in other materials [47]. With regard to the temperature and treatment time, the lowest band gap energy is observed for the composite synthesized at 140 °C for 12 h (Table 3).

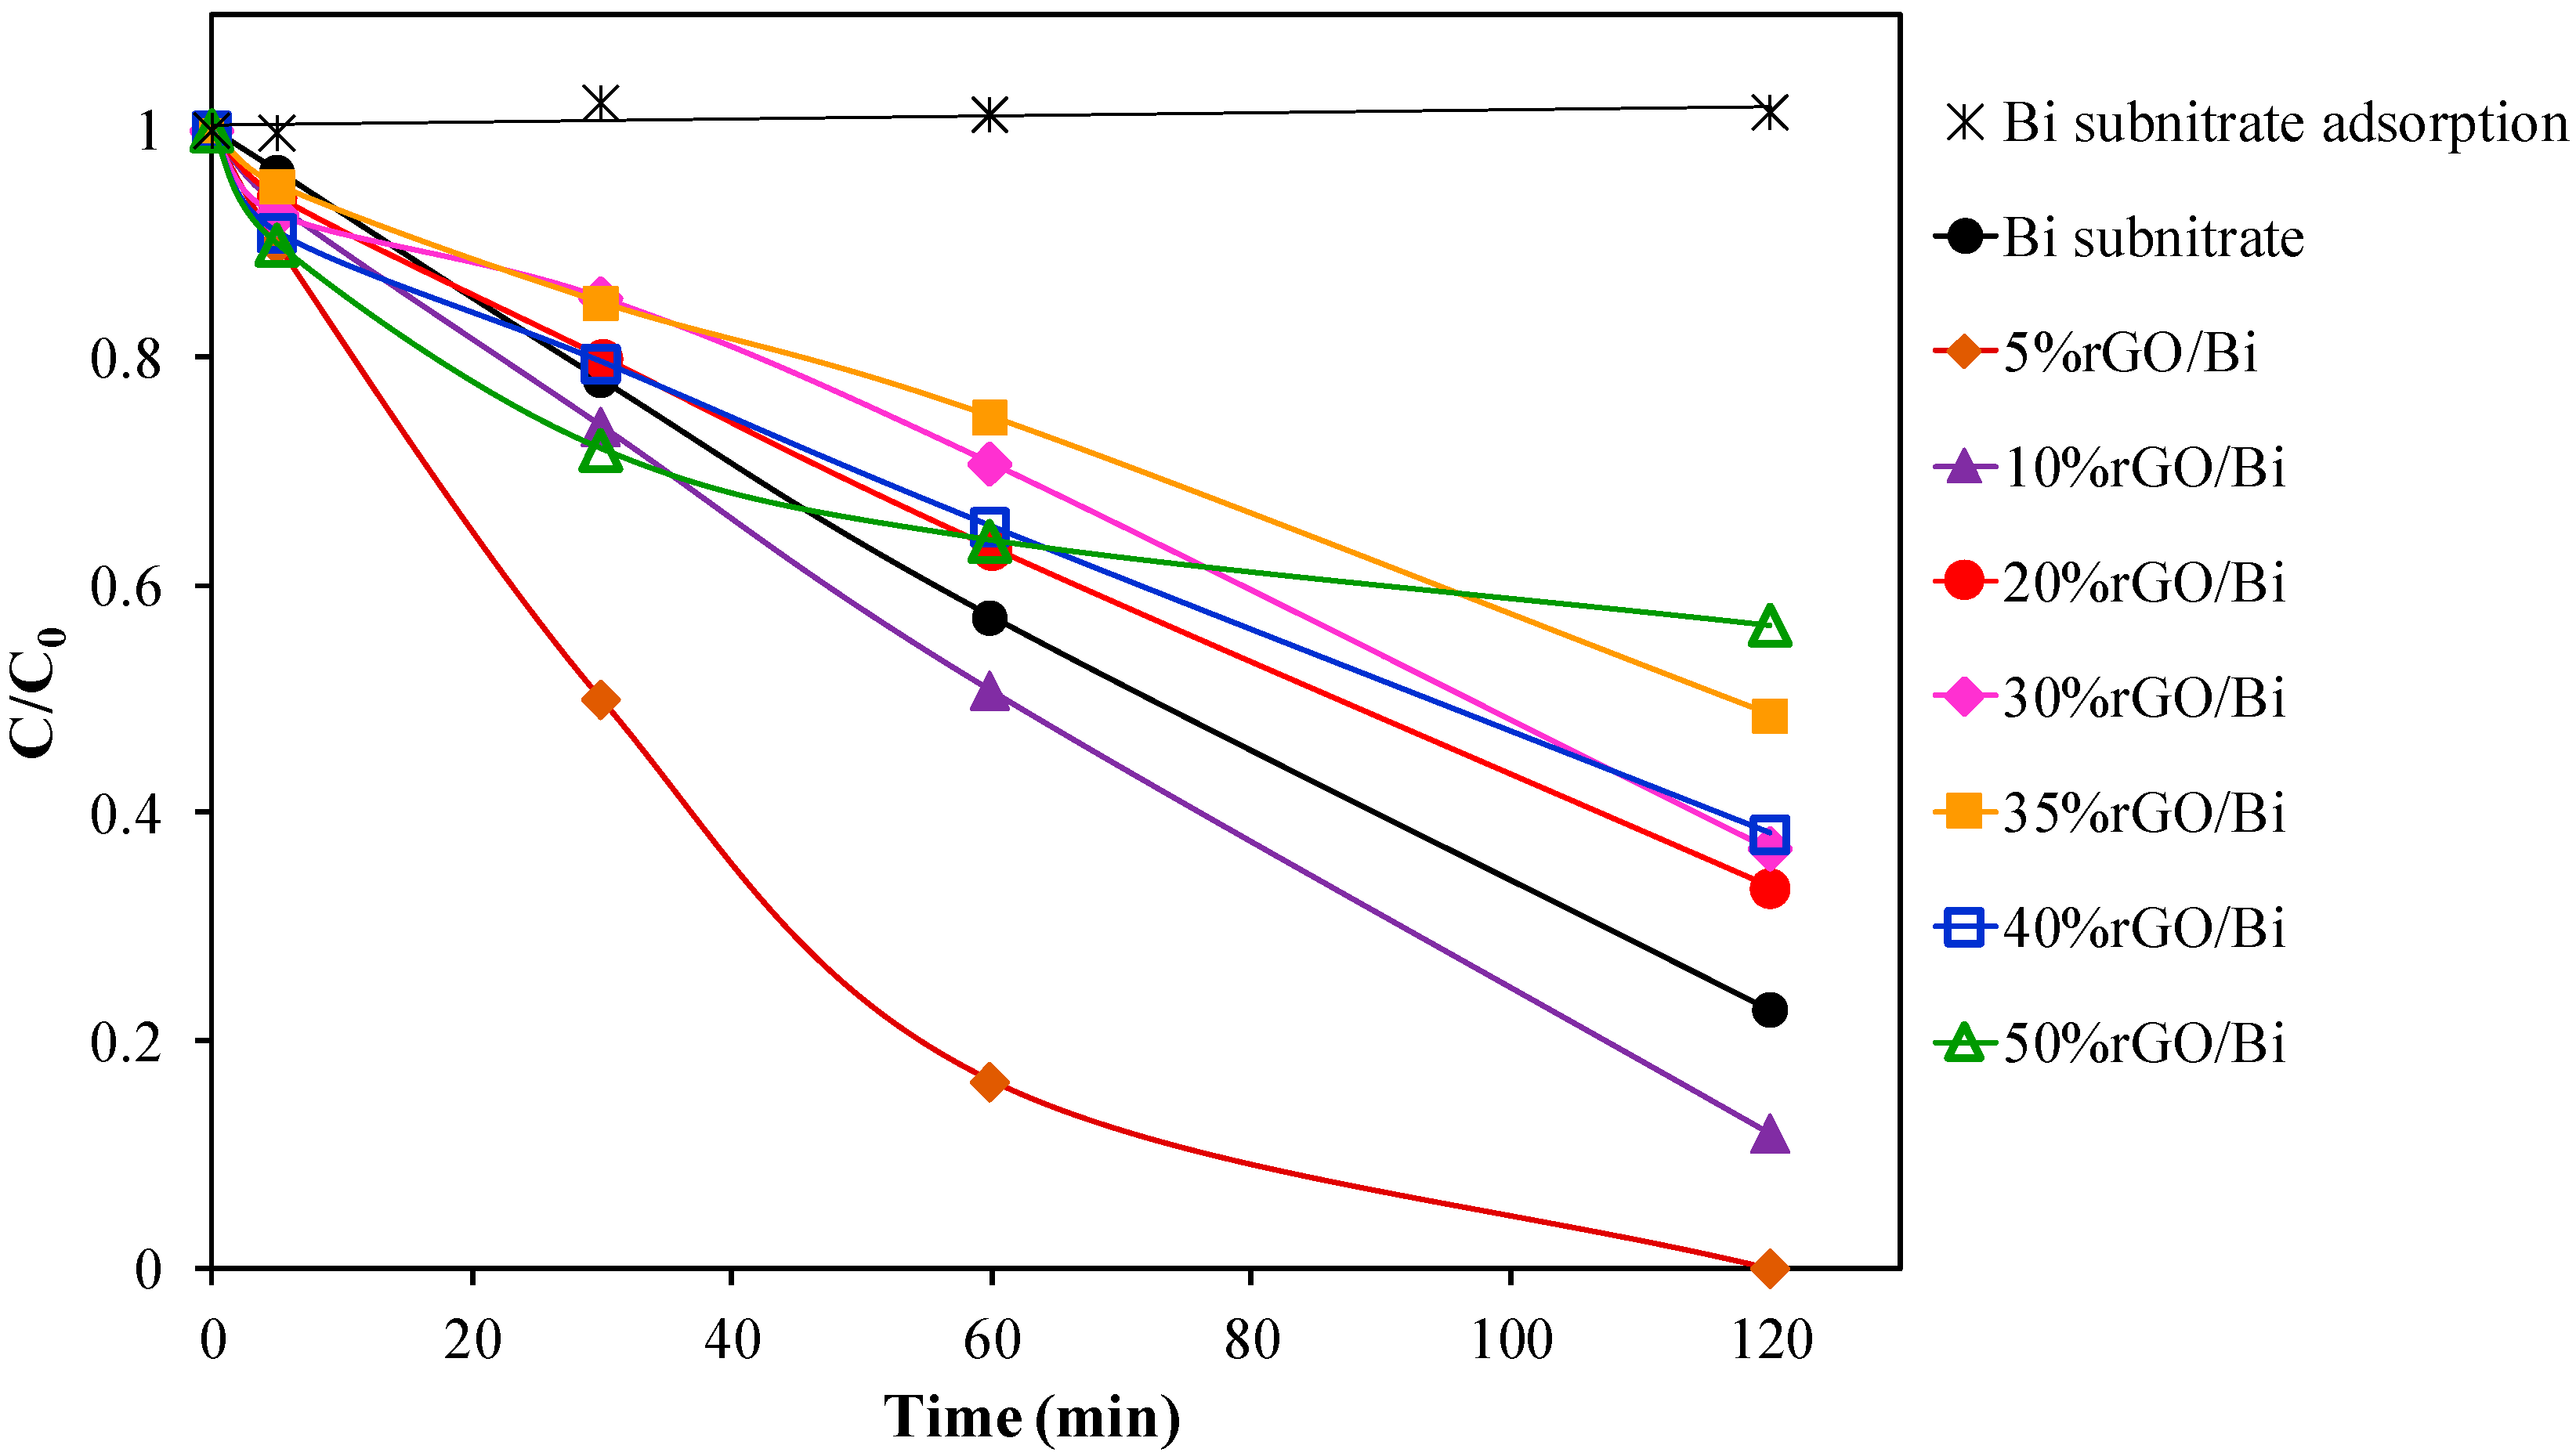
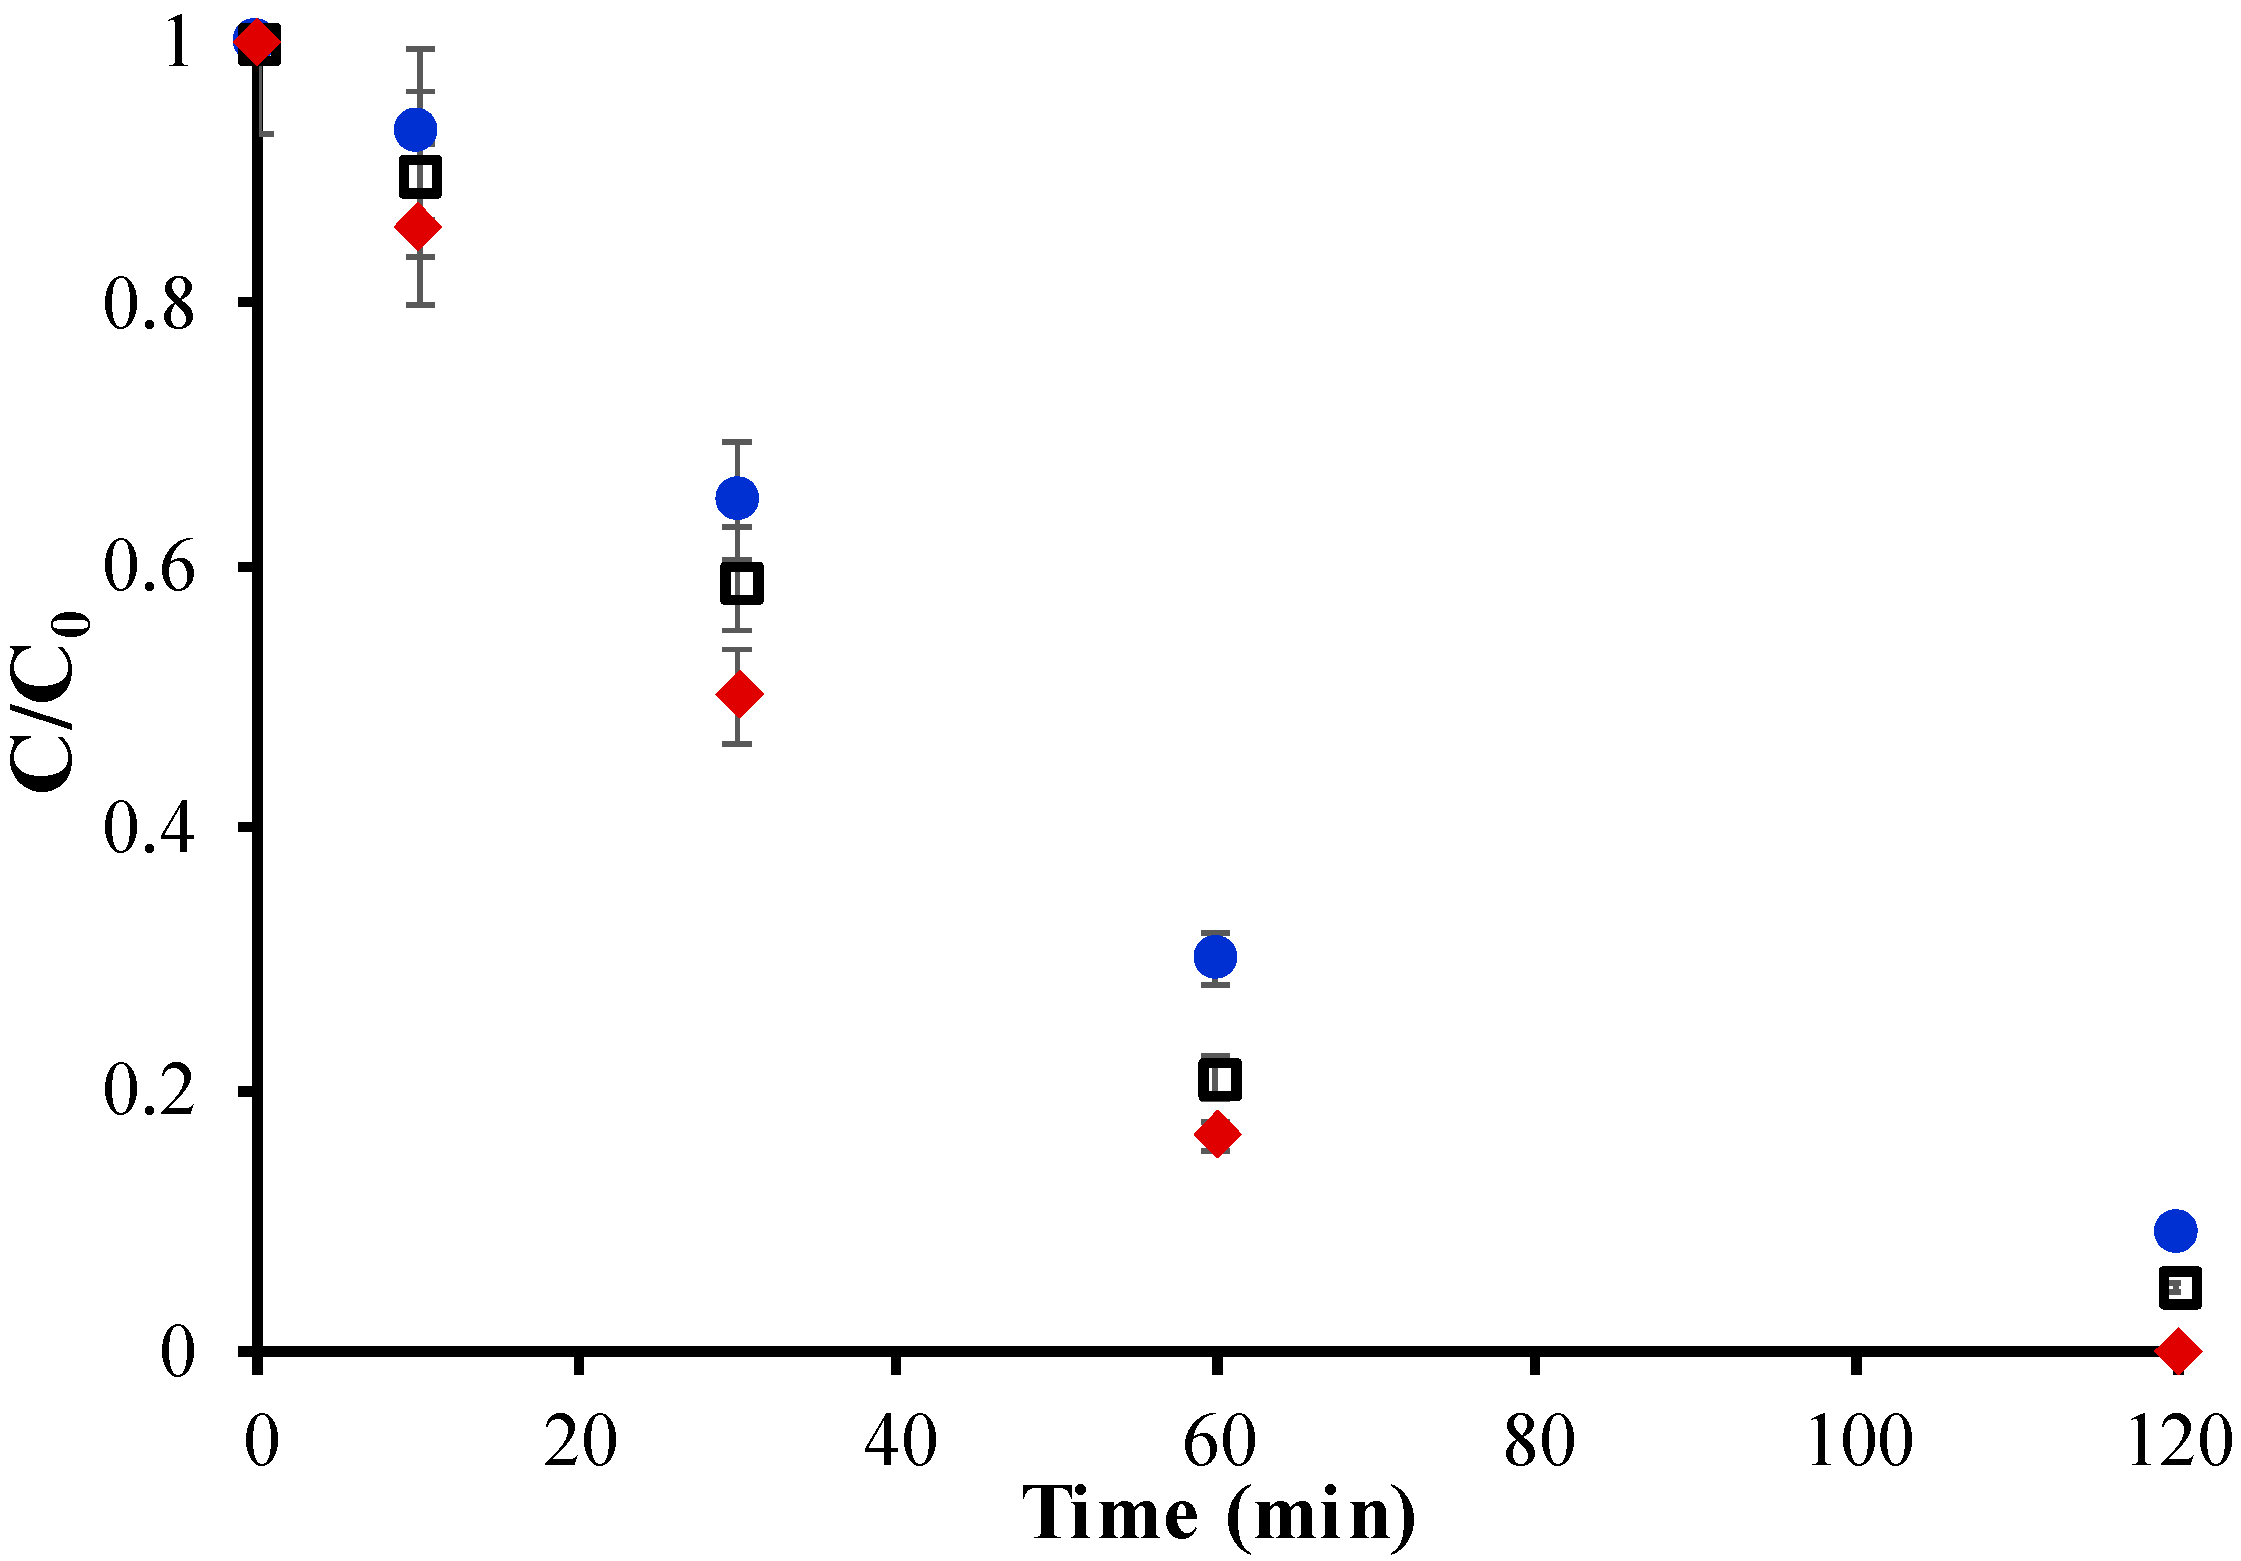
2.2. Photocatalytic Degradation of SMZ in the Presence of rGO/Bi Composites

It was found in the present study that SMZ is not degraded by solar radiation in the absence of photocatalysts as reported by other authors [48]. Figure 8 and Table 4 exhibit the kinetic parameters of SMZ removal by solar photodegradation in the presence of rGO/Bi composites. It can be observed that the photocatalytic activity for SMZ degradation is high when using bismuth subnitrate and even higher with 10%rGO/Bi and, especially, 5%rGO/Bi. Among the samples under study, the catalytic activity is greatest for 5%rGO/Bi and decreases with higher rGO/Bi ratios due to the reduction of the number of electrons and photogenerated holes available for photocatalytic reaction, because excessive rGO nanosheets act as recombination centers, leading to the aggregation of rGO nanosheets and Bi2O3 nanoparticles that cover active Bi2O3 surface sites. Similar results were reported for other types of rGO/metal composites [49,50,51].
The recycling capacity of photocatalysts and their stability in the photocatalytic process are highly relevant properties. As shown in Figure 9, 5%rGO/Bi sample shows no loss in activity after three 2-h cycles of SMZ photodegradation or any significant structural or morphological changes, with only a slight fall in SMZ removal from 100% to 91% over the three consecutive cycles, a loss of <10% of catalytic activity. These results indicate the high efficiency of the 5%rGO/Bi catalyst during consecutive cycles.

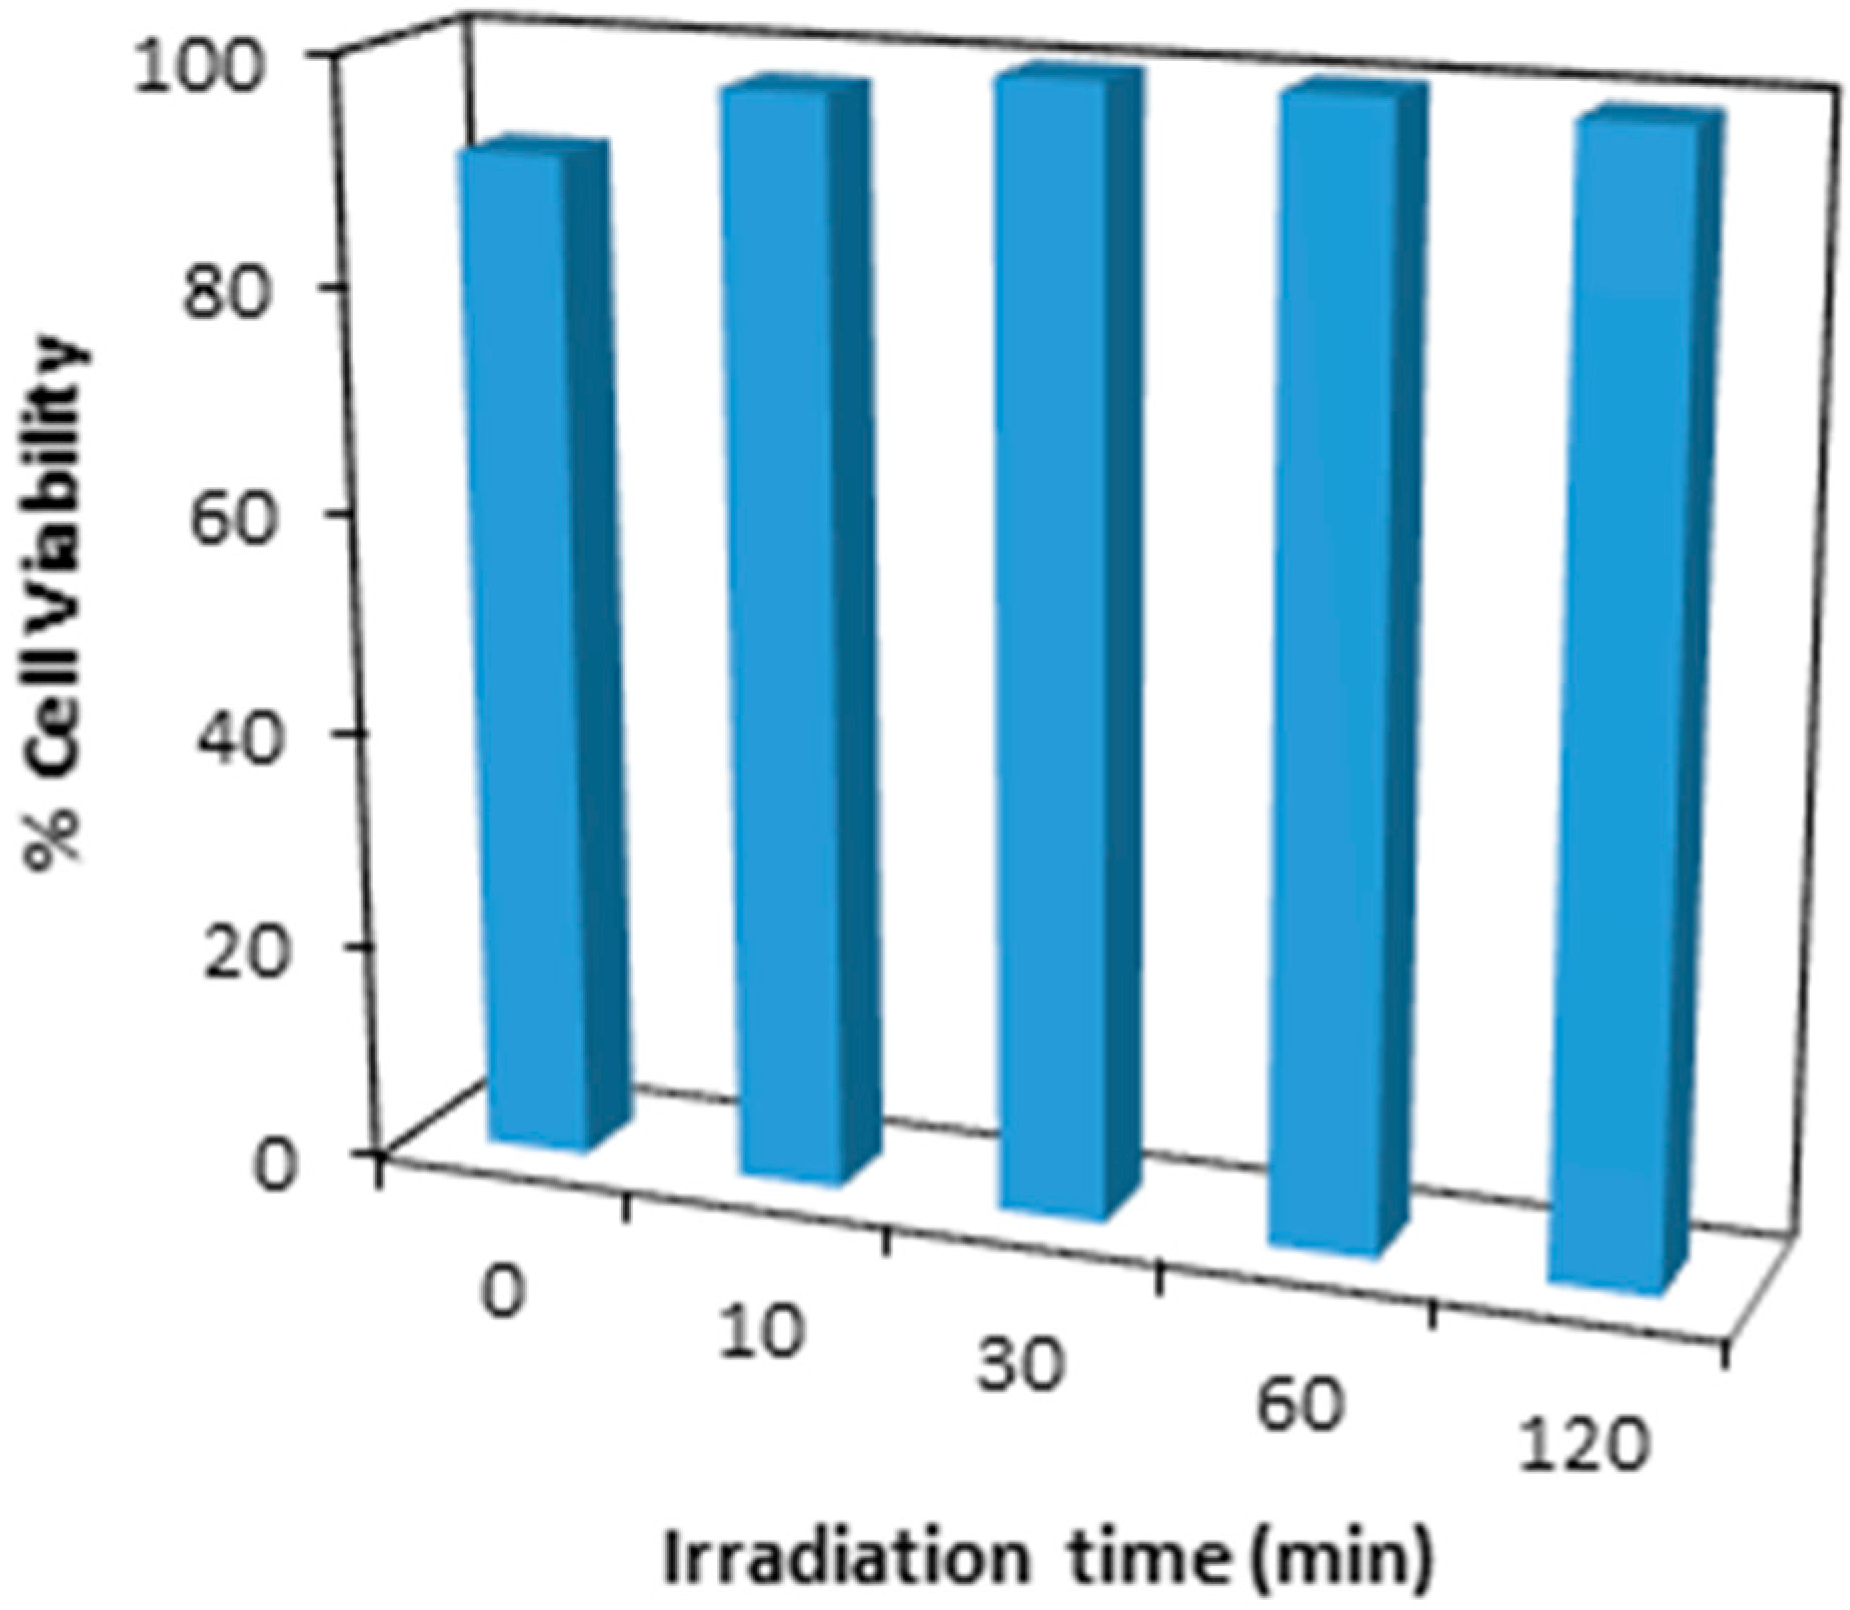
2.3. Cytotoxicity of Degradation By-Products

The cytotoxicity of SMZ degradation by-products after solar radiation in the presence of 5%rGO/Bi was studied as a function of treatment time. HEK-293 cells were used for this study, given that SMZ is used to treat kidney diseases and shows good renal clearance [52]. It is considered that there is a toxic effect when the cell viability is < 75%. The viability of cell cultures in the aqueous medium during SMZ photodegradation in the presence of 5%rGO/Bi was always > 75% (Figure 10). Greater cell viability was observed for the by-products than for SMZ itself. These results are in agreement with previous studies of SMZ [53], and similar behaviors have been observed for other pharmaceutical products [54].

3. Materials and Methods

3.1. Reagents

All chemical reagents used in this study (sulfamethazine, potassium persulfate, acetonitrile, formic acid, graphite, sulfuric acid, phosphoric acid, potassium permanganate, hydrogen peroxide, hydrochloric acid, ethanol, ammonia, and bismuth subnitrate) were of high-purity analytical grade and supplied by Sigma-Aldrich (St. Louis, MO, USA). The ultrapure water used for solution preparation was obtained using Milli-Q® equipment (Millipore®, Billerica, MA, USA). Table 5 exhibits the relevant chemical properties of SMZ.

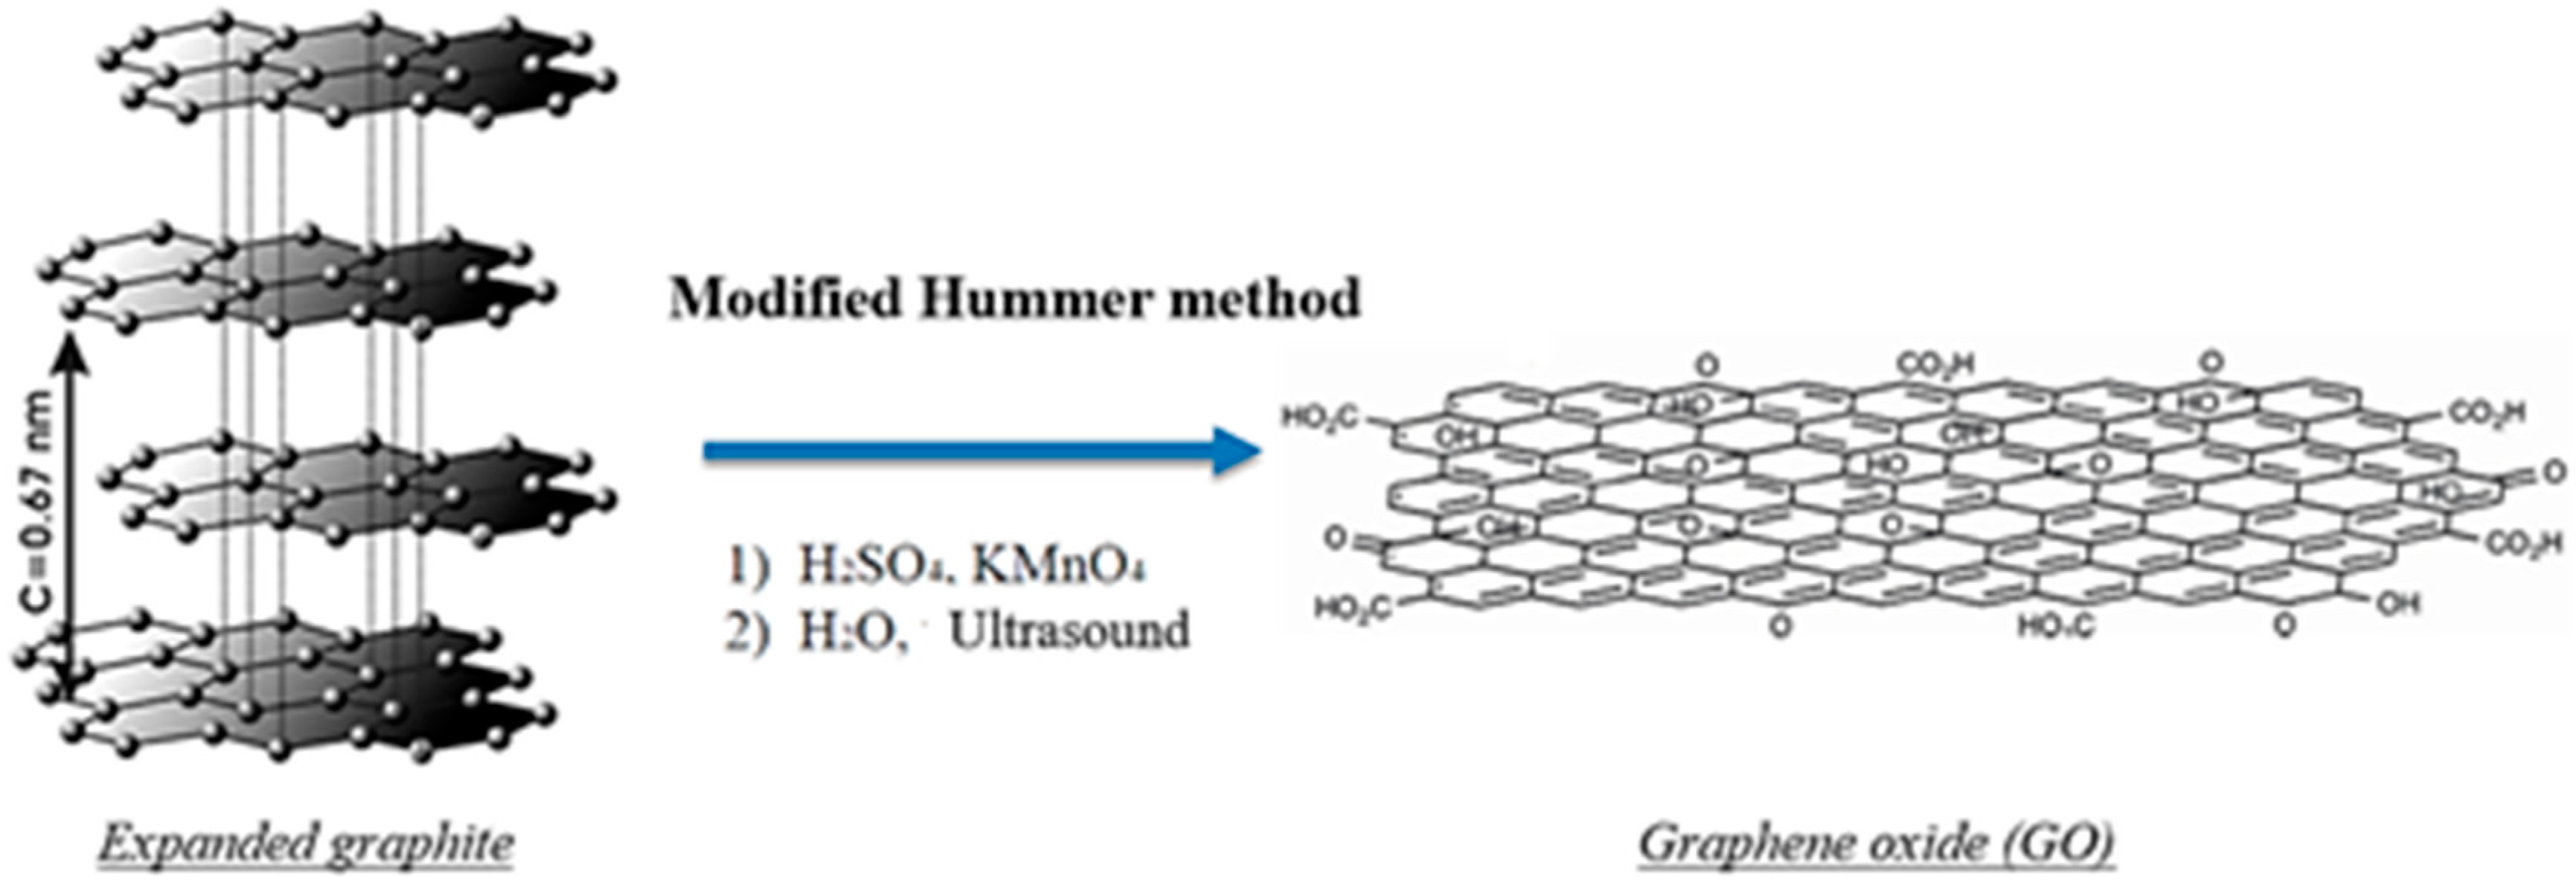
3.2. Synthesis of GO and rGO/Bi Composites

Graphene oxide (GO) was synthesized from commercially available graphite powder using a modification of the Hummer method (Figure 11) [55].
Once GO was obtained, it was exfoliated by ultrasound and uniformly dispersed by magnetic stirring for 1 h. Next, the appropriate amount of bismuth subnitrate was slowly added, followed by vigorous stirring for 4 h, adding ammonia dropwise during the stirring until pH 8 was reached. This mixture was transferred into a Teflon-lined autoclave (1500 W) for experiments using different GO/Bi ratios, temperatures, and time periods in order to establish the optimal composite synthesis conditions (Table 6). The final solutions were allowed to cool at room temperature and were then filtered and washed with double-distilled water and ethanol to remove impurities before being allowed to dry at 60 °C to obtain rGO/Bi nanocomposites.
In the optimization process, temperature and time were fixed (140 °C and 12 h) for the synthesis of a battery of catalysts with different rGO/Bi ratios. After selection of the optimal rGO/Bi ratio, two working temperatures (120 and 140 °C) and two treatment time periods (6 and 12 h) were tested. These experiments yielded the optimal working conditions. The selection of working temperatures was based on thermogravimetric analysis of GO [56] and determination of the appropriate temperature for graphene reduction-exfoliation.

3.3. Characterization of rGO/Bi Nanocomposites

The structure, morphology, microstructures, and functional groups of rGO/Bi nanocomposites were investigated by: (a) nitrogen physisorption, using ASAP 2420 equipment (Micromeritics, Norcross, GA, USA); (b) UV–Vis diffuse reflectance spectra (DRS), using VARIAN CARY-5E double-beam UV–Vis (Agilent, Santa Clara, CA, USA) and near-infrared absorption spectrophotometer with wavelength measurements from 200 (6.20 eV) to 2000 nm (0.62 eV) equipped with a spherical diffuse reflectance accessory; (c) variable pressure scanning electron microscopy (VPESM) with a Zeiss SUPRA40VP microscope (Carl Zeiss AG, Oberkochen, Germany); (d) high-resolution transmission electron microscopy (HRTEM), analyzing particles with a FEI Titan (FEI Company, Hillsboro, USA) operated at 300 kV, and obtaining selected area electron diffraction (SAED) patterns through a 10-μm aperture to collect diffraction data from a circular area; (e) Raman spectroscopy (JASCO NRS-5100, JASCO Inc., Easton, MD, USA), recording from 200 to 3500 cm−1 with a 532-nm green diode laser; (f) Fourier-transform infrared spectroscopy (FT-IR: FT-IR-6300, JASCO, Tokyo, Japan); (g) X-ray diffraction (XRD), using a Bruker D8 Advance Diffractometer (Bruker, Rivas-Vaciamadrid, Madrid, Spain) with Bruker LYNXEYE detector at Cu Kα radiation (λ) of 1.5406 Å, voltage of 40 kV, amperage of 40 mA, range 2θ between 5° and 60°, passage of ~0.04°, and measurement time of 384 s/step; (h) X-ray photoelectron spectroscopy (XPS), using a Kratos Axis Ultra-DLD spectrometer equipped with Al Kα source (Kratos Analytical Ltd., Kyoto, Japan) and CasaXPS software (version 2.3.16); and (i) particle size determination with standard test sieves (Filtra® vibration).

3.4. Sulfamethazine Determination in Aqueous Solution

SMZ concentrations in aqueous solution were determined by reversed-phase high-performance liquid chromatography (HPLC) using a Thermo-Fisher liquid chromatograph (Thermo Separation Products, San Jose, CA, USA) equipped with visible ultraviolet detector and autosampler with capacity for 120 vials and Kinetex® C18 chromatographic column. The mobile phase was 70% formic acid/water (0.1%, v/v) and 30% acetonitrile in isocratic mode at flow rate of 0.35 mL/min; the detector wavelength was 270 nm and the injection volume was 100 μL. This method is a modification of a previously published technique [57]. When experiments were conducted in the presence of composites, samples were immediately filtered with Millipore disk filters (0.45 μm pore size) to remove composites from the solution before HPLC analysis.

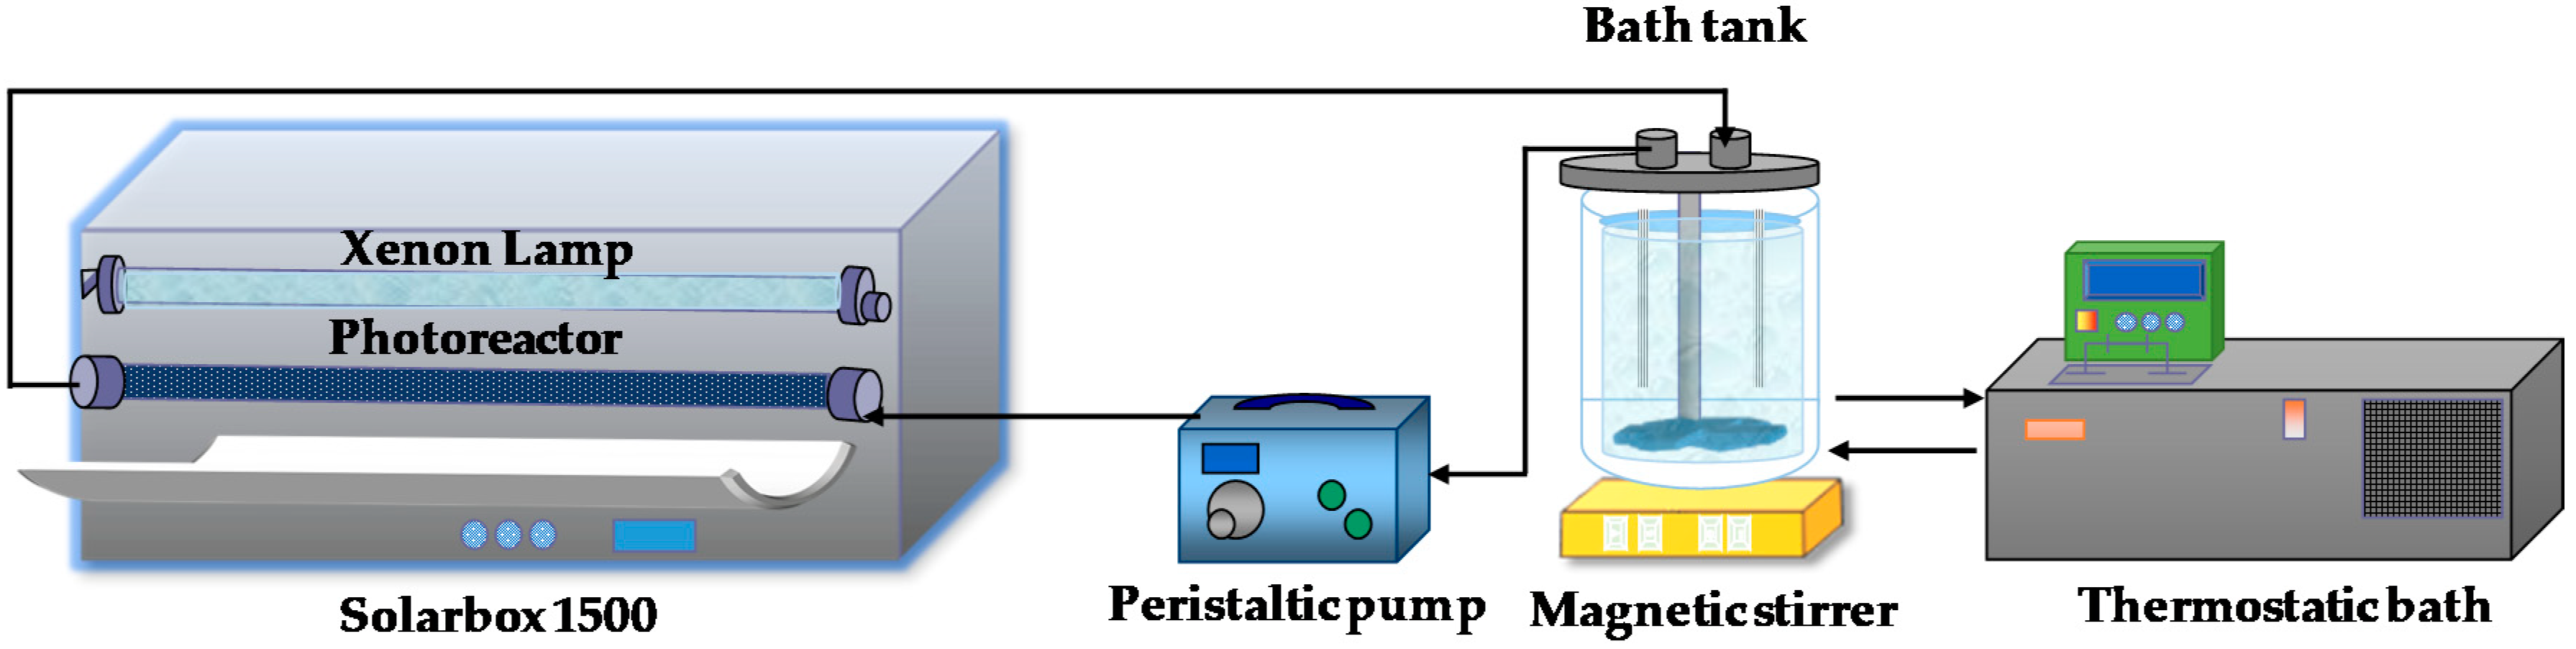
3.5. Sulfamethazine Degradation by Simulated Solar Radiation

The solar radiation photoreactor used was a Solarbox 1500 (Neurtek Instrument) equipped with a xenon lamp (PHILIPS XOP−15-OF, 1500 W) that supplies radiant energy in a spectral range from 280 to 825 nm. Photodegradation experiments were conducted at an irradiance of 450 W/m2 in quartz tubes (wall width of 1 mm, inner diameter of 1.5 cm, and height of 20 cm) with 92% transmittance across the 200–2500 nm range. The photoreactor also possesses a magnetic stirring system to ensure the homogeneity of the solution (Figure 12).
The photon flux entering the quartz tubes of the xenon lamp was determined by 2-nitrobenzaldehyde (o-NB) actinometry as described elsewhere [58]. The incident photon flow (I0) was calculated using Equation (3):
I 0 = d [ A t z ] d t ( 1 φ ) ( 1 1 10 ϵ . b . [ A t z ] 0 )
where [Atz] is the o-NB concentration, φ the quantum yield of o-NB (0.41 + 0.02 mol/E), ε the molar absorptivity (128.6 L mol−1 cm−1), and b the path length of the light (2.2 cm).
In this way, the photon flow was calculated as 2.95 × 10⁻⁶ Einstein/s. The weighted average wavelength of the xenon lamp, determined according to Cruz et al. [59], was 344 nm. The energy of the photon calculated using Planck’s law was 5.78 × 10⁻¹⁹ J/photon, the quartz tube area was 159.56 cm2, and the volume was 135.47 cm3. Based on these data, the calculated incident light flux was 64.52 W/m2.
Photocatalytic experiments were performed using nanocomposites with increasing rGO/Bi ratios (from 5% to 50% weight) and a catalyst mass of 0.03 g, with initial SMZ concentration of 15 mg/L, and pH of 5.4.

3.6. Evaluation of the Cytotoxicity of Reaction By-Products

The cytotoxicity of reaction by-products was tested by using a MTS assay to determine the percentage viability in the 293-human embryonic kidney cell line (Reference N° ECACC: 85120602 [lot CB2737]), supplied by the Cell Bank of the Center for Scientific Instrumentation (University of Granada).
Degradation kinetics were first studied in the presence of phosphate-buffered saline, and 10,000 HEK-293 cells were then incubated for 24 h, followed by renewal of the medium and the addition of SMZ by-products (10:100 µL dilution). After incubation for a further 24 h, 20 µL MTS was then added, and the absorbance was measured at 2 h with INFINITENANOQUA equipment at a wavelength of 490 nm. The relative cell viability was calculated by using untreated cells as control.

4. Conclusions

rGO/Bi nanocomposites were successfully synthesized using a modified Hummer method with microwave treatment. The optimal temperature was 140 °C and the optimal treatment time was 12 h as the shock thermal treatment of GO caused significant reduction of its oxygen functionalities.
Characterization of the nanocomposites by VP-SEM, HRTEM, XDR, XPS, RAMAN, and FTIR analyses demonstrated that GO is efficaciously reduced to rGO and bismuth is polydispersed on the surface as a crystalline phase of Bi2O3. Diffuse reflectance analysis showed an increase in band gap energy with lower percentages of rGO, making the rGO/Bi hybrid material more sensitive to visible light irradiation (λ > 400 nm), with a positive effect on SMZ degradation.
The mass ratio of rGO to Bi affects the efficacy of SMZ photodegradation, and the 5%rGO/Bi nanocomposite is the most active for SMZ degradation under solar radiation. When this rGO amount is exceeded, the performance of the process decreases, because an excess of rGO particles can cover the active sites on the Bi2O3 surface or act as recombination centers. This favors the aggregation of rGO/Bi composites, blocking light to the Bi2O3 surface and restricting the rGO/Bi contact, thereby reducing the synergic effect.
The 5%rGO/Bi nanocomposite does not lose its photocatalytic activity or undergo structural or morphological changes after three photodegradation cycles, adding value to its utilization in treatment plants.
Finally, SMZ degradation by-products are less toxic than the original SMZ pollutant, achieving cell viability values of around 100%.

Supplementary Materials

The following are available online at https://0-www-mdpi-com.brum.beds.ac.uk/2073-4344/10/5/573/s1, Figure S1: XPS spectra of GO, rGO, and 5%rGO/Bi (top to bottom): (a) C1s, (b) O1s, (c) Bi4f regions, and (d) comparative of full spectra for GO (pink line) and 5%rGO/Bi (yellow line).

Author Contributions

M.F.-P.: methodology, formal analysis, investigation, software, and writing-original draft; M.R.: methodology, formal analysis, validation, software, and writing—original draft; M.S.-P.: conceptualization, methodology, supervision, project administration, resources, writing—review, and editing; J.R.-U.: conceptualization, supervision, visualization, writing—review, and editing; M.V.L.-R.: conceptualization, formal analysis, visualization, writing—review, and editing; M.A.Á.: formal analysis, validation, and software. All authors have read and agreed to the published version of the manuscript.

Funding

This research was funded by the Spanish Ministry of Economy, Industry and Competitiveness and FEDER (grant number CTQ2016-80978-C2−1-R).

Acknowledgments

This work was supported by the Spanish Ministry of Economy, Industry and Competitiveness and by FEDER (CTQ2016-80978-C2−1-R), and the authors thank to Dr. Isabel Guerra Tschuschke for the technical advice during the VP-SEM study at the CIC-UGR.

Conflicts of Interest

The authors declare no conflict of interest.

References

  1. Magureanu, M.; Mandache, N.B.; Parvulescu, V.I. Degradation of pharmaceutical compounds in water by non-thermal plasma treatment. Water Res. 2015, 81, 124–136. [Google Scholar] [CrossRef] [PubMed]
  2. Wan, Z.; Wang, J.-L. Removal of sulfonamide antibiotics from wastewater by gamma irradiation in presence of iron ions. Nucl. Sci. Tech. 2016, 27, 104. [Google Scholar] [CrossRef]
  3. Baran, W.; Sochacka, J.; Wardas, W. Toxicity and biodegradability of sulfonamides and products of their photocatalytic degradation in aqueous solutions. Chemosphere 2006, 65, 1295–1299. [Google Scholar] [CrossRef] [PubMed]
  4. Ribeiro, A.R.; Nunes, O.C.; Pereira, M.F.R.; Silva, A.M.T. An overview on the advanced oxidation processes applied for the treatment of water pollutants defined in the recently launched Directive 2013/39/EU. Environ. Int. 2015, 75, 33–51. [Google Scholar] [CrossRef] [PubMed] [Green Version]
  5. Oh, W.-D.; Dong, Z.; Lim, T.-T. Generation of sulfate radical through heterogeneous catalysis for organic contaminants removal: Current development, challenges and prospects. Appl. Catal. B Environ. 2016, 194, 169–201. [Google Scholar] [CrossRef]
  6. Shi, M.; Shen, J.; Ma, H.; Li, Z.; Lu, X.; Li, N.; Ye, M. Preparation of graphene–TiO2 composite by hydrothermal method from peroxotitanium acid and its photocatalytic properties. Colloid Surface A 2012, 405, 30–37. [Google Scholar] [CrossRef]
  7. Gao, E.; Wang, W.; Shang, M.; Xu, J. Synthesis and enhanced photocatalytic performance of graphene-Bi2WO6 composite. Phys. Chem. Chem. Phys. 2011, 13, 2887–2893. [Google Scholar] [CrossRef]
  8. Fu, D.; Han, G.; Chang, Y.; Dong, J. The synthesis and properties of ZnO–graphene nano hybrid for photodegradation of organic pollutant in water. Mater. Chem. Phys. 2012, 132, 673–681. [Google Scholar] [CrossRef]
  9. Khan, M.E.; Khan, M.M.; Cho, M.H. Ce3+-ion, surface oxygen vacancy, and visible light-induced photocatalytic dye degradation and photocapacitive performance of CeO2 -graphene nanostructures. Sci. Rep. 2017, 7, 5928. [Google Scholar] [CrossRef] [Green Version]
  10. Vinoth, R.; Babu, S.G.; Ramachandran, R.; Neppolian, B. Bismuth oxyiodide incorporated reduced graphene oxide nanocomposite material as an efficient photocatalyst for visible light assisted degradation of organic pollutants. Appl. Surf. Sci. 2017, 418, 163–170. [Google Scholar] [CrossRef]
  11. Penki, T.R.; Valurouthu, G.; Shivakumara, S.; Sethuraman, V.A.; Munichandraiah, N. In situ synthesis of bismuth (Bi)/reduced graphene oxide (RGO) nanocomposites as high-capacity anode materials for a Mg-ion battery. New J. Chem. 2018, 42, 5996–6004. [Google Scholar] [CrossRef] [Green Version]
  12. Nie, G.; Lu, X.; Lei, J.; Yang, L.; Wang, C. Facile and controlled synthesis of bismuth sulfide nanorods-reduced graphene oxide composites with enhanced supercapacitor performance. Electrochim. Acta 2015, 154, 24–30. [Google Scholar] [CrossRef]
  13. Wang, J.; Zhang, H.; Hunt, M.R.; Charles, A.; Tang, J.; Bretcanu, O.; Walker, D.; Hassan, K.T.; Sun, Y.; Šiller, L. Synthesis and characterization of reduced graphene oxide/bismuth composite for electrodes in electrochemical energy storage devices. ChemSusChem 2017, 10, 363–371. [Google Scholar] [CrossRef] [PubMed] [Green Version]
  14. Gopalsamy, K.; Xu, Z.; Zheng, B.; Huang, T.; Kou, L.; Zhao, X.; Gao, C. Bismuth oxide nanotubes–graphene fiber-based flexible supercapacitors. Nanoscale 2014, 6, 8595–8600. [Google Scholar] [CrossRef] [PubMed]
  15. Hu, X.; Pan, D.; Lin, M.; Han, H.; Li, F. One-Step Electrochemical Deposition of Reduced Graphene Oxide-Bismuth Nanocomposites for Determination of Lead. ECS Electrochem. Lett. 2015, 4, H43–H45. [Google Scholar] [CrossRef] [Green Version]
  16. Ping, J.; Wang, Y.; Wu, J.; Ying, Y. Development of an electrochemically reduced graphene oxide modified disposable bismuth film electrode and its application for stripping analysis of heavy metals in milk. Food Chem. 2014, 151, 65–71. [Google Scholar] [CrossRef]
  17. Sahoo, P.K.; Panigrahy, B.; Sahoo, S.; Satpati, A.K.; Li, D.; Bahadur, D. In situ synthesis and properties of reduced graphene oxide/Bi nanocomposites: As an electroactive material for analysis of heavy metals. Biosens. Bioelectron. 2013, 43, 293–296. [Google Scholar] [CrossRef]
  18. Wang, Z.; Wang, H.; Zhang, Z.; Liu, G. Electrochemical determination of lead and cadmium in rice by a disposable bismuth/electrochemically reduced graphene/ionic liquid composite modified screen-printed electrode. Sensor. Actuat. B Chem. 2014, 199, 7–14. [Google Scholar] [CrossRef]
  19. Hu, X.; Pan, D.; Lin, M.; Han, H.; Li, F. Graphene oxide-assisted synthesis of bismuth nanosheets for catalytic stripping voltammetric determination of iron in coastal waters. Microchim. Acta 2016, 183, 855–861. [Google Scholar] [CrossRef]
  20. Liu, X.; Pan, L.; Lv, T.; Sun, Z.; Sun, C.Q. Visible light photocatalytic degradation of dyes by bismuth oxide-reduced graphene oxide composites prepared via microwave-assisted method. J. Colloid Interf. Sci. 2013, 408, 145–150. [Google Scholar] [CrossRef]
  21. Ng, Y.H.; Iwase, A.; Kudo, A.; Amal, R. Reducing graphene oxide on a visible-light BiVO4 photocatalyst for an enhanced photoelectrochemical water splitting. J. Phys. Chem. Lett. 2010, 1, 2607–2612. [Google Scholar] [CrossRef]
  22. Du, M.; Xiong, S.; Wu, T.; Zhao, D.; Zhang, Q.; Fan, Z.; Zeng, Y.; Ji, F.; He, Q.; Xu, X. Preparation of a microspherical silver-reduced graphene oxide-bismuth vanadate composite and evaluation of its photocatalytic activity. Materials 2016, 9, 160. [Google Scholar] [CrossRef] [PubMed] [Green Version]
  23. Liu, H.; Cao, W.-R.; Su, Y.; Chen, Z.; Wang, Y. Bismuth oxyiodide–graphene nanocomposites with high visible light photocatalytic activity. J. Colloid Interf. Sci. 2013, 398, 161–167. [Google Scholar] [CrossRef] [PubMed]
  24. Dong, S.; Pi, Y.; Li, Q.; Hu, L.; Li, Y.; Han, X.-; Wang, J.; Sun, J. Solar photocatalytic degradation of sulfanilamide by BiOCl/reduced graphene oxide nanocomposites: Mechanism and degradation pathways. J. Alloy Compd. 2016, 663, 1–9. [Google Scholar] [CrossRef]
  25. Deng, K.-Q.; Zhou, J.; Li, X.-F. Direct electrochemical reduction of graphene oxide and its application to determination of l-tryptophan and l-tyrosine. Colloid Surf. B 2013, 101, 183–188. [Google Scholar] [CrossRef]
  26. Liu, X.; Pan, L.; Lv, T.; Lu, T.; Zhu, G.; Sun, Z.; Sun, C. Microwave-assisted synthesis of ZnO–graphene composite for photocatalytic reduction of Cr(VI). Catal. Sci. Technol. 2011, 1, 1189–1193. [Google Scholar] [CrossRef]
  27. Zhu, G.; Pan, L.; Xu, T.; Zhao, Q.; Lu, B.; Sun, Z. Microwave assisted CdSe quantum dot deposition on TiO2 films for dye-sensitized solar cells. Nanoscale 2011, 3, 2188–2193. [Google Scholar] [CrossRef]
  28. Carp, O.; Huisman, C.L.; Reller, A. Photoinduced reactivity of titanium dioxide’. Prog. Solid State Ch. 2004, 32, 33–177. [Google Scholar] [CrossRef]
  29. Guo, F.; Creighton, M.; Chen, Y.; Hurt, R.; Külaots, I. Porous structures in stacked, crumpled and pillared graphene-based 3D materials. Carbon 2014, 66, 476–484. [Google Scholar] [CrossRef] [Green Version]
  30. Li, X.; Zhang, W.; Cui, W.; Sun, Y.; Jiang, G.; Zhang, Y.; Huang, H.; Dong, F. Bismuth spheres assembled on graphene oxide: Directional charge transfer enhances plasmonic photocatalysis and in situ DRIFTS studies. Appl. Catal. B Environ. 2018, 221, 482–489. [Google Scholar] [CrossRef]
  31. Moon, I.K.; Lee, J.; Ruoff, R.S.; Lee, H. Reduced graphene oxide by chemical graphitization. Nat. Commun. 2010, 1, 73. [Google Scholar] [CrossRef] [PubMed] [Green Version]
  32. Samal, A.; Das, D.P. Transfiguring UV light active “metal oxides” to visible light active photocatayst by reduced graphene oxide hypostatization. Catal. Today 2018, 300, 124–135. [Google Scholar] [CrossRef]
  33. Huang, H.; Liu, K.; Zhang, Y.; Chen, K.; Zhang, Y.; Tian, N. Tunable 3D hierarchical graphene–BiOI nanoarchitectures: Their in situ preparation, and highly improved photocatalytic performance and photoelectrochemical properties under visible light irradiation. RSC Adv. 2014, 4, 49386–49394. [Google Scholar] [CrossRef]
  34. Han, S.; Um, W.; Kim, W.-S. Development of bismuth-functionalized graphene oxide to remove radioactive iodine. Dalton Trans. 2019, 48, 478–485. [Google Scholar] [CrossRef] [PubMed]
  35. Malard, L.M.; Pimenta, M.A.; Dresselhaus, G.; Dresselhaus, M.S. Raman spectroscopy in graphene. Phys. Rep. 2009, 473, 51–87. [Google Scholar] [CrossRef]
  36. Ramm, M.; Ata, M.; Gross, T.; Unger, W. X-ray photoelectron spectroscopy and near-edge X-ray-absorption fine structure of C60 polymer films. Appl. Phys. A 2000, 70, 387–390. [Google Scholar] [CrossRef]
  37. Ferrari, A.C. Raman spectroscopy of graphene and graphite: Disorder, electron–phonon coupling, doping and nonadiabatic effects. Solid State Commun. 2007, 143, 47–57. [Google Scholar] [CrossRef]
  38. Tuinstra, F.; Koenig, J.L. Raman spectrum of graphite. J. Chem. Phys. 1970, 53, 1126–1130. [Google Scholar] [CrossRef] [Green Version]
  39. Nyquist, R.A.; Putzig, C.L.; Leugers, M.A. Infrared and Raman spectral atlas of inorganic compounds and organic salts. Raman spectra. In The Handbook of Infrared and Raman Spectra of Inorganic Compounds and Organic Salts; Academic Press: San Diego, CA, USA, 1997; p. 1151. [Google Scholar]
  40. Stankovich, S.; Dikin, D.A.; Piner, R.D.; Kohlhaas, K.A.; Kleinhammes, A.; Jia, Y.; Wu, Y.; Nguyen, S.B.T.; Ruoff, R.S. Synthesis of graphene-based nanosheets via chemical reduction of exfoliated graphite oxide. Carbon 2007, 45, 1558–1565. [Google Scholar] [CrossRef]
  41. Lambert, T.N.; Chavez, C.A.; Hernandez-Sanchez, B.; Lu, P.; Bell, N.S.; Ambrosini, A.; Friedman, T.; Boyle, T.J.; Wheeler, D.R.; Huber, D.L. Synthesis and characterization of titania−graphene nanocomposites. J. Phys. Chem. C 2009, 113, 19812–19823. [Google Scholar] [CrossRef]
  42. Kubelka, P. New contributions to the optics of intensely light-scattering materials. Part I. J. Opt. Soc. Am. JOSA 1948, 38, 448–457. [Google Scholar] [CrossRef] [PubMed]
  43. López, R.; Gómez, R. Band-gap energy estimation from diffuse reflectance measurements on sol–gel and commercial TiO2: A comparative study. J. Sol-Gel Sci. Technol. 2012, 61, 1–7. [Google Scholar] [CrossRef]
  44. Velo-Gala, I.; López-Peñalver, J.J.; Sánchez-Polo, M.; Rivera-Utrilla, J. Activated carbon as photocatalyst of reactions in aqueous phase. Appl. Catal. B Environ. 2013, 142–143, 694–704. [Google Scholar] [CrossRef]
  45. Chan, G.H.; Deng, B.; Bertoni, M.; Ireland, J.R.; Hersam, M.C.; Mason, T.O.; Van Duyne, R.P.; Ibers, J.A. Syntheses, structures, physical properties, and theoretical studies of CeMxOS (M = Cu, Ag; x approximately 0.8) and CeAgOS. Inorg. Chem. 2006, 45, 8264–8272. [Google Scholar] [CrossRef] [PubMed]
  46. Sun, Z.; Guo, J.; Zhu, S.; Ma, J.; Liao, Y.; Zhang, D. High photocatalytic performance by engineering Bi2WO6 nanoneedles onto graphene sheets. RSC Adv. 2014, 4, 27963–27970. [Google Scholar] [CrossRef]
  47. Pastrana-Martínez, L.M.; Morales-Torres, S.; Likodimos, V.; Figueiredo, J.L.; Faria, J.L.; Falaras, P.; Silva, A.M.T. Advanced nanostructured photocatalysts based on reduced graphene oxide-TiO2 composites for degradation of diphenhydramine pharmaceutical and methyl orange dye. Appl. Catal. B Environ. 2012, 123–124, 241–256. [Google Scholar] [CrossRef]
  48. Liu, X.; Ji, H.; Li, S.; Liu, W. Graphene modified anatase/titanate nanosheets with enhanced photocatalytic activity for efficient degradation of sulfamethazine under simulated solar light. Chemosphere 2019, 233, 198–206. [Google Scholar] [CrossRef]
  49. Petala, A.; Noe, A.; Frontistis, Z.; Drivas, C.; Kennou, S.; Mantzavinos, D.; Kondarides, D.I. Synthesis and characterization of CoOx/BiVO4 photocatalysts for the degradation of propyl paraben. J. Hazard. Mater. 2019, 372, 52–60. [Google Scholar] [CrossRef]
  50. Long, M.; Qin, Y.; Chen, C.; Guo, X.; Tan, B.; Cai, W. Origin of visible light photoactivity of reduced graphene oxide/TiO2 by in situ hydrothermal growth of undergrown TiO2 with graphene oxide. J. Phys. Chem. C 2013, 117, 16734–16741. [Google Scholar] [CrossRef]
  51. Awfa, D.; Ateia, M.; Fujii, M.; Johnson, M.S.; Yoshimura, C. Photodegradation of pharmaceuticals and personal care products in water treatment using carbonaceous-TiO2 composites: A critical review of recent literature. Water Res. 2018, 142, 26–45. [Google Scholar] [CrossRef]
  52. Sulfamethazine-DrugBank. Available online: https://www.drugbank.ca/drugs/DB01582 (accessed on 21 January 2020).
  53. Acosta-Rangel, A.; Sánchez-Polo, M.; Polo, A.M.S.; Rivera-Utrilla, J.; Berber-Mendoza, M.S. Sulfonamides degradation assisted by UV, UV/H2O2 and UV/K2S2O8: Efficiency, mechanism and byproducts cytotoxicity. J. Environ. Manag. 2018, 225, 224–231. [Google Scholar] [CrossRef] [PubMed]
  54. Yaghmaeian, K.; Moussavi, G.; Mashayekh-Salehi, A.; Mohseni-Bandpei, A.; Satari, M. Oxidation of acetaminophen in the ozonation process catalyzed with modified MgO nanoparticles: Effect of operational variables and cytotoxicity assessment. Process Saf. Environ. 2017, 109, 520–528. [Google Scholar] [CrossRef]
  55. Marcano, D.C.; Kosynkin, D.V.; Berlin, J.M.; Sinitskii, A.; Sun, Z.; Slesarev, A.; Alemany, A.B.; Lu, W.; Tour, J.M. Improved Synthesis of Graphene Oxide. ACS Nano 2010, 4, 4806–4814. [Google Scholar] [CrossRef] [PubMed]
  56. Gurzęda, B.; Buchwald, T.; Nocuń, M.; Bąkowicz, A.; Krawczyk, P. Graphene material preparation through thermal treatment of graphite oxide electrochemically synthesized in aqueous sulfuric acid. RSC Adv. 2017, 7, 19904–19911. [Google Scholar]
  57. Borowska, E.; Bourgin, M.; Hollender, J.; Kienle, C.; McArdell, C.S.; von Gunten, U. Oxidation of cetirizine, fexofenadine and hydrochlorothiazide during ozonation: Kinetics and formation of transformation products. Water Res. 2016, 94, 350–362. [Google Scholar] [CrossRef] [Green Version]
  58. Velo-Gala, I.; López-Peñalver, J.J.; Sánchez-Polo, M.; Rivera-Utrilla, J. Role of activated carbon surface chemistry in its photocatalytic activity and the generation of oxidant radicals under UV or solar radiation. Appl. Catal. B Environ. 2017, 207, 412–423. [Google Scholar] [CrossRef]
  59. De la Cruz, N.; Romero, V.; Dantas, R.F.; Marco, P.; Bayarri, B.; Giménez, J.; Esplugas, S. o-Nitrobenzaldehyde actinometry in the presence of suspended TiO2 for photocatalytic reactors. Catal. Today 2013, 209, 209–214. [Google Scholar] [CrossRef]
Figure 1. Nitrogen adsorption–desorption isotherms of (a) 5%rGO/Bi and (b) bismuth subnitrate.
Catalysts 10 00573 g001
Figure 2. SEM images of graphene oxide (a) and 5%rGO/Bi composite (b) and (c).
Catalysts 10 00573 g002
Figure 3. HRTEM images, (a) an (b), and SAED image (c) of 5%rGO/Bi.
Catalysts 10 00573 g003
Figure 4. XRD patterns of graphite, graphene oxide, and 5%rGO/Bi.
Catalysts 10 00573 g004
Figure 5. FTIR spectra of graphite, graphene oxide, and 5%rGO/Bi.
Catalysts 10 00573 g005
Figure 6. Raman spectra of GO, 5%rGO/Bi, graphite, and bismuth subnitrate.
Catalysts 10 00573 g006
Figure 7. (a) UV–Vis spectra and (b) relationship between transformed Kubelka–Munk function and light energy for 5%rGO/Bi.
Catalysts 10 00573 g007
Figure 8. Kinetics of sulfamethazine (SMZ) removal by solar photodegradation in the presence of rGO/Bi composites. [SMZ]0 = 15 mg/L.
Catalysts 10 00573 g008
Figure 9. Time course of SMZ photodegradation with irradiation time corresponding to three consecutive SMZ photodegradation cycles using the same 5%rGO/Bi sample. [SMZ]0 = 15 mg/L and mcatalyst = 0.03 g. Cycles: (◆) first, (☐) second, and (●) third.
Catalysts 10 00573 g009
Figure 10. HEK-293 cell viability (%) in the aqueous medium during SMZ photodegradation under solar radiation in the presence of 5%rGO/Bi. [SMZ]0 = 15 mg/L.
Catalysts 10 00573 g010
Figure 11. Scheme for synthesis of graphene oxide.
Catalysts 10 00573 g011
Figure 12. Solar simulator equipment.
Catalysts 10 00573 g012
Table 1. Textural properties of the studied materials.
SampleSurface Area SBET (m²/g)
Bismuth subnitrate0.27
Graphite24
GO114
rGO16
5%rGO/Bi26
10%rGO/Bi17
20%rGO/Bi20
30%rGO/Bi21
35%rGO/Bi21
40%rGO/Bi20
50%rGO/Bi21
Table 2. Band gap energies of rGO/Bi nanocomposites.
%rGOBand Gap
(eV)
53.51
103.57
203.73
303.76
353.76
403.33
503.04
Table 3. Band gap energy of 5%rGO/Bi as a function of treatment time and temperature.
%rGOBand Gap
(eV)
6 h/120 °C3.59
12 h/140 °C3.51
Table 4. Sulfamethazine (SMZ) degradation parameters for the different rGO/Bi composites.
%rGODegradation Rate (min−1)% Degradation (2 h)
50.030100
100.01888
200.00667
300.00663
350.00651
400.00662
500.00444
Table 5. Properties of SMZ.
PollutantMolecular StructureMolecular Weight (g/mol)Area (nm2)Water Solubility (mg/L)pKa
Sulfamethazine Catalysts 10 00573 i001 pKa1: 2.00
(SMZ)278.331061500
C12H14N4O2S pKa2: 6.99
Table 6. Experimental conditions used to obtain rGO/Bi nanocomposites.
rGO/Bi Ratio
(% weight)
Temperature (°C)Time (h)
51030354050100120140612

