Exploring the Mechanism of Catalysis with the Unified Reaction Valley Approach (URVA)—A Review


1
Department of Chemistry, Southern Methodist University, 3215 Daniel Avenue, Dallas, TX 75275-0314, USA
2
Institute of Modern Physics, Northwest University, and Shaanxi Key Laboratory for Theoretical Physics Frontiers, Xi’an 710127, China
*
Author to whom correspondence should be addressed.
Catalysts 2020, 10(6), 691; https://0-doi-org.brum.beds.ac.uk/10.3390/catal10060691
Submission received: 1 June 2020
/
Revised: 13 June 2020
/
Accepted: 15 June 2020
/
Published: 19 June 2020
(This article belongs to the Special Issue Feature Papers to Celebrate "Computational Catalysis"—Trends and Outlook)
Abstract
:The unified reaction valley approach (URVA) differs from mainstream mechanistic studies, as it describes a chemical reaction via the reaction path and the surrounding reaction valley on the potential energy surface from the van der Waals region to the transition state and far out into the exit channel, where the products are located. The key feature of URVA is the focus on the curving of the reaction path. Moving along the reaction path, any electronic structure change of the reacting molecules is registered by a change in their normal vibrational modes and their coupling with the path, which recovers the curvature of the reaction path. This leads to a unique curvature profile for each chemical reaction with curvature minima reflecting minimal change and curvature maxima, the location of important chemical events such as bond breaking/forming, charge polarization and transfer, rehybridization, etc. A unique decomposition of the path curvature into internal coordinate components provides comprehensive insights into the origins of the chemical changes taking place. After presenting the theoretical background of URVA, we discuss its application to four diverse catalytic processes: (i) the Rh catalyzed methanol carbonylation—the Monsanto process; (ii) the Sharpless epoxidation of allylic alcohols—transition to heterogenous catalysis; (iii) Au(I) assisted [3,3]-sigmatropic rearrangement of allyl acetate; and (iv) the Bacillus subtilis chorismate mutase catalyzed Claisen rearrangement—and show how URVA leads to a new protocol for fine-tuning of existing catalysts and the design of new efficient and eco-friendly catalysts. At the end of this article the pURVA software is introduced. The overall goal of this article is to introduce to the chemical community a new protocol for fine-tuning existing catalytic reactions while aiding in the design of modern and environmentally friendly catalysts.
Keywords:
unified reaction valley approach; reaction path Hamiltonian; reaction phases and reaction path curvature; vibrational spectroscopy; Rh catalyzed methanol carbonylation; Sharpless epoxidation of allylic alcohols; Au(I) assisted [3,3]-sigmatropic rearrangements; Bacillus subtilis chorismate mutase catalyzed Claisen rearrangement
1. Introduction
More than 180 years ago the Swedish chemist Berzelius defined a catalyst as a substance that increases the rate of a chemical reaction [1,2]. Today, more than 90% of all chemical processes involve at least at one point a catalytic transformation [3,4,5,6]. Prominent examples are the Ru/Os-catalyzed hydrogenation and oxidation reactions [7], the Ru/Mo-catalyzed olefin metathesis [8], and Pd-catalyzed cross-coupling reactions [9] which were awarded with the Nobel Prize in Chemistry in 2001, 2005, and 2010, respectively. It is interesting to note that 20 Chemistry Nobel Prizes have been associated with discoveries related to catalysts or catalysis [10]. According to a current report by Grand View Research, Inc., the global catalyst market size is expected to reach USD 34.1 billion by 2025 [11]. This market growth is related mainly to rising demand for polymers from automotive, electrical, and electronic industries. The growing area of nanocatalysis is an excellent example for so-called business to business (B2B) markets, leading to a new generation of patented nanocatalysts [12]. Another promising area is related to single-molecule catalysis monitored by fluorescence microscopy [13,14]. Biocatalysis is another expanding field of catalysis, which is inspired by enzymatic processes developed by nature [15,16]. Biocatalysts have become an essential tool in industrial biotechnology aimed at producing sustainably cheaper chemical products in chemical and pharmaceutical industries in an eco-friendly way [17].
These developments go hand-in-hand with the urgent need to optimize existing catalysts and to design new ones, a challenging endeavor for computational chemistry. A lot of effort has been put into the modeling of catalysis and their catalytic activities, ranging from the design and optimization of catalysts based on quantum chemical reaction modeling [18,19,20,21,22,23,24] and automated in silico catalyst design [25] to machine learning based procedures [26].
Modeling the mechanism of chemical reactions, in particular, complex catalytic cycles, at the atomic level is a formidable task, caused by high dimensionality of the potential energy surface (PES) which has to be mapped and analyzed for this purpose. Over the past few years, different methods have been explored to construct the PES, even for larger systems aiming toward chemical accuracy [27,28,29,30]; recently machine learning and artificial intelligence have been used [29,31,32,33]. Related approaches have been based on the fact that not all locations on the PES are of equal importance for a chemical reaction; examples include procedures mapping parts of the PES along reaction pathways [34,35,36,37,38,39], algorithms for automatically finding reaction paths [39,40,41,42,43], and methods working in a reduced dimensional space [44]. Numerous efforts have been devoted to the analysis of the information collected while tracing reaction paths on PESs. Some representative examples include: (i) The analysis of local reactivity descriptors, e.g., the Fukui function, and how they infer reactivity trends along the reaction path [45,46]. (ii) The reaction force and reaction force constant formalism, which is aimed at extracting information from higher derivatives of the energy profile taken along the reaction path [47,48,49], wherein one has to consider that the energy is a cumulative property, and as such the mechanistic information obtained is of more holistic nature. (iii) Monitoring changes of the topological features of the electron density [50,51] or the electron localization function [52] along the reaction path [53,54,55]. (iv) The recently suggested exploration of the PES with immersive virtual reality [56].
A complementary way of exploring the reaction mechanism is pursued in molecular dynamics (MD) simulations that allow an atomic visualization into the detail of molecular reactions on a femtosecond time scale [57,58,59,60]. MD simulations can be performed on a previously constructed PES or alternatively with a direct methodology calculating the trajectories on the fly [61,62,63]. In contrast to classical MD relying on Newton’s equation, ab initio MD is based on the Schrödinger equation. It offers a more realistic simulation of complex molecular systems and processes from first principles [64,65]. Recently, MD has also been paired with machine learning [32,66,67].
The unified reaction valley approach (URVA) [68,69,70,71,72] offers a different opportunity of gaining detailed mechanistic insights into chemical reaction mechanisms, perfectly complementing the above mentioned methodologies. URVA monitors all electronic changes in the reaction complex (RC; i.e., the union of the reacting molecules), from the pre-chemical to the post-chemical stages of the reaction based on the curving of the reaction path (RP), which the RC traces out on PES during the reaction. With regard to catalysis, URVA specifies and quantifies different catalytic activities for each reaction of a catalytic cycle and clarifies how catalysis can be related to (un)known electronic structure principles. We will present in this work the underlying concepts of URVA, followed by the application of URVA to a variety of catalytic reactions. We will conclude our article by discussing how, based on our findings, new concepts for rational catalyst design can emerge, including aspects of both chemo- and bio-catalysis, thereby serving as an incubator for enhanced interdisciplinary efforts in the design of the next generation of catalysts. In the Appendix A, the new pURVA software will be introduced.
2. The Unified Reaction Valley Approach (URVA)
2.1. Background: The Reaction Path Hamiltonian
In 1980, Miller, Handy, and Adams introduced in their seminal paper the reaction path Hamiltonian (RPH) that describes a chemical reaction in a specific region of the PES, the so-called reaction valley stretching around the RP connecting reactants, TS, and products [73]. In the same year, similar work of Kato and Morokuma [74] was published. The underlying idea was (i) the reaction valley is the location where all important mechanistic and dynamic steps of a chemical reaction take place; and (ii) the RC can be described via a large amplitude motion along the RP and the vibrations perpendicular to it, which has its roots in the early work of Hofacker [75], Marcus [76,77,78], and Hougen [79].
The RPH is a classical Hamiltonian H describing the kinetic energy T and potential energy V of the RC when moving along the RP. As the reaction path one generally chooses the steepest descent path in mass-weighted Cartesian coordinates, leading from the TS into reactant and product channels; the so-called intrinsic reaction coordinate (IRC) path, first introduced by Eliason and Hirschfelder [80], and formalized by Fukui [81].
Considering a RC of N atoms and internal coordinates (L = 6 for non-linear and 5 for linear molecules), the dimensional configurational space of H is partitioned into the one-dimensional reaction parameter s (i.e., the arc length of the RP) and its conjugated momentum describing the motion along the RP, and a set of normal coordinates and conjugated momenta ( = 2, ⋯, forming the reaction valley; i.e., the valley walls perpendicular to the = 1 direction along the RP.
The potential is approximated at each point s by the potential at s plus the potential for the harmonic displacements perpendicular to the path, defining the curvature of the valley; i.e., its steepness
with being the generalized force constant. It has to be noted that instead of a standard normal mode analysis performed at a stationary point, a generalized normal mode analysis [73,82] is necessary, which projects out at each path point s in addition to the rotations and translations of the reaction complex also the translational motion in internal coordinates along the RP from the mass-weighted Hessian matrix with a suitable projection operator [83]. This leads to the generalized Hessian
The generalized mass-weighted generalized normal vibrational modes defined in the () dimensional reaction valley space and corresponding frequencies can then be determined by solving a generalized Wilson equation [82,83]
where constant c is the speed of light.
The kinetic energy is composed of two terms; the first term corresponds to the kinetic energy part of the movement along the RP and the second term represents the kinetic energy part associated with a movement orthogonal to the path direction.
Central to the first part of the kinetic energy are the so-called coupling coefficients and . The coupling term reflects the energy transfer between modes and induced by the motion along the RP. As this motion involves a rotation of the transverse vibrational modes about the RP, they are often referred to as Coriolis couplings. The terms are given by the dot product between the normal mode vector and the change of normal mode vector with regard to s and vice versa [73]:
The coupling term reflects the translational–vibrational energy transfer between the translational motion along the RP and vibrational mode [73] induced by the curving of the RP. Since the RP is a curved line in dimensional space, its direction and curvature can be derived with the Frenet–Serret formalism [84]. The reaction path direction at a path point s is given by the unit vector :
where the derivative of the mass-weighted reaction coordinate with regard to s is the normalized mass-weighted gradient vector and is a diagonal matrix of atomic masses. The curvature vector is given by [68,83]
The can then be calculated as the dot product between the reaction path vector and the change of normal mode vector equivalent to the dot product of and the change of with regard to s, which corresponds to the reaction path curvature
As becomes larger, the mixing between the RP and vibrational mode increases and the translational–vibrational energy transfer becomes more pronounced. This can be directly monitored by the scalar curvature which is defined as [73]
Because of this relationship, the coefficients are called curvature couplings.
The main focus of the RPH was and still is to be used as a tool for the calculation of the dynamics of a chemical reaction, and in particular, the calculation of rate constants and tunneling coefficients [85,86]; or, as a valuable resource for laser spectroscopists working in the field of vibrationally driven reactions, which includes enhancement of reaction rates, manipulation of energy disposal, and promotion of a certain product channel by mode selective excitation [87,88,89,90,91,92]. However, the depth of mechanistic information provided by the RPH was not fully exploited in a systematic way, until Kraka, Cremer, and co-workers started to transform the RPH approach into an advanced mechanistic tool, known as the unified reaction valley approach (URVA) [68,69,70,93], which will be discussed in the following.
2.2. Basic Methodology of URVA
During the course of a chemical reaction, the RC changes its electronic structure. This is directly registered by the vibrational modes, which are sensitive to even the smallest electronic structure changes. The change in the vibrations leads to a change in the coupling between valley and path motions as is described by coefficients, which altogether define the scalar reaction path curvature, as shown in Equation (10). Therefore, URVA’s main focus is on the scalar curvature . Monitoring the along s leads to a unique curvature profile for each chemical reaction, with curvature maxima K and minima M as schematically shown in Figure 1a. The curvature maxima define the locations of electronic structure change, such as charge transfer and charge polarization, rehybridization, bond cleavage, and formation, and also change in the optimal orientation of the reactants for the reactive collision. Each curvature peak corresponding to a certain chemical event is flanked by two curvature minima, e.g., locations with minimal change of the RC, which can be classified as “hidden intermediates” [71,72,94,95]. Accordingly, Kraka and Cremer [69,71] defined a reaction phase as the reaction path region from one curvature minimum to the next, characterized by a curvature maximum. Different chemical reactions possess different curvature patterns with different numbers of reaction phases, which can be used as their fingerprints.
Further insight into the reaction mechanism, e.g., answering the question of which bond is broken/formed during a certain reaction phase, requires a decomposition of . In the original RPH of Miller, Handy, and Adams, a decomposition into coefficients was performed. However, for a mechanistic analysis, the coupling coefficients are of limited use because they refer to generalized normal vibrational modes, as shown in Equation (6). Normal vibrational modes are generally delocalized over part or even the entirety of a molecule because of mode–mode coupling [82]. Therefore, the first milestone of the URVA analysis was to introduce the curvature decomposition into local curvature coupling coefficients based on local vibrational modes that are associated with the internal coordinates q used to describe the RC [68]. The local vibrational mode theory, originally introduced by Konkoli and Cremer [96,97,98,99,100,101,102] derives local vibrational modes via mass-decoupled Euler Lagrange equations, which then can be used to define the local curvature coupling coefficients for the local decomposition of the reaction path curvature [68,69]
In this way, each curvature peak can be associated with a particular chemical event, as sketched in Figure 1b. Often, only a few vibrational modes at a given path position s contribute to the curving of the reaction path, which makes the analysis of larger chemical reactions feasible [68,95,103,104,105,106,107,108,109,110]. It is noteworthy that the sign of the component denotes whether it supports the chemical change (positive sign) or resists (negative sign).
The curvature decomposition into local modes via Equation (11) has been successfully applied to a number of organic reactions, such as the hydrogenation of methyl radical [68,105], FH addition to ethylene [95], 1,2-H-shift in methylchlorocarbene [103], the Diels–Alder reaction [104,106], the cycloaddition of 1,3 dipoles and ethylene or acetylene [107,108], and other pericyclic reactions [109]. However, it fails if the description of the reaction path is hampered by path instabilities (reflected by the occurrence of imaginary reaction valley frequencies). These can be caused by methodological shortcomings (e.g., in the case of bond-breaking or bond-forming processes leading to multi-reference character, which is often encountered for catalytic reactions involving transition metals) or can have a chemical origin (e.g., the reaction path bifurcates as an intrinsic feature of the PES). Any path instability precludes the description of electronic structure changes in terms of local mode curvature coupling coefficients being based on local modes . Therefore, the decomposition of the reaction path curvature in terms of geometrically-based local modes (dubbed internal coordinate component analysis) was developed, thereby offering a robust reaction path analysis which is no longer sensitive to path instabilities [110,111,112,113]. This can be considered as the second milestone of URVA that lead to a breakthrough in particular for the investigation catalysis reactions, which will be demonstrated below.
For each internal coordinate , a unit column vector can be defined [101,111] through its local mass [96,97] and Wilson’s B-matrix formalism [82], which connects internal coordinate to the Cartesian coordinates via ,
where . With the help of , Equation (7) can be rewritten in the mass-weighted internal coordinate [111],
leading to a decomposition of the reaction path direction into internal coordinate components.
The first term on the right hand side of Equation (15) is the projection of u onto the curvature vector leading to the amplitude , as each is a unit vector describing the local motion, which is driven by the internal coordinate . The amplitude is scaled by the scalar curvature corresponding to the length of the curvature vector in -dimensional space. The mixed second order term is determined by the change in the direction of with s and the tangent vector. The vector derivative du/ds that is orthogonal to is projected onto vector and therefore does not have any information on the curvature [111]. Hence, the curvature contribution of the internal coordinate is defined by the first term only; i.e.,
It has to be noted that the decomposition into any coordinate, e.g., Cremer–Pople puckering coordinates [114], is possible, as long as the corresponding B-matrix vector can be derived [106,109].
Other important features of URVA include the advanced path following procedure of Hratchian and Kraka [115], which allows a chemical reaction to be tracked far into entrance and exit channels. This is where decisive events often happen [106], particularly in the case of catalysis, as will be discussed below. URVA is not restricted to the IRC. It can be applied to any representative path. For example, in the case of barrier-less reactions without a TS for which an IRC does not exist, a representative path based on Newton trajectories can be used [94,116,117]. This led to the surprising result that barrier-less reactions such as the chelotropic reaction between methylene and ethene [94] or the spontaneous cycloaddition between vinylidene and acetylene reaction often possess a complex reaction mechanism [117]. It is important to note that the use of mass-weighted coordinates allows for a one-to-one comparison of reaction and curvature profiles in different media, i.e., gas phase versus solution or enzyme environment described by a QM/MM (quantum mechanics/molecular mechanics) approach [118]; and of reactions with different substituents. For example, the URVA study of 20 different 1,3 dipolar cycloadditions elucidated different substituent effects and the exchange of reaction partners in a compact and concise form [107,108].
The URVA study involving a multitude of catalyzed reactions in comparison with their non-catalyzed counterparts led to a number of interesting mechanistic insights which will be discussed in the following representative examples: (i) Rh-catalyzed methanol carbonylation; (ii) Sharpless epoxidation of of allylic alcohols; (iii) Au(I) assisted [3,3]-sigmatropic rearrangement of allyl acetate; and (iv) Bacillus subtilis chorismate mutase catalyzed Claisen rearrangement.
3. Computational Methods
The calculations of the methanol carbonylation catalyzed by dicarbonyldiiodorhodium [Rh(CO)I] were performed with the B3LYP density functional [119,120] utilizing Pople’s 6-31G(d,p) basis set [121,122] and the Stuttgart–Dresden (SDD) effective core potential [123] with the corresponding basis set for the Rh and I atoms [124,125]. The calculations of the Sharpless epoxidation reaction of allylic alcohols catalyzed by [Ti(tartrate)(OR)] were carried out with the B3LYP/6-31G(d,p) level of theory and utilizing the SDD effective core potential with a corresponding basis set for the Ti atom [126]. The calculation of the non-catalyzed [3,3]–sigmatropic rearrangement of allyl acetate was performed with B3LYP and Pople’s 6-31+G(d,p) basis set [127]. The Au(I) catalyzed reactions were performed at the same level of theory utilizing using the SDD effective core potential with the corresponding basis set for the Au atom [123,124]. The corresponding energetics were calculated at the DLPNO-CCSD(T) level of theory [128,129] for the DFT geometries, using for Au the same basis set as for the DFT calculations, and the cc-pVQZ Dunning basis set for all other atoms [130,131,132]. The IRC calculations of the Claisen rearrangement of chorismate to prephenate in the gas phase (R1) were performed using the B3LYP/6-31+G(d,p) level of theory. The calculations in implicit aqueous solution (R2) were performed at the same level of theory as in the gas phase using the polarizable continuum solvent model (PCM) of Tomasi [133]. The calculations in explicit water, reaction R3, were performed with a hybrid of QM/MM (quantum mechanics/molecular mechanics) as provided by the ONIOM methodology [134]. The QM part was described at the B3LYP/6-31+G(d,p) level of theory; water was modeled with TIP3P [135]. The enzyme reactions R4–R6 were also performed with QM/MM; for the MM part the AMBER General Force Field for organic molecules was utilized [136,137]. Technical details for the QM/MM calculations are provided in the Supplementary Materials.
All IRC calculations were performed with Gaussian09 [138] applying the improved reaction path following procedure of Hratchian and Kraka, enabling the tracking of a chemical reaction far out into the entrance and exit channels [115]. URVA and the local mode analysis were carried out with the COLOGNE20 program [139]. DLPNO-CCSD(T) calculations were executed with the ORCA 4.0.1 program [128]. Natural bond orbital (NBO) charges were calculated with the program NBO 6 [140]. A standalone URVA program written in python (pURVA), is described in the Appendix A.
4. Results
4.1. Rh Catalyzed Methanol Carbonylation—The Monsanto Process
Acetic acid is an important commodity chemical used in a broad range of applications [141]. In 2014, the worldwide demand was 12.1 million tons; projections estimate at least 17 million tons by 2022 [142]. Originally, acetic acid was produced by aerobic fermentation of ethanol, which is still the major process for the production of vinegar [143]. In 1970, Monsanto commercialized an improved homogeneous methanol carbonylation process using a methyl-iodide-promoted Rh catalyst [144,145]. Compared to ethanol fermentation, homogeneous Rh catalyzed methanol carbonylation is an efficient route that exhibits high productivity and yields. However given the reaction conditions (pressure: 30–60 bar; temperature: 150–200 C) there is room for improvement [141,146,147]. As shown in the center of Figure 2, the catalytic cycle involving the original Monsanto catalyst [RhI(CO)] involves four steps: step 1, oxidative addition; step 2, methyl group migration; step 3, carbon monoxide insertion; and step 4, reductive elimination of product and catalyst regeneration [144,145]. The corresponding curvature profiles and their decomposition into internal coordinate components provide direct access to the most important chemical events taking place in each catalysis step, which will be discussed in the following.
Step 1 is characterized by a longer preparation phase 1 aligning the reaction partners. In phase 2, a smaller curvature peak develops caused by the beginning of the formation of the new Rh–C bond (blue line, resisting) and the formation of the new Rh–I bond (red line, supportive). In phase 3 with a more pronounced curvature peak, both Rh–I and Rh–C bond formation continue and C–I bond cleavage of the CHI reactant starts (all supportive). Three observations are noteworthy which are typical for catalysis reactions: (i) several chemical events take place at the same time; (ii) they are often accompanied by a change of the coordination number of the metal atom—in this case the Rh coordination number changes from 4 to 6; and (iii) bond formation/breakage can stretch over several phases—here, Rh–I and Rh–C bond formation is finalized in phase 5, i.e., after the TS, where the reaction is already on a downhill path, and therefore does not require further energy to proceed. In step 2 migration of the methyl group from Rh to the one of the CO ligands takes place. This process is initiated by the bending of the equatorial iodine atom (I–Rh–C angle, green line) dominating phases 2 and 3. In phase 4 the breakage of the Rh–C bond (blue line) starts with a small contribution from the new C–C bond formation (orange line). The actual finalization of the bond breaking/forming process occurs simultaneously with a reorganization of the Rh–CO bond (purple line) after the TS. During this process, Rh changes its coordination number from 6 to 5. The following step (step 3) is characterized by CO insertion, a barrier-less process in which Rh restores its coordination number from 5 to 6. The final step (step 4) involves breakage of the Rh–C bond between Rh and the acetic acid group, migration of one iodine atom to the acetic acid group, i.e., breakage of one Rh–I bond, and formation of the new C-I bond. As depicted by the curvature decomposition, this complex process starts in phase 2 with a reorientation of the methyl hydrogens, as reflected by the torsional angle RhCCH (purple line, shown representatively for one of the methyl hydrogens) helping to initiate the breaking of the Rh–C bond (blue line) and the formation of the new C–I bond (green line, first resisting) which takes the lead in phase 4 before the TS. The breakage of the Rh–I bond (read line) contributes only marginally to the curvature peaks before the TS. All three bond breaking/forming processes are finalized synchronously in phase 4 after the TS, i.e., without further energy demand. Reaction movies for each steps can be found in the Supplementary Materials, Videos S1–S4.
The next step of the analysis is to combine mechanistic and energy information. As obvious from the data in Table 1 showing the energetics of each reaction step, step 1 is most demanding with an activation energy of 45.0 kcal/mol, whereas steps 2 and 4 have activation energies of 20.0 and 29.9 kcal/mol, whereas 3 proceeds without a barrier. Clearly, the high barrier of step 1 is the reason for the harsh reaction conditions. Further insight is needed to clarify which chemical events of this reaction step lead to such a high barrier. This can be gained by analyzing how much energy is consumed in each reaction phase up to the TS. As depicted in Table 1 approach of the reactants in step 1 requires 13.2 kcal/mol, and formation of the Rh–C bond 12.0 kcal/mol, whereas the cleavage of the C–I bond is, with 17.1 kcal/mol, the most energy demanding process. In step 2 the breakage of the Rh–C bond is with 16.0 kcal/mol most expensive, and in step 4 the breakage of the Rh–C bond with 12.7 kcal/mol. These findings provide valuable information for catalyst modification. We are currently investigating a selenium functionalized bis(phosphino)methane rhodium catalyst [Rh(CO)Cl(PHCHPH(Se))] [148] which could help via chelating the reactant to shorten the long approach phase and via polarization of the C–I bond supporting C–I bond breakage in the first step, lowering in this way the activation energy of step 1—an important move toward milder reaction conditions.
4.2. Sharpless Epoxidation of Allylic Alcohols—Transition to Heterogenous Catalysis
In 1980, Katsuki and Sharpless reported the enantioselective synthesis of 2,3-epoxyalcohols in the presence of hydroperoxide, (mostly t-butylhydroperoxide), a titanium (IV)-tartrate-diester catalyst, and a secondary allylic alcohol [149]. Given the commercial availability and low cost of the reagents, the high enantioselectivity of the reaction, and the versatility of the resulting chiral epoxides, this method has become an essential tool in organic synthesis [150,151,152,153,154]. As sketched in Figure 3a the Ti-tartrate -diester catalyst [Ti(IV)(tartrate) (OR)] forms a chiral dimer that controls the stereochemical outcome of the epoxidation process. The allylic alcohol binds to one of the Ti centers together with the hydrogen peroxide oxidant, as shown in Figure 3b, so that the metal center can support the breakage of the peroxide O–O bond and guide the subsequent transfer of the coordinated hydrogen peroxide oxygen atom to the ethylene unit of the allylic alcohol to form the two new CO epoxide bonds. After epoxide formation, Ti coordinates the cleaved OR part of the hydrogen peroxide.
We performed an URVA study of the Sharpless epoxidation reaction for a number of different epoxy alcohols to clarify the question of whether the curvature profile for such a complex system still discloses the basic reaction mechanism, i.e., uncovers the most important features of the reaction mechanism. In the following we will discuss the reaction for but-2-en-1-ol, methyl-hydroperoxide, and a dimeric Ti(IV) model catalyst, which was derived from the crystal structure of original Sharpless catalyst [154] with the simplifications shown in Figure 3b. A reaction movie can be found in the Supplementary Materials, Video S5.
As shown in Figure 4, we found seven distinct reaction phases. The calculated activation energy is 20.8 kcal/mol, which is almost 20 kcal/mol lower than that for the non-catalyzed reaction [155]. The reaction is exothermic by 42.2 kcal/mol; see Figure 4a. The corresponding curvature diagram shown in Figure 4b provides the mechanistic details. The reaction starts with the preparation phases 1 and 2, which are characterized by allyl group rotations and the orienting of the migrating oxygen atom O1 of the peroxide into a perfect position above the double bond, (see reaction Video S5, Supplementary Materials). Phase 3, the most energy consuming phase requiring 14.2 kcal/mol, is dominated by the breakage of the peroxide bond (red line). The formation of the new epoxide bonds starts (O1–C2, green line; O1–C1 blue line, both resisting) and there are also smaller contributions from TiO1 (orange line); i.e., the Ti–O bond to be broken and from TiO2 (olive line) the new Ti–O bond to be formed during the epoxidation process. In phase 4 including the TS, the TiO1 bond takes over the lead; it lengthens and O1 approaches the double bond. It is noteworthy that the curvature around the TS is small, confirming a general finding that in many reactions, including catalytic reactions, important chemical events take place before or after TS. (A prominent example is the Diels Alder reaction. The curvature profile of this reaction shows only one large curvature peak far out in the exit channel corresponding to the formation of the two new CC bonds—a signature of symmetry allowed reactions [104,106,111]). The synchronous finalization of the new C–O bonds occurs in phase 5, after the TS, i.e., without further energy request. This process is accompanied by the finalization of O–O bond breakage, which stretches into phase 6, the cleavage of TiO1, and the formation of TiO2 bonds. Phase 7 is devoted to allyl group rotation and reorientation of the expoxide, (see reaction Video S5, Supplementary Materials). Clearly, the catalytic activity is based on the topology of the dimeric Ti catalyst framework, channeling the hydroperoxide oxidant into a central position for the attack of the CC double bond of the allyl alcohol, which is coordinated in a way that allyl group rotations are feasible for optimal orientation.
One can say that the dimeric Ti catalyst mimics a surface typical of the heterogenous catalysis, thereby facilitating a stereospecific collision of the reaction partners. The peroxide O–O bond glides over the Ti atom. During this process, the metal atom polarizes the oxygen atoms, facilitating O–O bond breakage. Another important feature of the Sharpless reaction is that both new C–O epoxide bonds are synchronously finalized after the TS, i.e., without energy consumption; i.e., catalyst optimization should predominantly focus on improving O–O breakage. This example clearly shows that the curvature diagram unravels all mechanistic details, even for complex reactions, confirming that the chemical events are mostly characterized by a few significant parameters at a time.
4.3. Au(I) Assisted [3,3]-Sigmatropic Rearrangement of Allyl Acetate
Gold catalysis offers a large spectrum of organic transformations under mild conditions with high yields [156,157,158,159,160,161,162,163,164,165]. In particular, cationic gold complexes efficiently activate intra or intermolecularly, CC, CN, or CO multiple bonds for a nucleophilic attack [112,159,166,167,168], whereas Au(III) catalysts can be considered as hard Lewis acids with a higher oxophilic character, being useful when d-holes are needed [169,170]; Au(I) species are soft Lewis acids with high carbophilic character and high affinity to coordinate with carbon -systems [166,167]. Au(I) phosphine complexes are primarily applied. However, Au(I) complexes with heterocyclic carbenes (NHC) ligands [171,172] are an interesting alternative; NHCs are easier to synthesize and to handle than their phosphine counterparts, because they are less likely to dissociate during a chemical reaction from the attached metal atom; they are stronger -donors than most electron rich phosphines, and they display a broader range of versatility and regio-selectivity [173,174,175,176].
Gold-catalyzed sigmatropic rearrangements have been successfully applied in gold catalysis over the past decade [177], such as the gold catalyzed Claisen rearrangement of propargylic esters, which undergo intramolecular 1,2-ester or 1,3-ester migration [168]. We elucidated the mechanistic differences of the non-catalyzed and the Au(I)-NHC catalyzed [3,3]-sigmatropic rearrangement of allyl acetate via a comprehensive URVA study, including the investigation of the influence of solvation, counterions, bulky, and electron withdrawing/donating substituents as well as the exchange of the Au(I)-NHC with a Au(I)-phosphine catalyst [110].
In agreement with previous theoretical studies [178], we could confirm that the non-catalyzed rearrangement reaction proceeds in one step (DLPNO-CCSD(T): activation energy E of 45.9 kcal/mol and a reaction energy E of 0.7 kcal/mol) [110]; see Figure 5. A barrier of this height prevents the non-catalyzed reaction from being useful in synthesis. In contrast, the catalyzed reaction proceeds in two steps via a Au(I)-acetonium intermediat (DLPNO-CCSD(T): step 1, E of 18.2 kcal/mol and E of 12.5 kcal/mol; step 2, E of 2.3 kcal/mol and E of -9.2 kcal/mol) [110].
In the following we will focus on one important aspect of this study; namely, how the analysis of the reaction path curvature leads to a detailed understanding of the mechanistic differences between the gas phase reaction and its catalyzed counterpart. Reaction movies following the evolution of the RC along the reaction path are provided for both the non-catalyzed and the two steps of the catalyzed reaction in the Supplementary Materials, Videos S6–S8. More details about environmental and substituent effects can be found in [110].
Figure 6a shows the curvature diagram of the non-catalyzed reaction. The pre-chemical phases 1 and 2 are characterized by the rotation of methyl groups and the acetate unit and phase 3 by a pseudo-rotation of the 6-membered ring reducing the distance between the C and O atoms, which are supposed to form a new chemical bond (see Video S6, Supplementary Materials). CO bond formation (red line) starts already in the pre-chemical phases 2–4. The essential chemical event in phase 5 is the cleavage of the CO bond dominating curvature peak K3 (blue line). Phase 6, containing the TS, is characterized by a smaller curvature peak K4. It is interesting to note that the RC adapts a boat form at the TS with CO and CO distances close to 2.1 Å. Both the CO and the CO bonds resist a further change in this phase (see Video S6, Supplementary Materials), indicating the possibility to break up the reaction in this area into two steps with lower activation energies, e.g., with a catalyst that transforms the TS of the non-catalyzed reaction into a stable intermediate, as depicted in Figure 5. In phase 7, leading to the curvature peak K5, the formation of the new CO bond is finalized. Phases 8–10 are characterized by six-membered ring pseudo-rotations and a rotation of acetate methyl-group. In summary, the most important curvature peaks comprise: K3 before the TS (breakage of the CO bond), K4 close to the TS (boat form of the RC with equal CO and CO bond lengths), and K5 after the TS (finalization of CO bond formation).
Figure 6b,c shows the corresponding curvature diagrams of step 1 and step 2 of the Au(I)-NHC catalyzed reaction, revealing the major difference between the non-catalyzed and catalyzed reaction (see also Videos S7 and S8, Supplementary Materials). In step 1 (Figure 6b), first, the new CO bond is formed with the CO bond to be broken still being intact. During this process, the -bonded gold complex transforms into an intermediate -bonded Au(I) complex, strongly resembling the TS of the non-catalyzed reaction. The curvature peaks K1 and K2 before the TS are dominated by the loosening of the Au(I)-C interaction (green line), which is less energy demanding than breaking a CO bond. The formation of the Au(I))--complex is endothermic by 12.5 kcal/mol (DLPNO-CCSD(T)) [110]; therefore, in step 2 (see Figure 6c) the regeneration of a stable Au(I)--complex takes place, which includes the almost effortless breakage of the CO bond.
In essence, the URVA analysis clearly shows how the Au(I) catalyst breaks up the non-catalyzed rearrangement into two steps by easily switching between Au(I)- and Au(I)- complexation. These findings form the basis for a more general route map: (i) study the curvature diagram of the non-catalyzed reaction; (ii) identify energy consuming events before the TS and hidden intermediates, which could be the starting point for splitting the reaction into several steps and (iii) finding a catalyst which can (a) transform the hidden intermediates into real intermediates, and (b) can move energy-consuming events (i.e., bond breakage) into the exit channel.
4.4. Bacillus Subtilis Chorismate Mutase Catalyzed Claisen Rearrangement
In recent years, one has put a lot of emphasis on substituting traditional chemical processes relying on heavy metal catalysts (often leading to toxic byproducts) with nature’s powerful way of producing environmentally pure compounds under eco-friendly conditions using enzymes as catalysts. This new trend goes hand–in–hand with the development of new technologies in enzyme engineering [179,180,181,182,183]. If chemists would be able to use catalysts as effectively as nature uses enzymes, most of the sustainability problems in connection with chemistry could be solved. If we succeeded in mimicking aspects of natural processes while implementing features of traditional catalysts, we could take the precision and selectivity of catalysis to an entirely new level. One important prerequisite for this ambitious goal is the detailed understanding of the mechanism of enzyme catalysis at the atomic level, which is still in its infancy and often refers to more approximate methods and/or descriptions [184,185,186,187,188,189,190,191,192].
Our first successful URVA QM/MM enzyme study was the Bacillus subtilis chorismate mutase (BsCM) catalysed Claisen rearrangement of chorismate to prephenate [118]. This rearrangement forms an important part of the shikimate pathway controlling the synthesis of aromatic amino acids in the cells of fungi, bacteria and plants [193,194,195]. It is also interesting from a mechanistic point of view; being one of the few pericyclic processes taking place in a biological system, it provides a rare opportunity for studying how nature promotes such rearrangements so successfully.
Although it has been the object of numerous experimental and theoretical studies (for a comprehensive overview, see [118]), the actual enzyme mechanism lowering the reaction barrier has been still under debate suggesting the following alternatives: (i) the enzyme changes the rearrangement mechanism, (ii) space confinement of the chorismate in the active site plays a key role, or (iii) the enzyme lowers the barrier by stabilizing the TS via specific H-bonding, in particular between the migrating ether oxygen and Arg90. In order to shed light into this debate, we compared the mechanism in the gas phase (reaction R1), in solution (reactions R2 and R3) and in the enzyme (reactions R4–R6), as depicted in Figure 7. Reaction movies for reactions R1–R5 showing the evolution of the RC along the reaction path are provided in the Supplementary Materials, Videos S9–S14. In Figure 8 the QM/MM-optimized geometry of the BsCM-chorismate complex is shown.
Figure 9 shows the energy profiles for reactions R1–R6. The activation energy of the chorismate rearrangement decreases successively from the gas phase to the solution for the reaction in the BsCM; = 24.4 kcal/mol; = 19.7 kcal/mol; = 17.3 kcal/mol; = 11.6 kcal/mol; = 10.4 kcal/mol. Additionally, as expected, modification of the enzyme increases the activation energy, = 14.9 kcal/mol, (values from [118]). While these findings confirm the biological activity of BsCM, they do not provide any mechanistic details, because the energy is a cumulative property, showing the overall effects. Mechanistic details can be disclosed by the investigation of the corresponding curvature diagrams.
In Figure 10 the curvature diagrams of gas phase reaction R1 and enzyme reaction R5 are compared. This comparison clearly reveals that the reaction mechanism is the same for both media. There are two pronounced curvature peaks K1 in phase 3 and K3 in phase 5, separated by a smaller curvature enhancement K2 located in phase 4 containing the TS. The actual chemical process of C6O8 bond cleavage and C1C10 formation follows a similar pattern also for reactions R2–R4 and R6 [118] (not shown here), in line with the suggestion of several authors [196,197] that the mechanism of the chorismate rearrangement is the same in gas phase, solution, and in the enzyme. K1 located in phase 3 is the most pronounced peak before the TS. This peak is dominated by the C6O8 bond to be broken (red line) accompanied by a small resisting contribution of C1C10 (blue line), the new bond to be formed. Phase 4 is characterized by negative contributions from C6O8 and C1C10; i.e., a resistance to further change. The finalization of C1C10 bond formation and C6O8 bond cleavage occur after the TS in phase 5, characterized by curvature peak K3. This confirms the suggestion of several authors [198,199,200], that the actual bond breaking and bond forming processes are asynchronous. Noteworthy is that again the TS does not play any significant mechanistic role, as is reflected by the small curvature enhancement K2. In contrast to the Au(I)-assisted [3,3]-sigmatropic rearrangement of allyl acetate changing the bond forming/breaking process, the mechanistic differences between R1 and R5 leading to the different activation energies are related to the pre-chemical phases. While R1 is characterized by long pre-chemical phases 1 and 2 with curvature peak K4, in R5 the chemical phase 3 starts right away; i.e., while docked into the enzyme, the enolpyruvyl side chain of the chorismate is already in an optimal position to react with the cyclohexadienyl part. This clearly proves that space confinement is the key feature of the BsCM catalysis.
It has been suggested that intramolecular charge transfer from the enolpyruvyl part to the cylohexadienyl unit helps accelerating the rearrangement by decreasing the repulsion between these two negatively charged groups, which have to approach each other to form prephenate [196]. Figure 11a,b shows the total NBO charge of the enolpyruvyl group (in red color) and that of the 4-hydroxy-1,5-cyclohexdiene-1-carboxylate group (in blue color) as a function of the reaction parameter s, for the gas phase reaction R1 and the enzyme reaction R5, respectively. In the gas phase, charge transfer from enolpyruvyl to cyclohexadienly starts at K1, goes through a minimum at M4 where both parts are equally charged. After M4, a small charge transfer occurs in the opposite direction; see Figure 11a. In the enzyme reaction R5 the actual charge transfer from enolpyruvyl to cyclohexadienly starts after the TS, see Figure 11b. This clearly shows that charge transfer from the enolpyruvyl to the cyclohexdienyl group cannot contribute to the lowering of the energy barrier.
Several authors emphasized that BsCM could lower the barrier by selective H-bonding with the TS [201,202,203]. Most of these studies assume that the strength of a H-bond can be assessed from the H-bond distance. However, the shorter bond is not always the stronger bond [204,205,206]. Our local mode analysis has led to a unique and quantitative measure of bond strength based on vibrational spectroscopy [118,205,206,207,208,209,210,211,212,213,214,215,216,217,218,219,220,221,222,223,224,225,226,227,228,229,230,231,232] utilizing local mode force constants and related bond strength orders (BSO)s, which can be derived from local mode force constants via a generalized Badger rule [101,233] and two reference compounds with known bond strength orders. For H-bonds usually FH, n = 1 and FH, n = 0.5 are taken [213]. Applying the local mode analysis to the reactant, product, and TS of reaction R5 we could quantify that the enzyme does not lower the barrier via specific H-bonding in the TS, refuting these suggestions.
In Figure 12 the intermolecular H-bonds between the BsCM active site pocket and the reactant, TS, and product of reaction R5 are shown. According to Figure 12 there are 5 H-bonds (labelled with blue numbers) between the enzyme and the substrate which do not change during the reaction, showing that the enzyme confines the chorismate in an optimal position for the rearrangement already in the entrance channel. This complies with our finding that in the enzyme there is no longer a pre-chemical phase. The carboxylate group of the enolpyruvyl part of the reactant forms two strong H-bonds with Arg7 (BSO values of 0.332 and 0.333, H-bonds 1 and 2, respectively), one H-bond with Arg90 (BSO value of 0.329, H-bond 3), and one H-bond with Glu78 (BSO value of 0.278, H-bond 4), with comparable values for TS and product, and also comparable with the H-bonds of some reference systems shown in Figure 12. For H-bond 5 between the ether oxygen O8 and Arg90, which has been declared in several studies as the major source for the enzyme-TS stabilization [201,202,203,234] we find only a slight increase of the BSO for the TS, (BSO value of 0.304 compared with 0.290 for chorismate and 0.301 for prephenate).
In summary, the analysis of the reaction path curvature indisputably confirms that the actual mechanism of the chorismate rearrangement is the same in the gas phase, solution and enzyme. The process of CO bond cleavage starts before the TS and the new CC bond formation is finalized after the TS. There are significant differences in the pre-chemical phases, which are a result of the different environments. The pre-chemical phases become shorter in aqueous solution and disappear for the enzyme reaction; i.e., the chemical process of CO bond cleavage starts directly in the entrance channel. These findings are supported by the local mode analysis revealing that the inter-molecular H-bond network between BsCM and chorismate keeps the chorismate in an optimal position for the rearrangement process.
5. Conclusions
URVA is a powerful quantum chemical tool for a comprehensive and detailed study of chemical reaction mechanisms. URVA records all chemical events as the RC follows the energy valley from the entrance channel through the TS into the exit channel leading to the final products. All chemical events can be identified by analyzing the curvature of the reaction path, as shown in this review. This makes URVA feasible also for large molecular systems with many degrees of freedom and for complex reaction mechanisms, as found in catalysis. The unique curvature profile, i.e., the fingerprint of the chemical reaction, helps finding in the most efficient way, the mechanistic needles in the haystack.
The four reactions presented in this work provide a flavor of how URVA discloses the different facets of catalysis, and how based on the URVA analysis new guidelines for catalyst fine-tuning and rational catalyst design can emerge.
- The Rh catalyzed methanol carbonylation is an example for a coordination-sphere-driven catalysis catalyzing a chemical reaction by changing the coordination sphere of the transition metal to facilitate bond forming/bond breaking processes. The Rh coordination number changes from 4 to 6 in step 1, from 6 to 5 in step 2 from 5 to 6 in step 3 and back to 4 in step 4. Step 1 with an activation energy of 45.0 kcal/mol is the cause of the harsh reaction conditions. URVA identifies the approach of the reactants and the cleavage of the C–I bond as the most energy demanding processes of this step. These findings provide valuable information for catalyst modification aiming at milder reaction conditions. The long approach phase can be shortened by chelating the reactant and C–I bond breakage can be supported via polarization of the C–I bond, which will lower the overall activation energy. Work is in progress along these lines.
- In the Sharpless epoxidation of allylic alcohols the dimeric Ti catalyst mimics a surface typical of heterogenous catalysis, thus facilitating a stereospecific collision of the reaction partners, where the O–O bond of the oxidizing peroxide glides over the Ti atom. During this process the metal atom polarizes the peroxide oxygen atoms facilitating O–O bond breakage. Another important feature of the Sharpless reaction revealed by URVA is that both new C–O epoxide bonds are synchronously finalized after the TS, i.e., without energy consumption. Therefore, catalyst optimization should predominantly focus on further support of O–O breakage.
- The URVA analysis of Au(I) assisted [3,3]-sigmatropic rearrangement of allyl acetate shows how the Au(I) catalyst breaks up the non-catalyzed rearrangement into two energy saving steps by switching between Au(I)- and Au(I)- complexation. The unfavorably high activation energy of non-catalyzed reaction is caused the fact that the migrating CO bond is broken before the TS. In contrast, the -acidic cationic Au(I) catalyst forms a Au(I)--complex via the ethylene unit in the first step, supports the formation of the new CO bond while conserving the CO bond to be broken, and transforms at the end of this step into an intermediate Au(I)--complex resembling the TS of the non-catalyzed reaction. In the second step, the Au(I)--complex transforms back into a more stable Au(I)--complex including the energy conserving breakage of the migrating CO bond.
- The Bacillus subtilis chorismate mutase catalyzed Claisen rearrangement is an example for space-confinement-driven catalysis, perfectly designed by nature. URVA indisputably proves that the actual mechanism of the chorismate rearrangement is the same in the gas phase, solution and in the enzyme. The process of CO bond cleavage starts before the TS and the new CC bond formation is finalized after the TS. There are subtitle differences in the pre-chemical phases, which are a result of the different environments. The pre-chemical phases become shorter in aqueous solution and disappear for the reaction in the enzyme, where the chemical process of CO bond cleavage starts directly in the entrance channel. The local mode analysis reveals that the inter-molecular H-bond network between chorismate and BsCM does not change during the whole rearrangement, which eliminates suggestions that the enzyme lowers the barrier by stabilizing the TS through specific H-bonding.
The comparison of non-catalyzed and catalyzed reactions has led to a first roadmap for catalyst design comprising: (i) Analysis of the curvature diagram of the non-catalyzed reaction. (ii) Identification of the energy consuming events before the TS and of potential hidden intermediates as key locations for splitting the reaction into several energy conserving steps. (iii) Identification of a catalyst which can transform the hidden intermediates into real intermediates and/or can move energy consuming events into the exit channel. We hope that this review will attract the attention of the computational community and that in the future URVA will be applied as a mechanistic tool to a broad range of chemical reactions, in particular catalytic reactions.
Supplementary Materials
The following are available online at https://0-www-mdpi-com.brum.beds.ac.uk/2073-4344/10/6/691/s1: Technical details of the QM/MM calculations. Table S1: Description of reaction videos and IRC coordinate files of the chemical reactions discussed in this study. Figure S1: Browsing file version 1 with storage of the Hessian at one representative IRC point s. Figure S2: Browsing file version 2 with storage of reaction path direction and reaction path curvature instead of gradient and Hessian at one representative IRC point s. Reaction movies and IRC coordinate files S1–S14.
Author Contributions
Conceptualization, E.K.; methodology, E.K., W.Z., and Y.T.; software, Y.T. and W.Z.; validation, Y.T. and M.F.; data curation and formal analysis, M.F.; writing—original draft preparation, E.K.; writing—review and editing, E.K., Y.T., M.F., and W.Z.; visualization, M.F. and Y.T.; supervision, E.K.; funding acquisition, E.K. and W.Z.; Y.T. and M.F. contributed an equal amount. All authors have read and agreed to the published version of the manuscript.
Funding
This work was financially supported by the National Science Foundation (grant CHE 1464906). W.Z. was supported by National Natural Science Foundation of China (grant number 21673175) and the Double First-Class University Construction Project of Northwest University.
Acknowledgments
This work is dedicated to Dieter Cremer (1944–2017) who was instrumental for the success or URVA. We thank SMU for providing generous computational resources. We thank Pratanphorn Nakliang for assistance with the Sharpless calculations and we thank Vytor Oliveira, Alexis Delgado, Malgorzata Makos, and Daniel Sethio for fruitful discussions and suggestions.
Conflicts of Interest
The authors declare no conflict of interest.
Abbreviations
The following abbreviations are used in this manuscript:
| URVA | unified reaction valley approach |
| pURVA | standalone program of the unified reaction valley approach, written in python |
| RC | reaction complex |
| RP | reaction path |
| TS | transition state |
| RPH | reaction path Hamiltonian |
| PES | potential energy surface |
| IRC | intrinsic reaction coordinate |
| DFT | density functional theory |
| B3LYP | Becke 3–parameter Lee–Yang–Parr functional |
| SDD | Stuttgart–Dresden effective core potential |
| DLPNO–CCSD(T) | domain based local pair natural orbital coupled cluster |
| PCM | polarizable continuum solvent model |
| TIP3P | three–site transferrable intermolecular potential |
| QM/MM | quantum mechanics and molecular mechanics |
| ONIOM | Own N–layer integrated molecular orbital and molecular mechanics |
| ARG | arginine |
| GLU | glutamic acid |
| H-bond | hydrogen bond |
| NHC | N–heterocyclic carbene |
| BsCM | Bacillus subtilis chorismate mutase |
| NBO | natural bond orbital |
| BSO | bond strength order |
Appendix A. pURVA
Figure A1 shows a flowchart of the standalone URVA program package pURVA (written in python, ca. 10,000 lines of code). pURVA scans and processes data were saved during the IRC calculation in a so-called browsing file. The only requirement is that the quantum chemistry package applied for the IRC calculation provides first and second-order analytical energy derivatives for the model chemistry used. If the quantum chemical package is supporting analytic second-order analytical energy derivatives but does not have an IRC functionality, it can be interfaced to another package which supports this feature. In order to reach out far into the entrance and exit channels with sufficient accuracy, an advanced reaction path following procedure such as the improved predictor-corrector integrator by Hratchian and Kraka [115] is recommended.
Figure A1.
Flowchart of the pURVA software.

For small to medium-sized systems being composed of N atoms (e.g., Sharpless reaction), Cartesian coordinates (), gradient () and the Hessian matrix ( are saved at each IRC step s in browsing file version 1 () (see Figure A1, left box) while following the IRC. However, this procedure is no longer feasible for large QM/MM systems, because in this case N equals the number of all QM+MM atoms, which can easily reach values of 5000 and more, so that the storage of the Hessian matrix at each IRC step could lead to a browsing file size of more than 1 Gb. Therefore, we resort to the alternative option for large systems, calculate the reaction path direction vector and curvature vector directly during the reaction path following (i.e., on the fly), and save the calculated path direction/curvature vectors in the browsing file; i.e., browsing file version 2 () (see Figure A1, right box). In this way the storage of large Hessian matrices is avoided. This procedure benefits from the direct decomposition of path direction and curvature into internal coordinate components using geometrically defined -modes as alternative to the dynamically defined local -modes (see above), which would require Hessian information. Browsing file can be converted into browsing file with an external script. Examples for both browsing files can be found in the Supplementary Materials (Figures S1 and S2).
When only browsing file is available, pURVA analyzes (i) changes in the geometric properties (e.g., bond length, bond angle, and other internal coordinate parameters) along the path and (ii) the decomposition of reaction path direction/curvature into internal coordinate contributions. When the browsing file is available, pURVA analyzes, in addition, (iii) the decomposition of the reaction path curvature into normal modes (curvature coupling coefficients ) and local modes (adiabatic mode coupling coefficients ), and (iv) the normal mode frequencies in the () subspace. Post-processing scripts preparing the input for the graphical displays of URVA properties as a function of the reaction path parameter s are available and software (e.g., VMD) can be used for creating movies following the geometric changes of the reaction complex.
Additional important technical features of pURVA include (i) the automatic recognition of spikes (which could be falsely interpreted as curvature peaks), (ii) the automatic smoothing of the reaction path curvature profile, and (iii) the calculation of the curvature at the TS based on L’Hospital’s rule. The pURVA code can be obtained upon request.
References
- Beckman, J. The Publication Strategies of Jöns Jacob Berzelius (1779–1848): Negotiating National and Linguistic Boundaries in Chemistry. Ann. Sci. 2016, 73, 195–207. [Google Scholar] [CrossRef] [PubMed]
- Wisniak, J. The History of Catalysis. From the Beginning to Nobel Prizes. Educ. Quim. 2010, 21, 60–69. [Google Scholar] [CrossRef]
- Paul, C.J.K. (Ed.) Contemporary Catalysis: Science, Technology, and Applications; Royal Society of Chemistry: London, UK, 2017. [Google Scholar]
- Ruiz, J.C.S. (Ed.) Applied Industrial Catalysis; Arcler Press LLC: New York, NY, USA, 2017. [Google Scholar]
- Ludwig, J.R.; Schindler, C.S. Catalyst: Sustainable Catalysis. Chem 2017, 2, 313–316. [Google Scholar] [CrossRef] [Green Version]
- Zhou, Q.L. Transition-Metal Catalysis and Organocatalysis: Where Can Progress Be Expected? Angew. Chem. Int. Ed. 2016, 55, 5352–5353. [Google Scholar] [CrossRef] [Green Version]
- Chelucci, G.; Baldino, S.; Baratta, W. Recent Advances in Osmium–Catalyzed Hydrogenation and Dehydrogenation Reactions. Acc. Chem. Res. 2015, 48, 363–379. [Google Scholar] [CrossRef]
- Do, J.L.; Mottillo, C.; Tan, D.; Štrukil, V.; Friščić, T. Mechanochemical Ruthenium–Catalyzed Olefin Metathesis. J. Am. Chem. Soc. 2015, 137, 2476–2479. [Google Scholar] [CrossRef]
- Biffis, A.; Centomo, P.; Del Zotto, A.; Zecca, M. Pd Metal Catalysts for Cross–Couplings and Related Reactions in the 21st Century: A Critical Review. Chem. Rev. 2018, 118, 2249–2295. [Google Scholar] [CrossRef]
- Jones, J.W. Another Nobel Prize for Catalysis: Frances Arnold in 2018. ACS Catal. 2018, 8, 10913. [Google Scholar] [CrossRef] [Green Version]
- Grand View Research, Inc. Catalyst Market Size; Grand View Research, Inc.: San Francisco, CA, USA, 2019. [Google Scholar]
- Olveira, S.; Forster, S.P.; Seeger, S. Nanocatalysis: Academic Discipline and Industrial Realities. J. Nanotech. 2014, 2014, 324089. [Google Scholar] [CrossRef] [Green Version]
- Chen, P.; Zhou, X.; Andoy, N.M.; Han, K.S.; Choudhary, E.; Zou, N.; Chen, G.; Shen, H. Spatiotemporal Catalytic Dynamics within Single Nanocatalysts Revealed by Single–Molecule Microscopy. Chem. Soc. Rev. 2014, 43, 1107–1117. [Google Scholar] [CrossRef] [Green Version]
- Liu, X.; Chen, T.; Song, P.; Zhang, Y.; Xu, W. Single–Molecule Nanocatalysis of Pt Nanoparticles. J. Phys. Chem. C 2018, 122, 1746–1752. [Google Scholar] [CrossRef]
- Tripathi, P.; Sinha, S. Industrial Biocatalysis: An Insight into Trends and Future Directions. Curr. Sustain. Renew. Energy Rep. 2020, 64, 1–7. [Google Scholar] [CrossRef]
- Sandoval, B.A.; Hyster, T.K. Emerging Strategies for Expanding the Toolbox of Enzymes in Biocatalysis. Curr. Opin. Chem. Biol. 2020, 55, 45–51. [Google Scholar] [CrossRef] [PubMed]
- Adams, J.P.; Brown, M.J.B.; Diaz-Rodriguez, A.; Lloyd, R.C.; Roiban, G.D. Biocatalysis: A Pharma Perspective. Adv. Synth. Catal. 2019, 361, 2421–2432. [Google Scholar] [CrossRef] [Green Version]
- Ahn, S.; Hong, M.; Sundararajan, M.; Ess, D.H.; Baik, M.H. Design and Optimization of Catalysts Based on Mechanistic Insights Derived from Quantum Chemical Reaction Modeling. Chem. Rev. 2019, 119, 6509–6560. [Google Scholar] [CrossRef]
- Durand, D.J.; Fey, N. Computational Ligand Descriptors for Catalyst Design. Chem. Rev. 2019, 119, 6561–6594. [Google Scholar] [CrossRef] [Green Version]
- Vogiatzis, K.D.; Polynski, M.V.; Kirkland, J.K.; Townsend, J.; Hashemi, A.; Liu, C.; Pidko, E.A. Computational Approach to Molecular Catalysis by 3d Transition Metals: Challenges and Opportunities. Chem. Rev. 2019, 119, 2453–2523. [Google Scholar] [CrossRef] [Green Version]
- Quesne, M.G.; Silveri, F.; de Leeuw, N.H.; Catlow, C.R.A. Advances in Sustainable Catalysis: A Computational Perspective. Front. Chem. 2019, 7, 182–205. [Google Scholar] [CrossRef] [Green Version]
- Harvey, J.N. Mechanism and Kinetics in Homogeneous Catalysis: A Computational Viewpoint. In Transition Metals in Coordination Environments. Challenges and Advances in Computational Chemistry and Physics; Broclawik, E., Borowski, T., Radoń, M., Eds.; Springer: New York, NY, USA, 2019; Volume 29, pp. 289–314. [Google Scholar]
- Grajciar, L.; Heard, C.J.; Bondarenko, A.A.; Polynski, M.V.; Nachtigall, P. Towards Operando Computational Modeling in Heterogeneous Catalysis. Chem. Soc. Rev. 2018, 47, 8307–8348. [Google Scholar] [CrossRef] [Green Version]
- Lam, Y.; Grayson, M.N.; Holland, M.C.; Simon, A.; Houk, K.N. Theory and Modeling of Asymmetric Catalytic Reactions. Acc. Chem. Res. 2016, 49, 750–762. [Google Scholar] [CrossRef]
- Foscato, M.; Jensen, V.R. Automated in Silico Design of Homogeneous Catalysts. ACS Catal. 2020, 10, 2354–2377. [Google Scholar] [CrossRef]
- Toyao, T.; Maeno, Z.; Takakusagi, S.; Kamachi, T.; Takigawa, I.; Shimizu, K. Machine Learning for Catalysis Informatics: Recent Applications and Prospects. ACS Catal. 2020, 10, 2260–2297. [Google Scholar] [CrossRef]
- Espinosa-Garcia, J.; Monge-Palacios, M.; Corchado, J.C. Constructing Potential Energy Surfaces for Polyatomic Systems: Recent Progress and New Problems. Adv. Phys. Chem. 2012, 2012, 164752. [Google Scholar] [CrossRef] [Green Version]
- Rybkin, V.V. Sampling Potential Energy Surfaces in the Condensed Phase with Many—Body Electronic Structure Methods. Chemistry 2020, 26, 362–368. [Google Scholar] [CrossRef]
- Quintas-Sánchez, E.; Dawes, R. AUTOSURF: A Freely Available Program To Construct Potential Energy Surfaces. J. Chem. Inf. Model. 2019, 59, 262–271. [Google Scholar] [CrossRef]
- Dewyer, A.L.; Argüelles, A.J.; Zimmerman, P.M. Methods for Exploring Reaction Space in Molecular Systems. WIREs 2018, 8, e1354. [Google Scholar] [CrossRef]
- Unke, O.T.; Koner, D.; Patra, S.; Käser, S.; Meuwly, M. High–dimensional Potential Energy Surfaces for Molecular Simulations: From Empiricism to Machine Learning. Mach. Learn. Sci. Technol. 2020, 1, 013001. [Google Scholar] [CrossRef]
- Noé, F.; Tkatchenko, A.; Müller, K.R.; Clementi, C. Machine Learning for Molecular Simulation. Ann. Rev. Phys. Chem. 2020, 71, 361–390. [Google Scholar] [CrossRef] [Green Version]
- Abbott, A.S.; Turney, J.M.; Zhang, B.; Smith, D.A.; Altarawy, D.; Schaefer, H.F. PES-Learn: An Open-Source Software Package for the Automated Generation of Machine Learning Models of Molecular Potential Energy Surfaces. J. Chem. Theory Comput. 2019, 15, 4386–4398. [Google Scholar] [CrossRef]
- Quapp, W.; Hirsch, M.; Heidrich, D. Following the Streambed Reaction on Potential–energy Surfaces: A New Robust Method. Theor. Chem. Acc. 2000, 105, 145–155. [Google Scholar] [CrossRef]
- Bofill, J.M.; Anglada, J.M. Finding Transition States using Reduced Potential-energy Surfaces. Theor. Chem. Acc. 2001, 105, 463–472. [Google Scholar] [CrossRef]
- Schlegel, H.B. Exploring potential energy surfaces for chemical reactions: An overview of some practical methods. J. Comput. Chem. 2003, 24, 1514–1527. [Google Scholar] [CrossRef] [PubMed]
- Hirsch, M.; Quapp, W. The reaction pathway of a potential energy surface as curve with induced tangent. Chem. Phys. Lett. 2004, 395, 150–156. [Google Scholar] [CrossRef]
- Aguilar-Mogas, A.; Giménez, X.; Bofill, J.M. Finding reaction paths using the potential energy as reaction coordinate. J. Chem. Phys. 2008, 128, 104102. [Google Scholar] [CrossRef] [PubMed]
- Kim, Y.; Kim, J.W.; Kim, Z.; Kim, W.Y. Efficient prediction of reaction paths through molecular graph and reaction network analysis. Chem. Sci. 2018, 9, 825–835. [Google Scholar] [CrossRef] [PubMed] [Green Version]
- Maeda, S.; Harabuchi, Y.; Takagi, M.; Saita, K.; Suzuki, K.; Ichino, T.; Sumiya, Y.; Sugiyama, K.; Ono, Y. Implementation and Performance of the Artificial Force Induced Reaction Method in the GRRM17 Program. J. Comput. Chem. 2018, 39, 233–250. [Google Scholar] [CrossRef] [Green Version]
- Maeda, S.; Harabuchi, Y.; Ono, Y.; Taketsugu, T.; Morokuma, K. Intrinsic reaction coordinate: Calculation, bifurcation, and automated search. Int. J. Quant. Chem. 2015, 115, 258–269. [Google Scholar] [CrossRef]
- Tsutsumi, T.; Ono, Y.; Arai, Z.; Taketsugu, T. Visualization of the Intrinsic Reaction Coordinate and Global Reaction Route Map by Classical Multidimensional Scaling. J. Chem. Theory Comput. 2018, 14, 4263–4270. [Google Scholar] [CrossRef]
- Quapp, W.; Bofill, J.M. Some Mathematical Reasoning on the Artifical Force Induced Reaction Method. J. Comput. Chem. 2020, 41, 629–634. [Google Scholar] [CrossRef] [Green Version]
- Hare, S.R.; Bratholm, L.A.; Glowacki, D.R.; Carpenter, B.K. Low dimensional representations along intrinsic reaction coordinates and molecular dynamics trajectories using interatomic distance matrices. Chem. Sci. 2019, 10, 9954–9968. [Google Scholar] [CrossRef]
- Geerlings, P.; Chamorro, E.; Chattaraj, P.; De Proft, F.; Gázquez, J.; Liu, S.; Morell, C.; Toro-Labbé, A.; Vela, A.; Ayers, P. Conceptual density functional theory: Status, prospects, issues. Theoret. Chem. Acc. 2020, 139, 36-1–36-18. [Google Scholar] [CrossRef]
- Stuyver, T.; Proft, F.D.; Geerlings, P.; Shaik, S. How Do Local Reactivity Descriptors Shape the Potential Energy Surface Associated with Chemical Reactions? The Valence Bond Delocalization Perspective. J. Am. Chem. Soc. 2020, 142, 10102–10113. [Google Scholar] [CrossRef]
- Toro-Labbé, A.; Gutieŕrez-Oliva, S.; Murray, J.; Politzer, P. A new perspective on chemical and physical processes: The reaction force. Mol. Phys. 2007, 105, 2619–2625. [Google Scholar] [CrossRef]
- Urcelay, F.; Toro-Labbé, A.; Gutieŕrez-Oliva, S. Spectral Decomposition of the Reaction Force Constant. J. Phys. Chem. A 2020, 124, 2372–2379. [Google Scholar] [CrossRef]
- Rincon, L.; Torres, F.J.; Mora, J.R.; Zambrano, C.H.; Rodriguez, V. A valence bond perspective of the reaction force formalism. Theor. Chem. Acc. 2020, 139, 13. [Google Scholar] [CrossRef]
- Bader, R. Atoms in Molecules: A Quantum Theory; Oxford University Press: Oxford, UK, 1994. [Google Scholar]
- Bader, R. Atoms in Molecules. Chem. Rev. 1998, 1, 64–86. [Google Scholar]
- Savin, A.; Nesper, R.; Wengert, S.; Fässler, T.F. ELF: The Electron Localization Function. Angew. Chem. Int. Ed. 1997, 36, 1808–1832. [Google Scholar] [CrossRef]
- Andrés, J.; Gracia, L.; Gonzalez-Navarrete, P.; Safont, V. Chemical structure and reactivity by means of quantum chemical topology analysis. Comput. Theor. Chem. 2015, 1053, 17–30. [Google Scholar] [CrossRef] [Green Version]
- Andrés, J.; Gonzalez-Navarrete, P.; Safont, V.S. Unraveling Reaction Mechanisms by Means of Quantum Chemical Topology Analysis. Int. J. Quantum. Chem. 2014, 114, 1239–1252. [Google Scholar] [CrossRef] [Green Version]
- Polo, V.; Andres, J.; Berski, S.; Domingo, L.R.; Silvi, B. Understanding Reaction Mechanisms in Organic Chemistry from Catastrophe Theory Applied to the Electron Localization Function Topology. J. Phys. Chem. A 2008, 112, 7128–7136. [Google Scholar] [CrossRef]
- Martino, M.; Salvadori, A.; Lazzari, F.; Paoloni, L.; Nandi, S.; Mancini, G.; Barone, V.; Rampino, S. Chemical promenades: Exploring potential-energy surfaces with immersive virtual reality. J. Comput. Chem. 2020, 41, 1310–1323. [Google Scholar] [CrossRef]
- Yang, Z.; Houk, K.N. The Dynamics of Chemical Reactions: Atomistic Visualizations of Organic Reactions, and Homage to vant Hoff. Chemistry 2018, 24, 3916–3924. [Google Scholar] [CrossRef] [PubMed]
- Black, K.; Liu, P.; Xu, L.; Doubleday, C.; Houk, K.N. Dynamics, transition states, and timing of bond formation in Diels–Alder reactions. Proc. Natl. Acad. Sci. USA 2012, 109, 12860. [Google Scholar] [CrossRef] [PubMed] [Green Version]
- Meuwly, M. Reactive molecular dynamics: From small molecules to proteins. WIREs Comput. Mol. Sci. 2019, 9, e1386. [Google Scholar] [CrossRef] [Green Version]
- Gissinger, J.R.; Jensen, B.D.; Wise, K.E. Modeling chemical reactions in classical molecular dynamics simulations. Polymer 2017, 128, 211–217. [Google Scholar] [CrossRef]
- Pratihar, S.; Ma, X.; Homayoon, Z.; Barnes, G.L.; Hase, W.L. Direct Chemical Dynamics Simulations. J. Am. Chem. Soc. 2017, 139, 3570–3590. [Google Scholar] [CrossRef]
- Paranjothy, M.; Sun, R.; Zhuang, Y.; Hase, W.L. Direct chemical dynamics simulations: Coupling of classical and quasiclassical trajectories with electronic structure theory. WIREs Comput. Mol. Sci. 2013, 3, 296–316. [Google Scholar] [CrossRef]
- Tsutsumi, T.; Harabuchi, Y.; Ono, Y.; Maeda, S.; Taketsugu, T. Analyses of trajectory on-the-fly based on the global reaction route map. Phys. Chem. Chem. Phys. 2018, 20, 1364–1372. [Google Scholar] [CrossRef]
- Atalay, Y.; Paquet, E.; Viktor, H.L. Computational Methods for Ab Initio Molecular Dynamics. Adv. Chem. 2018, 9839641-1–9839641-14. [Google Scholar]
- Bowman, J.M.; Czakó, G.; Fu, B. High-dimensional ab initio potential energy surfaces for reaction dynamics calculations. Phys. Chem. Chem. Phys. 2011, 13, 8094–8111. [Google Scholar] [CrossRef]
- Chmiela, S.; Sauceda, H.; Tkatchenko, A.; Müller, K. Accurate Molecular Dynamics Enabled by Efficient Physically Constrained Machine Learning Approaches. In Machine Learning Meets Quantum Physics, Lecture Notes in Physics; Schütt, K., Chmiela, S., von Lilienfeld, O., Tkatchenko, A., Tsuda, K., Müller, K., Eds.; Springer: New York, NY, USA, 2020; Volume 968. [Google Scholar]
- Jia, W.; Wang, H.; Chen, M.; Lu, D.; Liu, J.; Lin, L.; Car, R.; E, W.; Zhang, L. Pushing the limit of molecular dynamics with ab initio accuracy to 100 million atoms with machine learning. arXiv 2020, arXiv:2005.00223v1. [Google Scholar]
- Konkoli, Z.; Kraka, E.; Cremer, D. Unified Reaction Valley Approach Mechanism of the Reaction CH3 + H2→CH4 + H. J. Phys. Chem. A 1997, 101, 1742–1757. [Google Scholar] [CrossRef]
- Kraka, E. Reaction Path Hamiltonian and the Unified Reaction Valley Approach. WIREs Comput. Mol. Sci. 2011, 1, 531–556. [Google Scholar] [CrossRef]
- Kraka, E.; Cremer, D. Dieter Cremer’s Contribution to the Field of Theoretical Chemistry. Int. J. Quantum Chem. 2019, 119, e25849. [Google Scholar] [CrossRef] [Green Version]
- Kraka, E.; Cremer, D. Computational Analysis of the Mechanism of Chemical Reactions in Terms of Reaction Phases: Hidden Intermediates and Hidden Transition States. Acc. Chem. Res. 2010, 43, 591–601. [Google Scholar] [CrossRef]
- Cremer, D.; Kraka, E. From Molecular Vibrations to Bonding, Chemical Reactions, and Reaction Mechanism. Curr. Org. Chem. 2010, 14, 1524–1560. [Google Scholar] [CrossRef]
- Miller, W.H.; Handy, N.C.; Adams, J.E. Reaction path Hamiltonian for polyatomic molecules. J. Chem. Phys. 1980, 72, 99–112. [Google Scholar] [CrossRef] [Green Version]
- Kato, S.; Morokuma, K. Potential energy characteristics and energy partitioning in chemical reactions: Ab initio MO study of four-centered elimination reaction CH3CH2F + CH2→CH2 + HF. J. Chem. Phys. 1980, 73, 3900–3914. [Google Scholar] [CrossRef]
- Hofacker, L. Quantentheorie Chemischer Reaktionen. Z. Naturforsch. A 1963, 18, 60–619. [Google Scholar] [CrossRef] [Green Version]
- Marcus, R. On analytical mechanics of chemical reactions. Quantum mechanics of linear collisions. J. Chem. Phys. 1966, 45, 4493–4499. [Google Scholar] [CrossRef] [Green Version]
- Marcus, R. On analytical mechanics of chemical reactions. Classical mechanics of linear collisions. J. Chem. Phys. 1966, 45, 4500–4504. [Google Scholar] [CrossRef] [Green Version]
- Marcus, R. Analytical mechanics of chemical reactions. 3. Natural collision coordinates. J. Chem. Phys. 1968, 49, 2610–2616. [Google Scholar] [CrossRef]
- Hougen, J.; Bunker, P.; Johns, J. Vibration-rotation problem in triatomic molecules allowing for a large-amplitude bending vibration. J. Mol. Spectrosc. 1970, 34, 136–172. [Google Scholar] [CrossRef]
- Eliason, M.A.; Hirschfelder, J.O. General Collision Theory Treatment for the Rate of Bimolecular, Gas Phase Reactions. J. Chem. Phys. 1959, 30, 1426–1436. [Google Scholar] [CrossRef]
- Fukui, K. The path of chemical-reactions—The IRC approach. Acc. Chem. Res. 1981, 14, 363–368. [Google Scholar] [CrossRef]
- Wilson, E.B.; Decius, J.C.; Cross, P.C. Molecular Vibrations; McGraw-Hill: New York, NY, USA, 1955. [Google Scholar]
- Page, M.; McIver, J.W., Jr. On evaluating the Reaction path Hamiltonian. J. Chem. Phys. 1988, 88, 922–935. [Google Scholar] [CrossRef]
- Kühnel, W. Differential Geometry: Curves-Surfaces-Manifolds; American Mathematics Society, AMS: New York, NY, USA, 2005. [Google Scholar]
- Garrett, B.; Truhlar, D. Variational transition state theory. In Theory and Applications of Computational Chemistry: The First Forty Years; Dykstra, C., Frenking, G., Kim, K., Scuseria, G., Eds.; Elsevier: Amsterdam, The Netherlands, 2005; pp. 67–87. [Google Scholar]
- Gonzales, J.; Gimenez, X.; Bofill, J. A reaction path—Liouville approach to the rate constant for polyatomic chemical reactions. Phys. Chem. Chem. Phys. 2002, 4, 2921–2926. [Google Scholar] [CrossRef]
- Luckhaus, D. Large curvature tunneling on the reaction path. Phys. Chem. Chem. Phys. 2008, 10, 6215–6222. [Google Scholar] [CrossRef]
- Killelea, D.; Campbell, V.; Shuman, N.; Utz, A. Bond-selective control of a heterogeneously catalyzed reaction. Science 2008, 319, 790–793. [Google Scholar] [CrossRef]
- Kraka, E.; Dunning, T.H., Jr. Characterization of Molecular Potential Energy Surfaces: Critical Points, Reaction Paths and Reaction Valleys. In Advances in Molecular Electronic Structure Theory: The Calculation and Characterization of Molecular Potential Energy Surfaces; Dunning, T.H., Jr., Ed.; JAI Press, Inc.: Greenwich, CT, USA, 1990; pp. 129–173. [Google Scholar]
- Dunning, T.H., Jr.; Kraka, E.; Eades, R.A. Insights into the Mechanisms of Chemical Reactions—Reaction Paths for Chemical Reactions. Faraday Discuss. 1987, 84, 427–440. [Google Scholar] [CrossRef]
- Dunning, T.H., Jr.; Harding, L.B.; Kraka, E. Calculation and Characterization of Reaction Valleys for Chemical Reactions. In NATO Advanced Research Workshop on Supercomputer Algorithms for Reactivity, Dynamcis and Kinetics of Small Molecules; Dunning, T.H., Jr., Ed.; Kluwer Academic Publishers: Dordrecht, The Netherlands, 1989; pp. 57-1–57-15. [Google Scholar]
- Kraka, E. Reaction Path Hamiltonian and its Use for Investigating Reaction Mechanism. In Encyclopedia of Computational Chemistry; Schleyer, P., Allinger, N., Clark, T., Gasteiger, J., Kollman, P., Schaefer, H., III, Schreiner, P., Eds.; John Wiley & Sons: New York, NY, USA, 1998; pp. 2437–2463. [Google Scholar]
- Konkoli, Z.; Cremer, D.; Kraka, E. Diabatic Ordering of Vibrational Normal Modes in Reaction Valley Studies. J. Comput. Chem. 1997, 18, 1282–1294. [Google Scholar] [CrossRef]
- Joo, H.; Kraka, E.; Quapp, W.; Cremer, D. The Mechanism of a Barrierless Reaction: Hidden Transition State and Hidden Intermediates in the Reaction of Methylene with Ethene. Mol. Phys. 2007, 105, 2697–2717. [Google Scholar] [CrossRef]
- Cremer, D.; Wu, A.; Kraka, E. The Mechanism of the Reaction FH + H2C=CH2→H2C-CFH3. Investigation of Hidden Intermediates with the Unified Reaction Valley Approach. Phys. Chem. Chem. Phys. 2001, 3, 674–687. [Google Scholar] [CrossRef]
- Konkoli, Z.; Cremer, D. A New Way of Analyzing Vibrational Spectra. I. Derivation of Adiabatic Internal Modes. Int. J. Quantum Chem. 1998, 67, 1–9. [Google Scholar] [CrossRef]
- Konkoli, Z.; Larsson, J.A.; Cremer, D. A New Way of Analyzing Vibrational Spectra. II. Comparison of Internal Mode Frequencies. Int. J. Quantum Chem. 1998, 67, 11–27. [Google Scholar] [CrossRef]
- Konkoli, Z.; Cremer, D. A New Way of Analyzing Vibrational Spectra. III. Characterization of Normal Vibrational Modes in terms of Internal Vibrational Modes. Int. J. Quantum Chem. 1998, 67, 29–40. [Google Scholar] [CrossRef]
- Konkoli, Z.; Larsson, J.A.; Cremer, D. A New Way of Analyzing Vibrational Spectra. IV. Application and Testing of Adiabatic Modes within the Concept of the Characterization of Normal Modes. Int. J. Quantum Chem. 1998, 67, 41–55. [Google Scholar] [CrossRef]
- Cremer, D.; Larsson, J.A.; Kraka, E. New Developments in the Analysis of Vibrational Spectra on the Use of Adiabatic Internal Vibrational Modes. In Theoretical and Computational Chemistry; Parkanyi, C., Ed.; Elsevier: Amsterdam, The Netherlands, 1998; pp. 259–327. [Google Scholar]
- Kraka, E.; Zou, W.; Tao, Y. Decoding chemical information from vibrational spectroscopy data: Local vibrational mode theory. WIREs Comput. Mol. Sci. 2020, e1480. [Google Scholar] [CrossRef]
- Zou, W.; Kalescky, R.; Kraka, E.; Cremer, D. Relating Normal Vibrational Modes to Local Vibrational Modes with the Help of an Adiabatic Connection Scheme. J. Chem. Phys. 2012, 137, 084114. [Google Scholar] [CrossRef] [Green Version]
- Kraka, E.; Cremer, D. Mechanism and Dynamics of Organic Reactions: 1,2-H Shift in Methylchlorocarbene. J. Phys. Org. Chem. 2002, 15, 431–447. [Google Scholar] [CrossRef]
- Kraka, E.; Wu, A.; Cremer, D. Mechanism of the Diels-Alder Reaction Studied with the United Reaction Valley Approach: Mechanistic Differences between Symmetry-Allowed and Symmetry-Forbidden Reactions. J. Phys. Chem. A 2003, 107, 9008–9021. [Google Scholar] [CrossRef]
- Kraka, E.; Zou, W.; Freindorf, M.; Cremer, D. Energetics and Mechanism of the Hydrogenation of XHn for Group IV to Group VII Elements X. J. Chem. Theory Comput. 2012, 8, 4931–4943. [Google Scholar] [CrossRef]
- Sexton, T.; Kraka, E.; Cremer, D. Extraordinary Mechanism of the Diels-Alder Reaction: Investigation of Stereochemistry, Charge Transfer, Charge Polarization, and Biradicaloid Formation. J. Phys. Chem. A 2016, 120, 1097–1111. [Google Scholar] [CrossRef] [PubMed]
- Freindorf, M.; Sexton, T.; Kraka, E.; Cremer, D. The Mechanism of the Cycloaddition Reaction of 1,3-Dipole Molecules with Acetylene—An Investigation with the Unified Reaction Valley Approach. Theor. Chem. Acc. 2013, 133, 1423–1441. [Google Scholar] [CrossRef]
- Sexton, T.M.; Freindorf, M.; Kraka, E.; Cremer, D. A Reaction Valley Investigation of the Cycloaddition of 1,3-Dipoles with the Dipolarophiles Ethene and Acetylene: Solution of a Mechanistic Puzzle. J. Phys. Chem. A 2016, 120, 8400–8418. [Google Scholar] [CrossRef] [PubMed]
- López, C.S.; Faza, O.N.; Freindorf, M.; Kraka, E.; Cremer, D. Solving the Pericyclic-Pseudo pericyclic Puzzle in the Ring-Closure Reactions of 1,2,4,6-Heptatetraene Derivatives. J. Org. Chem. 2015, 81, 404–414. [Google Scholar] [CrossRef] [PubMed]
- Freindorf, M.; Cremer, D.; Kraka, E. Gold(I)-Assisted Catalysis—A Comprehensive View on the [3,3]-Sigmatropic Rearrangement of Allyl Acetate. Mol. Phys. 2017, 116, 611–630. [Google Scholar] [CrossRef]
- Zou, W.; Sexton, T.; Kraka, E.; Freindorf, M.; Cremer, D. A New Method for Describing the Mechanism of a Chemical Reaction Based on the Unified Reaction Valley Approach. J. Chem. Theory Comput. 2016, 12, 650–663. [Google Scholar] [CrossRef]
- Reis, M.C.; López, C.S.; Kraka, E.; Cremer, D.; Faza, O.N. Rational Design in Catalysis: A Mechanistic Study of β-Hydride Eliminations in Gold(I) and Gold(III) Complexes Based on Features of the Reaction Valley. Inorg. Chem. 2016, 55, 8636–8645. [Google Scholar] [CrossRef]
- Nanayakkara, S.; Kraka, E. A New Way of Studying Chemical Reactions: A Hand-in-hand URVA and QTAIM Approach. Phys. Chem. Chem. Phys. 2019, 21, 15007–15018. [Google Scholar] [CrossRef]
- Cremer, D.; Pople, J.A. General Definition of Ring Puckering Coordinates. J. Am. Chem. Soc. 1975, 97, 1354–1358. [Google Scholar] [CrossRef]
- Hratchian, H.P.; Kraka, E. Improved Predictor-Corrector Integrators For Evaluating Reaction Path Curvature. J. Chem. Theory Comput. 2013, 9, 1481–1488. [Google Scholar] [CrossRef] [PubMed]
- Quapp, W.; Kraka, E.; Cremer, D. Finding the Transition State of Quasi-Barrierless Reactions by a Growing String Method for Newton Trajectories: Application to the Dissociation of Methylenecyclopropene and Cyclopropane. J. Chem. Phys. A 2007, 111, 11287–11293. [Google Scholar] [CrossRef] [PubMed] [Green Version]
- Kraka, E.; Joo, H.; Cremer, D. A Stunning Example for a Spontaneous Reaction with a Complex Mechanism: The Vinylidene-Acetylene Cycloaddition Reaction. Mol. Phys. 2010, 108, 2667–2685. [Google Scholar] [CrossRef]
- Freindorf, M.; Tao, Y.; Sethio, D.; Cremer, D.; Kraka, E. New Mechanistic Insights into the Claisen Rearrangement of Chorismate—A Unified Reaction Valley Approach Study. Mol. Phys. 2019, 117, 1172–1192. [Google Scholar] [CrossRef]
- Becke, A.D. Density-functional Thermochemistry. III. The role of Exact Exchange. J. Chem. Phys. 1993, 98, 5648–5652. [Google Scholar] [CrossRef] [Green Version]
- Stephens, P.J.; Devlin, F.J.; Chabalowski, C.F.; Frisch, M.J. Ab Initio Calculation of Vibrational Absorption and Circular Dichroism Spectra Using Density Functional Force Fields. J. Phys. Chem. 1994, 98, 11623–11627. [Google Scholar] [CrossRef]
- Ditchfield, D.; Hehre, W.J.; Pople, J.A. Self-Consistent Molecular Orbital Methods. 9. Extended Gaussian-type basis for molecular-orbital studies of organic molecules. J. Chem. Phys. 1971, 54, 724–728. [Google Scholar] [CrossRef]
- Hariharan, P.C.; Pople, J.A. The influence of polarization functions on molecular orbital hydrogenation energies. Theor. Chim. Acta 1973, 28, 213–222. [Google Scholar] [CrossRef]
- Schwerdtfeger, P.; Dolg, M.; Schwarz, W.; Bowmaker, G.; Boyd, P. Relativistic effects in gold chemistry. I. Diatomic gold compounds. J. Chem. Phys. 1989, 91, 1762–1774. [Google Scholar] [CrossRef] [Green Version]
- Andrae, D.; Haeussermann, U.; Dolg, M.; Stoll, H.; Preuss, H. Energy-adjusted ab initio pseudopotentials for the second and third row transition elements. Theor. Chim. Acta 1990, 77, 123–141. [Google Scholar] [CrossRef]
- Feller, D. The role of databases in support of computational chemistry calculations. J. Comput. Chem. 1996, 17, 1571–1586. [Google Scholar] [CrossRef]
- Dolg, M.; Wedig, U.; Stoll, H.; Preuss, H. Energy–adjusted ab initio pseudopotentials for the first row transition elements. J. Chem. Phys. 1987, 86, 866–872. [Google Scholar] [CrossRef]
- Clark, T.; Chandrasekhar, J.; Spitznagel, G.W.; Schleyer, P.V.R. Efficient diffuse function-augmented basis sets for anion calculations. III. The 3-21+G basis set for first-row elements, Li-F. J. Comput. Chem. 1983, 4, 294–301. [Google Scholar] [CrossRef]
- Neese, F. The ORCA program system. Wiley Interdiscip. Rev. Comput. Mol. Sci. 2012, 2, 73–78. [Google Scholar] [CrossRef]
- Sparta, M.; Neese, F. Chemical applications carried out by local pair natural orbital based coupled-cluster methods. Chem. Soc. Rev. 2014, 43, 5032–5041. [Google Scholar] [CrossRef] [PubMed] [Green Version]
- Dunning, T.J. Gaussian basis sets for use in correlated molecular calculations. I. The atoms boron through neon and hydrogen. J. Chem. Phys. 1989, 90, 1007–1023. [Google Scholar] [CrossRef]
- Woon, D.; Dunning, T.J. Gaussian basis sets for use in correlated molecular calculations. III. The atoms aluminum through argon. J. Chem. Phys. 1993, 98, 1358–1371. [Google Scholar] [CrossRef] [Green Version]
- Woon, D.; Dunning, T.J. Gaussian basis sets for use in correlated molecular calculations. IV. Calculation of static electrical response properties. J. Chem. Phys. 1994, 100, 2975–2988. [Google Scholar] [CrossRef] [Green Version]
- Tomasi, J.; Mennucci, B.; Cammi, R. Quantum mechanical continuum solvation models. Chem. Rev. 2005, 105, 2999–3093. [Google Scholar] [CrossRef]
- Chung, L.W.; Sameera, W.M.C.; Ramozzi, R.; Page, A.J.; Hatanaka, M.; Petrova, G.P.; Harris, T.V.; Li, X.; Ke, Z.; Liu, F.; et al. The ONIOM Method and Its Applications. Chem. Rev. 2015, 115, 5678–5796. [Google Scholar] [CrossRef] [Green Version]
- Jorgensen, W.L.; Chandrasekhar, J.; Madura, J.D.; Impey, R.W.; Klein, M.L. Comparison of simple potential functions for simulating liquid water. J. Chem. Phys. 1983, 79, 926–935. [Google Scholar] [CrossRef]
- Case, D.A.; Ben-Shalom, I.Y.; Brozell, S.R.; Cerutti, D.S.; Cheatham, T.E.; Cruzeiro, V.W.D.; Darden, T.A.; Duke, R.E.; Ghoreishi, D.; Gilson, M.K.; et al. AMBER; University of California: San Francisco, CA, USA, 2018. [Google Scholar]
- Nikitin, A.M.; Milchevskiy, Y.V.; Lyubartsev, A.P. A new AMBER-compatible force field parameter set for alkanes. J. Mol. Mod. 2014, 20, 2143. [Google Scholar] [CrossRef] [PubMed]
- Frisch, M.J.; Trucks, G.W.; Schlegel, H.B.; Scuseria, G.E.; Robb, M.A.; Cheeseman, J.R.; Scalmani, G.; Barone, V.; Mennucci, B.; Petersson, G.A.; et al. Gaussian09; Gaussian Inc.: Wallingford, CT, USA, 2010. [Google Scholar]
- Kraka, E.; Zou, W.; Filatov, M.; Gräfenstein, J.; Gauss, J.; He, Y.; Wu, A.; Konkoli, Z.; He, Z.; Cremer, D. COLOGNE20. 2020. Available online: https://sites.smu.edu/dedman/catco (accessed on 1 January 2020).
- Reed, A.E.; Curtiss, L.A.; Weinhold, F. Intermolecular Interactions from a Natural Bond Orbital, Donor–Acceptor Viewpoint. Chem. Rev. 1988, 88, 899–926. [Google Scholar] [CrossRef]
- Kalck, P.; Berre, C.L.; Serp, P. Recent advances in the methanol carbonylation reaction into acetic acid. Coord. Chem. Rev. 2020, 402, 213078. [Google Scholar] [CrossRef]
- Credence Research, Inc. Global Acetic Acid Market; Credence Research, Inc.: San Jose, CA, USA, 2019. [Google Scholar]
- Gomes, R.J.; de Fatima Borges, M.; de Freitas Rosa, M.; Castro-Gomez, R.J.H.; Spinosa, W.A. Acetic Acid Bacteria in the Food Industry: Systematics, Characteristics and Applications. Food Technol. Biotechnol. 2018, 56, 140–151. [Google Scholar] [CrossRef] [PubMed]
- Roth, J.F. The Production of Acetic Acid. Platinum Met. Rev. 1975, 19, 12–14. [Google Scholar]
- Foster, D. On the mechanism of a rhodium-complex-catalyzed carbonylation of methanol to acetic acid. J. Am. Chem. Soc. 1976, 98, 846–848. [Google Scholar] [CrossRef]
- Thomas, C.M.; Süfuss-Fink, G. The Production of Acetic Acid. Coord. Chem. Rev. 2003, 243, 125–142. [Google Scholar] [CrossRef]
- Pal, P.; Nayak, J. Acetic Acid Production and Purification: Critical Review Towards Process Intensification. Sep. Purif. Rev. 2017, 46, 44–61. [Google Scholar] [CrossRef]
- Dutta, D.K.; Woollins, D.; Slawin, A.M.Z.; Konwar, D.; Sharma, M.; Bhattacharyya, P.; Aucott, S.M. Rhodium(I) carbonyl complexes of mono selenium functionalized bis(diphenylphosphino)methane and bis(diphenylphosphino)amine chelating ligands and their catalytic carbonylation activity. J. Organometal. Chem. 2006, 691, 1229–1234. [Google Scholar] [CrossRef]
- Katsuki, T.; Sharpless, K.B. The First Practical Method for Asymmetric Epoxidation. J. Am. Chem. Soc. 1980, 102, 5974–5976. [Google Scholar] [CrossRef]
- Sawano, T.; Yamamoto, H. Regio-and Enantioselective Substrate-Directed Epoxidation. Eur. J. Org. Chem. 2020, 2369–2378. [Google Scholar] [CrossRef]
- Bhadra, S.; Yamamoto, H. Substrate Directed Asymmetric Reactions. Chem. Rev. 2018, 118, 3391–3446. [Google Scholar] [CrossRef] [PubMed]
- Sharpless, K.B. Searching for New Reactivity (Nobel Lecture). Angew. Chem. Int. Ed. 2002, 41, 2024–2032. [Google Scholar] [CrossRef]
- Pedersen, S.F.; Dewan, J.C.; Eckman, R.R.; Sharpless, K.B. Unexpected Diversity in the Coordination Chemistry of Tartrate Esters with Titanium(IV). J. Am. Chem. Soc. 1987, 109, 1279–1282. [Google Scholar] [CrossRef]
- Williams, I.D.; Pedersen, S.F.; Sharpless, K.B.; Lippard, S.J. Crystal Structures of Two Titanium Tartrate Asymmetric Epoxidation Catalysts. J. Am. Chem. Soc. 1984, 106, 6430–6431. [Google Scholar] [CrossRef]
- Finn, G.M.; Sharpless, K.B. Mechanism of Asymmetric Epoxidation. 2. Catalyst Structure. J. Am. Chem. Soc. 1991, 113, 113–1262. [Google Scholar] [CrossRef]
- Marin-Luna, M.; Faza, O.N.; López, C.S. Gold-Catalyzed Homogeneous (Cyclo)Isomerization Reactions. Front. Chem. 2019, 7, 296. [Google Scholar] [CrossRef] [Green Version]
- Shahzad, S.A.; Sajid, M.A.; Khan, Z.A.; Canseco-Gonzalez, D. Gold catalysis in organic transformations: A review. Synth. Commun. 2017, 47, 735–755. [Google Scholar] [CrossRef]
- Scurrell, M.S. Thoughts on the use of gold-based catalysts in environmental protection catalysis. Gold Bull. 2017, 50, 77–84. [Google Scholar] [CrossRef]
- Zi, W.; Dean Toste, F. Recent advances in enantioselective gold catalysis. Chem. Soc. Rev. 2016, 45, 4567–4589. [Google Scholar] [CrossRef] [PubMed]
- Ishida, T.; Koga, H.; Okumura, M.; Haruta, M. Advances in Gold Catalysis and Understanding the Catalytic Mechanism. Chem. Rec. 2016, 16, 2278–2293. [Google Scholar] [CrossRef] [PubMed]
- Echavarren, A.M.; Hashmi, A.S.K.; Toste, F.D. Gold Catalysis—Steadily Increasing in Importance. Adv. Synth. Catal. 2016, 358, 1347. [Google Scholar] [CrossRef] [Green Version]
- Villa, A.; Dimitratos, N.; Chan-Thaw, C.E.; Hammond, C.; Veith, G.M.; Wang, D.; Manzoli, M.; Prati, L.; Hutchings, G.J. Characterisation of gold catalysts. Chem. Soc. Rev. 2016, 45, 4953–4994. [Google Scholar] [CrossRef] [Green Version]
- Zhao, X.; Rudolph, M.; Hashmi, A.S.K. Dual gold catalysis—An update. Chem. Commun. 2019, 55, 12127–12135. [Google Scholar] [CrossRef]
- Pflisterer, D.; Hashmi, A.S.K. Gold catalysis in total synthesis—Ecent achievements. Chem. Soc. Rev. 2016, 45, 1331–1367. [Google Scholar] [CrossRef]
- Hashmi, A.S.K. Gold-catalyzed organic reactions. Top. Organomet. Chem. 2013, 44, 143–164. [Google Scholar]
- Kennedy, C.R.; Lin, S.; Jacobsen, E.N. The Cation-π Interaction in Small-Molecule Catalysis. Angew. Chem. Int. Ed. 2016, 55, 12596–12624. [Google Scholar] [CrossRef] [Green Version]
- Vidhani, D.V.; Cran, J.W.; Krafft, M.E.; Manoharan, M.; Alabugin, I.V. Gold(I)-catalyzed claisen rearrangement of allenyl vinyl ethers: Missing transition states revealed through evolution of aromaticity, Au(I) as an oxophilic lewis acid, and lower energy barriers from a high energy complex. J. Org. Chem. 2013, 78, 2059–2073. [Google Scholar] [CrossRef]
- Sherry, B.D.; Toste, F.D. Gold ( I )-Catalyzed Propargyl Claisen Rearrangement. J. Am. Chem. Soc. 2004, 14, 15978–15979. [Google Scholar] [CrossRef] [PubMed] [Green Version]
- Wu, C.Y.; Horibe, T.; Jacobsen, C.B.; Toste, F.D. Stable gold(III) catalysts by oxidative addition of a carbon-carbon bond. Nature 2015, 517, 449–454. [Google Scholar] [CrossRef] [PubMed] [Green Version]
- Comas-Vives, A.; González-Arellano, C.; Corma, A.; Iglesias, M.; Sánchez, F.; Ujaque, G. Single-site homogeneous and heterogeeized gold(III) hydrogenation catalysts: Mechanistic implications. J. Am. Chem. Soc. 2006, 128, 4756–4765. [Google Scholar] [CrossRef]
- Arduengo, A.J.; Harlow, R.L.; Kline, M. A stable crystalline carbene. J. Am. Chem. Soc. 1991, 113, 361–363. [Google Scholar] [CrossRef]
- Diez-Gonzáles, S. (Ed.) N-Heterocyclic Carbenes—From Laboratory Curiosities to Efficient Synthetic Tools; Royal Society of Chemistry: London, UK, 2017. [Google Scholar]
- Gómez-Suárez, A.; Nelson, D.J.; Nolan, S.P. Quantifying and understanding the steric properties of N-heterocyclic carbenes. Chem. Commun. 2017, 53, 2650–2660. [Google Scholar] [CrossRef] [PubMed] [Green Version]
- Jacobsen, H.; Correa, A.; Poater, A.; Costabile, C.; Cavallo, L. Understanding the M(NHC) (NHC=N-heterocyclic carbene) bond. Coord. Chem. Rev. 2009, 253, 687–703. [Google Scholar] [CrossRef]
- Mora, M.; Gimeno, M.C.; Visbal, R. Recent advances in gold-NHC complexes with biological properties. Chem. Soc. Rev. 2019, 48, 447–462. [Google Scholar] [CrossRef]
- Tang, X.T.; Yang, F.; Zhang, T.T.; Liu, Y.F.; Liu, S.Y.; Su, T.F.; Lv, D.C.; Shen, W.B. Recent Progress in N-Heterocyclic Carbene Gold-Catalyzed Reactions of Alkynes Involving Oxidation/Amination/Cycloaddition. Catalysis 2019, 10, 350. [Google Scholar] [CrossRef] [Green Version]
- Majumdar, K.C.; Alam, S.; Chattopadhyay, B. Catalysis of the Claisen rearrangement. Tetrahedron 2008, 64, 597–643. [Google Scholar] [CrossRef]
- Gourlaouen, C.; Marion, N.; Nolan, S.P. Mechanism of the [( NHC ) Au I ] -Catalyzed Rearrangement of Allylic Acetates. A DFT Study. Org. Lett. 2009, 11, 12–15. [Google Scholar] [CrossRef]
- Chen, K.; Arnold, F.H. Engineering new catalytic activities in enzymes. Nat. Catal. 2020, 3, 203–213. [Google Scholar] [CrossRef]
- Chowdhury, R.; Maranas, C.D. From directed evolution to computational enzyme engineering-A review. AIChE J. 2020, 66, e16847. [Google Scholar] [CrossRef]
- Bilal, M.; Cui, J.; Iqbal, H.M. Directed Evolution of Artificial Metalloenzymes: A Universal Means to Tune the Selectivity of Transition Metal Catalysts? Acc. Chem. Res. 2020, 52, 336–344. [Google Scholar]
- Reilley, D.J.; Hennefarth, M.R.; Alexandrova, A.N. The Case for Enzymatic Competitive Metal Affinity Methods. ACS Catal. 2020, 10, 2298–2307. [Google Scholar] [CrossRef] [Green Version]
- Bilal, M.; Cui, J.; Iqbal, H.M. The Case for Enzymatic Competitive Metal Affinity Methods. Int. J. Biol. Macromol. 2020, 130, 186–196. [Google Scholar] [CrossRef]
- Magalhaes, R.P.; Fernandes, H.S.; Sousa, S. Modeling Enzymatic Mechanisms with QM/MM Approaches: Current Status and Future Challenges. Isr. J. Chem. 2020, 60, 1–13. [Google Scholar] [CrossRef]
- Himo, F. Recent Trends in Quantum Chemical Modeling of Enzymatic Reactions. J. Am. Chem. Soc. 2017, 139, 6780–6786. [Google Scholar] [CrossRef] [Green Version]
- Quesne, M.G.; Borowski, T.; de Visser, S.P. Quantum Mechanics/Molecular Mechanics Modeling of Enzymatic Processes: Caveats and Breakthroughs. Chem. Eur. J. 2016, 22, 2562–2581. [Google Scholar] [CrossRef]
- Cui, Q. Perspective: Quantum mechanical methods in biochemistry and biophysics. J. Chem. Phys. 2016, 145, 140901–140913. [Google Scholar] [CrossRef] [Green Version]
- Warshel, A.; Bora, R.P. Perspective: Defining and quantifying the role of dynamics in enzyme catalysis. J. Chem. Phys. 2016, 144, 180901–180918. [Google Scholar] [CrossRef]
- Ramírez, C.L.; Martí, M.A.; Roitberg, A.E. Chapter Six: Steered Molecular Dynamics Methods Applied to Enzyme Mechanism and Energetics, 1st ed.; Elsevier Inc.: Amsterdam, The Netherlands, 2016; Volume 578, pp. 123–143. [Google Scholar]
- Sokkar, P.; Boulanger, E.; Thiel, W.; Sanchez-Garcia, E. Hybrid quantum mechanics/molecular mechanics/coarse grained modeling: A triple-resolution approach for biomolecular systems. J. Chem. Theory Comput. 2015, 11, 1809–1818. [Google Scholar] [CrossRef] [PubMed] [Green Version]
- Lever, G. A Density-Functional Perspective on the Chorismate Mutase Enzyme. In Large-Scale Quantum-Mechanical Enzymology; Springer International Publishing: Cham, Switzerland, 2015; pp. 111–141. [Google Scholar] [CrossRef]
- Patel, S.S. Large Scale Simulation and Analysis to Understand Enzymatic Chemical Mechanisms. Ph.D. Thesis, Department of Chemistry, Massachusetts Institute of Technology, Boston, MA, USA, 2015. [Google Scholar]
- Lynch, J.H.; Dudareva, N. Aromatic Amino Acids: A Complex Network Ripe for Future Exploration. Trends Plant Sci. 2020, 1935, 1–12. [Google Scholar] [CrossRef] [PubMed]
- Mir, R.; Jallu, S.; Singh, T.P. The shikimate pathway: Review of amino acid sequence, function and three-dimensional structures of the enzymes. Crit. Rev. Microbiol. 2015, 41, 172–189. [Google Scholar] [CrossRef] [PubMed]
- Maeda, H.; Dudareva, N. The Shikimate Pathway and Aromatic Amino Acid Biosynthesis in Plants. Annu. Rev. Plant Biol. 2015, 63, 73–105. [Google Scholar] [CrossRef] [PubMed]
- Claeyssens, F.; Ranaghan, K.E.; Lawan, N.; Macrae, S.J.; Manby, F.R.; Harvey, J.N.; Mulholland, A.J. Analysis of chorismate mutase catalysis by QM/MM modelling of enzyme-catalysed and uncatalysed reactions. Org. Biomol. Chem. 2011, 9, 1578–1590. [Google Scholar] [CrossRef] [PubMed]
- Giraldo, J.; Roche, D.; Rovira, X.; Serra, J. The catalytic power of enzymes: Conformational selection or transition state stabilization? FEBS Lett. 2006, 580, 2170–2177. [Google Scholar] [CrossRef] [Green Version]
- Dong, L.; Liu, Y. Comparative studies of the catalytic mechanisms of two chorismatases: CH-fkbo and CH-Hyg5. Proteins Struct. Funct. Bioinform. 2017, 85, 1146–1158. [Google Scholar] [CrossRef]
- Gustin, D.J.; Mattei, P.; Kast, P.; Wiest, O.; Lee, L.; Cleland, W.W.; Hilvert, D. Heavy Atom Isotope Effects Reveal a Highly Polarized Transition State for Chorismate Mutase. J. Am. Chem. Soc. 1999, 121, 1756–1757. [Google Scholar] [CrossRef]
- Wiest, O.; Houk, K.N. Stabilization of the Transition State of the Chorismate-Prephenate Rearrangement: An ab Initio Study of Enzyme and Antibody Catalysis. J. Am. Chem. Soc. 1995, 117, 11628–11639. [Google Scholar] [CrossRef]
- Burschowsky, D.; Krengel, U.; Uggerud, E.; Balcells, D. Quantum chemical modeling of the reaction path of chorismate mutase based on the experimental substrate/product complex. FEBS Open Bio. 2017, 7, 789–797. [Google Scholar] [CrossRef]
- Ishida, T. Effects of point mutation on enzymatic activity: Correlation between protein electronic structure and motion in chorismate mutase reaction. J. Am. Chem. Soc. 2010, 132, 7104–7118. [Google Scholar] [CrossRef] [PubMed]
- Uyeda, C.; Jacobsen, E.N. Enantioselective Claisen Rearrangements with a Hydrogen-Bond Donor Catalyst. J. Am. Chem. Soc. 2008, 130, 9228–9229. [Google Scholar] [CrossRef] [PubMed] [Green Version]
- Kraka, E.; Cremer, D. Weaker Bonds with Shorter Bond Lengths. Rev. Proc. Quim. 2012, 6, 39–42. [Google Scholar] [CrossRef]
- Setiawan, D.; Kraka, E.; Cremer, D. Hidden Bond Anomalies: The Peculiar Case of the Fluorinated Amine Chalcogenides. J. Phys. Chem. A 2015, 119, 9541–9556. [Google Scholar] [CrossRef] [PubMed]
- Kraka, E.; Setiawan, D.; Cremer, D. Re-Evaluation of the Bond Length-Bond Strength Rule: The Stronger Bond Is not Always the Shorter Bond. J. Comput. Chem. 2015, 37, 130–142. [Google Scholar] [CrossRef]
- Kalescky, R.; Kraka, E.; Cremer, D. Identification of the Strongest Bonds in Chemistry. J. Phys. Chem. A 2013, 117, 8981–8995. [Google Scholar] [CrossRef]
- Humason, A.; Zou, W.; Cremer, D. 11,11-Dimethyl-1,6-methano[10]annulene—An Annulene with an Ultralong CC Bond or a Fluxional Molecule? J. Phys. Chem. A. 2014, 119, 1666–1682. [Google Scholar] [CrossRef] [PubMed]
- Kalescky, R.; Zou, W.; Kraka, E.; Cremer, D. Quantitative Assessment of the Multiplicity of Carbon-Halogen Bonds: Carbenium and Halonium Ions with F, Cl, Br, and I. J. Phys. Chem. A 2014, 118, 1948–1963. [Google Scholar] [CrossRef] [PubMed]
- Kraka, E.; Cremer, D. Characterization of CF Bonds with Multiple-Bond Character: Bond Lengths, Stretching Force Constants, and Bond Dissociation Energies. ChemPhysChem 2009, 10, 686–698. [Google Scholar] [CrossRef]
- Zou, W.; Cremer, D. C2 in a Box: Determining its Intrinsic Bond Strength for the X1Σ+g Ground State. Chem. Eur. J. 2016, 22, 4087–4097. [Google Scholar] [CrossRef]
- Setiawan, D.; Sethio, D.; Cremer, D.; Kraka, E. From Strong to Weak NF Bonds: On the Design of a New Class of Fluorinating Agents. Phys. Chem. Chem. Phys. 2018, 20, 23913–23927. [Google Scholar] [CrossRef] [PubMed]
- Freindorf, M.; Kraka, E.; Cremer, D. A Comprehensive Analysis of Hydrogen Bond Interactions Based on Local Vibrational Modes. Int. J. Quantum Chem. 2012, 112, 3174–3187. [Google Scholar] [CrossRef]
- Kalescky, R.; Zou, W.; Kraka, E.; Cremer, D. Local Vibrational Modes of the Water Dimer—Comparison of Theory and Experiment. Chem. Phys. Lett. 2012, 554, 243–247. [Google Scholar] [CrossRef]
- Kalescky, R.; Kraka, E.; Cremer, D. Local Vibrational Modes of the Formic Acid Dimer—The Strength of the Double H-Bond. Mol. Phys. 2013, 111, 1497–1510. [Google Scholar] [CrossRef]
- Kalescky, R.; Zou, W.; Kraka, E.; Cremer, D. Vibrational Properties of the Isotopomers of the Water Dimer Derived from Experiment and Computations. Aust. J. Chem. 2014, 67, 426–434. [Google Scholar] [CrossRef] [Green Version]
- Tao, Y.; Zou, W.; Jia, J.; Li, W.; Cremer, D. Different Ways of Hydrogen Bonding in Water—Why Does Warm Water Freeze Faster than Cold Water? J. Chem. Theory Comput. 2017, 13, 55–76. [Google Scholar] [CrossRef] [PubMed]
- Tao, Y.; Zou, W.; Kraka, E. Strengthening of Hydrogen Bonding with the Push-Pull Effect. Chem. Phys. Lett. 2017, 685, 251–258. [Google Scholar] [CrossRef]
- Makoś, M.Z.; Freindorf, M.; Sethio, D.; Kraka, E. New Insights into Fe–H2 and Fe–H− Bonding of a [NiFe] Hydrogenase Mimic—A Local Vibrational Mode Study. Theor. Chem. Acc. 2019, 138, 76. [Google Scholar] [CrossRef]
- Lyu, S.; Beiranvand, N.; Freindorf, M.; Kraka, E. Interplay of Ring Puckering and Hydrogen Bonding in Deoxyribonucleosides. J. Phys. Chem. A 2019, 123, 7087–7103. [Google Scholar] [CrossRef]
- Oliveira, V.; Kraka, E.; Cremer, D. The Intrinsic Strength of the Halogen Bond: Electrostatic and Covalent Contributions Described by Coupled Cluster Theory. Phys. Chem. Chem. Phys. 2016, 18, 33031–33046. [Google Scholar] [CrossRef]
- Oliveira, V.; Kraka, E.; Cremer, D. Quantitative Assessment of Halogen Bonding Utilizing Vibrational Spectroscopy. Inorg. Chem. 2016, 56, 488–502. [Google Scholar] [CrossRef] [PubMed]
- Oliveira, V.; Cremer, D. Transition from Metal-Ligand Bonding to Halogen Bonding Involving a Metal as Halogen Acceptor: A Study of Cu, Ag, Au, Pt, and Hg Complexes. Chem. Phys. Lett. 2017, 681, 56–63. [Google Scholar] [CrossRef]
- Yannacone, S.; Oliveira, V.; Verma, N.; Kraka, E. A Continuum from Halogen Bonds to Covalent Bonds: Where Do λ3 Iodanes Fit? Inorganics 2019, 7, 47. [Google Scholar] [CrossRef] [Green Version]
- Oliveira, V.P.; Kraka, E.; Machado, F.B.C. Pushing 3c-4e Bonds to the Limit: A Coupled Cluster Study of Stepwise Fluorination of First-Row Atoms. Inorg. Chem. 2019, 58, 14777–14789. [Google Scholar] [CrossRef] [PubMed]
- Oliveira, V.P.; Marcial, B.L.; Machado, F.B.C.; Kraka, E. Metal-Halogen Bonding Seen through the Eyes of Vibrational Spectroscopy. Materials 2020, 13, 55. [Google Scholar] [CrossRef] [PubMed] [Green Version]
- Setiawan, D.; Kraka, E.; Cremer, D. Description of Pnicogen Bonding with the help of Vibrational Spectroscopy-The Missing Link Between Theory and Experiment. Chem. Phys. Lett. 2014, 614, 136–142. [Google Scholar] [CrossRef]
- Setiawan, D.; Kraka, E.; Cremer, D. Strength of the Pnicogen Bond in Complexes Involving Group VA Elements N, P, and As. J. Phys. Chem. A 2014, 119, 1642–1656. [Google Scholar] [CrossRef]
- Setiawan, D.; Cremer, D. Super-Pnicogen Bonding in the Radical Anion of the Fluorophosphine Dimer. Chem. Phys. Lett. 2016, 662, 182–187. [Google Scholar] [CrossRef] [Green Version]
- Oliveira, V.; Cremer, D.; Kraka, E. The Many Facets of Chalcogen Bonding: Described by Vibrational Spectroscopy. J. Phys. Chem. A 2017, 121, 6845–6862. [Google Scholar] [CrossRef]
- Oliveira, V.; Kraka, E. Systematic Coupled Cluster Study of Noncovalent Interactions Involving Halogens, Chalcogens, and Pnicogens. J. Phys. Chem. A 2017, 121, 9544–9556. [Google Scholar] [CrossRef]
- Sethio, D.; Oliveira, V.; Kraka, E. Quantitative Assessment of Tetrel Bonding Utilizing Vibrational Spectroscopy. Molecules 2018, 23, 2763. [Google Scholar] [CrossRef] [PubMed] [Green Version]
- Kraka, E.; Larsson, J.A.; Cremer, D. Generalization of the Badger Rule Based on the Use of Adiabatic Vibrational Modes. In Computational Spectroscopy; Grunenberg, J., Ed.; Wiley: New York, NY, USA, 2010; pp. 105–149. [Google Scholar]
- Burschowsky, D.; van Eerde, A.; Ökvist, M.; Kienhöfer, A.; Kast, P.; Hilvert, D.; Krengel, U. Electrostatic transition state stabilization rather than reactant destabilization provides the chemical basis for efficient chorismate mutase catalysis. Proc. Natl. Acad. Sci. USA 2014, 111, 17516. [Google Scholar] [CrossRef] [PubMed] [Green Version]
Figure 1.
(a) Schematic representation of the reaction profile for a model reaction defined as the scalar curvature (solid green line) given as a function of the reaction parameter s. Curvature minima M and curvature maxima K are shown. The location of the TS is denoted by a dotted blue line. The starts and ends of the reaction phases are denoted by dashed black lines. (b) Decomposition of the scalar curvature into components. Three different components are shown in blue, red, and orange.

Figure 2.
The reaction cycle of methanol carbonylation catalyzed by [Rh(CO)I] consisting of four steps: 1—oxidative addition; 2—migration of the methyl group; 3—insertion of carbon monoxide; 4—reductive elimination [144,145]. For each step the reaction curvature as a function of the reaction path parameter s (solid black line) and its decomposition into the most important curvature components (colored lines) are shown. The borders of the reaction phases are indicated by vertical dashed lines at curvature minima M1, M2, M3, etc. The reaction phases are indicated by blue numbers. The TS at amu Bohr is also indicated by a vertical dotted line. B3LYP/6-31G(d,p)/SDD level of theory.

Figure 3.
(a) General scheme of the Sharpless reaction; (b) model system investigated in this work.

Figure 4.
(a) Energy diagram of the Sharpless epoxidation reaction. The energy amount consumed in each phase up to the TS is shown in italics. (b) Corresponding curvature profile including most important curvature components. The reaction curvature as a function of s is shown as a solid black line; the curvature components are shown as solid colored lines. The borders of the reaction phases are indicated by vertical dashed lines at curvature minima M1, M2, M3, etc. The reaction phases are indicated by blue numbers. The TS at s = 0 amu1/2 Bohr is also indicated by a vertical dotted line. B3LYP/6-31G(d,p)/SDD level of theory.

Figure 5.
Non-catalyzed and Au(I) catalyzed [3,3]-sigmatropic rearrangement of allyl acetate.

Figure 6.
Scalar curvature as a function of the reaction path parameter s (solid black line) for the non-catalyzed [3,3]-sigmatropic rearrangement of allyl acetate (Figure 6a) and for the two steps of the Au(I)-NHC catalyzed reaction (Figure 6b,c). The borders of the reaction phases are indicated by vertical dashed lines at curvature minima M1, M2, M3, etc. The reaction phases are indicated by blue numbers. Curvature maxima are given as K1, K2, K3, etc. The TS at s = 0 amu1/2 Bohr is also indicated by a vertical dashed line. B3LYP/6-31+G(d,p)/SDD(Au) level of theory. (Reprinted with permission from [110]; copyright 2020 from Taylor and Francis).

Figure 7.
Claisen rearrangement of chorismate in different environments. Gas phase, R1; aqueous solution: R2 solvent effects described via a polarizable continuum model [133]; R3, solvent effects described via QM/MM using the TIP3P water model [135]; reaction in BsCM described with QM/MM: R4, QM part: chorismate only, MM part: BsCM; R5, QM part: chorismate plus side chains of Arg90, Arg7, and Glu78 of BsCM, MM part: remaining BsCM atoms, R6: QM part: chorismate, MM part: BsCM with Arg90 exchanged to Cit90. B3LYP/ 6-31+G(d,p) model chemistry for reactions R1 and R2 and the QM part of reactions R3–R6, MM part R3–R6 being described with the AMBER force field. For further details, see Computational Methods and Supplementary Materials.

Figure 8.
QM/MM optimized geometry of the BsCM-chorismate complex (ca. 5000 atoms), performed without any geometry constraints, allowing both the enzyme and substrate to relax to their optimal conformation, B3LYP/6-31+G(d,p)/AMBER level of theory.
Figure 8.
QM/MM optimized geometry of the BsCM-chorismate complex (ca. 5000 atoms), performed without any geometry constraints, allowing both the enzyme and substrate to relax to their optimal conformation, B3LYP/6-31+G(d,p)/AMBER level of theory.

Figure 9.
Energy profile of the chorismate rearrangements in the gas phase (R1), aqueous solution modeled with PCM (R2), modeled with TIP3P (R3), in BsCM (R4), in BsCM with an extended QM part (R5), and in mutated BsCM (R6). B3LYP/6-31+G(d,p), B3LYP/6-31+G(d,p)/TIP3P and B3LYP/6-31+G(d,p)/AMBER calculations. (Reprinted with permission from [118]; copyright 2020 from Taylor and Francis).

Figure 10.
Scalar curvature as a function of the reaction path parameter s (solid black line) for the chorismate rearrangements R1 (gas phase reaction), Figure 10a and R5 (reaction in BsCM with an extended QM part), Figure 10b. The decomposition of the scalar curvature into the most important components is given in color. The borders of the reaction phases are indicated by vertical dashed lines at curvature minima M1, M2, M3, etc. Curvature maxima are indicated by K1, K2, K3, etc. The TS at s = 0 amu1/2 Bohr is also indicated by a vertical dotted line. The reaction phases are denoted in blue print and the chemical phases are highlighted with a gray bar. (Reprinted with permission from [118]; copyright 2020 from Taylor and Francis).

Figure 11.
NBO charge of the enolpyruvyl group (in red color) and the NBO charge of the 4-hydroxy-1,5-cyclohexdiene-1-carboxylate group (in blue color) as function of the reaction parameter s for the reactions R1 (a) and R5 (b). The TS at s = 0 amu1/2 Bohr is indicated by a vertical dashed line. (Reprinted with permission from [118]; copyright 2020 from Taylor and Francis).

Figure 12.
H-bond distances( in Ångstrom, black print ) and BSO n values (brown print) for the intermolecular hydrogen bonds in chorismate, the TS, and prephenate of reaction R5 and some reference molecules are shown. The five H-bonds established in the enzyme are numbered (blue print) in order to facilitate the discussion. (Reprinted with permission from [118]; copyright 2020 from Taylor and Francis).


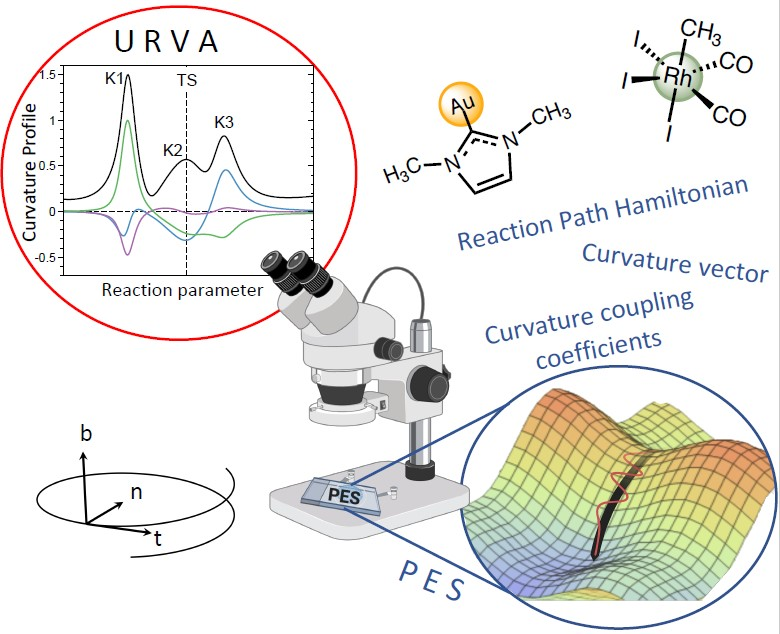
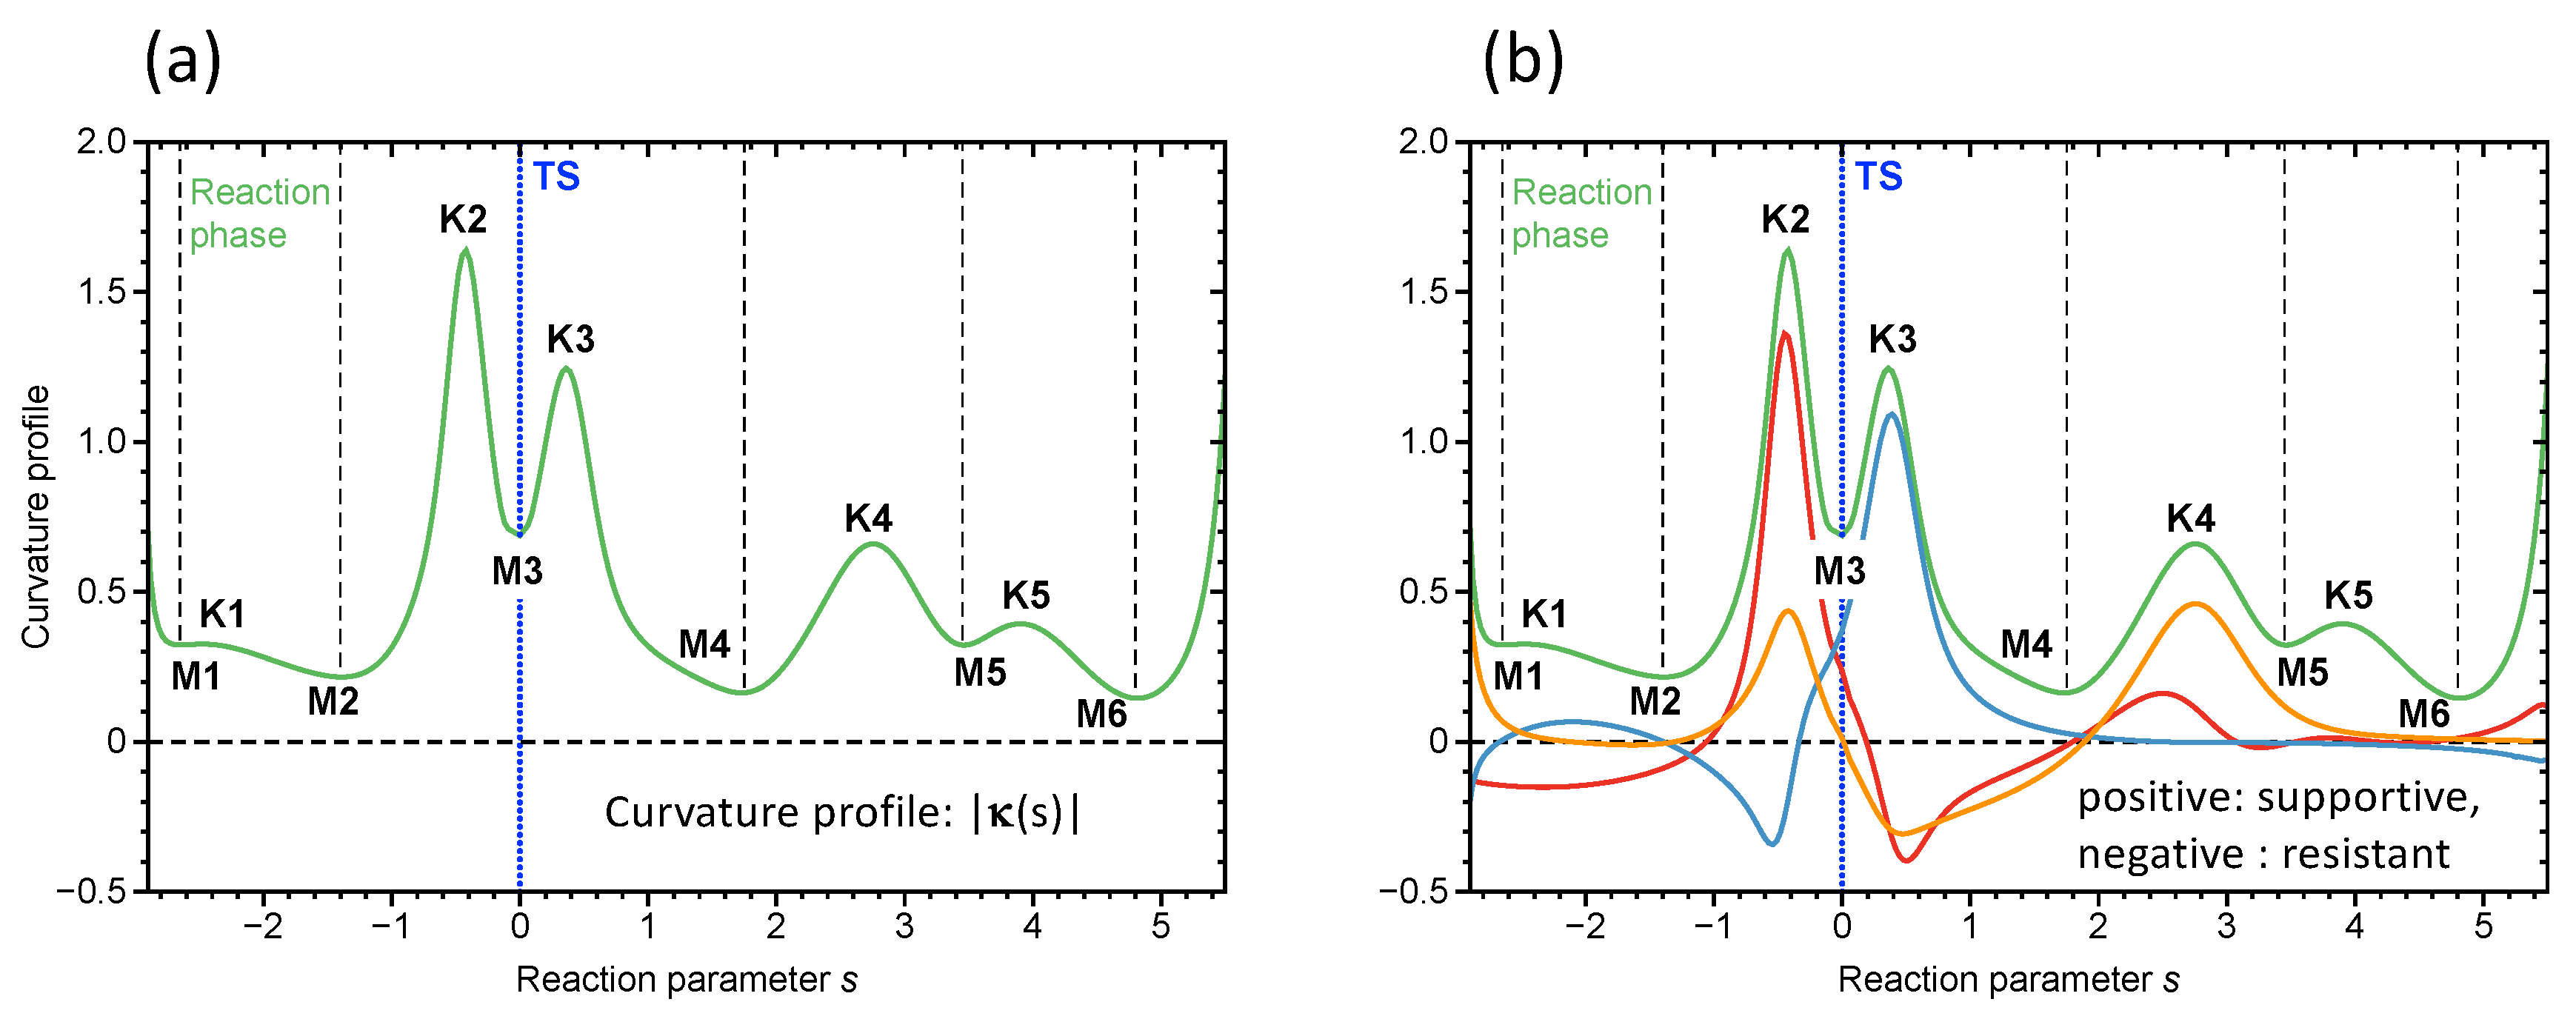
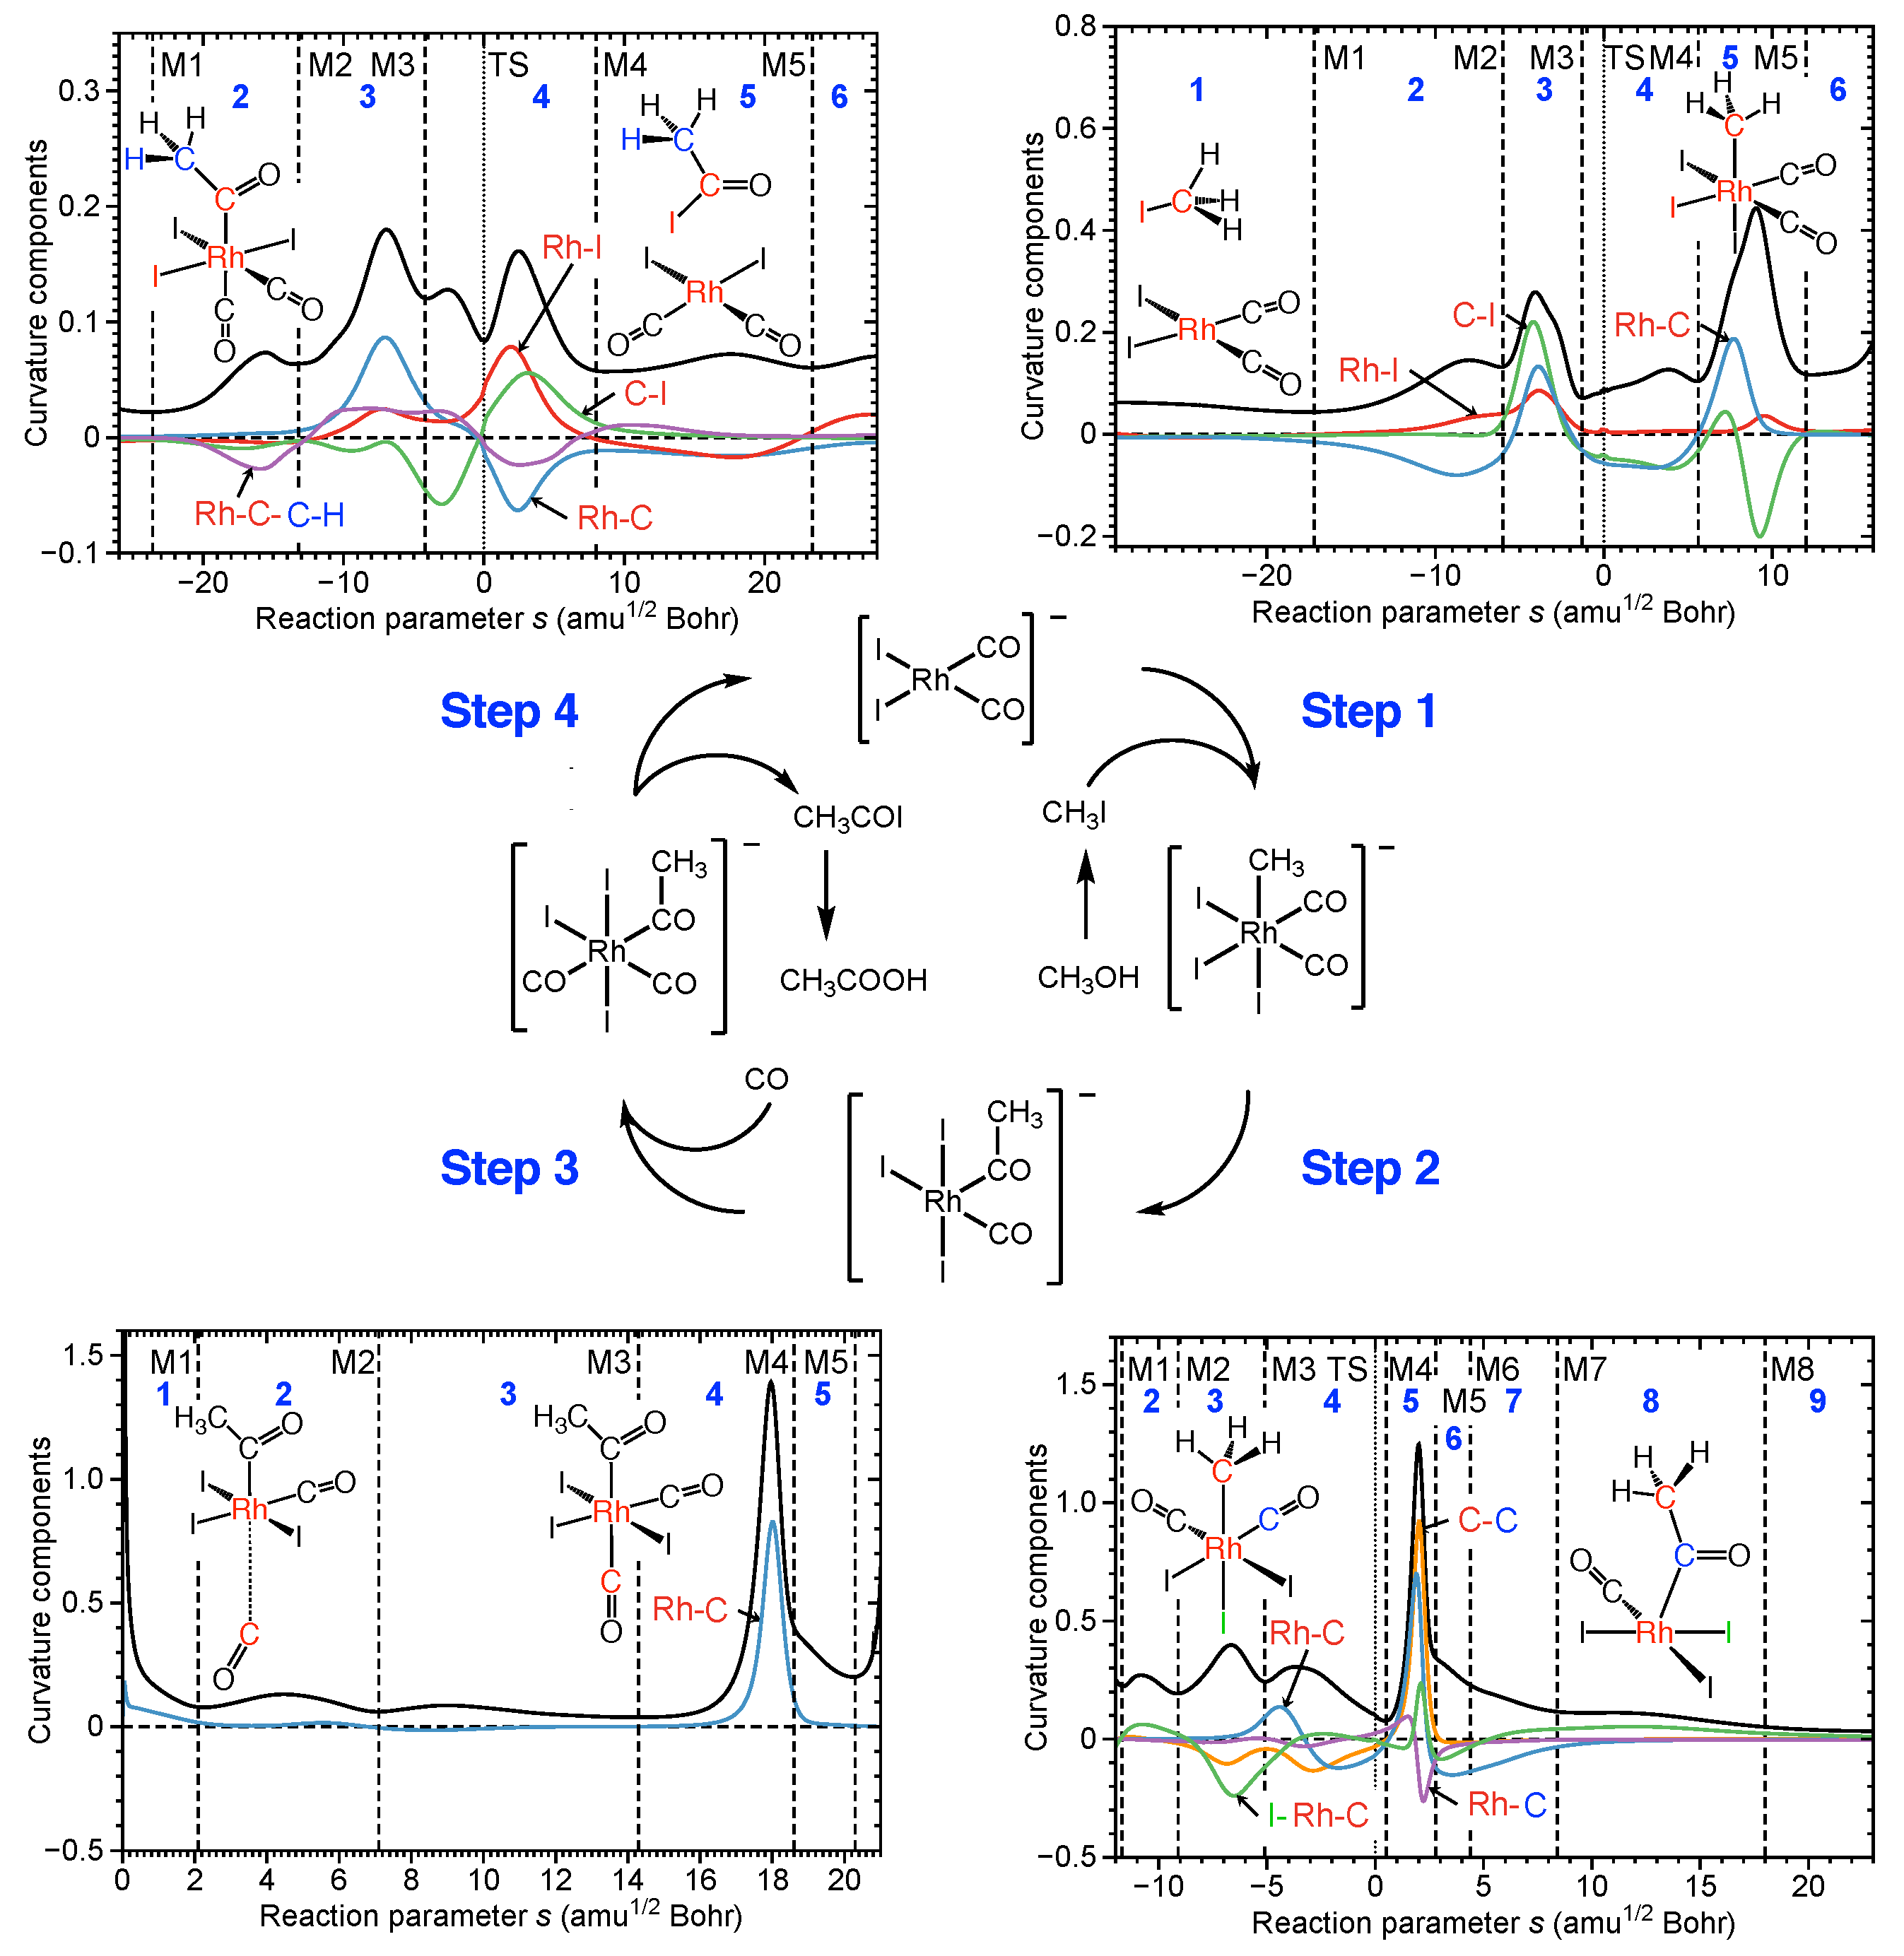
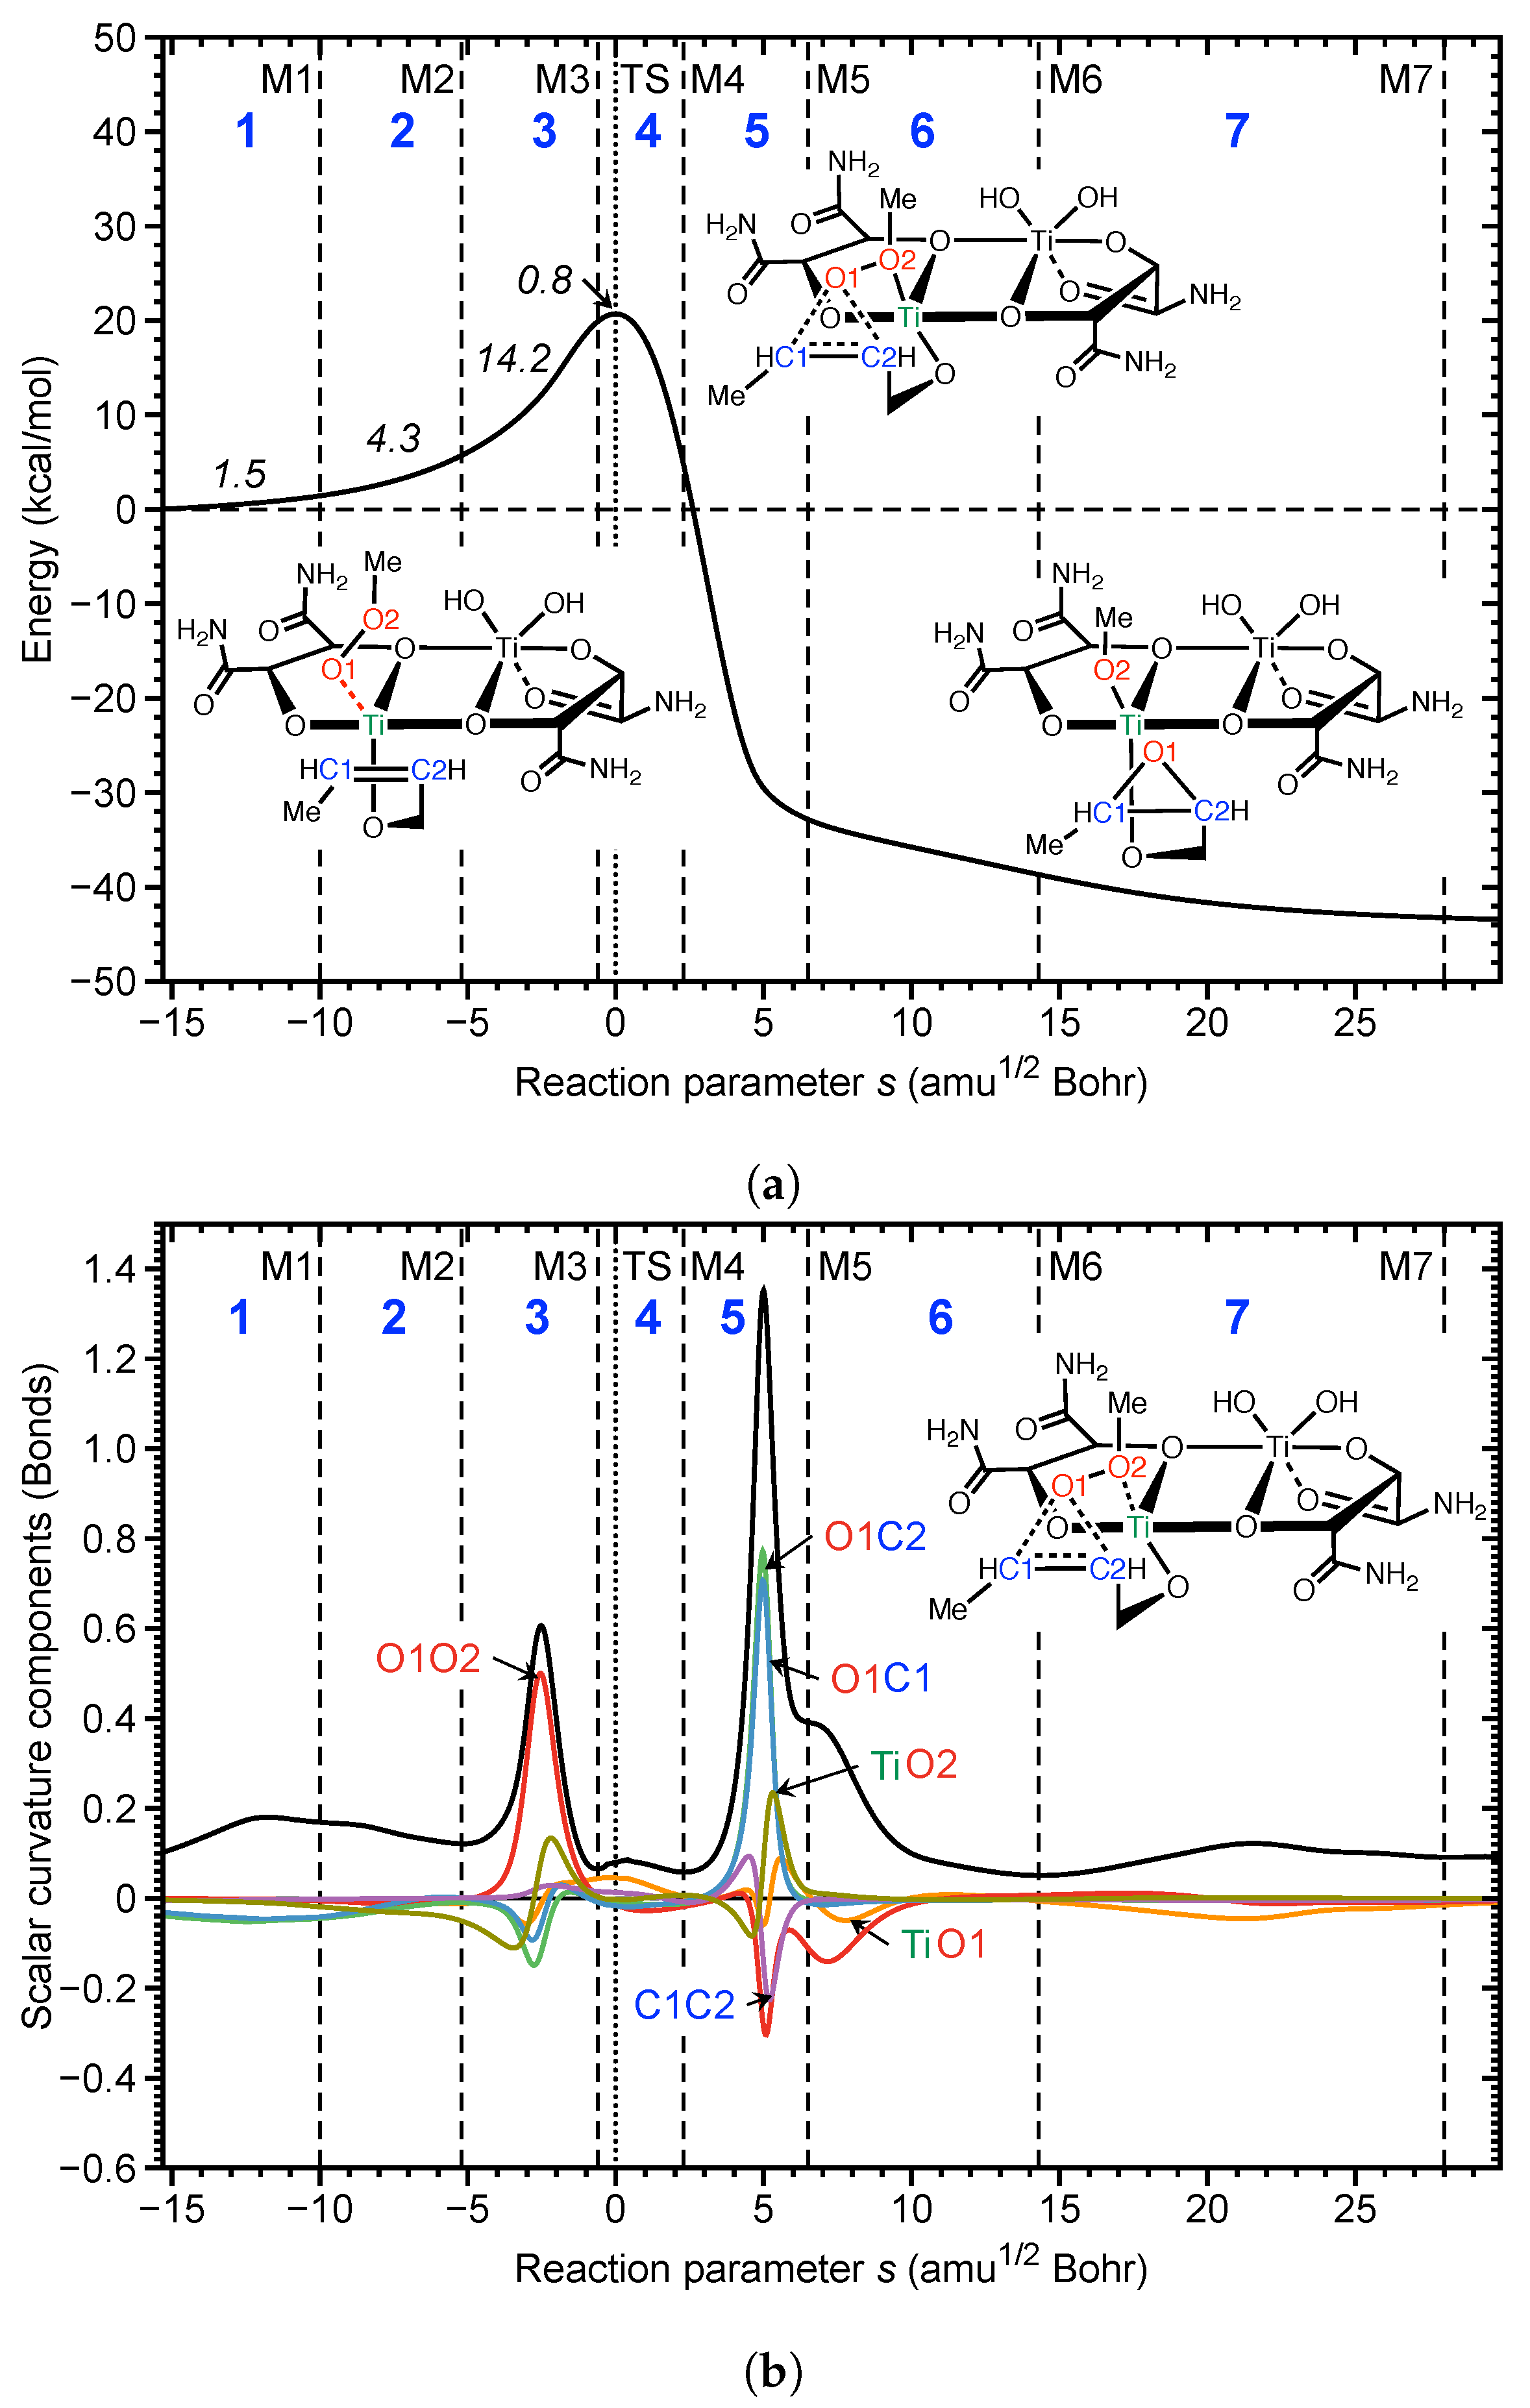
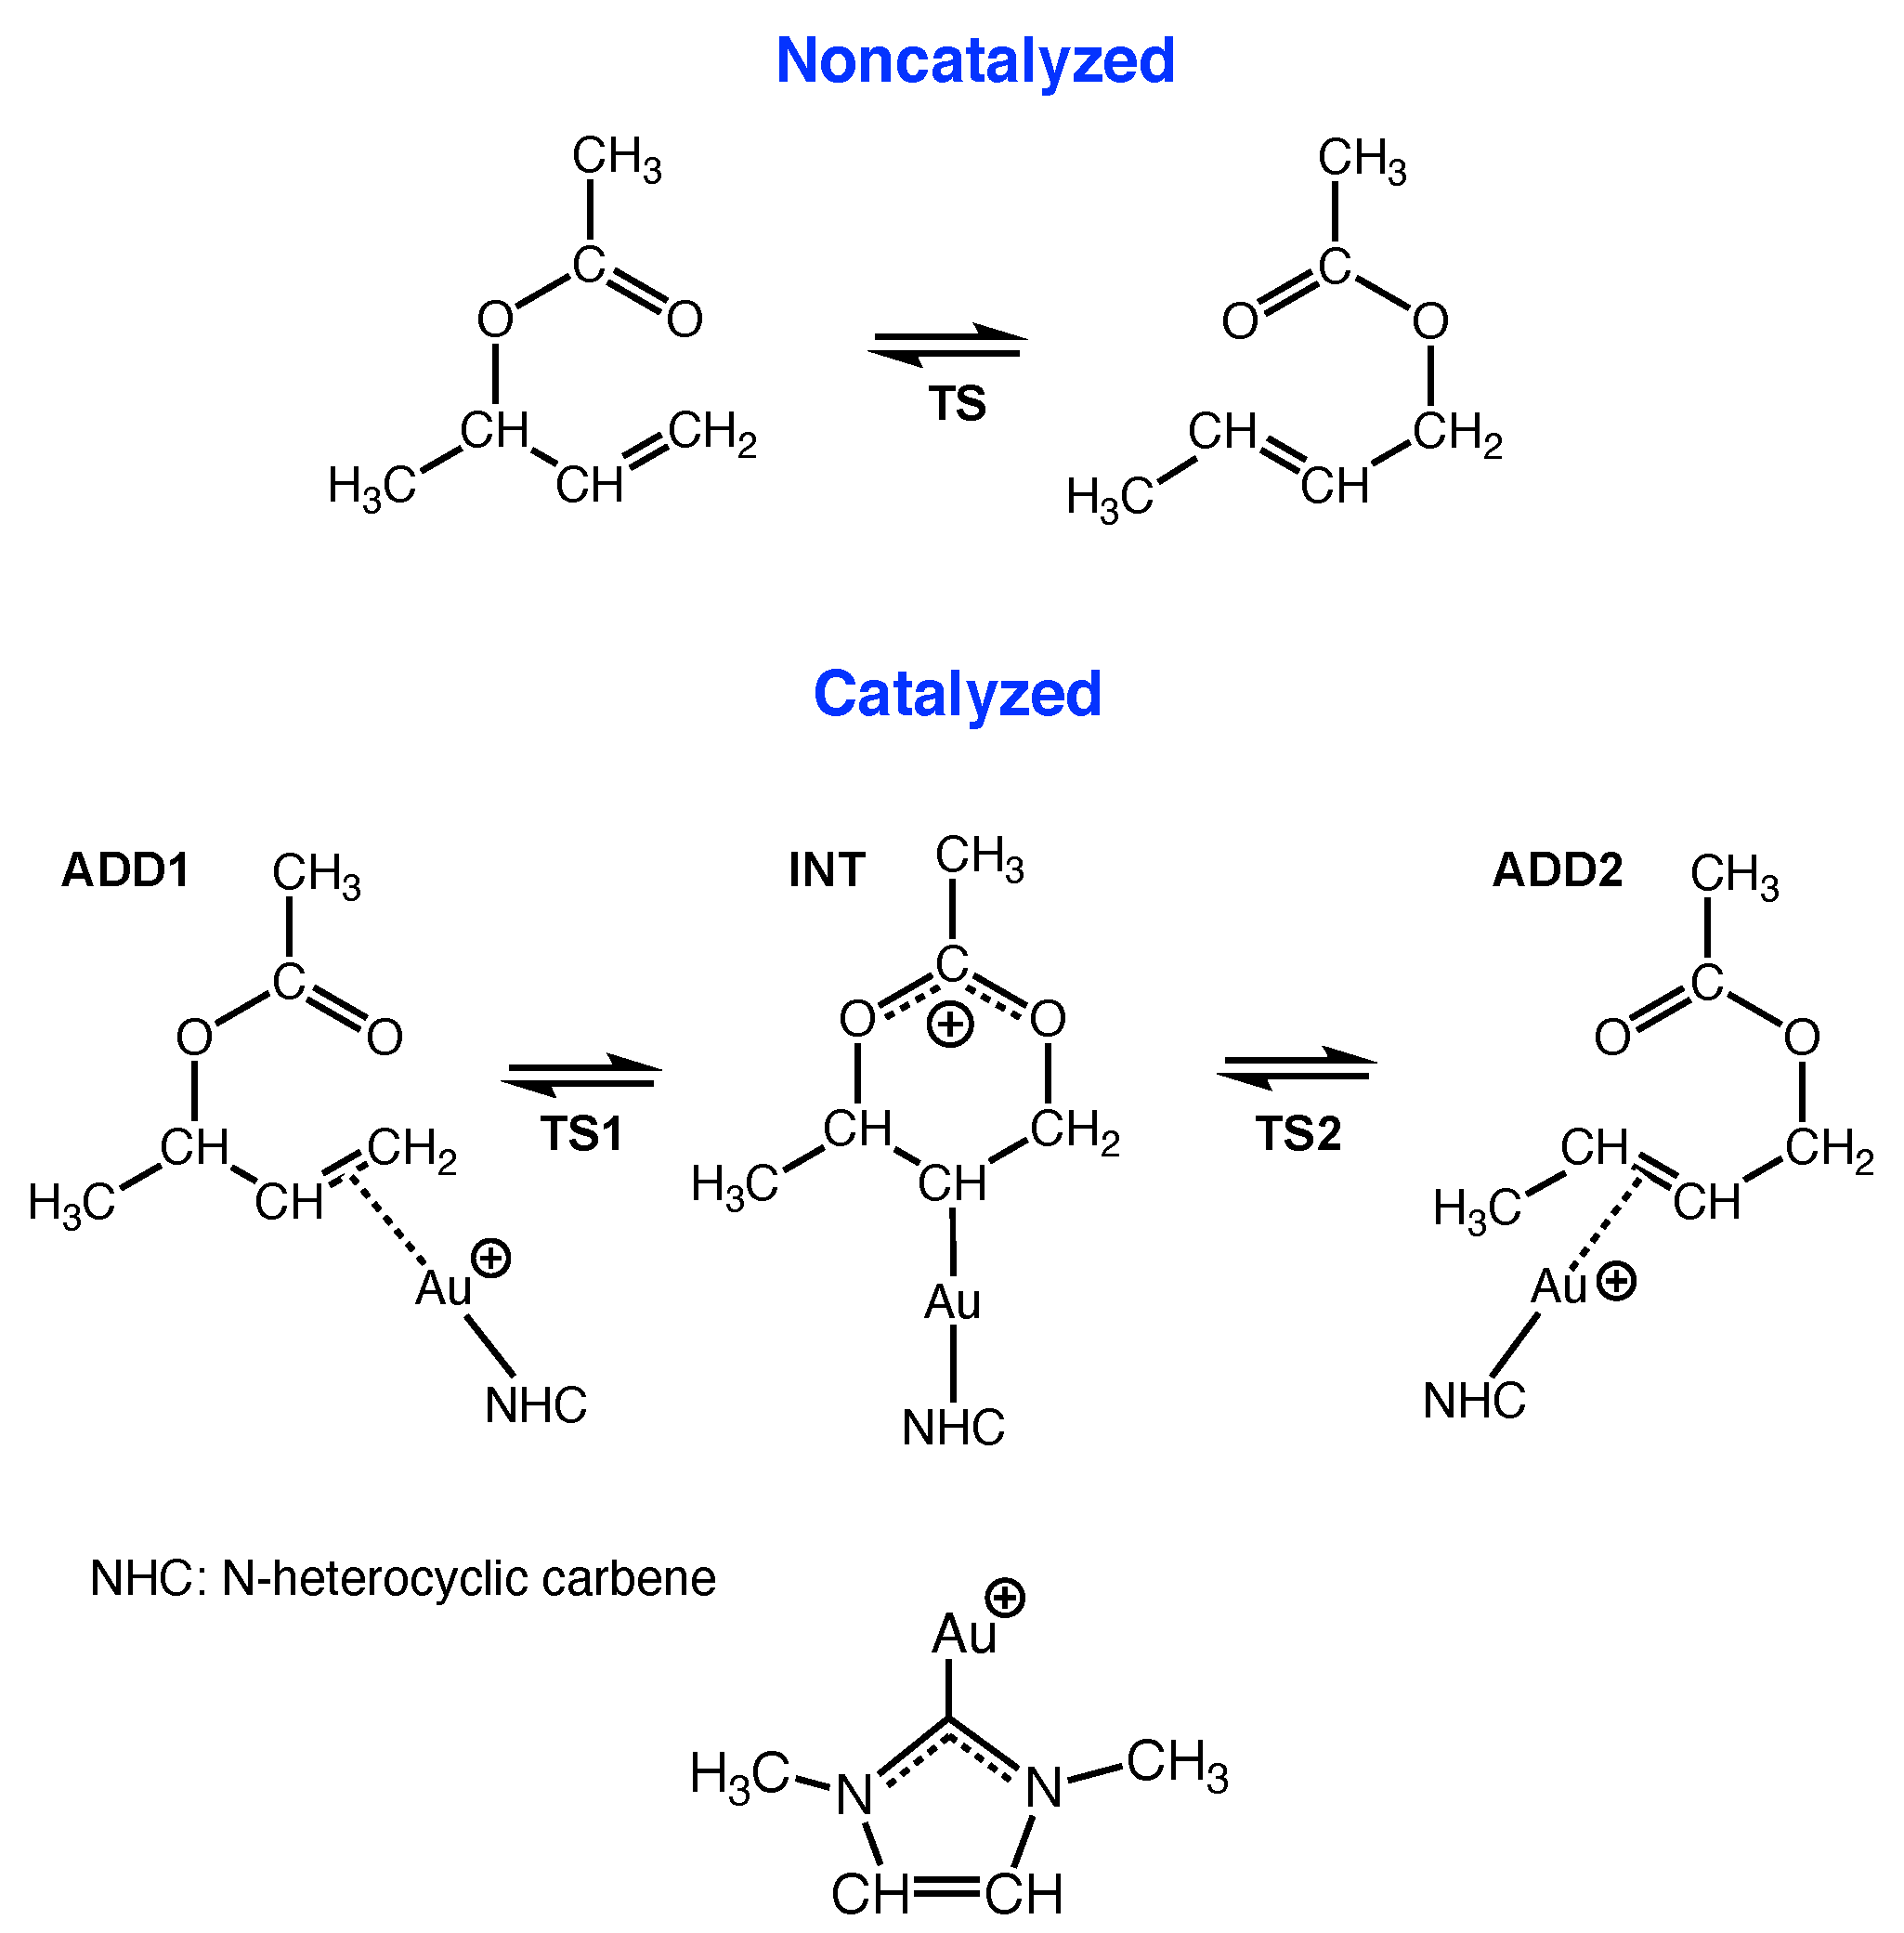
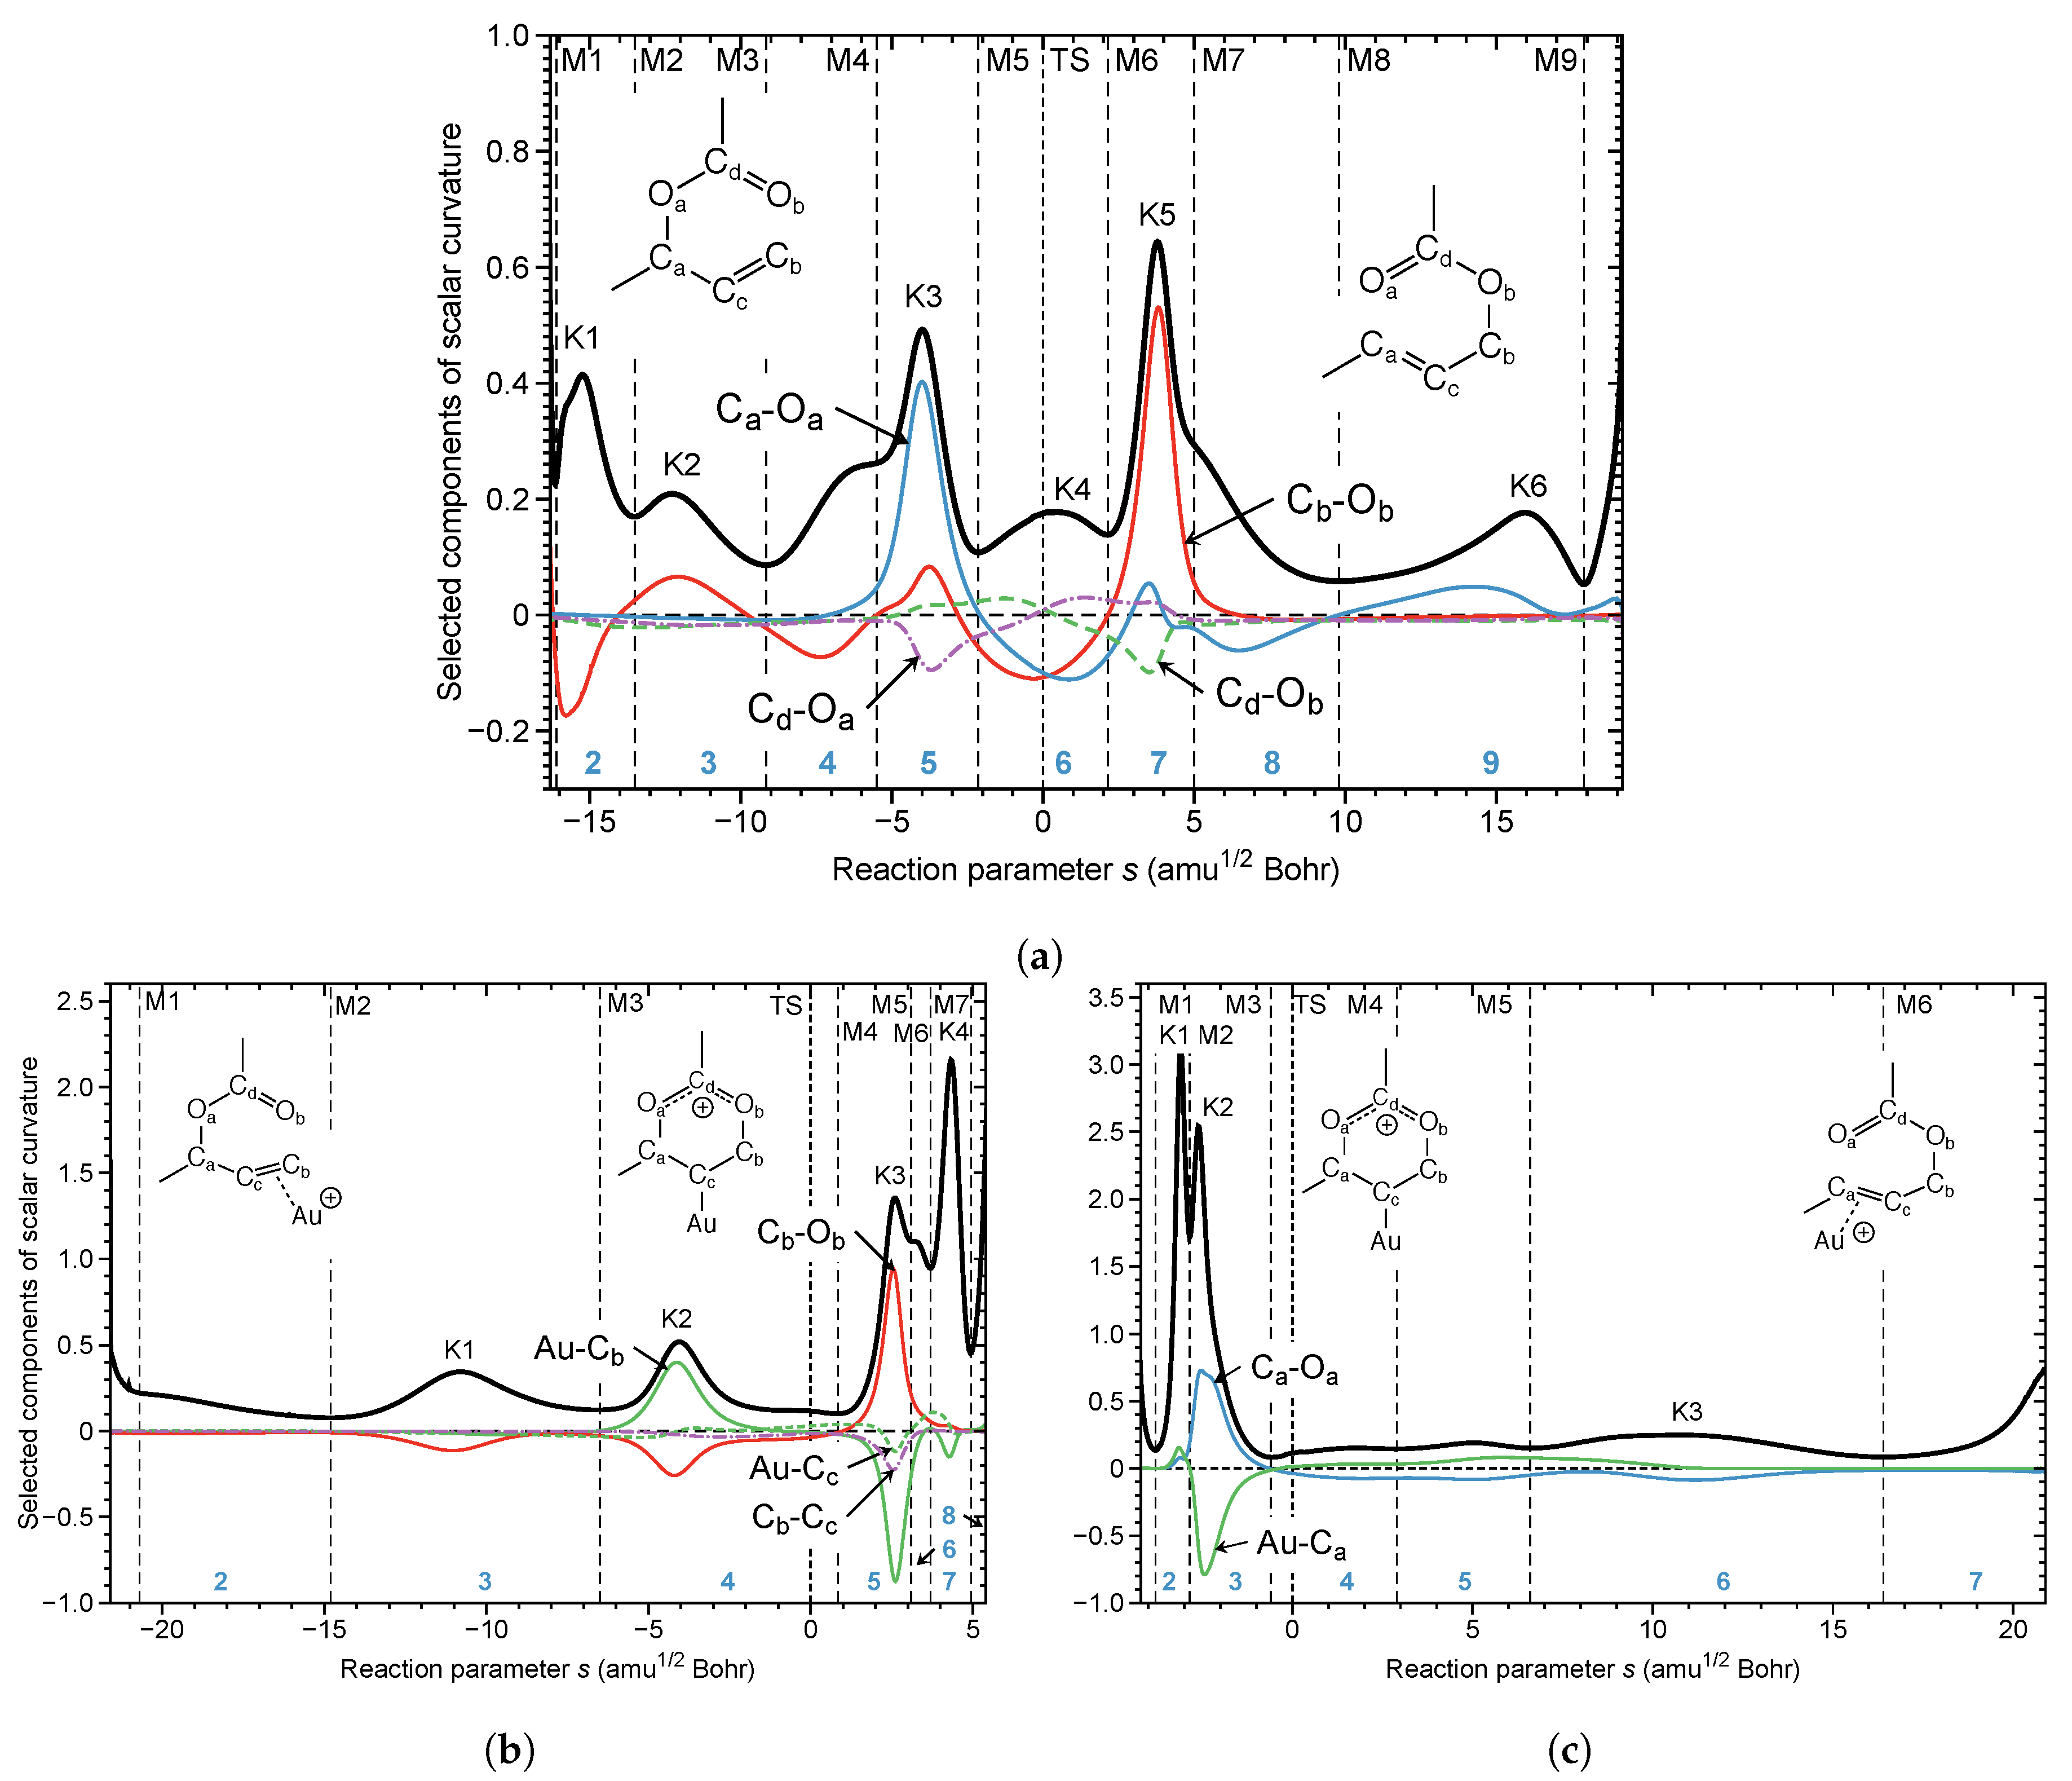
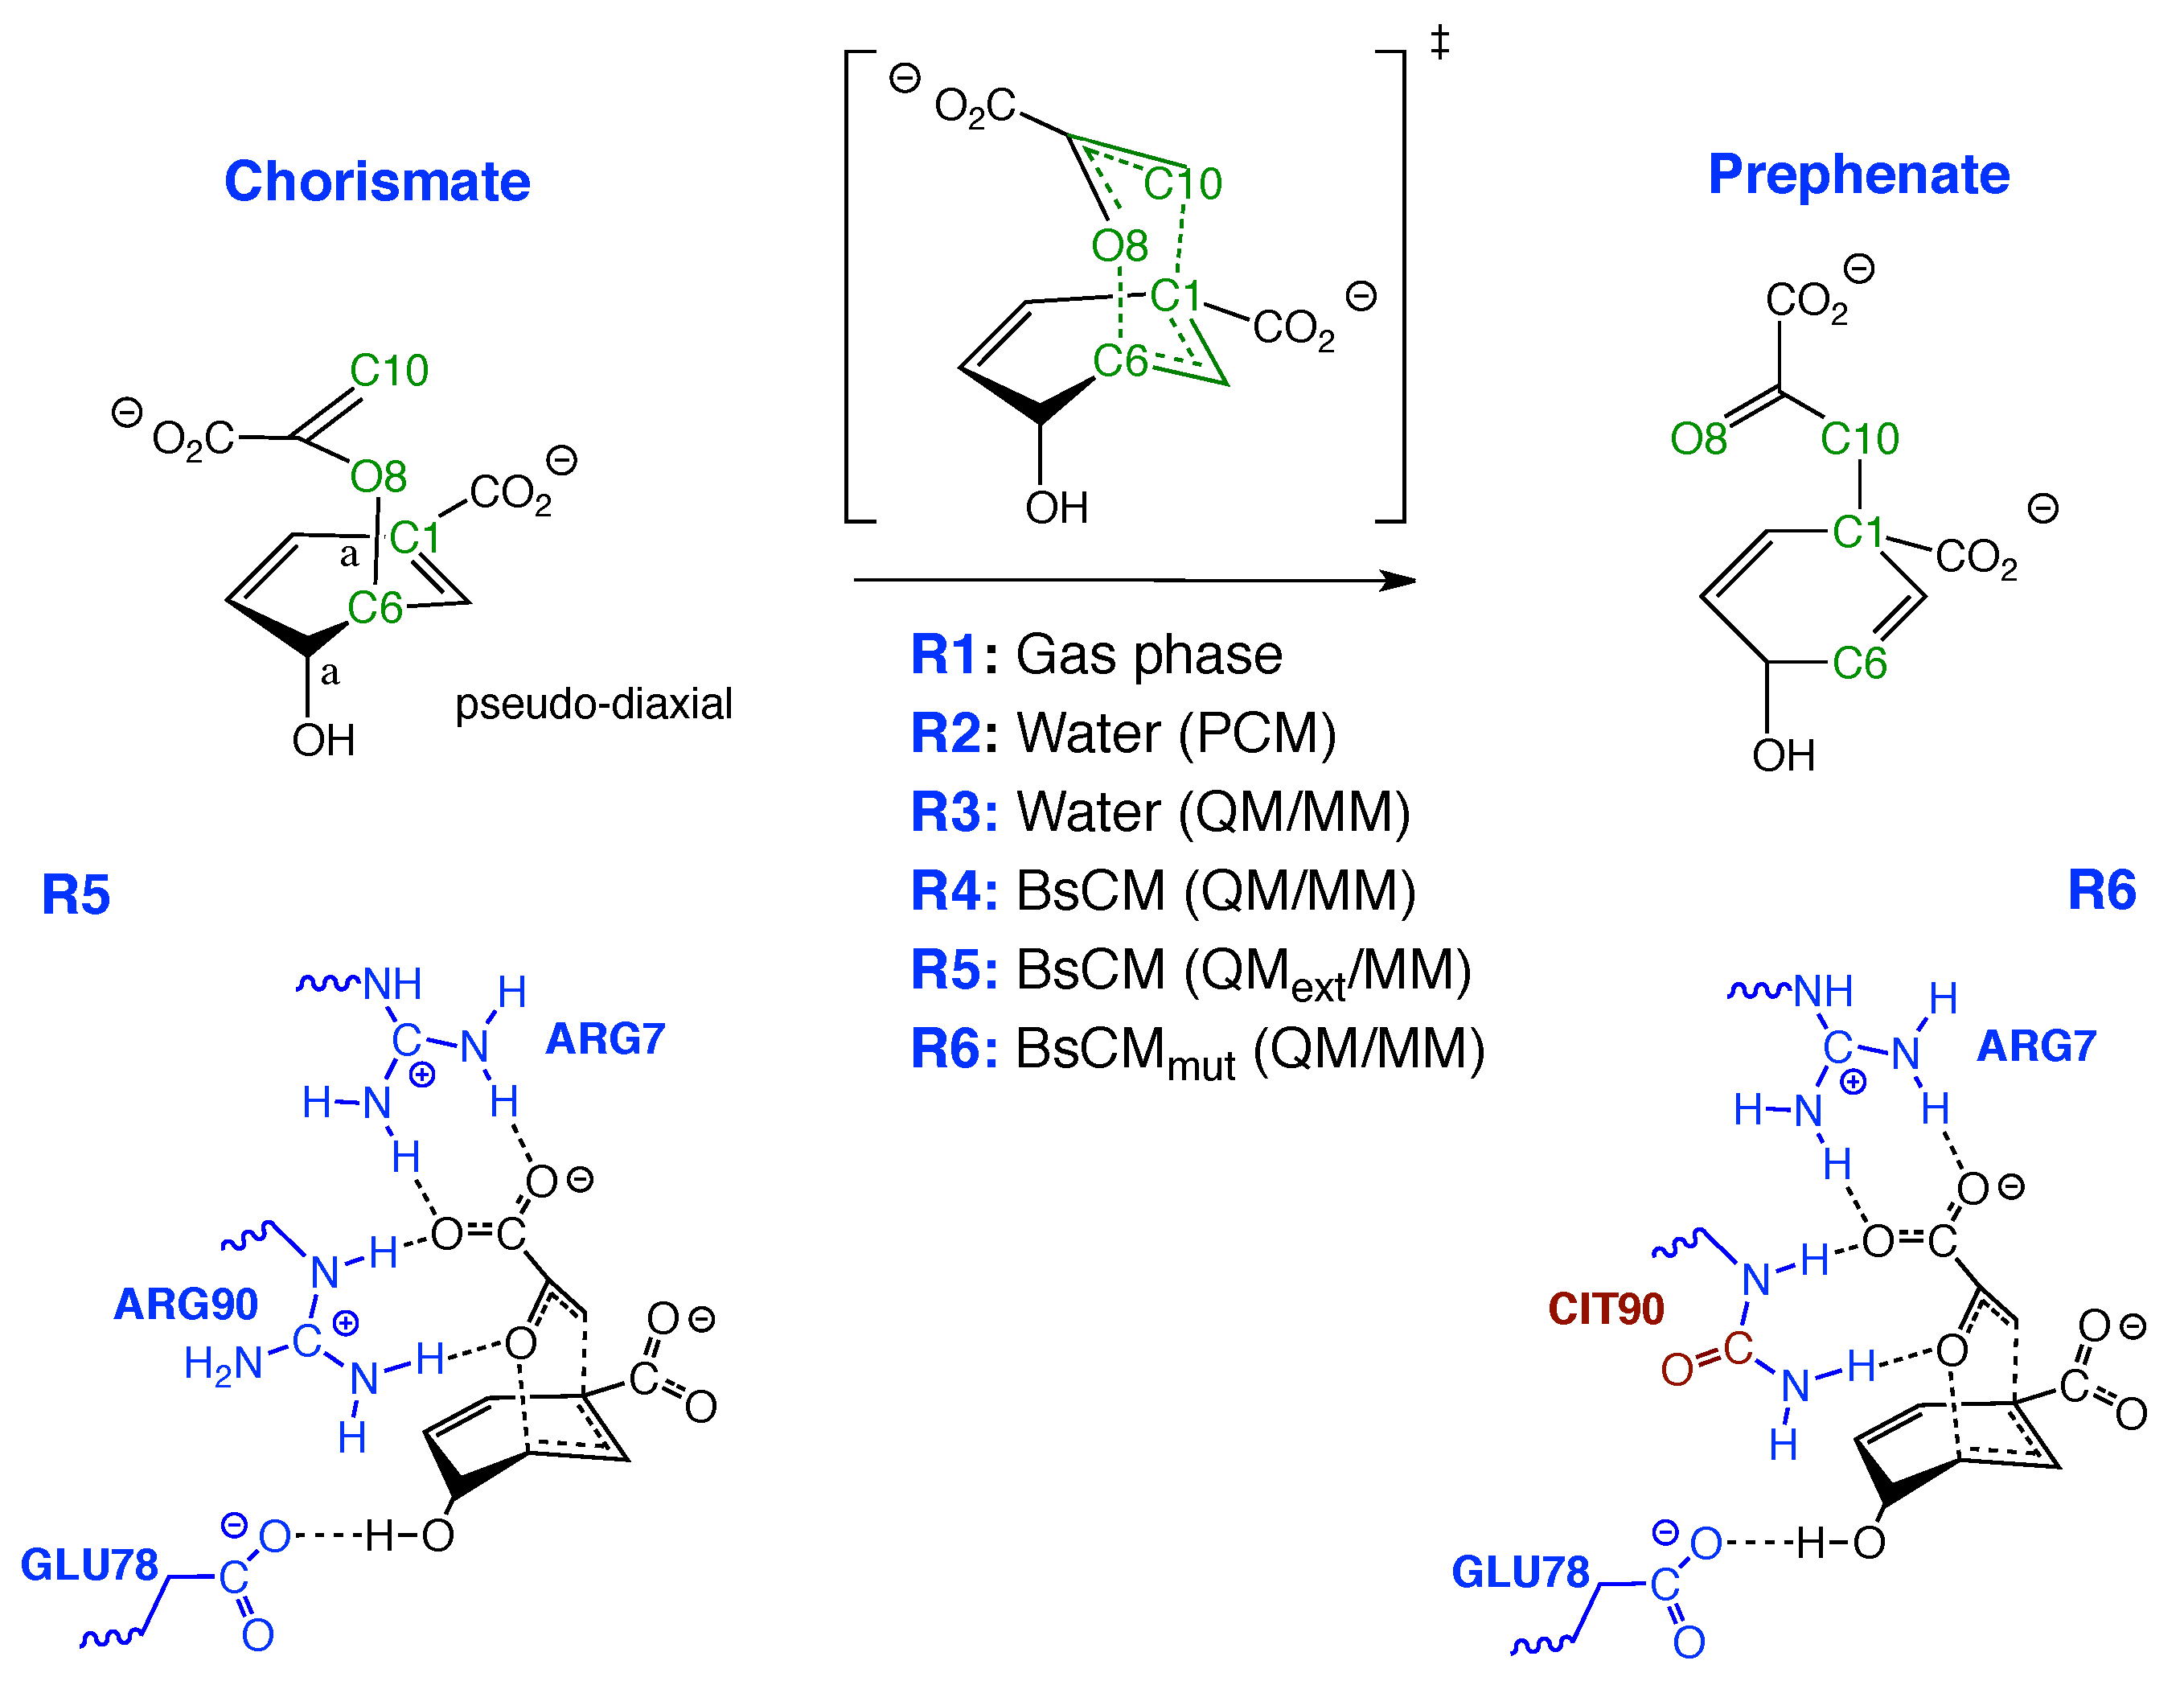
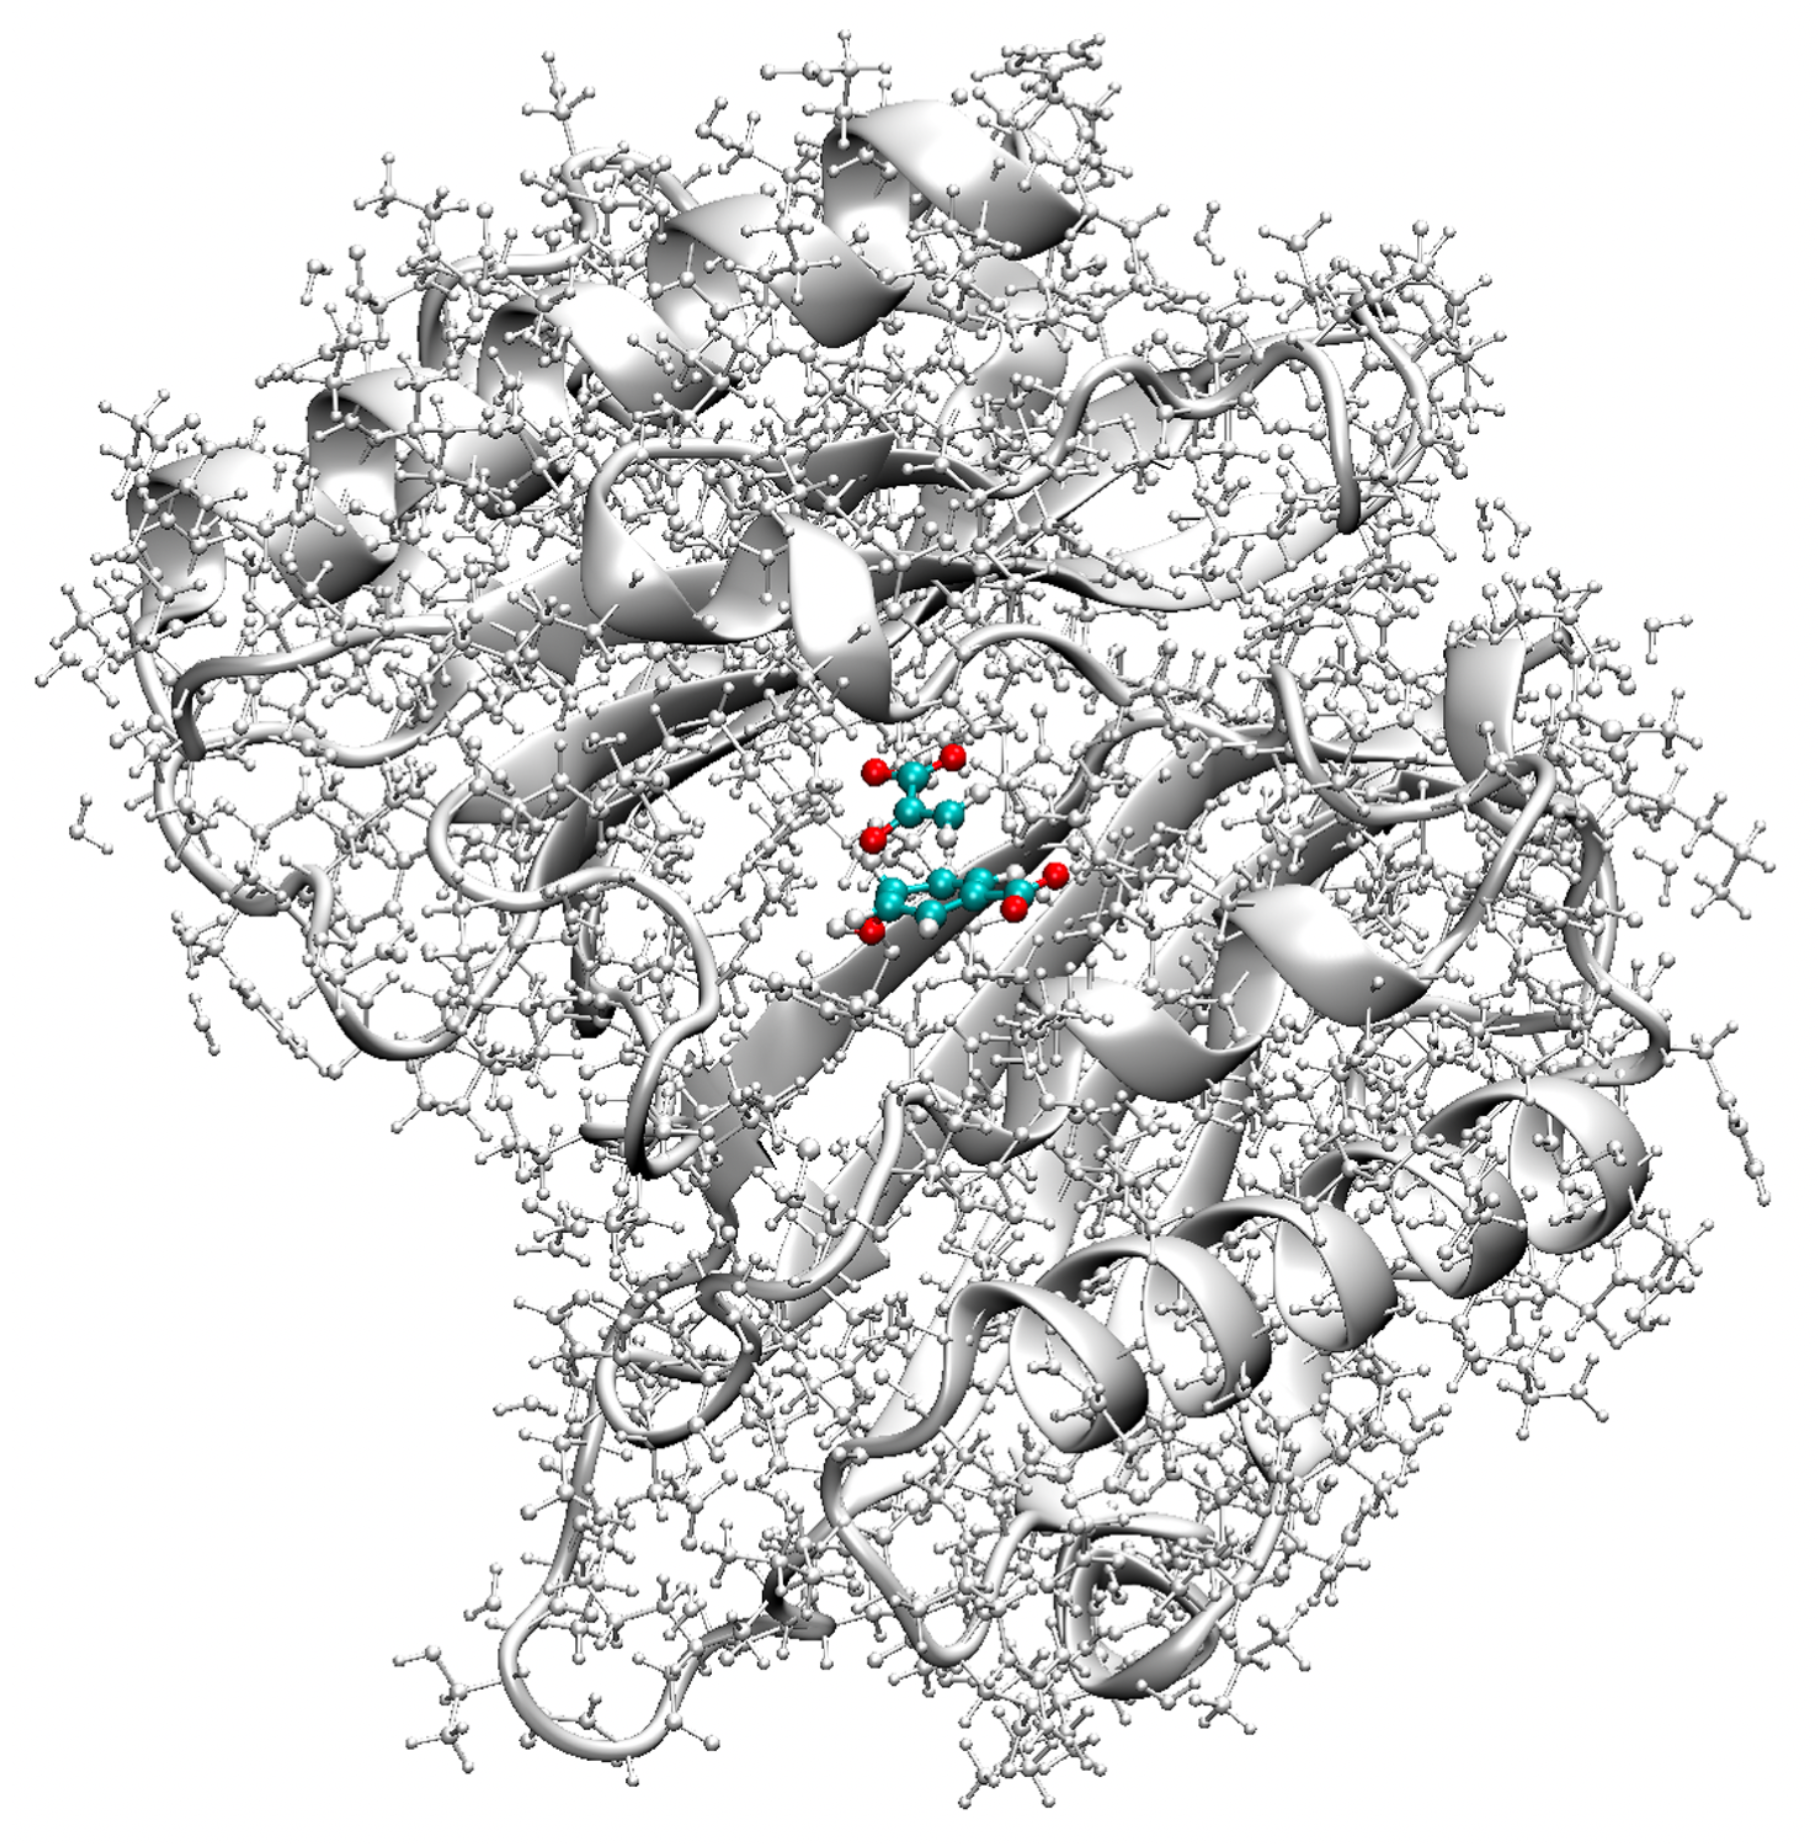
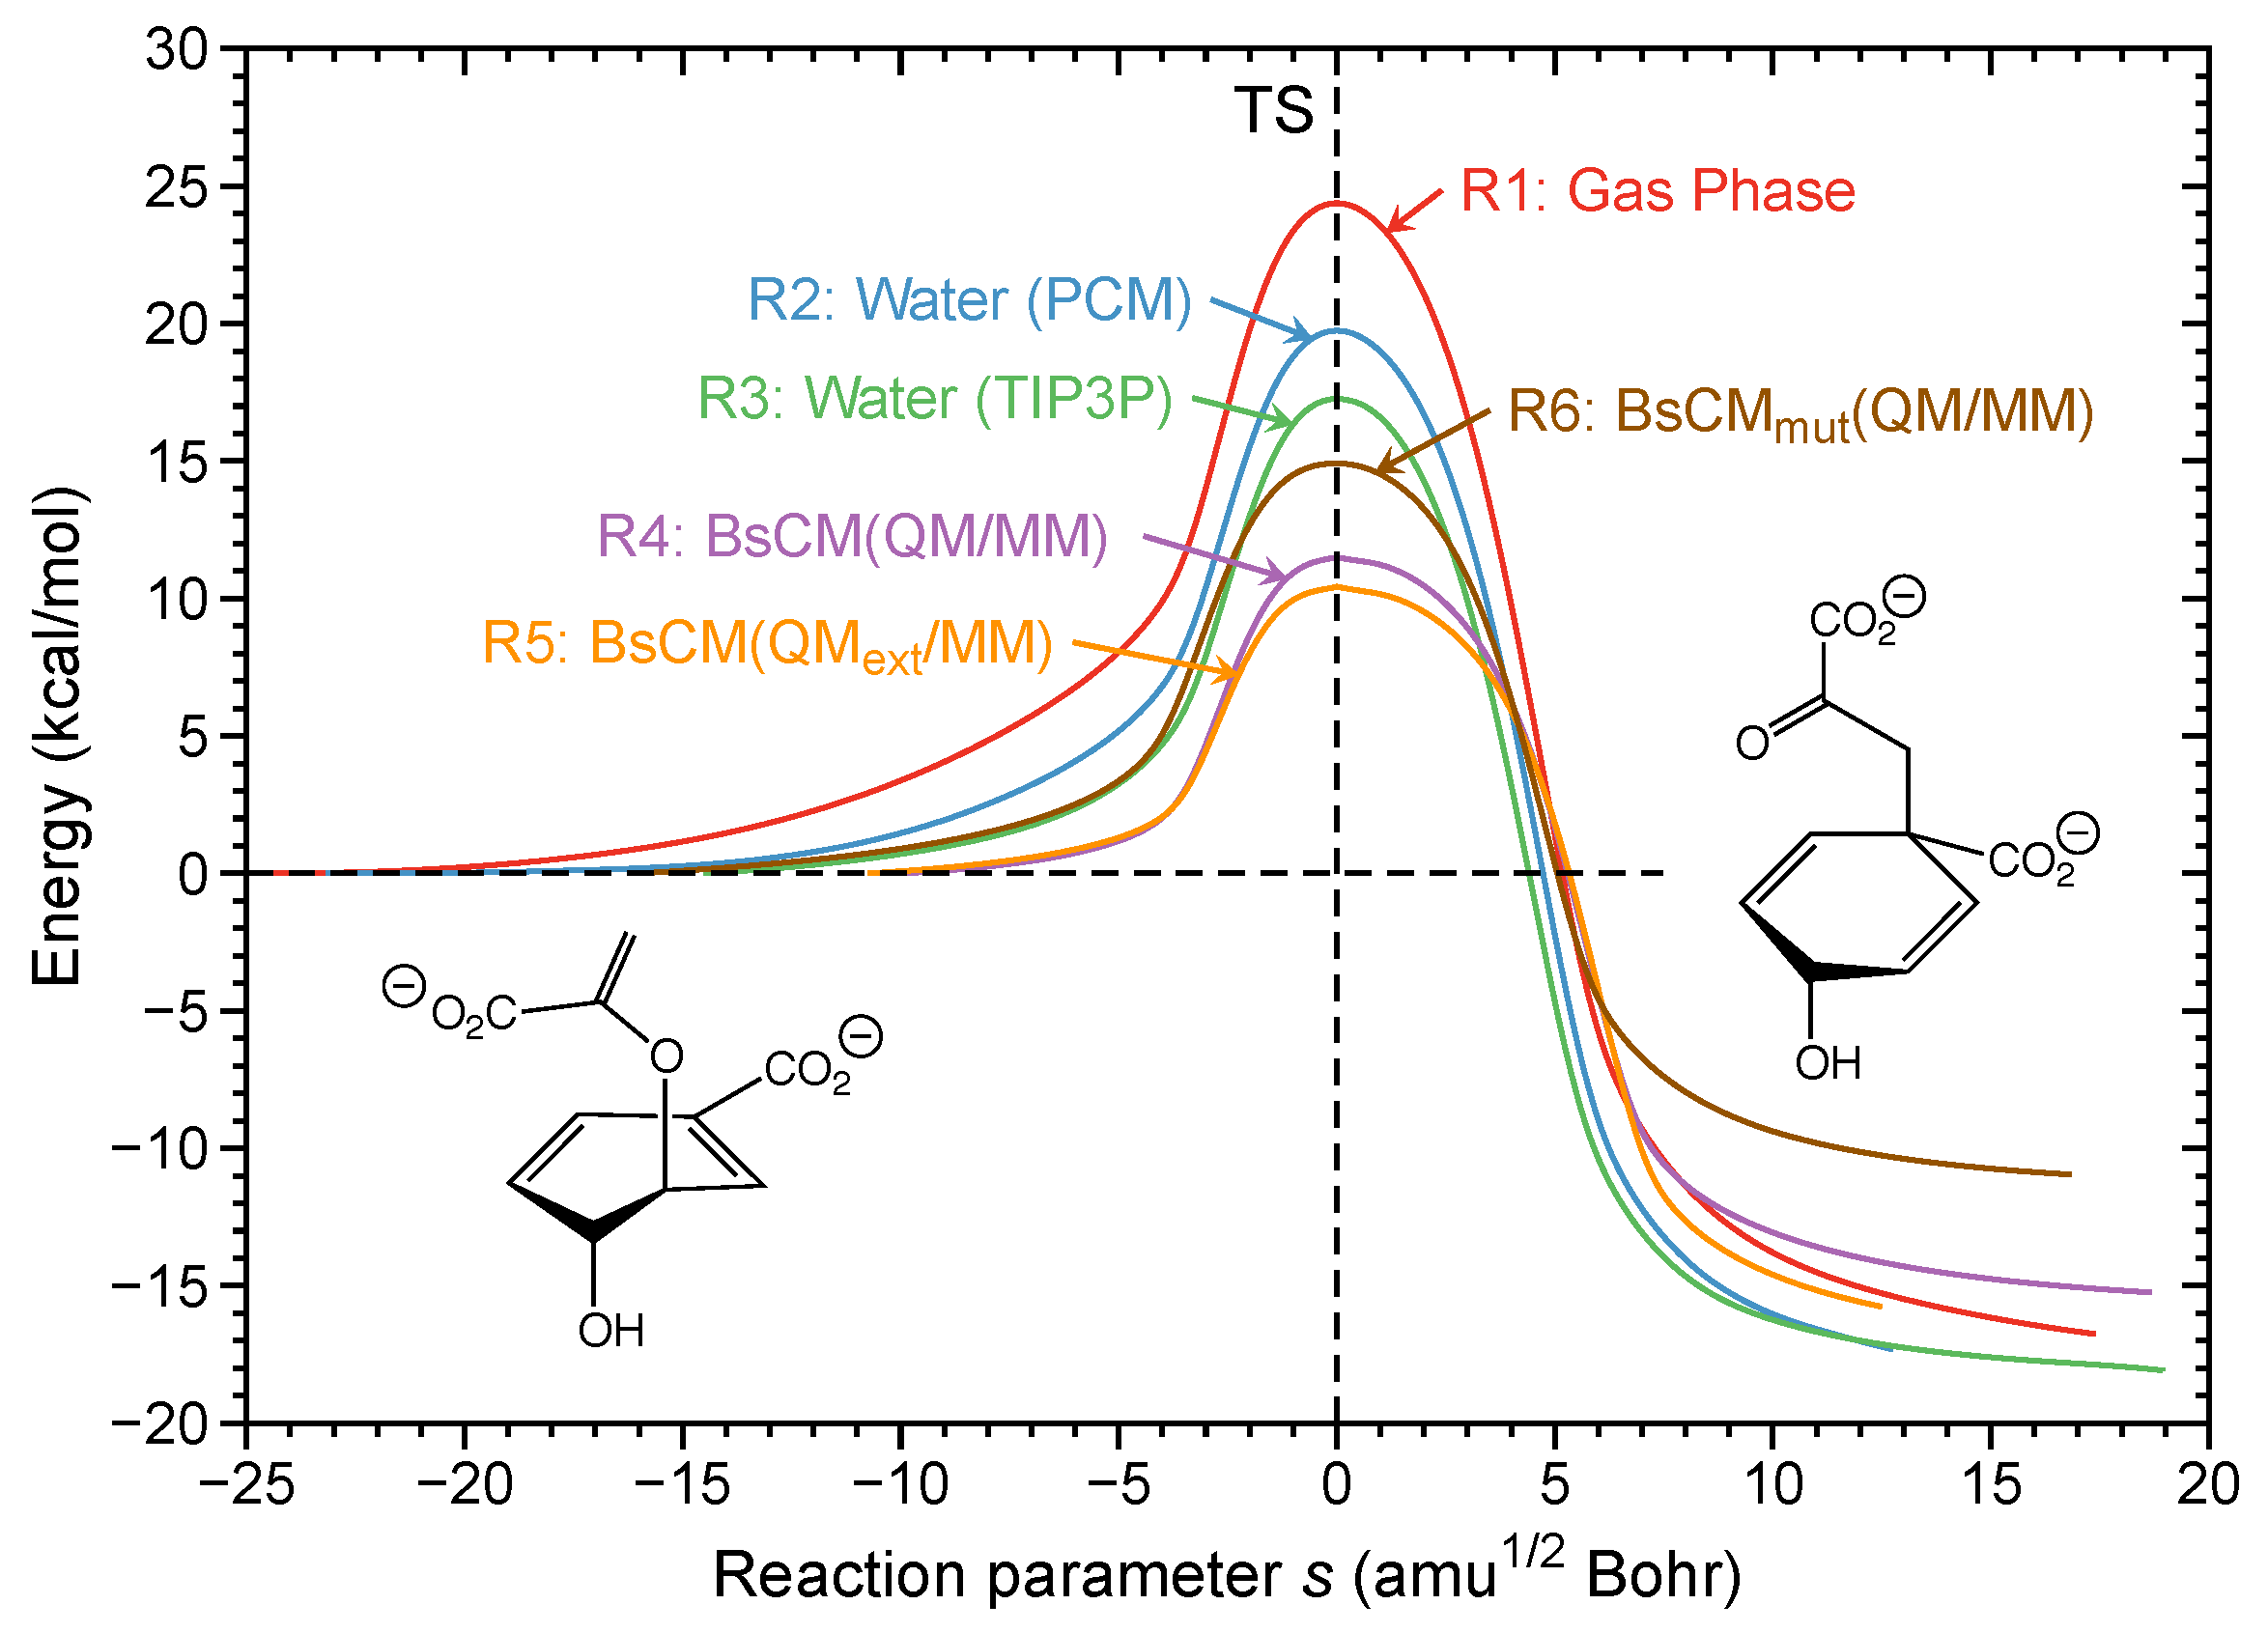
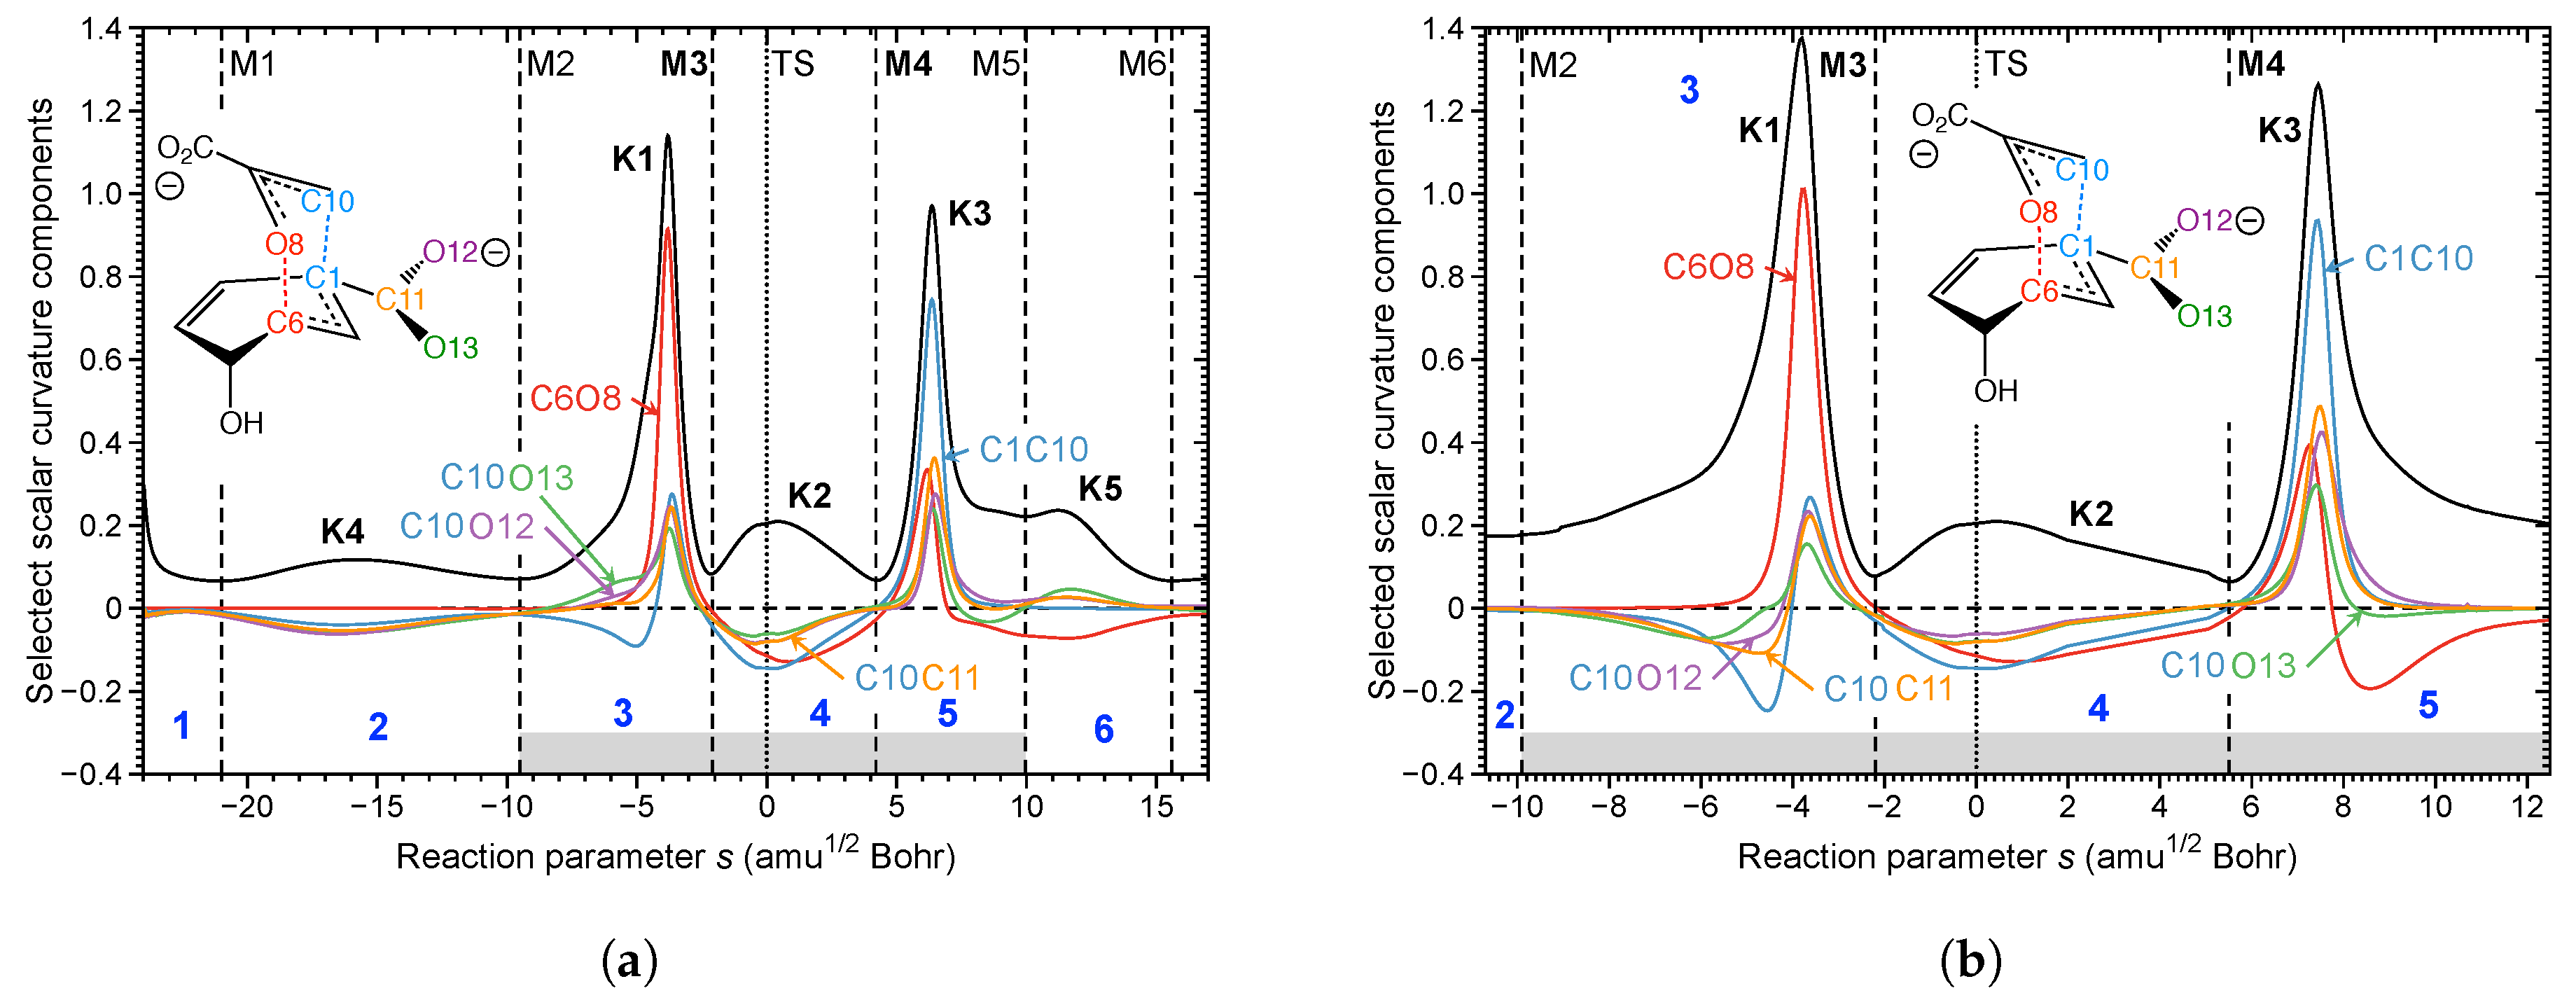
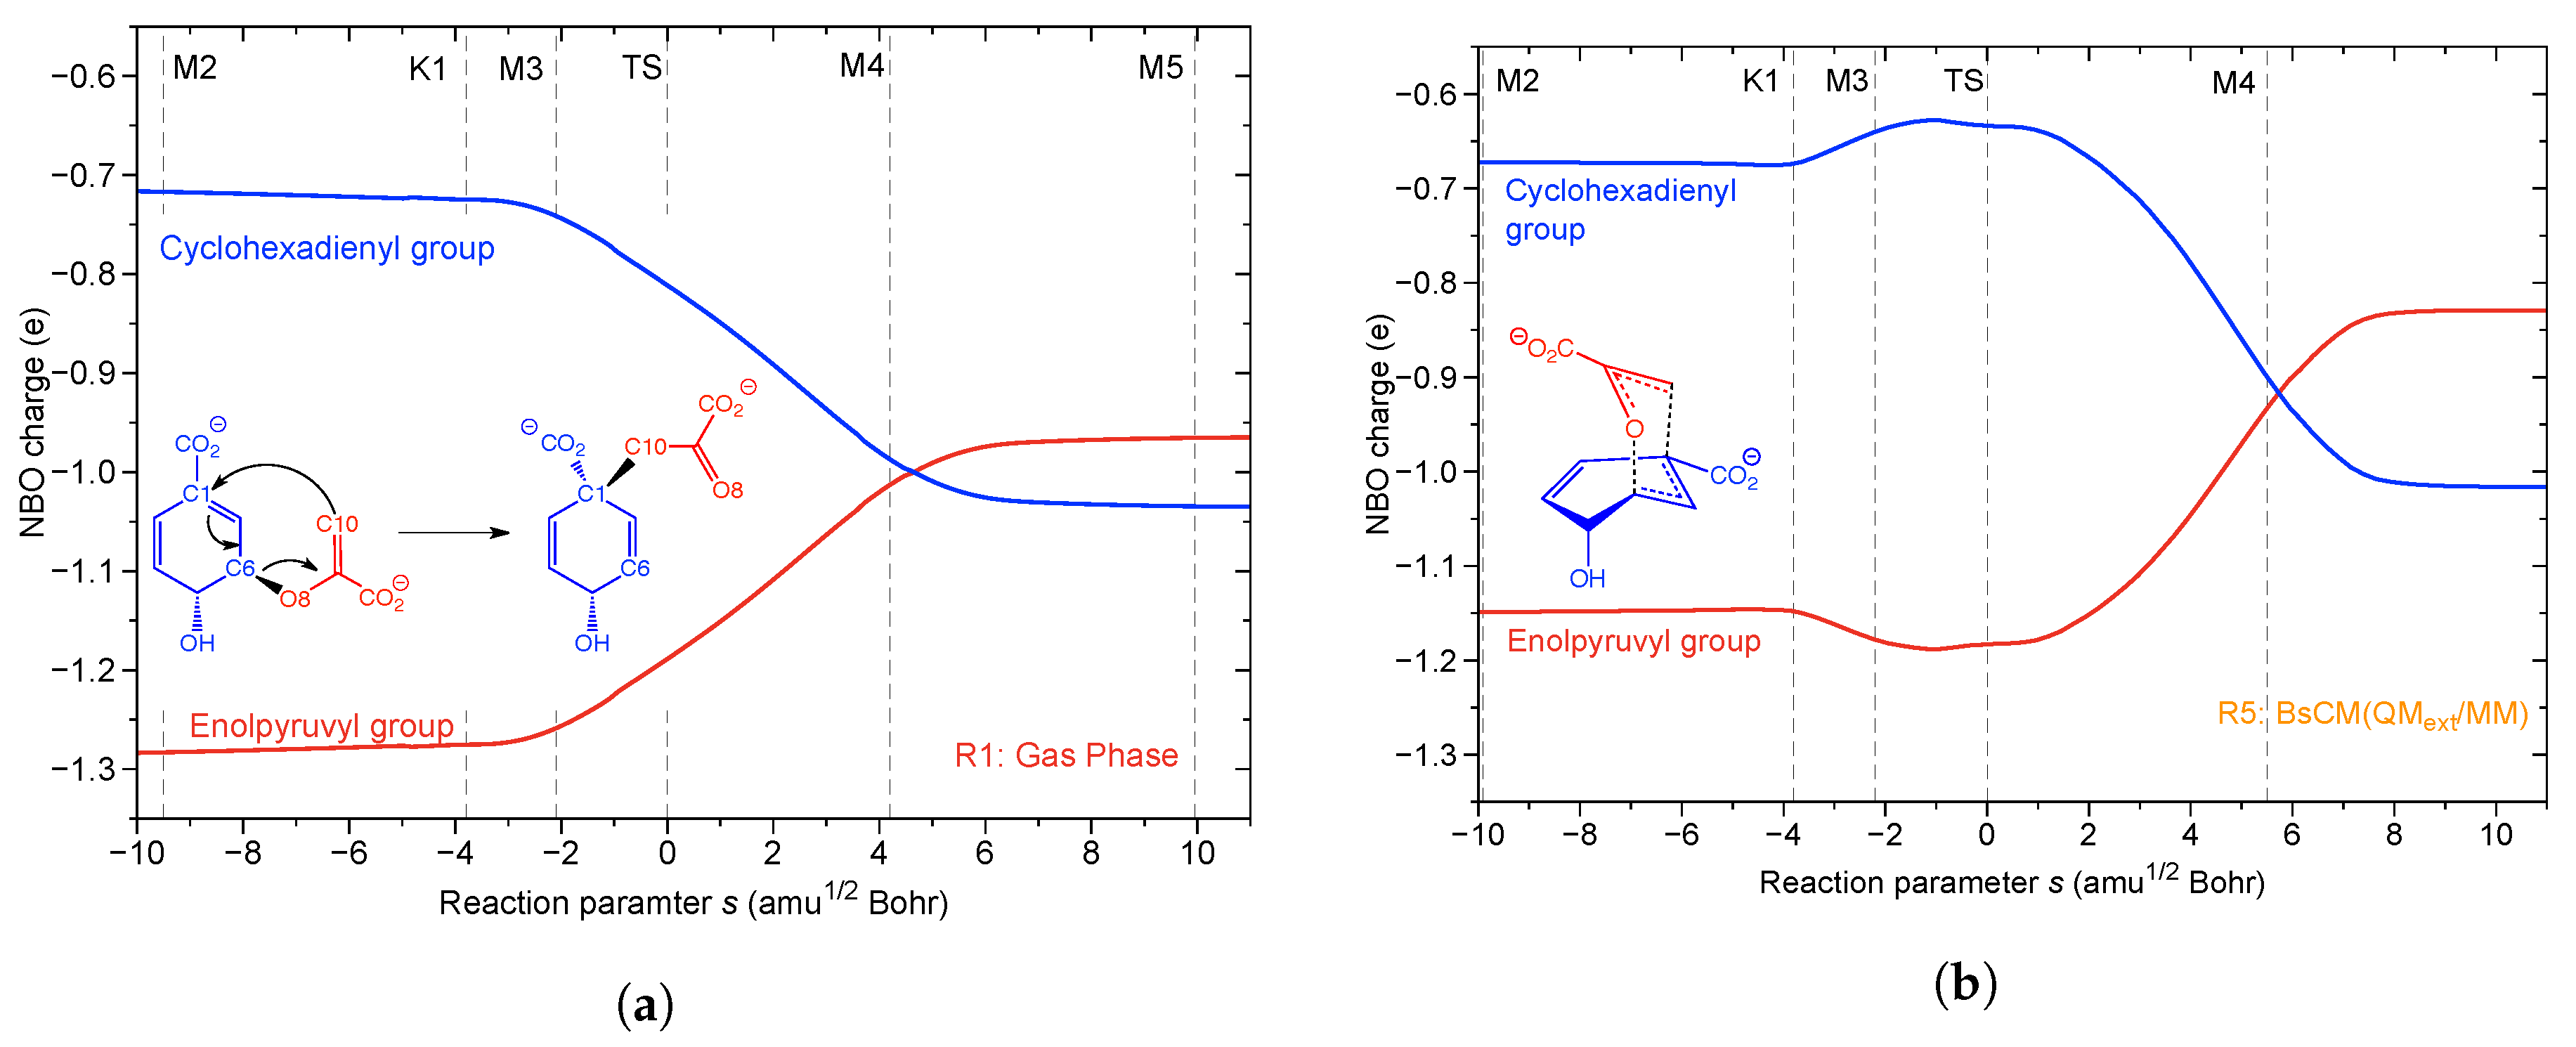
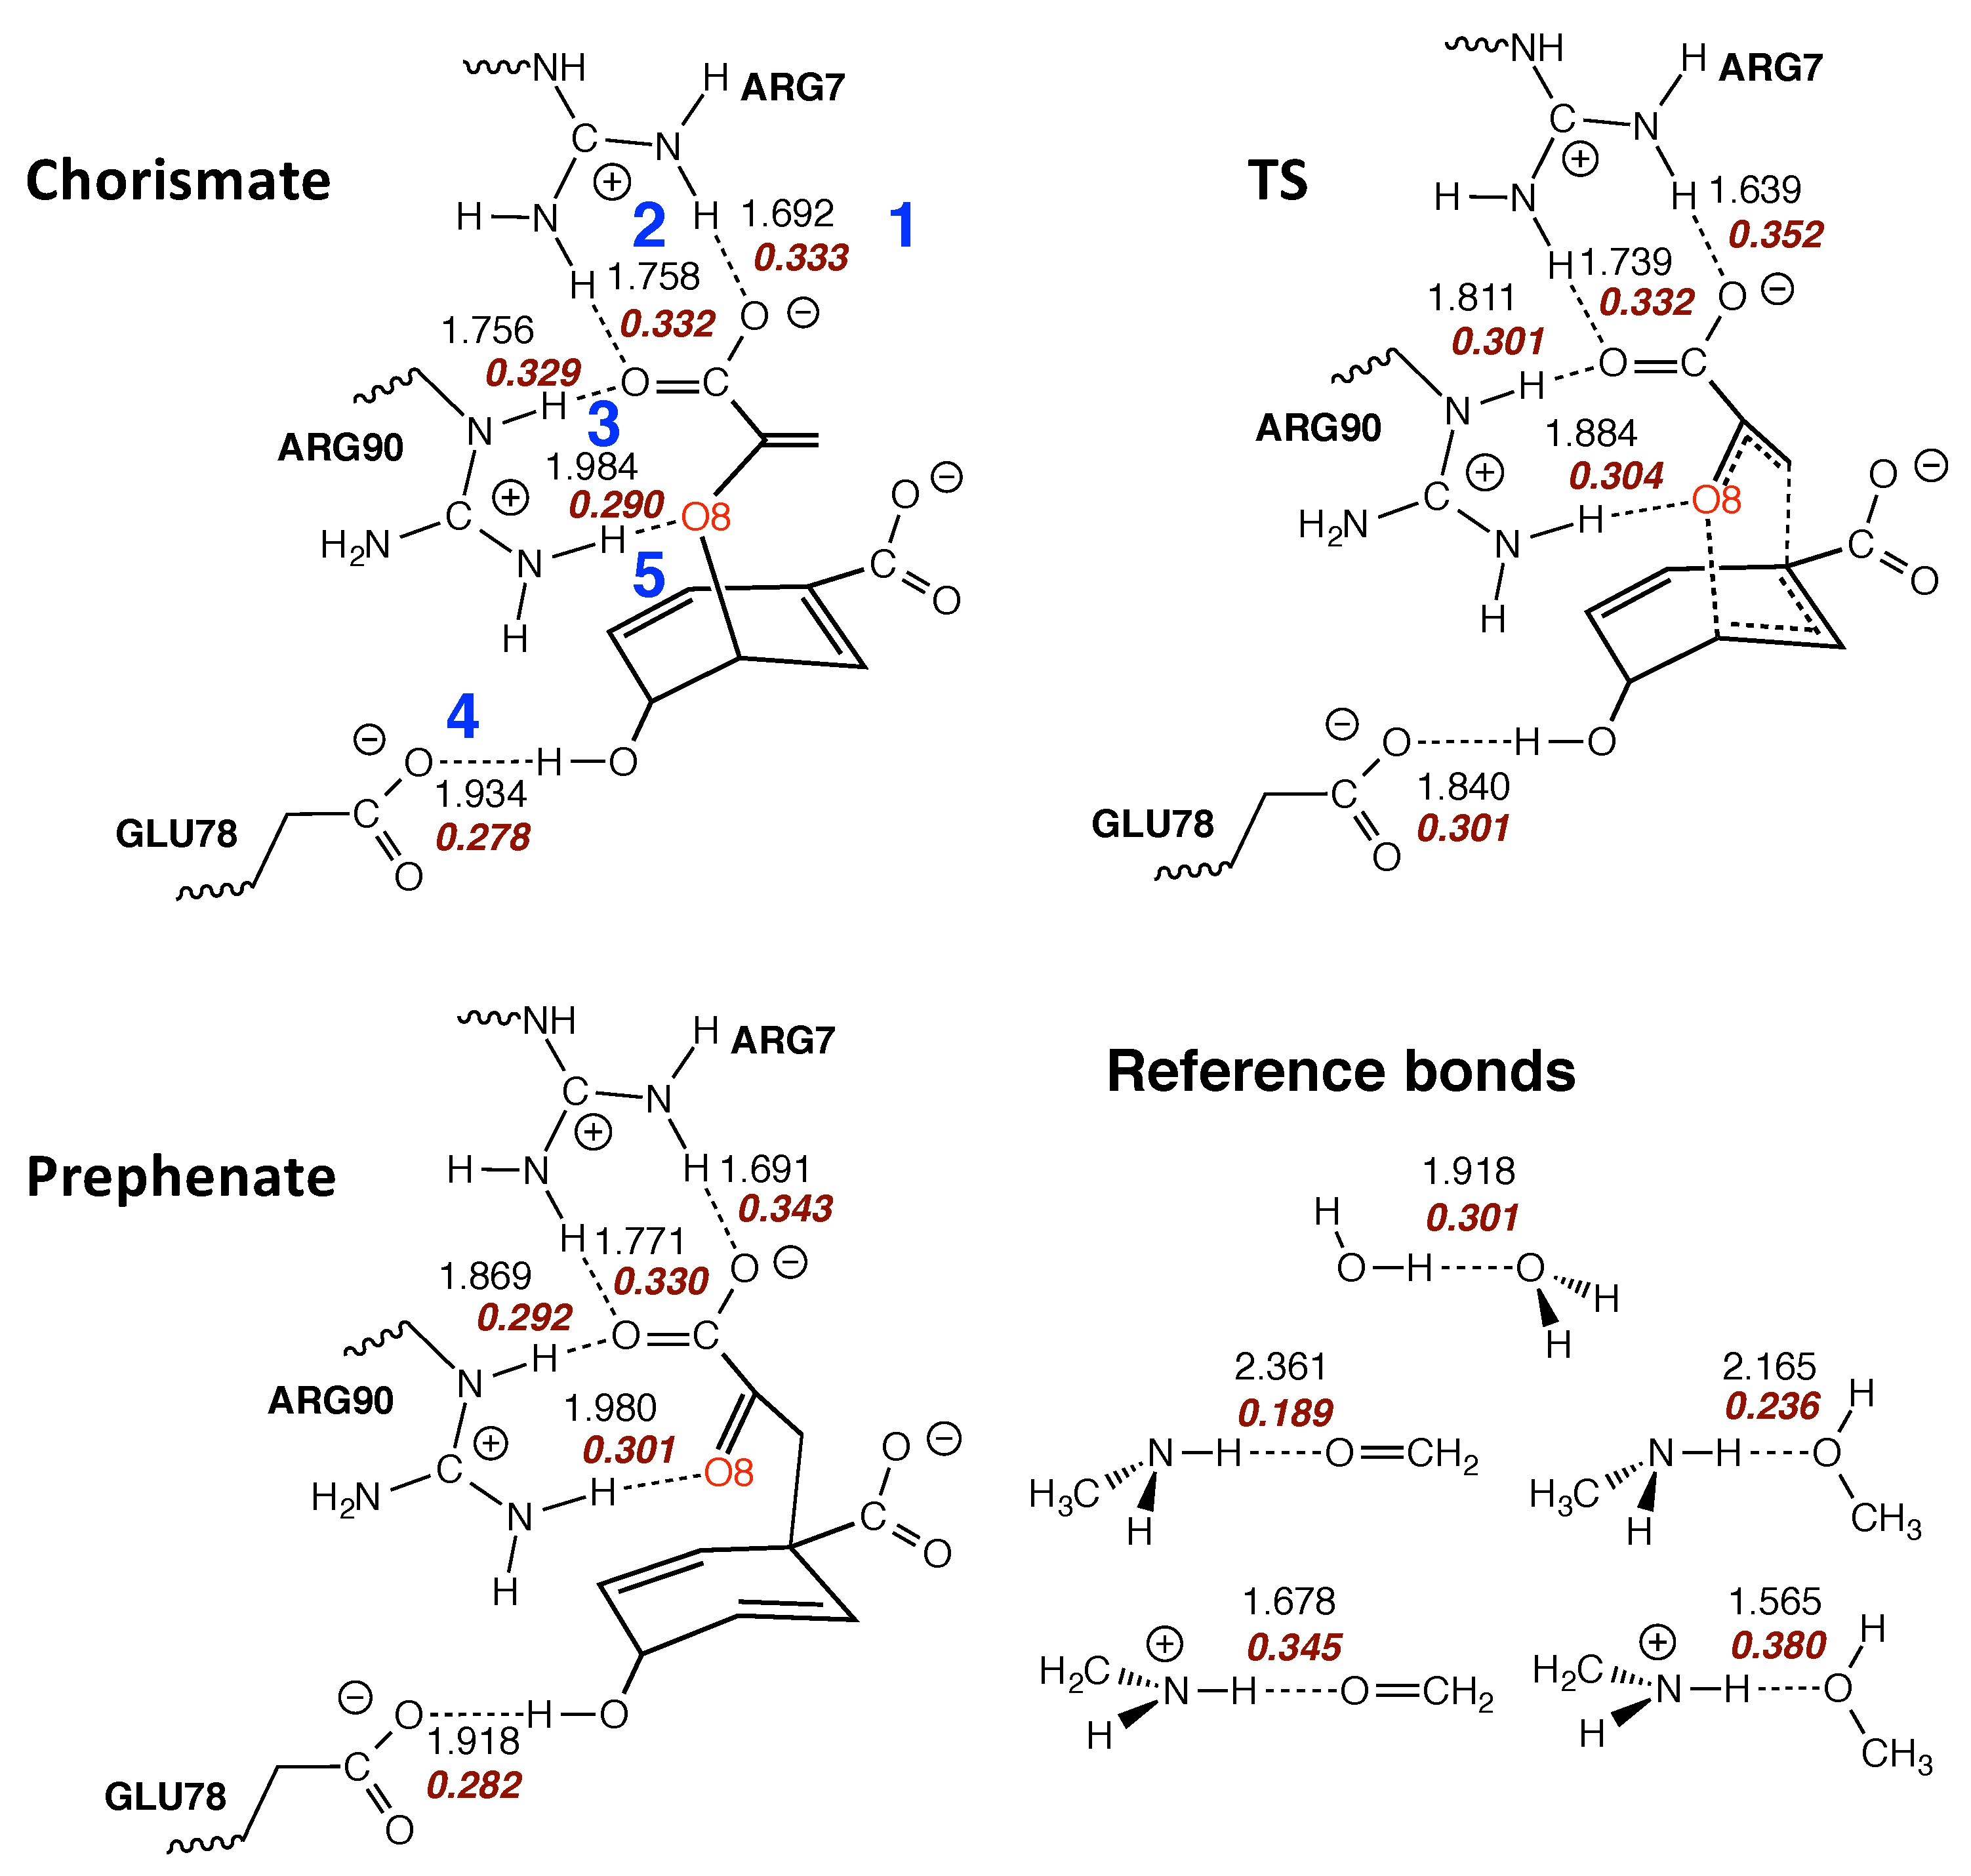
Table 1.
Activation energy , reaction energy , activation enthalpy , and reaction enthalpy for each step of the [Rh(CO)I] catalyzed methanol carbonylation . Energy values denote the energy consumed in phase m up to the TS.
Table 1.
Activation energy , reaction energy , activation enthalpy , and reaction enthalpy for each step of the [Rh(CO)I] catalyzed methanol carbonylation . Energy values denote the energy consumed in phase m up to the TS.
| Reaction Step | ||||||||
|---|---|---|---|---|---|---|---|---|
| 1 | 45.0 | 2.4 | 43.5 | 2.1 | 13.2 | 12.0 | 17.1 | 2.7 |
| 2 | 20.0 | −9.3 | 19.1 | −8.5 | 0.0 | 0.9 | 3.1 | 16.0 |
| 3 | - | −8.0 | - | −7.5 | - | - | - | - |
| 4 | 29.9 | 0.5 | 25.0 | 0.1 | 0.5 | 6.5 | 12.7 | 6.2 |
B3LYP/6-31G(d,p)/SDD level of theory. All values (kcal/mol) are given relative to the first point in the entrance channel of the corresponding reaction step. Downhill reaction without TS. of phase m is the energy difference between the energy of phase m and energy of phase m-1, is an energy difference between energy at the TS and the energy of phase 3 of the corresponding reaction step.
© 2020 by the authors. Licensee MDPI, Basel, Switzerland. This article is an open access article distributed under the terms and conditions of the Creative Commons Attribution (CC BY) license (http://creativecommons.org/licenses/by/4.0/).
Share and Cite
MDPI and ACS Style
Kraka, E.; Zou, W.; Tao, Y.; Freindorf, M. Exploring the Mechanism of Catalysis with the Unified Reaction Valley Approach (URVA)—A Review. Catalysts 2020, 10, 691. https://0-doi-org.brum.beds.ac.uk/10.3390/catal10060691
AMA Style
Kraka E, Zou W, Tao Y, Freindorf M. Exploring the Mechanism of Catalysis with the Unified Reaction Valley Approach (URVA)—A Review. Catalysts. 2020; 10(6):691. https://0-doi-org.brum.beds.ac.uk/10.3390/catal10060691
Chicago/Turabian StyleKraka, Elfi, Wenli Zou, Yunwen Tao, and Marek Freindorf. 2020. "Exploring the Mechanism of Catalysis with the Unified Reaction Valley Approach (URVA)—A Review" Catalysts 10, no. 6: 691. https://0-doi-org.brum.beds.ac.uk/10.3390/catal10060691
Note that from the first issue of 2016, this journal uses article numbers instead of page numbers. See further details here.