Synthesis and Characterization of Zinc Peroxide Nanoparticles for the Photodegradation of Nitrobenzene Assisted by UV-Light

 , ,
, ,
Abstract
:
1. Introduction
2. Results and Discussion
2.1. Synthesis of ZnO2 Nanoparticles
2.2. Characterization of ZnO2 Nanoparticles
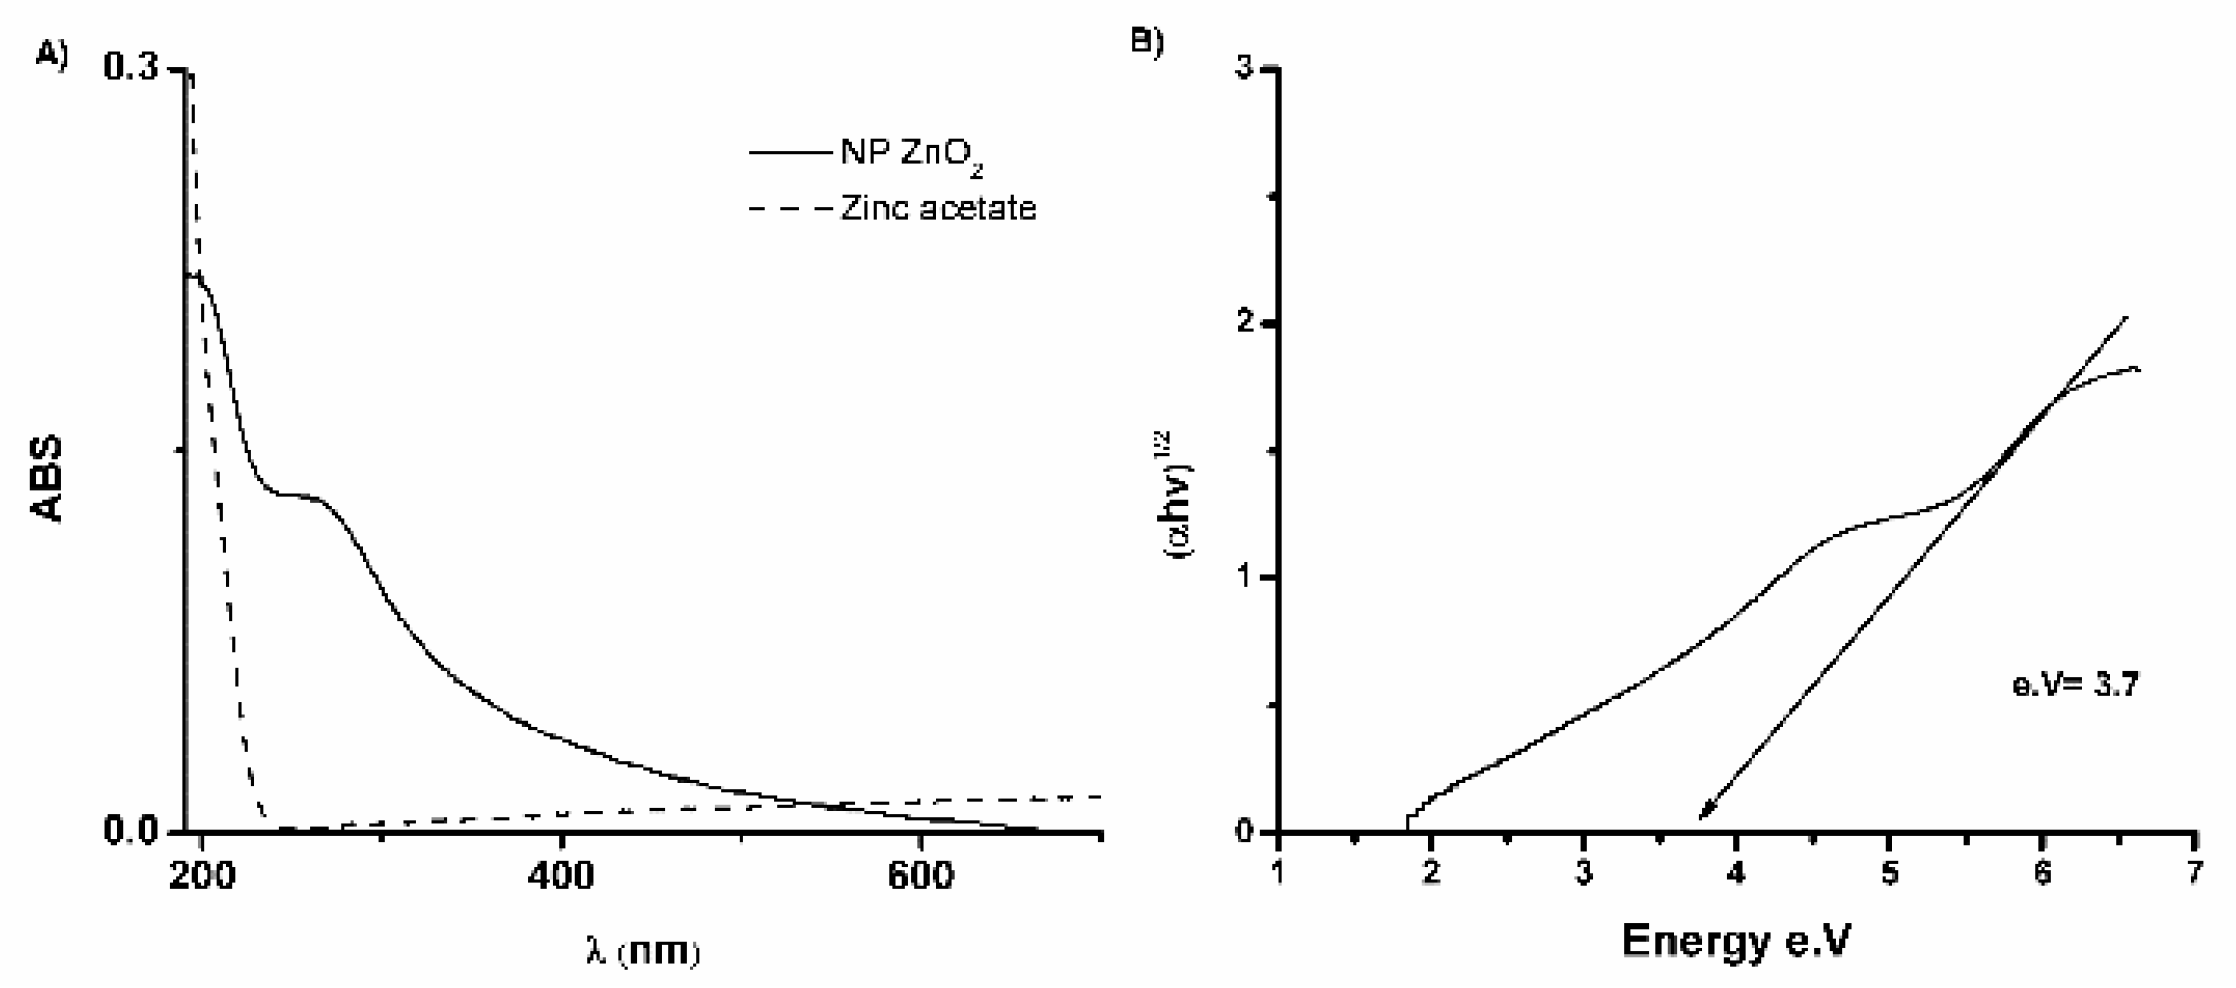
2.2.1. UV-Vis Spectroscopy
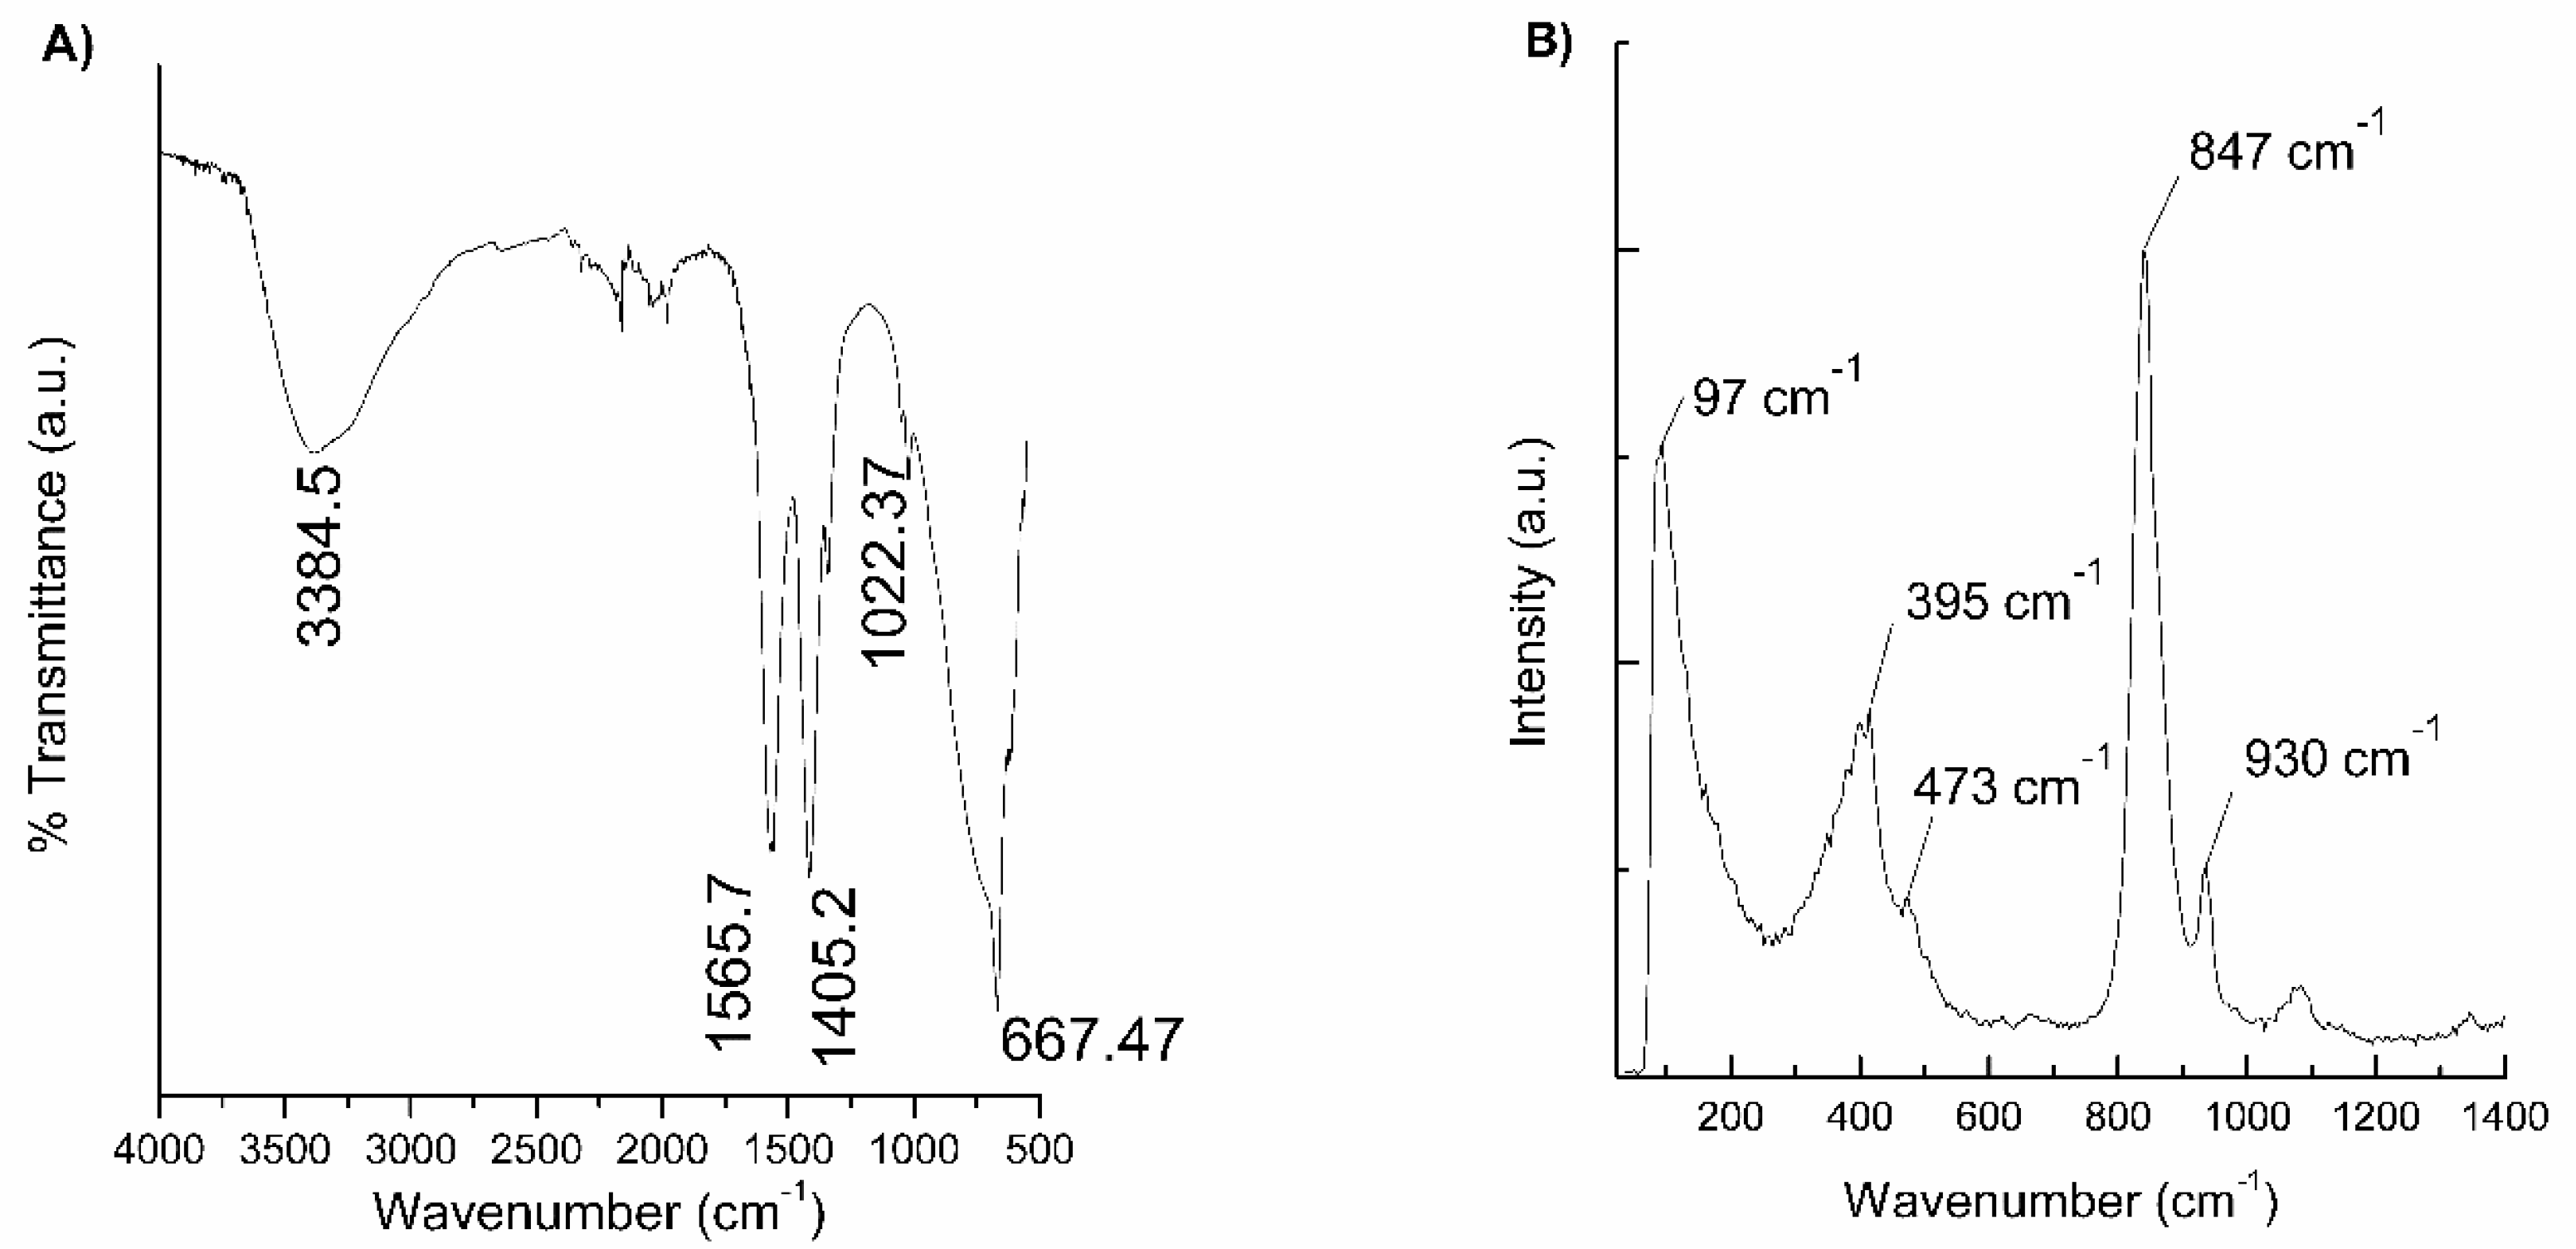
2.2.2. Infrared Fourier Transform (FT-IR)
2.2.3. Raman Spectroscopy
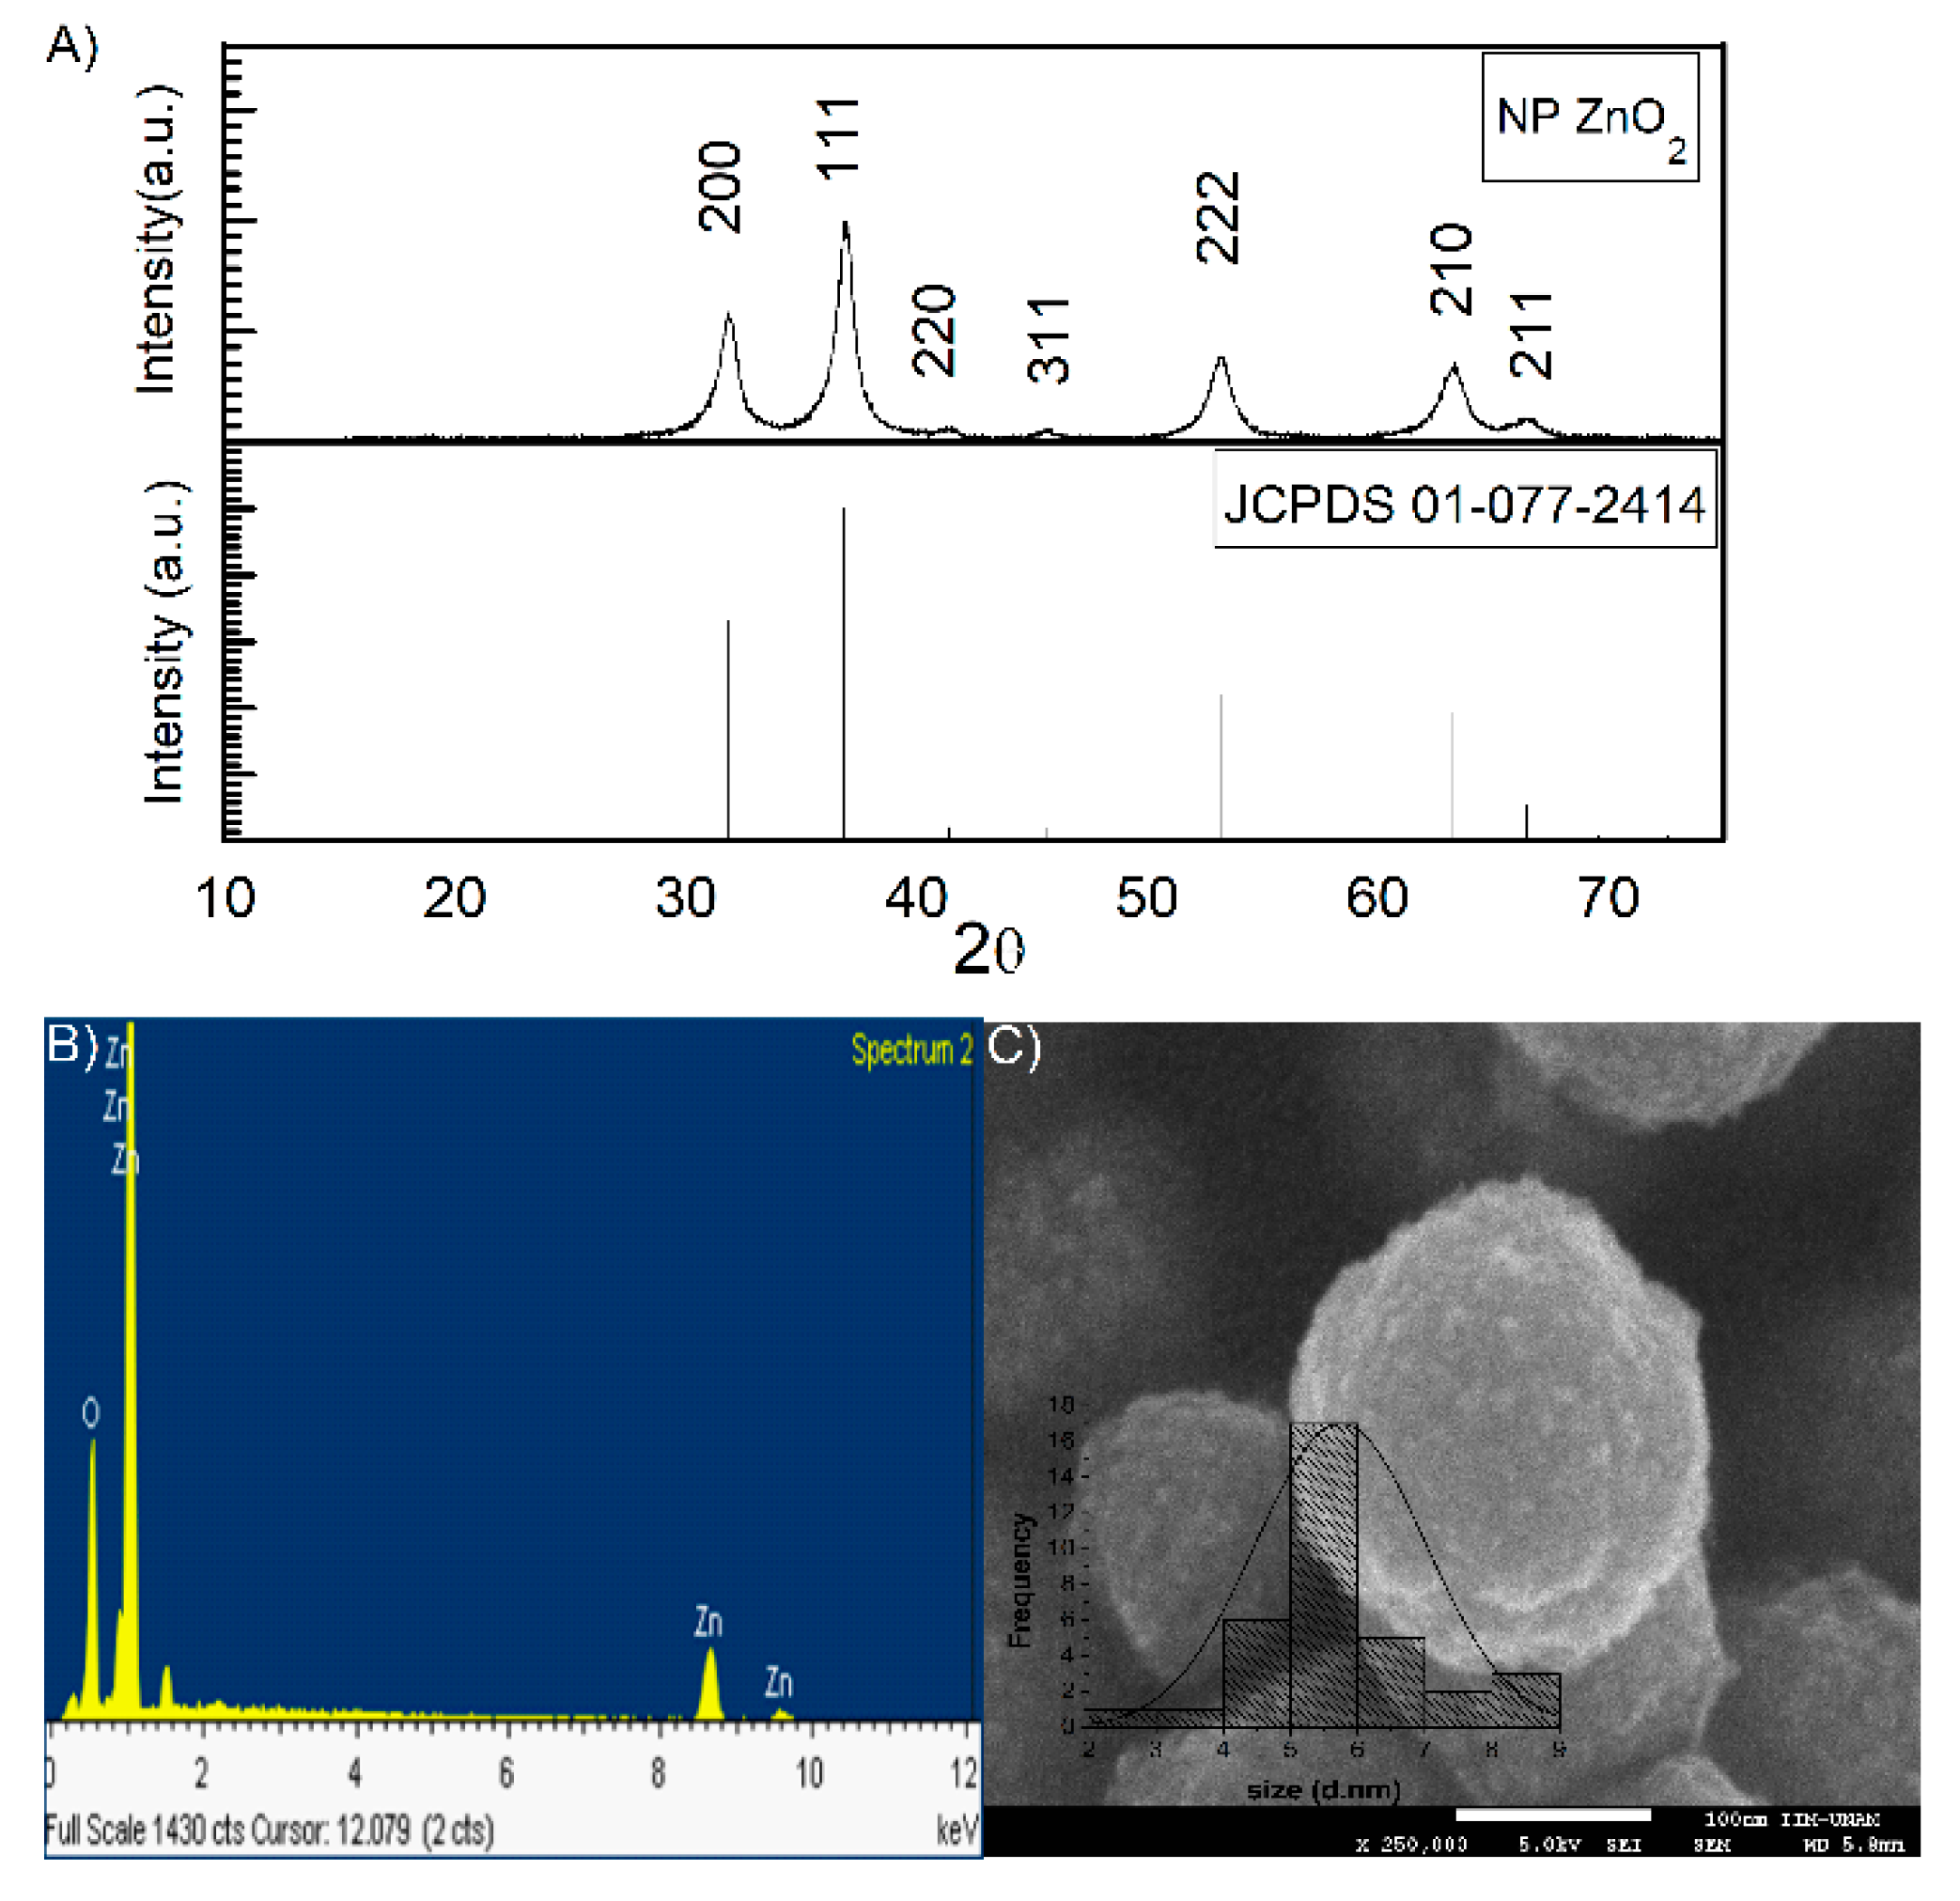
2.2.4. X-ray Diffraction
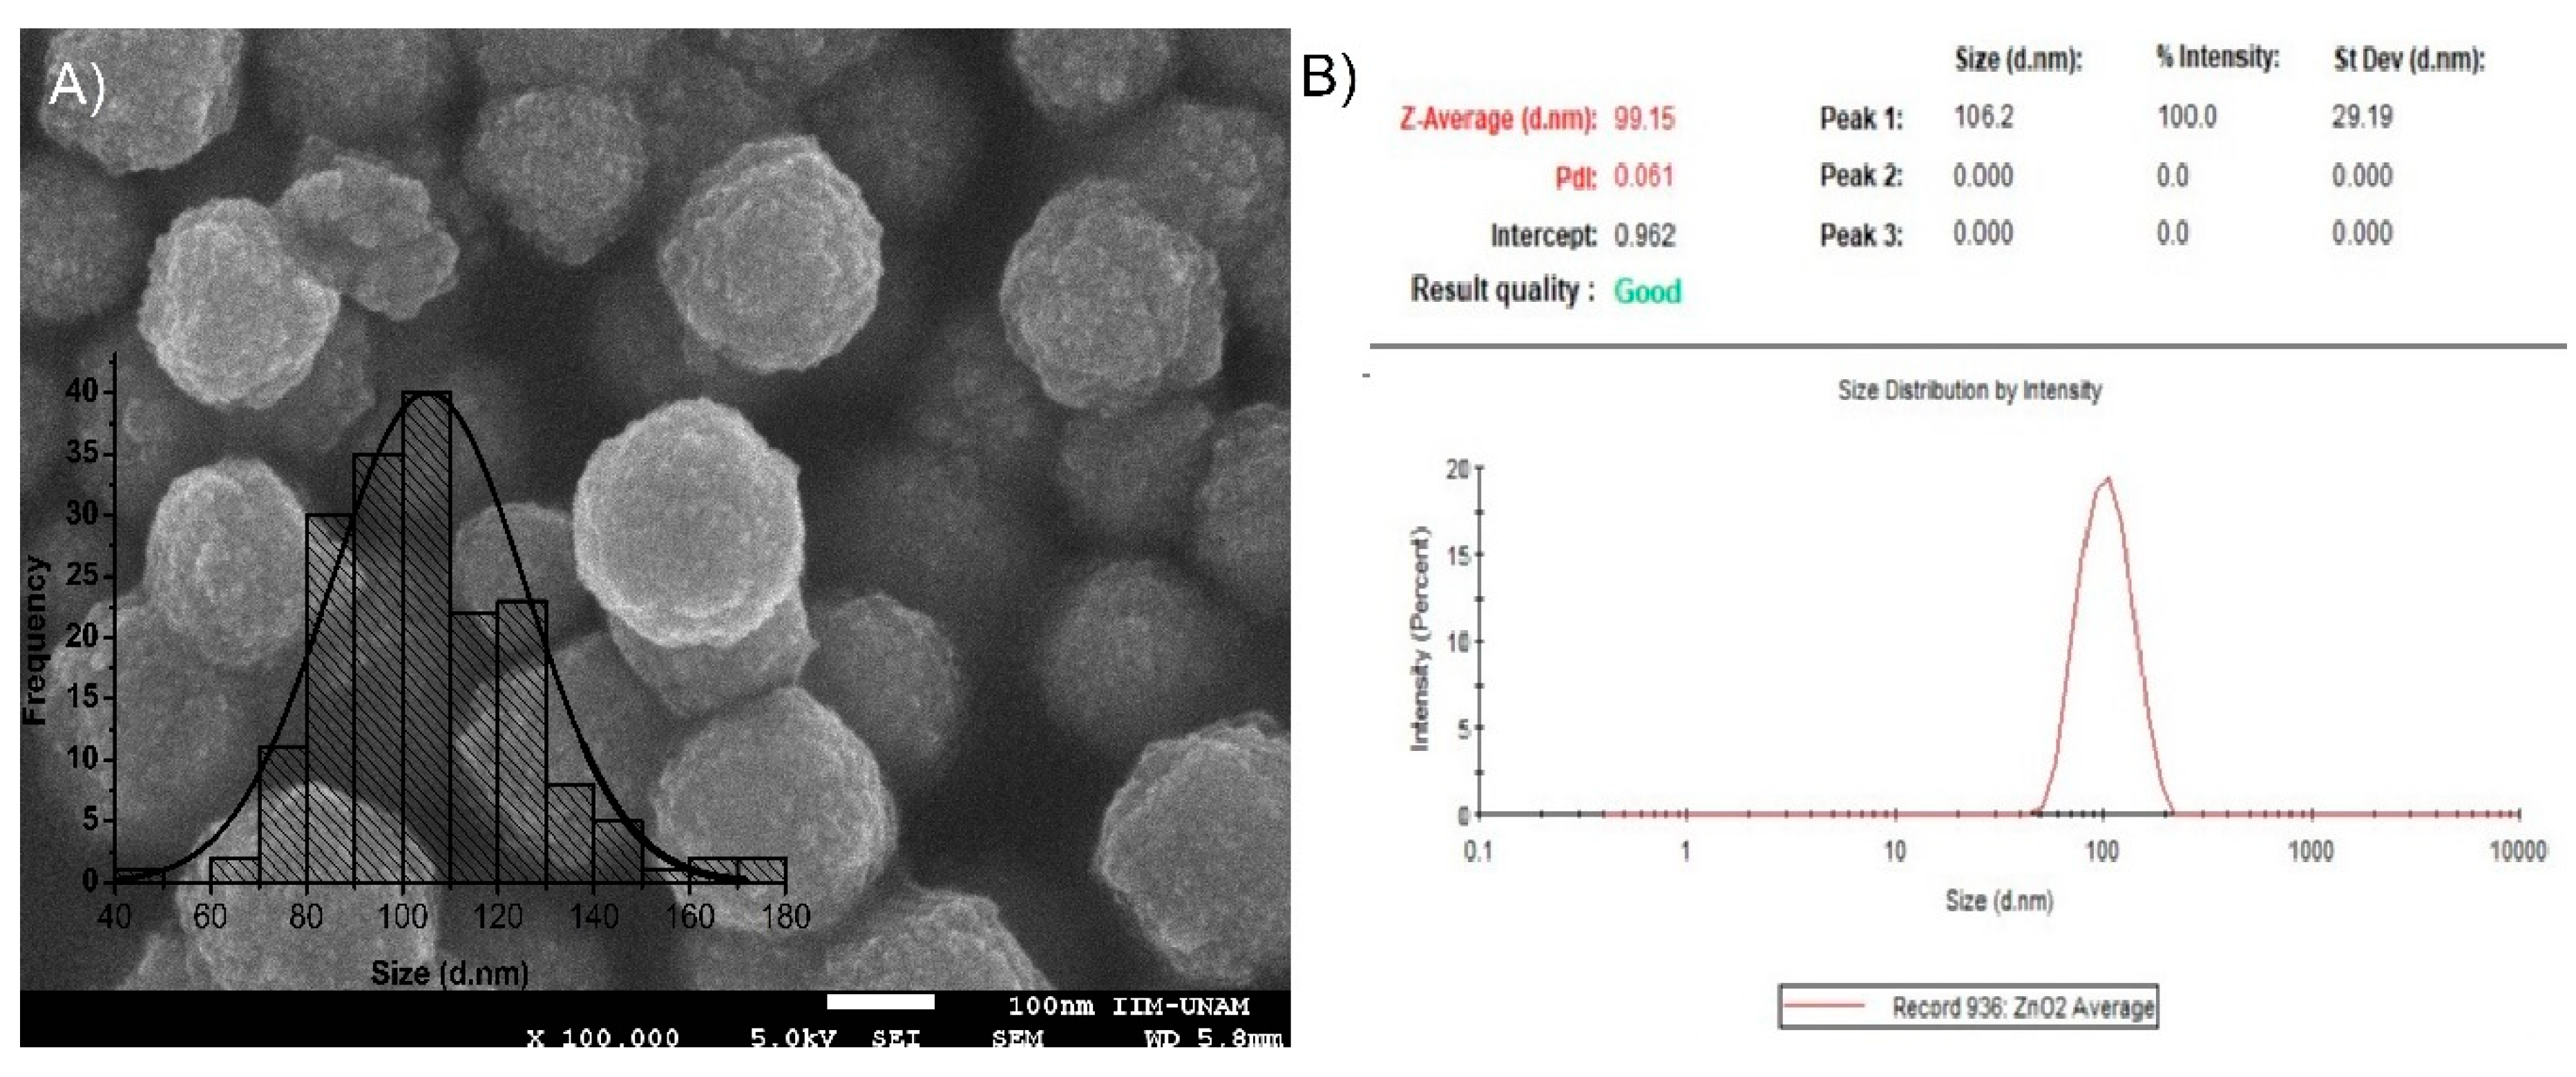
2.2.5. Scanning Electronic Microscope (SEM) and Dynamic Light Scattering (DLS)
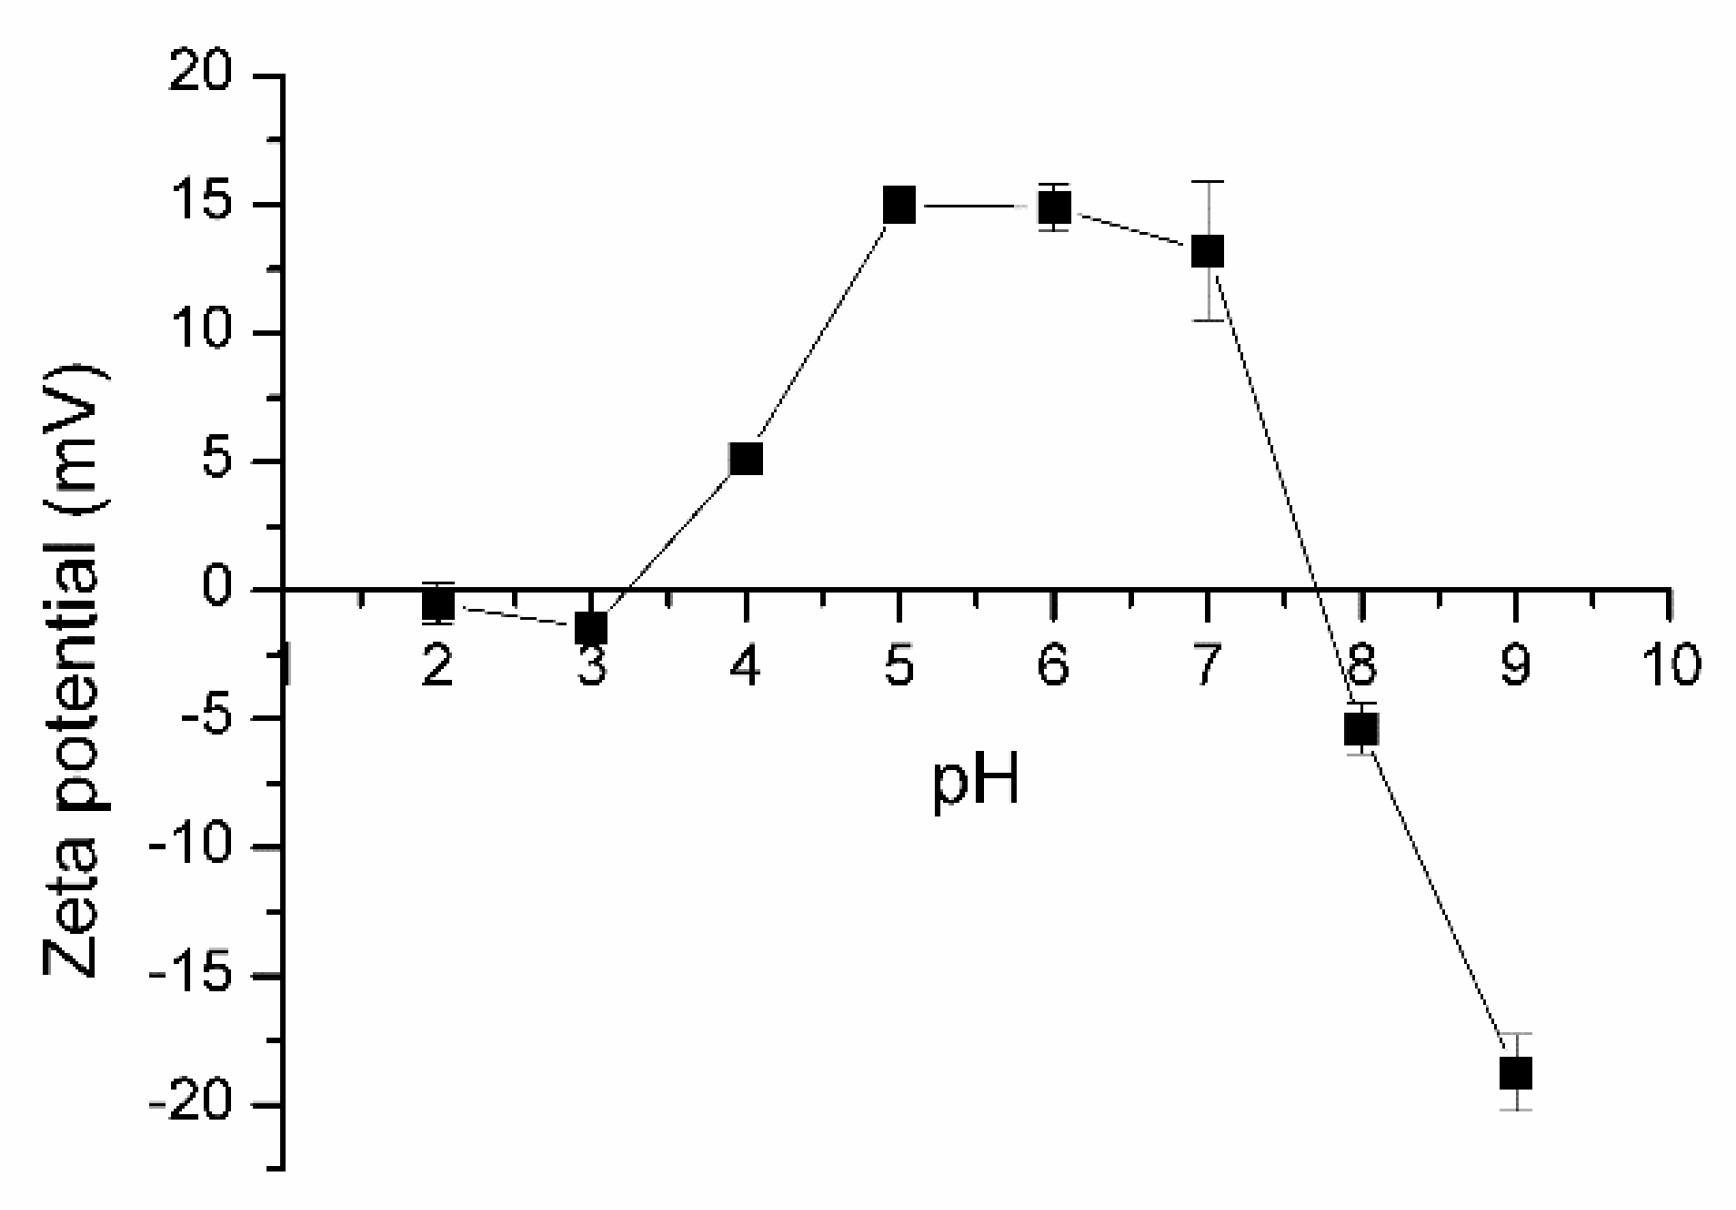
2.2.6. Zeta Potential
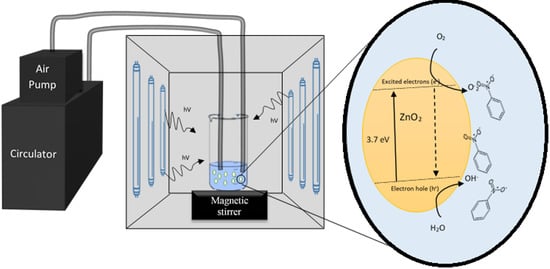
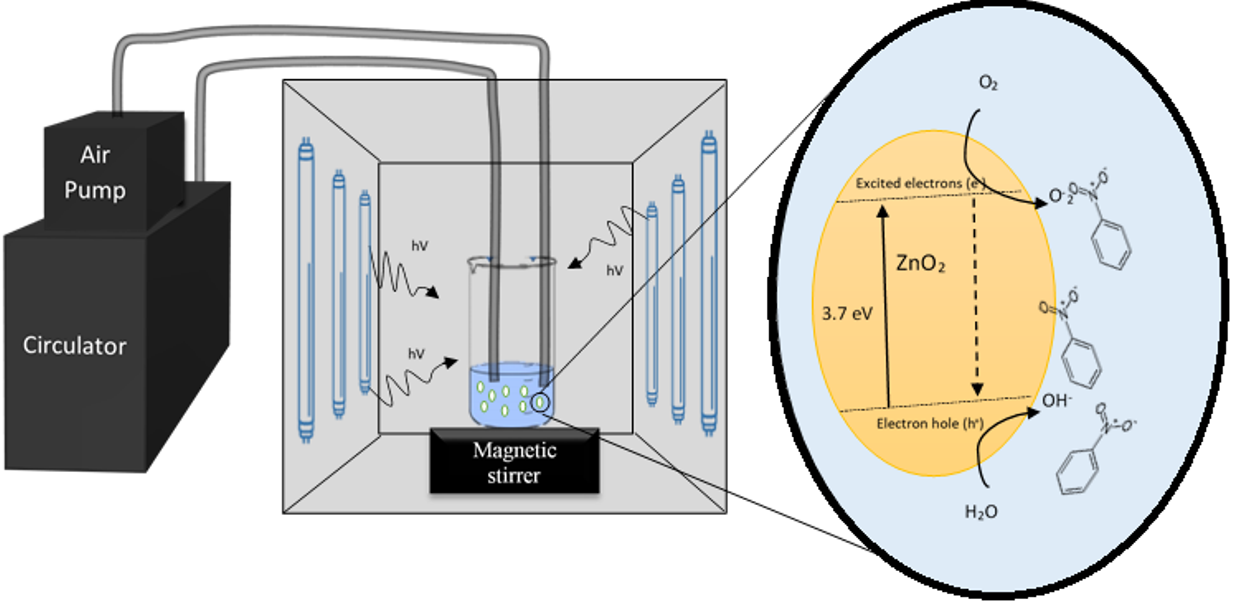
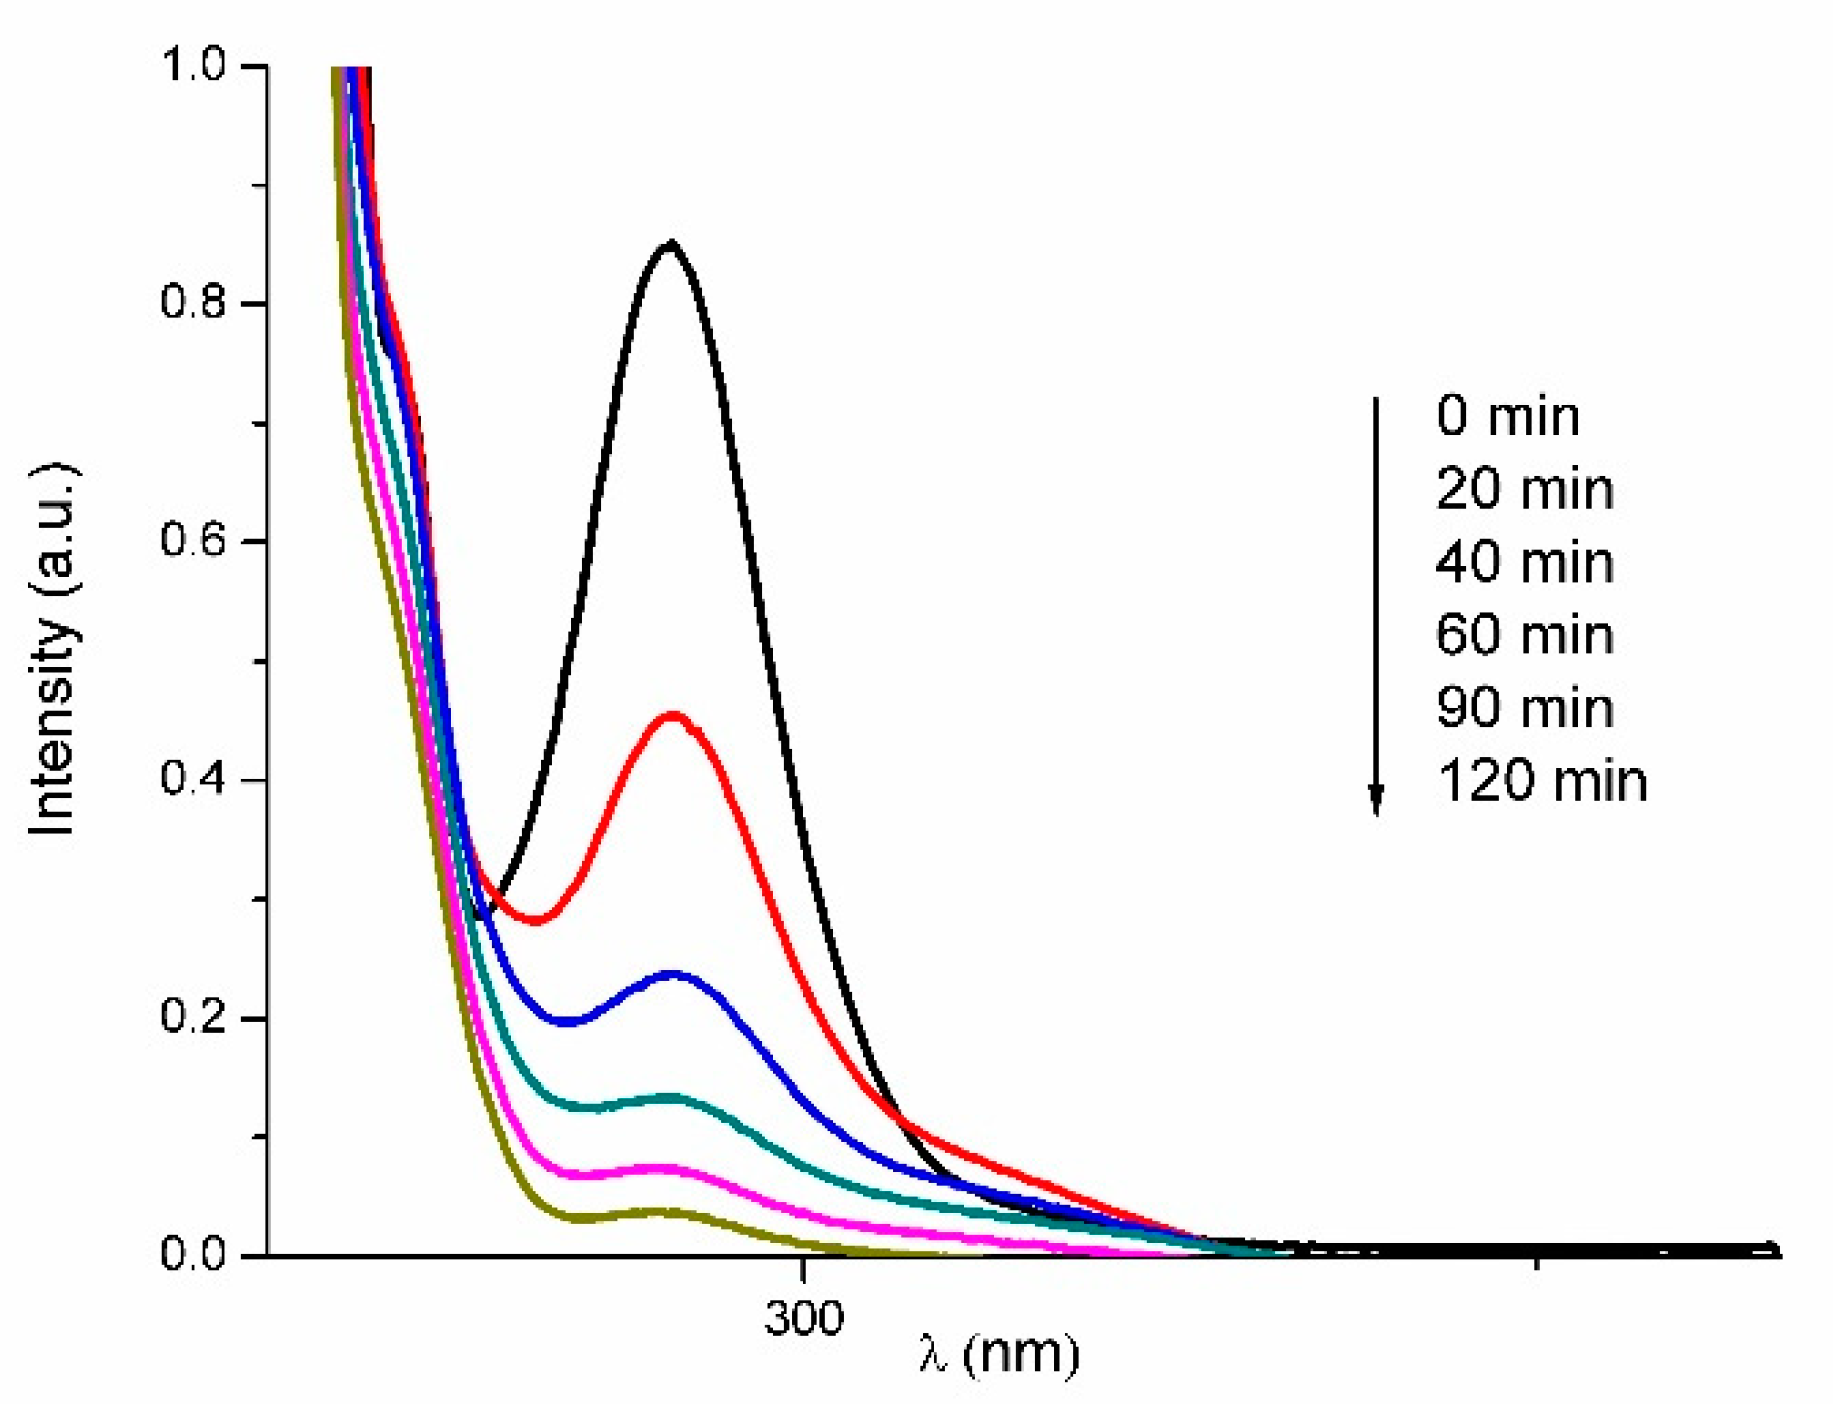
2.3. Photocatalytic Degradation of Nitrobenzene
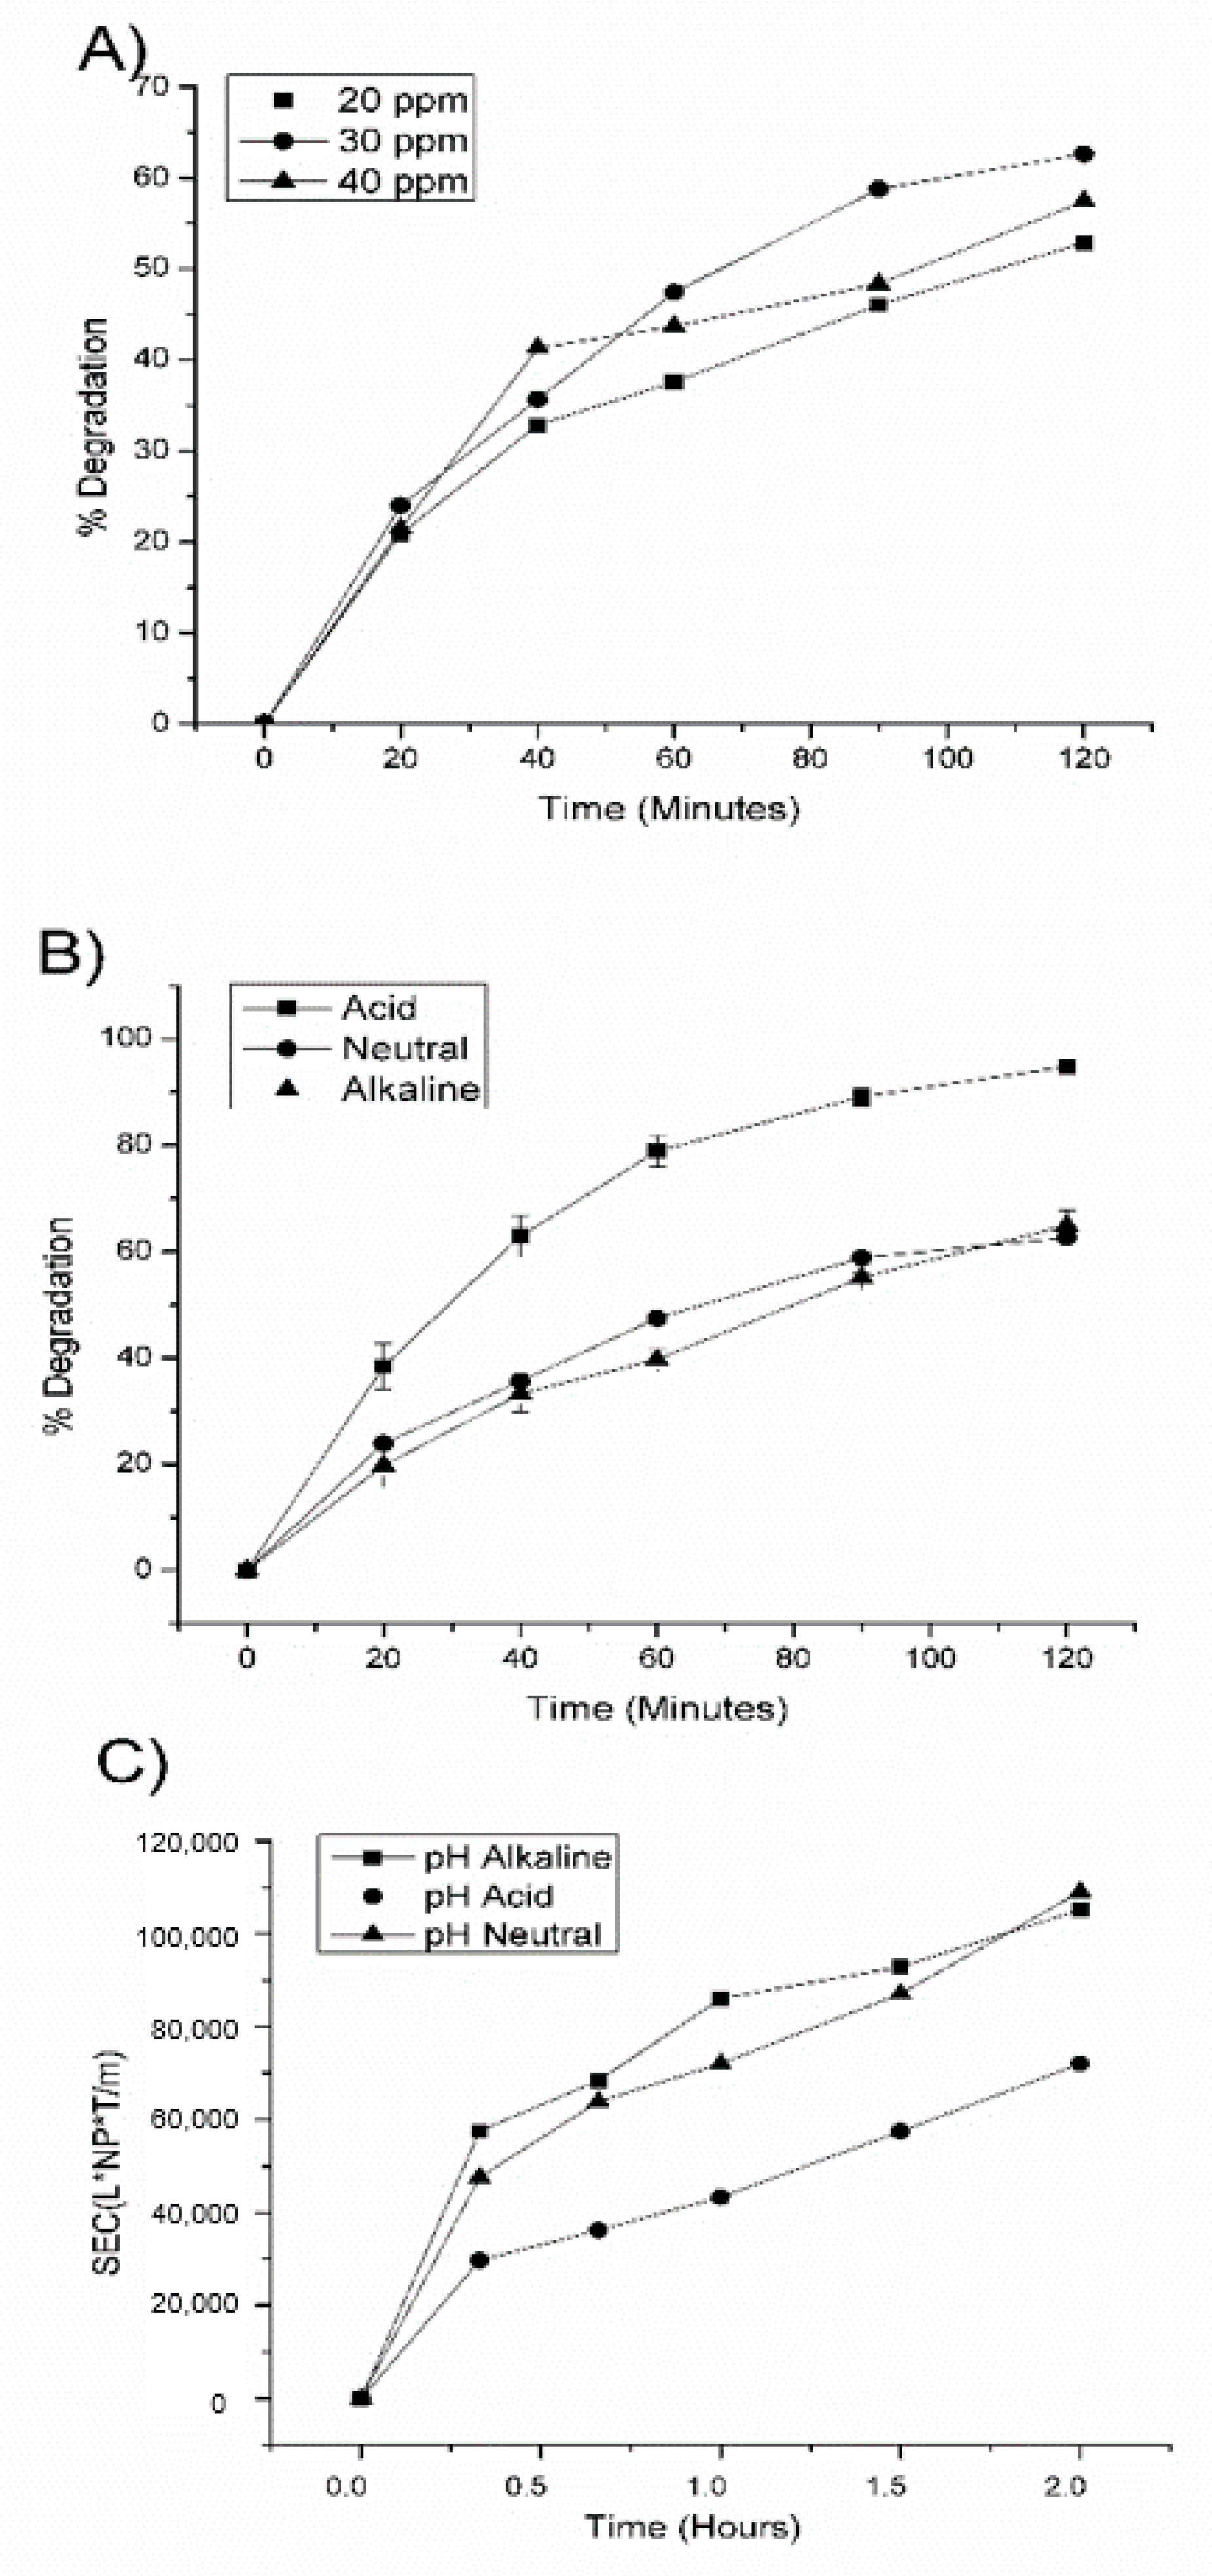
2.3.1. Effect of Photocatalyst Concentration
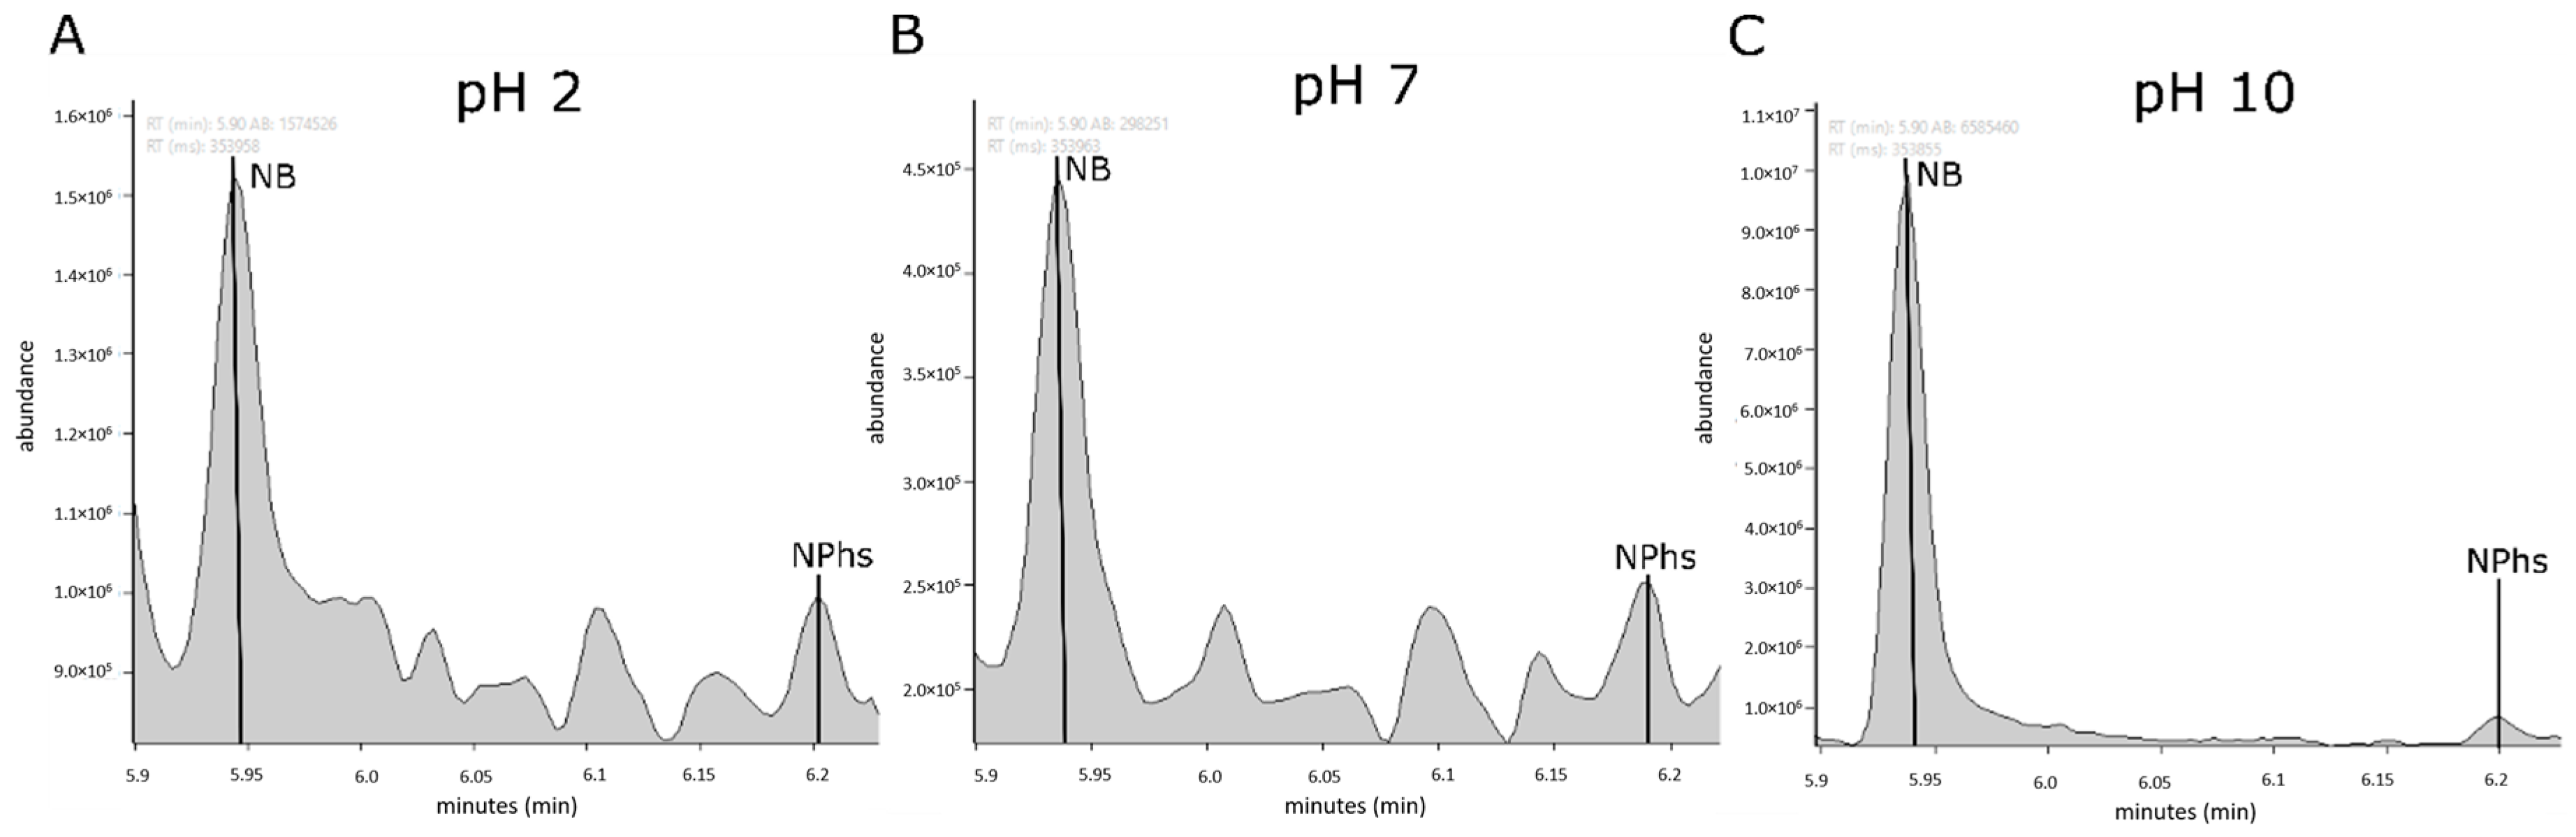
2.3.2. Effect of pH
3. Materials and Methods
3.1. Synthesis of ZnO2 Nanoparticles
3.2. Characterization of ZnO2 Nanoparticles
3.2.1. UV-VIS Spectroscopy
3.2.2. FT-IR Analysis
3.2.3. Raman Analysis
3.2.4. X-ray Diffraction (XRD)
3.2.5. Scanning Electronic Microscope (SEM)
3.2.6. DLS Analysis and Zeta Potential
3.3. Photocatalytic Degradation of Nitrobenzene
4. Conclusions
Author Contributions
Funding
Acknowledgments
Conflicts of Interest
References
- Beauchamp, R.O.; Irons, R.D.; Rickert, D.E.; Couch, D.B.; Hamm, T.E.; Lyon, J.P. A critical review of the literature on nitrobenzene toxicity. Crit. Rev. Toxicol. 1982, 11, 33–84. [Google Scholar] [CrossRef]
- Katritzky, A.R.; Oliferenko, P.; Oliferenko, A.; Lomaka, A.; Karelson, M. Nitrobenzene toxicity: QSAR correlations and mechanistic interpretations. J. Phys. Org. Chem. 2003, 16, 811–817. [Google Scholar] [CrossRef]
- Harrison, M.R. Toxic methaemoglobinaemia. Anaesthesia 1977, 32, 270–272. [Google Scholar] [CrossRef] [PubMed]
- Mu, Y.; Yu, H.Q.; Zheng, J.C.; Zhang, S.J.; Sheng, G.P. Reductive degradation of nitrobenzene in aqueous solution by zero-valent iron. Chemosphere 2004, 54, 789–794. [Google Scholar] [CrossRef] [PubMed]
- Wang, C.; Feng, Y.; Zhao, S.; Li, B.L. A dynamic contaminant fate model of organic compound: A case study of Nitrobenzene pollution in Songhua River, China. Chemosphere 2012, 88, 69–76. [Google Scholar] [CrossRef] [PubMed]
- Cai, Z.; Fu, J.; Du, P.; Zhao, X.; Hao, X.; Liu, W.; Zhao, D. Reduction of nitrobenzene in aqueous and soil phases using carboxymethyl cellulose stabilized zero-valent iron nanoparticles. Chem. Eng. J. 2018, 332, 227–236. [Google Scholar] [CrossRef]
- Elnashaie, S.S.E.; Danafar, F.; Abashar, M.E.E. Maximum Production Minimum Pollution (MPMP), Necessary but not Sufficient for Sustainability. Eur. J. Sustain. Dev. Res. 2018, 2, 41. [Google Scholar] [CrossRef] [Green Version]
- Zhao, L.; Lu, Z.; Tan, S.; Ciren, J.; Tan, C. Effects of glucose and starch on the toxicity of nitrobenzene to plants and microbes in constructed wetlands. Sci. Total Environ. 2019, 658, 809–817. [Google Scholar] [CrossRef]
- Liu, L.-L.; Chen, J.; Yu, C.-X.; Lv, W.-X.; Yu, H.-Y.; Cui, X.-Q.; Liu, L. A novel Ag (I)-calix[4]arene coordination polymer for the sensitive detection and efficient photodegradation of nitrobenzene in aqueous solution. Dalt. Trans. 2017, 46, 178–185. [Google Scholar] [CrossRef]
- Tayade, R.J.; Kulkarni, R.G.; Jasra, R.V. Photocatalytic degradation of aqueous nitrobenzene by nanocrystalline TiO2. Ind. Eng. Chem. Res. 2006, 45, 922–927. [Google Scholar] [CrossRef]
- Cao, L.; Zhang, C.; Zou, S.; Zhu, G.; Li, N.; Zhang, Y.; Rittmann, B.E. Simultaneous anaerobic and aerobic transformations of nitrobenzene. J. Environ. Manag. 2018, 226, 264–269. [Google Scholar] [CrossRef] [PubMed]
- Li, Y.P.; Cao, H.B.; Liu, C.M.; Zhang, Y. Electrochemical reduction of nitrobenzene at carbon nanotube electrode. J. Hazard. Mater. 2007, 148, 158–163. [Google Scholar] [CrossRef] [PubMed]
- Chong, H.; Li, P.; Xiang, J.; Fu, F.; Zhang, D.; Ran, X.; Zhu, M. Design of an ultrasmall Au nanocluster-CeO2 mesoporous nanocomposite catalyst for nitrobenzene reduction. Nanoscale 2013, 5, 7622–7628. [Google Scholar] [CrossRef] [PubMed]
- Caprio, V.; Insola, A.; Volpiceli, G. Ozonation of Aqueous Solutions of Nitrobenzene. Ozone Sci. Eng. 2008, 6, 115–121. [Google Scholar] [CrossRef]
- Nishino, S.F.; Spain, J.C. Oxidative pathway for the biodegradation of nitrobenzene by Comamonas sp. strain JS765. Appl. Environ. Microbiol. 1995, 61, 2308–2313. [Google Scholar] [CrossRef] [Green Version]
- Wang, D.; Shan, H.; Sun, X.; Zhang, H.; Wu, Y. Removal of nitrobenzene from aqueous solution by adsorption onto carbonized sugarcane bagasse. Adsorpt. Sci. Technol. 2018, 36, 1366–1385. [Google Scholar] [CrossRef]
- Priya, M.H.; Madras, G. Photocatalytic degradation of nitrobenzenes with combustion synthesized nano-TiO2. J. Photochem. Photobiol. A Chem. 2006, 178, 1–7. [Google Scholar] [CrossRef]
- Bhatkhande, D.S.; Pangarkar, V.G.; Beenackers, A.A.C.M. Photocatalytic degradation for environmental applications—A review. J. Chem. Technol. Biotechnol. 2002, 77, 102–116. [Google Scholar] [CrossRef]
- Wolanov, Y.; Prikhodchenko, P.V.; Medvedev, A.G.; Pedahzur, R.; Lev, O. Zinc Dioxide Nanoparticulates: A Hydrogen Peroxide Source at Moderate pH. Environ. Sci. Technol. 2013, 47, 8769–8774. [Google Scholar] [CrossRef]
- Rodríguez, M.; Kirchner, A.; Contreras, S.; Chamarro, E.; Esplugas, S. Influence of H2O2 and Fe(III) in the photodegradation of nitrobenzene. J. Photochem. Photobiol. A Chem. 2000, 133, 123–127. [Google Scholar] [CrossRef]
- Contreras, S.; Rodríguez, M.; Chamarro, E.; Esplugas, S.; Casado, J. Oxidation of nitrobenzene by O3/UV: The influence of H2O2 and Fe(III). Experiences in a pilot plant. Water Sci. Technol. 2001, 44, 39–46. [Google Scholar] [CrossRef] [PubMed]
- Lee, K.M.; Lai, C.W.; Ngai, K.S.; Juan, J.C. Recent developments of zinc oxide based photocatalyst in water treatment technology: A review. Water Res. 2016, 88, 428–448. [Google Scholar] [CrossRef] [PubMed]
- Rej, S.; Mascaretti, L.; Santiago, E.Y.; Tomanec, O.; Kment, Š.; Wang, Z.; Zbořil, R.; Fornasiero, P.; Govorov, A.O.; Naldoni, A. Determining Plasmonic Hot Electrons and Photothermal Effects during H2 Evolution with TiN-Pt Nanohybrids. ACS Catal. 2020, 10, 5261–5271. [Google Scholar] [CrossRef]
- Crişan, M.; Mardare, D.; Ianculescu, A.; Drăgan, N.; Niţoi, I.; Crişan, D.; Voicescu, M.; Todan, L.; Oancea, P.; Adomniţei, C.; et al. Iron doped TiO2 films and their photoactivity in nitrobenzene removal from water. Appl. Surf. Sci. 2018, 455, 201–215. [Google Scholar] [CrossRef]
- Cropek, D.; Kemme, P.A.; Makarova, O.V.; Chen, L.X.; Rajh, T. Selective photocatalytic decomposition of nitrobenzene using surface modified TiO2 nanoparticles. J. Phys. Chem. C 2008, 112, 8311–8318. [Google Scholar] [CrossRef]
- Ayati, A.; Tanhaei, B.; Bamoharram, F.F.; Ahmadpour, A.; Maydannik, P.; Sillanpää, M. Photocatalytic degradation of nitrobenzene by gold nanoparticles decorated polyoxometalate immobilized TiO2 nanotubes. Sep. Purif. Technol. 2016, 171, 62–68. [Google Scholar] [CrossRef]
- Chen, W.; Lu, Y.H.; Wang, M.; Kroner, L.; Paul, H.; Fecht, H.-J.; Bednarcik, J.; Stahl, K.; Zhang, Z.L.; Wiedwald, U.; et al. Synthesis, Thermal Stability and Properties of ZnO2 Nanoparticles. J. Phys. Chem. C. 2009, 113, 1320–1324. [Google Scholar] [CrossRef] [Green Version]
- Verma, S.; Jain, S.L. Nanosized zinc peroxide (ZnO2): A novel inorganic oxidant for the oxidation of aromatic alcohols to carbonyl compounds. Inorg. Chem. Front. 2014, 1, 534. [Google Scholar] [CrossRef]
- Hsu, C.C.; Wu, N.L. Synthesis and photocatalytic activity of ZnO/ZnO2 composite. J. Photochem. Photobiol. A Chem. 2005, 172, 269–274. [Google Scholar] [CrossRef]
- Giannakoudakis, D.A.; Florent, M.; Wallace, R.; Secor, J.; Karwacki, C.; Bandosz, T.J. Zinc peroxide nanoparticles: Surface, chemical and optical properties and the effect of thermal treatment on the detoxification of mustard gas. Appl. Catal. B Environ. 2018, 226, 429–440. [Google Scholar] [CrossRef]
- Profesional, E.; Física, D.E.I.; Carlos, R.; Surichaqui, C. Sintesis y Caracterización de nanopartículas de Zn02 y su actividad antímicrobiana. EsESCUELA Prof. Ing. FÍSICA 2013, 84. [Google Scholar] [CrossRef]
- Gondal, M.A.; Drmosh, Q.A.; Yamani, Z.H.; Saleh, T.A. Synthesis of ZnO2 nanoparticles by laser ablation in liquid and their annealing transformation into ZnO nanoparticles. Appl. Surf. Sci. 2009, 256, 298–304. [Google Scholar] [CrossRef]
- Drmosh, Q.A.; Gondal, M.A.; Yamani, Z.H.; Saleh, T.A. Spectroscopic characterization approach to study surfactants effect on ZnO2 nanoparticles synthesis by laser ablation process. Appl. Surf. Sci. 2010, 256, 4661–4666. [Google Scholar] [CrossRef]
- Mallika, A.N.; Ramachandrareddy, A.; Sowribabu, K.; Reddy, K.V. Synthesis and optical characterization of aluminum doped ZnO nanoparticles. Ceram. Int. 2014, 40, 12171–12177. [Google Scholar] [CrossRef]
- Rusdi, R.; Rahman, A.A.; Mohamed, N.S.; Kamarudin, N.; Kamarulzaman, N. Preparation and band gap energies of ZnO nanotubes, nanorods and spherical nanostructures. Powder Technol. 2011, 210, 18–22. [Google Scholar] [CrossRef]
- Drmosh, Q. Synthesis and Characterization of Nano-Structure Metal Oxides and Peroxides Prepared by Laser Ablation in Liquids. Ph.D. Thesis, King Fahd University of Petroleum and Minerals, Dhahran, Saudi Arabia, 2010. [Google Scholar]
- Malhotra, V.M.; Jasty, S.; Mu, R. FT-IR spectra of water in microporous KBr pellets and water’s desorption kinetics. Appl. Spectrosc. 1989, 43, 638–645. [Google Scholar] [CrossRef]
- Escobedo-Morales, A.; Esparza, R.; García-Ruiz, A.; Aguilar, A.; Rubio-Rosas, E.; Pérez, R. Structural and vibrational properties of hydrothermally grown ZnO2 nanoparticles. J. Cryst. Growth 2011, 316, 37–41. [Google Scholar] [CrossRef]
- Yang, L.Y.; Feng, G.P.; Wang, T.X. Green synthesis of ZnO2 nanoparticles from hydrozincite and hydrogen peroxide at room temperature. Mater. Lett. 2010, 64, 1647–1649. [Google Scholar] [CrossRef]
- de Mello, L.B.; Varanda, L.C.; Sigoli, F.A.; Mazali, I.O. Co-precipitation synthesis of (Zn-Mn)-co-doped magnetite nanoparticles and their application in magnetic hyperthermia. J. Alloys Compd. 2019, 698–705. [Google Scholar] [CrossRef]
- Gonçalves, N.S.; Carvalho, J.A.; Lima, Z.M.; Sasaki, J.M. Size-strain study of NiO nanoparticles by X-ray powder diffraction line broadening. Mater. Lett. 2012, 72, 36–38. [Google Scholar] [CrossRef]
- Zak, A.K.; Majid, W.H.A.; Abrishami, M.E.; Yousefi, R. X-ray analysis of ZnO nanoparticles by Williamson-Hall and size-strain plot methods. Solid State Sci. 2011, 13, 251–256. [Google Scholar] [CrossRef]
- Bai, H.; Liu, X. Green hydrothermal synthesis and photoluminescence property of ZnO2 nanoparticles. Mater. Lett. 2010, 64, 341–343. [Google Scholar] [CrossRef]
- Fatehah, M.O.; Aziz, H.A.; Stoll, S. Stability of ZnO Nanoparticles in Solution. Influence of pH, Dissolution, Aggregation and Disaggregation Effects. J. Colloid Sci. Biotechnol. 2014, 3, 75–84. [Google Scholar] [CrossRef]
- Omar, F.M.; Aziz, H.A.; Stoll, S. Aggregation and disaggregation of ZnO nanoparticles: Influence of pH and adsorption of Suwannee River humic acid. Sci. Total Environ. 2013, 468, 195–201. [Google Scholar] [CrossRef]
- Berg, J.M.; Romoser, A.; Banerjee, N.; Zebda, R.; Sayes, C.M. The relationship between pH and zeta potential of ~30 nm metal oxide nanoparticle suspensions relevant to in vitro toxicological evaluations. Nanotoxicology 2009, 3, 276–283. [Google Scholar] [CrossRef]
- Zhang, Q.; Xu, M.; You, B.; Zhang, Q.; Yuan, H.; Ostrikov, K. Oxygen Vacancy-Mediated ZnO Nanoparticle Photocatalyst for Degradation of Methylene Blue. Appl. Sci. 2018, 8, 353. [Google Scholar] [CrossRef] [Green Version]
- Moon, D.R.; Ingham, T.; Whalley, L.K.; Seakins, P.W.; Baeza-Romero, M.T.; Heard, D.E. Production of HO2 and OH radicals from near-UV irradiated airborne TiO2 nanoparticles. Phys. Chem. Chem. Phys. 2019, 21, 2325–2336. [Google Scholar] [CrossRef] [PubMed]
- Zent, A.P.; Ichimura, A.S.; Quinn, R.C.; Harding, H.K. The formation and stability of the superoxide radical (O2-) on rock-forming minerals: Band gaps, hydroxylation state, and implications for mars oxidant chemistry. J. Geophys. Res. 2008, 113, 1–13. [Google Scholar] [CrossRef]
- Wu, W.; Lin, R.; Shen, L.; Liang, R.; Yuan, R.; Wu, L. Highly efficient visible-light-induced photocatalytic hydrogenation of nitrobenzene to aniline in water. RSC Adv. 2013, 3, 10894–10899. [Google Scholar] [CrossRef]
- Modi, K.B.; Natarajan, K.; Kathad, C.R.; Shah, S.J.; Raval, P.Y.; Pathak, T.K.; Meshiya, U.M.; Vyas, K.G.; Bajaj, H.C.; Tayade, R.J. Synthesis and characterization of ferrite-semiconductor nano composite for photocatalytic degradation of aqueous nitrobenzene solution. AIP Conf. Proc. 2016, 1728, 1–6. [Google Scholar] [CrossRef]
- Shahrezaei, F.; Mansouri, Y.; Zinatizadeh, A.A.L.; Akhbari, A. Photocatalytic degradation of aniline using TiO2 nanoparticles in a vertical circulating photocatalytic reactor. Int. J. Photoenergy 2012, 2012, 430638. [Google Scholar] [CrossRef] [Green Version]
- Flores, S.O.; Rios-Bernij, O.; Valenzuela, M.A. Photocatalytic reduction of nitrobenzene by titanium dioxide powder. Top. Catal. 2007, 44, 507–511. [Google Scholar] [CrossRef]
- Chong, M.N.; Jin, B.; Chow, C.W.K.; Saint, C. Recent developments in photocatalytic water treatment technology: A review. Water Res. 2010, 44, 2997–3027. [Google Scholar] [CrossRef]
- Jeong, S.; Lee, H.; Park, H.; Jeon, K.J.; Park, Y.K.; Jung, S.C. Rapid photocatalytic degradation of nitrobenzene under the simultaneous illumination of UV and microwave radiation fields with a TiO2 ball catalyst. Catal. Today 2018, 307, 65–72. [Google Scholar] [CrossRef]
- ElMetwally, A.E.; Eshaq, G.; Al-Sabagh, A.M.; Yehia, F.Z.; Philip, C.A.; Moussa, N.A.; ElShafei, G.M.S. Insight into heterogeneous Fenton-sonophotocatalytic degradation of nitrobenzene using metal oxychlorides. Sep. Purif. Technol. 2019, 210, 452–462. [Google Scholar] [CrossRef]
- Bergs, C.; Simon, P.; Prots, Y.; Pich, A. Ultrasmall functional ZnO2 nanoparticles: Synthesis, characterization and oxygen release properties. RSC Adv. 2016, 6, 84777–84786. [Google Scholar] [CrossRef]
- Bergs, C.; Brück, L.; Rosencrantz, R.R.; Conrads, G.; Elling, L.; Pich, A. Biofunctionalized zinc peroxide (ZnO2) nanoparticles as active oxygen sources and antibacterial agents. RSC Adv. 2017, 7, 38998–39010. [Google Scholar] [CrossRef] [Green Version]
- Karthik, R.; Govindasamy, M.; Chen, S.M.; Cheng, Y.H.; Muthukrishnan, P.; Padmavathy, S.; Elangovan, A. Biosynthesis of silver nanoparticles by using Camellia japonica leaf extract for the electrocatalytic reduction of nitrobenzene and photocatalytic degradation of Eosin-Y. J. Photochem. Photobiol. B Biol. 2017, 170, 164–172. [Google Scholar] [CrossRef]
- Lawrence, A.; Thollander, P.; Andrei, M.; Karlsson, M. Specific Energy Consumption/Use (SEC) in Energy Management for Improving Energy Efficiency in Industry: Meaning, Usage and Differences. Energies 2019, 12, 247. [Google Scholar] [CrossRef] [Green Version]
- Tayade, R.J.; Key, D.L. Synthesis and Characterization of Titanium Dioxide Nanotubes for Photocatalytic Degradation of Aqueous Nitrobenzene in the Presence of Sunlight. Mater. Sci. Forum. 2010, 657, 62–74. [Google Scholar] [CrossRef]
- Srilakshmi, C.; Saraf, R.; Shivakumara, C. Effective degradation of aqueous nitrobenzene using the SrFeO3−δ photocatalyst under UV illumination and its kinetics and mechanistic studies. Ind. Eng. Chem. Res. 2015, 54, 7800–7810. [Google Scholar] [CrossRef]
- Bhatkhande, D.S.; Pangarkar, V.G.; Beenackers, A.A.C.M. Photocatalytic degradation of nitrobenzene using titanium dioxide and concentrated solar radiation: Chemical effects and scaleup. Water Res. 2003, 37, 1223–1230. [Google Scholar] [CrossRef]
- Roy, P.; Periasamy, A.P.; Liang, C.T.; Chang, H.T. Synthesis of graphene-ZnO-Au nanocomposites for efficient photocatalytic reduction of nitrobenzene. Environ. Sci. Technol. 2013, 47, 6688–6695. [Google Scholar] [CrossRef] [PubMed]
- Reynoso-Soto, E.A.; Pérez-Sicairos, S.; Reyes-Cruzaley, A.P.; Castro-Riquelme, C.L.; Félix-Navarro, R.M.; Paraguay-Delgado, F.; Alonso-Núñez, G.; Lin-Ho, S.W. Photocatalytic degradation of nitrobenzene using nanocrystalline TiO2 photocatalyst doped with Zn ions. J. Mex. Chem. Soc. 2013, 57, 298–305. [Google Scholar] [CrossRef]
- Jo, W.K.; Won, Y.; Hwang, I.; Tayade, R.J. Enhanced photocatalytic degradation of aqueous nitrobenzene using graphitic carbon-TiO2 composites. Ind. Eng. Chem. Res. 2014, 53, 3455–3461. [Google Scholar] [CrossRef]
- Boxi, S.S.; Paria, S. Visible light induced enhanced photocatalytic degradation of organic pollutants in aqueous media using Ag doped hollow TiO2 nanospheres. RSC Adv. 2015, 5, 37647–37668. [Google Scholar] [CrossRef]
- Bhatia, K. Hydroxyl radical induced oxidation of nitrobenzene. J. Phys. Chem. 1975, 79, 1032–1038. [Google Scholar] [CrossRef]
- Eberhardt, M.K.; Yoshida, M. Radiation-induced homolytic aromatic substitution. I. Hydroxylation of nitrobenzene, chlorobenzene, and toluene. J. Phys. Chem. 1973, 77, 589–597. [Google Scholar] [CrossRef]
- Zhang, Y.; Zhang, K.; Dai, C.; Zhou, X.; Si, H. An enhanced Fenton reaction catalyzed by natural heterogeneous pyrite for nitrobenzene degradation in an aqueous solution. Chem. Eng. J. 2014, 244, 438–445. [Google Scholar] [CrossRef]
- Pérez-Sicairos, S.; Corrales-López, K.A.; Hernández-Calderón, O.M.; Salazar-Gastélum, M.I.; Félix-Navarro, R.M. Photochemical Degradation of Nitrobenzene by S2O8–2 Ions and UV Radiation. Rev. Int. Contam. Ambient. 2016, 32, 227–236. [Google Scholar] [CrossRef]


| 2θ | HKL JCPDS | Lattice Parameter (Å) | Atomic Radius (Å) | Cell Volume (Å3) | ||
|---|---|---|---|---|---|---|
| 37 | 2 | 0 | 0 | 4.86 | 2.43 | 115 |
| 31 | 1 | 1 | 1 | 4.91 | 2.45 | 118 |
| 53 | 2 | 2 | 0 | 4.87 | 2.43 | 115 |
| 63 | 3 | 1 | 1 | 4.87 | 2.43 | 115 |
| 66 | 2 | 2 | 2 | 4.87 | 2.43 | 115 |
| 41 | 2 | 1 | 0 | 4.89 | 2.44 | 117 |
| 45 | 2 | 1 | 1 | 4.88 | 2.44 | 116 |
| Material | [Material] | [NB] | Time (h) | Type of Irradiation | NB Degradation (%) | Principal Intermediates | Reference |
|---|---|---|---|---|---|---|---|
| TiO2 Nanotubes | 50 mg/50 mL | 40 ppm | 4 | Sun light | 100.00% | No report | [61] |
| SrFeO3−δ | 1000 ppm | 50 ppm | 6 | 125 W, Mercury Vapor Lamp | 99.00% | No report | [62] |
| TiO ** | 0.3% w/v | 300 ppm | 4 | Sun light | 98.50% | 3-nitrophenol and 4-nitrophenol | [63] |
| TiO2 | 50 mg | 50 ppm | 8 | 125 W, Mercury Vapor Lamp | 98.00% | No report | [10] |
| G-ZnO-Au NCs | 4 ppm | 5 mM | 2.3 | 500 W, <420 nm | 97.80% | Aniline | [64] |
| (0.50%) Zn doped TiO2 | 15 ppm | 2 | 254 nm | 97.00% | No report | [65] | |
| GT-1 | 200 ppm | 50 ppm | 4 | 200 W | 96.00% | No report | [66] |
| Mercury Vapor Lamp | |||||||
| Ag-h-TiO2 *** | 0.5 g/L | 61.5 ppm | 3.5 | 435.8 nm | 95.50% | n-butanol, di-ethyl ether, furan, orthoformic acid, propanol and acetic acid. | [67] |
| TiFe0.5 *** | 4 glass plates | 2.51 × 10⁻⁴ M | 4 | 320–500 nm | 88.45% | No report | [22] |
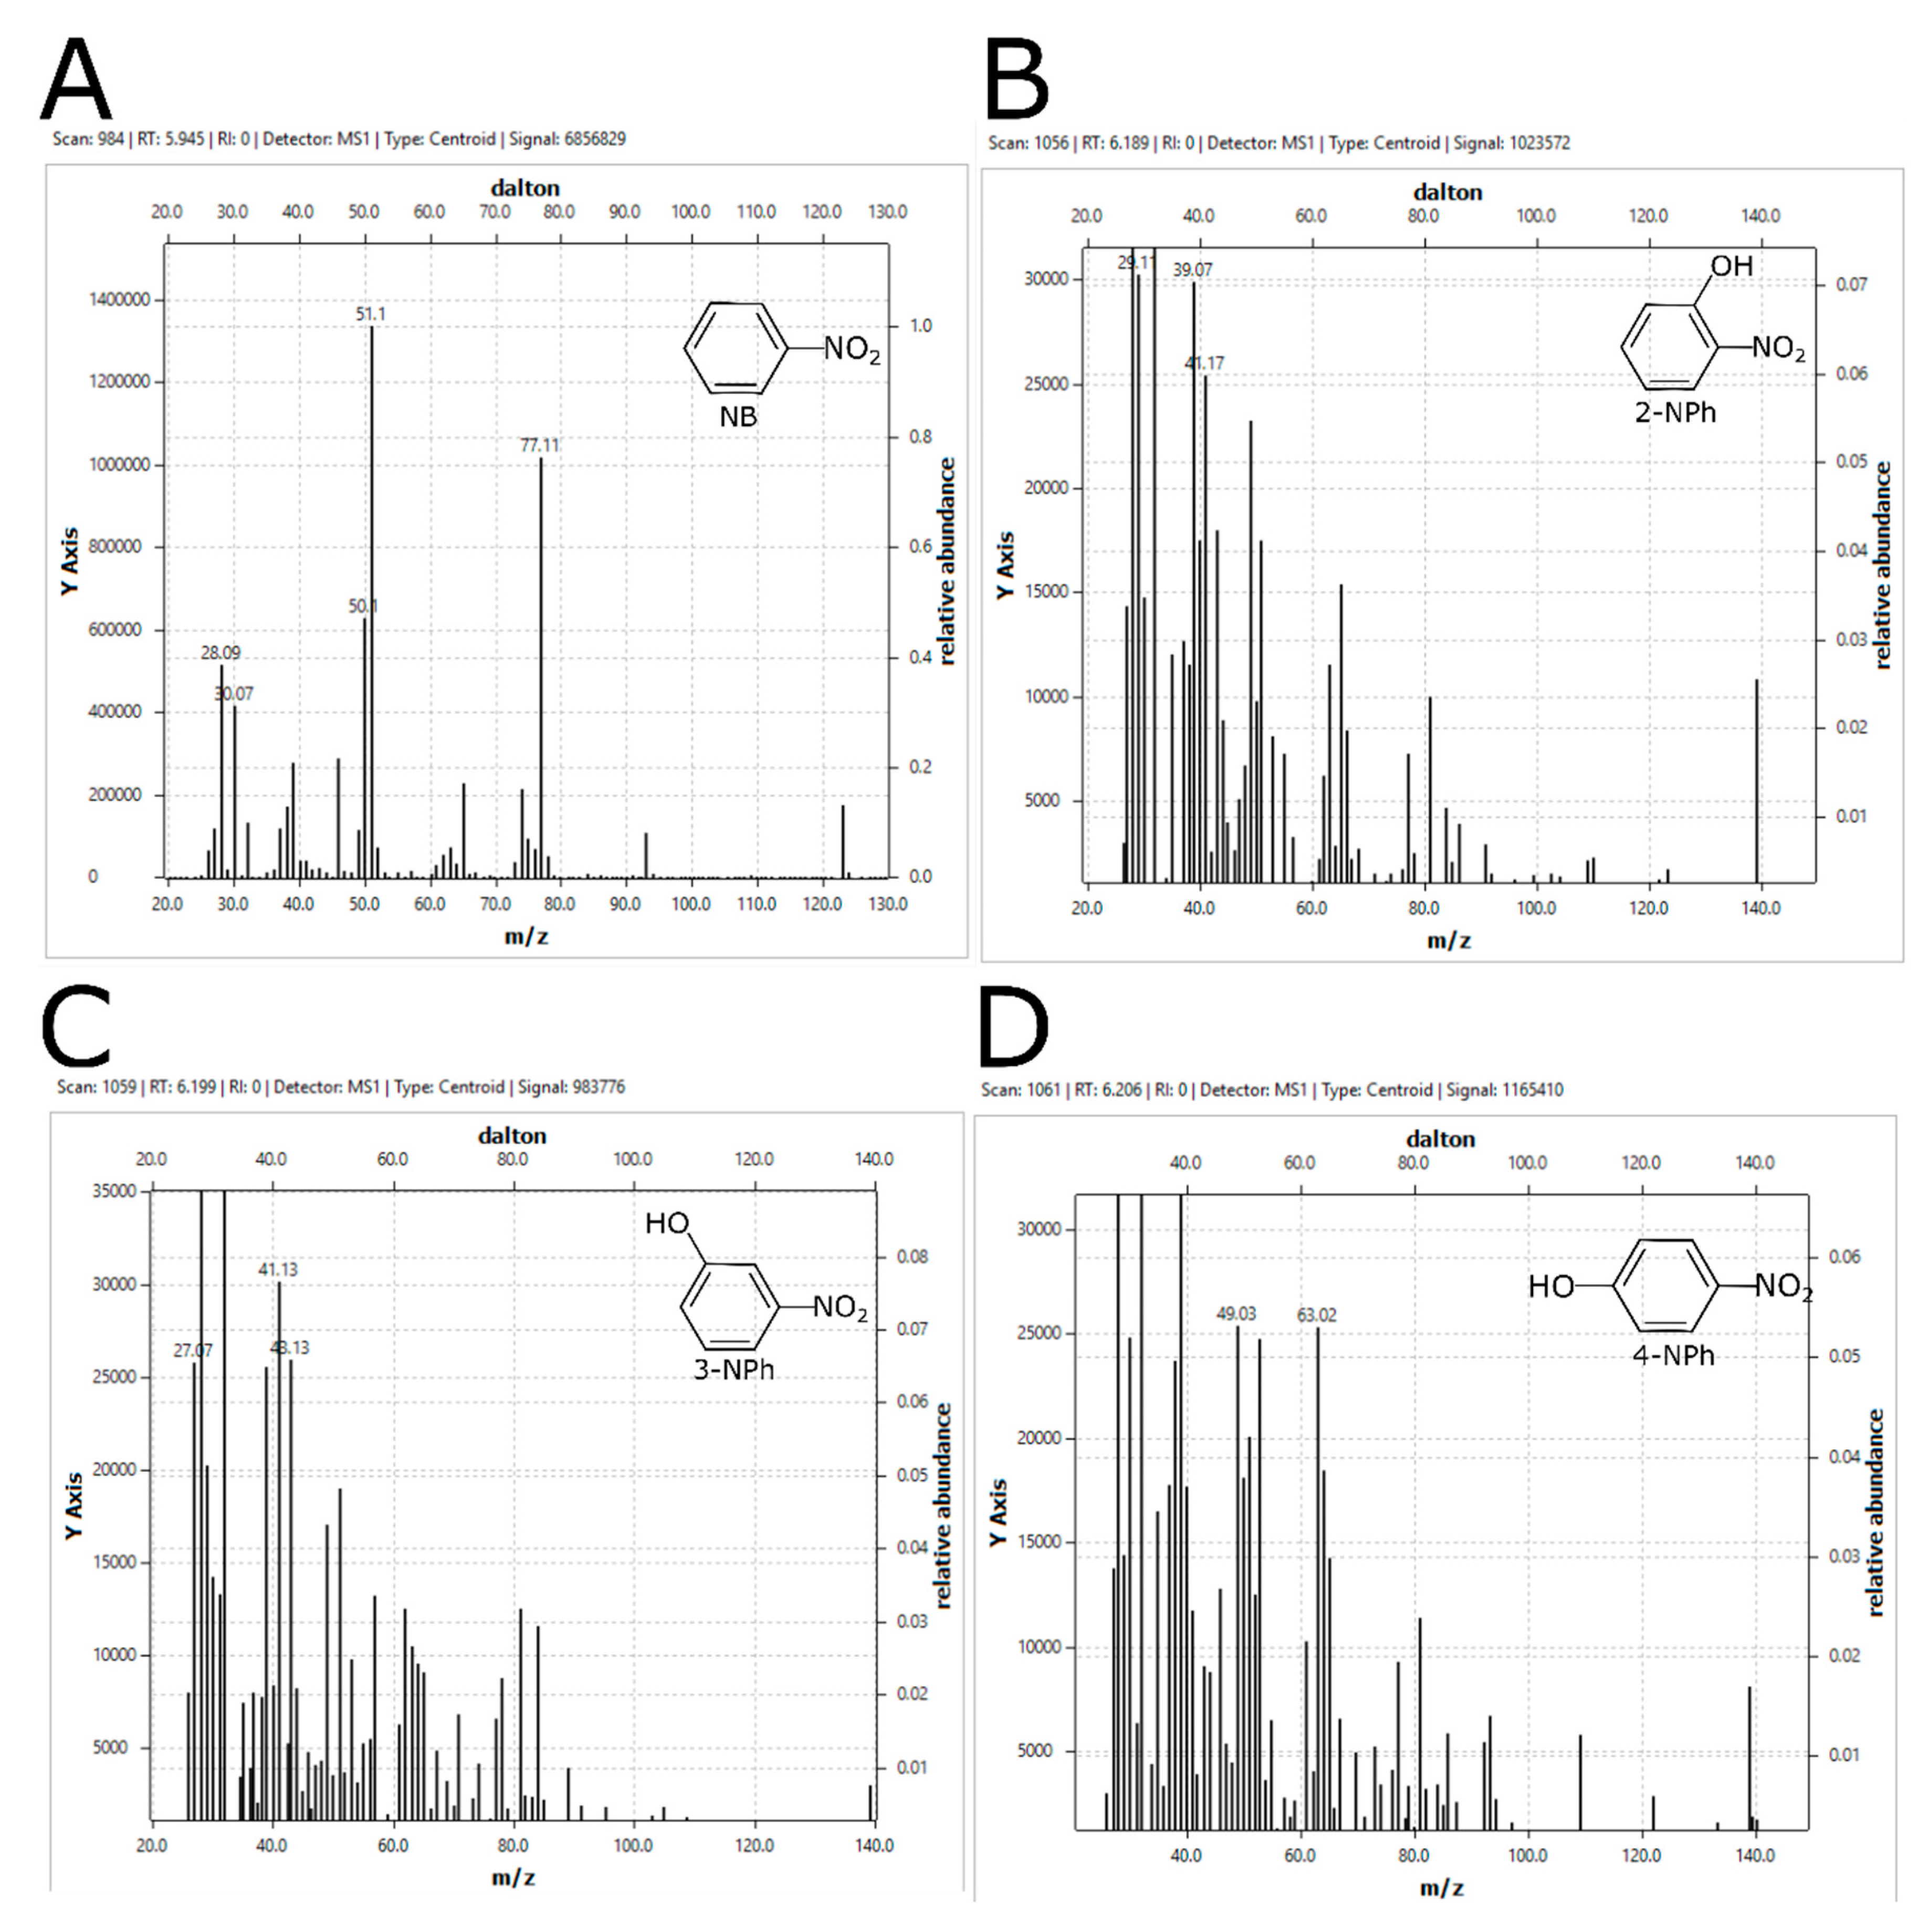
| ZnO2 * | 30 ppm | 15 ppm | 2 | 254 nm | 97.55% | 2-NPhs, 3-NPhs and 4-NPhs | This work |
© 2020 by the authors. Licensee MDPI, Basel, Switzerland. This article is an open access article distributed under the terms and conditions of the Creative Commons Attribution (CC BY) license (http://creativecommons.org/licenses/by/4.0/).
Share and Cite
Ramírez, J.I.D.L.; Villegas, V.A.R.; Sicairos, S.P.; Guevara, E.H.; Brito Perea, M.D.C.; Sánchez, B.L. Synthesis and Characterization of Zinc Peroxide Nanoparticles for the Photodegradation of Nitrobenzene Assisted by UV-Light. Catalysts 2020, 10, 1041. https://0-doi-org.brum.beds.ac.uk/10.3390/catal10091041
Ramírez JIDL, Villegas VAR, Sicairos SP, Guevara EH, Brito Perea MDC, Sánchez BL. Synthesis and Characterization of Zinc Peroxide Nanoparticles for the Photodegradation of Nitrobenzene Assisted by UV-Light. Catalysts. 2020; 10(9):1041. https://0-doi-org.brum.beds.ac.uk/10.3390/catal10091041
Chicago/Turabian StyleRamírez, Jesús Isaías De León, Víctor Alfredo Reyes Villegas, Sergio Pérez Sicairos, Esteban Hernández Guevara, Mirna Del Carmen Brito Perea, and Bertha Landeros Sánchez. 2020. "Synthesis and Characterization of Zinc Peroxide Nanoparticles for the Photodegradation of Nitrobenzene Assisted by UV-Light" Catalysts 10, no. 9: 1041. https://0-doi-org.brum.beds.ac.uk/10.3390/catal10091041