Article

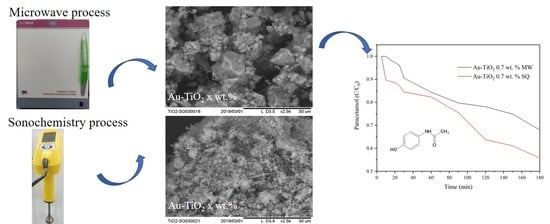
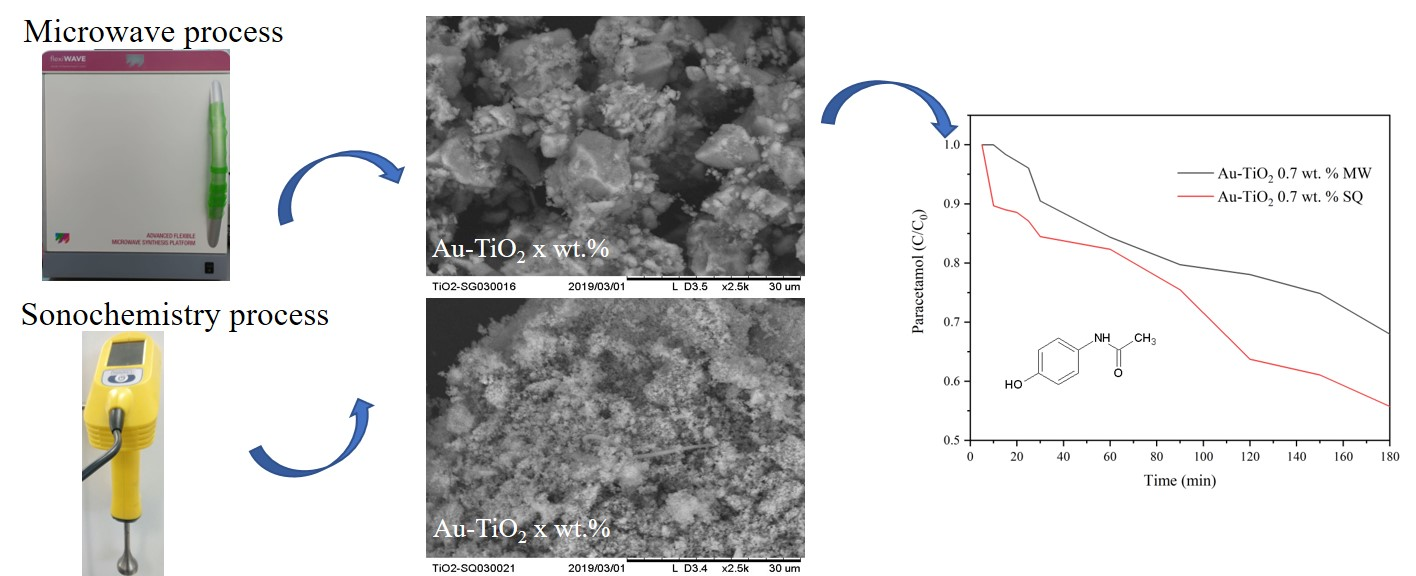
Au-TiO2 Synthesized by a Microwave- and Sonochemistry-Assisted Sol-Gel Method: Characterization and Application as Photocatalyst

by
Rafael Hernández
1,
José Rosendo Hernández-Reséndiz
1,
Marisela Cruz-Ramírez
2,
Rodrigo Velázquez-Castillo
1,
Luis Escobar-Alarcón
3,
Luis Ortiz-Frade
4 and
Karen Esquivel
1,*
1
Graduate and Research Division, Engineering Faculty, Autonomous University of Queretaro, Cerro de las Campanas, Santiago de Querétaro, Qro. C.P. 76010, Mexico
2
Chemical Engineering and Renewable Energies, San Juan del Río Technologic University, Av. de la Palma 125, Vista Hermosa, San Juan del Río, Querétaro C.P. 76800, Mexico
3
Physics Department, National Institute for Nuclear Research, Carr. México-Toluca km 36.5, Ocoyoacac, Edo. de México C.P. 52750, Mexico
4
Electrochemistry Department, Research Center and Technological Development of Electrochemistry, S.C. Technological Park Queretaro, Sanfandila, Pedro Escobedo, Querétaro C.P. 76703, Mexico
*
Author to whom correspondence should be addressed.
Submission received: 9 August 2020 / Revised: 3 September 2020 / Accepted: 11 September 2020 / Published: 13 September 2020
(This article belongs to the Special Issue Photocatalytic Degradation of Organic Wastes in Water)

Abstract

:
Titanium dioxide (TiO2) is a widely used and well studied photocatalyst synthesized using different methodologies, including sol-gel, which allows one to modify the material in a one-pot step. By using a microwave- and sonochemistry-assisted sol-gel method, x wt.% Au-TiO2 photocatalysts were successfully synthesized. Physicochemical characterization of the photocatalysts shows an average crystallite size of 10.5 nm and an even morphological distribution of spherical particles with the sonochemistry synthesis method. For the microwave method an average value of crystallite size of 8.3 nm was found and it presents an increase with the amount of Au load. The cyclic voltammetric response and Mott-Schottky analysis are consistent with a semiconductor material containing metallic particles and for a heterophase junction of anatase and brookite with oxygen vacancies, respectively. The photocatalytic activity was assessed by paracetamol degradation in an aqueous solution as model. The sonochemistry-synthesized photocatalysts display the most promising results as they have a better paracetamol removal and the amount of gold in the catalyst (0.7 wt.%) was found to be optimal for this process.

Graphical Abstract

1. Introduction

Titanium dioxide (TiO2) is a widely studied material owing to its excellent physical, chemical, electronic and optical properties. Due to its properties, TiO2 has a wide number of applications such as electronic devices [1], thin films [2], self-cleaning surfaces [3] and water treatment through advanced oxidation processes [4,5,6].
Many methods have been reported for the synthesis of titanium dioxide materials, including hydrothermal methods [7,8], chemical vapor deposition [9,10], the Pechini method [11], and sol-gel processes which have been also used in industrial scale synthesis [12,13,14]. Among these sol-gel is still one of the most widely used synthesis methods for the preparation of TiO2 photocatalysts, either as pure TiO2 or doped TiO2. The main advantage of this method is that it allows the synthesis of crystalline powders of high purity at relatively low temperatures [15,16]. The sol-gel method can be also be assisted by coupling it with another different type of process, such as microwave or sonochemical irradiation.
The microwave-assisted method is a rapid, energy-saving and high yielding method for the preparation of functional nanomaterials [2]. Microwave radiation frequencies range from 300 MHz to 300 GHz. When microwaves interact with matter, they transfer energy directly, producing a fast and homogeneous heating process [17,18]. The microwave-assisted sol-gel method has been reported as a versatile procedure for preparing metal or non-metal doped titanium dioxide. Reda et al. reported the copper doping of TiO2, with a diminution on the synthesis time and improvement of the photocatalytic activity. A crystalline anatase phase with particles of sizes between 9–17 nm was determined [19]. Studies on non-metal (nitrogen) doping of titanium dioxide through a sol-gel process affording particles of 50–120 nm size and their application for visible-driven photocatalytic degradation of pharmaceutical pollutants have been reported by Shetty et al. [20]. Moreover, comparisons of metal and non-metal doping effects have been performed in some studies. Esquivel et al. reported the synthesis of TiO2 doped with iron and sulfur employing a microwave-assisted sol-gel method, where according to the results, the crystallite size of the synthesized samples remained in the 4.9 nm to 6.5 nm range no matter the dopant utilized [21].
On the other hand, sonochemistry has attracted attention in recent years as a novel synthesis route since it causes chemical reactions and physical changes that do not occur in other ways [22,23]. In the sonochemistry method, a three-step process takes place including the formation, growth, and finally the implosive collapse of cavitation bubbles [24]. This implosion produces extremely high temperatures (>5000 K), pressures (>20 MPa), and very high cooling rates (>1010 K s1) [25,26,27]. Several investigations have been carried out to synthesize titanium dioxide under these extreme conditions. Guo et al. successfully incorporated TiO2 nanoparticles with an average size of 4–5 nm on graphene layers using a sonochemical-assisted synthesis method without any surfactant [28]. Ambati and Gogate reported the synthesis of an iron-doped TiO2 catalyst through an ultrasound-assisted sol-gel method. A comparison between the obtained TiO2 and the conventionally synthesized material indicated that the ultrasound approach yields lower particle size and reduced reaction time [29].
It is worth mentioning that novel assisted synthesis methods coupled to the sol-gel conventional method are proven to yield better performance and specific characteristics of the synthesized TiO2, however, only a few investigations have made clear comparisons on the advantages on the use of assisted methods with conventional synthesis methods, and, to the best of our knowledge, there is no clear comparison in the synthesis of doped titanium dioxide using microwave- and sonochemistry-assisted methods. In this work, a comparison of the synthesis and structural characterization of x wt.% Au-TiO2 photocatalysts produced by two different methods, namely, microwave and a new sonochemistry-assisted sol-gel method (MW method and SQ method, respectively) is presented, in order to observe any morphology changes due to the energy applied to the reaction and also the expected changes in its photocatalytic activity for the degradation of paracetamol (PAM) as model pollutant in aqueous medium by UV assisted photocatalysis. Therefore, it will be possible to start further studies of how gold interacts with the TiO2 matrix in advanced oxidation processes, self-cleaning surfaces or nanotoxicology studies.

2. Results and Discussion

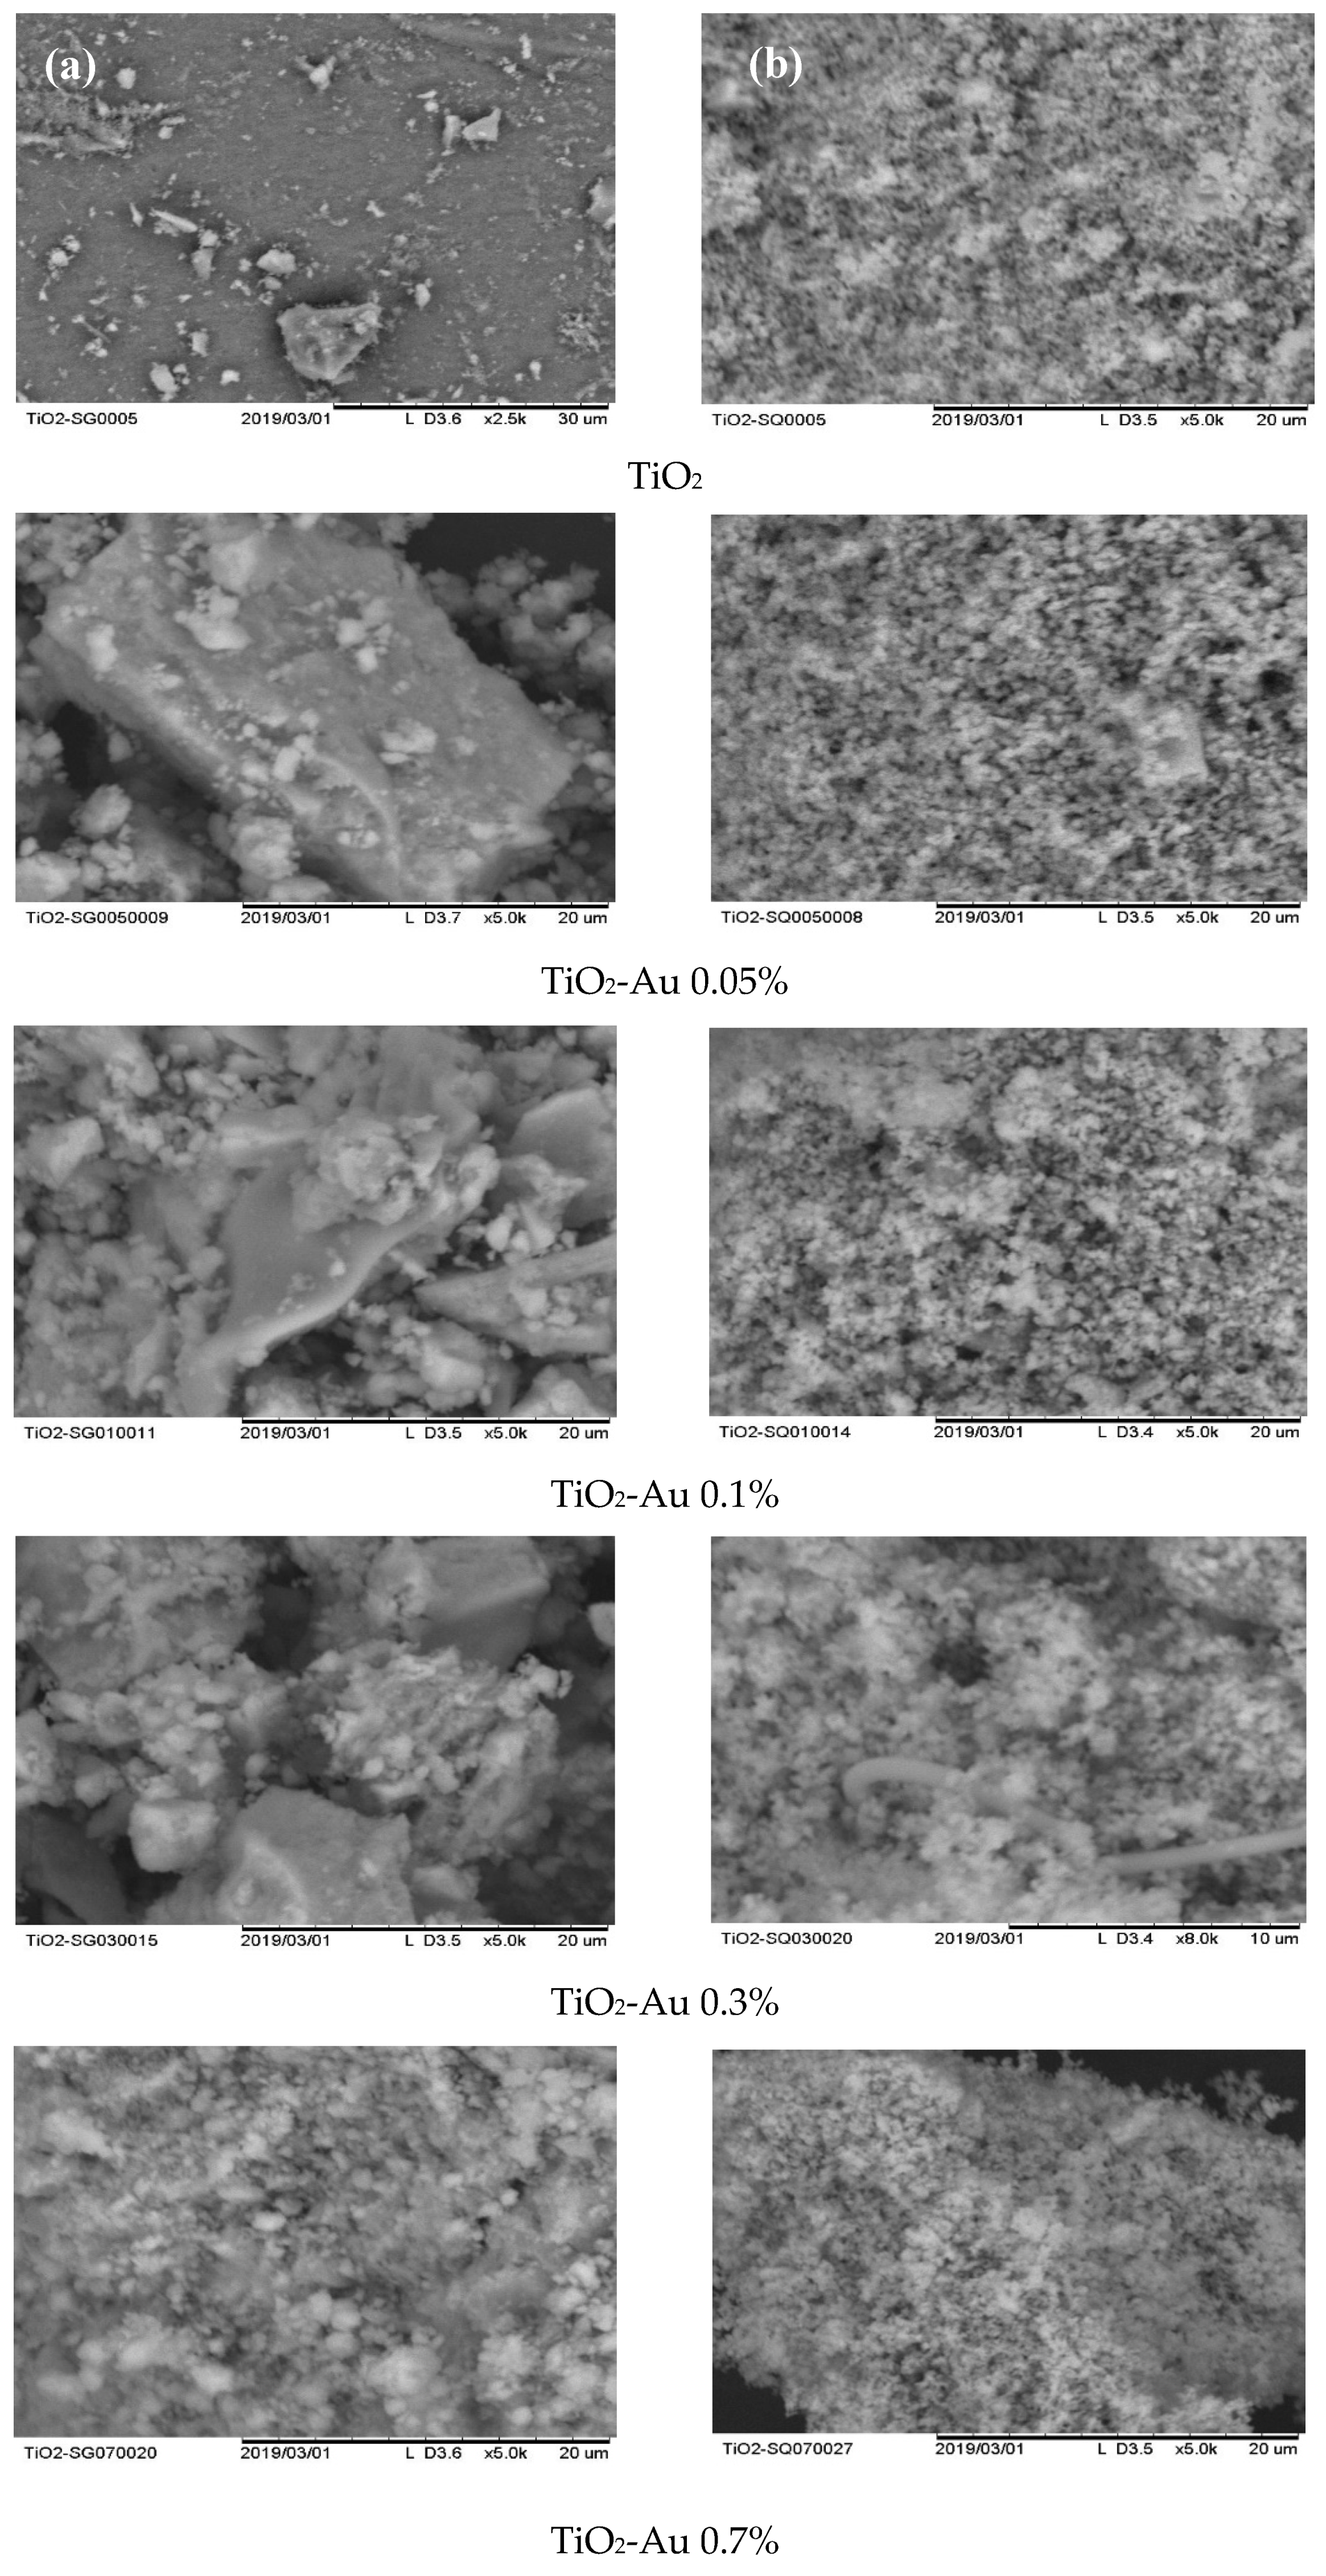
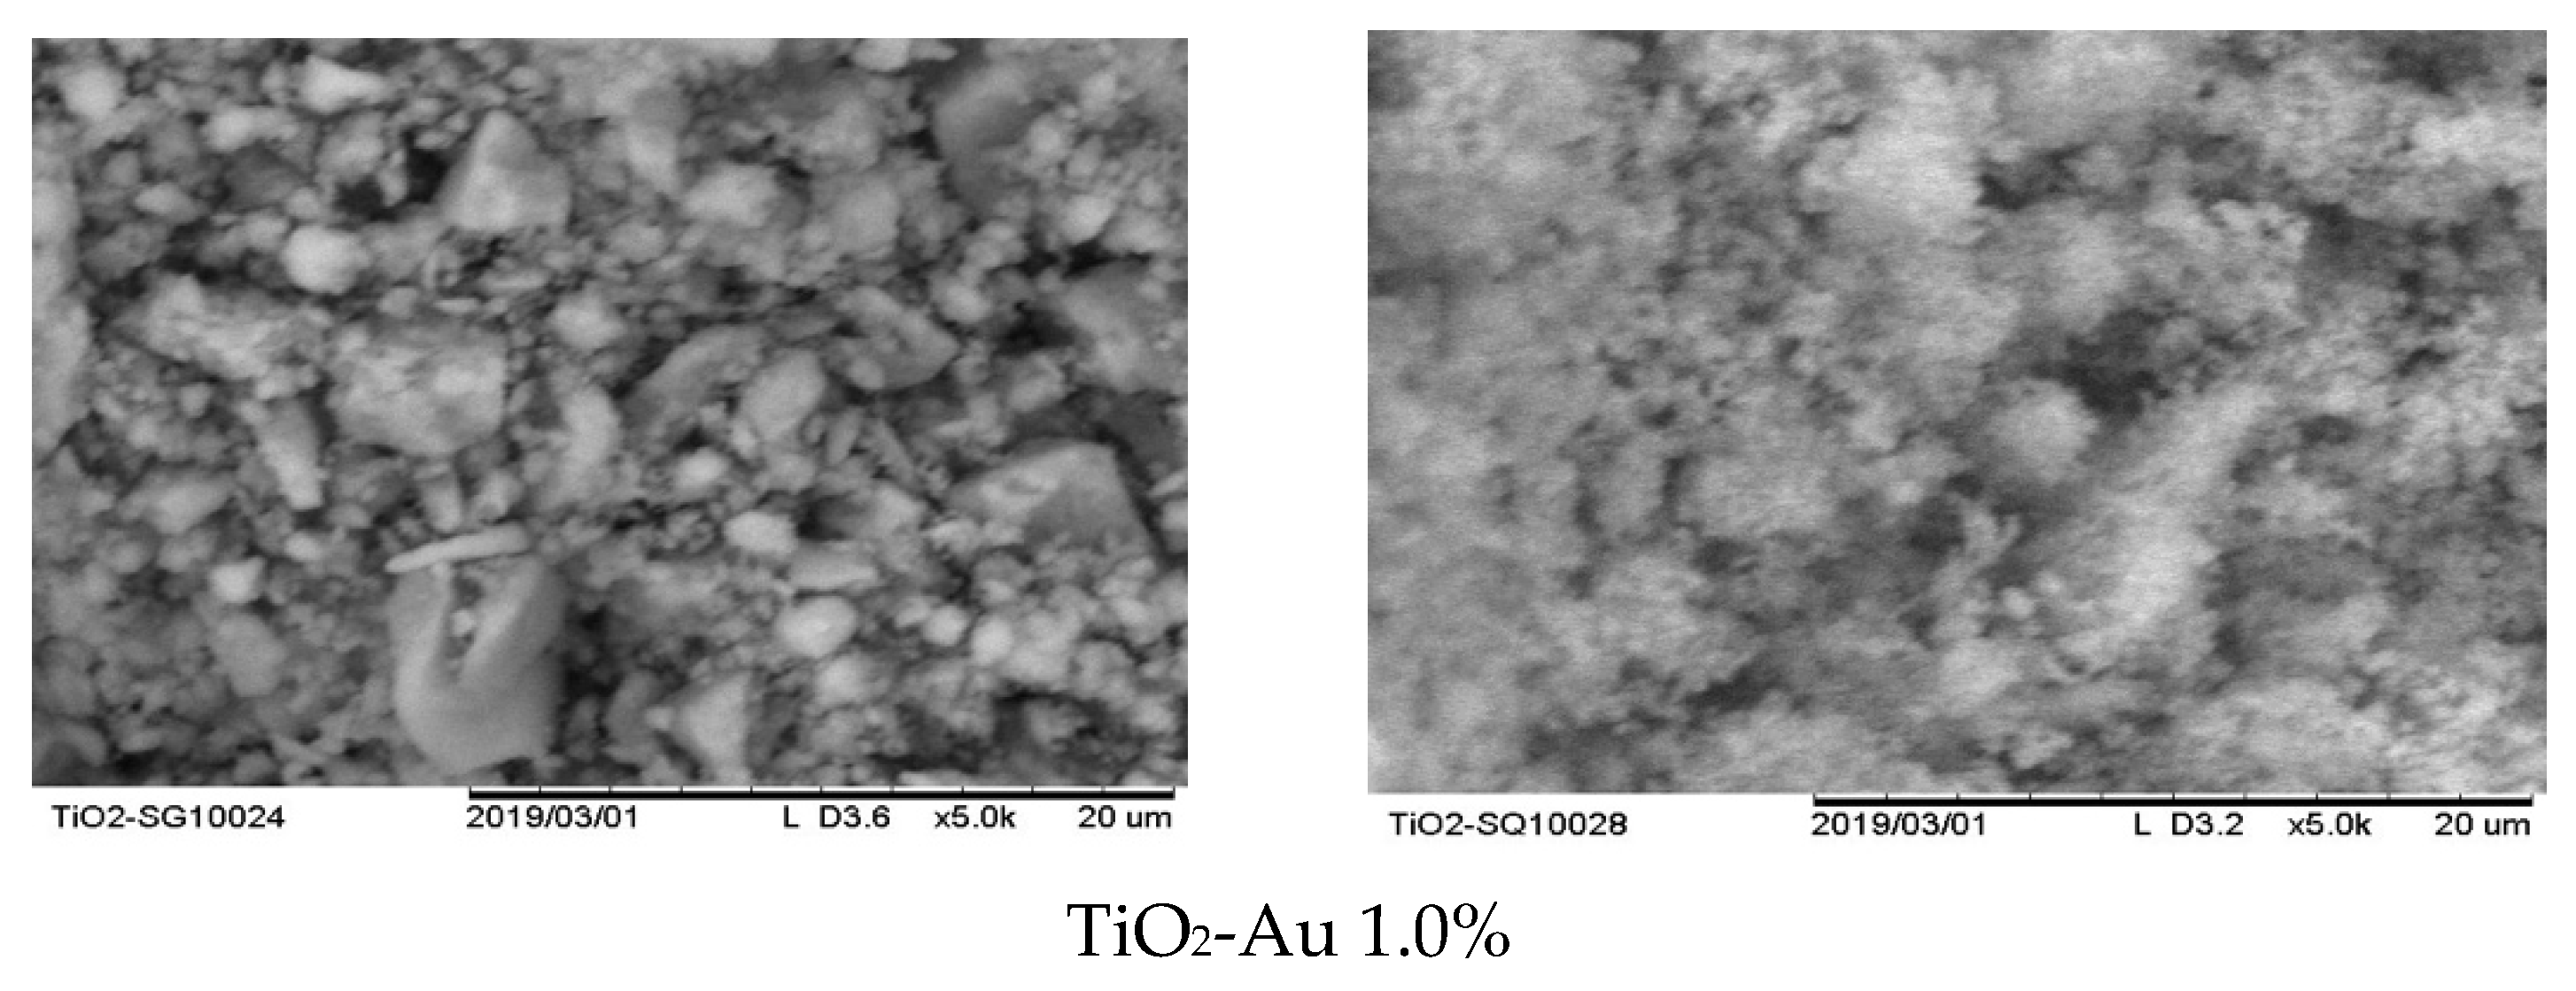
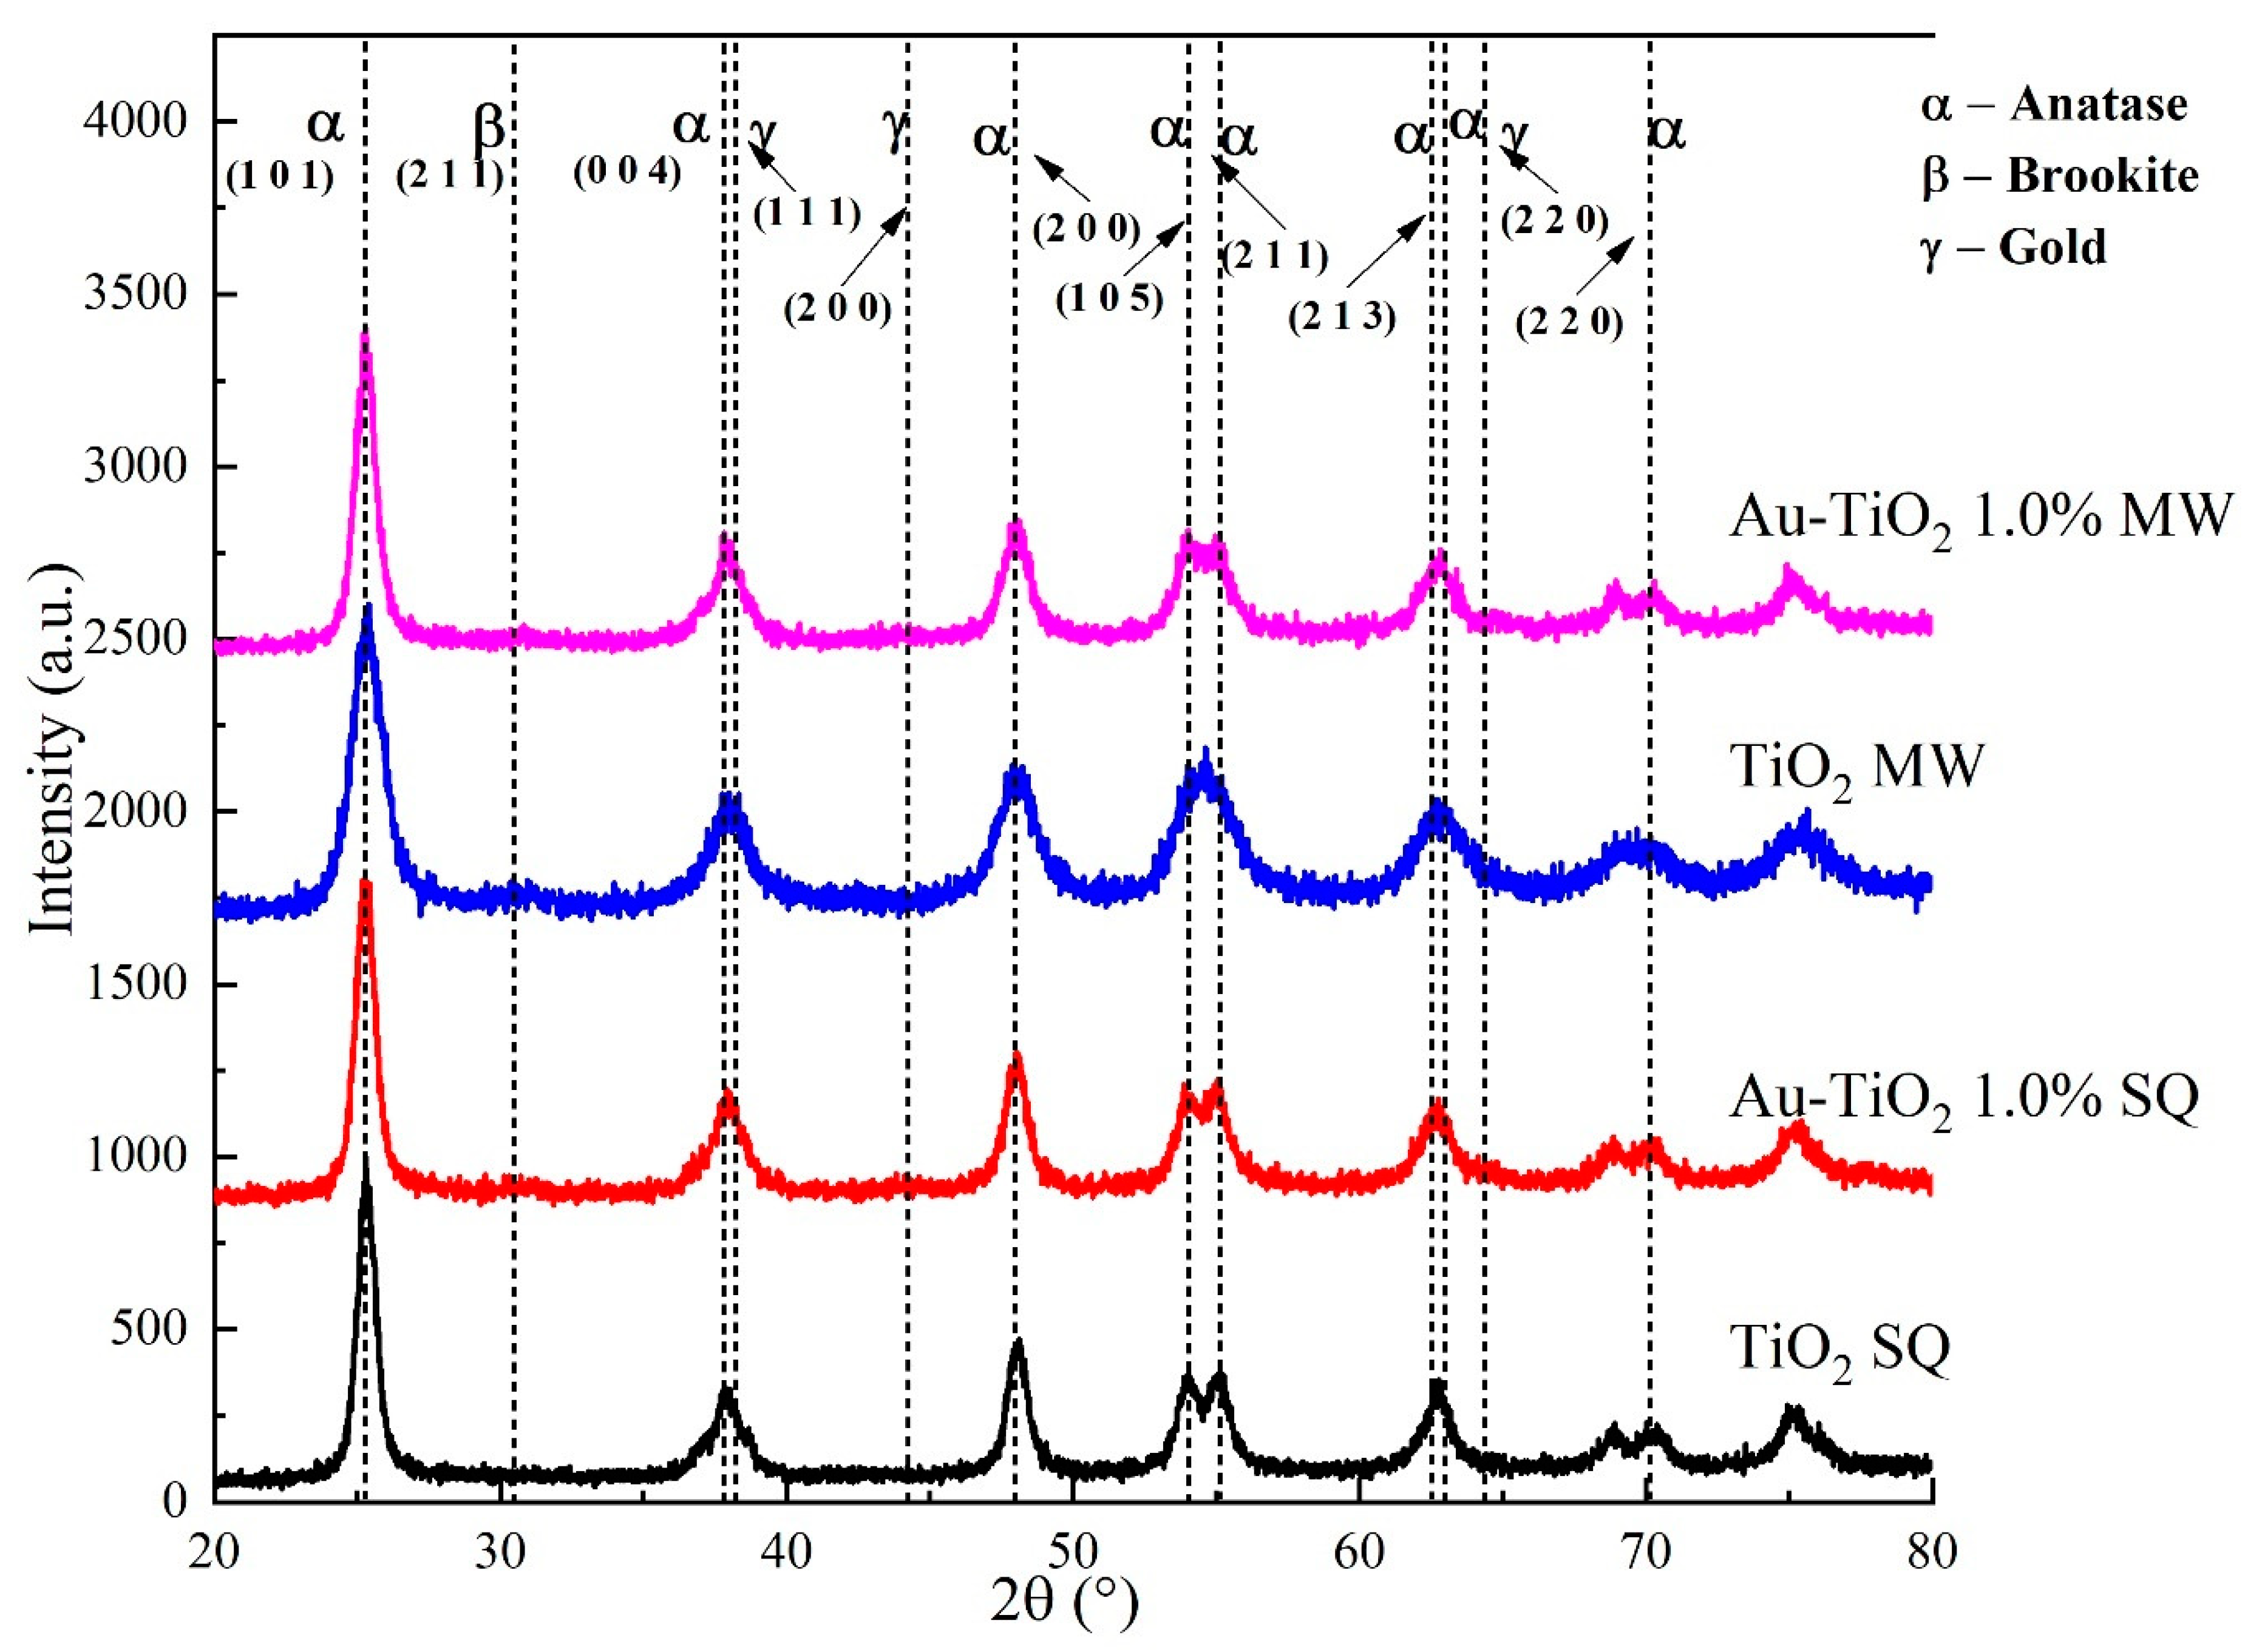
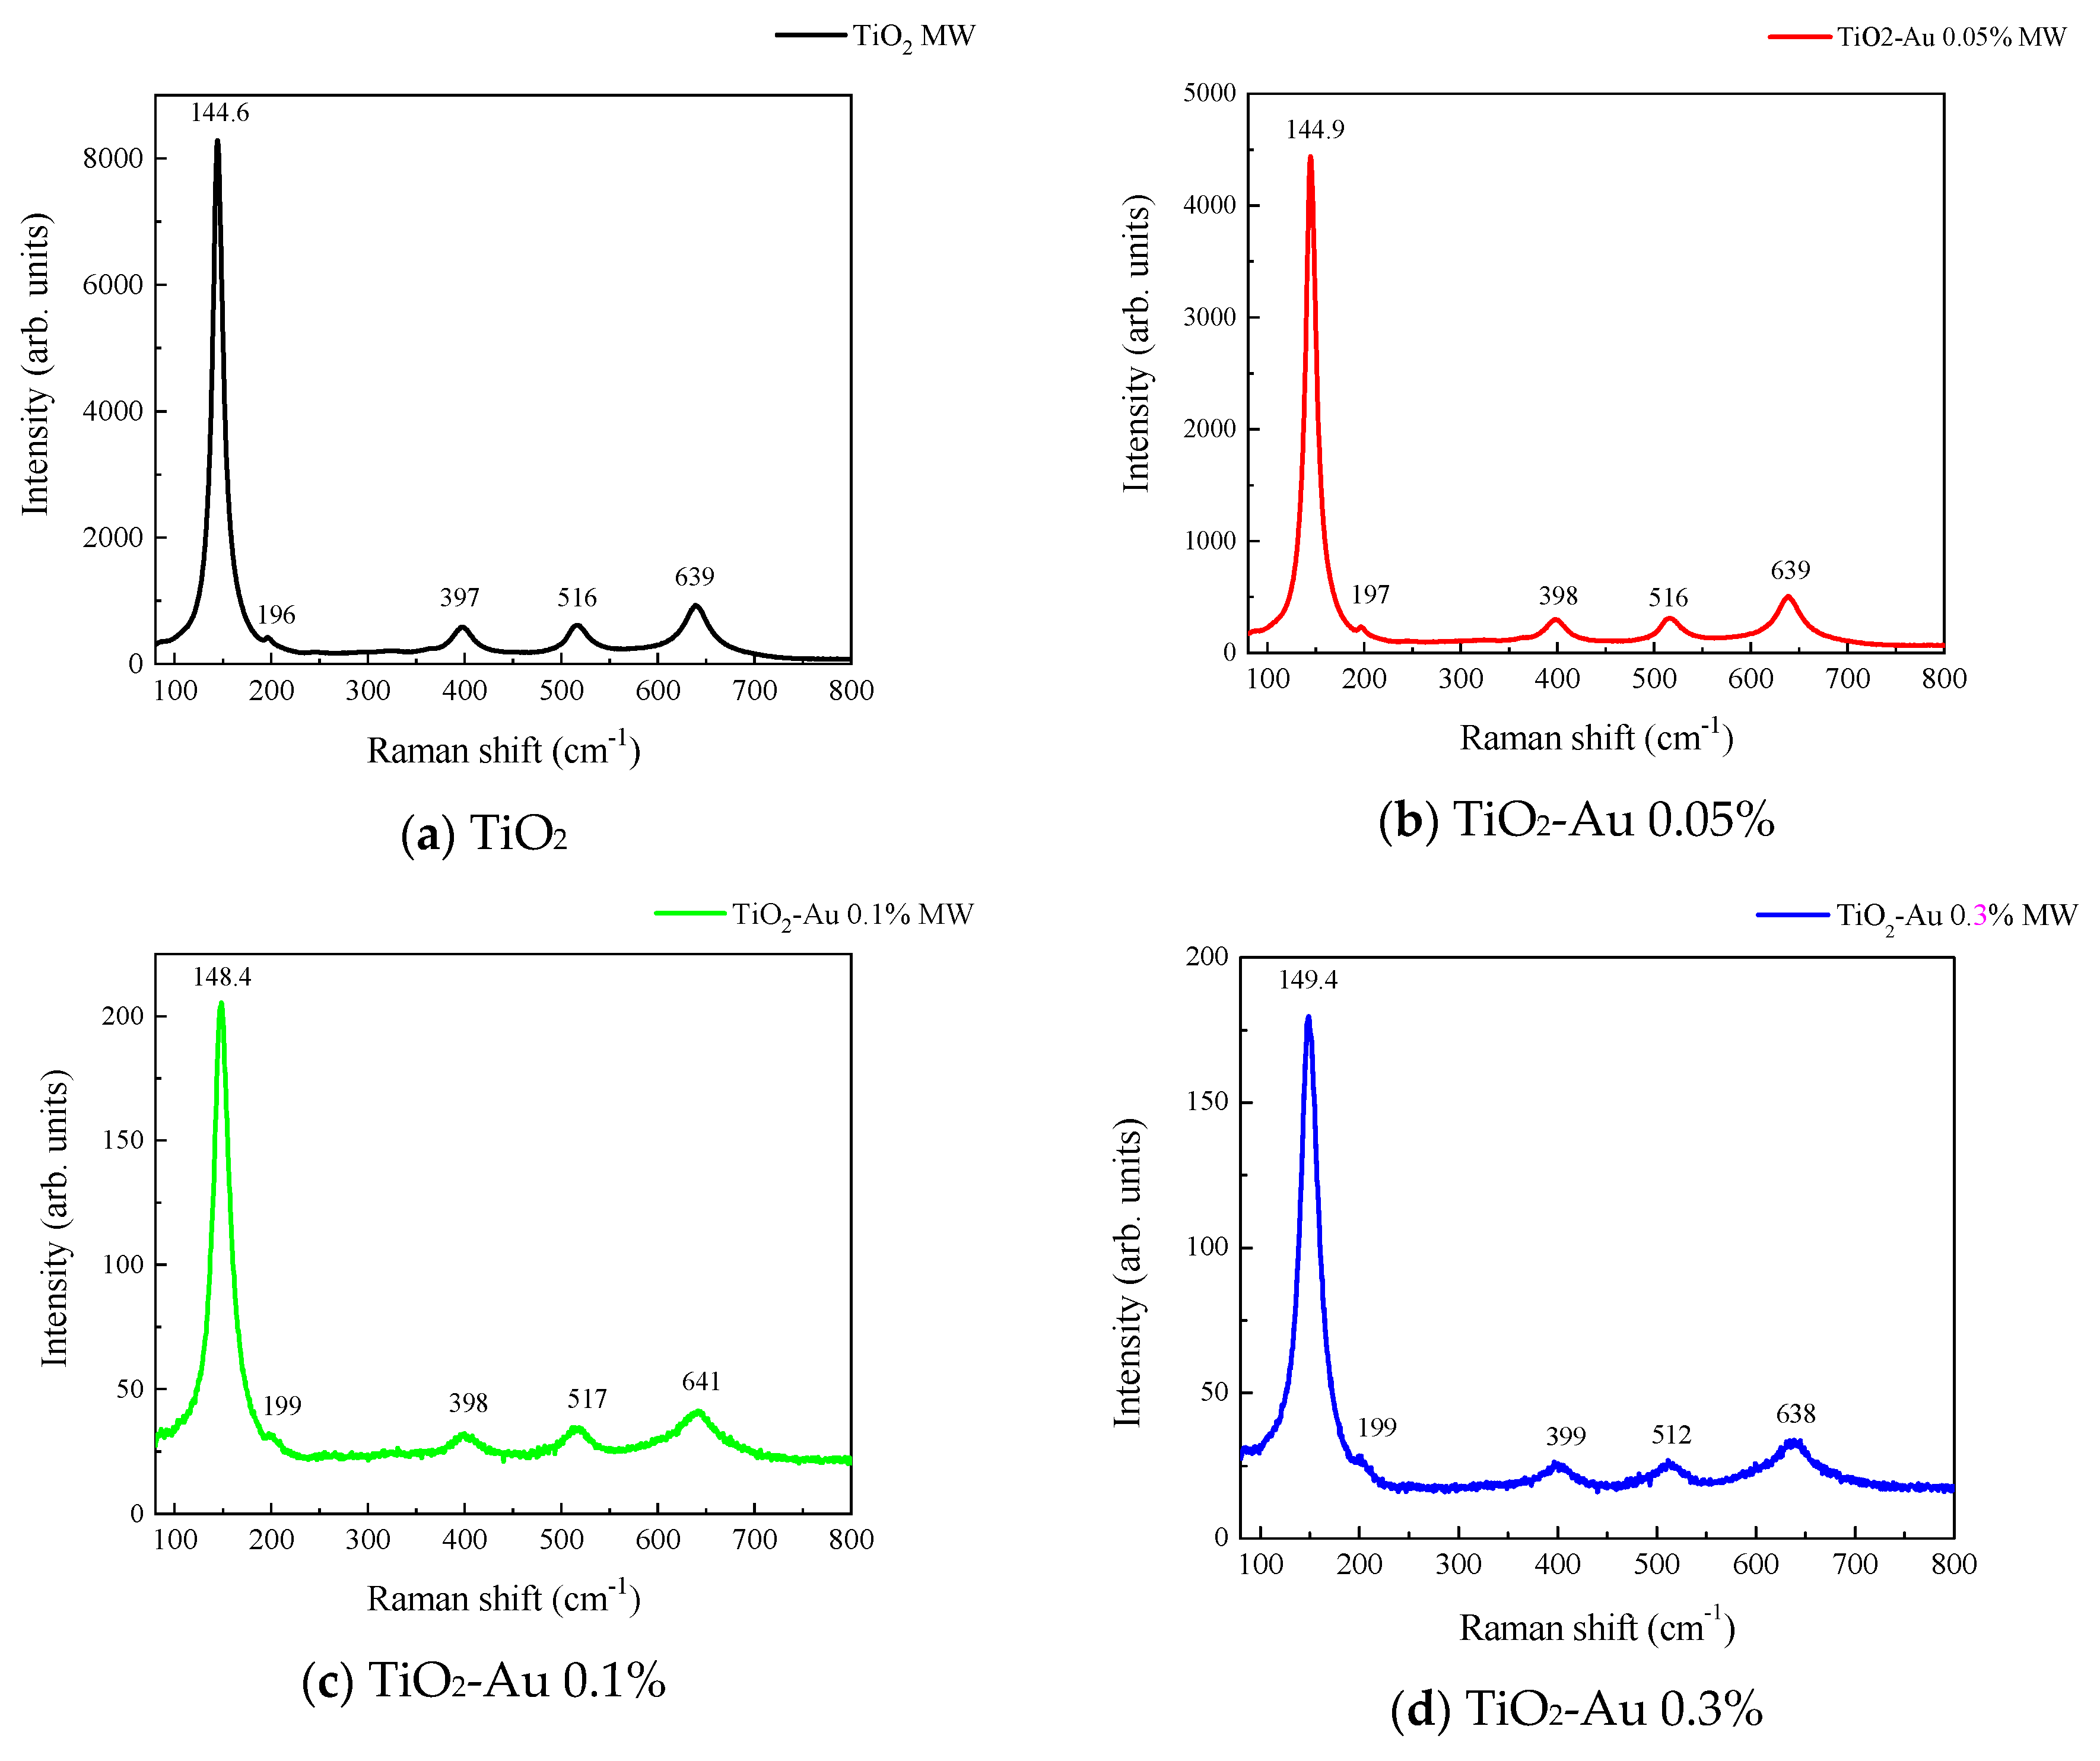
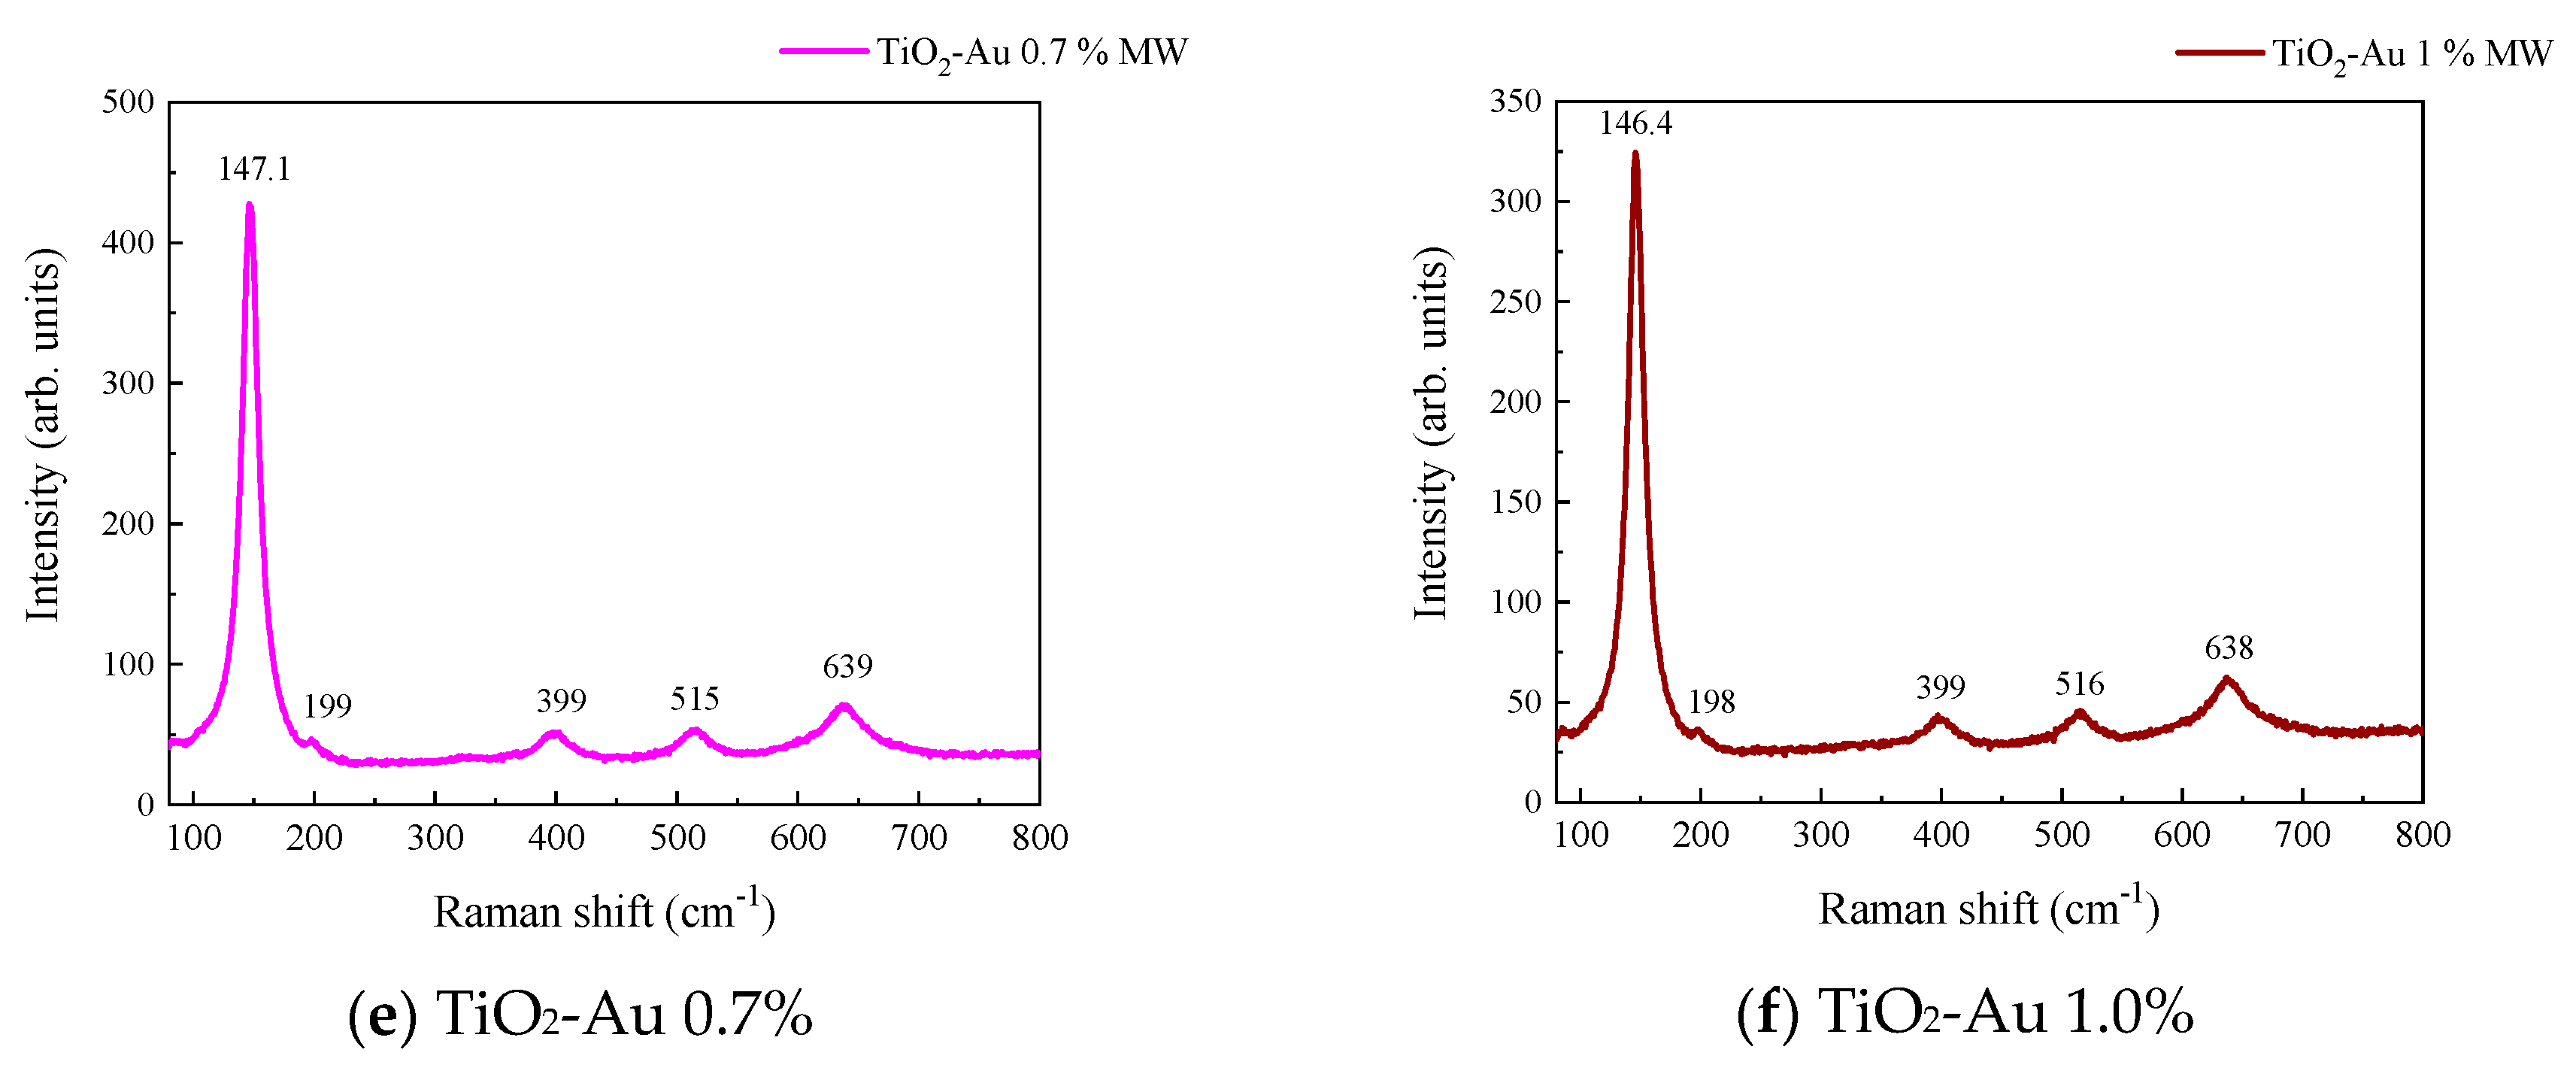
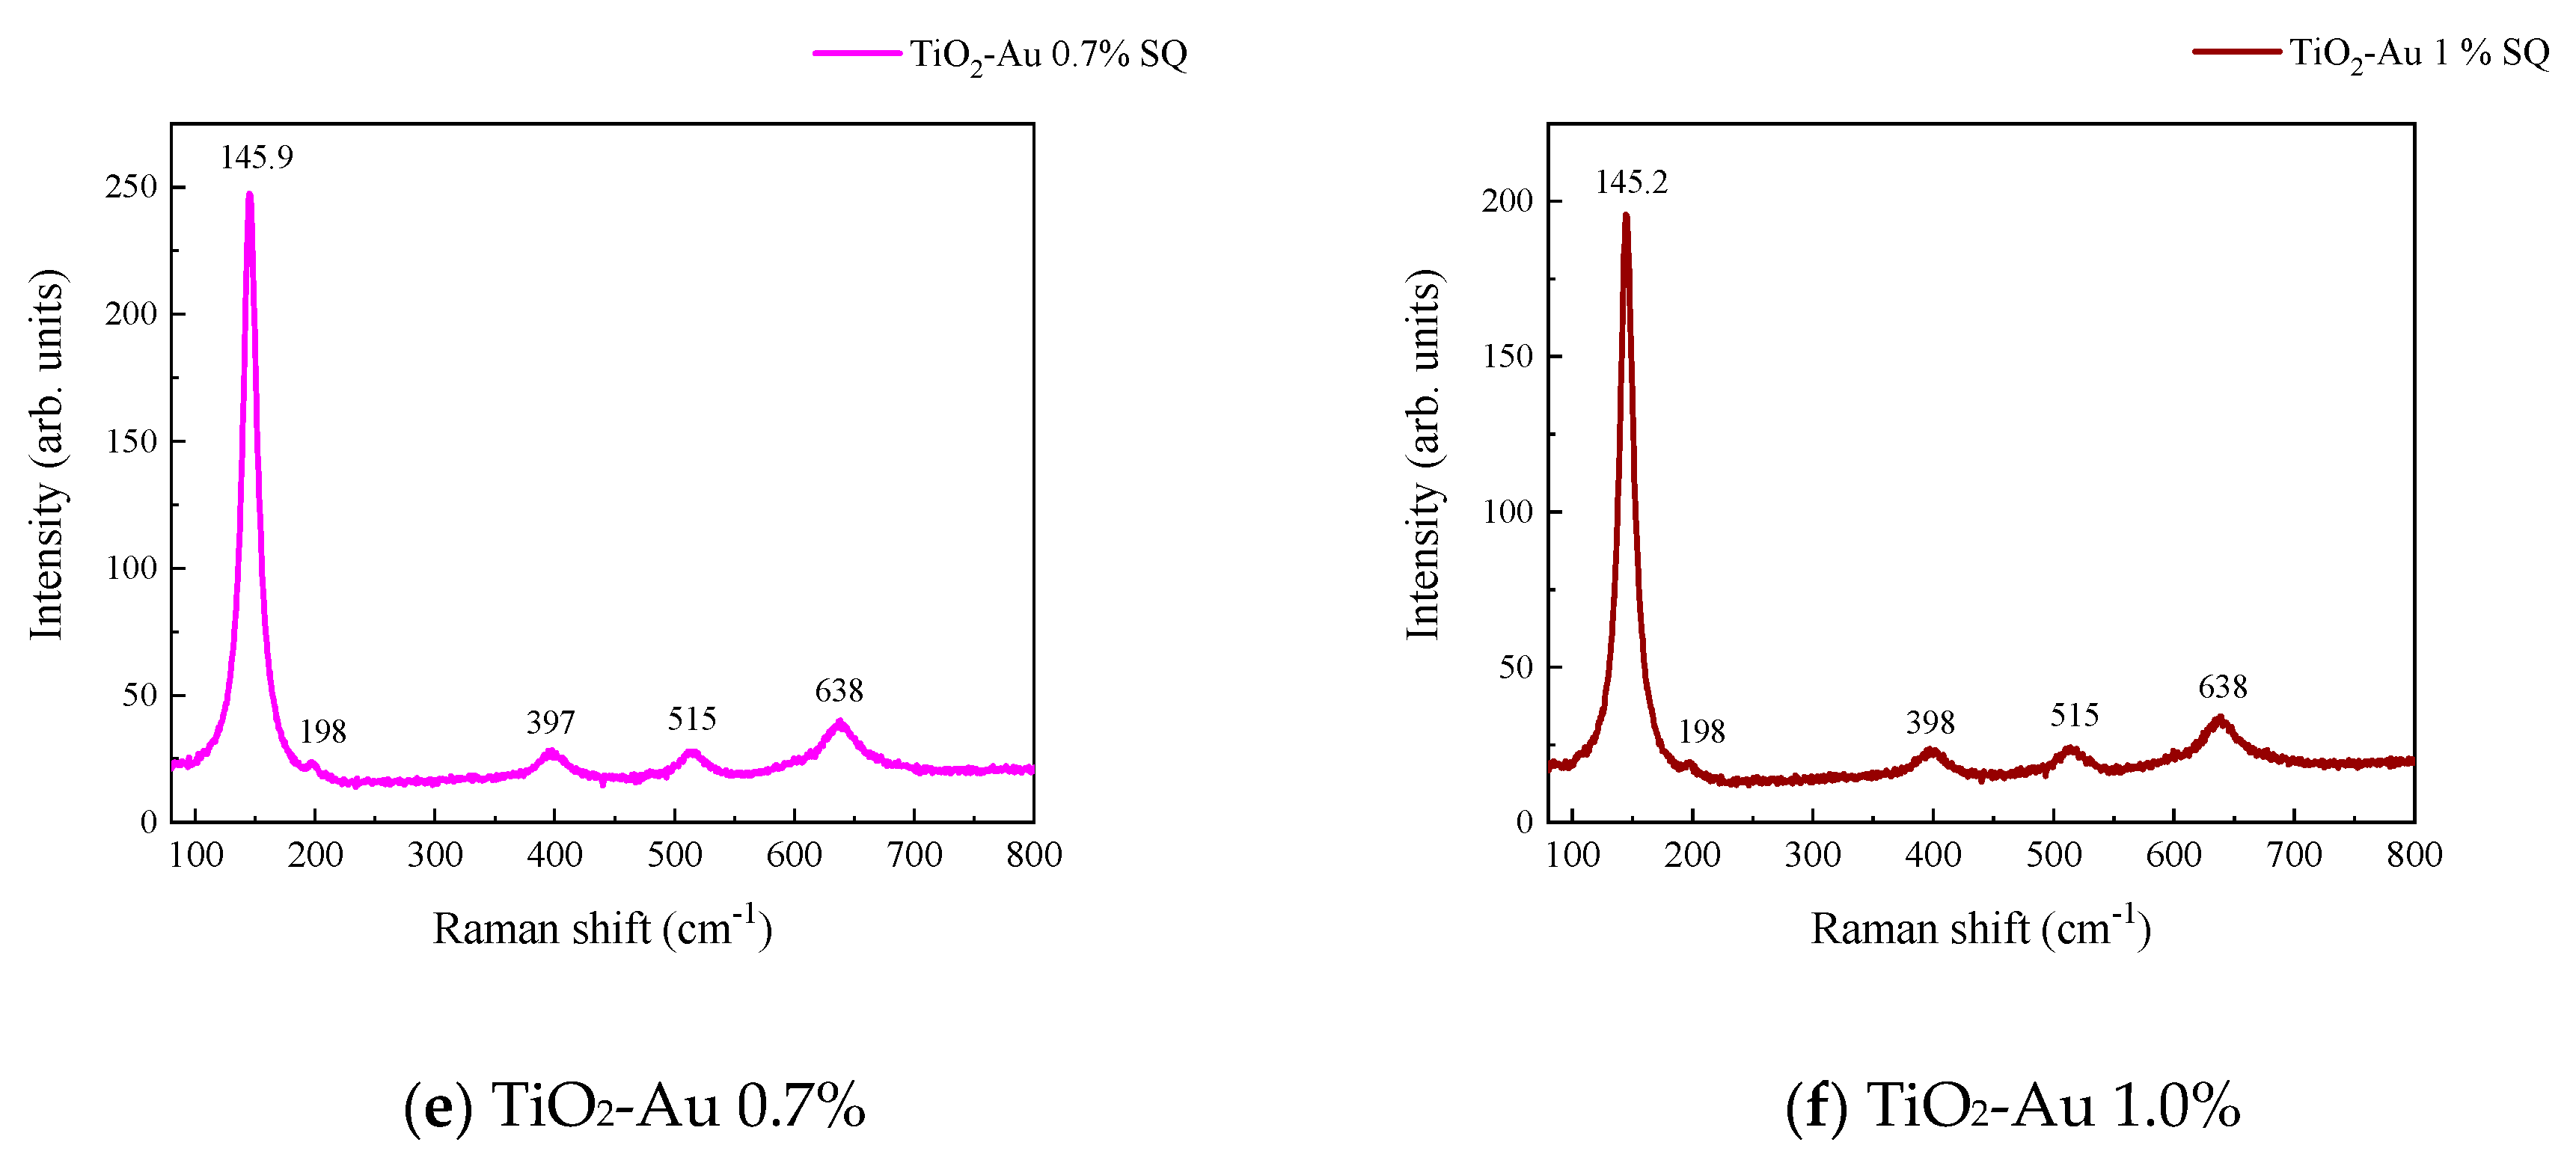
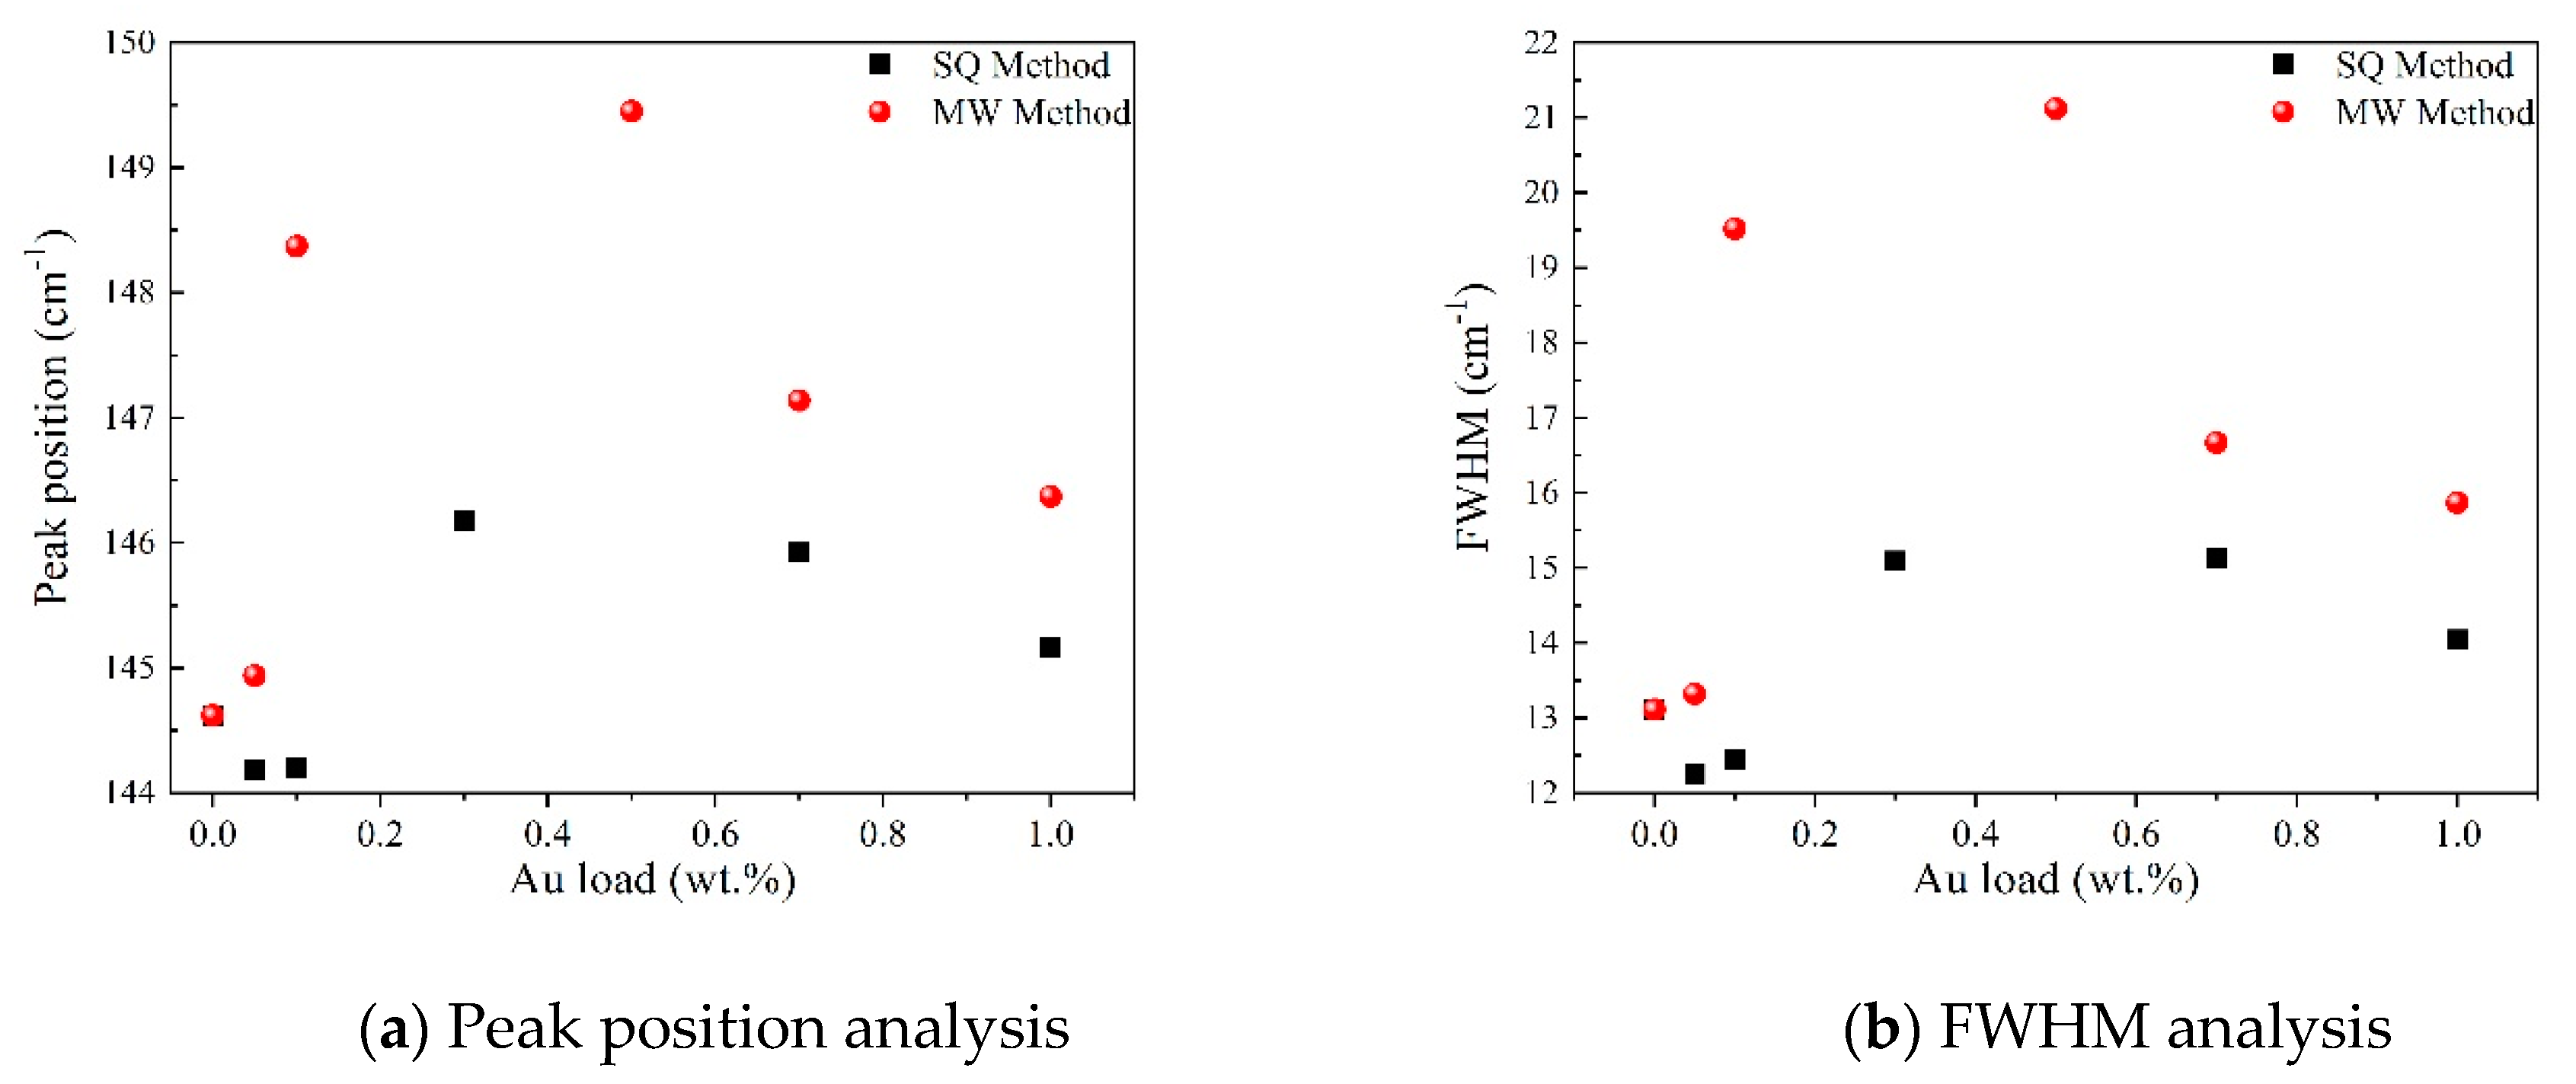
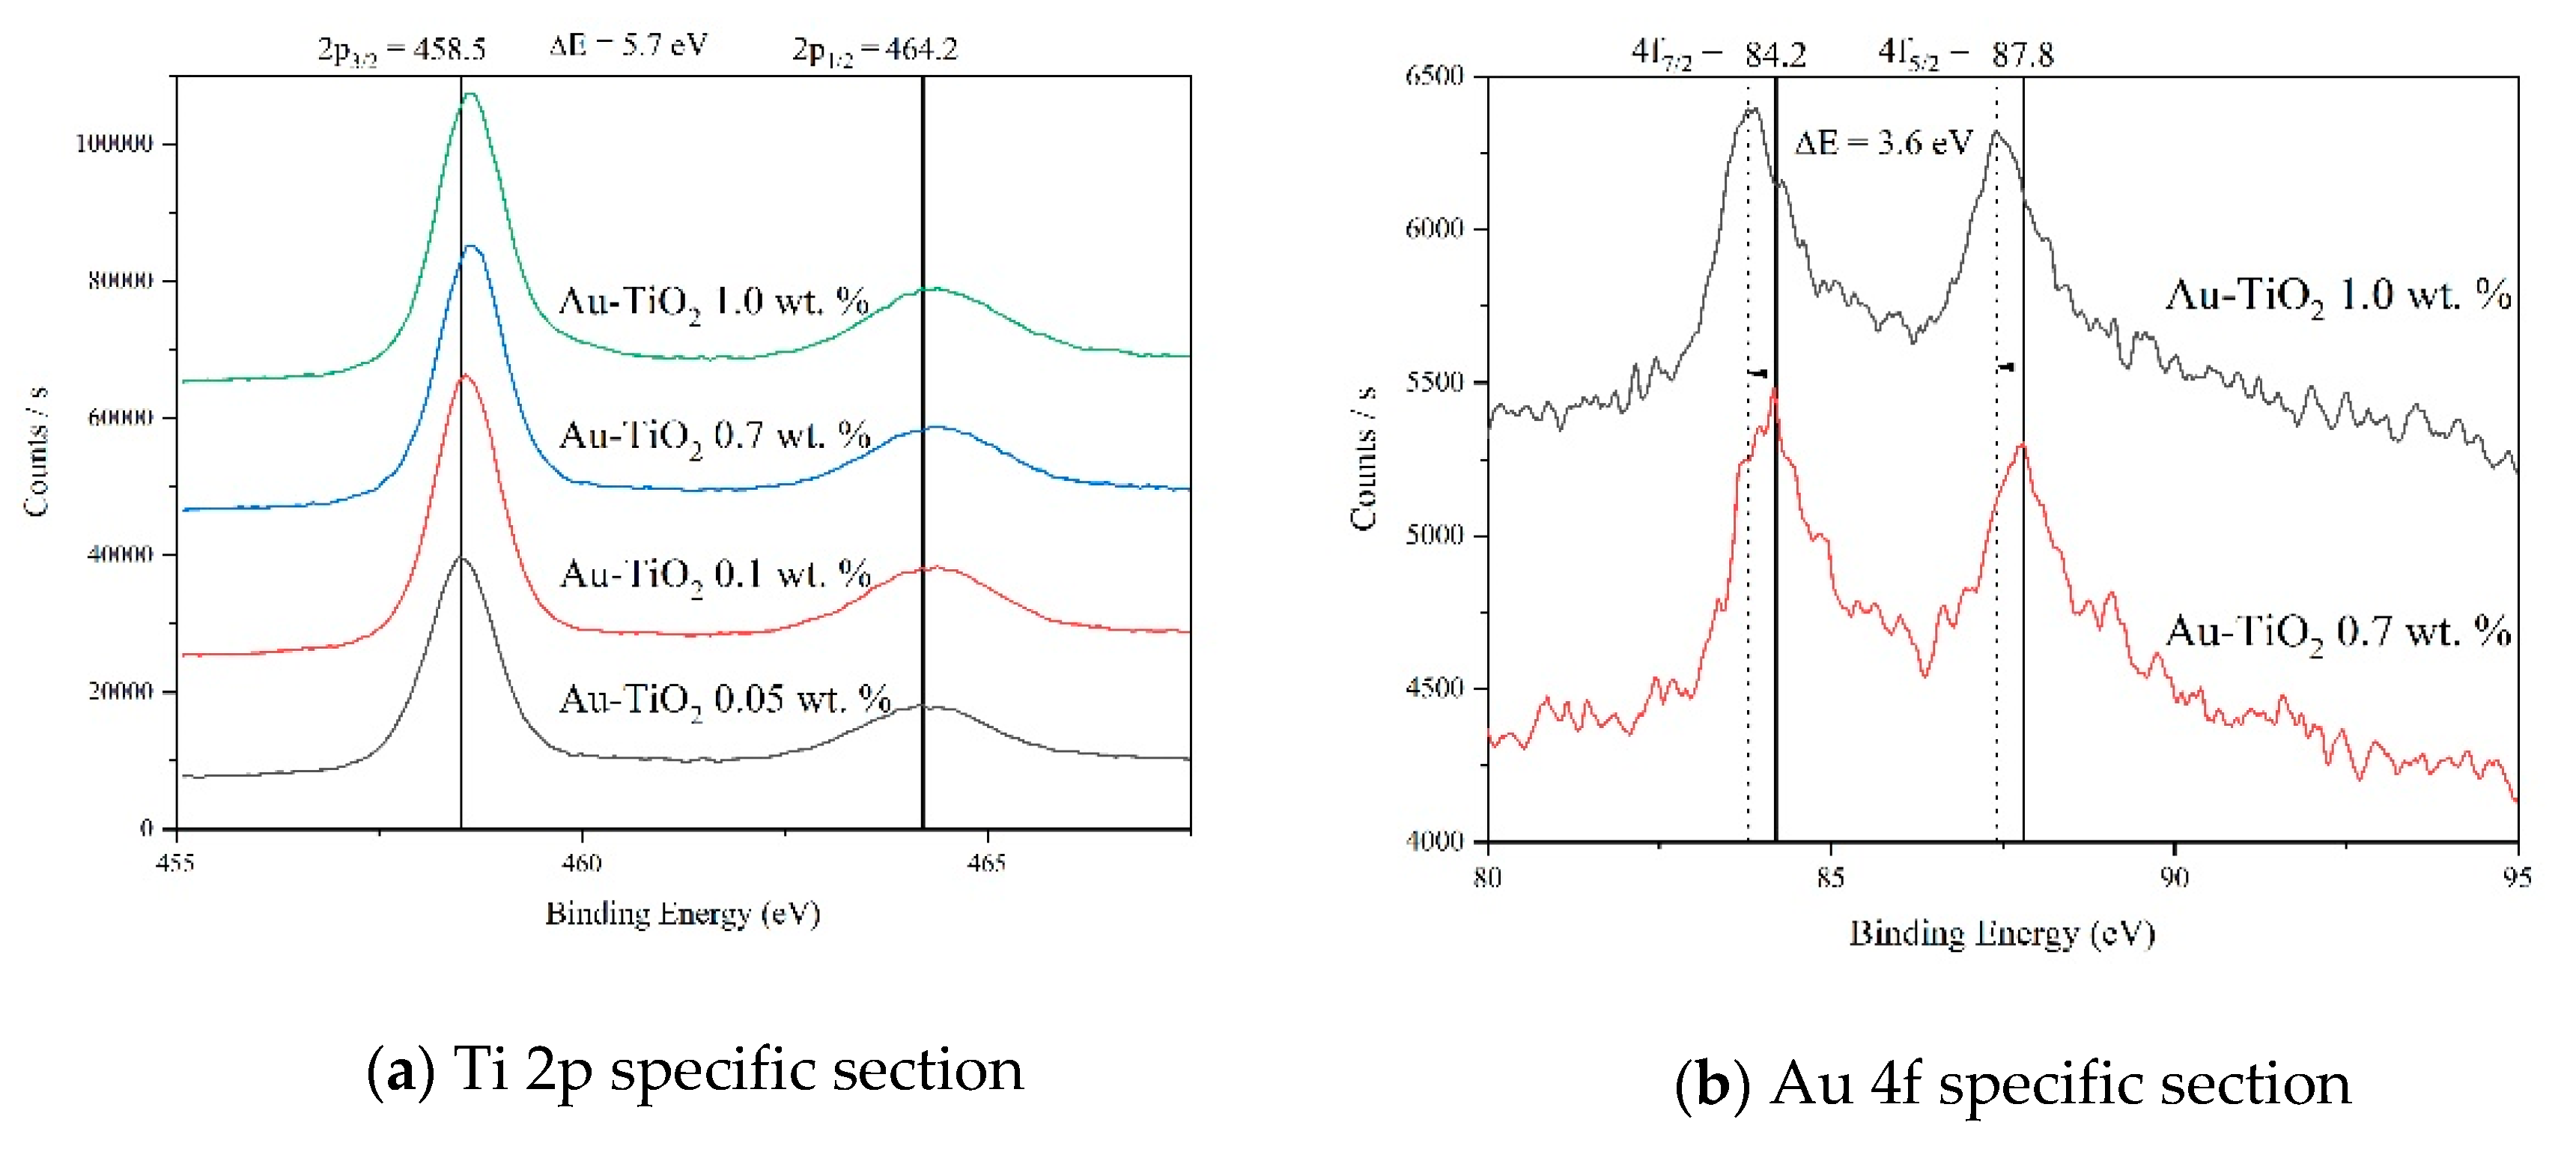
2.1. Structural Characterization of the Photocatalysts

In order to evaluate the morphology of the synthesized materials and assess the differences in the synthesis methods, SEM analysis was carried out. As can be seen in Figure 1a,b, several differences between the MW and SQ methods of synthesis can be appreciated. Firstly, among SQ method-synthesized materials (Figure 1b), a large agglomeration of small spherical particles with pores evenly distributed on the surface is observed in all samples.
It is worth noting that no important changes in the morphology of the materials are observed as the load of gold changes, however, changes due to the synthesis method—SQ or MW—are clearly observed. Figure 1a shows that MW method results in particles of irregular geometry and bigger sizes than samples produced by the SQ method. Also, the powders obtained by the MW method show smooth surfaces with low porosity. On the other side, the powders synthesized by SQ method seems to have greater surface area, which could favor its catalytic properties.
XRD analysis was carried out to determine the crystal phases and crystallite size of Au-TiO2 photocatalysts synthesized by the MW and SQ methods. Figure 2 shows a comparison of the XRD patterns obtained in each case.
Crystal phase identification was done by comparison using the powder diffraction file (PDF) data bank supplied by the International Centre for Diffraction Data (ICDD), comparing against anatase (PDF 01-070-6826), rutile (PDF 01-071-0650) and metallic gold (PDF 00-004-0784). In general terms, all diffraction patterns show diffraction peaks at 2θ = 25.3°, 37.9°, 48.1°, 53.9°, 55.1°, 62.8°, 70.2° and 75.3° for all the powders synthesized by the SQ and MW methods. These peaks are assigned unambiguously to the anatase phase of TiO2. It is worth mentioning that no diffraction peaks from, rutile or metallic gold were detected, indicating the obtention of a pure phase; the absence of signals due to gold could be attributed to an expected dilution effect because of the very low amount of Au used in the synthesis process; therefore, to analyze the small amounts of gold, further analysis such as XPS is needed.
Besides the polycrystalline nature of the synthesized powders, broader peaks in the XRD patterns corresponding to samples produced by the MW method are observed. This result suggests a lower crystallite size and strain in these samples. The crystallite size was determined by using the Scherrer equation D = (kλ/βcosθ), where D is the mean crystallite size, λ is the wavelength of the radiation (1.54056 Å for CuKα radiation), k is a dimensionless number of the order of unity, known as the Scherrer constant, whose value depends on the shape of the crystal, the size distribution and how the width is determined, β is the peak full width at half-maximum (FWHM) intensity and θ is the peak position in radians [30,31]. For MW samples the crystallite size decreases from 12.3 nm to 6.7 nm as the gold load increases, whereas for samples produced by the SQ method the crystallite size remains constant at around 10.6 nm. A more in-depth analysis of the XRD and crystallite size of the synthesized materials was already reported by the authors [32].
Figure 3 and Figure 4 show the Raman spectra of the Au-TiO2 samples synthesized by the MW and SQ methods, respectively. All spectra are characterized by Raman peaks around 144, 197, 399, 515, and 639 cm−1 which correspond unambiguously to the anatase phase of TiO2 [33,34,35]. The three bands at 147, 197, and 639 cm−1 are assigned to the Eg modes and the band at 399 cm−1 to the B1g mode. The band at 515 cm−1 is a doublet of the A1g and B1g modes [33]. From these spectra it is clear that no matter the synthesis method only the anatase phase is obtained.
In order to gain insight about the effect of the gold load in the vibrational features of the different samples, a more detailed analysis of the Raman peak at 144 cm−1 was performed. For such a purpose, the main Eg mode in each spectrum was fitted using Voigt functions and the obtained results, concerning the peak position and FWHM as a function of the Au load are shown in Figure 5a,b, respectively. A blue shift from 144.6 to 149.4 cm−1 is observed for samples synthesized by the MW method, whereas a blue shift from 144.2 to 146.2 cm−1 is seen for samples synthesized by the SQ method for Au loads lower than 0.5 wt.%. This can be due to distortion of the TiO2 lattice due to the fact that Au atoms are occupying Ti sites causing strain. This is confirmed by the data presented in Figure 5b in which an increase in the FWHM from 13.3 to 21.1 cm−1 is observed for samples synthesized by the MW method, whereas FWHM varies from 12.2 to 15.1 cm−1 for samples synthesized by the SQ method for Au loads lower than 0.3 wt.%. For higher Au loads a red shift from 149.5 to 146.4 cm−1 and from 146.2 to 145.1 cm−1 are now observed (Figure 5a). This red shift could be attributed to an improvement of the crystallinity of the material which is again confirmed by the decrease of the FWHM as is seen in Figure 5b. From these two figures, it is clear that the Raman features are very sensitive to Au content and provide indirect evidence of the presence of Au in these samples producing structural changes.
The atomic contents of the samples synthesized by the SQ and MW methods, determined from XPS measurements are listed in Table 1 and Table 2. The gold atomic content determined from the XPS analysis was converted to weight content and compared to the nominal content added in the synthesis step. It can be observed that the nominal content of gold is larger in all cases no matter the synthesis method used.
The XPS spectra (not shown) of the Au-TiO2 samples synthesized by the SQ method revealed the presence of oxygen at 530 eV, titanium at 458 eV, and gold at 87 eV in the photocatalysts [36,37,38,39].
Figure 6a shows the high-resolution XPS spectra of the Ti 2p region for samples with different Au loads. All spectra show a doublet at 464.2 eV and 458.5 eV assigned to Ti 2p1/2 and Ti 2p3/2, respectively, with a binding energy difference of 5.7 eV. These signals are attributed to Ti4+ of the TiO2 in its anatase phase [40,41]. When the load of Au in the TiO2 is increased, a shift towards higher binding energies, indicating a change in the chemical environment of the Ti due to the Au incorporation is observed [42,43], which can lead us to assume a chemical interaction of the gold metallic particlew in the TiO2 matrix, as can be seen in the results obtained by Raman spectroscopy (Figure 3 and Figure 4) and reported by Hernández et al. [32].
Also, no formation of Ti3+ was detected in the present synthesis [44]. In Figure 6b, the XPS high resolution spectra corresponding to the 4f gold region are presented. The doublet at 84.2 and 87.7 eV corresponds to the 4f7/2 and the 4f5/2 gold core level with a binding energy difference of 3.6 eV [45,46,47], it is important to notice that below 0.3 wt.% of Au load, gold was not detected. Also, a shift of these peaks towards lower energies, as the gold load increases is observed indicating negative charges on the surface of TiO2 [32,48].

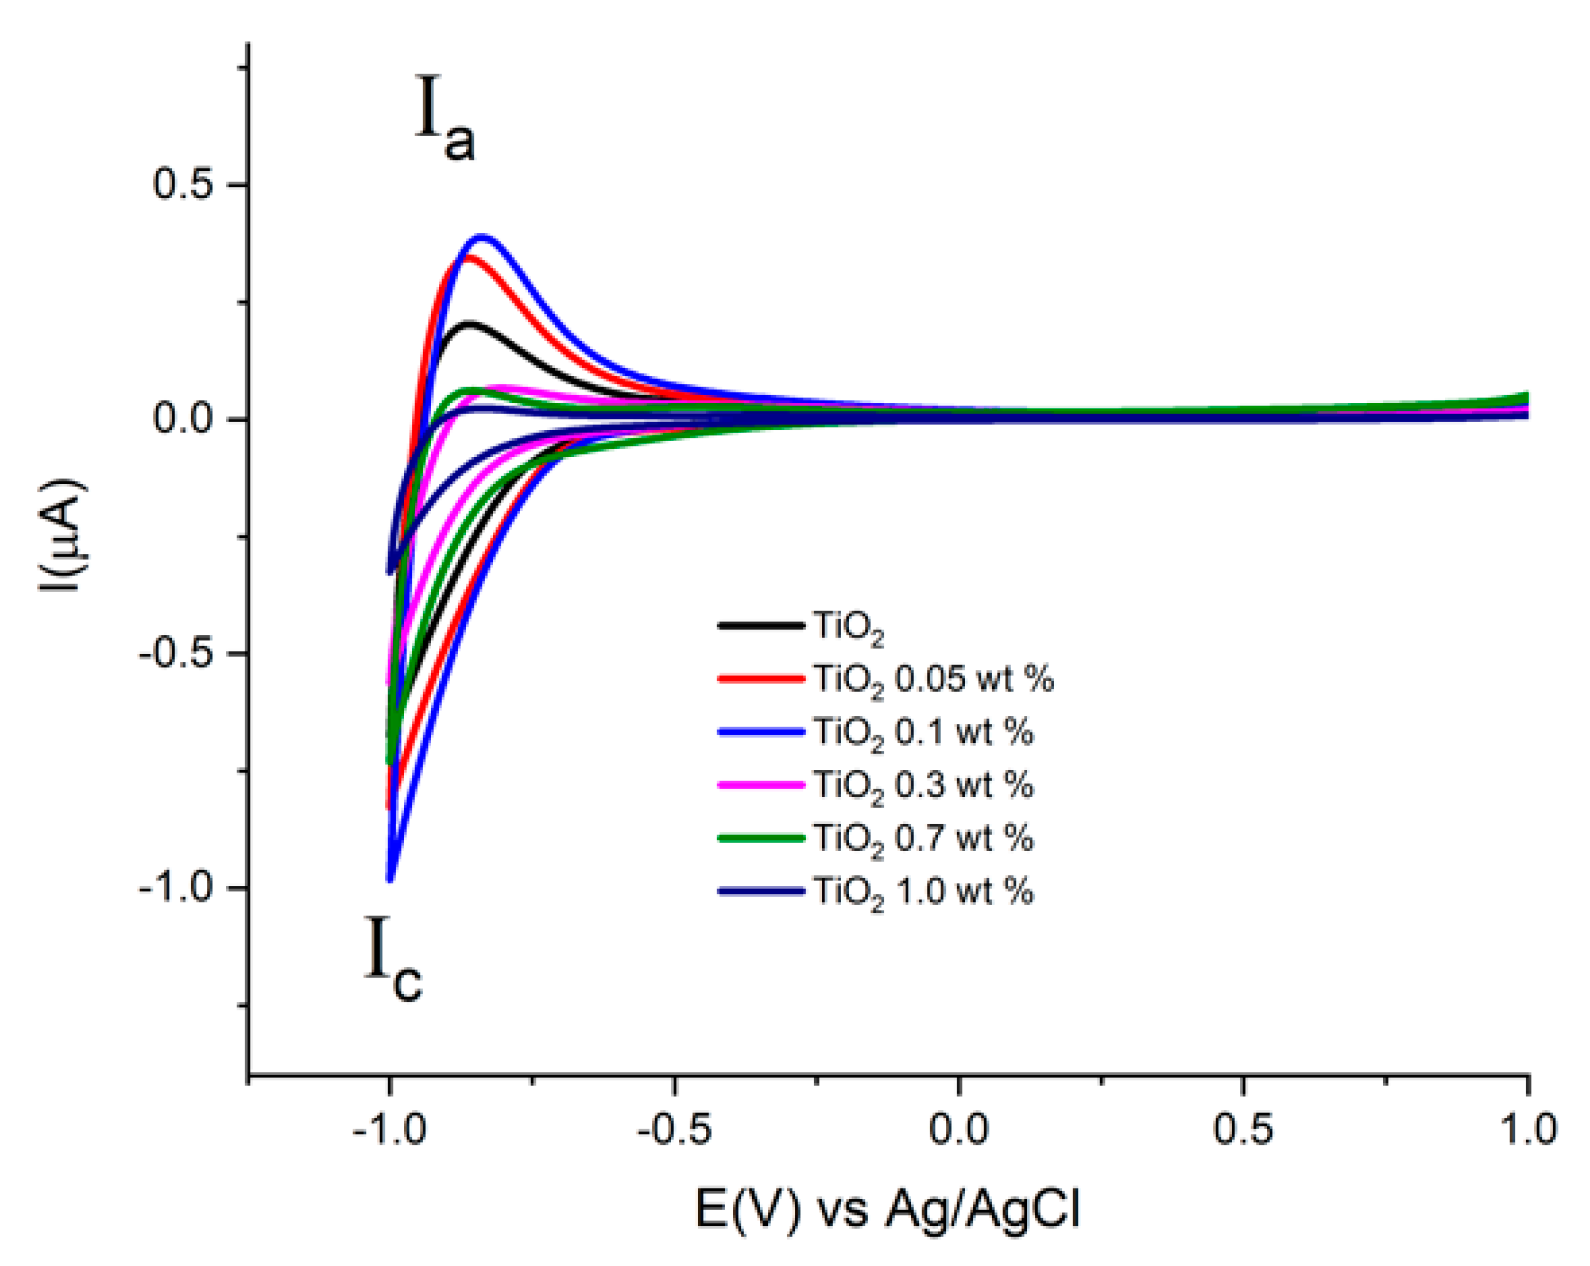
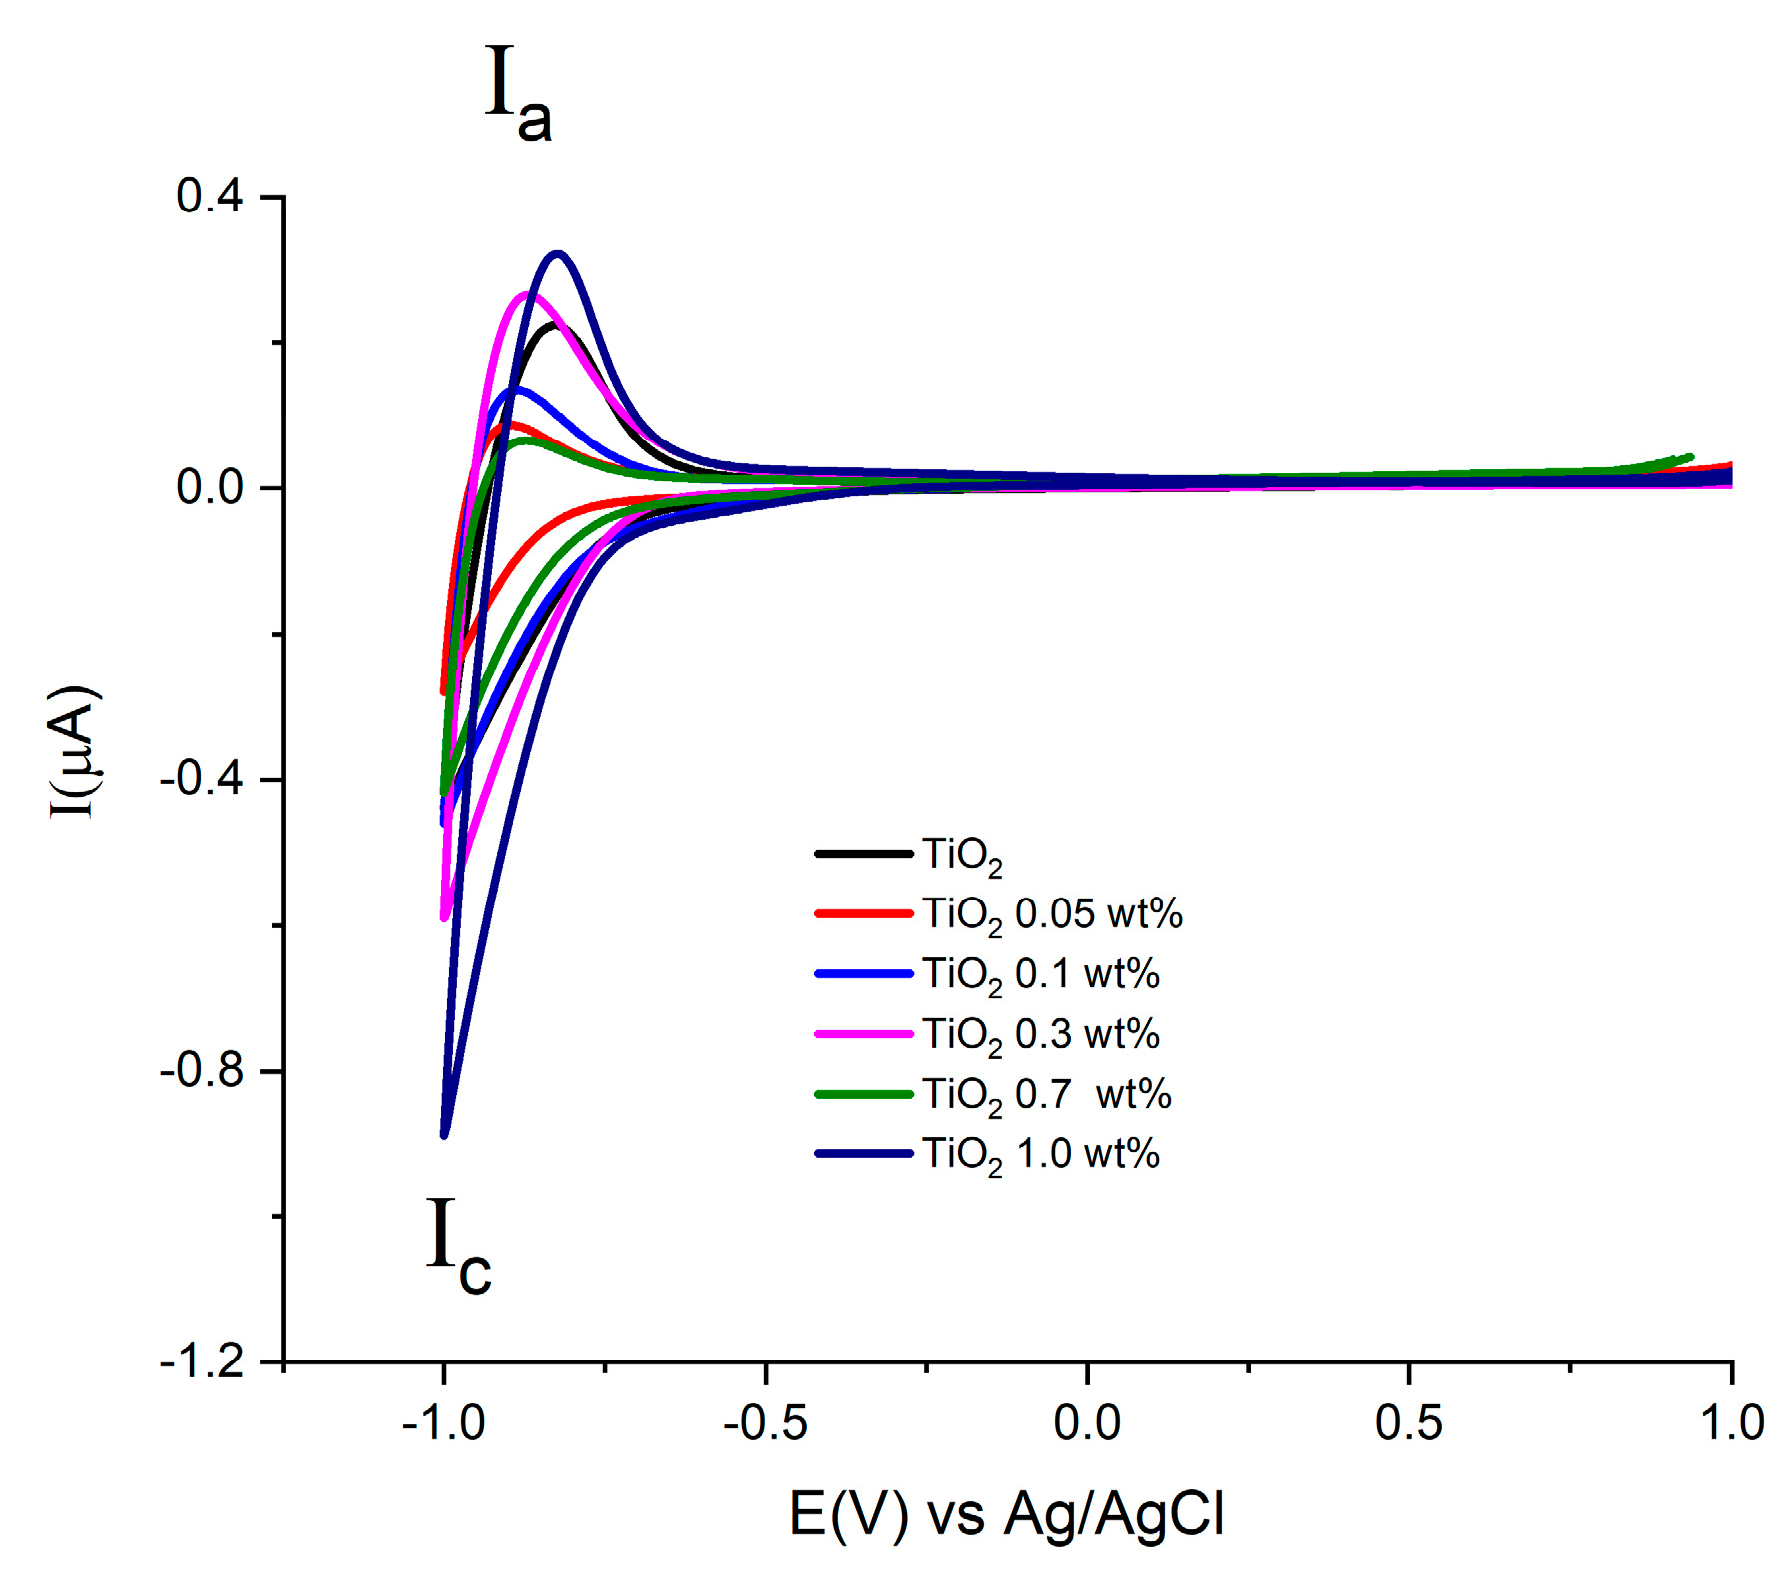
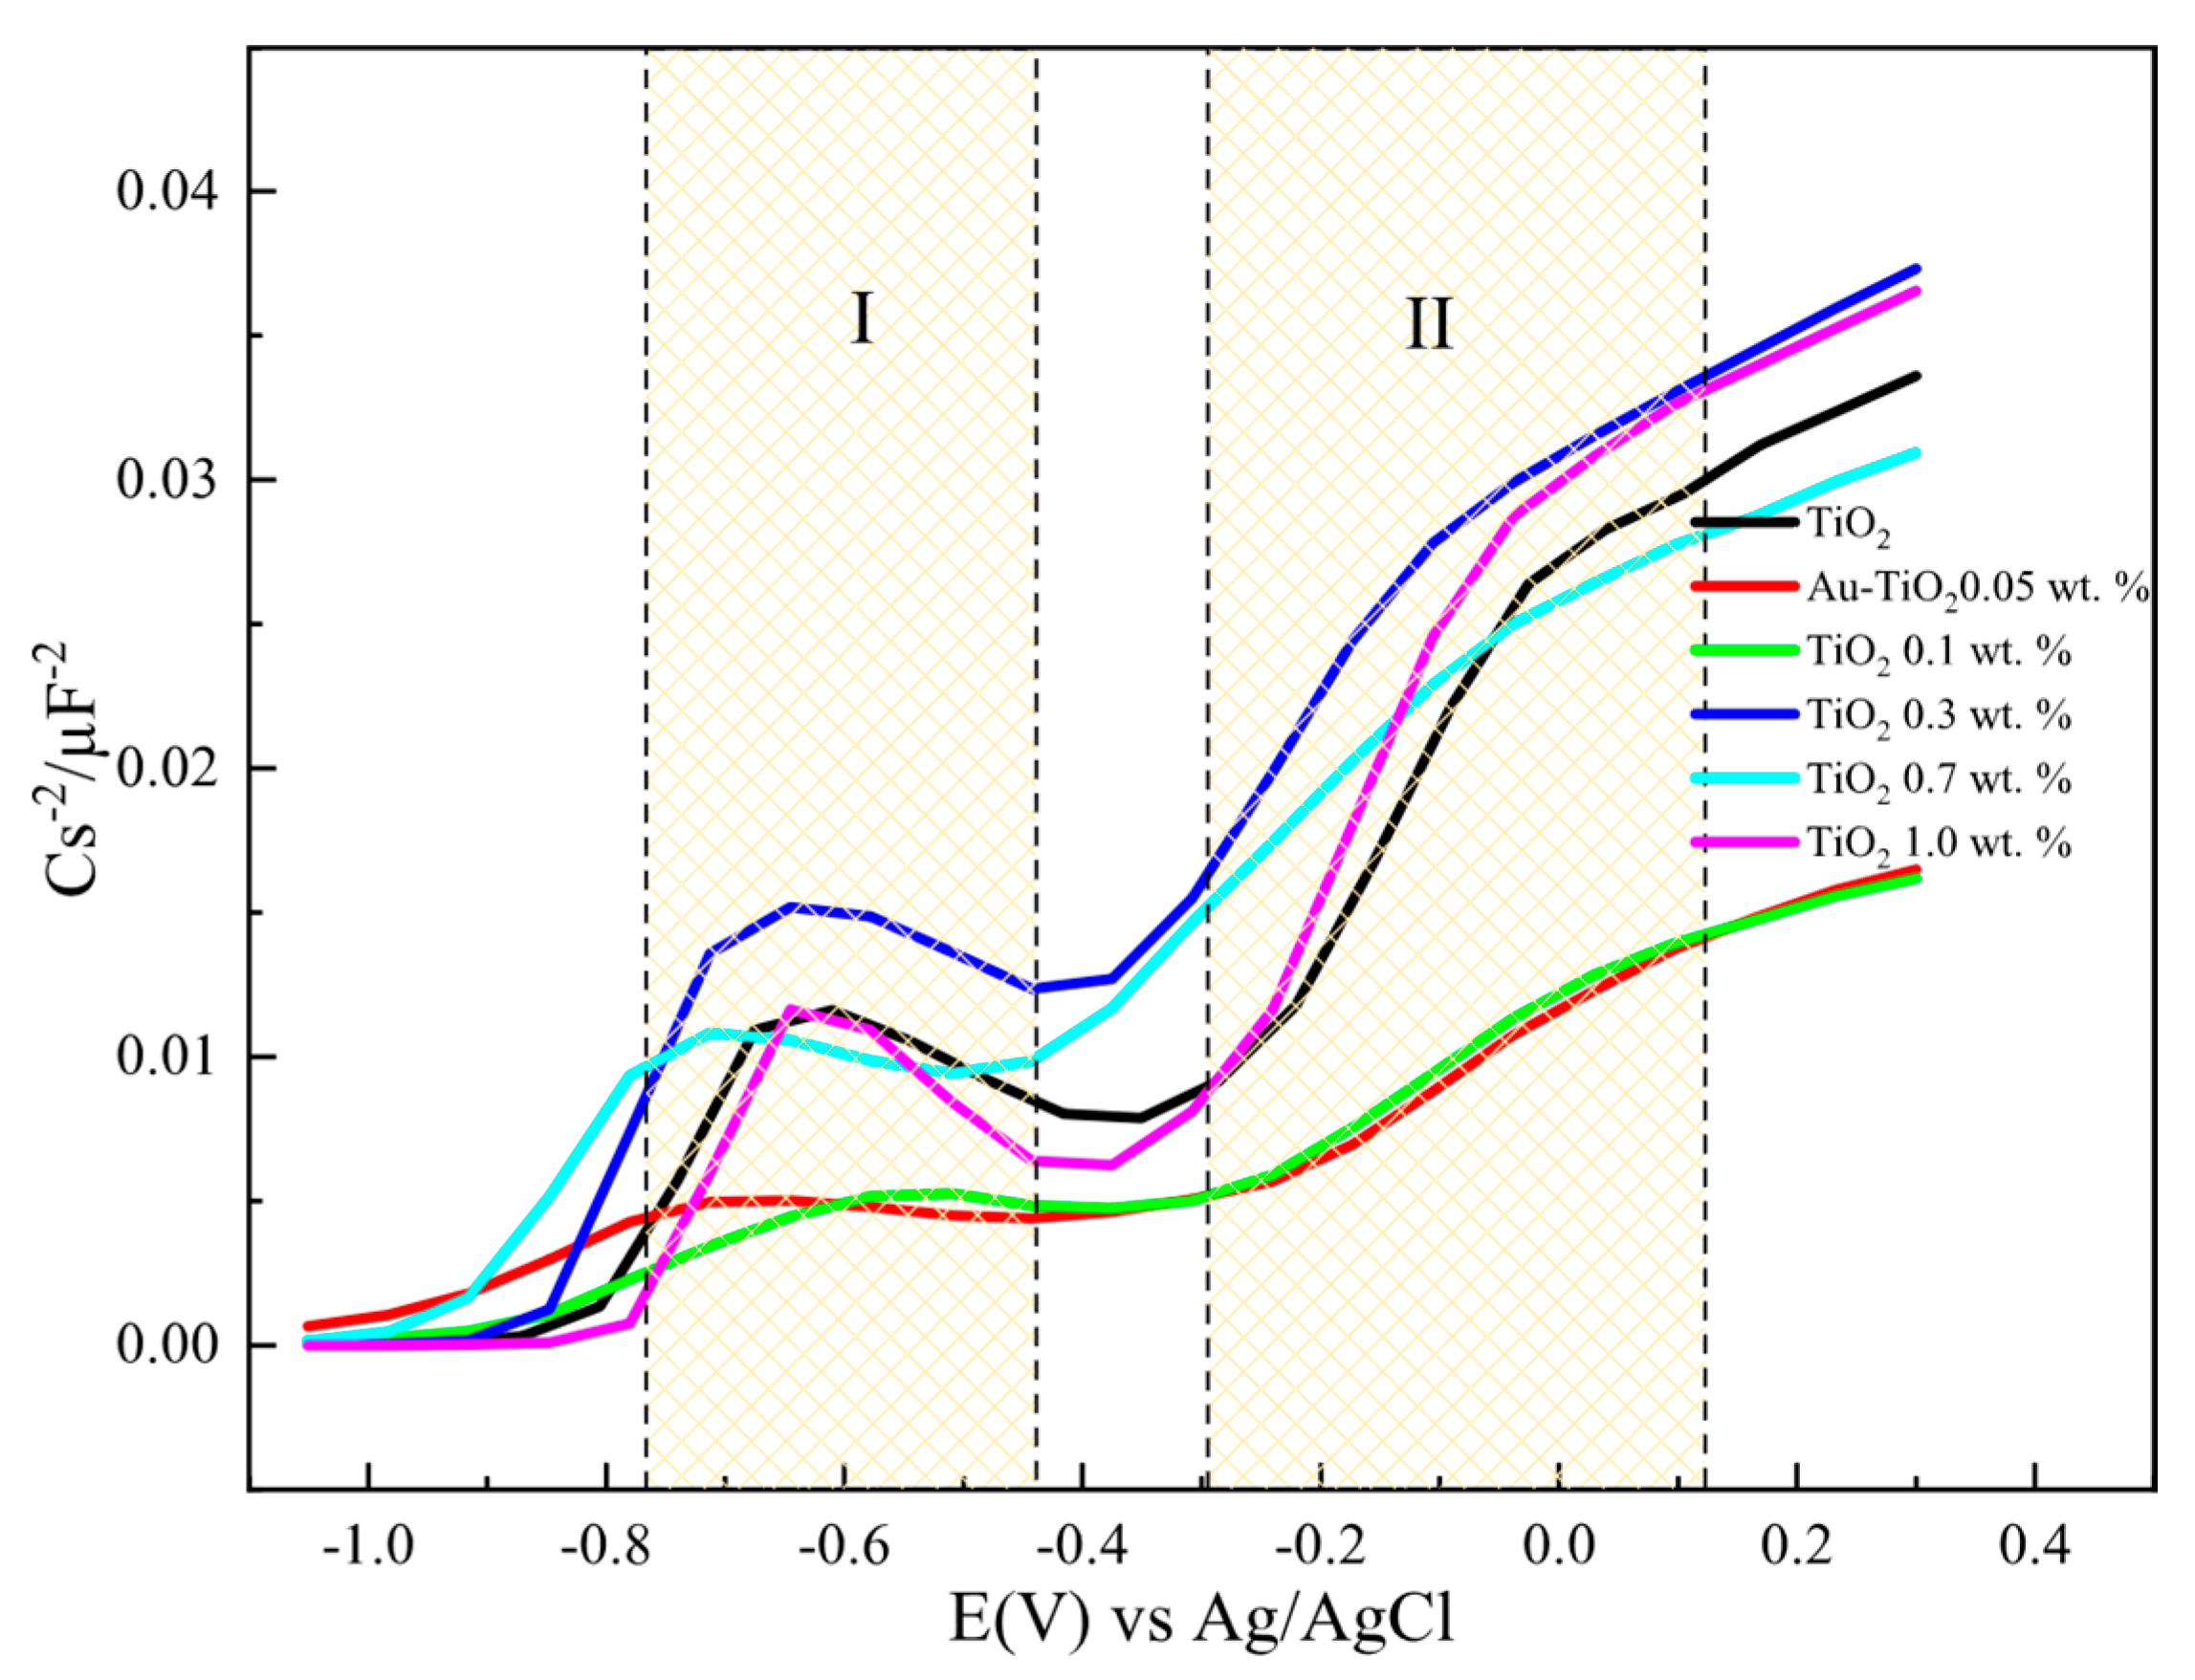
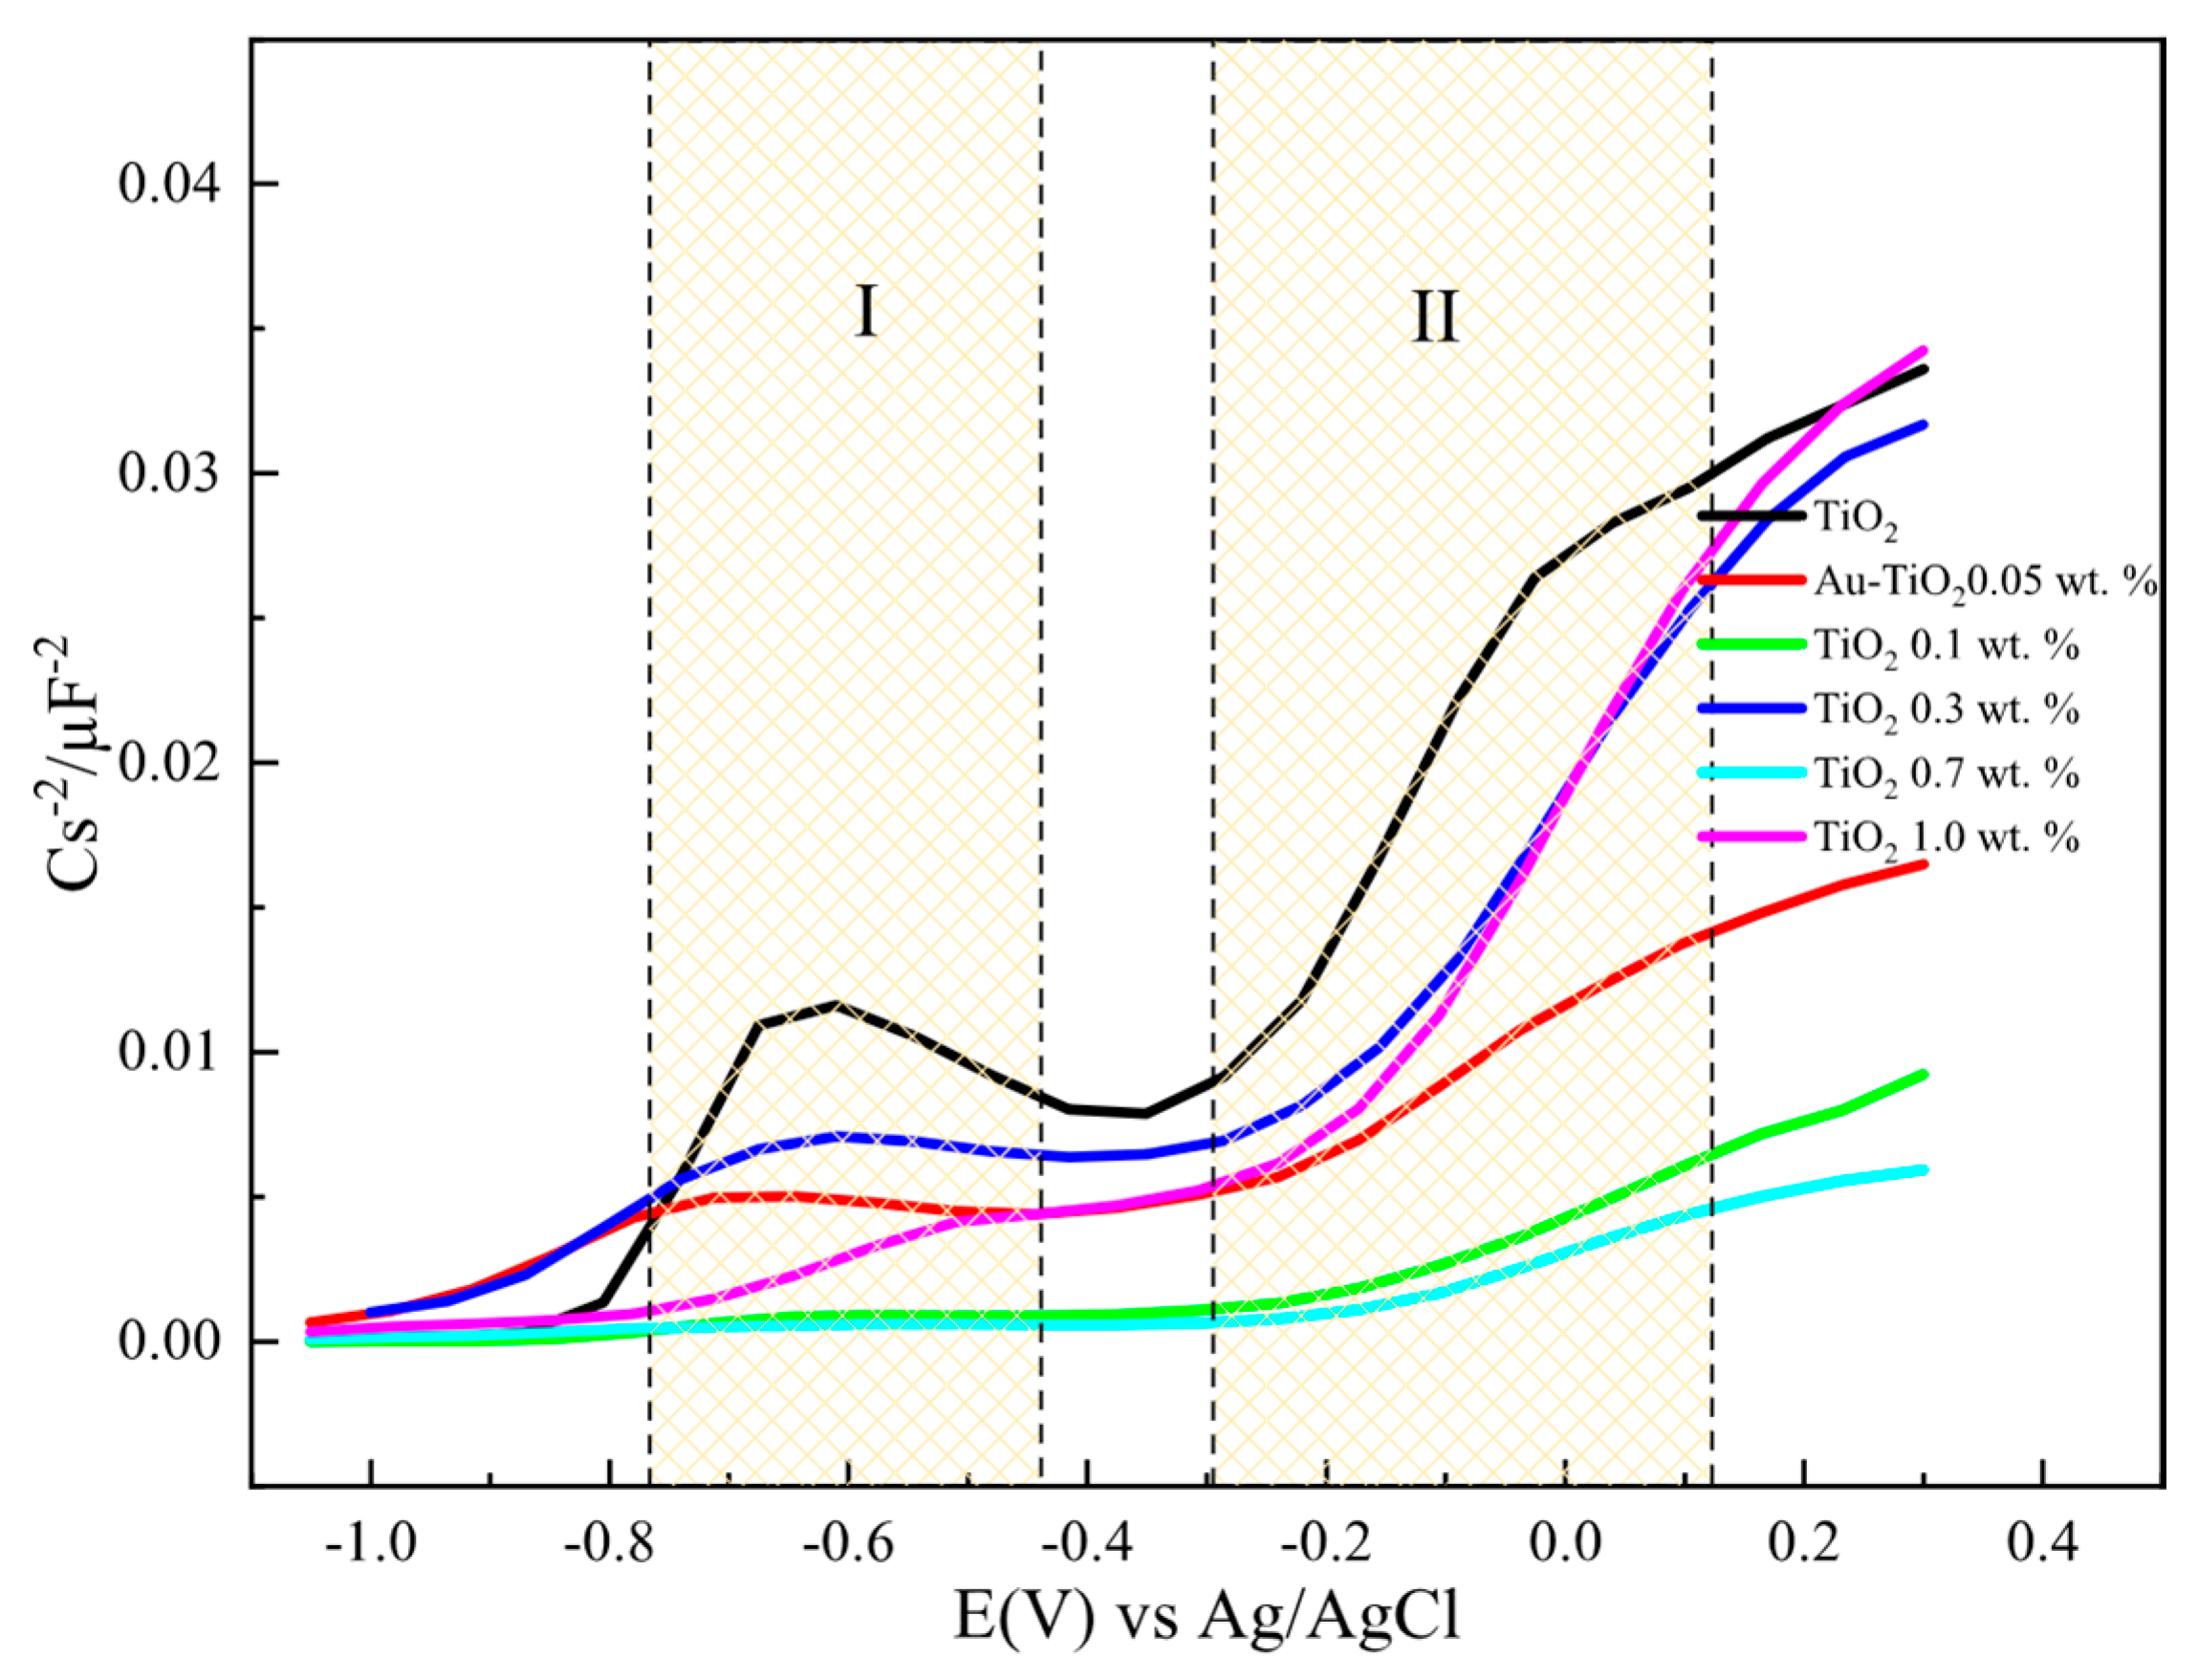
2.2. Cyclic Voltammetric Response and Mott-Schottky Analysis

Figure 7 shows cyclic voltammograms acquired at a scan rate of 0.1 Vs−1, using the prepared electrodes with Au-TiO2 synthesized by the SQ method in the presence of 0.1 M NaOH (pH 12.9). In the complete scan one reduction (Ic) signal and one oxidation (Ia) signal are observed, attributed respectively to the reduction and oxidation of Ti(IV) sites in the TiO2 and the conduction-band filling accompanied by proton insertion [49,50]. This process at the surface of TiO2 is described by the following chemical Equation (1):
Ti4+ + e + H+(aq) = Ti3+ + H+(ads)
For the TiO2 synthesized by both methods, (see Figure 7 and Figure 8), similar onset potentials (Eon) values are observed, ranging from −0.630 and −0.610 V vs. Ag/AgCl. In the other hand, the oxidation process Ia shows differences in current values in the presence of Au in comparison with pure TiO2 materials.
This fact can be associated with the substitution conduction-band of sites Ti(IV) by the Au. This study allows us to find the potential range for semiconductor properties by means of potential step electrochemical impedance spectroscopy, Mott-Schottky analysis.
Figure 9 and Figure 10 show the 1/C2 vs. potential plots for electrodes made with Au-TiO2 synthesized by the MW and SQ methods, respectively. In both cases, a positive slope characteristic of n-type semiconductors according to the Mott-Schottky model is observed. The density of donors, Nd, and the flat-band potential (Efb) can be calculated, using Equation (2):
1 C S C 2 = 2 N A N d F ε ε 0 [ E E f b R T F ]
where NA is the Avogadro’s number (6.023 × 10²³ mol−1), F is the Faraday constant (9.65 × 10⁴ Cmol−1), ε0 is the vacuum permittivity (8.8542 × 10⁻¹⁴ Fcm−1), ε is the dielectric constant of the semiconductor, R is the gas constant (8.314 JK−1mol−1), T is the absolute temperature (298 K), and E (V) is the applied potential, The Mott-Schottky diagrams for the different electrodes with Au-TiO2 synthesized by SQ and MW methods were obtained using a frequency value of 1002 kHz, where a type of a capacitance response is observed.
Figure 10 shows Mott-Schottky plots for electrodes with Au-TiO2 synthesized by the SQ method. Two regions (labeled as I and II) can be observed where the different density of donors, Nd, and flat-band potentials (Efb) can be calculated. This behavior is consistent with a typical hetero-phase junction of anatase and brookite with oxygen vacancies [51,52]. According to that Nd and Efb for the mixture is calculated and presented in Table 3.
It should be highlighted that as the amount of Au is increased the flat-band potential takes more negative values for the anatase and brookite phases with no significant changes in Nd values. The same behavior and tendency are observed for Au-TiO2 synthesized by the MW method. A summary of all values is presented in Table 3.

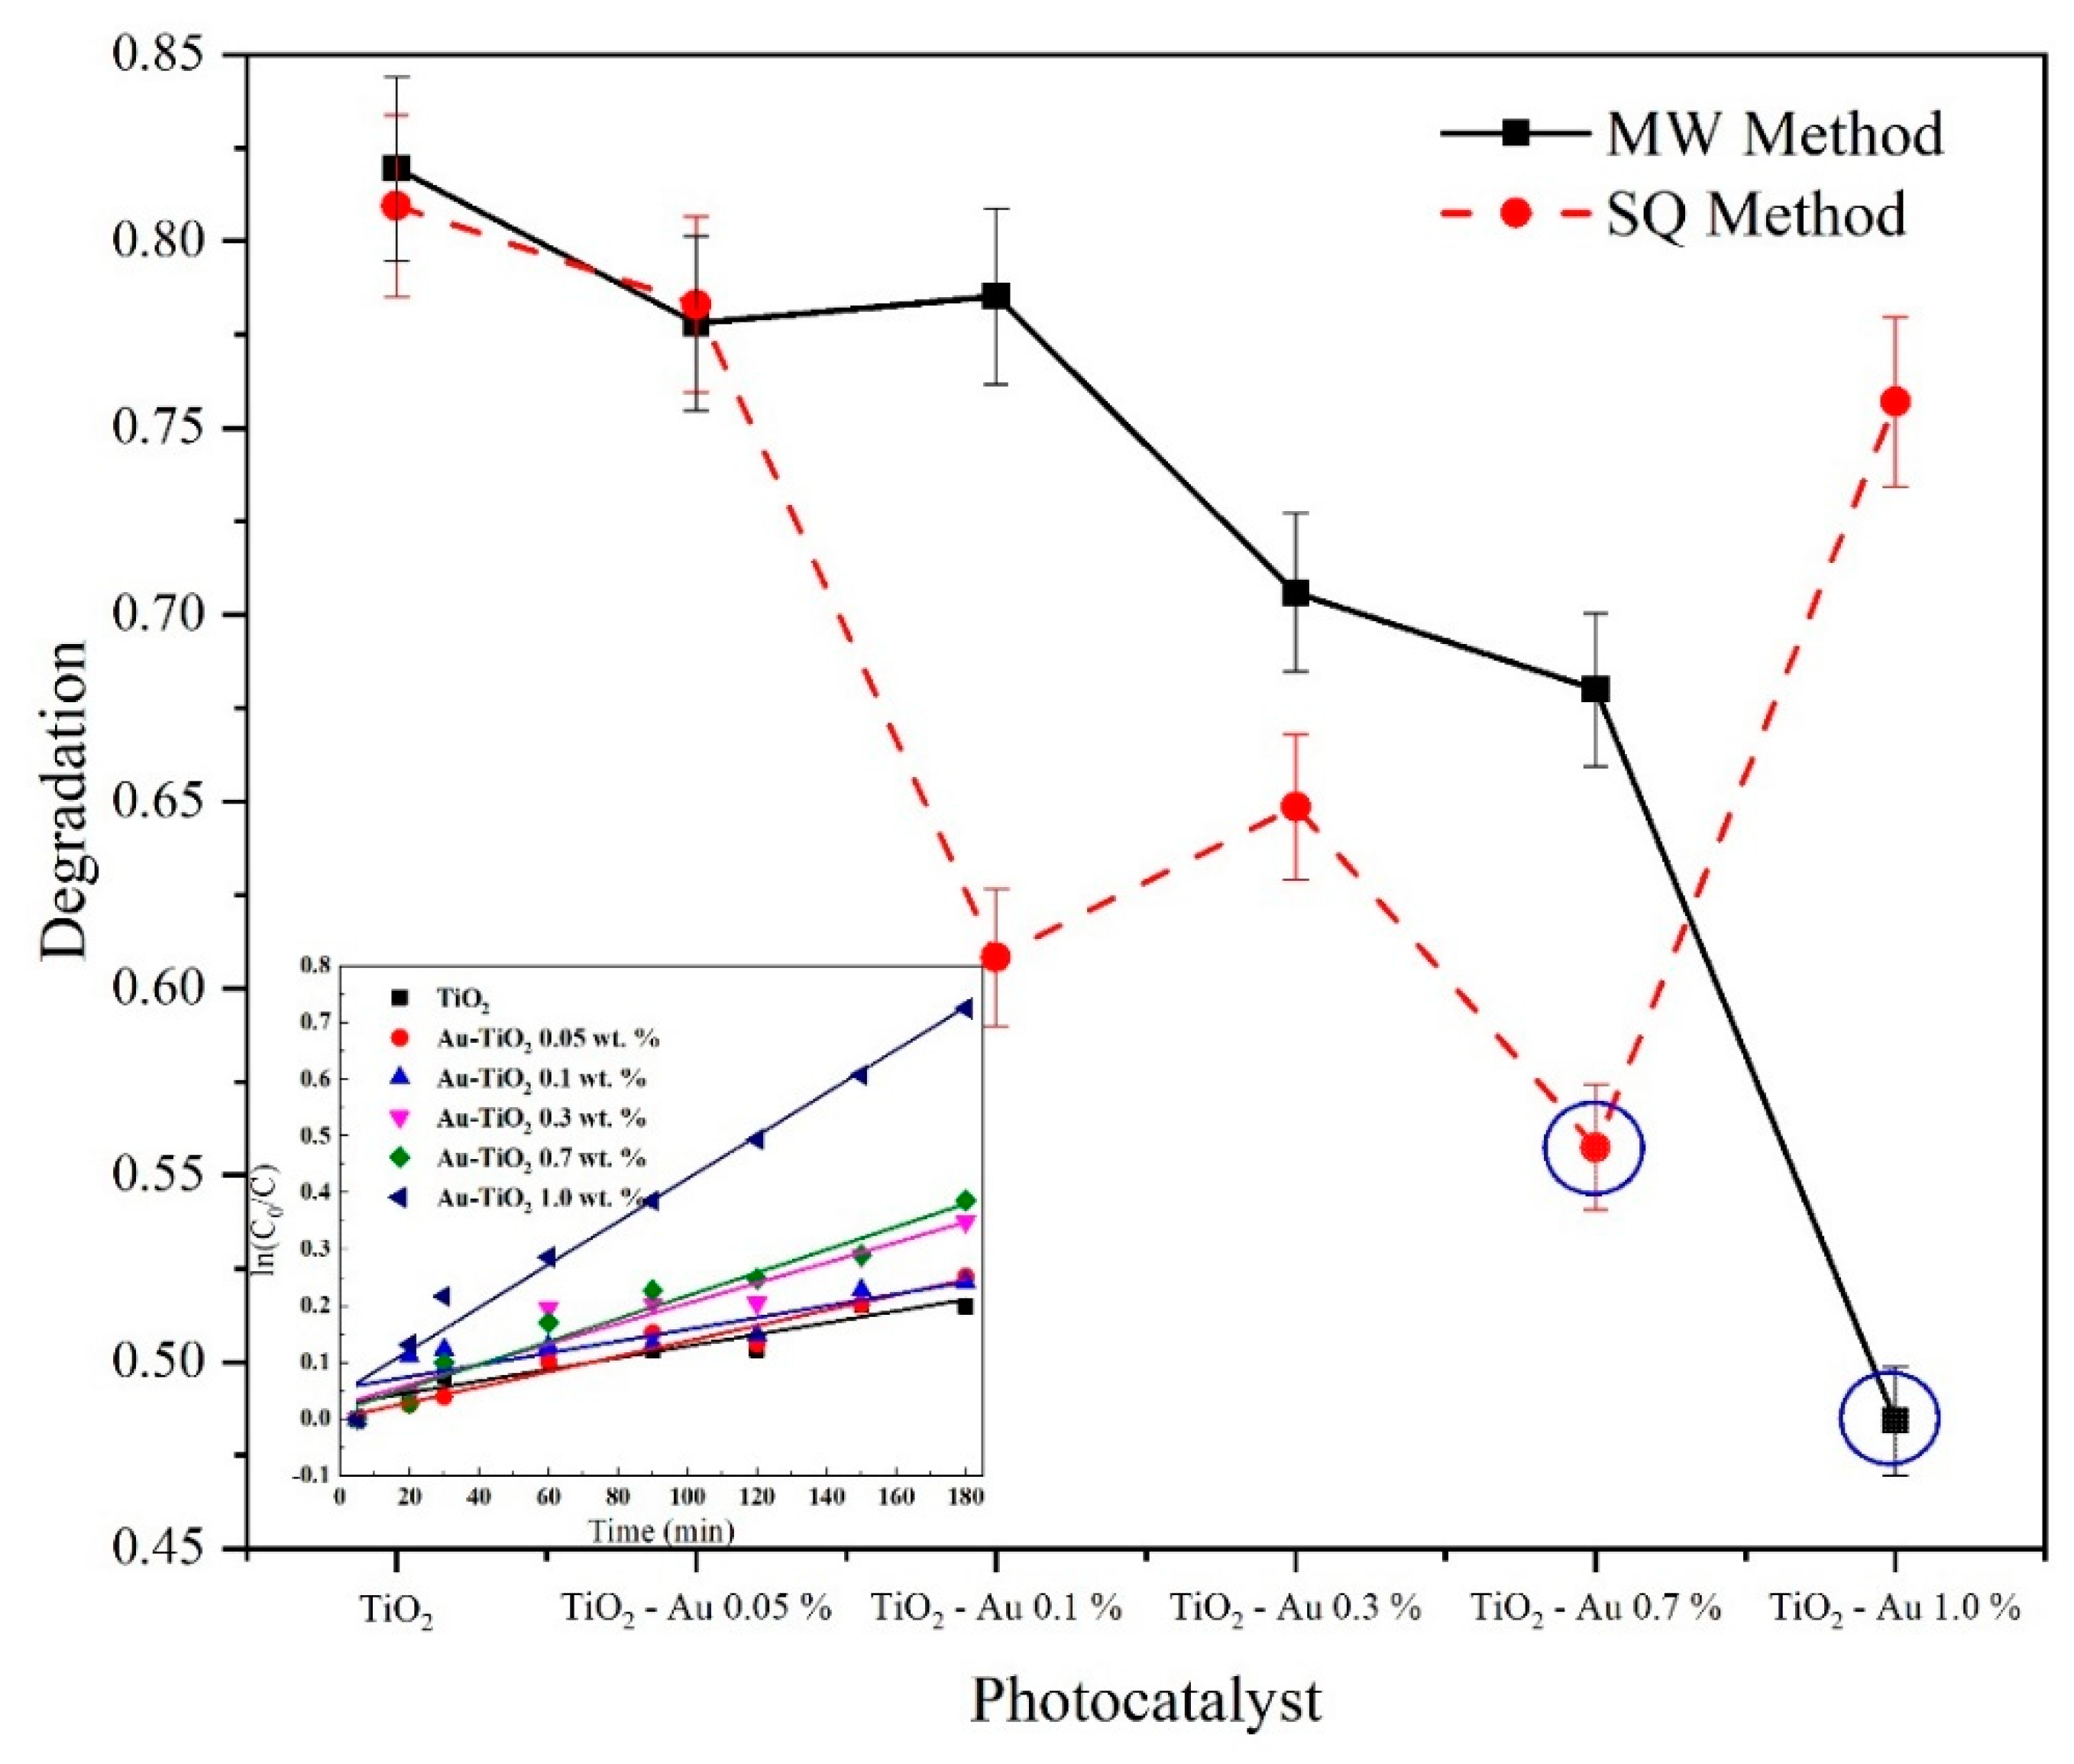
2.3. Photocatalytic Tests

The photocatalytic performance of the synthesized photocatalysts was assessed by the treatment of 100 mL of a solution containing 30 mg L−1 of the drug paracetamol (PAM) as model pollutant at pH 3.0 and irradiated with a 365 nm UV lamp (21 W). Figure 11 shows the maximum degradation obtained after 3 h of reaction time with all synthesized photocatalysts. As can be seen, the samples with the best performance and degradation were Au-TiO2 1.0 wt.% for the MW method and Au-TiO2 0.7 wt.% for the SQ method.
From the graphs displayed in Figure 11 it is evident that the inclusion of gold ions in the crystal structure of TiO2 had a favorable impact on the catalytic properties, compared to TiO2 without modification (far left), and it is also possible to see a greater degradation capacity of the catalysts made by the SQ method, except for the sample with 1% Au. The crystalline quality and the surface area could be relevant factors impacting on the catalytic properties. To the best of our knowledge and according to [21] and [53] there is a difference between the synthesis process, resulting in a surface areas over 100 m2g−1 previously reported for those research groups, leading a higher removal performance, nevertheless more studies about the surface and specific area must be carried out to fully understand the effect of the MW and SQ over the sol-gel method in pure and doped catalysts.
In the inset graph, a pseudo-first-order kinetic model fit for the MW photocatalysts is shown. For all the synthesized samples a good linear fit was achieved, with rate constants (k1) varying from 1.03 × 10⁻³ min−1 for undoped TiO2 to 3.79 × 10⁻³ min−1 for Au-TiO2 1.0 wt.% for the MW method samples and rate constants varying from 1.01 × 10⁻³ min−1 for undoped TiO2 to 3.13 × 10⁻³ min−1 for Au-TiO2 0.7 wt.% for the SQ method samples. It can be observed that similar values of kinetic constants were achieved for undoped TiO2 for both the MW and the SQ method, however, there is a clear difference in the degradation performance as the Au load increases. It is important to notice that to obtain the best performance using the SQ method it was necessary a smaller amount of dopant, being the optimal dopant load 0.7 wt.% while for the MW method the optimal load of gold was 1.0 wt.%.
When varying the initial concentration of paracetamol [PAM]0 from 10 mg L−1 to 30 mg L−1, a corresponding rate constant variation was noted, indicating that k1 is not a true constant since it should be [PAM]0 independent. For Au-TiO2 0.7 wt.% (the SQ method) a change from 7.3 × 10⁻³ min−1 to 2.7 × 10⁻³ min−1 was observed when increasing paracetamol initial concentration from 10 mg L−1 to 30 mg L−1, and for Au-TiO2 1.0 wt.% (the MW method) a change from 5.0 × 10⁻³ min−1 to 3.2 × 10⁻³ min−1 was observed for the same initial concentrations. The decrease of k1 when the initial concentration of paracetamol was increased could be due to a greater number of TiO2 active sites being occupied by molecules, hence suppressing oxidant generation [54,55]. The change of k1 with [PAM]0 can be described by using the Langmuir-Hinshelwood model, describing the correlation between degradation rate constants and initial concentrations as [55]:
1 k 1   = 1 k c K P A M + 1 k c [ P A M ] 0
where kc is the rate constant at the catalyst surface and KPAM is the Langmuir-Hinshelwood adsorption constant. The linear correlation between 1/k1 vs. [PAM]0 obtained for the two different methods was good, r2 = 0.9615 and r2 = 0.9187, for Au-TiO2 0.7 wt.% (SQ) and Au-TiO2 1.0 wt.% (MW) respectively. The kc and KPAM values obtained were, 0.086 and 0.178 mg L−1 min−1, and 0.345 and 0.087 L mg−1 for Au-TiO2 0.7 wt.% (SQ) and Au-TiO2 1.0 wt.% (MW) respectively, indicating poor adsorption at Au-TiO2 surface and a fast reaction with reactive species such as OH and also indicating that photocatalysts synthesized by the SQ method yield a faster reaction of pollutants and poorer adsorption at the surface than those synthesized by the MW method.

3. Materials and Methods

Titanium isopropoxide (IV) (Ti{OCH(CH3)2}4, 97.0%), gold (III) chloride hydrate (HAuCl4·x H2O, 99.995%) and sodium borohydride (NaBH4, 98%) were purchased from Sigma-Aldrich (Toluca, Edo. Mex., México), isopropyl alcohol (C3H8O, 98%) and sulfuric acid (H2SO4, 95–98%) (used to adjust the pH) were purchased from J. T. Baker (Mexico City, CDMx, México). Paracetamol (99.9%) was reagent grade purchased from Merck (Mexico City, CDMx, México) and used as received.

3.1. Photocatalysts Synthesis

The photocatalysts were synthesized using a regular sol-gel process coupled to two different methods, microwave and sonochemistry. The precursors undergo a series of hydrolysis and polycondensation reactions to form a colloidal suspension, or “sol”. Since the hydrolysis process and the H2O:Ti ratio play a key role in the obtaining of crystalline materials, all hydrolysis process were carried out in a predominantly aqueous medium to ensure the formation of a crystalline phase [56]. In this work, gold (III) chloride hydrate was used as the dopant precursor salt. For the microwave process, isopropyl alcohol was placed under a nitrogen atmosphere to displace the dissolved oxygen; then titanium isopropoxide (IV) was added and allowed to stand. The resulting solution was stirred, then the total volume of water (water + dopant) was added (in different proportion of dopant to obtain the desired nominal load of gold: 0.05 wt.%, 0.1 wt.%, 0.3 wt.%, 0.7 wt.% y 1.0 wt.%. A chemical reduction was made by adding 10 mL of a 30 mM NaBH4 solution. The resulting mixture was stirred in a dark environment for one hour. The cooled solution was placed in the microwave system, where a ramp of 10 °C/min was used up to a final temperature of 210 °C for 30 min.
On the other hand, the sol-gel process coupled to sonochemistry was done in the same way until the dopant was added, where an ultrasonic homogenizer (UP200Ht, Hielscher, Mount Holly, NJ, United States) equipped with a 40 mm sonotrode configured at 70% cavitation and 30% amplitude for 30 min, after that the solution was put on the dark for one hour. In both cases, the obtained solution was filtered, dried, and calcinated at 450 °C for three hours.

3.2. Physicochemical Characterization

The morphology analysis was carried out by SEM with a JSM-6510LV microscope (JEOL, United States). X-ray diffraction (XRD) patterns were recorded to study the crystallinity and particle size, using a D8 advanced diffractometer (Bruker, Madison, WI, United States) equipped with a Cu anode to generate Cu Kα radiation (λ = 1.5406 Å) in the range 20° < 2θ < 80° with a step size of 0.02°. The samples were mounted in a standard sample holder for bulk samples. Raman spectroscopy measurements were carried out using a LabRAM HR spectrometer (Horiba Scientific, Santa Clara, CA, United States) equipped with a Nd:YAG laser (λ = 532 nm). Samples were analyzed with a 6 mW power focused on a 1.5 µm diameter area. X-ray photoelectron spectroscopy analyses were carried out with a K-Alpha XPS spectrometer (Thermo Scientific, Waltham, MA, United States) equipped with an Al-Kα X-ray source (1486.7 eV).

3.3. Electrochemical Experiments

The working electrodes were prepared using conductive glass substrates (FTO 20 Ohms SOLEMS, Palaiseau, France) which were coated with each catalyst. This was accomplished by the dropwise addition of 1 mL of a previously prepared suspension of 15 mg/mL of each catalyst in ethanol. After the solvent was evaporated, the electrode was heated at 200 °C (10 °C/min, 1 h) under an air atmosphere. All experiments were carried out using 0.1M NaOH solution (pH 12.9) as a supporting electrolyte in the presence of N2. Electrochemical measurements were performed at 25 °C in a three-electrode array cell, using the previously described electrodes, a platinum wire was used as a counter electrode. A commercial Ag/AgCl electrode was used as the reference electrode. The measurements were made on a SP- 300 potentiostat-galvanostat (Biologic, Seyssinet-Pariset, France). Cyclic voltammetry experiments were performed at v = 0.1 V/s from open circuit potential in a potential range from −1.0 to 1.0 V vs. Ag/AgCl. Experiments were done for 11 consecutive cycles to verify the steady-state. The semiconductor properties of the electrodes were calculated from 1/C2 vs. potential measurements, employing potential step electrochemical impedance spectroscopy, applying an altering voltage of 10 mV from −1.0 to 0.4 V vs. Ag/AgCl and a frequency range from 100 kHz to 1 Hz.

3.4. Photocatalytic Tests

Photocatalytic tests were carried out with each one of the synthesized powders to determine its degradation potential with pharmaceutical compounds. Paracetamol (PAM) was used as model organic pollutant. Each experiment was carried out at room temperature under a constant airflow of 0.1 L min−1 bubbled through the stirred solution, containing 30 mg L−1 of PAM, with a pH of 3 adjusted with sulfuric acid and irradiated with a 36 W UV lamp (λ = 365 nm) located 15 cm above and using a dose of 0.5 g L−1 of photocatalyst. After determining which photocatalyst had the best results, experiments were carried out varying the initial concentration of the pollutant, specifically, 10 mg L−1, 20 mg L−1 and 30 mg L−1. All samples were filtered with Whatman PTFE filters before analysis. The concentration of paracetamol was determined by high performance liquid chromatography (HPLC) analysis using an UltiMate™ 3000 HPLC system (Thermo Scientific, Waltham, MA, United States) with a Hypersil C18 5 µm, 150 × 46 mm, column at 25 °C. Mobile phase was set at 60% 10 mM KH2PO4 with an adjusted pH of 3 and 40% acetonitrile at a flow speed of 0.8 mL min−1.

4. Conclusions

Au-TiO2 photocatalysts with different content of gold were successfully synthesized by MW and SQ methodologies. Several morphological and crystallographic differences were found, namely, the MW method yields uneven particles while the SQ method yields homogeneous particles with a better crystalline quality and greater surface area, where these particles are distributed evenly across the surface. The anatase crystalline phase were found for both synthesis methods. By Raman analysis was possible to corroborate the presence of anatase phase when both synthesis methods were used and how according to the gold load, some structural changes appear even if the metallic gold nanoparticles are not detected due to their low concentration in this technique and by XRD analysis. Only by XPS measurements was it possible to detect the presence of gold in samples with higher content of 0.1 (wt.%) for the MW method and 0.3 when the SQ method was used in the synthesis process. When the load of Au increases in the TiO2, a shift towards higher binding energies is observed, indicating a change in the chemical environment of the material due to the Au incorporation, which can be related to the obtained Raman spectroscopy results.
According to the electrochemical analysis, a typical TiO2 voltammogram was obtained and no changes were observed according to the synthesis method or even for the gold load. From the Mott-Schottky diagrams it was possible to conclude that as the amount of Au increases the flat-band potential takes more negative values for anatase and brookite phases with no significant changes in Nd values and it doesn´t change according to the type of synthesis method used.
In order to relate all the observed morphology, crystallite size, crystallinity, gold content and electrochemical behavior features, the photocatalysts were tested in the photocatalytic degradation of paracetamol as model pollutant. The paracetamol concentration decay obeyed pseudo-first-order kinetics, where first of all the optimal Au loads for the paracetamol removal were 0.7 wt.% and 1.0 wt.% for Au-TiO2 synthesized by the SQ and the MW method, respectively. This can lead us to propose that the energy used in the synthesis method such as sonochemistry or microwaves, could help to achieve small crystallite sizes (9.41 MW and 10.71 SQ method) and produce some structural changes that will help to modify the TiO2 matrix with the gold nanoparticles and assure that the density donors and the oxygen vacancies will promote a faster absorption of paracetamol molecules on active sites and desorption of by-products in the removal reaction and also, a fast reaction with reactive species such as OH. Finally, the use of sonochemistry as synthesis method can provide a good catalyst with low gold loads yet efficient enough to carry out a photocatalysis process.

Author Contributions

K.E. conceived and designed the experiments; L.E.-A. and R.V.-C. characterized the samples by Raman, XPS, and XRD techniques; R.H. and J.R.H.-R. synthesized the samples, collected and analyzed the data; M.C.-R. and L.O.-F. characterized the samples by the electrochemical techniques. All authors discussed the experiment results and contributed to the writing of the paper. Conceptualization, K.E.; Data curation, M.C.-R.; Formal analysis, R.H., J.R.H.-R., M.C.-R. and L.E.-A.; Funding acquisition, K.E.; Investigation, R.H., M.C.-R., R.V.-C., L.E.-A. and L.O.-F.; Methodology, R.H. and J.R.H.-R.; Project administration, K.E.; Resources, K.E.; Validation, L.E.-A. and L.O.-F.; Writing—original draft, R.H.; Writing—review & editing, K.E., M.C.-R., R.V.-C., L.E.-A. and L.O.-F. All authors have read and agreed to the published version of the manuscript.

Funding

This research was funded by FOFI-UAQ-2018, grant number FIN201810.

Acknowledgments

Rafael Hernández and José Rosendo Hernández-Reséndiz thank CONACYT for their fellowships.

Conflicts of Interest

The authors declare no conflict of interest.

References

  1. Ranka, P.; Sethi, V.; Contractor, A.Q. One step electrodeposition of composite of PANI-PSS tubules with TiO2 nanoparticles and application as electronic sensor device. Sens. Actuators B Chem. 2018, 261, 11–21. [Google Scholar] [CrossRef]
  2. Falk, G.S.; Borlaf, M.; López-Muñoz, M.J.; Fariñas, J.C.; Rodrigues Neto, J.B.; Moreno, R. Microwave-assisted synthesis of TiO2 nanoparticles: photocatalytic activity of powders and thin films. J. Nanopart. Res. 2018, 20, 23. [Google Scholar] [CrossRef]
  3. Rosales, A.; Maury-Ramírez, A.; Gutiérrez, R.M.-D.; Guzmán, C.; Esquivel, K. SiO2@TiO2 Coating: Synthesis, Physical Characterization and Photocatalytic Evaluation. Coatings 2018, 8, 120. [Google Scholar] [CrossRef] [Green Version]
  4. Awfa, D.; Ateia, M.; Fujii, M.; Yoshimura, C. Novel Magnetic Carbon Nanotube-TiO2 Composites for Solar Light Photocatalytic Degradation of Pharmaceuticals in the Presence of Natural Organic Matter. J. Water Process Eng. 2019, 31, 100836. [Google Scholar] [CrossRef]
  5. Gar Alalm, M.; Tawfik, A.; Ookawara, S. Enhancement of photocatalytic activity of TiO2 by immobilization on activated carbon for degradation of pharmaceuticals. J. Environ. Chem. Eng. 2016, 4, 1929–1937. [Google Scholar] [CrossRef]
  6. Rasheed, T.; Adeel, M.; Nabeel, F.; Bilal, M.; Iqbal, H.M.N. TiO2/SiO2 decorated carbon nanostructured materials as a multifunctional platform for emerging pollutants removal. Sci. Total Environ. 2019, 688, 299–311. [Google Scholar] [CrossRef]
  7. Gao, Y.; Wang, L.; Zhou, A.; Li, Z.; Chen, J.; Bala, H.; Hu, Q.; Cao, X. Hydrothermal synthesis of TiO2/Ti3C2 nanocomposites with enhanced photocatalytic activity. Mater. Lett. 2015, 150, 62–64. [Google Scholar] [CrossRef]
  8. Asadi, A.; Akbarzadeh, R.; Eslami, A.; Jen, T.-C.; Ozaveshe Oviroh, P. Effect of synthesis method on NS-TiO2 photocatalytic performance. Energy Procedia 2019, 158, 4542–4547. [Google Scholar] [CrossRef]
  9. Ingrosso, C.; Bianco, G.V.; Pifferi, V.; Guffanti, P.; Petronella, F.; Comparelli, R.; Agostiano, A.; Striccoli, M.; Palchetti, I.; Falciola, L.; et al. TiO2 Nanocrystals Decorated CVD Graphene Based Hybrid for UV-Light Active Photoanodes. Procedia Eng. 2016, 168, 396–402. [Google Scholar] [CrossRef]
  10. Astinchap, B.; Laelabadi, K.G. Effects of substrate temperature and precursor amount on optical properties and microstructure of CVD deposited amorphous TiO2 thin films. J. Phys. Chem. Solids 2019, 129, 217–226. [Google Scholar] [CrossRef]
  11. Chen, W.-F.; Mofarah, S.S.; Hanaor, D.A.H.; Koshy, P.; Chen, H.-K.; Jiang, Y.; Sorrell, C.C. Enhancement of Ce/Cr Codopant Solubility and Chemical Homogeneity in TiO2 Nanoparticles through Sol–Gel versus Pechini Syntheses. Inorg. Chem. 2018, 57, 7279–7289. [Google Scholar] [CrossRef] [PubMed]
  12. Solís-Casados, D.A.; Escobar-Alarcón, L.; Arrieta-Castañeda, A.; Haro-Poniatowski, E. Bismuth-Titanium Oxide nanopowders prepared by sol-gel method for photocatalytic applications. Mater. Chem. Phys. 2016, 172, 11–19. [Google Scholar] [CrossRef]
  13. Blanco-Vega, M.P.; Guzmán-Mar, J.L.; Villanueva-Rodríguez, M.; Maya-Treviño, L.; Garza-Tovar, L.L.; Hernández-Ramírez, A.; Hinojosa-Reyes, L. Photocatalytic elimination of bisphenol A under visible light using Ni-doped TiO2 synthesized by microwave assisted sol-gel method. Mater. Sci. Semicond. Process. 2017, 71, 275–282. [Google Scholar] [CrossRef]
  14. Lusvardi, G.; Barani, C.; Giubertoni, F.; Paganelli, G. Synthesis and Characterization of TiO2 Nanoparticles for the Reduction of Water Pollutants. Materials 2017, 10, 1208. [Google Scholar] [CrossRef] [PubMed] [Green Version]
  15. Macwan, D.P.; Dave, P.N.; Chaturvedi, S. A review on nano-TiO2 sol–gel type syntheses and its applications. J. Mater Sci. 2011, 46, 3669–3686. [Google Scholar] [CrossRef]
  16. Jafari, A.; Khademi, S.; Farahmandjou, M.; Darudi, A.; Rasuli, R. Structural and Optical Properties of Ce3+-Doped TiO2 Nanocrystals Prepared by Sol–Gel Precursors. J. Electron. Mater. 2018, 47, 6901–6908. [Google Scholar] [CrossRef]
  17. Tony, V.C.S.; Voon, C.H.; Lim, B.Y.; Al-Douri, Y.; Gopinath, S.C.B.; Arshad, M.K.M.; Ten, S.T.; Parmin, N.A.; Ruslinda, A.R. Synthesis of silicon carbide nanomaterials by microwave heating: Effect of types of carbon nanotubes. Solid State Sci. 2019, 98, 106023. [Google Scholar] [CrossRef]
  18. Kang, J.; Gao, L.; Zhang, M.; Pu, J.; He, L.; Ruan, R.; Omran, M.; Peng, J.; Chen, G. Synthesis of rutile TiO2 powder by microwave-enhanced roasting followed by hydrochloric acid leaching. Adv. Powder Technol. 2020, 31, 1140–1147. [Google Scholar] [CrossRef]
  19. Reda, S.M.; Khairy, M.; Mousa, M.A. Photocatalytic activity of nitrogen and copper doped TiO2 nanoparticles prepared by microwave-assisted sol-gel process. Arab. J. Chem. 2017, 13, 86–95. [Google Scholar] [CrossRef]
  20. Shetty, R.; Chavan, V.B.; Kulkarni, P.S.; Kulkarni, B.D.; Kamble, S.P. Photocatalytic Degradation of Pharmaceuticals Pollutants Using N-Doped TiO2 Photocatalyst: Identification of CFX Degradation Intermediates. Indian Chem. Eng. 2017, 59, 177–199. [Google Scholar] [CrossRef]
  21. Esquivel, K.; Nava, R.; Zamudio-Méndez, A.; González, M.V.; Jaime-Acuña, O.E.; Escobar-Alarcón, L.; Peralta-Hernández, J.M.; Pawelec, B.; Fierro, J.L.G. Microwave-assisted synthesis of (S)Fe/TiO2 systems: Effects of synthesis conditions and dopant concentration on photoactivity. Appl. Catal. B Environ. 2013, 140–141, 213–224. [Google Scholar] [CrossRef]
  22. Guo, W.; Lin, Z.; Wang, X.; Song, G. Sonochemical synthesis of nanocrystalline TiO2 by hydrolysis of titanium alkoxides. Microelectron. Eng. 2003, 66, 95–101. [Google Scholar] [CrossRef]
  23. Kaviyarasan, K.; Vinoth, V.; Sivasankar, T.; Asiri, A.M.; Wu, J.J.; Anandan, S. Photocatalytic and photoelectrocatalytic performance of sonochemically synthesized Cu2O@TiO2 heterojunction nanocomposites. Ultrason. Sonochem. 2019, 51, 223–229. [Google Scholar] [CrossRef] [PubMed]
  24. Meskin, P.E.; Ivanov, V.K.; Barantchikov, A.E.; Churagulov, B.R.; Tretyakov, Y.D. Ultrasonically assisted hydrothermal synthesis of nanocrystalline ZrO2, TiO2, NiFe2O4 and Ni0.5Zn0.5Fe2O4 powders. Ultrason. Sonochem. 2006, 13, 47–53. [Google Scholar] [CrossRef]
  25. de Santiago Colín, D.M.; Martínez-Chávez, L.A.; Cuán, Á.; Elizalde-Peña, E.A.; Rivera, J.A.; Guzmán, C.; Escobar-Alarcón, L.; Esquivel, K. Sonochemical coupled synthesis of Cr-TiO2 supported on Fe3O4 structures and chemical simulation of the degradation mechanism of Malachite Green dye. J. Photochem. Photobiol. A Chem. 2018, 364, 250–261. [Google Scholar] [CrossRef]
  26. Zhu, L.; Chung, J.; Oh, W.-C. Rapid sonochemical synthesis of novel PbSe–graphene–TiO2 composite sonocatalysts with enhanced on decolorization performance and generation of ROS. Ultrason. Sonochem. 2015, 27, 252–261. [Google Scholar] [CrossRef]
  27. Shende, T.P.; Bhanvase, B.A.; Rathod, A.P.; Pinjari, D.V.; Sonawane, S.H. Sonochemical synthesis of Graphene-Ce-TiO2 and Graphene-Fe-TiO2 ternary hybrid photocatalyst nanocomposite and its application in degradation of crystal violet dye. Ultrason. Sonochem. 2018, 41, 582–589. [Google Scholar] [CrossRef]
  28. Guo, J.; Zhu, S.; Chen, Z.; Li, Y.; Yu, Z.; Liu, Q.; Li, J.; Feng, C.; Zhang, D. Sonochemical synthesis of TiO2 nanoparticles on graphene for use as photocatalyst. Ultrason. Sonochem. 2011, 18, 1082–1090. [Google Scholar] [CrossRef]
  29. Ambati, R.; Gogate, P.R. Ultrasound assisted synthesis of iron doped TiO2 catalyst. Ultrasonics Sonochem. 2018, 40, 91–100. [Google Scholar] [CrossRef]
  30. Khorsand Zak, A.; Abd Majid, W.H.; Abrishami, M.E.; Yousefi, R. X-ray analysis of ZnO nanoparticles by Williamson–Hall and size–strain plot methods. Solid State Sci. 2011, 13, 251–256. [Google Scholar] [CrossRef]
  31. Rajesh Kumar, B.; Hymavathi, B. X-ray peak profile analysis of solid-state sintered alumina doped zinc oxide ceramics by Williamson–Hall and size-strain plot methods. J. Asian Ceram. Soc. 2017, 5, 94–103. [Google Scholar] [CrossRef] [Green Version]
  32. Hernández, R.; Hernández-Reséndiz, J.R.; Martínez-Chávez, A.; Velázquez-Castillo, R.; Escobar-Alarcón, L.; Esquivel, K. X-ray diffraction Rietveld structural analysis of Au–TiO2 powders synthesized by sol–gel route coupled to microwave and sonochemistry. J. Sol-Gel Sci. Technol. 2020, 95, 239–252. [Google Scholar] [CrossRef]
  33. Balachandran, U.; Eror, N.G. Raman spectra of titanium dioxide. J. Solid State Chem. 1982, 42, 276–282. [Google Scholar] [CrossRef]
  34. Zhang, J.; Xu, Q.; Feng, Z.; Li, C. UV Raman Spectroscopic Studies on Titania: Phase Transformation and Significance of Surface Phase in Photocatalysis. In Environmentally Benign Photocatalysts; Anpo, M., Kamat, P.V., Eds.; Nanostructure Science and Technology; Springer: New York, NY, USA, 2010; pp. 153–184. ISBN 978-0-387-48441-9. [Google Scholar]
  35. Leyva-Porras, C.; Toxqui-Teran, A.; Vega-Becerra, O.; Miki-Yoshida, M.; Rojas-Villalobos, M.; García-Guaderrama, M.; Aguilar-Martínez, J.A. Low-temperature synthesis and characterization of anatase TiO2 nanoparticles by an acid assisted sol–gel method. J. Alloys Compd. 2015, 647, 627–636. [Google Scholar] [CrossRef]
  36. Greczynski, G.; Hultman, L. Reliable determination of chemical state in x-ray photoelectron spectroscopy based on sample-work-function referencing to adventitious carbon: Resolving the myth of apparent constant binding energy of the C 1s peak. Appl. Surf. Sci. 2018, 451, 99–103. [Google Scholar] [CrossRef]
  37. Lopez, T.; Cuevas, J.L.; Ilharco, L.; Ramírez, P.; Rodríguez-Reinoso, F.; Rodríguez-Castellón, E. XPS characterization and E. Coli DNA degradation using functionalized Cu/TiO2 nanobiocatalysts. Mol. Catal. 2018, 449, 62–71. [Google Scholar] [CrossRef]
  38. Luna, M.; Gatica, J.M.; Vidal, H.; Mosquera, M.J. One-pot synthesis of Au/N-TiO2 photocatalysts for environmental applications: Enhancement of dyes and NOx photodegradation. Powder Technol. 2019, 355, 793–807. [Google Scholar] [CrossRef]
  39. Iatsunskyi, I.; Kempiński, M.; Nowaczyk, G.; Jancelewicz, M.; Pavlenko, M.; Załęski, K.; Jurga, S. Structural and XPS studies of PSi/TiO2 nanocomposites prepared by ALD and Ag-assisted chemical etching. Appl. Surf. Sci. 2015, 347, 777–783. [Google Scholar] [CrossRef]
  40. George, P.P.; Gedanken, A.; Perkas, N.; Zhong, Z. Selective oxidation of CO in the presence of air over gold-based catalysts Au/TiO2/C (sonochemistry) and Au/TiO2/C (microwave). Ultrason. Sonochem. 2008, 15, 539–547. [Google Scholar] [CrossRef]
  41. Kruse, N.; Chenakin, S. XPS characterization of Au/TiO2 catalysts: Binding energy assessment and irradiation effects. Appl. Catal. A Gen. 2011, 391, 367–376. [Google Scholar] [CrossRef] [Green Version]
  42. Arabatzis, I.M.; Stergiopoulos, T.; Andreeva, D.; Kitova, S.; Neophytides, S.G.; Falaras, P. Characterization and photocatalytic activity of Au/TiO2 thin films for azo-dye degradation. J. Catal. 2003, 220, 127–135. [Google Scholar] [CrossRef]
  43. Chenakin, S.; Kruse, N. Combining XPS and ToF-SIMS for assessing the CO oxidation activity of Au/TiO2 catalysts. J. Catal. 2018, 358, 224–236. [Google Scholar] [CrossRef]
  44. Feng, X.; Pan, F.; Zhao, H.; Deng, W.; Zhang, P.; Zhou, H.-C.; Li, Y. Atomic layer deposition enabled MgO surface coating on porous TiO2 for improved CO2 photoreduction. Appl. Catal. B Environ. 2018, 238, 274–283. [Google Scholar] [CrossRef]
  45. Olvera-Rodríguez, I.; Hernández, R.; Medel, A.; Guzmán, C.; Escobar-Alarcón, L.; Brillas, E.; Sirés, I.; Esquivel, K. TiO2/Au/TiO2 multilayer thin-film photoanodes synthesized by pulsed laser deposition for photoelectrochemical degradation of organic pollutants. Sep. Purif. Technol 2019, 224, 189–198. [Google Scholar] [CrossRef]
  46. Casaletto, M.P.; Longo, A.; Martorana, A.; Prestianni, A.; Venezia, A.M. XPS study of supported gold catalysts: the role of Au0 and Au+δ species as active sites. Surf. Interface Anal. 2006, 38, 215–218. [Google Scholar] [CrossRef]
  47. Zwijnenburg, A.; Goossens, A.; Sloof, W.G.; Crajé, M.W.J.; van der Kraan, A.M.; Jos de Jongh, L.; Makkee, M.; Moulijn, J.A. XPS and Mössbauer Characterization of Au/TiO2 Propene Epoxidation Catalysts. J. Phys. Chem. B 2002, 106, 9853–9862. [Google Scholar] [CrossRef]
  48. Wu, Y.; Zhang, J.; Xiao, L.; Chen, F. Preparation and characterization of TiO2 photocatalysts by Fe3+ doping together with Au deposition for the degradation of organic pollutants. Appl. Catal. B Environ. 2009, 88, 525–532. [Google Scholar] [CrossRef]
  49. Marken, F.; Bhambra, A.S.; Kim, D.-H.; Mortimer, R.J.; Stott, S.J. Electrochemical reactivity of TiO2 nanoparticles adsorbed onto boron-doped diamond surfaces. Electrochem. Commun. 2004, 6, 1153–1158. [Google Scholar] [CrossRef] [Green Version]
  50. Fabregat-Santiago, F.; Mora-Seró, I.; Garcia-Belmonte, G.; Bisquert, J. Cyclic Voltammetry Studies of Nanoporous Semiconductors. Capacitive and Reactive Properties of Nanocrystalline TiO2 Electrodes in Aqueous Electrolyte. J. Phys. Chem. B 2003, 107, 758–768. [Google Scholar] [CrossRef]
  51. Hu, W.; Li, L.; Li, G.; Tang, C.; Sun, L. High-Quality Brookite TiO2 Flowers: Synthesis, Characterization, and Dielectric Performance. Cryst. Growth Des. 2009, 9, 3676–3682. [Google Scholar] [CrossRef]
  52. An, X.; Hu, C.; Liu, H.; Qu, J. Hierarchical Nanotubular Anatase/Rutile/TiO2(B) Heterophase Junction with Oxygen Vacancies for Enhanced Photocatalytic H2 Production. Langmuir 2018, 34, 1883–1889. [Google Scholar] [CrossRef]
  53. Neppolian, B.; Wang, Q.; Jung, H.; Choi, H. Ultrasonic-assisted sol-gel method preparation of TiO2 nano-particles: Characterization, properties and 4-chlorophenol removal application. Ultrason. Sonochem. 2008, 15, 649–658. [Google Scholar] [CrossRef] [PubMed]
  54. Hernández, R.; Olvera-Rodríguez, I.; Guzmán, C.; Medel, A.; Escobar-Alarcón, L.; Brillas, E.; Sirés, I.; Esquivel, K. Microwave-assisted sol-gel synthesis of an Au-TiO2 photoanode for the advanced oxidation of paracetamol as model pharmaceutical pollutant. Electrochem. Commun. 2018, 96, 42–46. [Google Scholar] [CrossRef]
  55. Yang, L.; Yu, L.E.; Ray, M.B. Degradation of paracetamol in aqueous solutions by TiO2 photocatalysis. Water Res. 2008, 42, 3480–3488. [Google Scholar] [CrossRef] [PubMed]
  56. Hanaor, D.A.H.; Chironi, I.; Karatchevtseva, I.; Triani, G.; Sorrell, C.C. Single and mixed phase TiO2 powders prepared by excess hydrolysis of titanium alkoxide. Adv. Appl. Ceram. 2012, 111, 149–158. [Google Scholar] [CrossRef] [Green Version]
Figure 1. SEM images of Au-TiO2 synthesized by (a) the MW Method and (b) the SQ Method.
Catalysts 10 01052 g001aCatalysts 10 01052 g001b
Figure 2. XRD patterns of the Au-TiO2 samples synthesized by the MW and SQ Method.
Catalysts 10 01052 g002
Figure 3. Raman spectra recorded for Au-TiO2 samples synthesized by the MW Method, (a) TiO2, (b) TiO2-Au 0.05%, (c) TiO2-Au 0.1%, (d) TiO2-Au 0.3%, (e) TiO2-Au 0.7%, (f) TiO2-Au 1.0%.
Catalysts 10 01052 g003aCatalysts 10 01052 g003b
Figure 4. Raman spectra recorded for Au-TiO2 samples synthesized by the SQ Method (a) TiO2, (b) TiO2-Au 0.05%, (c) TiO2-Au 0.1%, (d) TiO2-Au 0.3%, (e) TiO2-Au 0.7%, (f) TiO2-Au 1.0%.
Catalysts 10 01052 g004aCatalysts 10 01052 g004b
Figure 5. Detailed analysis of the Raman peak at 144 cm−1 of Au-TiO2 synthesized samples.
Catalysts 10 01052 g005
Figure 6. XPS spectra analysis recorded for Au-TiO2 samples synthesized by the SQ Method.
Catalysts 10 01052 g006
Figure 7. Cyclic Voltammograms of the different electrodes with Au-TiO2 synthesized by the SQ method using NaOH 0.1 M as supporting electrolyte. Scan rate 100 mV/s.
Catalysts 10 01052 g007
Figure 8. Cyclic Voltammograms of electrodes with Au-TiO2 synthesized by the MW method using NaOH 0.1 M as supporting electrolyte. Scan rate 100 mV/s.
Catalysts 10 01052 g008
Figure 9. 1/C2 vs. potential plots for electrodes with Au-TiO2 synthesized by the MW method using NaOH 0.1 M as supporting electrolyte, f = 1.002 Hz.
Catalysts 10 01052 g009
Figure 10. 1/C2 vs. potential plots for electrodes with Au-TiO2 synthesized by the SQ method using NaOH 0.1 M as supporting electrolyte, f = 1.002 Hz.
Catalysts 10 01052 g010
Figure 11. Comparison of PAM degradation at 180 min of reaction time and pseudo first order kinetic fit of the MW method samples.
Catalysts 10 01052 g011
Table 1. Atomic contents of TiO2 samples synthesized by the SQ method.
Nominal Au Content (wt.%) Ti (at.%)O (at.%)Au (at.%)Au (wt.%)
0------------
0.0536.463.6------
0.135.764.3------
0.335.963.20.90.060
0.733.066.01.00.069
136.162.81.10.073
Table 2. Atomic contents of TiO2 samples synthesized by the MW method.
Nominal Au Content (wt.%) Ti (at.%)O (at.%)Au (at.%)Au (wt.%)
0------------
0.0536.363.7--------
0.136.363.10.60.041
0.335.963.20.80.054
0.733.465.70.90.062
135.163.91.00.068
Table 3. Flat-Band potential (Efb) and donor density (Nd) determined from Mott-Schottky for Au-TiO2 samples synthesized by the SQ and the MW Method.
Material(Efb) a Anatase(Nd) b Anatase(Efb) a Brookite(Nd) b Brookite
TiO2 (SQ)−0.4372.1 × 1027−0.8802.5 × 1027
Au-TiO2 0.05 wt.% (SQ)−0.5816.9 × 1027−1.0658.7 × 1027
Au-TiO2 0.1 wt.% (SQ)−0.9911.0 × 1028−0.5336.0 × 1027
Au-TiO2 0.3 wt.% (SQ)−0.9212.0 × 1027−0.7823.6 × 1027
Au-TiO2 0.7 wt.% (SQ)−1.0043.3 × 1027−0.7874.2 × 1027
Au-TiO2 1.0 wt.% (SQ)−0.8141.7 × 1027−0.4451.9 × 1027
TiO2 (MW)−0.9801.9 × 1028−0.4211.1 × 1028
Au-TiO2 0.05 wt.% (MW)−0.9641.6 × 1028−0.4048.2 × 1028
Au-TiO2 0.1 wt.% (MW)−0.9541.6 × 1028−0.4007.8 × 1028
Au-TiO2 0.3 wt.% (MW)−1.0196.6 × 1028−0.3842.6 × 1028
Au-TiO2 0.7 wt.% (MW)−1.0828.9 × 1028−0.3091.2 × 1028
Au-TiO2 1.0 wt.% (MW)−0.9101.3 × 1028-0.3212.2 × 1027
a = Volts vs. Ag/AgCl, b = cm−3.

