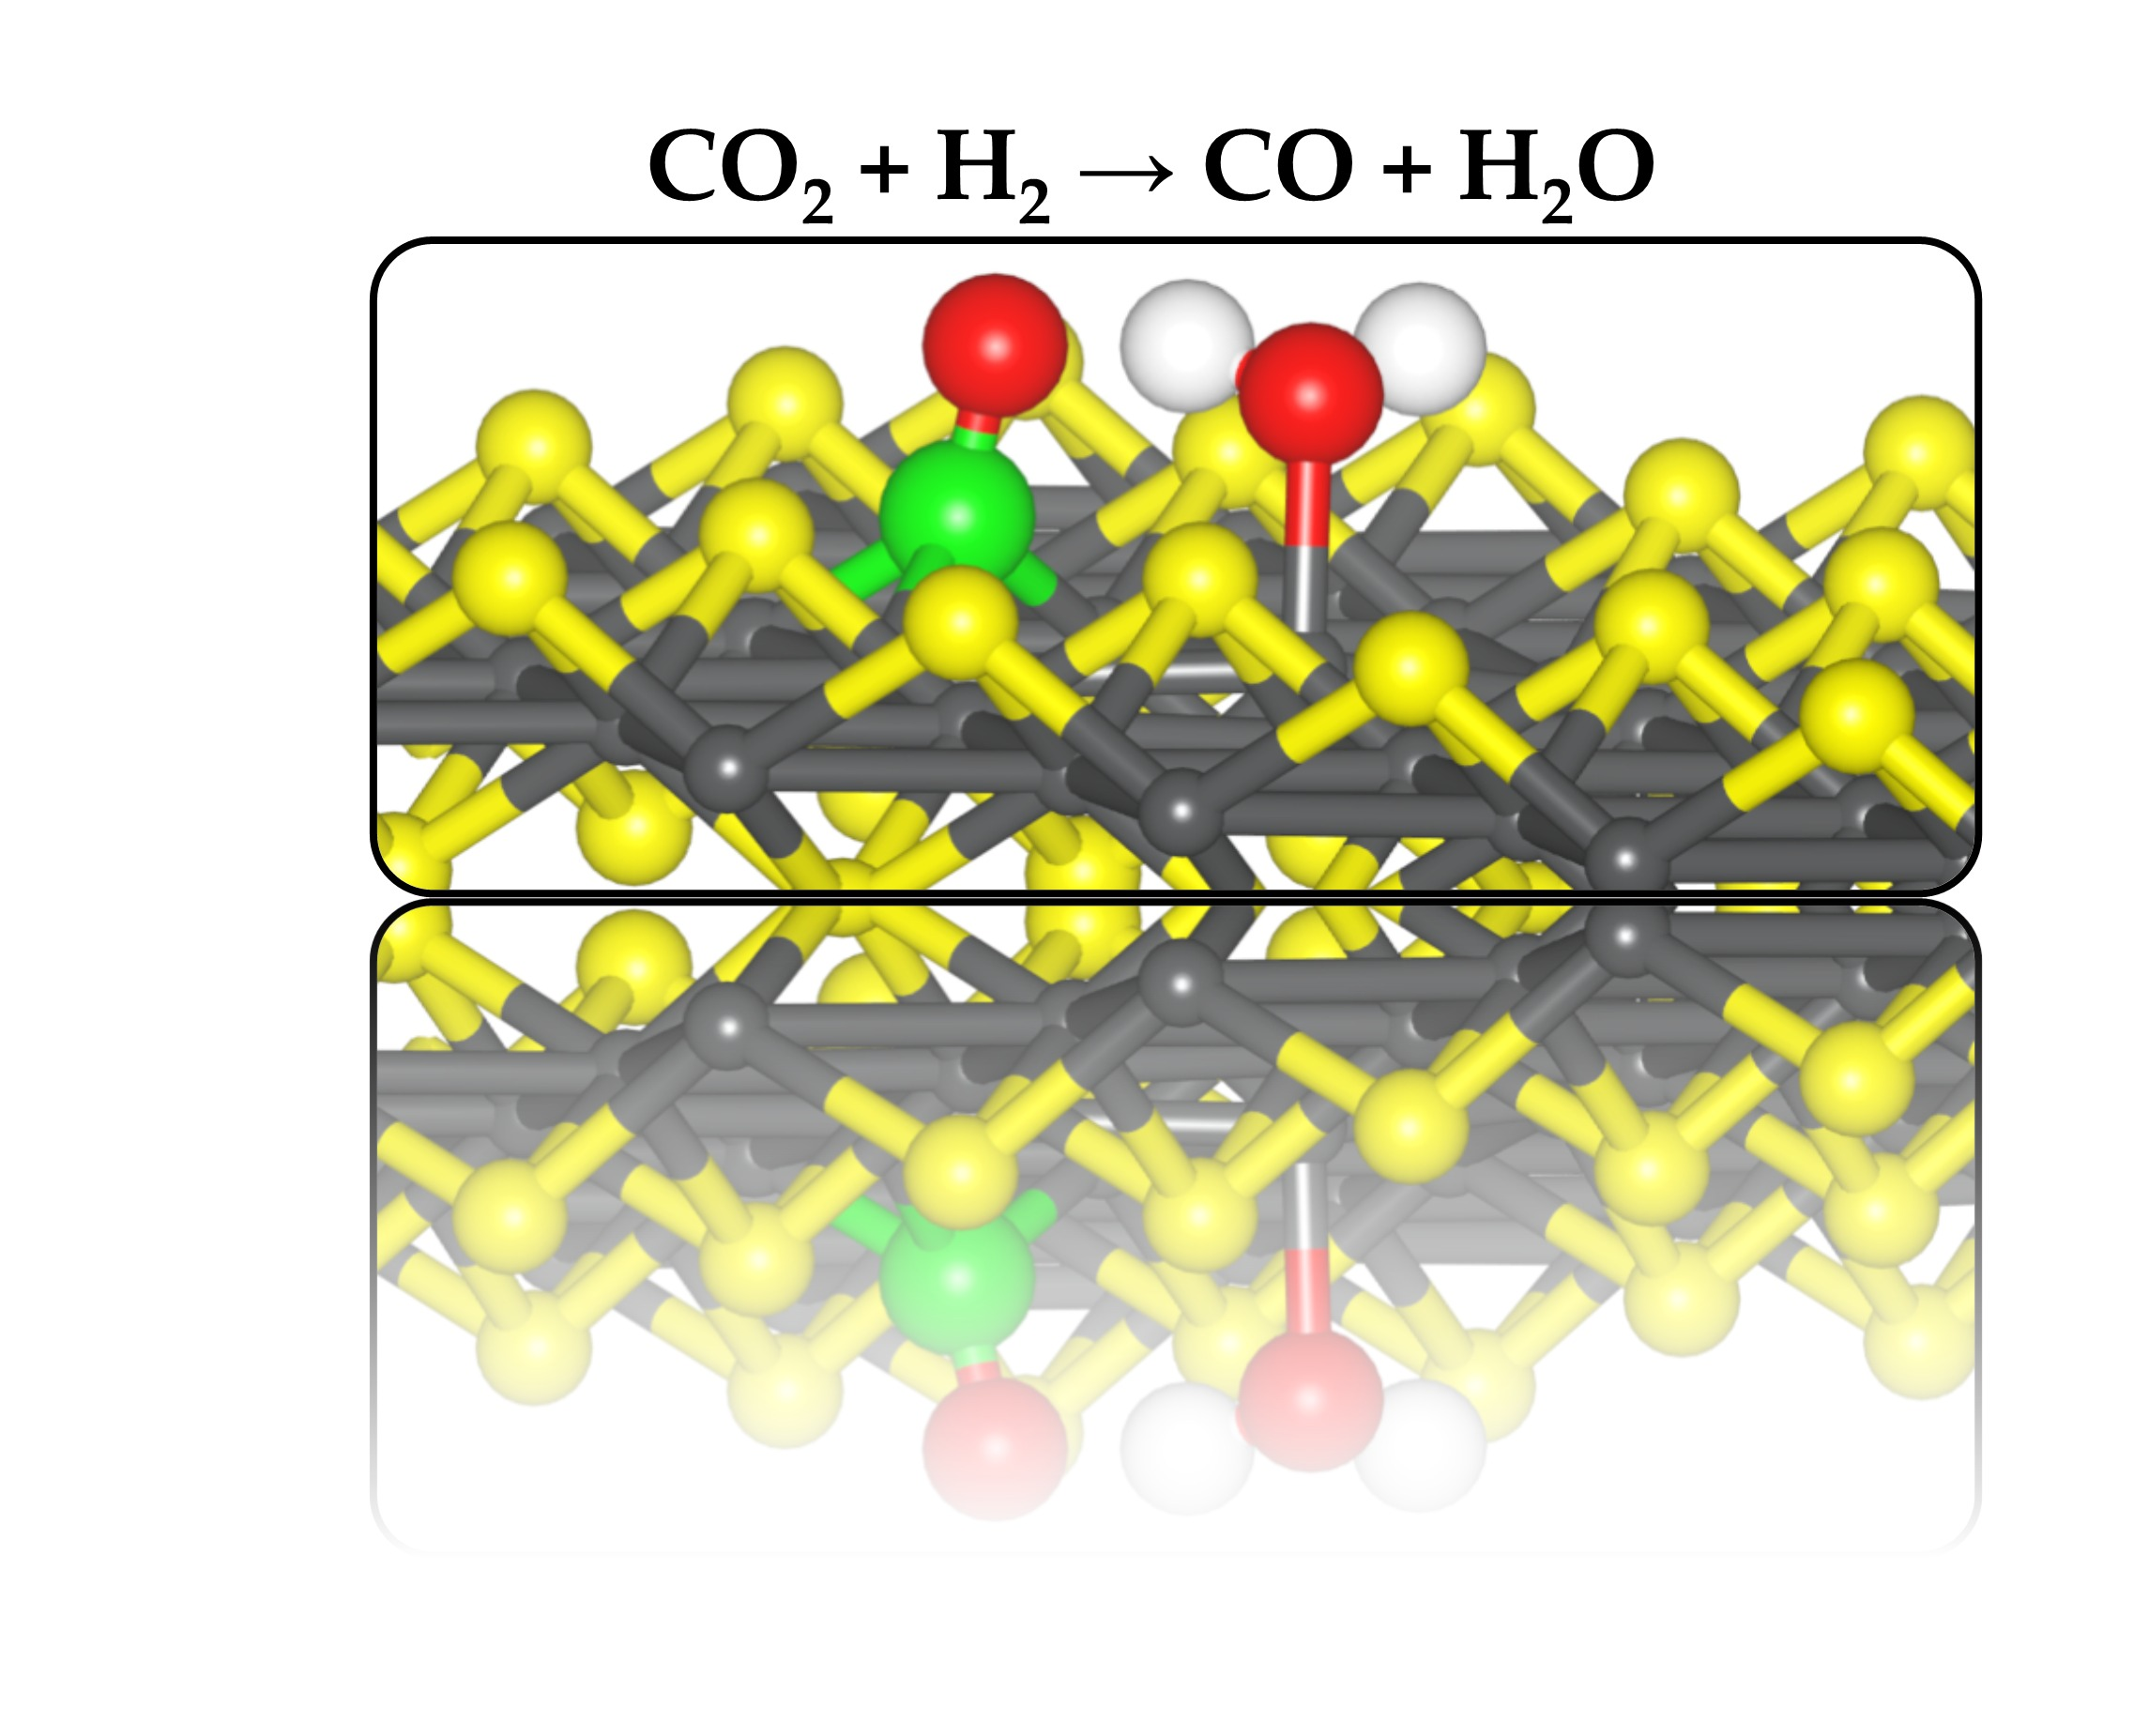
Activating the FeS (001) Surface for CO2 Adsorption and Reduction through the Formation of Sulfur Vacancies: A DFT-D3 Study


1
School of Chemistry, Cardiff University, Main Building, Park Place, Cardiff CF10 3AT, UK
2
Department of Earth Sciences, Utrecht University, Princetonlaan 8A, 3584 CB Utrecht, The Netherlands
3
School of Chemistry, University of Leeds, Leeds LT2 9JT, UK
*
Authors to whom correspondence should be addressed.
Catalysts 2021, 11(1), 127; https://0-doi-org.brum.beds.ac.uk/10.3390/catal11010127
Submission received: 30 December 2020
/
Revised: 12 January 2021
/
Accepted: 12 January 2021
/
Published: 15 January 2021
(This article belongs to the Special Issue Catalysts in Energy Applications)
Abstract
:As a promising material for heterogeneous catalytic applications, layered iron (II) monosulfide (FeS) contains active edges and an inert basal (001) plane. Activating the basal (001) plane could improve the catalytic performance of the FeS material towards CO2 activation and reduction reactions. Herein, we report dispersion-corrected density functional theory (DFT-D3) calculations of the adsorption of CO2 and the elementary steps involved in its reduction through the reverse water-gas shift reaction on a defective FeS (001) surface containing sulfur vacancies. The exposed Fe sites resulting from the creation of sulfur vacancies are shown to act as highly active sites for CO2 activation and reduction. Based on the calculated adsorption energies, we show that the CO2 molecules will outcompete H2O and H2 molecules for the exposed active Fe sites if all three molecules are present on or near the surface. The CO2 molecule is found to weakly physisorb (−0.20 eV) compared to the sulfur-deficient (001) surface where it adsorbs much strongly, releasing adsorption energy of −1.78 and −1.83 eV at the defective FeS (001) surface containing a single and double sulfur vacancy, respectively. The CO2 molecule gained significant charge from the interacting surface Fe ions at the defective surface upon adsorption, which resulted in activation of the C–O bonds confirmed via vibrational frequency analyses. The reaction and activation energy barriers of the elementary steps involved in the CO2 hydrogenation reactions to form CO and H2O species are also unraveled.

1. Introduction
The conversion of CO2 into fuels and chemicals is a promising process towards achieving green energy [1,2,3,4]. However, efficient, and inexpensive catalysts are needed to facilitate the conversion of CO2, which will also reduce the environmental impacts of carbon emissions [5,6]. In submarine hydrothermal environments, the surfaces of ferrous sulfide minerals are posited to have acted as heterogeneous catalysts for CO2 reduction, catalyzing the reaction of CO2 and H2 to form small organic molecules in the primordial ocean [7,8,9,10,11]. It has been suggested by Russell et al. that iron sulfide phases such as mackinawite (FeS), greigite (Fe3S4), and violarite (FeNi2S4) may have played important catalytic roles in prebiotic chemistry [9]. The surfaces of these minerals are structurally similar to the primary active sites, (Fe,Ni)S clusters, of natural enzymes such as carbon monoxide dehydrogenase (CODH), which efficiently and reversibly catalyze the reduction of CO2 to CO [12,13]. Huber and Wächtershäuser have shown that it was feasible to synthesize acetic acid on sulfide surfaces under the conditions of early Earth [14], whereas recent studies have shown that greigite (Fe3S4) and pyrrhotite (Fe1−xS) can electrocatalytically reduce CO2 to methanol, formic, and acetic acid under room temperature and pressure [15,16].
The activation of the CO2 molecule is the key step for its catalyzed reduction reactions [17] and detailed understanding of the mechanisms involved in CO2 conversion is indispensable in the design of efficient catalysts. Depending on the surface structure and electronic properties, the activity of catalyst surfaces may differ significantly with surfaces exhibiting low work functions showing more promise for CO2 reduction as they favour electron transfer [17,18]. The nature of the surface structures, compositions, and electronic properties of iron sulfides, that facilitate CO2 activation and reduction under hydrothermal conditions, remain poorly understood. Whereas synthetic mackinawite (FeS) is often reported to be stoichiometric, naturally occurring FeS is known to be non-stoichiometric, either due to the presence of S vacancies or interstitial metal atoms intercalated within its layers [19,20].
Compositional variations of mackinawite have been determined by several authors. Clarke et al. summarized some of the earlier results and suggested a composition in the range of MS0.93–MS0.96, where M = Fe2+ + Ni2+ + Co2+, with nickel making up to 10% by weight [21]. Results based on electron microprobe analysis of Ni and Co-free mackinawite, gave ratios of FeS0.9–FeS0.946 [22]. Ward et al. concluded that phase-pure mackinawite can be represented by the formula FeS0.94 [23]. Taylor and Finger et. al. found crystallographic evidence confirming analytical suggestions that mackinawite is sulfur-deficient (FeS1−x, typically 0 ≤ x ≤ 0.07) [24].
The (001) basal plane is by far the thermodynamically most stable surface of FeS and it encloses the largest area of its crystal morphology, which has a thin and tabular form [25,26]. Despite its large surface area, the stoichiometric FeS (001) surface is unreactive towards adsorbing species, such as H2O, NOx and CO2 [26,27,28,29]. However, as the experimental material is sulfur-deficient, here we investigate the effects of sulfur vacancies in the FeS (001) surface on the activation of CO2 and its hydrogenation reduction reactions. The existence of oxygen vacancies at metal oxide surfaces has been demonstrated to promote CO2 adsorption and its activation [30,31,32]. Recent density functional theory (DFT) investigations, for example, have shown that bent CO2− species are formed at the Zn-terminated ZnO (0001) surface via inserting one of the O atoms of the CO2 molecule into the vacancy [31,32,33]. The presence of surface oxygen vacancy sites on In2O3 (110) promote the formation of methanol via CO2 hydrogenation reactions [34]. Also, the adsorption of CO2 has been demonstrated to be thermodynamically more favourable at reduced CeO2 (110) surface containing oxygen vacancies than at the stoichiometric CeO2 (110) [35]. Compared with the numerous studies on the reduction of CO2 on metal oxide catalysts [36,37,38,39,40,41,42], only a few studies have reported on metal sulfides [15,16,29].
The present study presents a comprehensive DFT mechanistic investigation of the activation and reduction of CO2 on defective FeS (001) surface. We first examined the energetics of sulfur vacancy formation on the FeS (001) surface, subsequently investigating the adsorption and electronic properties, including charge transfer and vibrational frequency assignments for the CO2 activation. Finally, we discuss the thermodynamics and calculated activation energy barriers of the elementary steps involved in CO2 reduction through the reverse water–gas shift reaction (CO2 + H2 → CO + H2O) on the defective FeS (001) surface.
2. Results and Discussion
2.1. Bulk and Surface Characterisation
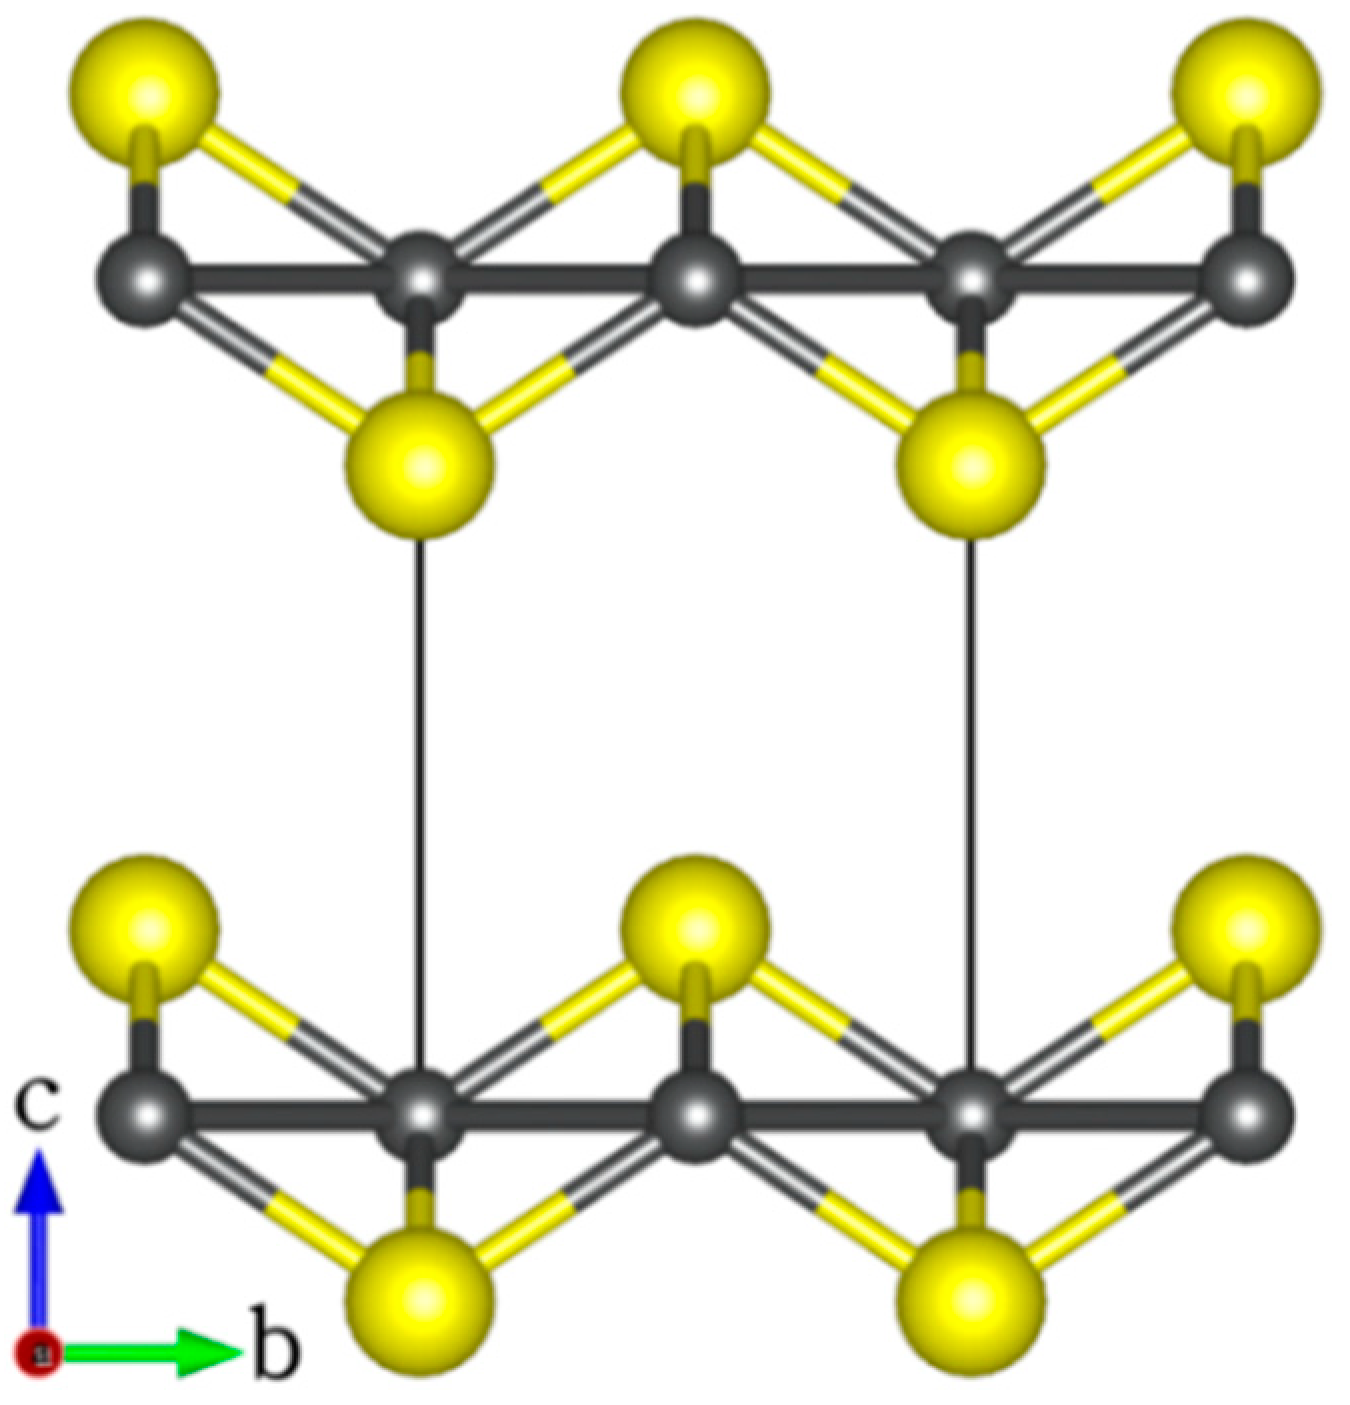
FeS adopts the tetragonal structure (space group P4/nmm) with lattice parameters a = b = 3.674 Å, c = 5.033 Å, and c/a ratio = 1.370 Å [43,44,45] as shown in Figure 1. The structure is composed of vertically stacked two-dimensional FeS layers in the c-direction that are held together by weak Van der Waals forces [43,44,45]. A full unit relaxation yields the unit cell parameters a = b = 3.615 Å, c = 5.001 Å, and c/a ratio = 1.383 Å, all of which are in good agreement with commonly reported experiment values [43,44,45].
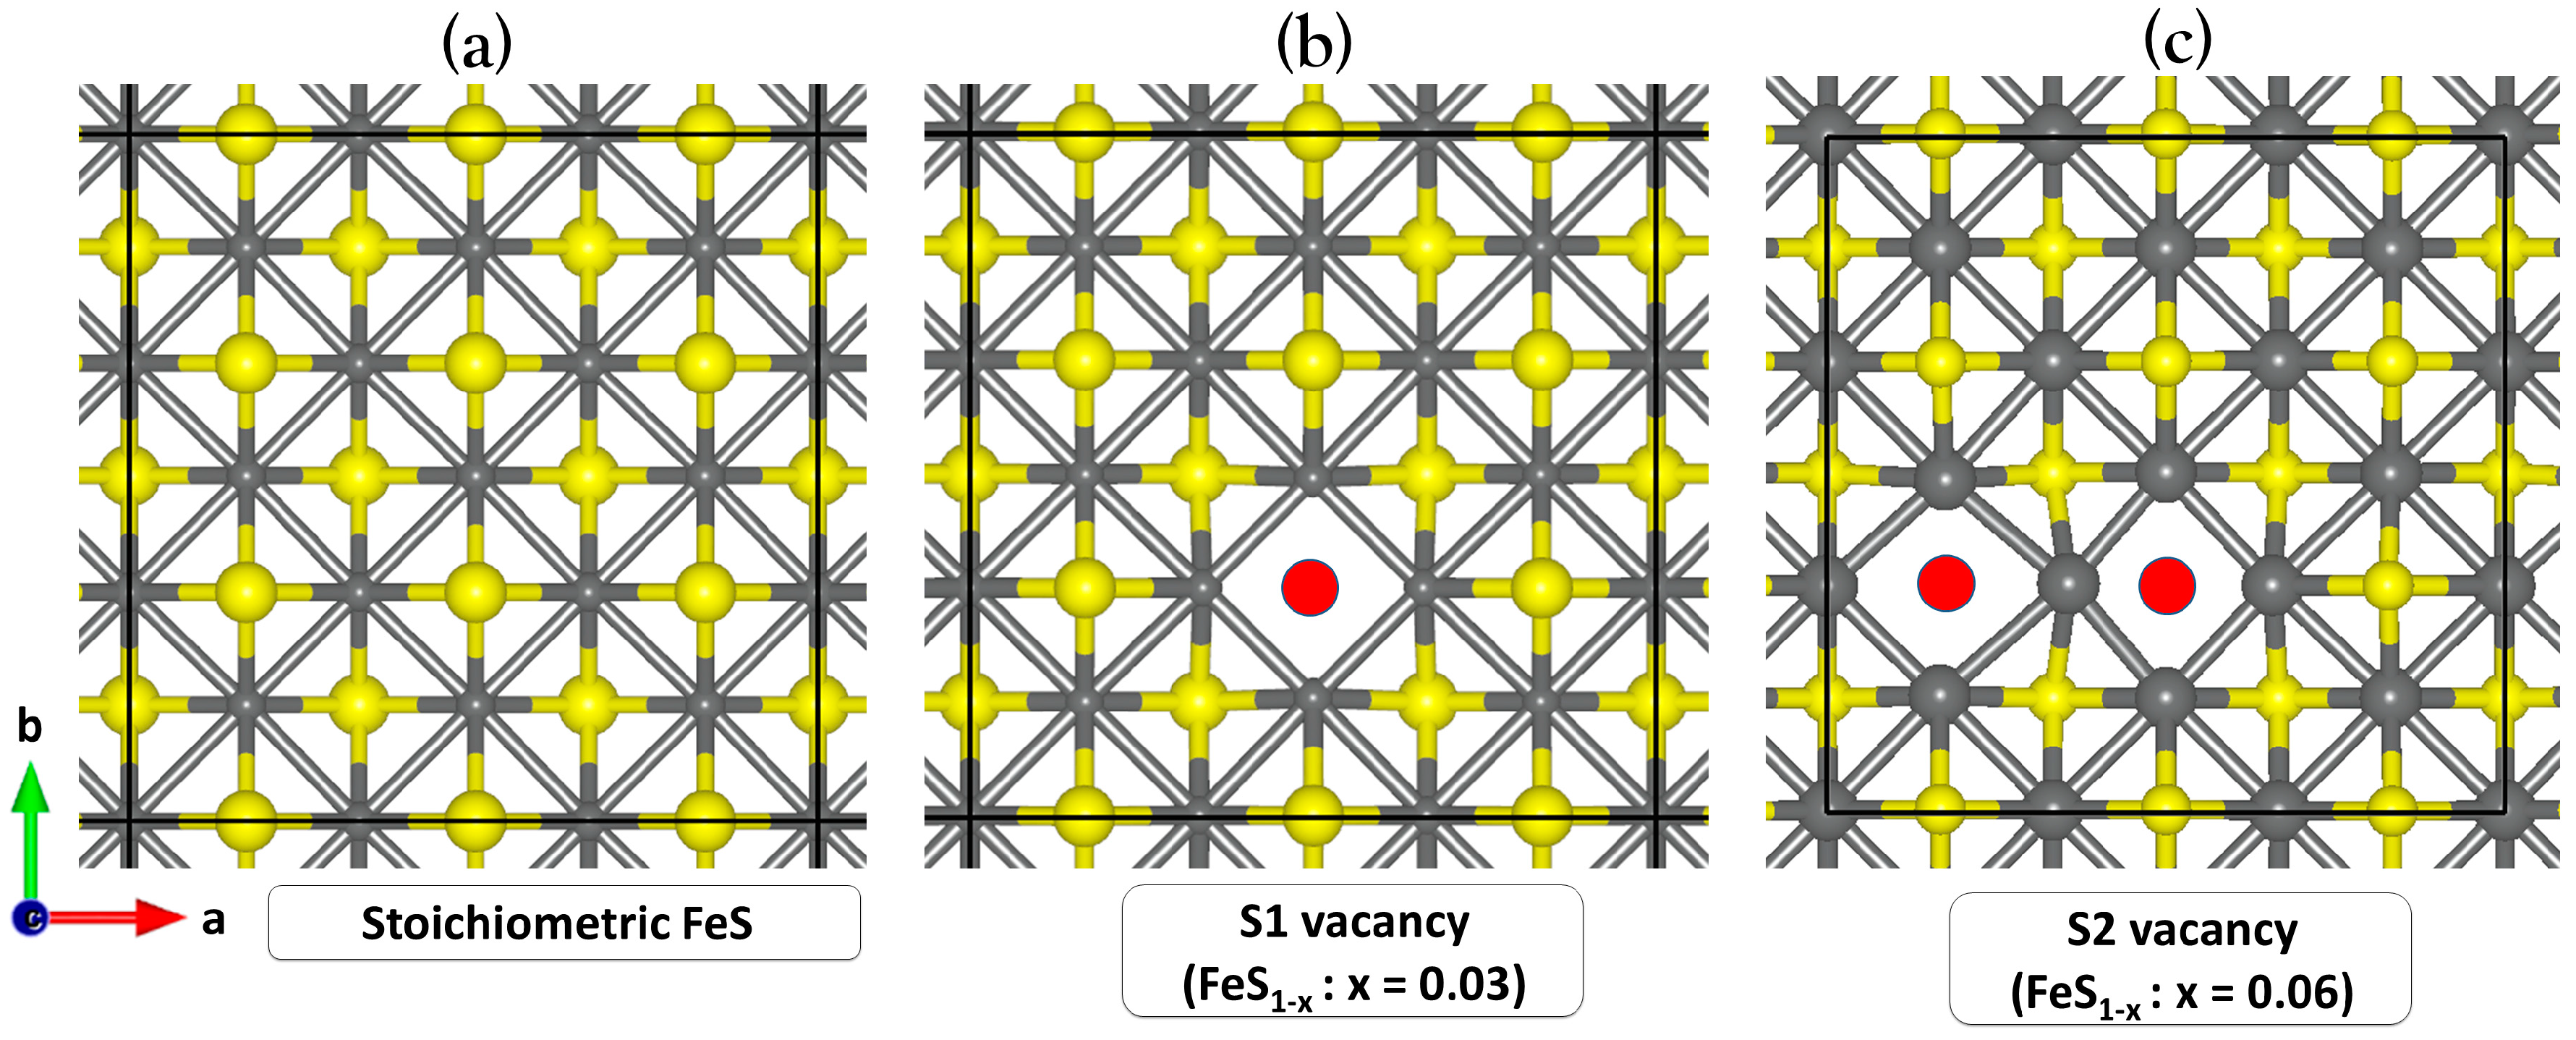
Displayed in Figure 2a is a (3 × 3) supercell of the perfect FeS (001) surface, showing that each iron atom is arranged in square-planar coordination with neighbouring irons, and the sulfur atoms are in an asymmetric one-sided four-fold coordination with iron. A single (VS1) or double (VS2) sulfur vacancy on the FeS (001) surface was created by removing one or two surface sulfur atoms from the perfect FeS (001) surface, as shown in Figure 2b,c. We observe small contractions in the exposed square-planar Fe–Fe distances in the defective (VS1) surface site, calculated at an average value of 2.466 Å compared to the 2.554 Å in the prefect stoichiometric (001) surface. For the VS2 surface, we observed both contraction and expansion in the exposed square-planar Fe–Fe distances, with the shortest and longest Fe–Fe distances calculated at 2.379 and 2.731 Å, respectively.
The formation energy per vacancy (Eform) of the surface containing n sulfur vacancies is defined as:
where are the total energies of a (3 × 3) FeS supercell without and with n sulfur vacancies. The chemical potential of S atom (), is taken under S-rich condition to be equal to the calculated from orthorhombic S8. The formation energy of a single sulfur vacancy (VS1) in the (3 × 3) FeS supercell is found to be 1.53 eV, while that for two sulfur vacancies (VS2) adjacent and far from each other is 1.71 eV and 1.85 eV, respectively. Although the sulfur vacancy formation energies are endothermic, the energy required is not excessively high, suggesting that sulfur vacancies can form in the FeS basal plane. Moreover, we found that the creation of S vacancies lowers the work function (Φ) of the perfect (001) surface from 4.72 eV to 4.33 eV for the single S vacancy surface and down to 4.06 eV for the double S vacancy surface. The reduced work function has implications for CO2 activation as it favours electron transfer processes.
2.2. Adsorption of CO2 on Perfect and Defective FeS (00) Surface
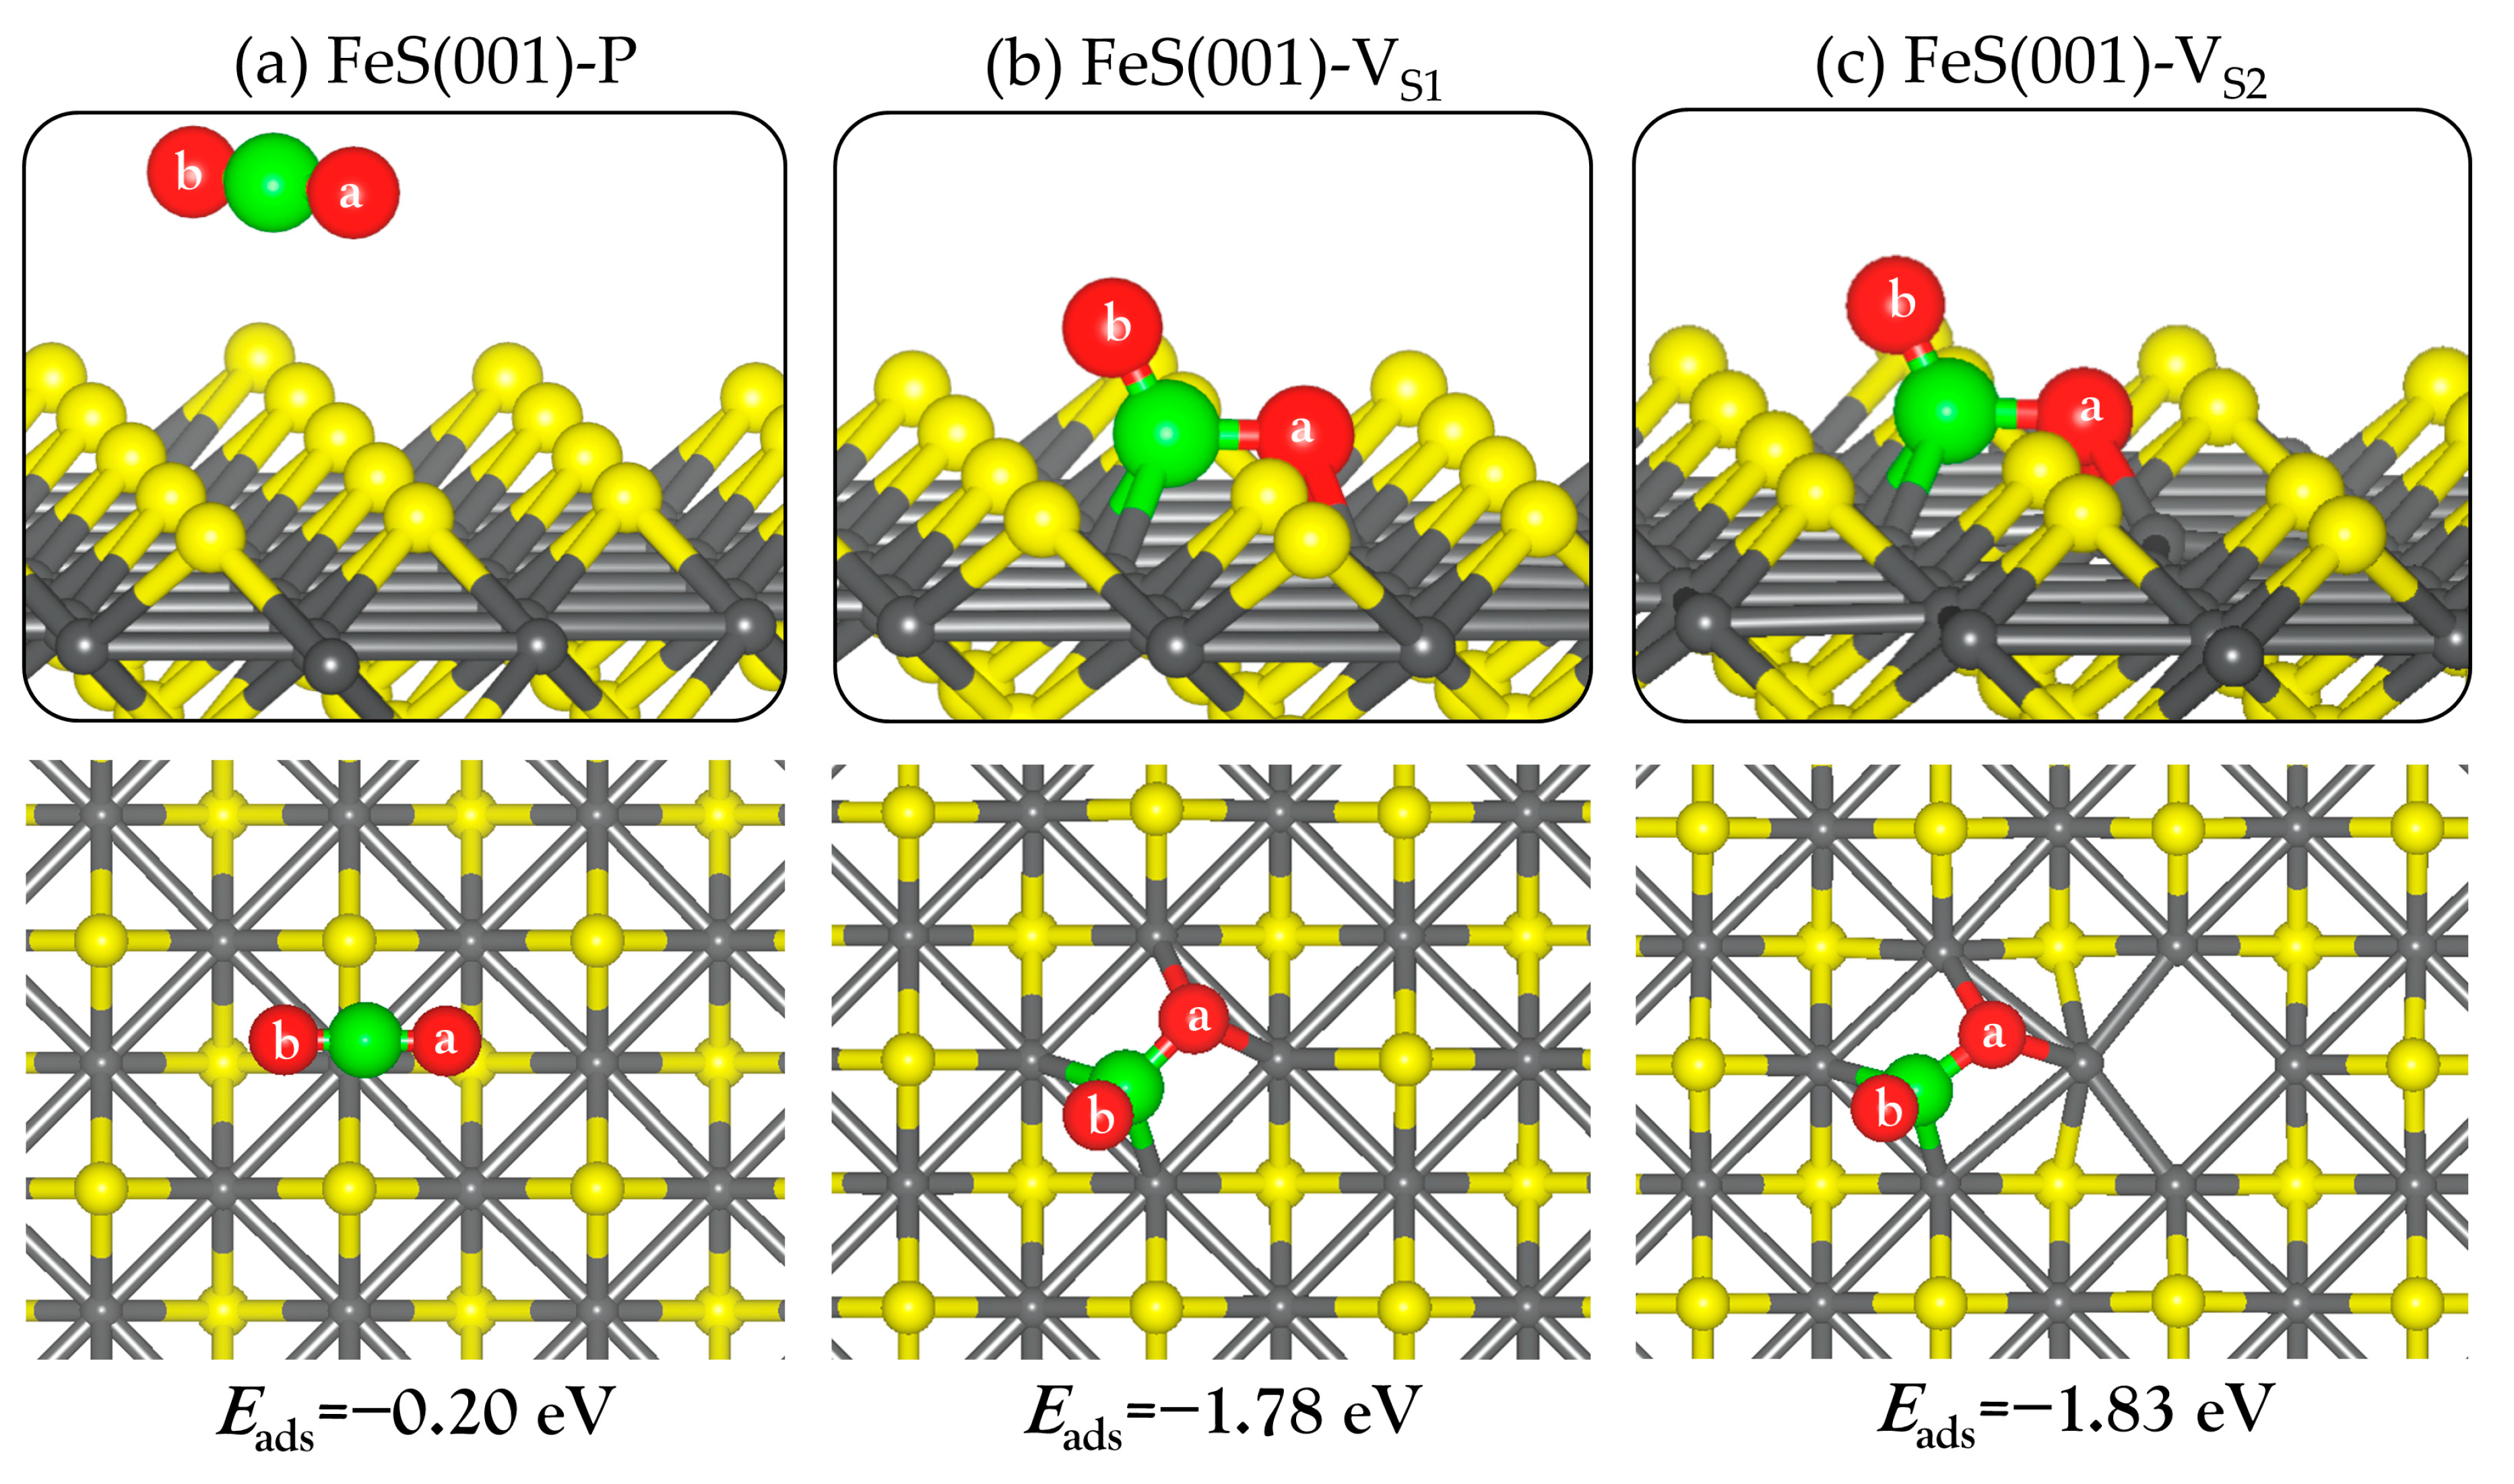
First, we investigated the adsorption of CO2 on the perfect and defective FeS (001) surfaces by optimizing different initial adsorption configurations of the CO2 molecule. At the perfect FeS (001) surface, the CO2 molecule is physisorbed (Figure 3a) releasing an adsorption energy −0.20 eV. The layer of S−2 ions terminating the surface shields the inner Fe+2 ions, giving rise to repulsive interactions between the oxygen atoms in the CO2 molecule and the surface S−2 ions [29]. The adsorption energy (Eads), selected structural parameters, charge transfers (Δq(CO2)), and vibrational frequencies are summarized in Table 1. The CO2 remained linear with no change in the C–O bond distances relative to the gas phase molecule, which is consistent with no charge transfer to the CO2 molecule upon adsorption. Thus, we can conclude that the perfect FeS (001) does not activate the CO2 molecule.
The CO2 molecule on the other hand, chemisorbs strongly at the defective surfaces, binding to the exposed Fe sites (Figure 3b,c). The adsorption energy for CO2 at the defective VS1 and VS2 surfaces is calculated at −1.78 and −1.83 eV, respectively. The CO2 molecule gained a significant amount of charge from the interacting surface Fe ions, resulting in the formation of negatively charged bent species (CO2δ−) with elongated C–O bond distances (see Table 1). Bader population analysis shows that charges of 1.14 and 1.23 e− were transferred from the interacting surface Fe ions to the CO2 molecule at the defective VS1 and VS2 surfaces, respectively. The amount of charge gained is consistent with the lower work function predicted for the defective surfaces compared to the perfect stoichiometric surface. At the defective VS1 surface, the C–O bonds are predicted to be 1.417 Å for C–Oa and 1.230 Å for C–Ob, compared to 1.174 Å in the gas phase. Similarly, at the defective VS2 surface, the C–O bonds are elongated to 1.429 for the C–Oa and 1.229 Å for the C–Ob bonds. The α(OaCOb) bond angle for the adsorbed CO2 molecule at the defective VS1 and VS2 surfaces is calculated at 118.2° and 118.1°, respectively, compared to the gas-phase linear (180.0°) molecule. The elongated C–O bonds are confirmed by vibrational frequency analyses, presented in Table 1. For instance, the asymmetric (υas) and symmetric (υs) C–O stretching and the bending (υb) vibrational modes for the adsorbed CO2 at the defective VS1 surface are calculated at 1547, 809, and 672 cm−1, respectively. Compared to the gas phase C–O stretching modes (2373 and 1323 cm−1), it is worth noting that both the υas and υs modes of the adsorbed CO2 molecule are significantly red-shifted, a property which could be tested experimentally. These results are consistent with previous DFT studies which showed that the existence of oxygen vacancy defects on metal oxide ZnO (0001) [31,32,33], In2O3 (110) [34], CeO2 (110) [35] and β-Ga2O3 (100) [42] surfaces promote CO2 adsorption and activation.
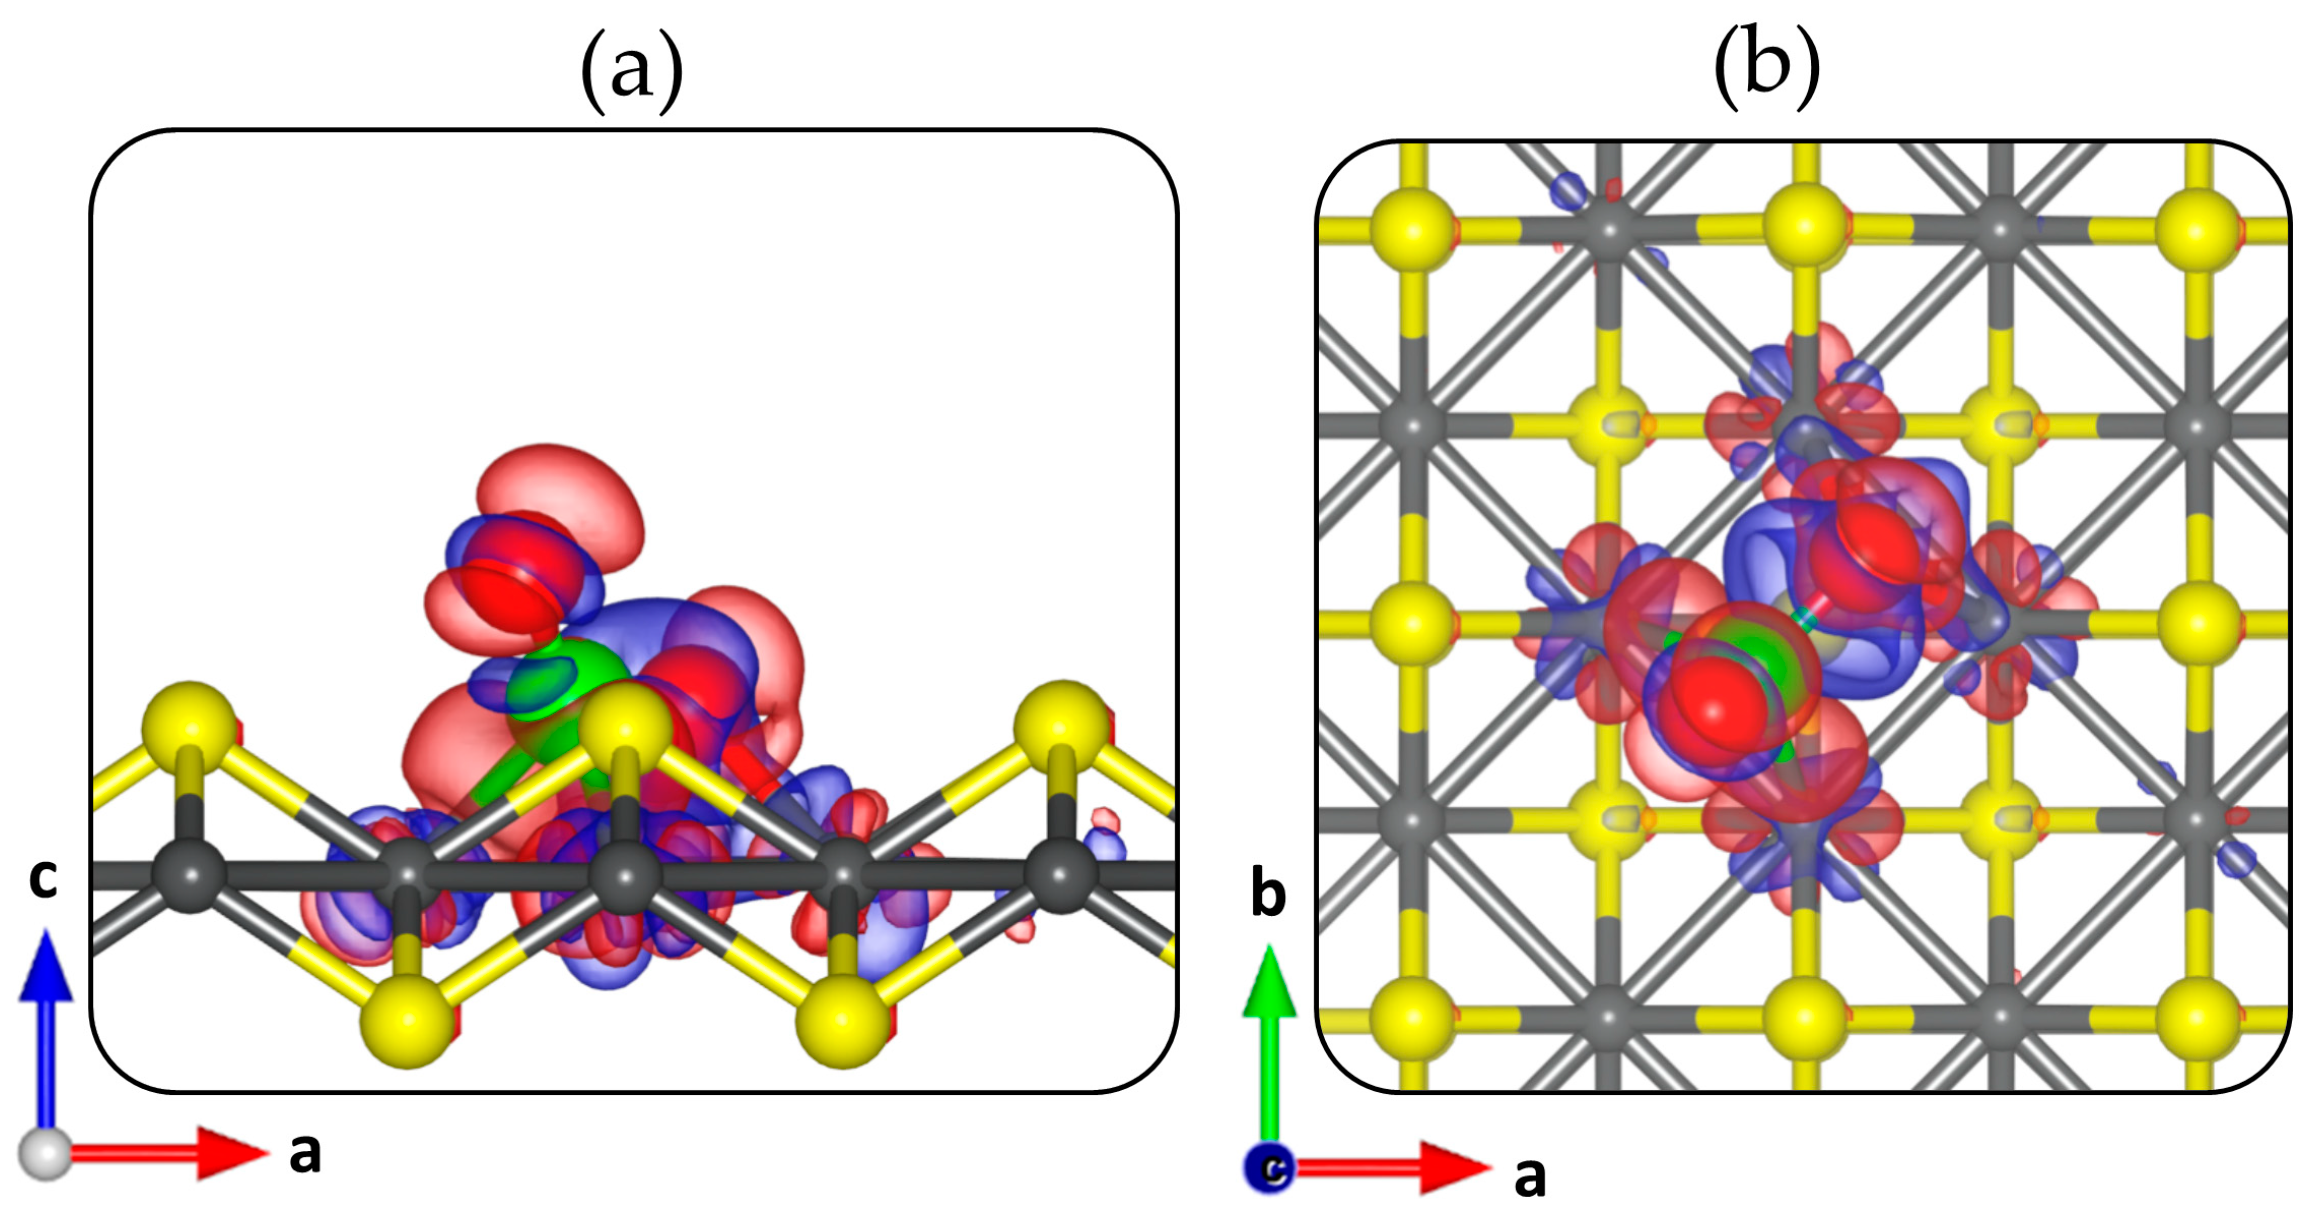
Insight into the charge density redistribution in the CO2–FeS adsorption system at the defective FeS (001) surfaces, was ascertained from the differential charge density (Δρ) iso-surface plot, which is calculated as:
where ρ(FeSsurf + CO2), ρ(FeSsurf) and ρ(CO2) denotes the electron density of the FeS–CO2 systems, the naked defective FeS (001) surface and the isolated CO2, respectively, with the atomic positions kept the same as those of the total FeS–CO2 system. The electron density difference isosurface plot, shown in Figure 4 reveals electron density redistribution within the CO2–FeS system at the defective VS1 surface. A significant electron density accumulation within the newly formed C–Fe and O–Fe bonds is observed, which is consistent with chemisorption.
Δρ = ρ(FeSsurf + CO2) − (ρ(FeSsurf) + ρ(CO2))
2.3. Adsorption and Dissociation of H2 on Perfect and Defective FeS (00) Surface
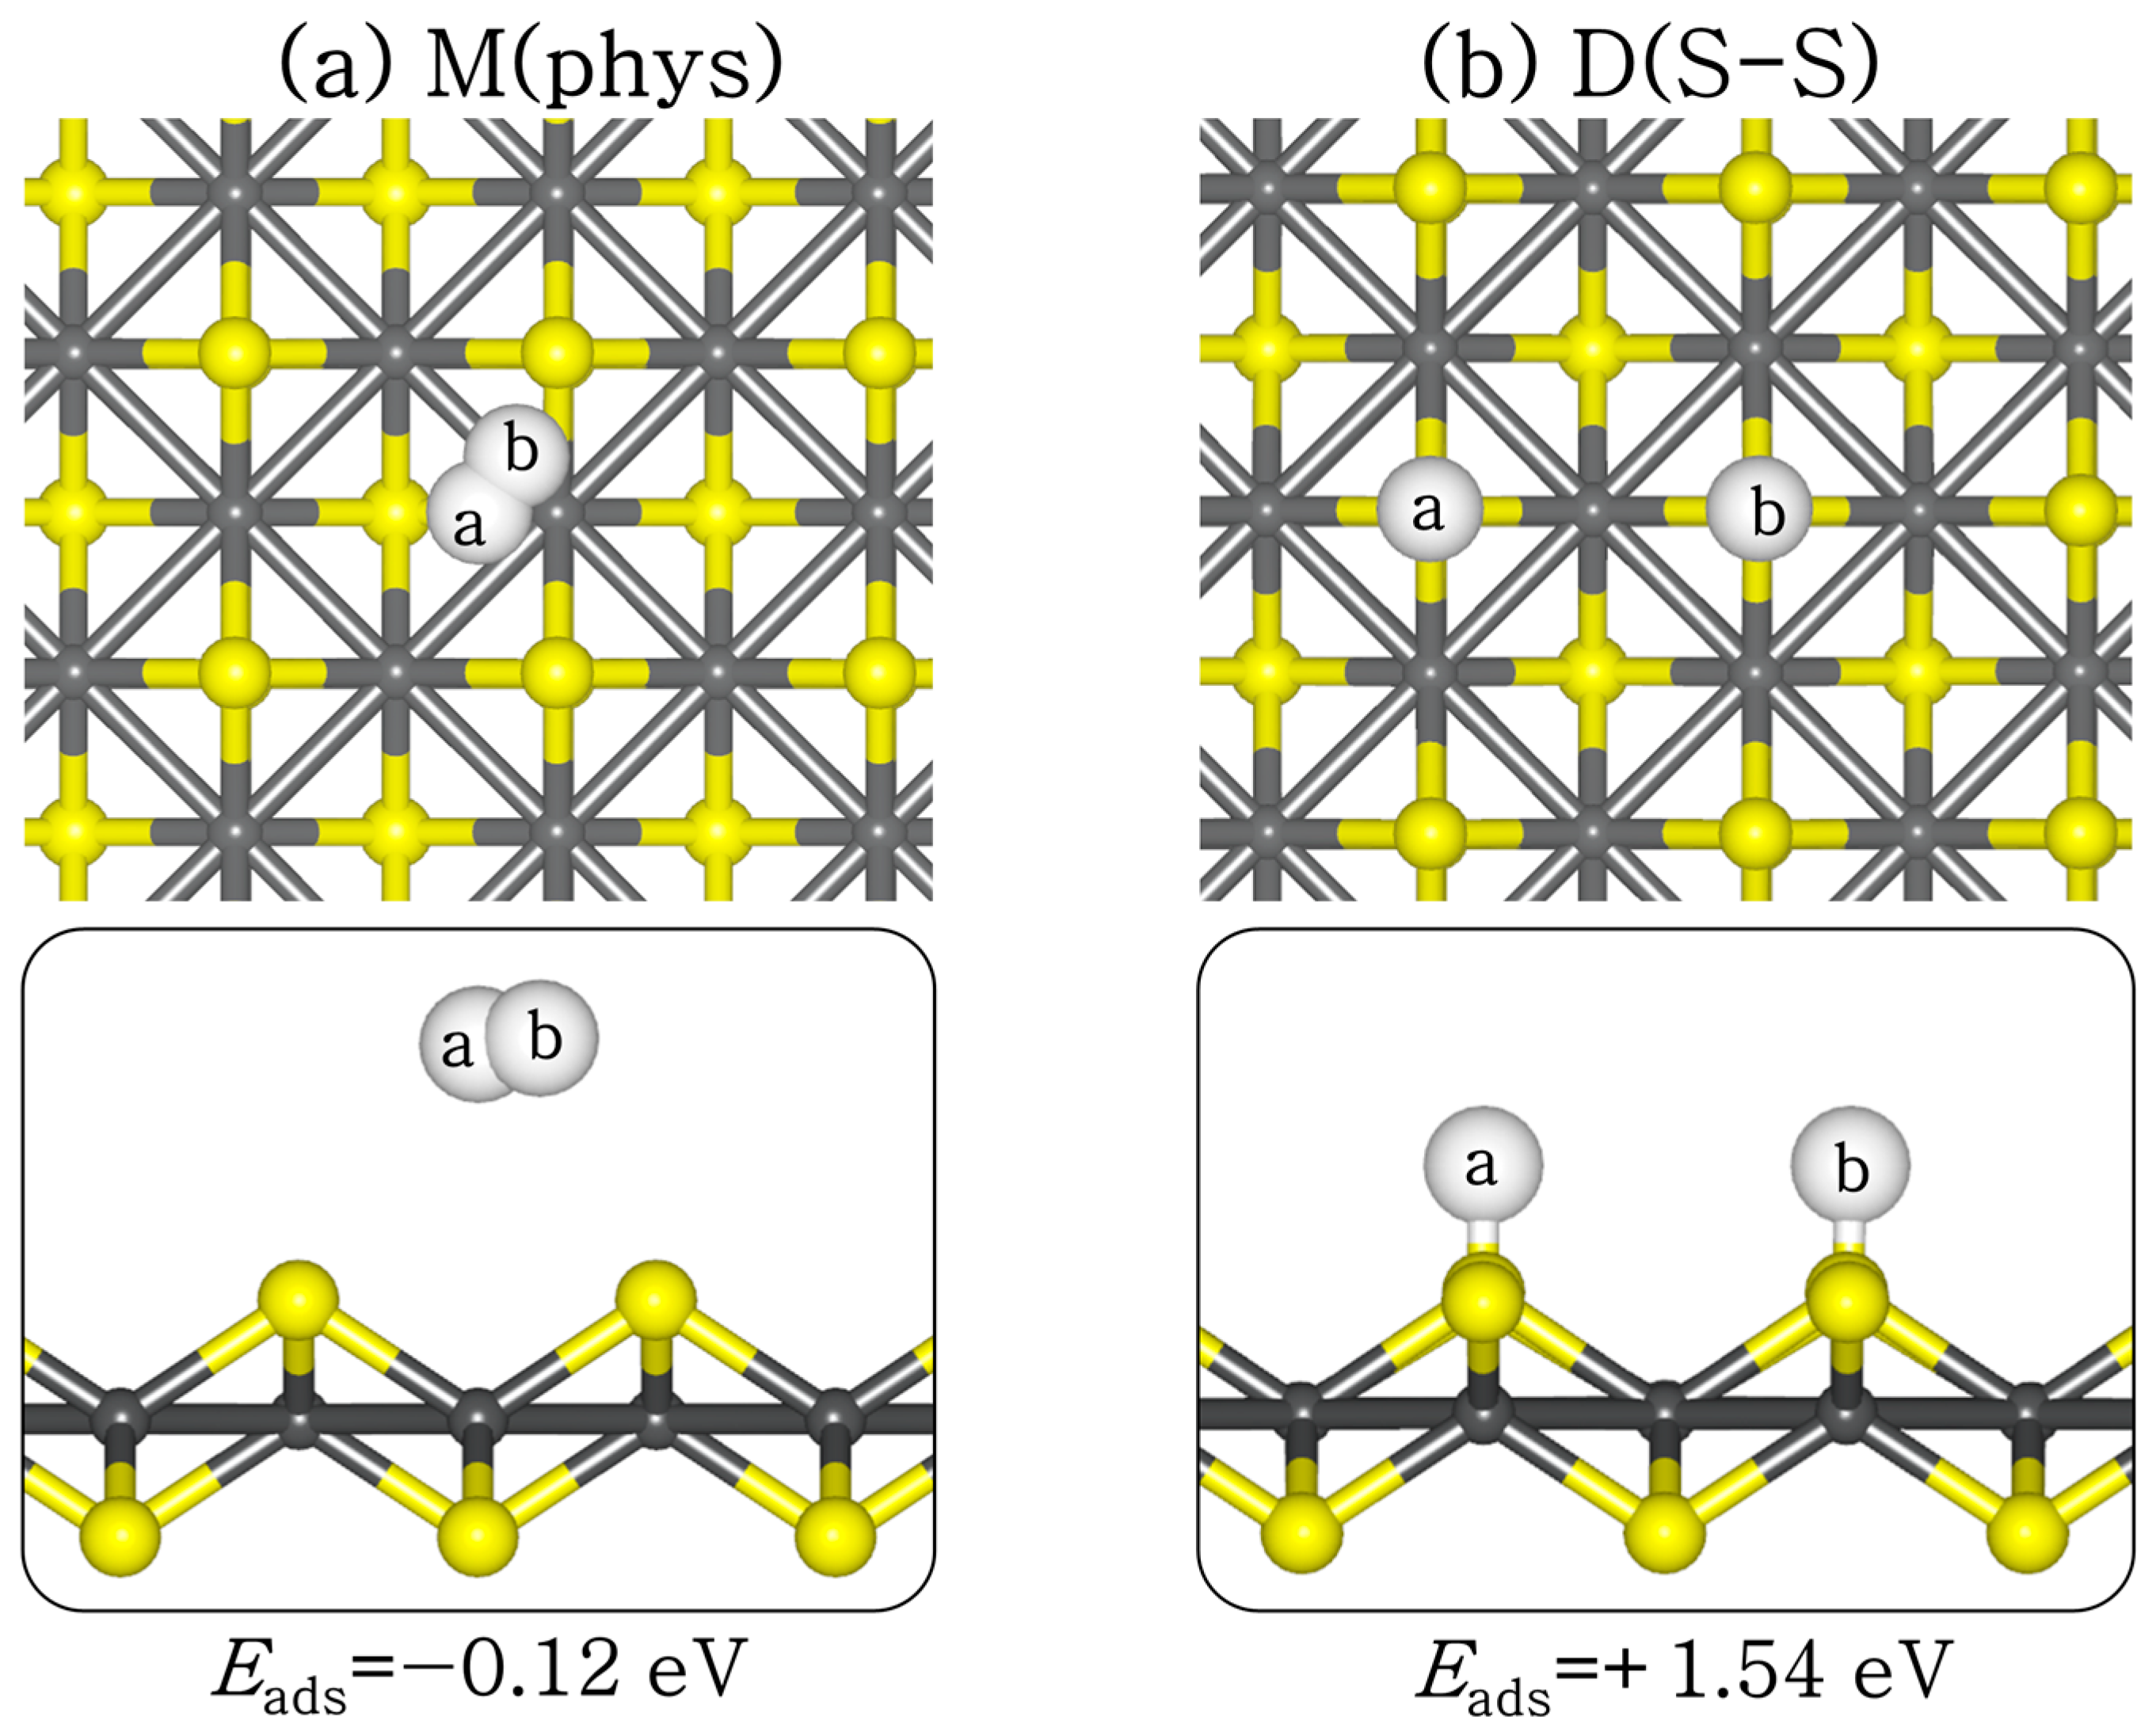
H2 adsorption and dissociation will potentially impact CO2 binding via competitive adsorption at the active sites, and subsequently influence CO2 reduction via hydrogenation reactions. Therefore, we have systematically investigated the structures and energetics of molecular and dissociative H2 adsorption on the perfect and defective FeS (001) surfaces. At the perfect FeS (001) surface, molecular H2 is physisorbed (Eads = −0.12 eV) with the closest hydrogen to surface distance (H–S) predicted at 3.289 Å (see Figure 5a). The H–H bond distance remained 0.75 Å, as in the gas phase. The dissociative adsorption of H2 is found to be endothermic (Eads = +1.54 eV) at the perfect FeS (001) surface (Figure 5b), with the dissociated H atoms binding to the S sites at an average S–H distance of 1.375 Å. The large energy difference between the molecular and the dissociative H2 adsorption suggests that H2 will preferentially desorb molecularly from the perfect FeS (001) surface rather than dissociate.
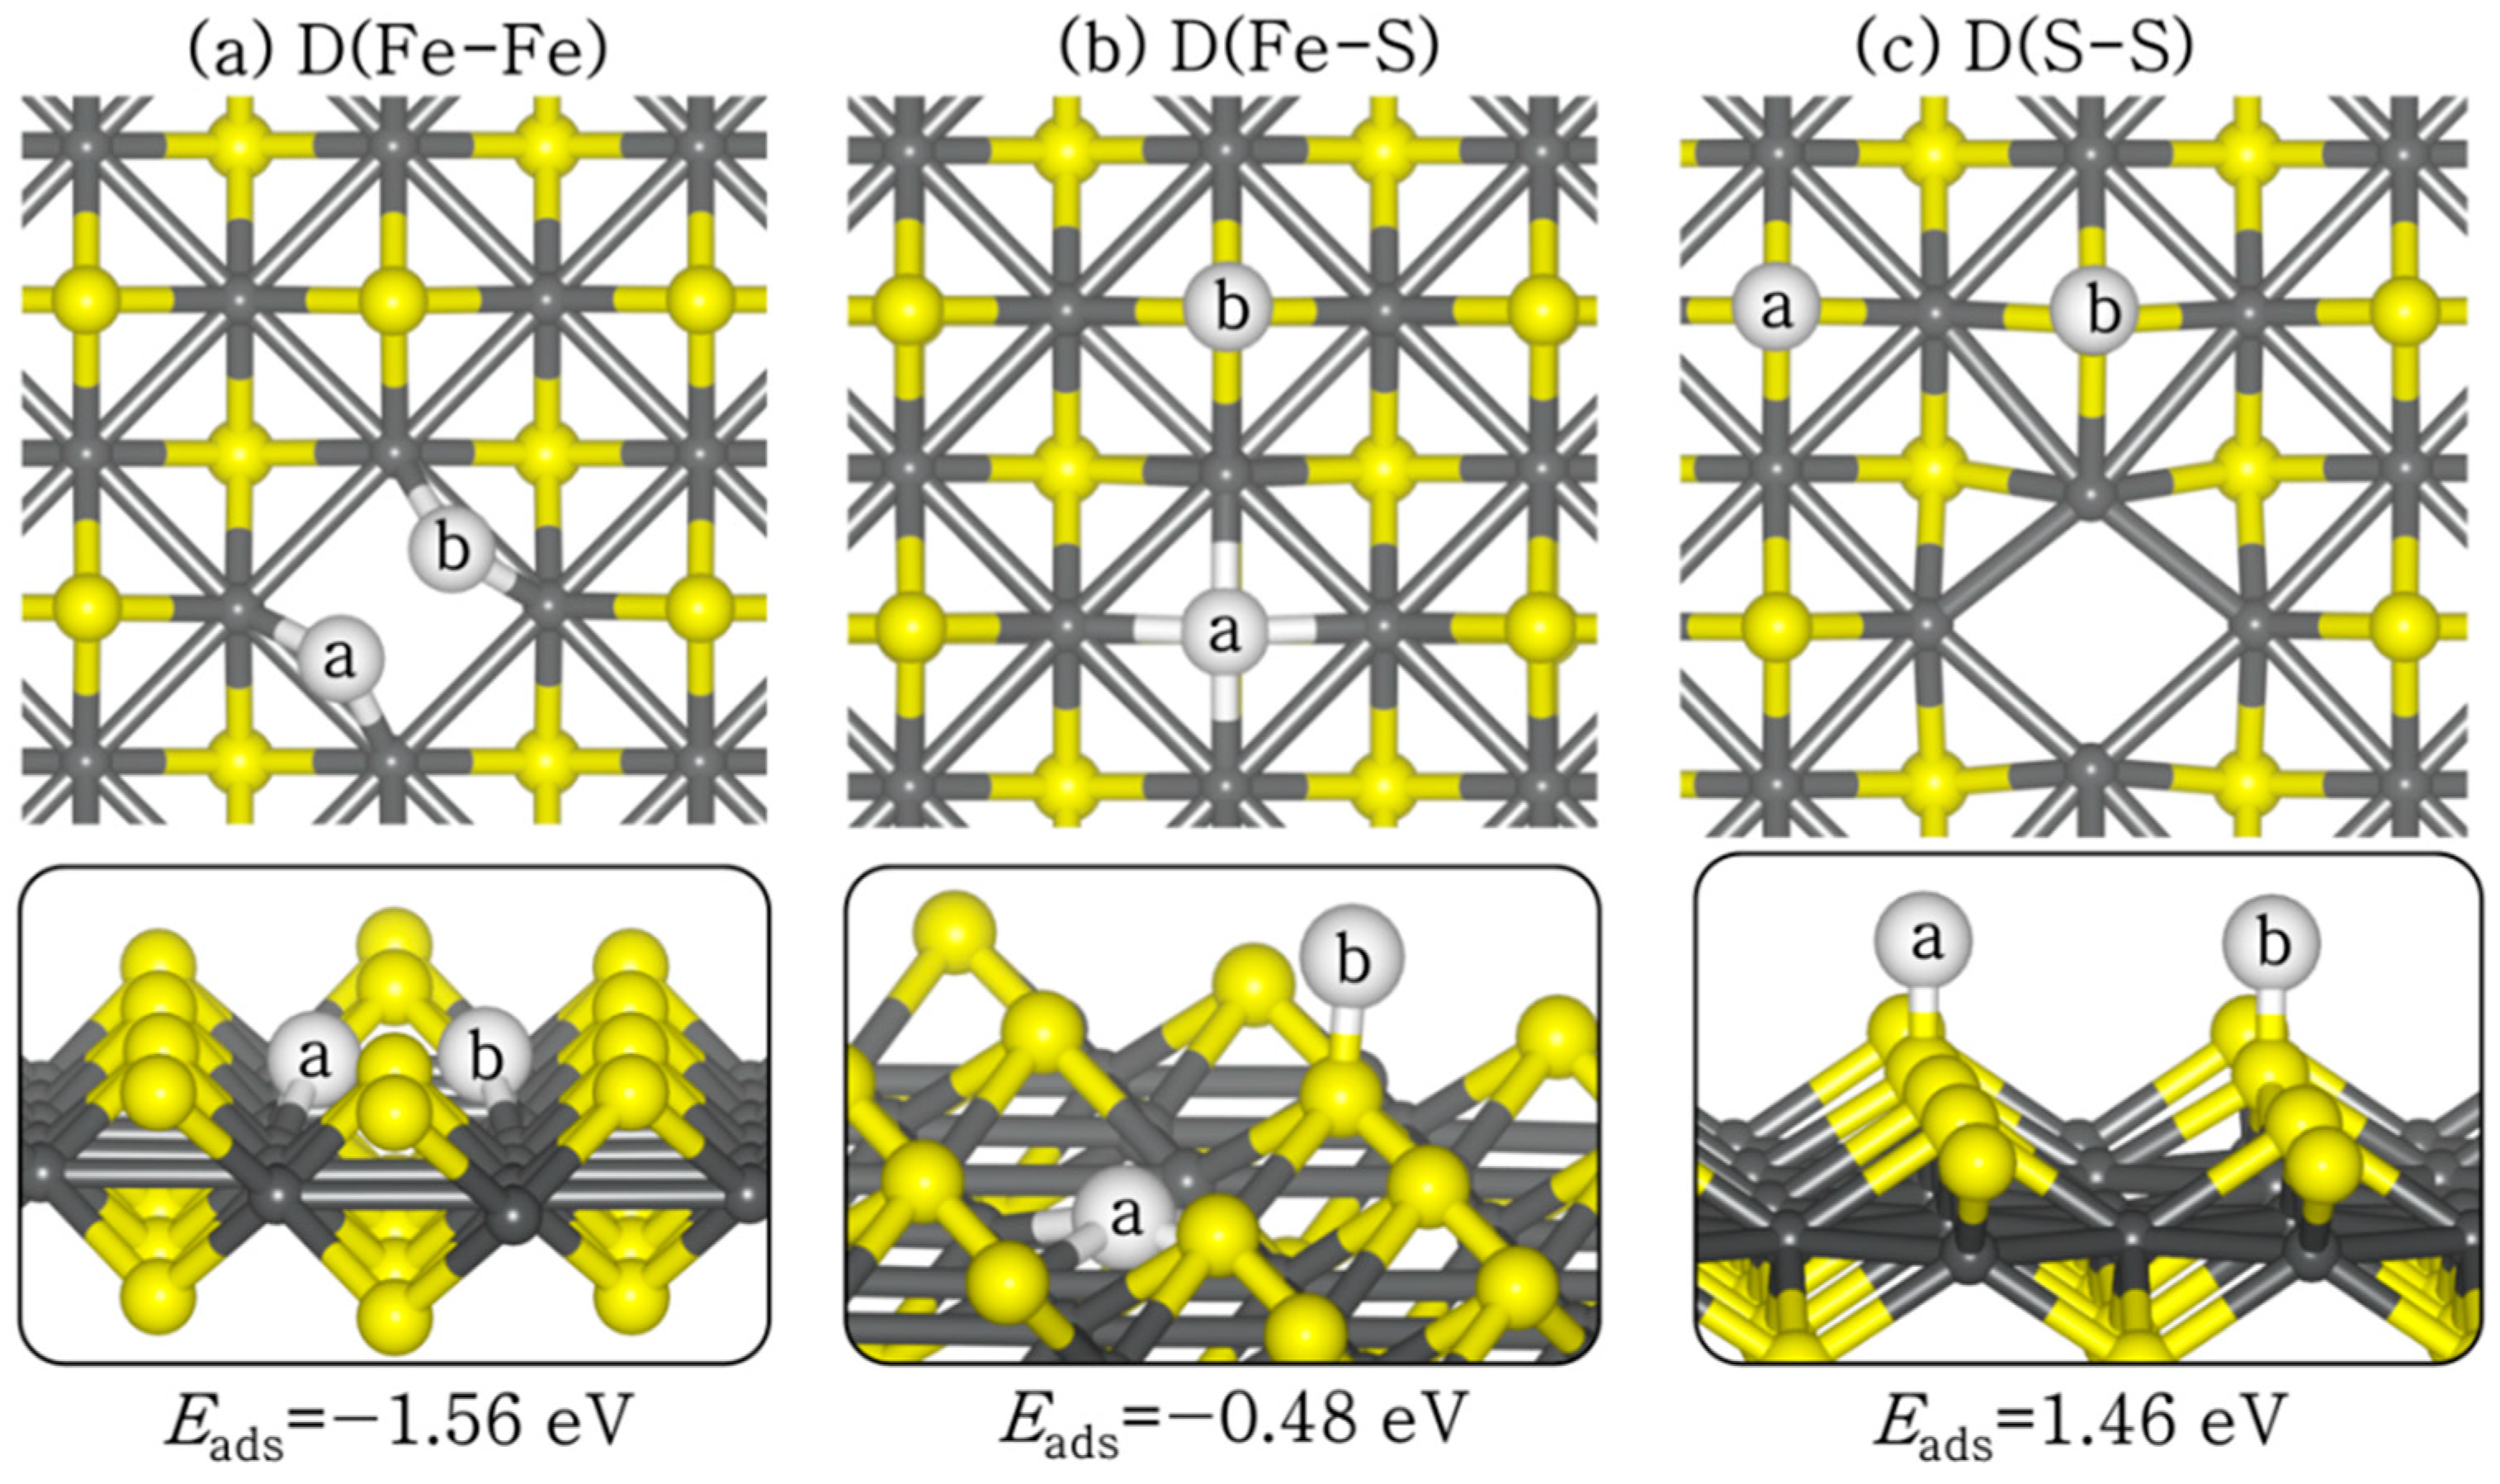
The adsorption of an H2 molecule at the defective VS1 FeS (001) surface resulted in spontaneous exothermic dissociation, as shown in Figure 6. The dissociative adsorption structures are labelled according to the sites to which the H atoms bind. For instance, D(Fe–Fe) corresponds to H atoms binding to two Fe sites, and D(Fe–S) corresponds to the H atoms binding at Fe and S sites. The adsorption energies of the D(Fe–Fe), D(Fe–S), and D(S–S) structures at the defective surface are calculated at −1.76 eV, −0.48 eV, and +1.46 eV, respectively. The exothermic adsorption energies calculated for the D(Fe–Fe) and D(Fe–S) structures, compared to the endothermic adsorption energy of the D(S–S) structure on the perfect surface, show that the exposed Fe sites due to the creation of an S vacancy are the active sites for H2 dissociation. The newly formed S–H bonds have the same bond length (1.374 Å), whereas the Fe–H bonds are slightly different in each adsorption configuration, ranging from 1.585–1.839 Å, as shown in Table 2.
2.4. Coadsorption and Reaction of CO2 and H2 on Defective FeS (00) Surface
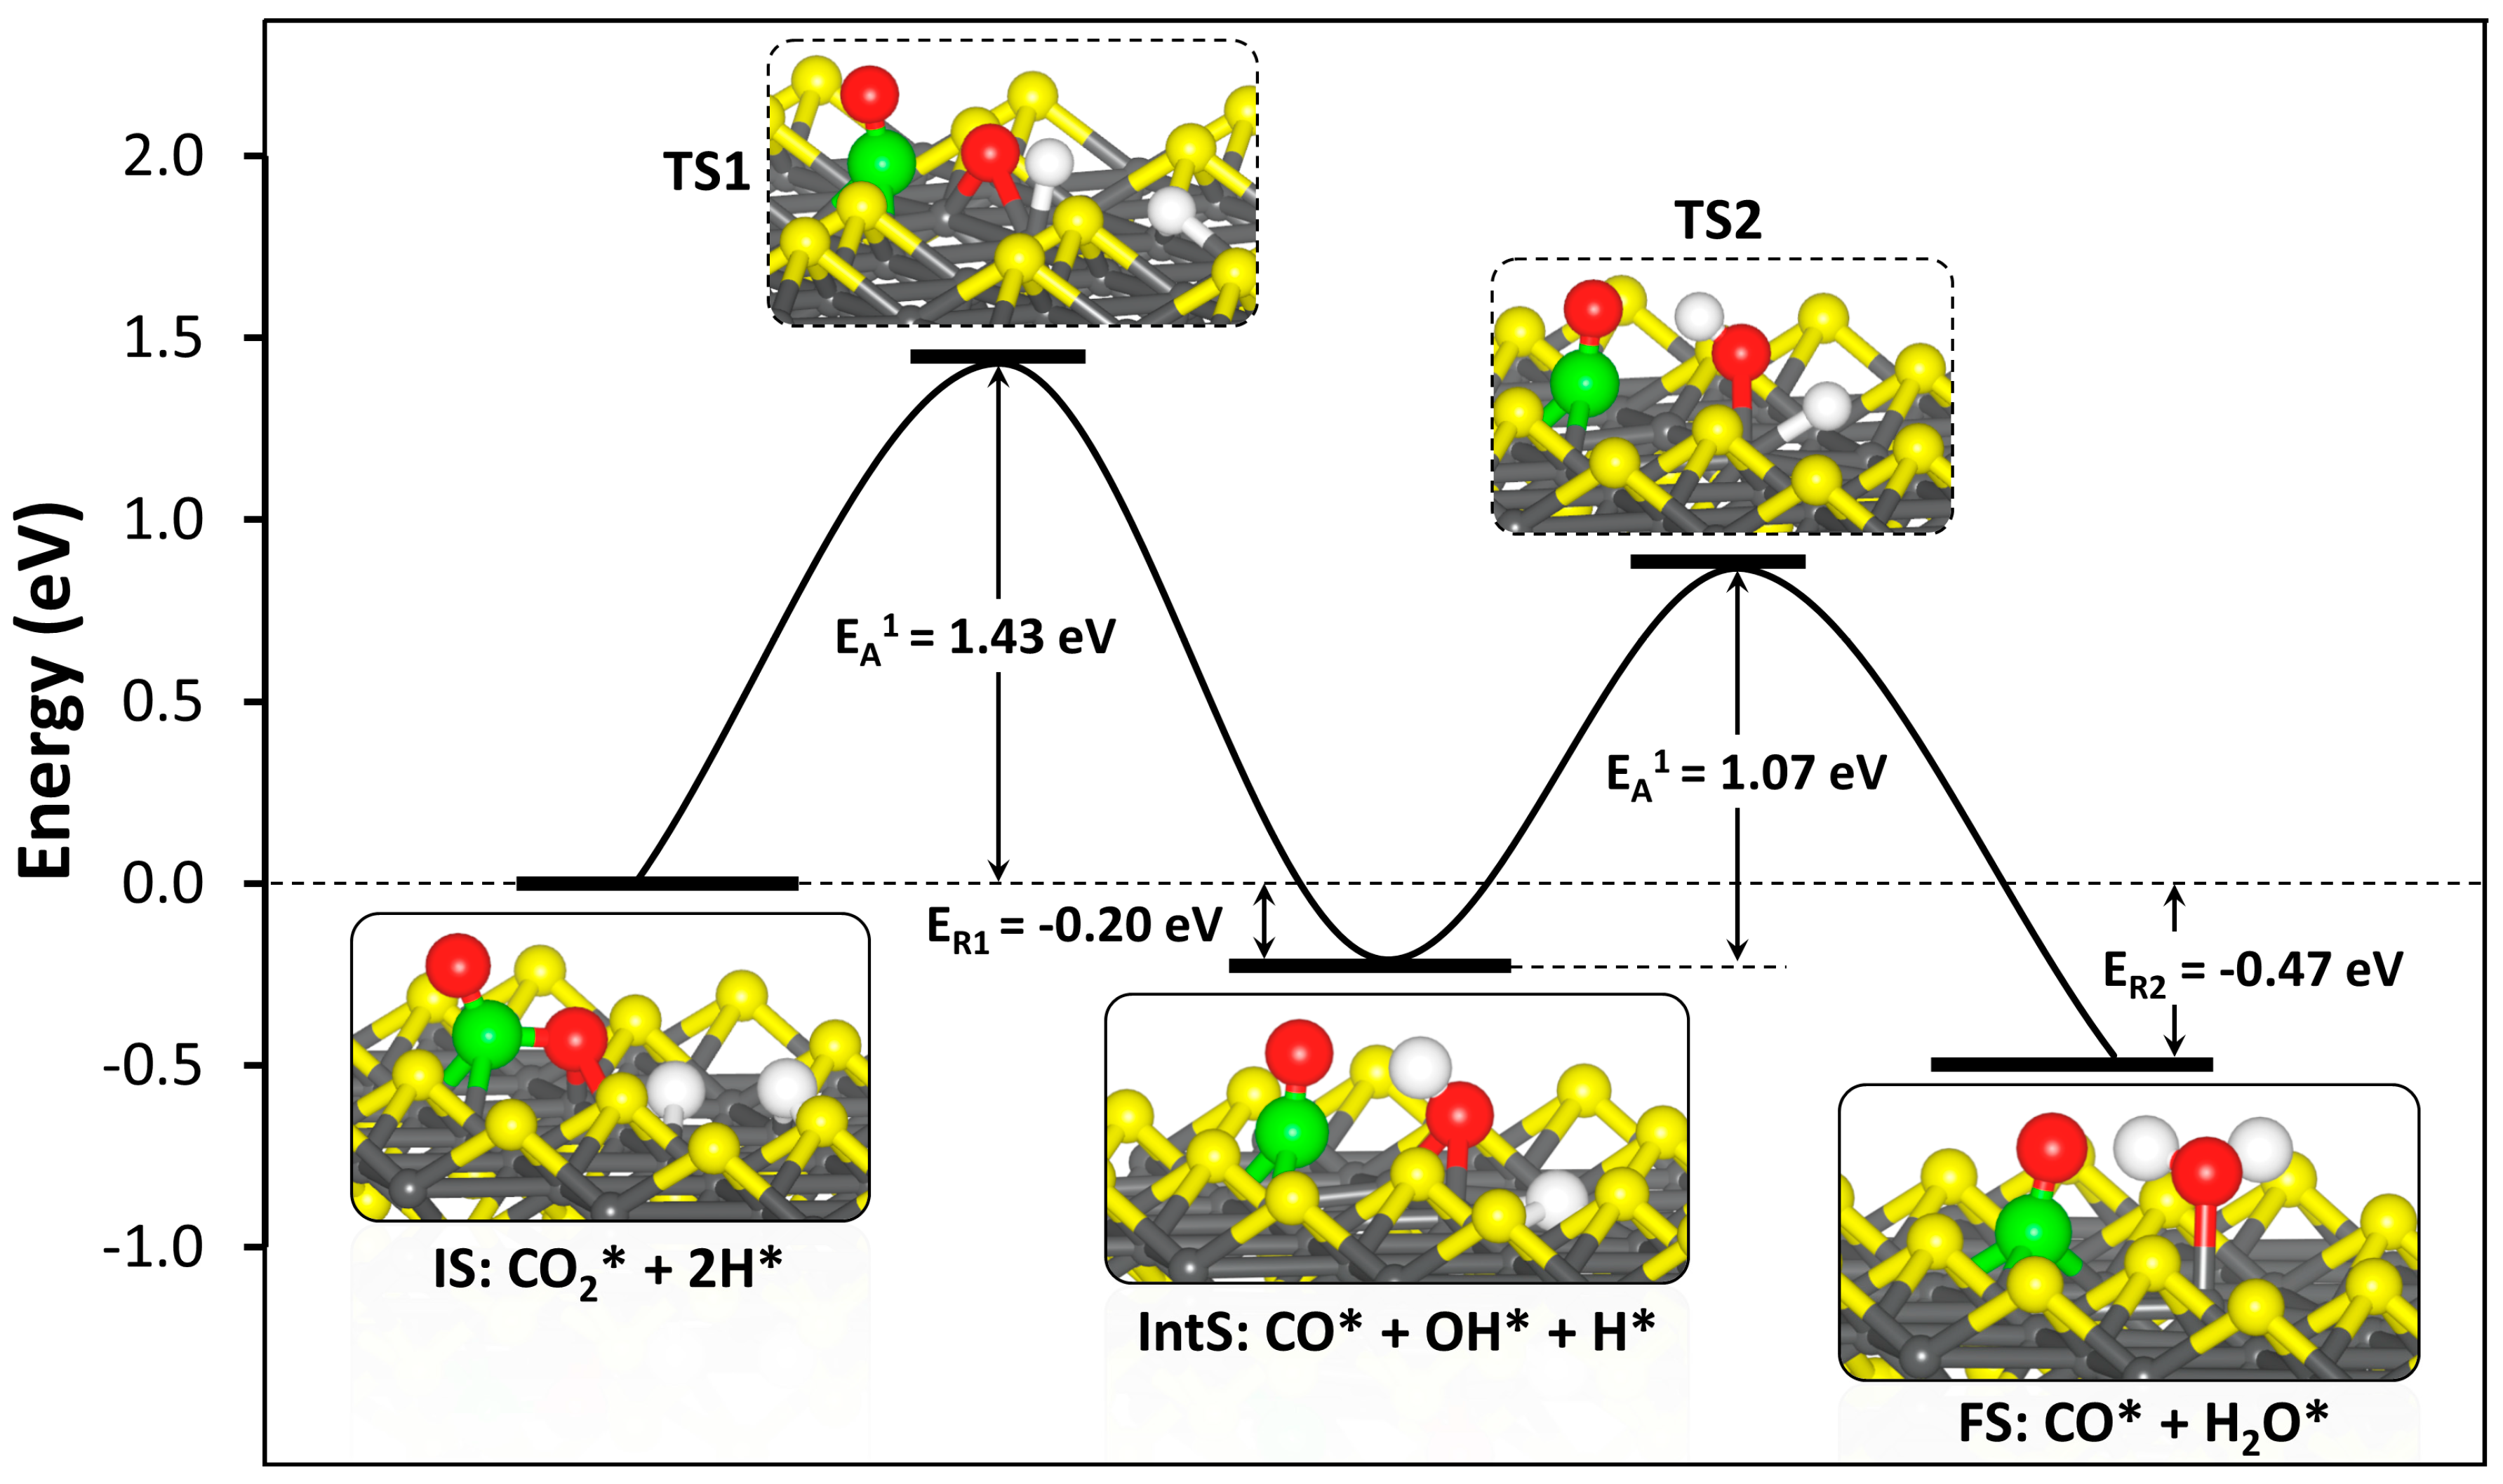
The reduction of CO2 is one route for its removal and sequestration or utilization, as the reduced species may prove to be a valuable feedstock for other processes. Generally, CO2 reduction may occur through the reverse water-gas shift reaction (CO2 + H2 → CO + H2O), a major side reaction in methanol synthesis. Therefore, we have analyzed the reactions between CO2 and H adatoms and determined the reaction pathway on the defective VS2 FeS (001) surface. Different possible CO2 and H2 coadsorption structures were explored to determine the lowest-energy coadsorption structure (IS, Figure 7). In the coadsorption structure, the adsorption structures of CO2 and H adatoms are identical to that of the isolated individual species. The coadsorption energy with respect to free CO2 and H2 was calculated at −3.68 eV, which is more exothermic than the sum of the isolated adsorption energies of CO2 and 2H (−3.34 eV). The increased stability of the coadsorbed system indicates an attractive interaction between the CO2 and H adatoms on the defective FeS (001) surface. By allowing the H adatoms to react with the adsorbed CO2, we have calculated the reaction energies and activation barriers of the hydrogenation reactions of the activated CO2 molecule on the defective FeS (001) surface.
Attachment of the first hydrogen to the carbon centre to form the formate (HCOO) intermediate structure was not possible as the carbon centre is fully saturated, preventing the attachment of hydrogen atoms. Hydrogenation of the surface-bound Oa ion first (COOH) results in the dissociation of the C–O bond to form CO and OH species adsorbed at adjacent bridging Fe sites (Figure 7). This reaction step is exothermic by 0.20 eV with an activation energy barrier of 1.43 eV. The formation of a COOH intermediate by hydrogenating the unbound Ob ion first was found to be less exothermic (ER1 = −0.08 eV) with a higher activation barrier of 1.65 eV, suggesting that hydrogenating the surface bound Oa ion first represents a more favourable route. In the transition state (TS1), the distance between the surface bound Oa ion and the approaching H atom (O–H) was calculated at1.498 Å, whereas the Fe–H bond was calculated at 1.462 Å. The dissociating C–O bond in the TS1 structure was calculated at 1.895 Å compared to 2.542 Å in the intermediate structure (IntS: CO* + OH* + H*). The hydrogen atom of the formed OH species in the intermediate state is oriented towards the O atom of the CO fragment at a distance of 1.841 Å.
The second hydrogenation step involves the diffusion of the second H atom towards the formed OH species from the first hydrogenation step to form CO and H2O. The formation CO and H2O is found to be an exothermic process with a reaction energy of −0.47 eV and a lower activation energy barrier of 1.07 eV for the second hydrogenation step, compared to 1.43 eV for the first step. The higher barrier of the first hydrogenation step of CO2 to form CO and OH suggest that it is rate-limiting step in the reduction of CO2 to CO and H2O on the defective FeS (001) surface. In the second transition state (TS2), the distance between the approaching H atom and OH species to form water was calculated at 1.798 Å, whereas the Fe–H bond was calculated at 1.568 Å. The resulting water molecule interacts with an iron site through the oxygen atom at an Fe–O distance of 1.954 Å, with one of its hydrogen atoms oriented towards the O atom of the CO fragment at a distance of 1.481 Å.
Attaching the second hydrogen atom to the surface bound Oa ion of the less stable COOH intermediate from the first hydrogenation step, results in the formation of dihydroxymethylidene (C(OH)2), but this reaction is found to be highly endothermic (ER2 = +1.41 eV) with an activation barrier of 1.33 eV. The defective FeS (001), therefore, favours CO and H2O formation over a dihydroxymethylidene intermediate or formic acid. The isolated H2O molecule binds to the defective surface with an adsorption energy of −0.48 eV. The smaller adsorption energy of an isolated H2O compared to isolated CO2 (−1.83 eV for the double S-vacancy surface), suggests that when both species are present in the gas phase or solution, the CO2 molecules will outcompete H2O molecules for the active sulfur vacancy sites.
3. Computational Details
The DFT calculations were carried out within the VASP-Vienna ab initio simulation package (VASP) [46,47,48,49], using the projector augmented wave (PAW) potentials [50]. The electronic exchange-correlation potential was calculated using the Perdew–Burke–Ernzerhof (PBE) generalized gradient approximation (GGA) functional [51,52]. Non-local dispersion forces were accounted for using the Grimme DFT-D3 scheme [53]. An energy cut-off of 500 eV was used the expand the electronic wave functions and is found to be sufficient enough to converge the total energy and the Hellman–Feynman forces to within 10−6 eV and 0.001 eVÅ−1, respectively. A Monkhorst-Pack [54] k-point mesh of 11 × 11 × 11 and 5 × 5 × 1 were used to sample Brillouin zone of the bulk and (001) surface, respectively.
A (3 × 3) simulation supercell of the (001) surface was employed for the adsorption calculations, which was large enough to minimize the lateral interactions between the adsorbate molecules in periodic cells. It consists of 36 iron atoms and 36 sulfur atoms, distributed in two FeS layers. To avoid interactions between periodic slabs, a vacuum size of 15 Å was added in the z-direction. The adsorption energies of adsorbates were defined according to equation:
where EM+surf, Esurf, and EM, respectively, represent the total energy of the adsorbate-surface systems, of the naked perfect or defective FeS (001) surface with sulfur vacancies, and of the adsorbates (CO2 and H2). The coadsorption energies were computed with respect to the sum of the total energies of the free molecules. Negative and positive adsorption energies indicate exothermic and endothermic processes, respectively. All energies (adsorption, reaction, and activation barriers) are corrected by the zero-point energy (ZPE), calculated according to the relation:
where h and νi denote the Planck constant and vibrational frequencies, respectively. Charge transfer between the surfaces and adsorbates is quantified using the Bader charge analysis code developed by Henkelman and co-workers [55]. Transition states (TS) between reactants (initial, IS) and products (final, FS) were determined using the climbing-image nudged elastic band (CI-NEB) method [56,57]. Vibrational frequency calculations were performed to confirm an identified transition state, which is characterised by only one imaginary frequency. The activation energy barriers (EA) are calculated as energy difference between TS and IS, whereas the reaction energies (ER) were calculated as the energy difference between FS and IS.
Eads (M) = EM+surf − (Esurf + EM)
4. Conclusions
In summary, a comprehensive analyses of the structural geometries, electronic properties, and the reaction mechanisms associated with CO2 adsorption and its hydrogenation reactions on the sulfur-deficient FeS (001) surface was performed, using dispersion-correction density functional theory calculations. It is demonstrated that the presence of sulfur vacancies promotes CO2, and H2 adsorption and activation on the FeS (001) basal plane. The exposed Fe sites resulting from the creation of sulfur vacancies provide highly active catalytic sites for CO2 activation and reduction. Accordingly, a high sulfur vacancy density is expected to improve the catalytic activity of FeS-containing catalysts for CO2 activation and conversion. The results presented also show that CO2 will outcompete H2O for the sulfur vacancy sites when both species are present on the surface. The overall reaction energy for the hydrogenation of CO2 to CO and H2O is found to be exothermic by 0.47 eV, with the activation barrier for the rate-determining step calculated at 1.43 eV. The chemical picture and molecular-level insights derived from this work suggest that defective FeS (001) surfaces containing sulfur vacancies can catalyze the necessary reactions of CO2 and H2 to form small organic molecules.
Author Contributions
N.Y.D. performed the DFT calculations, data analysis and has written the paper. N.H.d.L. led on the research and study design and contributed to the scientific discussion of the results. All authors have read and agreed to the published version of the manuscript.
Funding
We acknowledge funding from the UK Engineering and Physical Sciences Research Council (N.Y.D.: grant no. EP/S001395/1, N.H.d.L.: grant no. EP/K009567) and the Netherlands Research Council NWO (N.H.d.L: ECHO grant 712.018.005).
Data Availability Statement
Information on the data that underpins the results presented here, including how to access them, can be found in the Cardiff University data catalogue at http://0-doi-org.brum.beds.ac.uk/10.17035/d.2021.0126461123.
Acknowledgments
This work has used the computational facilities of the Advanced Research Computing at Cardiff (ARCCA) Division, Cardiff University, and HPC Wales. We also acknowledge the use of ARCHER facilities (http://www.archer.ac.uk), the UK’s national supercomputing service via our membership of the UK’s HEC Materials Chemistry Consortium, which is funded by EPSRC (EP/L000202).
Conflicts of Interest
The authors declare no conflict of interest.
References
- Porosoff, M.D.; Yan, B.; Chen, J.G. Catalytic reduction of CO2 by H2 for synthesis of CO, methanol and hydrocarbons: Challenges and opportunities. Energy Environ. Sci. 2016, 9, 62–73. [Google Scholar] [CrossRef]
- Liu, M.; Pang, Y.J.; Zhang, B.; De Luna, P.; Voznyy, O.; Xu, J.X.; Zheng, X.L.; Dinh, C.T.; Fan, F.J.; Cao, C.H. Enhanced electrocatalytic CO2 reduction via field-induced reagent concentration. Nature 2016, 537, 382–386. [Google Scholar] [CrossRef] [PubMed]
- Daza, Y.A.; Kuhn, J.N. CO2 conversion by reverse water gas shift catalysis: Comparison of catalysts, mechanisms and their consequences for CO2 conversion to liquid fuels. RSC Adv. 2016, 6, 49675–49691. [Google Scholar] [CrossRef]
- Dorner, R.W.; Hardy, D.R.; Williams, F.W.; Willauer, H.D. Heterogeneous catalytic CO2 conversion to value-added hydrocarbons. Energy Environ. Sci. 2010, 3, 884–890. [Google Scholar] [CrossRef]
- Lackner, K.S. A guide to CO2 sequestration. Science 2003, 300, 1677–1678. [Google Scholar] [CrossRef]
- D’Alessandro, D.M.; Smit, B.; Long, J.R. Carbon dioxide capture: Prospects for new materials. Angew. Chem. Int. Ed. 2010, 49, 6058–6082. [Google Scholar] [CrossRef] [Green Version]
- Martin, W.; Russell, M.J. On the origins of cells: A hypothesis for the evolutionary transitions from abiotic geochemistry to chemoautotrophic prokaryotes, and from prokaryotes to nucleated cells. Philos. Trans. R. Soc. Lond. Ser. B Biol. Sci. 2003, 358, 59–83. [Google Scholar] [CrossRef] [Green Version]
- Martin, W.; Russell, M.J. On the origin of biochemistry at an alkaline hydrothermal vent. Philos. Trans. R. Soc. B Biol. Sci. 2007, 362, 1887–1925. [Google Scholar] [CrossRef]
- Russell, M.J.; Hall, A.J. The emergence of life from iron monosulphide bubbles at a submarine hydrothermal redox and pH front. J. Geol. Soc. 1997, 154, 377–402. [Google Scholar] [CrossRef] [Green Version]
- Wächtershäuser, G. Groundworks for an evolutionary biochemistry: The iron-sulphur world. Prog. Biophys. Mol. Biol. 1992, 58, 85–210. [Google Scholar] [CrossRef]
- Cody, G.D.; Boctor, N.Z.; Brandes, J.A.; Filley, T.R.; Hazen, R.M.; Yoder, H.S. Assaying the catalytic potential of transition metal sulfides for abiotic carbon fixation. Geochim. Cosmochim. Acta 2004, 68, 2185–2196. [Google Scholar] [CrossRef]
- Parkin, A.; Seravalli, J.; Vincent, K.A.; Ragsdale, S.W.; Armstrong, F.A. Rapid and Efficient Electrocatalytic CO2/CO Interconversions by Carboxydothermus hydrogenoformans CO Dehydrogenase I on an Electrode. J. Am. Chem. Soc. 2007, 129, 10328–10329. [Google Scholar] [CrossRef] [PubMed] [Green Version]
- Hansen, H.A.; Varley, J.B.; Peterson, A.A.; Nørskov, J.K. Understanding trends in the electrocatalytic activity of metals and enzymes for CO2 reduction to CO. J. Phys. Chem. Lett. 2013, 4, 388–392. [Google Scholar] [CrossRef] [PubMed]
- Huber, C.; Wächtershäuser, G. Activated acetic acid by carbon fixation on (Fe,Ni)S under primordial conditions. Science 1997, 276, 245–247. [Google Scholar] [CrossRef] [PubMed] [Green Version]
- Roldan, A.; Hollingsworth, N.; Roffey, A.; Islam, H.-U.; Goodall, J.B.M.; Catlow, C.R.A.; Darr, J.A.; Bras, W.; Sankar, G.; Holt, K.B.; et al. Bio-inspired CO2 conversion by iron sulfide catalysts under sustainable conditions. Chem. Commun. 2015, 51, 7501. [Google Scholar] [CrossRef] [PubMed] [Green Version]
- Mitchell, C.E.; Terranova, U.; Beale, A.M.; Jones, W.; Morgan, D.J.; Sankar, M.; de Leeuw, N.H. A surface oxidised Fe-S catalyst for the liquid phase hydrogenation of CO2. Catal. Sci. Technol. 2020, in press. [Google Scholar] [CrossRef]
- Freund, H.J.; Roberts, M.W. Surface chemistry of carbon dioxide. Surf. Sci. Rep. 1996, 25, 225–273. [Google Scholar] [CrossRef] [Green Version]
- Nørskov, J.K.; Bligaard, T.; Rossmeisl, J.; Christensen, C.H. Towards the computational design of solid catalysts. Nat. Chem. 2009, 1, 37–46. [Google Scholar] [CrossRef]
- Rickard, D.; Luther, G.W. Chemistry of iron sulfides. Chem. Rev. 2007, 107, 514–562. [Google Scholar] [CrossRef]
- Brgoch, J.; Miller, G.J. Validation of interstitial iron and consequences of nonstoichiometry in mackinawite (Fe1+xS). J. Phys. Chem. A 2012, 116, 2234–2243. [Google Scholar] [CrossRef] [Green Version]
- Clark, A.H. Some comments on the composition and stability relations of mackinawite. Neues Jahrb. Mineral. Monatsh. 1966, 5, 300–304. [Google Scholar]
- Clark, A.H.; Clark, A.M. Electron microscope analysis of mackinawite from the Ylojarvi deposit Finland. Neues Jahrb. Mineral. Monatsh. 1968, 6, 259–268. [Google Scholar]
- Ward, J.C. The structure and properties of some iron sulphides. Rev. Pure Appl. Chem. 1970, 20, 175–206. [Google Scholar]
- Taylor, L.A.; Finger, L.W. Structural refinement and composition of mackinawite. Carnegie Inst. Wash. Yearb. 1971, 69, 318–322. [Google Scholar]
- Dzade, N.Y.; Roldan, A.; de Leeuw, N.H. Surface and shape modification of mackinawite (FeS) nanocrystals by cysteine adsorption: A first-principles DFT-D2 study. Phys. Chem. Chem. Phys. 2016, 18, 32007–32020. [Google Scholar] [CrossRef] [PubMed] [Green Version]
- Dzade, N.Y.; Roldan, A.; de Leeuw, N.H. The surface chemistry of NOx on mackinawite (FeS) surfaces: A DFT-D2 study. Phys. Chem. Chem. Phys. 2014, 16, 15444–15456. [Google Scholar] [CrossRef] [PubMed] [Green Version]
- Dzade, N.Y.; Roldan, A.; de Leeuw, N.H. DFT-D2 simulations of water adsorption and dissociation on the low-index surfaces of mackinawite (FeS). J. Chem. Phys. 2016, 144, 174704. [Google Scholar] [CrossRef] [Green Version]
- Dzade, N.Y.; Roldan, A.; de Leeuw, N.H. DFT-D2 study of the adsorption and dissociation of water on clean and oxygen-covered {001} and {011} surfaces of mackinawite (FeS). J. Phys. Chem. C 2016, 120, 21441–21450. [Google Scholar] [CrossRef]
- Dzade, N.Y.; Roldan, A.; de Leeuw, N.H. Activation and dissociation of CO2 on the (001), (011), and (111) surfaces of mackinawite (FeS): A dispersion-corrected DFT study. J. Chem. Phys. 2015, 143, 094703. [Google Scholar] [CrossRef] [Green Version]
- Pipornpong, W.; Wanbayor, R.; Ruangpornvisuti, V. Adsorption CO2 on the perfect and oxygen vacancy defect surfaces of anatase TiO2 and its photocatalytic mechanism of conversion to CO. Appl. Surf. Sci. 2011, 257, 10322–10328. [Google Scholar] [CrossRef]
- French, S.A.; Sokol, A.A.; Bromley, S.T.; Catlow, C.R.A.; Rogers, S.C.; King, F.; Sherwood, P. From CO2 to methanol by hybrid QM/MM embedding. Angew. Chem. Int. Ed. 2001, 40, 4437–4440. [Google Scholar] [CrossRef]
- Tabatabaei, J.; Sakakini, B.; Waugh, K. On the mechanism of methanol synthesis and the water-gas shift reaction on ZnO. Catal. Lett. 2006, 110, 77–84. [Google Scholar] [CrossRef]
- Zhao, Y.-F.; Rousseau, R.; Li, J.; Mei, D. Theoretical study of syngas hydrogenation to methanol on the polar Zn-terminated ZnO(0001) surface. J. Phys. Chem. C 2012, 116, 15952–15961. [Google Scholar] [CrossRef]
- Ye, J.; Liu, C.; Mei, D.; Ge, Q. Active oxygen vacancy site for methanol synthesis from CO2 hydrogenation on In2O3(110): A DFT study. ACS Catal. 2013, 3, 1296–1306. [Google Scholar] [CrossRef]
- Cheng, Z.; Sherman, B.J.; Lo, C.S. Carbon dioxide activation and dissociation on ceria (110): A density functional theory study. J. Chem. Phys. 2013, 138, 014702. [Google Scholar] [CrossRef] [PubMed]
- Mishra, A.K.; Roldan, A.; de Leeuw, N.H. CuO surfaces and CO2 activation: A dispersion-corrected DFT+U study. J. Phys. Chem. C 2016, 120, 2198–2214. [Google Scholar] [CrossRef]
- Pan, Y.-X.; Liu, C.-J.; Ge, Q. Effect of surface hydroxyls on selective CO2 hydrogenation over Ni4/γ-Al2O3: A density functional theory study. J. Catal. 2010, 272, 227–234. [Google Scholar] [CrossRef]
- Kohno, Y.; Tanaka, T.; Funabiki, T.; Yoshida, S. Photoreduction of CO2 with H2 over ZrO2. A study on interaction of hydrogen with photoexcited CO2. Phys. Chem. Chem. Phys. 2000, 2, 2635–2639. [Google Scholar] [CrossRef]
- He, H.; Zapol, P.; Curtiss, L.A. A theoretical study of CO2 anions on anatase (101) surface. J. Phys. Chem. C 2010, 114, 21474–21481. [Google Scholar] [CrossRef]
- Sorescu, D.C.; Lee, J.; Al-Saidi, W.A.; Jordan, K.D. CO2 adsorption on TiO2(110) rutile: Insight from dispersion-corrected density functional theory calculations and scanning tunneling microscopy experiments. J. Chem. Phys. 2011, 134, 104707. [Google Scholar] [CrossRef]
- Downing, C.A.; Sokol, A.A.; Catlow, C.R.A. The reactivity of CO2 on the MgO(100) surface. Phys. Chem. Chem. Phys. 2014, 16, 184–195. [Google Scholar] [CrossRef] [PubMed] [Green Version]
- Pan, Y.-X.; Liu, C.-J.; Mei, D.; Ge, Q. Effects of hydration and oxygen vacancy on CO2 adsorption and activation on β-Ga2O3(100). Langmuir 2010, 26, 5551–5558. [Google Scholar] [CrossRef] [PubMed]
- Lennie, A.R.; Redfern, S.A.T.; Champness, P.E.; Stoddart, C.P.; Schofield, P.F.; Vaughan, D.J. Transformation of mackinawite to greigite: An in situ X-ray powder diffraction and transmission electron microscope study. Am. Mineral. 1997, 82, 302–309. [Google Scholar] [CrossRef]
- Lennie, A.R.; Redfern, S.A.T.; Schofield, P.F.; Vaughan, D.J. Synthesis and Rietveld crystal structure refinement of mackinawite, tetragonal FeS. Mineral. Mag. 1995, 59, 677–683. [Google Scholar] [CrossRef] [Green Version]
- Berner, R.A. Tetragonal iron sulfide. Science 1962, 137, 669. [Google Scholar] [CrossRef]
- Kresse, G.; Joubert, D. From ultrasoft pseudopotentials to the projector augmented-wave method. Phys. Rev. B 1999, 59, 1758–1775. [Google Scholar] [CrossRef]
- Kresse, G.; Furthmüller, J. Efficient iterative schemes for ab initio total-energy calculations using a plane-wave basis set. Phys. Rev. B 1996, 54, 11169–11186. [Google Scholar] [CrossRef]
- Kresse, G.; Furthmüller, J. Efficiency of ab-initio total energy calculations for metals and semiconductors using a plane-wave basis set. Comput. Mater. Sci. 1996, 6, 15–50. [Google Scholar] [CrossRef]
- Kresse, G.; Hafner, J. Ab initio molecular dynamics for liquid metals. Phys. Rev. B Condens. Matter Mater. Phys. 1993, 47, 558–561. [Google Scholar] [CrossRef]
- Blöchl, P.E. Projector augmented-wave method. Phys. Rev. B 1994, 50, 17953–17979. [Google Scholar] [CrossRef] [Green Version]
- Perdew, J.P.; Zunger, A. Self-interaction correction to density-functional approximations for many-electron systems. Phys. Rev. B 1981, 23, 5048–5079. [Google Scholar] [CrossRef] [Green Version]
- Perdew, J.P.; Chevary, J.A.; Vosko, S.H.; Jackson, K.A.; Pederson, M.R.; Singh, D.J.; Fiolhais, C. Atoms, molecules, solids, and surfaces: Applications of the generalized gradient approximation for exchange and correlation. Phys. Rev. B 1992, 46, 6671. [Google Scholar] [CrossRef] [PubMed]
- Grimme, S.; Antony, J.; Ehrlich, S.; Krieg, S. A consistent and accurate ab initio parametrization of density functional dispersion correction (DFT-D) for the 94 elements H-Pu. J. Chem. Phys. 2010, 132, 154104. [Google Scholar] [CrossRef] [PubMed] [Green Version]
- Monkhorst, H.J.; Pack, J.D. Special points for Brillouin-zone integrations. Phys. Rev. B 1976, 13, 5188–5192. [Google Scholar] [CrossRef]
- Tang, W.; Sanville, E.; Henkelman, G. A grid-based Bader analysis algorithm without lattice bias. Phys. Condens. Matter 2009, 21, 084204. [Google Scholar] [CrossRef] [PubMed]
- Henkelman, G.; Jónsson, H. A climbing image nudged elastic band method for finding saddle points and minimum energy paths. J. Chem. Phys. 2000, 113, 9901–9904. [Google Scholar] [CrossRef] [Green Version]
- Henkelman, G.; Jónsson, H. Improved tangent estimate in the nudged elastic band method for finding minimum energy paths and saddle points. J. Chem. Phys. 2000, 113, 9978–9985. [Google Scholar] [CrossRef] [Green Version]
Figure 1.
The layered tetragonal structure of FeS (atomic colour: Fe = grey, S = yellow).

Figure 2.
Schematic representations of the (a) stoichiometric FeS (001), (b,c) defective FeS (001) surfaces containing single (VS1) and double (VS2) sulfur vacancies. (colour code: Fe = grey, S = yellow and Svac-site = red).
Figure 2.
Schematic representations of the (a) stoichiometric FeS (001), (b,c) defective FeS (001) surfaces containing single (VS1) and double (VS2) sulfur vacancies. (colour code: Fe = grey, S = yellow and Svac-site = red).

Figure 3.
Lowest-energy adsorption structures of CO2 on the perfect (a) and defective (b,c) FeS (001) surfaces with VS1 and VS2. The inserts show the top views. (atomic colour: Fe = grey, S = yellow, C = green, O = red).
Figure 3.
Lowest-energy adsorption structures of CO2 on the perfect (a) and defective (b,c) FeS (001) surfaces with VS1 and VS2. The inserts show the top views. (atomic colour: Fe = grey, S = yellow, C = green, O = red).

Figure 4.
Side (a) and top (b) views of the differential charge density isosurface contours upon CO2 adsorption on the defective VS1 FeS (001) surface. The red and blue regions denote electron density accumulation and depletion by 0.02 e/Å3, respectively.
Figure 4.
Side (a) and top (b) views of the differential charge density isosurface contours upon CO2 adsorption on the defective VS1 FeS (001) surface. The red and blue regions denote electron density accumulation and depletion by 0.02 e/Å3, respectively.

Figure 5.
Lowest-energy adsorption structures of (a) molecular (M) and (b) dissociated (D) H2 on perfect FeS (001) surface, in top (top) and side (down) views. (Atomic colour: Fe = grey, S = yellow, H = white.)
Figure 5.
Lowest-energy adsorption structures of (a) molecular (M) and (b) dissociated (D) H2 on perfect FeS (001) surface, in top (top) and side (down) views. (Atomic colour: Fe = grey, S = yellow, H = white.)

Figure 6.
Lowest-energy adsorption structures of dissociated (D) H2 on defective VS1 FeS (001) surface at (a) Fe–Fe, (b) Fe–S, and (c) S–S sites, in top (top) and side (down) views. (Atomic colour code: Fe = grey, S = yellow, H = white.)
Figure 6.
Lowest-energy adsorption structures of dissociated (D) H2 on defective VS1 FeS (001) surface at (a) Fe–Fe, (b) Fe–S, and (c) S–S sites, in top (top) and side (down) views. (Atomic colour code: Fe = grey, S = yellow, H = white.)

Figure 7.
Potential energy profile for CO2 hydrogenation To CO and H2O on defective VS2 FeS (001) surface.
Figure 7.
Potential energy profile for CO2 hydrogenation To CO and H2O on defective VS2 FeS (001) surface.


Table 1.
Adsorption energies, structure, charges, and vibrational frequencies of CO2 on perfect and defective (VS1 and VS2) FeS (001).
Table 1.
Adsorption energies, structure, charges, and vibrational frequencies of CO2 on perfect and defective (VS1 and VS2) FeS (001).
| Eads | C–Oa | C–Ob | C–Fe | Oa–Fe | α(OaCOb) | Δq(CO2) | υas | υs | υb | |
|---|---|---|---|---|---|---|---|---|---|---|
| (eV) | (Å) | (Å) | (Å) | (Å) | (o) | (|e|) | (cm−1) | (cm−1) | (cm−1) | |
| Free CO2 | - | 1.176 | 1.176 | - | - | 180.0 | 0.00 | 2373 | 1323 | 631 |
| (001)-P | −0.20 | 1.177 | 1.176 | 4.013 | 4.222 | 179.6 | 0.00 | 2349 | 1319 | 628 |
| (001)-VS1 | −1.78 | 1.417 | 1.230 | 2.044 | 1.913 | 118.2 | −1.14 | 1547 | 809 | 672 |
| (001)-VS2 | −1.83 | 1.429 | 1.229 | 2.024 | 1.910 | 118.1 | −1.23 | 1546 | 801 | 668 |
P = perfect stoichiometric surface, VS1 = defective surface with single S-vacancy and VS2 = defective surface with double S-vacancy.
Table 2.
Adsorption energies and structure of H2 on perfect and defective FeS(001), where M and D denotes molecular and dissociative adsorption modes, respectively.
Table 2.
Adsorption energies and structure of H2 on perfect and defective FeS(001), where M and D denotes molecular and dissociative adsorption modes, respectively.
| Configuration | Eads (eV) | Ha–Hb (Å) | Ha–S (Å) | Hb–S (Å) | Ha–Fe (Å) | Hb–Fe (Å) | |
|---|---|---|---|---|---|---|---|
| (001)-perf | M(phys) | −0.12 | 0.750 | 3.297 | 3.289 | - | - |
| - | D(S-S) | +1.54 | 3.653 | 1.376 | 1.375 | - | - |
| (001)-VS1 | D(Fe-Fe) | −1.56 | 1.838 | - | - | 1.635 | 1.637 |
| - | D(Fe-S) | −0.48 | 4.229 | - | 1.374 | 1.839 | - |
| - | D(S-S) | +1.46 | 3.658 | 1.375 | 1.374 | - | - |
perf = perfect stoichiometric surface, VS1 = defective surface with single S-vacancy.
Publisher’s Note: MDPI stays neutral with regard to jurisdictional claims in published maps and institutional affiliations. |
© 2021 by the authors. Licensee MDPI, Basel, Switzerland. This article is an open access article distributed under the terms and conditions of the Creative Commons Attribution (CC BY) license (http://creativecommons.org/licenses/by/4.0/).
Share and Cite
MDPI and ACS Style
Dzade, N.Y.; de Leeuw, N.H. Activating the FeS (001) Surface for CO2 Adsorption and Reduction through the Formation of Sulfur Vacancies: A DFT-D3 Study. Catalysts 2021, 11, 127. https://0-doi-org.brum.beds.ac.uk/10.3390/catal11010127
AMA Style
Dzade NY, de Leeuw NH. Activating the FeS (001) Surface for CO2 Adsorption and Reduction through the Formation of Sulfur Vacancies: A DFT-D3 Study. Catalysts. 2021; 11(1):127. https://0-doi-org.brum.beds.ac.uk/10.3390/catal11010127
Chicago/Turabian StyleDzade, Nelson Y., and Nora H. de Leeuw. 2021. "Activating the FeS (001) Surface for CO2 Adsorption and Reduction through the Formation of Sulfur Vacancies: A DFT-D3 Study" Catalysts 11, no. 1: 127. https://0-doi-org.brum.beds.ac.uk/10.3390/catal11010127
Note that from the first issue of 2016, this journal uses article numbers instead of page numbers. See further details here.