Article

A Comprehensive Study of Coke Deposits on a Pt-Sn/SBA-16 Catalyst during the Dehydrogenation of Propane

by
Jose P. Ruelas-Leyva
1,*,
Luis F. Maldonado-Garcia
1,
Alfonso Talavera-Lopez
2,
Iván A. Santos-López
3,
Lorenzo A. Picos-Corrales
1,
Carlos E. Santolalla-Vargas
4,
Sergio A. Gómez Torres
5 and
Gustavo A. Fuentes
5
1
Facultad de Ciencias Químico Biológicas, Universidad Autónoma de Sinaloa, Culiacán, Sinaloa 80030, Mexico
2
Unidad Académica de Ciencias Químicas, Universidad Autónoma de Zacatecas, Campus UAZ Siglo XXI, Zacatecas 98160, Mexico
3
Facultad de Ciencias Químicas, Universidad Autónoma de Nuevo León, Monterrey, Nuevo León 66455, Mexico
4
Centro Interdisciplinario de Investigaciones y Estudios sobre Medio Ambiente y Desarrollo (CIIEMAD), Departamento de Biociencias e Ingeniería, Instituto Politécnico Nacional, Ciudad de México 07340, Mexico
5
Ingeniería de Procesos e Hidráulica, Universidad Autónoma Metropolitana, Ciudad de México 09340, Mexico
*
Author to whom correspondence should be addressed.
Submission received: 21 December 2020 / Revised: 10 January 2021 / Accepted: 12 January 2021 / Published: 16 January 2021
(This article belongs to the Special Issue Catalysis with Ordered Porous Materials)

Abstract

:
Catalytic propane dehydrogenation is an attractive method to produce propylene while avoiding the issues of its traditional synthesis via naphtha steam cracking of naphtha. In this contribution, a series of Pt-Sn/SBA-16 catalysts were synthesized and evaluated for this purpose. Bimetallic Pt-Sn catalysts were more active than catalysts containing only Pt. The catalyst with the best performance was assessed at different reaction times of 0, 60, 180, and 300 min. The evolution of coke deposits was also studied. Thermogravimetric analysis demonstrated the presence of two types of coke on the catalyst surface at low and high temperature, respectively. Raman results showed an increased coke’s crystal size from 60 to 180 min on stream, and from 180 to 300 min under reaction, Raman suggested a reduction in the crystal size of coke. Also transmission electron microscopy confirmed a more evident agglomeration of metallic particles with reaction times higher than 180 min. These results are consistent with the phenomena called “coke migration” and the cause is often explained by coke movement near the particle to the support; it can also be explained due to sintering of the metallic particle, which we propose as a more suitable explanation.

Graphical Abstract

1. Introduction

Propylene, relatively non-toxic to humans, is a widely used raw material in the production of several important chemicals like polypropylene, acrolein and isopropyl alcohol, among others [1,2]. Propylene manufacture via catalytic dehydrogenation of propane is a common practice and, is also one of the most promising methods given that propane is readily available in natural gas, and also, as a consequence of the discovery and exploration of shale gas [3]. For propane production via catalytic routes, some of the most effective catalytic systems are the ones containing Pt or CrOx. Pt catalysts are preferred due the higher toxicity of Cr species.
Despite the great potential of Pt catalysts, they suffer from deactivation [4] due to coke deposition [5]. Several reports in the technical literature shed some light in the current understanding of ways of dealing with catalyst deactivation, for example, by adding a second metal to the Pt catalyst [6], using other supports rather than the typically employed Al2O3 [7], modifying the Pt particle size [8], and others [9,10]. The incorporation of a highly connected support is a less commonly implemented methodology to address coke deposits and the subsequent catalyst deactivation [11,12]. Highly ordered mesoporous materials with a three-dimensional porous structure [13], similar to KIT-6 and SBA-16, can be incorporated as support in the catalyst yielding good dispersion of the active phase during catalyst synthesis thereby enhancing diffusion of both, species involved in the main reaction and the coke precursor species. A catalyst containing a three-dimensional material as support reduces catalyst deactivation by coke deposits more than a catalyst synthesized with a two-dimensional porous structure (SBA-15 and MCM-41). This is possible due to the higher porous connectivity in the three-dimensional material; if a pore is blocked by coke, the active sites can still be accessed via interconnectivity between pores. Literature reports have demonstrated advantages of using a more pore-connected support in various reactions where catalyst deactivation is mainly caused by coke deposition [14,15]. Our literature review in this topic indicated that the incorporation of a three-dimensional support in the catalysts for the dehydrogenation of propane to propylene has been hardly researched.
In this study, a series of Pt-Sn catalysts containing mesoporous silica SBA-16 as support were designed, successfully synthesized and their performance during the dehydrogenation of propane yielding propylene was evaluated (520 °C and atmospheric pressure). The authors’ opinion is that this research provides relevant findings useful in understanding catalyst deactivation by coke deposition, which can be further exploited by scientists and industrialists immersed in this topic.

2. Results and Discussion

2.1. Atomic Absorption Spectroscopy (AAS) and N2 Adsorption-Desorption

The theoretical and real loadings of Pt and Sn are reported in Table 1. The real Pt loadings in all cases were almost halved when compared to the theoretical loading. Regarding the Sn loadings, real data were very similar to the theoretical values excluding the sample 0.5-Pt-2-Sn/SBA-100. N2 adsorption isotherms are presented in Figure 1 and textural properties of the catalysts are summarized in Table 1. Both, the textural properties and the hysteresis loops depend strongly on the hydrothermal temperature used during the synthesis of SBA-16. In the case of 100 °C, the adsorption isotherm (Type IV), the hysteresis width and the textural properties suggest a cage-like pore shape characteristic of well-ordered SBA-16 structure [16]. The surface area (SBET) for the support was greater when the hydrothermal treatment temperature (HTT) was 100 °C. The average pore size (Dp) and the total pore volume (Vp) increased when treatment temperature increased to 140 °C, but the hysteresis loop changed from H2 type to H1 type, associated to agglomerates of uniform spheres in regular array [17]. In the case of supported catalysts, the addition of 0.5 wt% of Pt and 1 wt% of Sn to SBA-100 had a small effect on the textural properties. In all cases the SBA-16 structure was preserved. The SBET, Dp, and Vp of the catalysts 0.5-Pt-1-Sn/SBA-60, -100 and -140 were practically the same as those of the support synthesized at their corresponding hydrothermal pretreatment temperature. For samples 0.5-Pt-0-Sn/SBA-100 and 0.5-Pt-2-Sn/SBA-100 the SBET, Dp, and Vp were reduced significantly from the values of their corresponding support. In the case of 0.5-Pt-2-Sn/SBA-100 the loss in textural properties was 28% in SBET and Vp with respect to SBA-100. This is due to the agglomeration of Sn particles.

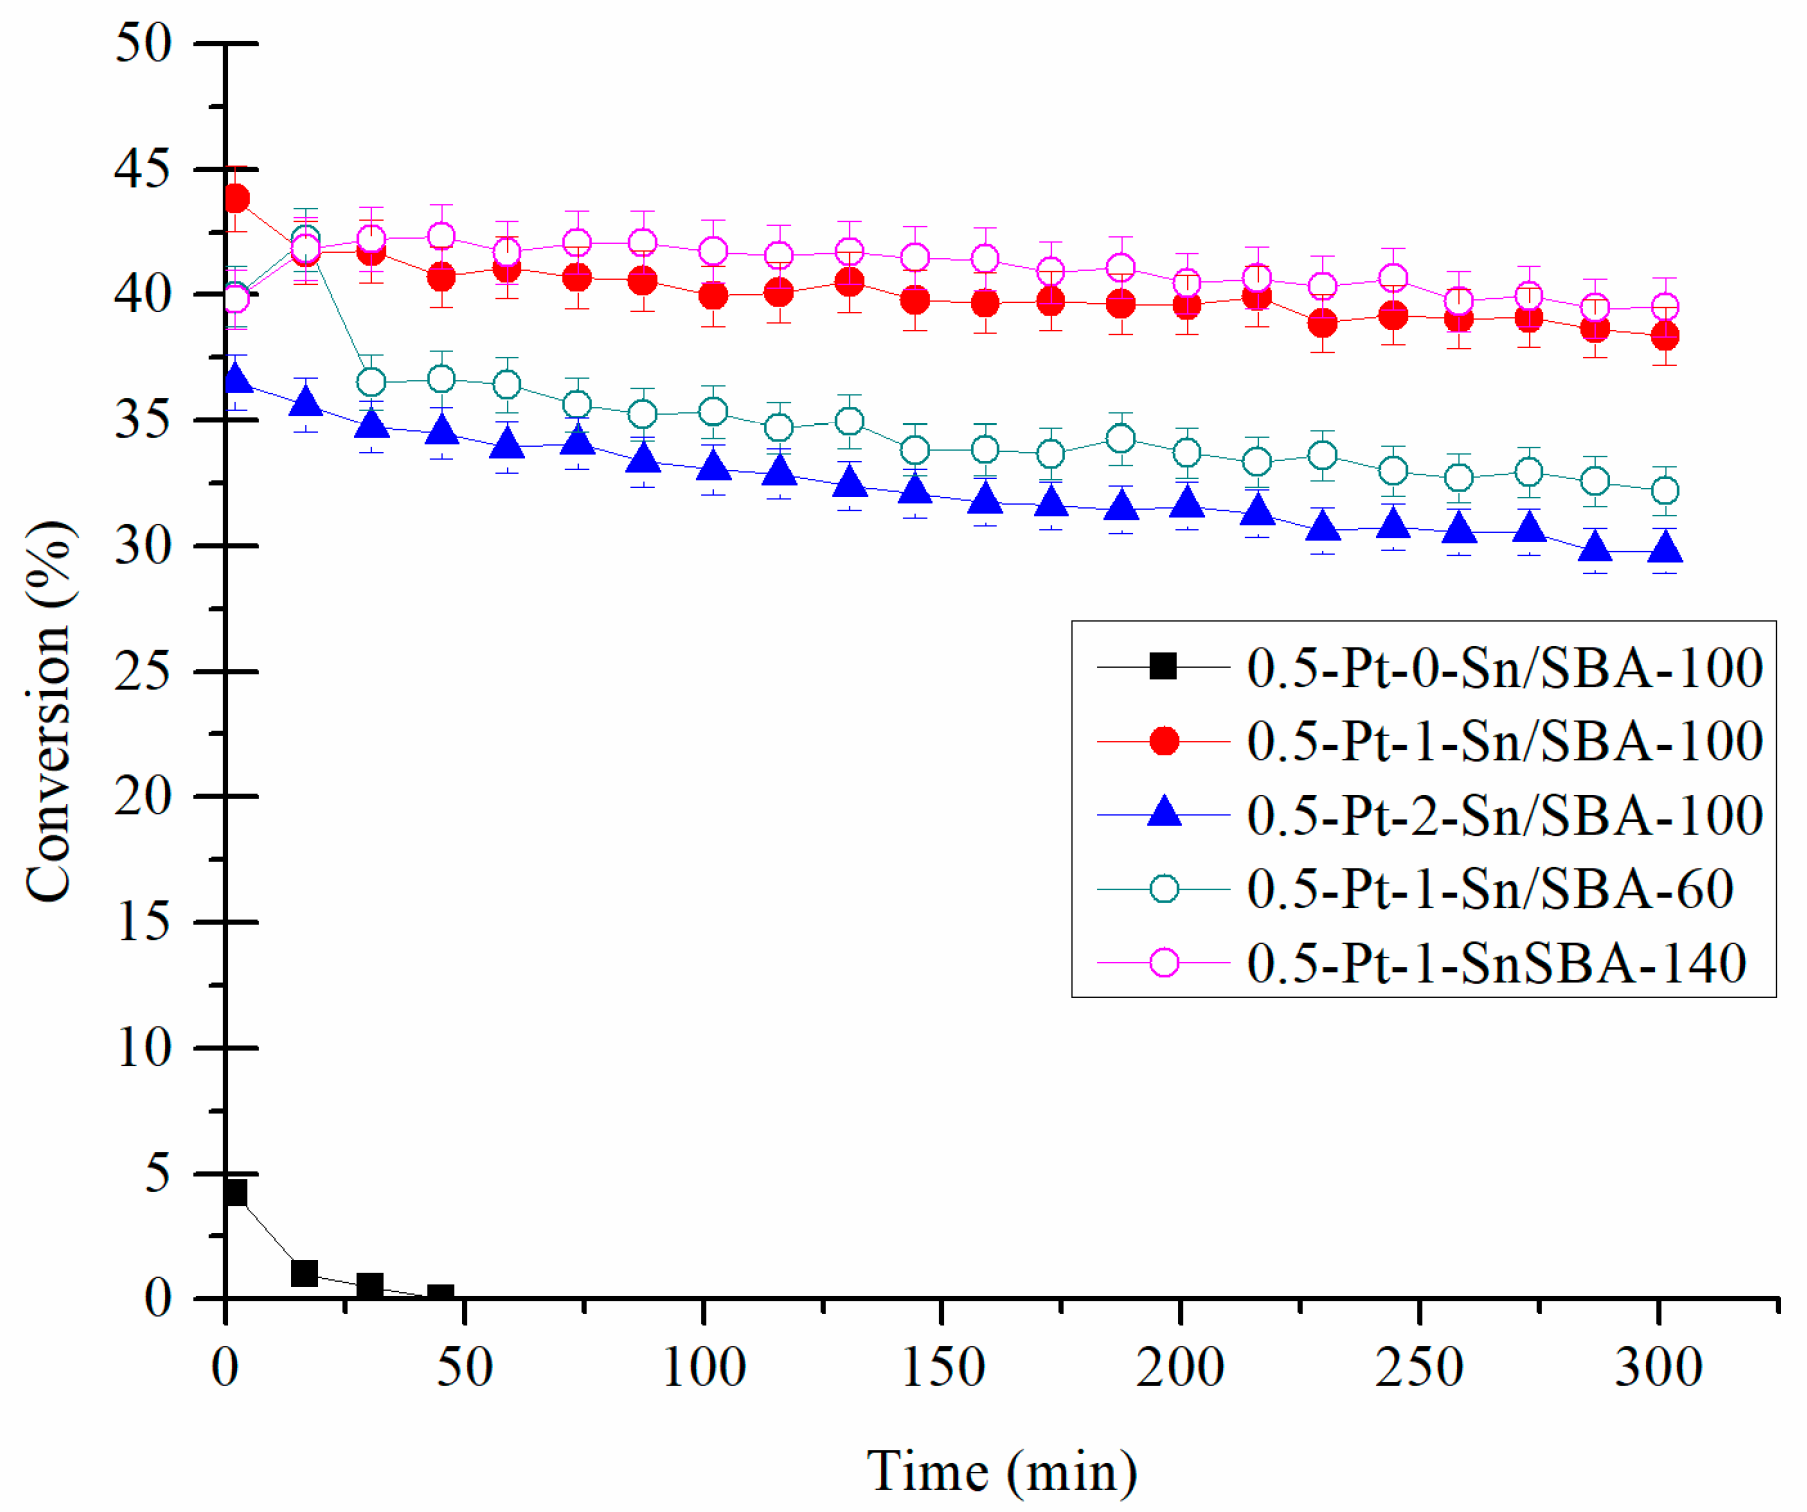
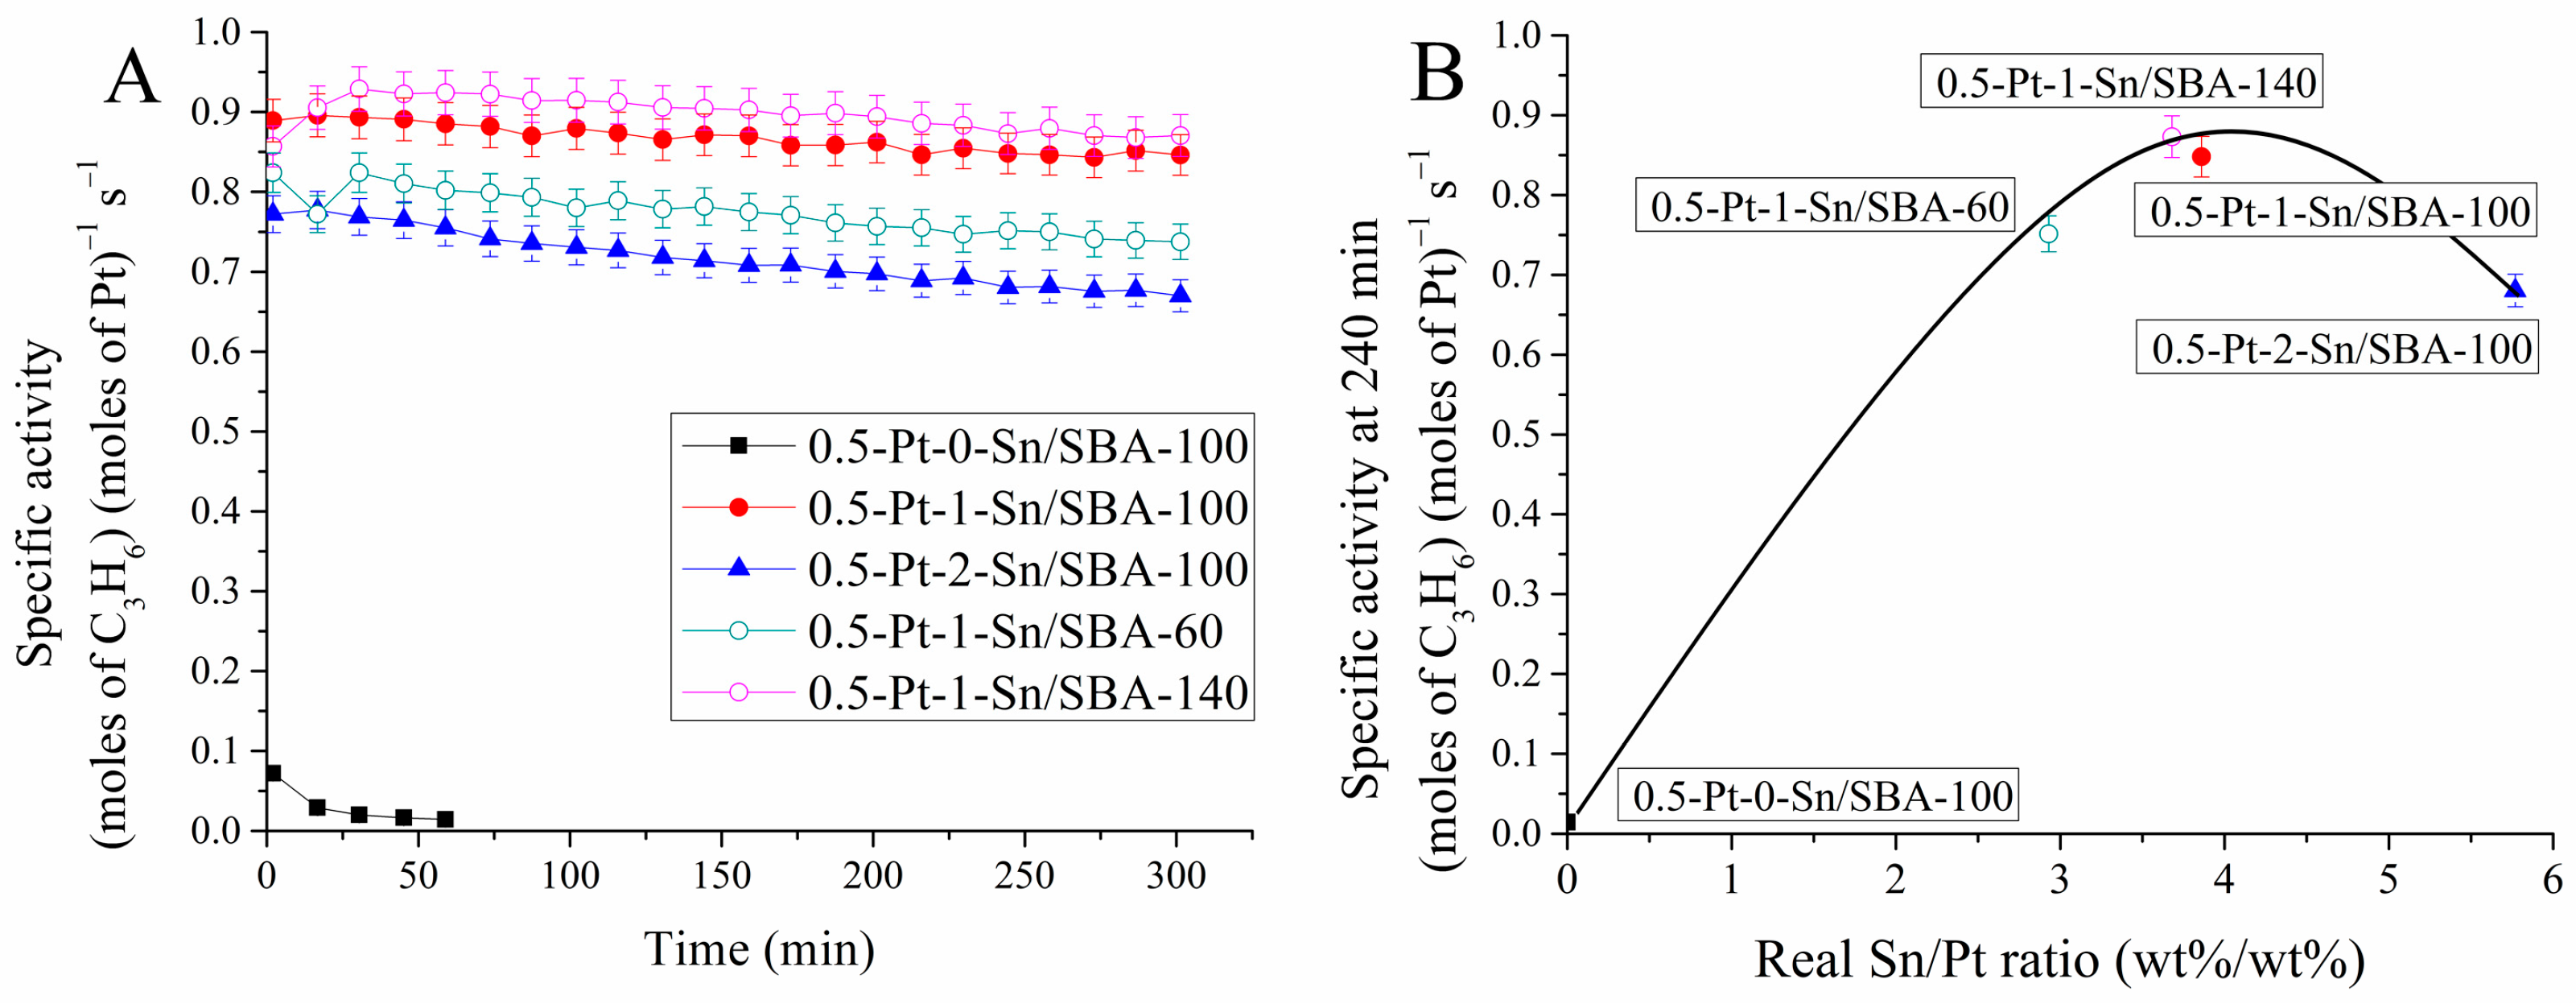
2.2. Catalytic Tests

Conversions of propane using the designed series of catalysts are shown in Figure 2. Rising the Sn/Pt ratio on catalysts with support synthesized at 100 °C (samples: 0.5-Pt-0-Sn/SBA-100, 0.5-Pt-1-Sn/SBA-100 and 0.5-Pt-2-Sn/SBA-100) increased the conversion only to a certain extend: Sn/Pt ratio from 0.00 in sample 0.5-Pt-0-Sn/SBA-100, to 3.86 in sample 0.5-Pt-1-Sn/SBA-100. Once the Sn/Pt ratio was greater than 3.86 (sample 0.5-Pt-2-Sn/SBA-100; Sn/Pt = 5.77, in Figure 2) the conversion was 75% less with respect to that observed in the sample 0.5-Pt-1-Sn/SBA-100. In contrast, using a nominal Sn/Pt ratio of 2, the influence of the hydrothermal treatment temperature on propane conversion was straightforward; the higher the temperature the greater the conversion. Nonetheless, the conversion values by using a hydrothermal treatment temperature of 100 and 140 °C were the same (0.5-Pt-1-Sn/SBA-100 and 140; note that the Pt content was similar for these samples). A slight difference in conversion of propane for these catalysts was detected during the first stage of the experiment, where the 0.5-Pt-1-Sn/SBA-100 sample initiated with a conversion of 44% and at the end the conversion was around 39%, meanwhile the 0.5-Pt-1-Sn/SBA-140 sample started and finished with propane conversion close to 40%.
The selectivity to propylene for all catalysts is depicted in Figure 3. Commonly, in all samples the selectivity was higher than 90% with the increase in the time on stream (TOS). In the particular case of the catalyst containing only Pt, the obtained selectivity was unexpected, given that normally the monometallic catalyst is less preferential to form propylene during this reaction [18,19]. This result can be explained with the contribution of two active sites: one being preferential for cracking and hydrogenolysis of propane leading to the formation of methane, ethane and ethylene and deactivating faster by coke deposits or at least reducing markedly the contribution for the propane conversion; the other site presenting preference for the dehydrogenation sites [20,21]. Then, to observe an increase of the selectivity to propylene with TOS, the sites favoring cracking and hydrogenolysis has to be deactivated (or reduced) by coke deposits, and the dehydrogenation sites become more relevant. This explanation is also reasonable for the rest of the samples, but for the monometallic catalyst is more evident due to its fast deactivation.
The results of specific activity of propylene formation are presented in Figure 4A. It was considered that all Pt in the catalysts was available for the reaction to occur, i.e., 100% Pt dispersion. In this figure, there is a gap between the specific activity of bimetallic and monometallic catalysts, where the latter had the lowest performance. The best results were attained with two catalysts having 1 wt% of Sn and SBA-16 synthesized at 100 and 140 °C of hydrothermal treatment (Samples: 0.5-Pt-1-Sn/SBA-100 and 0.5-Pt-1-Sn/SBA-140; these samples contains the same real Pt loading). For these catalysts, the production of propylene through all the experiment was effectively constant. More importantly, the specific activity of propylene formation obtained with these catalysts competes with the highest values reported in the literature so far [22]. In Figure 4B, the specific activity at 240 min of TOS against the real Sn/Pt ratio is shown. The specific activity was the greatest at around 3.68 and 3.86 of real Sn/Pt ratio regardless the hydrothermal treatment temperature used during the synthesis of the support.

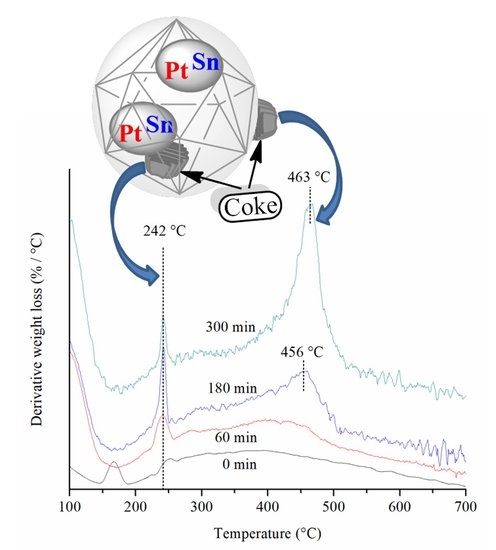
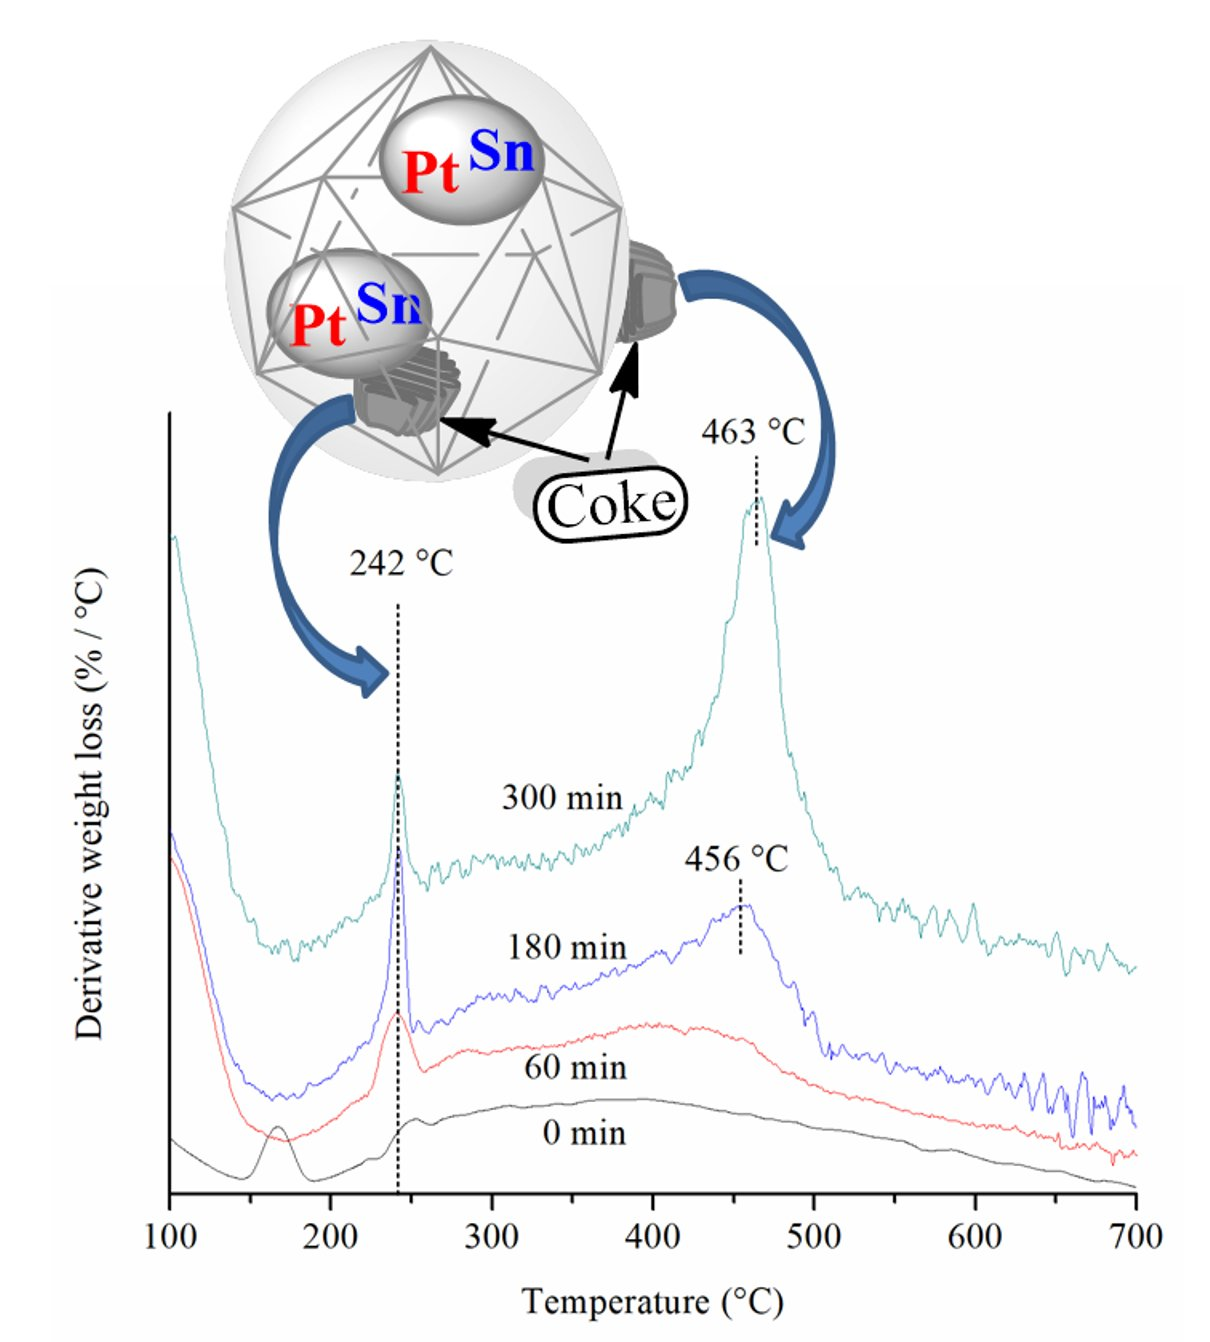
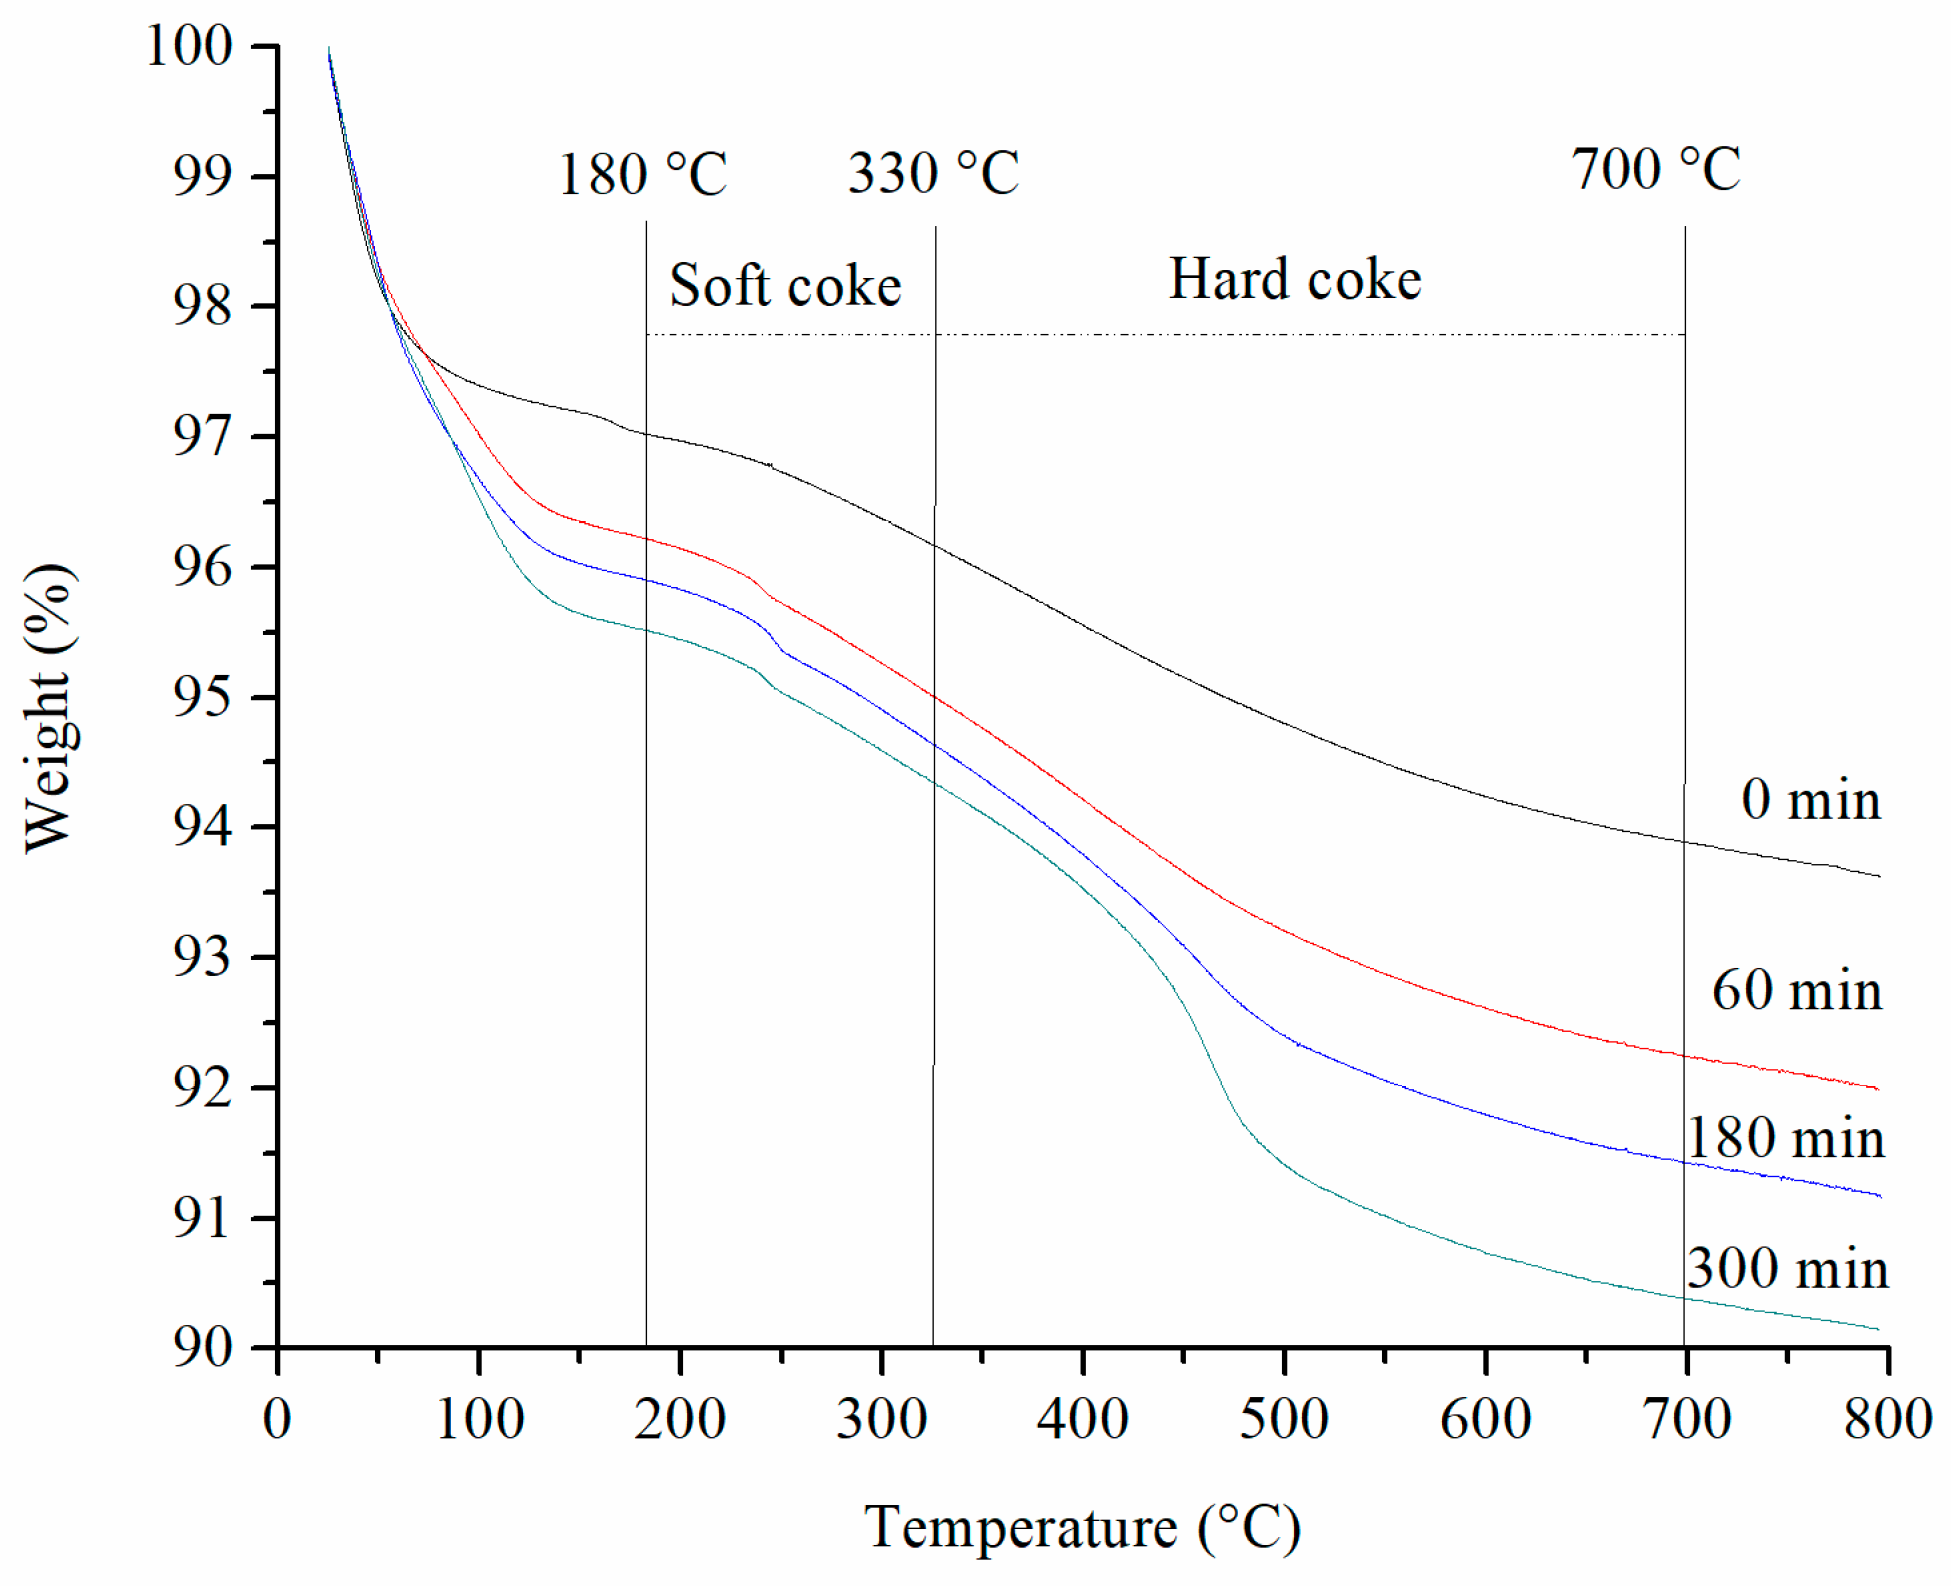
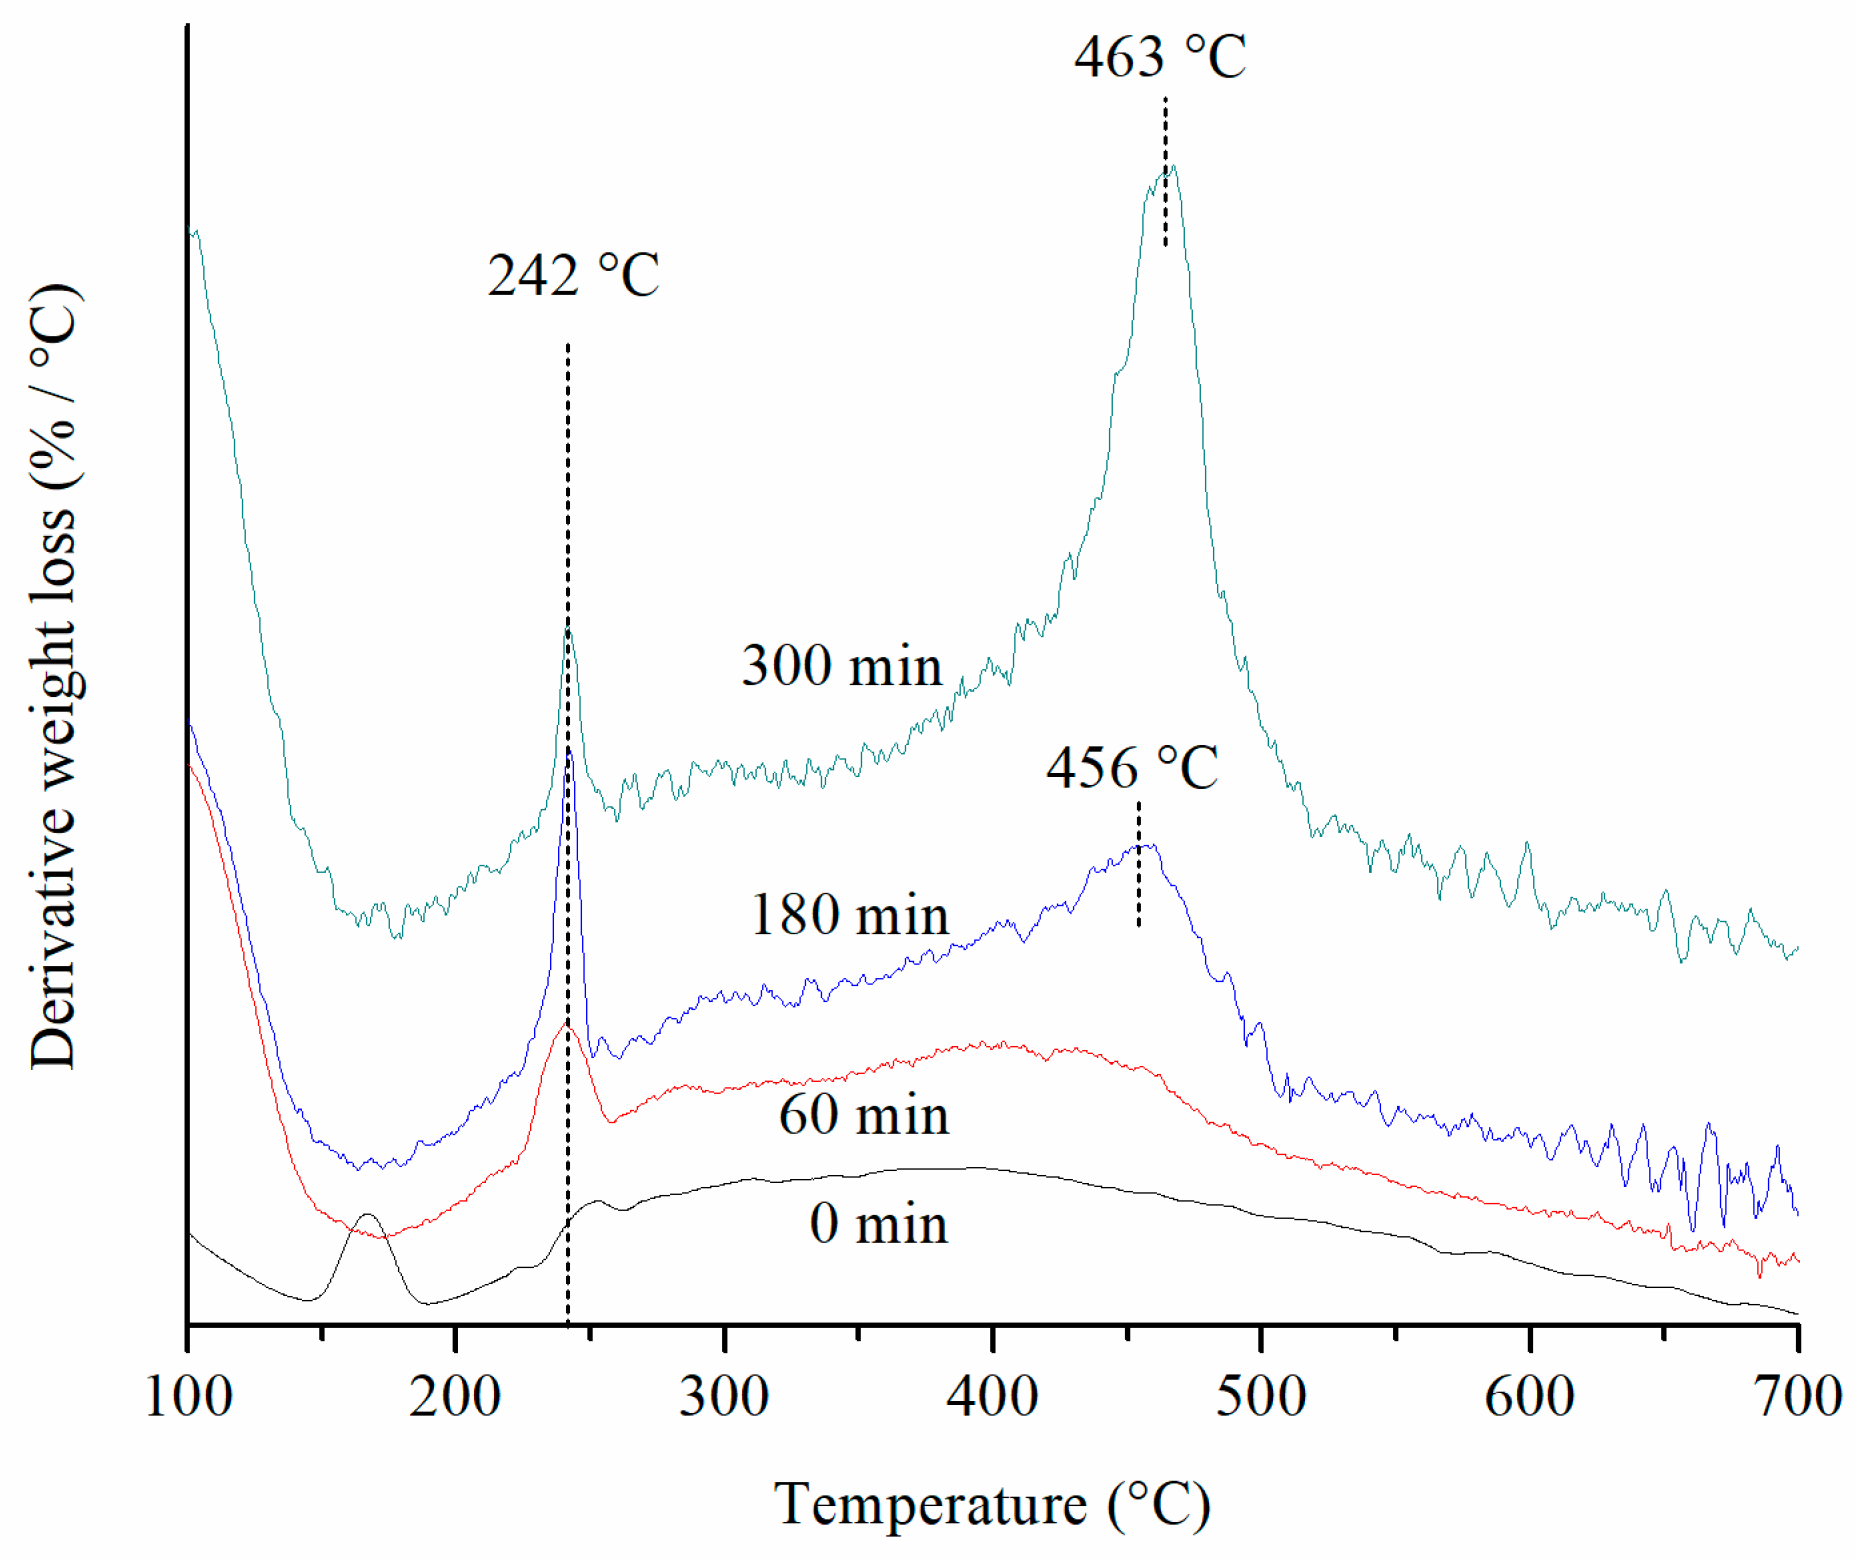
2.3. Thermogravimetric Analysis (TGA)
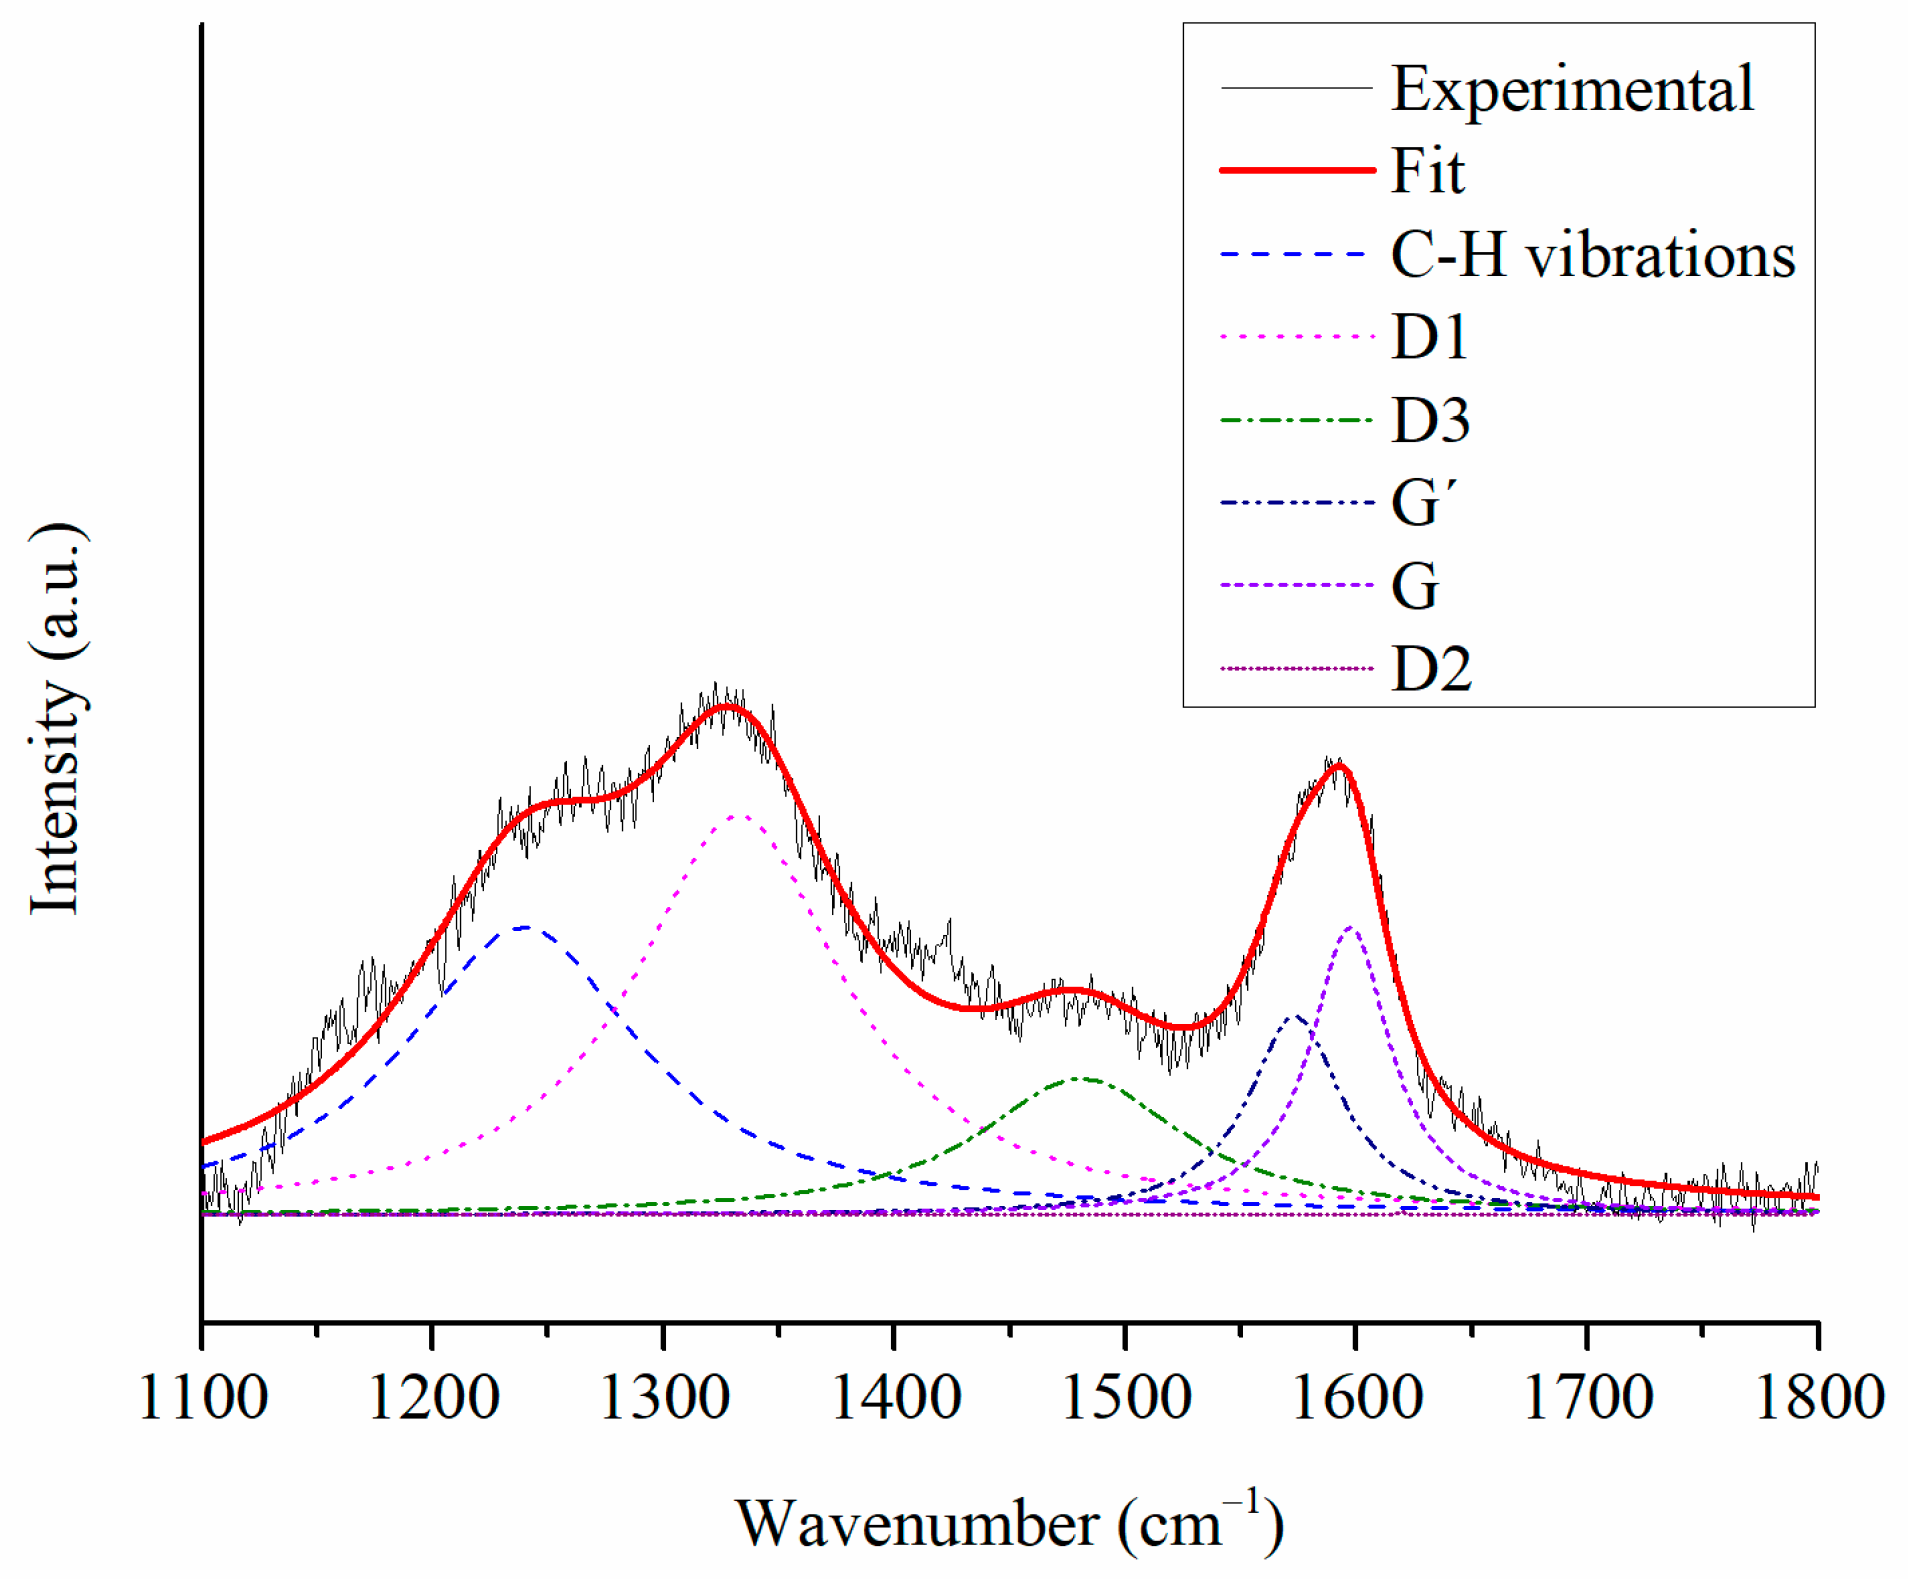
TGA experiments were conducted for the best catalyst in order to study the nature of the coke deposited on these outstanding materials. The 0.5-Pt-1-Sn/SBA-100 sample was selected given that it was one of the two catalysts with the highest specific activity to propylene and also because, from industrial point of view, it would be preferred 100 °C vs 140 °C as a hydrothermal treatment temperature during the support synthesis. The thermograms of the 0.5-Pt-1-Sn/SBA-100 with different TOS are depicted in Figure 5. It has been reported in the literature, that thermograms can be divided into several regions depending on temperature range [23,24,25]. In the first region (T < 180 °C), the loss of water and volatile species, products or reaction intermediates occurs. The region between 180 and 330 °C corresponds to a coke of mobile carbonaceous residues or physisorbed products (or side products) also termed as “soft coke”. At temperatures between 330 and 700 °C the weight loss contribution is attributed to more bulky carbonaceous compounds namely “hard coke”. The information of TGA results is summarized in Table 2, considering two scenarios where in the sample with only pretreatment (0 min of TOS; reduced sample) the weight loss is related or not to coke formation. At this point, it is assumed that in the reduced sample the weight loss is associated to organic compounds resulting from the synthesis of the catalyst, which is assessed in the following section. Weight loss attributed to carbonaceous compounds was the lowest at 0 min and the largest at 300 min, as expected. The total coke content increases drastically during the first 60 min of experimentation followed by a moderate linear increase. This behavior has already been observed in others studies [26,27,28]; those studies, however, did not provide information on the soft and hard coke contribution. In Figure 6, the amount of soft and hard coke is plotted against the TOS. Regarding the soft coke content, as soon as the reaction started (60 min of experimentation), it increased and then it was remained constant. In contrast, the wt% of hard coke on the sample increased linearly with TOS. Total coke content profile through time will depend on the predominant type of coke (soft or hard). For example, if hard coke formation is predominant, the profile of total coke content versus time will be linear.
The derivative thermogravimetry (DTG) profiles corresponding to the 0.5-Pt-1-Sn/SBA-100 catalyst at distinct TOS are found in Figure 7. At 0 min, the DTG had no peak at temperatures greater than 180 °C. In the samples at 60, 180 and 300 min under reaction all the DTG curves presented a peak at 242 °C, and in the profiles at 180 and 300 min under TOS a second peak was observed (around 456–463 °C). Additionally, in the DTG analysis, the low temperature peak appeared at 242 °C in all the experiments with no change in weight content (except for the analysis at 0 min), meanwhile the high temperature peak appeared at higher temperatures and increased its wt% when the TOS was longer.
In a similar way in the literature, the low temperature peak has been associated with the weight loss of coke located on the metal sites and in the vicinity of the metal (Pt, Active site) and the second peak at higher temperatures has been attributed to the weight loss of coke on the support [29,30]. Taking these considerations for our thermogravimetric experiments, the coke content in the metal particle (and its vicinity) remained constant after 60 min of reaction but the coke on the support increased linearly during all the experiment. Thus, after 60 min on stream the coke near the metal particle starts migrating to the support [31,32,33,34] and the shift in temperature of the second peak can be explained with an increased in the graphitization degree of the coke [30].

2.4. Raman Analysis

Raman spectroscopy is a powerful tool for the characterization of carbon-related materials like coke. The Raman spectra of the 0.5-Pt-1-Sn/SBA-100 catalyst at different TOS can be studied in Figure 8. Two peaks appeared at approximately 1332 and 1600 cm−1, while for the sample with only pretreatment (0 min on stream) peaks were not observed, which suggested that the weight loss observed in TGA for this sample is associated to organic compounds resulting from the synthesis of the support/catalyst. To further understand the coke composition, the Raman peaks were deconvoluted into six contributions at 1620 cm−1 (D2), 1600 cm−1 (G), 1580 cm−1 (G’), 1500 cm−1 (D3, defect band), 1350 cm−1 (D1) and 1250 cm−1 (C–H vibrations) according to previous literature reports [29,35,36,37].
All the peaks were fitted with Lorentzian shaped functions and in Figure 9 the individual and total contribution of the peaks are depicted for the catalyst at TOS of 60 min. The same procedure was applied for all the Raman spectrums and Table 3 comprises the information regarding the fittings to the G and D1 peaks.
The D1 band is related to the defects or vacancies presents in the carbon structure and with the presence of sp3 carbons whereas the G band is informative about the in-plane vibrations of sp2–bonded carbon atoms in rings, not in chains [29]. In the sample at 60 min on stream there were peaks observed in the Raman profile, this means that the sample contained coke deposits and were the responsible for the small conversion decay previously observed (Figure 2). In the catalyst from 60 to 180 min on stream, the G band position shifted from 1605 to 1600 cm−1, this implies that the crystal size of the coke increased [38]. The full width at half-maximum (FWHM or Γ) of the G band (ΓG) at 60 min was lower than the ΓG at 180 min; in literature this has been attributed to an increase in the disorder of the graphite particle [39]. The ratio of the D and G intensities, denoted in literature as ID/IG ratio, decreased from 3.85 to 2.22 at 60 and 180 min, respectively. This change in the ID/IG ratio is related to a larger crystal size [40]. These changes in the coke crystal were almost unnoticed by the results of conversion or selectivity (their values were practically constant from 60 to 180 min of TOS), the explanation is provided by TGA given that the hard coke formed during this TOS is more likely to be in the support instead of over the active site. In the samples analyzed from 180 to 300 min on stream, the G band was practically maintained and the ΓG decreased indicating a more ordered graphite particle. Also, the ID/IG ratio increased suggesting a reduction in the crystal size, but it became more ordered. Relating to the performance of the catalyst, although there were more coke deposits on the catalyst, this deposits were located on the support as deduced by TGA, therefore, having no influence on the performance of the catalyst.

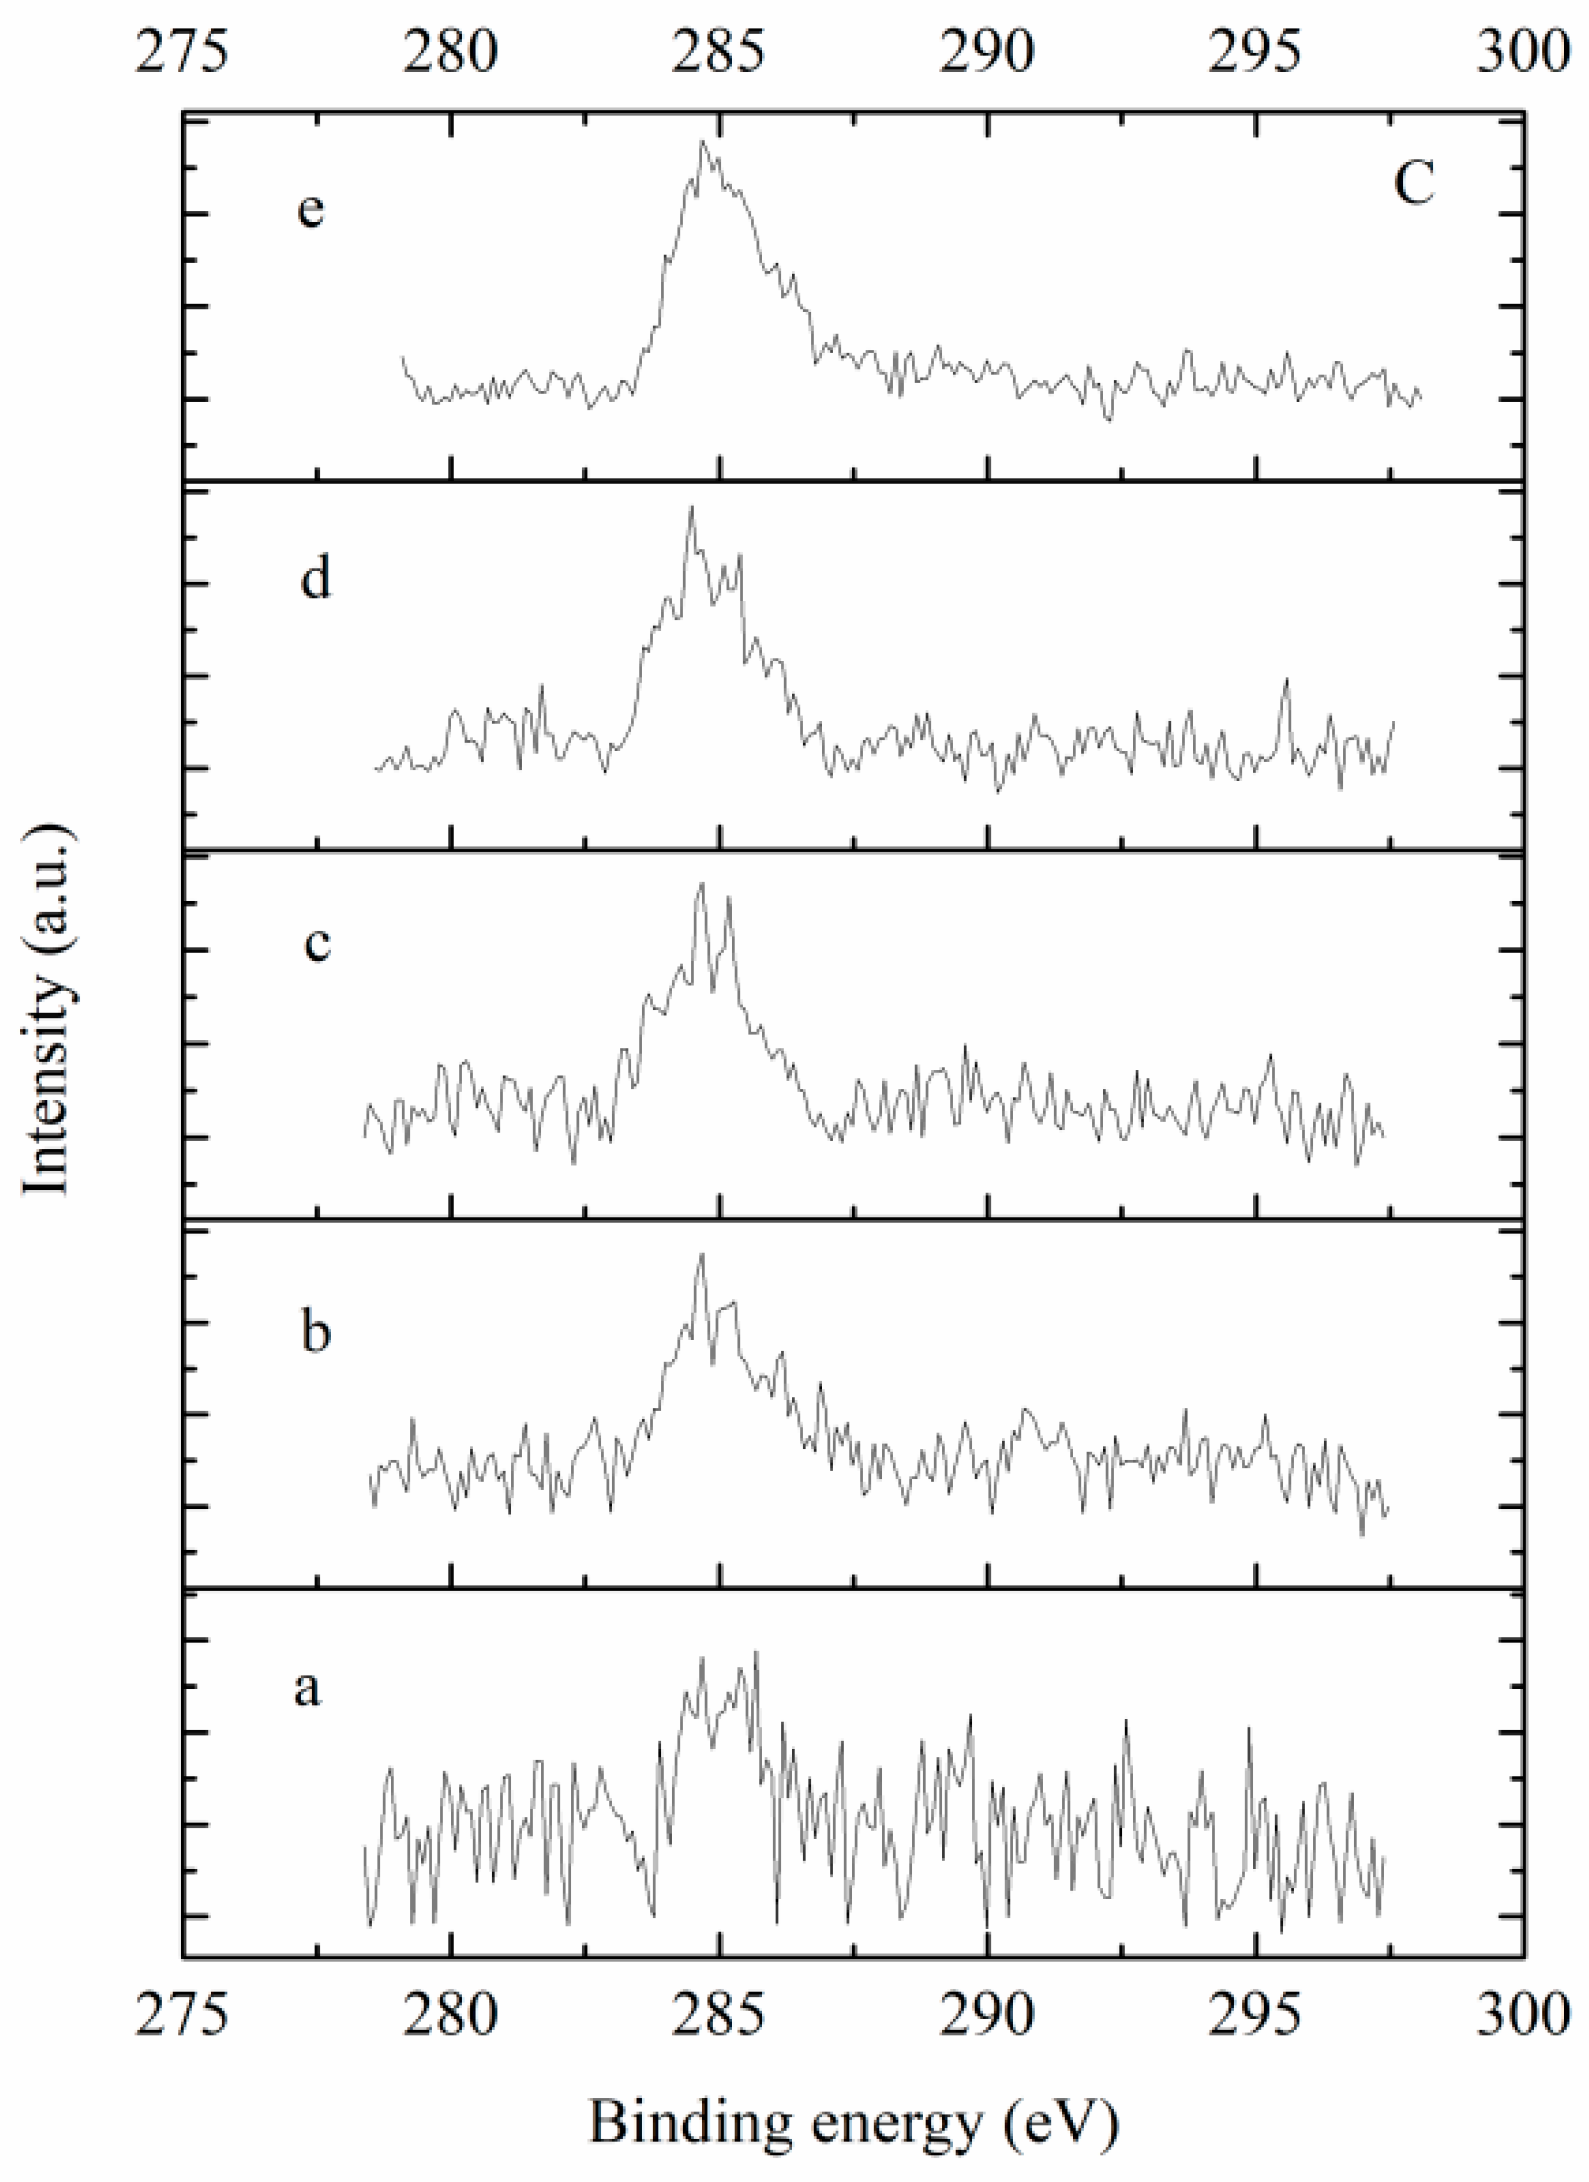
2.5. X-ray Photoelectron Spectroscopy (XPS)

XPS measurements were performed on the 0.5-Pt-1-Sn/SBA-100 catalyst at different TOS in order to obtain information on the surface species of the catalyst material and the high-resolution spectrums of Pt 4f peaks (4f7/2 and 4f5/2) are shown in Figure 10. The fresh sample (Figure 10a) presented two binding energies peaks at 72.4 and 75.1 eV that were assigned to Pt oxides. These peaks shifted toward lower values of Pt 4f7/2 and 4f5/2 during in situ reduction and reaction. After reduction in H2 the catalyst exhibits two binding energy signals at 71.7 and 75.3 eV corresponding to metallic Pt (Figure 10b). In a similar way, the catalyst with TOS of 60 min exhibited binding energy values at 71.1 and 74.7 eV that can be attributed to Pt in zero valent state. Similarly for the catalyst with 180 and 300 min of TOS, it was observed a metallic platinum component in Pt 4f7/2 and 4f5/2 XPS spectra with 71.4 & 75.1 eV and 71.7 & 75.3 eV, respectively (Figure 10d,e). In Figure 10e, the decrease of the Pt signals occurred owing to the carbon depositions on the surface of the catalyst [41,42].
Figure 11 shows the XPS Sn 3d region in the 0.5-Pt-1-Sn/SBA-100 catalyst. For all the samples, only two peaks located at 487.7 and 495.5 eV corresponding to Sn 3d5/2 and Sn 3d3/2 binding energies of Sn were detected, respectively. It is clear that these peaks corresponded to tin oxides (II and IV oxidation state), but as suggested in the literature from the XPS results, it is difficult to distinguish between Sn (II) oxide and Sn (IV) oxide and another technique as Mössbauer spectroscopy is required. Finally, the peak due to metallic tin is not found at 484.3 eV [41,42].
On one hand, Figure 12 shows C 1 s spectra for carbon deposits on the surface of the catalyst formed at different TOS. There is a small peak of C 1 s for the fresh catalyst due to contamination in the air showed in Figure 11a (consistent with Raman). On the other hand, the same XPS peak position is observed at 284.7 eV for all the catalysts (Figure 11b–e), with peak intensity growth indicating the formation of carbon and without significant shifting in the peak signal [41,42]. From XPS and previous studies of our group [11,12], it can be inferred that there is a Pt-Sn alloy in which the carbon was deposited as the TOS increased. Besides, the excess of Sn is in an oxide state, Sn (II) oxide and Sn (IV) oxide.

2.6. Transmission Electron Microscopy (TEM)

Figure 13 illustrates the TEM images and their corresponding particle size distribution for the 0.5-Pt-1-Sn/SBA-100 catalyst with different TOS; the average particle size of the Pt alloy [11,12] in each case is listed in Table 4. For the reduced sample (Figure 13A, 0 min on stream), the particle exhibited a good distribution and the lowest particle size (Figure 13B). At 180 min on stream, the particle size increased about 1 nm (Figure 13D) and at 300 min under reaction the Pt particle tended to agglomerate in the catalyst resulting in the largest average particle size of the Pt alloy (Figure 13F). This sintering of the Pt had no significant effect on the catalyst performance, namely conversion, selectivity and specific activity. This is not expected given that the exposed Pt is reducing with sintering then the conversion should decrease. Maybe during this sintering some of the coke between the Pt particle and the support (or in the Pt particle close to the support) moves towards the support exposing more Pt and compensating the Pt exposure lost during sintering.
In summary, for the analysis of the sample 0.5-Pt-1-Sn/SBA-100 at different TOS, in TGA the soft coke was essentially the same except for the sample at 0 min on stream and where Raman spectroscopy presented no signal possible due to the lack of coke deposits on the catalyst surface. In the sample analyzed from 60 to 180 min on stream, TGA showed a constant soft coke but an increase in the hard coke content (in about 0.4 wt%) while Raman spectroscopy suggested an increase in the crystal size of coke but in a disordered manner. Hence, this incipient formation of hard coke was accompanied with an increase in the coke particle in a disorder way, and from TEM it was deduced that this occurred with a small Pt particle sintering. The conversion to propane with the 0.5-Pt-1-Sn/SBA-100 catalyst had a sudden drop of conversion within the first 60 min of reaction (Figure 2) and then it was practically maintained constant. According to the characterization discussed, this can be explained with the formation of soft coke in the particle. The active sites responsible for the soft coke formation started to deactivate during this time, whereas the active sites accountable for the dehydrogenation of propane continued producing propylene. Naturally, this required an increase in the selectivity of propane for the same period of deactivation, a behavior that can be appreciated in our results (Figure 3), this behavior has been reported in the literature by other researchers [9,43,44]. During 180 to 300 min on stream, TGA detected an increase in the wt% in hard coke (approx. 0.8%) and also the temperature in which the peak appeared increased. Moreover, Raman spectroscopy was consistent with a reduction in the coke crystal size but they became more ordered accompanied by a sudden increase in the metallic particle size demonstrated by TEM. In this stage, conversion and selectivity were practically stable despite the changes previously described.
Overall, when the reaction starts the metal gets covered by soft coke and remains constant but there is still occurring coke formation, this hard coke needs to be away from the metallic particle, allegedly in the support [45]. Then the soft coke migrated from the Pt-Sn alloy to the support, as proposed in other works and called “coke migration” [33,34,46], with a reduction in the coke crystal size. Once the soft coke is far away from the metallic particle it works as the precursor for the hard coke. Other possibility to explain the coke migration is that not only the coke is moving but also the Pt alloy particle is moving. In the present work, there was sinterization of the Pt alloy during the experimentation time meaning that the alloy has mobility. Therefore, from our results, it is more likely that the coke migration is caused by the mobility of the Pt alloy, rather than due the mobility of the coke away from the Pt alloy.

3. Materials and Methods

3.1. Atomic Absorption Spectroscopy (AAS)

The AAS experiments were achieved using a SpectrAA 220 FS spectrophotometer (Varian, Palo Alto, CA, USA) to quantify Pt, the flame during AAS was a mixture of air and acetylene with a flow of 13.5 L min−1 and 2 L min−1, respectively. The temperature range was from 2100 to 2400 °C. Each sample (0.1 g) was digested in aqua regia (200 mL) at 95 °C with stirring until the remaining solution was approximately 50 mL and then it was cooled to room temperature. This solution was poured in a 100 mL flask and 50 mL of distilled water was added. The corresponding lamp and wavelength were used. The quantification of Sn was attained with a flame of acetylene (7 L min−1) and nitrous oxide (5 L min−1). The temperature was around 3000 °C. The sample (0.1 g) was digested in 20 mL of aqua regia at 95 °C with stirring. This temperature was maintained until 50 mL of the solution was left. To this solution 50 mL of fluoric acid (10%) were added. The Sn was measured with the adequate lamp and wavelength.

3.2. N2 Adsorption-Desorption

The textural properties of the samples were analyzed in an adsorption-desorption instrument (Asap 2020, Micromeritics, Norcross, GA, USA) with N2 as adsorbent. A given mass of the sample was added to a sample holder and degassed at 250 °C for 12 h and then the sample holder was submerged in liquid N2 at −172.5 °C. The specific surface area and pore volume were calculated using the adsorption isotherms of N2 with the Brunauer-Emmett-Teller (BET) method.

3.3. Thermogravimetric Analysis (TGA)

TGA were conducted in a Hi-Res TGA 2950 Thermogravimetric Analyzer (TA Instruments, New Castle, DE, USA). Approximately 5 mg of the sample were heated from 25 to 800 °C with a heating rate of 10 °C min−1 with an atmosphere of 60 mL min−1 of O2 and 40 mL min−1 of N2.

3.4. Raman Spectroscopy

Raman spectra of the samples were recorded at room temperature on a T64000 triple monochromator (Jobin-Yvon-Horiba, Edison, NJ, USA) using the 785 nm line of a Lexel laser (Ar+ laser, Edison, NJ, USA). All the experiments were conducted at a power of 10 mW at the laser head, in the 200 to 3000 cm−1 range, using an Olympus microscope (x100 objective, Edison, NJ, USA) and 10 accumulations of 60 s each. The spectrum resolution was 1 cm−1.

3.5. X-ray Photoelectron Spectroscopy (XPS)

The X-ray photoelectron spectra were recorded on K-Alpha (Thermo Scientific, Waltham, MA, USA) X-ray photoelectron spectrometer, using Al Kα radiation (1486.6 eV) as the exciting source.

3.6. Transmission Electron Microscopy (TEM)

Samples were characterized by high resolution transmission electron microscopy on a TECNAI-F30 system (Phillips, Hillsboro, OR, USA) operated at 300 kV. Samples were prepared for analysis by dispersing the powder in alcohol with ultrasonic treatment, then depositing a drop onto a holey carbon film grid.

3.7. Support and Catalyst Synthesis

3.7.1. Supports

The mesoporous silica SBA-16 was obtained attending a method reported in the literature [47,48]. In the method, 8.52 g of Pluronic F127 were dissolved in a mixture of 16.87 g of HCl (36.5%) and 408.96 g of distilled water at 35 °C with stirring. Once the Pluronic was dissolved, 25.56 g of 1-butanol and 40.33 g of tetraethyl orthosilicate (TEOS, Sigma, St. Louis, MO, USA, 99%) were added and the resulting mixture was left under stirring for 24 h. Then, the mixture was poured to a flask for hydrothermal treatment at 60, 100 or 140 °C for 24 h. After cooling to room temperature, the solution was filtered. The solid retained was washed with 750 mL of distilled water and dried at 95 °C during 48 h. The dried sample was calcined at 550 °C for 5 h. Samples were labelled as SBA-T with T as the temperature of the hydrothermal treatment.

3.7.2. Catalysts

The incipient wetness technique was selected to synthesize the catalysts using a simultaneous impregnation of Pt and Sn. The catalysts (3 g) were prepared at constant Pt loading (0.5 wt%) but changing the Sn loadings (0, 1 and 2 wt%). First, the metallic precursors (H2PtCl6·H2O and SnCl4) were dissolved in distilled water in the amount required to fill the pore volume of the SBA-16 support. This solution was added dropwise to the SBA-16 support and dried for 16 h at 100 °C. Finally, the dried powder was calcined at 400 °C for 4 h. The samples were labelled as 0.5-Pt-X-Sn/SBA-T, where X refers to the wt% of Sn and T to the hydrothermal treatment temperature; therefore the sample 0.5-Pt-1-Sn/SBA-100 stands for the catalyst containing 0.5 wt% of Pt, 1 wt% of Sn supported on SBA-16 synthesized at 100 °C of hydrothermal treatment temperature.

3.8. Catalytic Tests

The samples were pretreated under controlled atmosphere (H2, 20 mL min−1) at atmospheric pressure, heated from room temperature to 520 °C with a heating rate of 10 °C min−1 and maintained for 2 h. After that, the temperature was maintained at 520 °C and the H2 flow was changed to the reaction mixture feed: C3H8, H2 and N2 at 8.5, 1.5 and 90% in volume, respectively. The total flow was 150 mL min−1 with a weight hourly space velocity (WHSV) equivalent to 9.5 h−1. The composition of the gas at the reactor outlet was analyzed by Gas chromatography (Agilent 6890N, Palo Alto, CA, USA and a HP Plot Q column, Folsom, CA, USA). The equations for conversion of C3H8, selectivity to C3H6 and specific activity were the following:
C o n v e r s i o n   ( % ) = ( 100 ) × ( ( F C 3 H 8 ) i n ( F C 3 H 8 ) o u t ( F C 3 H 8 ) i n )
S e l e c t i v i t y C 3 H 6   ( % ) = ( 100 ) × ( ( F C 3 H 6 ) o u t ( F C 3 H 8 ) i n ( F C 3 H 8 ) o u t )
S p e c i f i c   a c t i v i t y   ( % ) = ( 100 ) × ( ( F C 3 H 6 ) o u t m c a t × X P t × ( D P t / M P t ) )
where ( F C 3 H 8 ) i n is the molar flow of propane at the inlet, and ( F C 3 H 8 ) o u t and, ( F C 3 H 6 ) o u t are the propane and propylene molar flows at the outlet, respectively. The mass of the catalyst, the Pt mass fraction in the catalyst, the Pt dispersion in the catalyst and the molecular mass of Pt are defined as m c a t , X P t , D P t and M P t , correspondingly.

4. Conclusions

Catalysts containing Pt were barely active, while the bimetallic Pt-Sn catalysts were highly active (conversions up to 43%; selectivity >90%). The catalyst with the best performance contained 0.5 wt% of Pt, 1.0 wt% of Sn and SBA-16 (labelled as 0.5-Pt-1-Sn/SBA-100) and was synthesized by hydrothermal treatment at 100 °C. The specific activity of this catalyst toward propylene formation was maintained during the whole experimentation time and displayed one of the highest values reported so far in the literature. The characterization of this catalyst at distinct TOS (TGA, Raman, XPS and TEM) suggested that the soft coke content reaches a given value and then its weight percentage remains constant, meanwhile the hard coke increases linearly with time. The soft coke diminishes the conversion reached by the catalyst at the start of the experiment; nevertheless it was helpful to increase the selectivity. Furthermore, the soft coke migrates from the Pt-Sn alloy to the support, supposedly with the aid of Sn, and it is the precursor for the hard coke; although it is more likely that the coke and the Pt alloy separate from each other due the sintering observed of the Pt alloy particle. Depending on the TOS, the hard coke crystal gets more ordered (graphitized) avoiding repercussion on the conversion.

Author Contributions

Conceptualization, J.P.R.-L.; methodology, L.F.M.-G., A.T.-L. and J.P.R.-L.; validation, L.F.M.-G., A.T.-L. and J.P.R.-L.; formal analysis, I.A.S.-L., C.E.S.-V., S.A.G.T. and J.P.R.-L.; investigation, L.F.M.-G., I.A.S.-L., C.E.S.-V. and J.P.R.-L.; resources, G.A.F., S.A.G.T. and J.P.R.-L.; data curation, J.P.R.-L.; writing—original draft preparation, J.P.R.-L.; writing—review and editing, G.A.F., S.A.G.T., L.A.P.-C., I.A.S.-L. and J.P.R.-L.; visualization, L.A.P.-C., I.A.S.-L. and J.P.R.-L.; supervision, J.P.R.-L.; project administration, J.P.R.-L.; funding acquisition, J.P.R.-L. All authors have read and agreed to the published version of the manuscript.

Funding

This research was funded by the Mexican National Council for Science and Technology (CONACyT; project CB-2015-01 # 256268) and the Autonomous University of Sinaloa (UAS; project PROFAPI-2015/251). The authors thank financial support from Instituto Politécnico Nacional (project SIP 20210204).

Institutional Review Board Statement

Not applicable.

Informed Consent Statement

Not applicable.

Data Availability Statement

The data presented in this study are available in the figures and tables here presented.

Conflicts of Interest

The authors declare no conflict of interest.

References

  1. Yang, C.; Wu, Z.; Zhang, G.; Sheng, H.; Tian, J.; Duan, Z.; Sohn, H.; Kropf, A.J.; Wu, T.; Krause, T.R.; et al. Promotion of Pd nanoparticles by Fe and formation of a Pd3Fe intermetallic alloy for propane dehydrogenation. Catal. Today 2019, 323, 123–128. [Google Scholar] [CrossRef]
  2. Rostom, S.; de Lasa, H. Propane Oxidative Dehydrogenation on Vanadium-Based Catalysts under Oxygen-Free Atmospheres. Catalysts 2020, 10, 418. [Google Scholar] [CrossRef] [Green Version]
  3. Liu, J.; Li, J.; Rong, J.; Liu, C.; Dai, Z.; Bao, J.; Da, Z.; Zheng, H. Defect-driven unique stability of Pt/carbon nanotubes for propane dehydrogenation. Appl. Surf. Sci. 2019, 464, 146–152. [Google Scholar] [CrossRef]
  4. Ruelas-Leyva, J.P.; Fuentes, G.A. Chiral Catalyst Deactivation during the Asymmetric Hydrogenation of Acetophenone. Catalysts 2017, 7, 193. [Google Scholar] [CrossRef] [Green Version]
  5. Li, Q.; Sui, Z.; Zhou, X.; Chen, D. Kinetics of propane dehydrogenation over Pt–Sn/Al2O3 catalyst. Appl. Catal. A Gen. 2011, 398, 18–26. [Google Scholar] [CrossRef]
  6. Kaylor, N.; Davis, R.J. Propane dehydrogenation over supported Pt-Sn nanoparticles. J. Catal. 2018, 367, 181–193. [Google Scholar] [CrossRef]
  7. Xiong, H.; Lin, S.; Goetze, J.; Pletcher, P.; Guo, H.; Kovarik, L.; Artyushkova, K.; Weckhuysen, B.M.; Datye, A.K. Thermally Stable and Regenerable Platinum–Tin Clusters for Propane Dehydrogenation Prepared by Atom Trapping on Ceria. Angew. Chem. Int. Ed. 2017, 56, 8986–8991. [Google Scholar] [CrossRef] [PubMed] [Green Version]
  8. Tuo, Y.-X.; Shi, L.-J.; Cheng, H.-Y.; Zhu, Y.-A.; Yang, M.-L.; Xu, J.; Han, Y.-F.; Li, P.; Yuan, W.-K. Insight into the support effect on the particle size effect of Pt/C catalysts in dehydrogenation. J. Catal. 2018, 360, 175–186. [Google Scholar] [CrossRef]
  9. Bai, L.Y.; Zhou, Y.M.; Zhang, Y.W.; Liu, H.; Tang, M.H. Influence of Calcium Addition on Catalytic Properties of PtSn/ZSM-5 Catalyst for Propane Dehydrogenation. Catal. Lett. 2009, 129, 449–456. [Google Scholar] [CrossRef]
  10. Liu, X.; Lang, W.-Z.; Long, L.-L.; Hu, C.-L.; Chu, L.-F.; Guo, Y.-J. Improved catalytic performance in propane dehydrogenation of PtSn/γ-Al2O3 catalysts by doping indium. Chem. Eng. J. 2014, 247, 183–192. [Google Scholar] [CrossRef]
  11. Ruelas-Leyva, J.P.; Mata-Martinez, A.; Talavera-López, A.; Gómez, S.A.; Jimenez-Lam, S.A.; Fuentes, G.A. Dehydrogenation of Propane to Propylene with Highly Stable Catalysts of Pt-Sn Supported over Mesoporous Silica KIT-6. Int. J. Chem. React. Eng. 2018, 16. [Google Scholar] [CrossRef]
  12. Mata-Martinez, A.; Jimenez-Lam, S.A.; Talavera-López, A.; Gómez, S.A.; Fuentes, G.A.; Picos-Corrales, L.A.; Piña-Victoria, J.C.; Ruelas-Leyva, J.P. The Effect of Sn Content in a Pt/KIT-6 Catalyst over its Performance in the Dehydrogenation of Propane. Int. J. Chem. React. Eng. 2018, 16. [Google Scholar] [CrossRef]
  13. Naidu Talapaneni, S.; Ramadass, K.; Ruban, S.J.; Benzigar, M.; Lakhi, K.S.; Yang, J.-H.; Ravon, U.; Albahily, K.; Vinu, A. 3D cubic mesoporous C3N4 with tunable pore diameters derived from KIT-6 and their application in base catalyzed Knoevenagel reaction. Catal. Today 2019, 324, 33–38. [Google Scholar] [CrossRef]
  14. Vijayakumar, G.; Pandurangan, A. Up-gradation of α-tetralone to jet-fuel range hydrocarbons by vapour phase hydrodeoxygenation over PdNi/SBA-16 catalysts. Energy 2017, 140, 1158–1172. [Google Scholar] [CrossRef]
  15. Catizzone, E.; Aloise, A.; Migliori, M.; Giordano, G. From 1-D to 3-D zeolite structures: Performance assessment in catalysis of vapour-phase methanol dehydration to DME. Microporous Mesoporous Mater. 2017, 243, 102–111. [Google Scholar] [CrossRef]
  16. Kim, T.-W.; Ryoo, R.; Kruk, M.; Gierszal, K.P.; Jaroniec, M.; Kamiya, S.; Terasaki, O. Tailoring the Pore Structure of SBA-16 Silica Molecular Sieve through the Use of Copolymer Blends and Control of Synthesis Temperature and Time. J. Phys. Chem. B 2004, 108, 11480–11489. [Google Scholar] [CrossRef]
  17. Sing, K.S.W. Reporting physisorption data for gas/solid systems with special reference to the determination of surface area and porosity. Pure Appl. Chem. 1985, 57, 603–619. [Google Scholar] [CrossRef]
  18. Santhosh Kumar, M.; Chen, D.; Holmen, A.; Walmsley, J.C. Dehydrogenation of propane over Pt-SBA-15 and Pt-Sn-SBA-15: Effect of Sn on the dispersion of Pt and catalytic behavior. Catal. Today 2009, 142, 17–23. [Google Scholar] [CrossRef]
  19. Wang, G.; Zhang, H.; Zhu, Q.; Zhu, X.; Li, X.; Wang, H.; Li, C.; Shan, H. Sn-containing hexagonal mesoporous silica (HMS) for catalytic dehydrogenation of propane: An efficient strategy to enhance stability. J. Catal. 2017, 351, 90–94. [Google Scholar] [CrossRef]
  20. Duan, Y.; Zhou, Y.; Zhang, Y.; Sheng, X.; Zhou, S.; Zhang, Z. Effect of aluminum modification on catalytic properties of PtSn-based catalysts supported on SBA-15 for propane dehydrogenation. J. Nat. Gas Chem. 2012, 21, 207–214. [Google Scholar] [CrossRef]
  21. Fan, X.; Li, J.; Zhao, Z.; Wei, Y.; Liu, J.; Duan, A.; Jiang, G. Dehydrogenation of propane over PtSnAl/SBA-15 catalysts: Al addition effect and coke formation analysis. Catal. Sci. Technol. 2015, 5, 339–350. [Google Scholar] [CrossRef]
  22. Shi, L.; Deng, G.-M.; Li, W.-C.; Miao, S.; Wang, Q.-N.; Zhang, W.-P.; Lu, A.-H. Al2O3 Nanosheets Rich in Pentacoordinate Al3+ Ions Stabilize Pt-Sn Clusters for Propane Dehydrogenation. Angew. Chem. Int. Ed. 2015, 54, 13994–13998. [Google Scholar] [CrossRef] [PubMed]
  23. Pradhan, A.R.; Wu, J.F.; Jong, S.J.; Tsai, T.C.; Liu, S.B. An ex situ methodology for characterization of coke by TGA and 13C CP-MAS NMR spectroscopy. Appl. Catal. A Gen. 1997, 165, 489–497. [Google Scholar] [CrossRef]
  24. Zhang, Y.; Zhou, Y.; Qiu, A.; Wang, Y.; Xu, Y.; Wu, P. Effect of Alumina Binder on Catalytic Performance of PtSnNa/ZSM-5 Catalyst for Propane Dehydrogenation. Ind. Eng. Chem. Res. 2006, 45, 2213–2219. [Google Scholar] [CrossRef]
  25. Li, Q.; Sui, Z.; Zhou, X.; Zhu, Y.; Zhou, J.; Chen, D. Coke Formation on Pt–Sn/Al2O3 Catalyst in Propane Dehydrogenation: Coke Characterization and Kinetic Study. Top. Catal. 2011, 54, 888. [Google Scholar] [CrossRef]
  26. Santhosh Kumar, M.; Chen, D.; Walmsley, J.C.; Holmen, A. Dehydrogenation of propane over Pt-SBA-15: Effect of Pt particle size. Catal. Commun. 2008, 9, 747–750. [Google Scholar] [CrossRef]
  27. Van Sint Annaland, M.; Kuipers, J.A.M.; van Swaaij, W.P.M. A kinetic rate expression for the time-dependent coke formation rate during propane dehydrogenation over a platinum alumina monolithic catalyst. Catal. Today 2001, 66, 427–436. [Google Scholar] [CrossRef]
  28. Lobera, M.P.; Téllez, C.; Herguido, J.; Menéndez, M. Transient kinetic modelling of propane dehydrogenation over a Pt–Sn–K/Al2O3 catalyst. Appl. Catal. A Gen. 2008, 349, 156–164. [Google Scholar] [CrossRef]
  29. Guichard, B.; Roy-Auberger, M.; Devers, E.; Rebours, B.; Quoineaud, A.A.; Digne, M. Characterization of aged hydrotreating catalysts. Part I: Coke depositions, study on the chemical nature and environment. Appl. Catal. A Gen. 2009, 367, 1–8. [Google Scholar] [CrossRef]
  30. Carrero, A.; Calles, J.A.; Vizcaíno, A.J. Effect of Mg and Ca addition on coke deposition over Cu–Ni/SiO2 catalysts for ethanol steam reforming. Chem. Eng. J. 2010, 163, 395–402. [Google Scholar] [CrossRef]
  31. Tian, Y.-P.; Liu, X.-M.; Rood, M.J.; Yan, Z.-F. Study of coke deposited on a VOx-K2O/γ-Al2O3 catalyst in the non-oxidative dehydrogenation of isobutane. Appl. Catal. A Gen. 2017, 545, 1–9. [Google Scholar] [CrossRef]
  32. Zhou, S.; Zhou, Y.; Zhang, Y.; Sheng, X.; Zhang, Z. The synthesis of new coke-resistant support and its application in propane dehydrogenation to propene. J. Chem. Technol. Biotechnol. 2016, 91, 1072–1081. [Google Scholar] [CrossRef]
  33. Nawaz, Z.; Tang, X.; Wang, Y.; Wei, F. Parametric Characterization and Influence of Tin on the Performance of Pt−Sn/SAPO-34 Catalyst for Selective Propane Dehydrogenation to Propylene. Ind. Eng. Chem. Res. 2010, 49, 1274–1280. [Google Scholar] [CrossRef]
  34. Jiang, F.; Zeng, L.; Li, S.; Liu, G.; Wang, S.; Gong, J. Propane Dehydrogenation over Pt/TiO2–Al2O3 Catalysts. ACS Catal. 2015, 5, 438–447. [Google Scholar] [CrossRef]
  35. Bokobza, L.; Bruneel, J.-L.; Couzi, M. Raman Spectra of Carbon-Based Materials (from Graphite to Carbon Black) and of Some Silicone Composites. C J. Carbon Res. 2015, 1, 77–94. [Google Scholar] [CrossRef] [Green Version]
  36. Sadezky, A.; Muckenhuber, H.; Grothe, H.; Niessner, R.; Pöschl, U. Raman microspectroscopy of soot and related carbonaceous materials: Spectral analysis and structural information. Carbon 2005, 43, 1731–1742. [Google Scholar] [CrossRef]
  37. Ferrari, A.C.; Robertson, J. Interpretation of Raman spectra of disordered and amorphous carbon. Phys. Rev. B 2000, 61, 14095–14107. [Google Scholar] [CrossRef] [Green Version]
  38. Sattler, J.J.H.B.; Beale, A.M.; Weckhuysen, B.M. Operando Raman spectroscopy study on the deactivation of Pt/Al2O3 and Pt–Sn/Al2O3 propane dehydrogenation catalysts. Phys. Chem. Chem. Phys. 2013, 15, 12095–12103. [Google Scholar] [CrossRef] [Green Version]
  39. Cançado, L.G.; Jorio, A.; Ferreira, E.H.M.; Stavale, F.; Achete, C.A.; Capaz, R.B.; Moutinho, M.V.O.; Lombardo, A.; Kulmala, T.S.; Ferrari, A.C. Quantifying Defects in Graphene via Raman Spectroscopy at Different Excitation Energies. Nano Lett. 2011, 11, 3190–3196. [Google Scholar] [CrossRef] [Green Version]
  40. Ferrari, A.C.; Basko, D.M. Raman spectroscopy as a versatile tool for studying the properties of graphene. Nat. Nanotechnol. 2013, 8, 235–246. [Google Scholar] [CrossRef] [Green Version]
  41. Deng, L.; Zhou, Z.; Shishido, T. Behavior of active species on Pt-Sn/SiO2 catalyst during the dehydrogenation of propane and regeneration. Appl. Catal. A Gen. 2020, 606, 117826. [Google Scholar] [CrossRef]
  42. Pastor-Pérez, L.; Sepúlveda-Escribano, A. Low temperature glycerol steam reforming on bimetallic PtSn/C catalysts: On the effect of the Sn content. Fuel 2017, 194, 222–228. [Google Scholar] [CrossRef] [Green Version]
  43. Iglesias-Juez, A.; Beale, A.M.; Maaijen, K.; Weng, T.C.; Glatzel, P.; Weckhuysen, B.M. A combined in situ time-resolved UV–Vis, Raman and high-energy resolution X-ray absorption spectroscopy study on the deactivation behavior of Pt and PtSn propane dehydrogenation catalysts under industrial reaction conditions. J. Catal. 2010, 276, 268–279. [Google Scholar] [CrossRef]
  44. Collett, C.H.; McGregor, J. Things go better with coke: The beneficial role of carbonaceous deposits in heterogeneous catalysis. Catal. Sci. Technol. 2016, 6, 363–378. [Google Scholar] [CrossRef]
  45. Barbier, J. Deactivation of reforming catalysts by coking—A review. Appl. Catal. 1986, 23, 225–243. [Google Scholar] [CrossRef]
  46. Wolf, M.; Raman, N.; Taccardi, N.; Haumann, M.; Wasserscheid, P. Coke Formation during Propane Dehydrogenation over Ga−Rh Supported Catalytically Active Liquid Metal Solutions. ChemCatChem 2020, 12, 1085–1094. [Google Scholar] [CrossRef]
  47. Kleitz, F.; Czuryszkiewicz, T.; Solovyov, L.A.; Lindén, M. X-ray Structural Modeling and Gas Adsorption Analysis of Cagelike SBA-16 Silica Mesophases Prepared in a F127/Butanol/H2O System. Chem. Mater. 2006, 18, 5070–5079. [Google Scholar] [CrossRef]
  48. Gobin, O.C.; Wan, Y.; Zhao, D.; Kleitz, F.; Kaliaguine, S. Mesostructured silica SBA-16 with tailored intrawall porosity part 1: Synthesis and characterization. J. Phys. Chem. C 2007, 111, 3053–3058. [Google Scholar] [CrossRef]
Figure 1. N2 adsorption isotherms at different hydrothermal treatment temperature for (A) SBA-16 and (B) Pt-Sn/SBA-16 catalysts.
Catalysts 11 00128 g001
Figure 2. Propane conversion versus time profiles for the Pt-X-Sn/SBA-T catalysts. Conditions: atmospheric pressure and 520 °C; reaction mixture of C3H8 = 8.5%, H2 = 1.5% and N2 = 90% in volume, total flow = 150 mL min−1 and WHSV = 9.5 h−1.
Catalysts 11 00128 g002
Figure 3. Propylene selectivity versus time for the Pt-Sn/SBA-16 catalysts. Reaction conditions: atmospheric pressure and 520 °C; reaction mixture of C3H8 = 8.5%, H2 = 1.5% and N2 = 90% in volume, total flow = 150 mL min−1 and WHSV = 9.5 h−1.
Catalysts 11 00128 g003
Figure 4. (A) Profiles of specific activity at different TOS for the Pt-X-Sn/SBA-T catalysts. (B) Specific activity at 240 min versus the real Pt/Sn ratio. Reaction conditions: atmospheric pressure and 520 °C; reaction mixture: C3H8 = 8.5%, H2 = 1.5% and N2 = 90% in volume, total flow = 150 mL min−1 and WHSV = 9.5 h−1.
Catalysts 11 00128 g004
Figure 5. TGA profiles for the 0.5-Pt-1-Sn/SBA-100 sample at different TOS.
Catalysts 11 00128 g005
Figure 6. Variation in the soft and hard coke content as a function of the TOS over the 0.5-Pt-1-Sn/SBA-100 catalysts without considering the weight loss of the reduced sample.
Catalysts 11 00128 g006
Figure 7. Derivative thermogravimetry profiles of the 0.5-Pt-1-Sn/SBA-100 catalyst acquired at different TOS.
Catalysts 11 00128 g007
Figure 8. Raman profiles of the 0.5-Pt-1-Sn/SBA-100 catalyst at distinct TOS.
Catalysts 11 00128 g008
Figure 9. Raman fitting showing the total and individual contributions.
Catalysts 11 00128 g009
Figure 10. XPS analysis for Pt on 0.5-Pt-1-Sn/SBA-100 catalyst: (a) fresh sample; (b) reduced sample; under reaction at (c) 60 min, (d) 180 min, (e) 300 min.
Catalysts 11 00128 g010
Figure 11. XPS analysis for Sn on 0.5-Pt-1-Sn/SBA-100 catalyst: (a) fresh sample; (b) reduced sample; under reaction at (c) 60 min, (d) 180 min, (e) 300 min.
Catalysts 11 00128 g011
Figure 12. XPS analysis of C on 0.5-Pt-1-Sn/SBA-100 catalyst: (a) fresh sample; (b) reduced sample; under reaction at (c) 60 min, (d) 180 min, (e) 300 min.
Catalysts 11 00128 g012
Figure 13. TEM images for the 0.5-Pt-1-Sn/SBA-100 catalyst with different TOS: (A) 0 min, (C) 180 min, (E) 300 min. Particle size distribution for the 0.5-Pt-1-Sn/SBA-100 catalyst at: (B) 0 min, (D) 180 min, (F) 300 min.
Catalysts 11 00128 g013
Table 1. Textural properties and real loadings of the Pt-Sn supported on SBA-16 catalysts.
SampleNominal Pt/Sn (wt%/wt%)Real Pt/Sn (wt%/wt%)HTT a (°C)SBET
(m2 g−1)
Dp
(nm)
Vp
(cm3 g−1)
SBA-600/0ND b604531.40.30
SBA-1000/0ND b1009671.80.84
SBA-1400/0ND b1405724.01.18
0.5-Pt-0-Sn/SBA-1000.5/00.30/0.001008941.80.78
0.5-Pt-1-Sn/SBA-600.5/10.30/0.88604331.30.29
0.5-Pt-1-Sn/SBA-1000.5/10.22/0.851009561.70.81
0.5-Pt-1-Sn/SBA-1400.5/10.22/0.811405614.01.12
0.5-Pt-2-Sn/SBA-1000.5/20.26/1.501006901.70.60
a HTT = Hydrothermal treatment temperature during support synthesis; b ND = Not Detected.
Table 2. Soft and hard coke content at different TOS for the 0.5-Pt-1-Sn/SBA-100 sample.
TOS (min)Coke Content (wt%) Considering the Reduced SampleCoke Content (wt%) without
Considering the Reduced Sample
Soft CokeHard CokeTotalSoft CokeHard CokeTotal
180–330 °C330–700 °C180–330 °C330–700 °C
00.892.253.140.000.000.00
601.272.723.990.380.470.85
1801.323.124.440.430.871.30
3001.223.925.140.331.672.00
Table 3. Summarized contributions of the of the Raman fittings.
TOS (min)ID/IGΓG (cm−1)Position (cm−1)
IGID
0ND *ND *ND *ND *
603.8550.6516051336
1802.2254.5516001335
3003.6638.1515981332
* ND. Not detected.
Table 4. Average particle size as a function to the TOS determined with TEM.
TOS (min)Pt alloy Particle Size (nm)
07.13
1808.16
30020.56
Publisher’s Note: MDPI stays neutral with regard to jurisdictional claims in published maps and institutional affiliations.

