
Iridium Oxide Enabled Sensors Applications


1
Department of Chemistry, Xi’an Jiaotong-Liverpool University, No. 111 Ren Ai Road, Suzhou Industrial Park, Suzhou 215123, China
2
Department of Chemical Engineering, Rochester Institute of Technology, Rochester, NY 14623, USA
3
Department of General Surgery, The First Affiliated Hospital of Soochow University, Suzhou 215006, China
*
Author to whom correspondence should be addressed.
†
Q.D. and S.H. contributed equally.
Catalysts 2021, 11(10), 1164; https://0-doi-org.brum.beds.ac.uk/10.3390/catal11101164
Submission received: 31 August 2021
/
Revised: 20 September 2021
/
Accepted: 21 September 2021
/
Published: 27 September 2021
(This article belongs to the Special Issue Electrocatalysis: From Catalytic Reactions to Energy Storage and Sensing Applications)
Abstract
:There have been numerous studies applying iridium oxides in different applications to explore their proton-change-based reactions since the 1980s. Iridium oxide can be fabricated directly by applying electrodeposition, sputter-coating method, or oxidation of iridium wire. Generally, there have been currently two approaches in applying iridium oxide to enable its sensing applications. One was to improve or create different electrolytes with (non-)electrodeposition method for better performance of Nernst Constant with the temperature-related system. The mechanism behind the scenes were summarized herein. The other was to change the structure of iridium oxide through different kinds of templates such as photolithography patterns, or template-assisted direct growth methods, etc. to improve the sensing performance. The detection targets varied widely from intracellular cell pH, glucose in an artificial sample or actual urine sample, and the hydrogen peroxide, glutamate or organophosphate pesticides, metal-ions, etc. This review paper has focused on the mechanism of electrodeposition of iridium oxide in aqueous conditions and the sensing applications towards different biomolecules compounds. Finally, we summarize future trends on Iridium oxide based sensing and predict future work that could be further explored.
1. Introduction
In 1989, Yamanaka et al. [1] firstly reported two kinds of iridium-based films, including the anodically oxidized iridium oxide film (AOIRF) and cathodically oxidized iridium oxide film (COIRF). Since then, iridium oxide has attracted much attention and has been used to detect glucose, hydrogen peroxide, glutamate, metal ion and organophosphate pesticide, etc. In the early development of synthesis and application, iridium oxide was prepared by thermo-deposition or electrodeposition as a film on either working electrode or reference electrode and mainly applied to develop solid-state pH sensor development. Later, different kinds of iridium oxide deposition methods were explored and created by using additional electrolytes and various iridium sources to control the morphology, thus offering the opportunity to expand the applications of iridium oxide. Consequently, an increasing amount of work has shifted to a broader application such as glucose and hydrogen peroxide detection instead of just limiting aqueous pH detection. This review began with the presentation of iridium oxide preparation methods, followed by extensive discussion and summarization of recent progress of various iridium oxide-enabled sensors and biosensors in detecting chemical and biological species, as well as iridium oxide-based gas sensing. Finally, this review concluded with a discussion of future trends in developing advanced iridium oxide-enabled sensors and biosensors.
2. Iridium Oxide Deposition Method
Several methods have been developed to synthesize iridium oxide in the past decades, which will introduce and discuss in the subsequent section.
2.1. Anodically Oxidized Iridium Oxide
In this method, an iridium-containing deposition solution was first prepared following a recipe developed by Yamanaka [1]. Under the deposition condition in 0.1 M H2SO4 solution at a constant current density of 10 mA cm−2 for 20 min, [2] iridium oxide film was formed and then ready for use. This method provides a convenient way to coat iridium oxide on the conducting electrode surface.
2.2. Thermal Deposition to Prepare Iridium Oxide
Decomposition of iridium salt at high temperatures in the air is another popular method to prepare iridium oxide. Kinoshita et al. [3] and Ardizzone et al. [4] reported a simple plan to prepare iridium oxide electrodes. In brief, Ti coupon (0.22 mm thick, 1 cm2) was dipped into IrCl3 solution first, and then the coupon was gently heated with an air gun to crystalize the IrCl3 on the titanium surface. Next, the coupon was heated in an air oven for around 10 min to decompose chloride salt, forming iridium oxide. This process was repeated three times, followed by another 4-h heat-treatment at the same decomposition temperature. When applied for pH detection, it shows a Nernst constant of 59 mV/pH with good stability, which was corroborated by a slight shift of 0.08 V after two weeks of aging.
Later on, Chalamala et al. [5] reported that iridium film could be oxidized at 600 °C under an oxygen-containing environment. The X-ray Powder Diffraction (XRD) showed that IrO2 changed from (110) oriented to a mixture of (110) and (200) during the oxide growth, which offers another simple method to prepare high-quality iridium oxide.
2.3. Sputter-Coating to Deposit Iridium Oxide
By using a cryogenic sputtering system, Kinlen et al. [6] and Klein et al. [7] deposited iridium dioxide (IrO2) from a high-purity iridium target. Oxygen at the flow rate of 6.0 sccm s−1 was continuously pumped into the chamber, which was held at 1.33 Pa.
Furthermore, Kreider et al. [8] reported another procedure to prepare iridium oxide thin film on aluminum oxide substrate through sputtering at 13.5 MHz planar magnetron source in a 20 cm target-to-substrate distance. In conjunction with the use of pure iridium (99.99%, dia. of 5 cm) and 0.15 Pa total pressure, they found that the sputter-coated iridium oxide film suffered less redox interference compared with the electrodeposited iridium oxide film for other ions.
In another study, Sato et al. [9] reported that iridium oxide could be formed by sputter coating from iridium carbon composite films (Ir-C films). Ir-C films were prepared on SnO2-coated glass plates through evaporating iridium from a graphite crucible by an electron-beam gun. Then the Ir-C films were converted to thermally oxidized iridium oxide film with a thickness of around 90 nm by heating at 250 °C for 10 min. All the studies indicate that the sputtering method is a facile technique to prepare iridium oxide film with controllable thickness.
2.4. Melt-Oxidized Iridium Oxide
Metal oxidization is also employed to prepare metal oxide of interest. Yao et al. [10] reported the carbonate melt method to oxidize a metal to fabricate an iridium oxide film using LixIrOynH2O, which was similar to Yoshiyuki’s previous work electron-beam to melt iridium–carbonate mixture. Good Nernst response at 58.92 mV/pH was realized with drift-free features and fast response (<0.2 s).
2.5. Iridium Oxide Colloid Formation
Takayuki Kuwabara and co-workers [11] reported an innovative iridium oxide colloid formation method. By using potassium hexachloroiridate (IV) (30 mg) mixed with sodium hydrogen citrate (50 mg) in 50 mL aqueous solution to form red-brown solution, which was adjusted to pH 7.5 with NaOH solution and refluxed in an oil bath with constant stirring for 30 min. After the solution was cooled to room temperature, the pH of the solution was adjusted again to 7.5. These steps were repeated until the pH reaching to 7.5. The iridium oxide colloid was formed after another two hours of oxygen bubbling. Such iridium oxide colloid was deposited on indium tin oxide (ITO) in terms of the carboxyl group and hydroxyl group on the surface of ITO to promote self-assembly.
3. Iridium Oxide Enabled Sensors
Over past decades, iridium oxide has been employed in various sensors for a wide spectrum of applications, including glucose sensing, hydrogen peroxide detection, extracellular environment pH monitoring, glutamate detection, immunosensing, organophosphate pesticide detection, metal ion detection, urine monitoring, iodate and periodate detection, protein, and metalloid metal detection, etc. The following section will systematically review the progress of iridium oxide-enabled various sensing applications based on the detection targets.
3.1. Glucose Sensor
Glucose detection is of paramount importance for the management of diabetes disease. The recent progress has been focusing on the development of the repeatable and long-term glucose monitoring systems. However, iridium oxide-based glucose detection has been developed in enzymatic and non-enzymatic detection methods. Herein, we summarized the recent developments of the iridium oxide-based glucose detections.
3.1.1. Glucose Oxidase Based IrOx Sensor
To develop a glucose sensor glucose oxidase (GOx) is employed to develop a novel glucose sensor in conjunction with iridium oxide [12]. It was found that iridium oxide plays an important role in glucose detection, and the reactions were presented as follows:
GOX + glucose → GOX-H2 + gluconic acid
GOX-H2 + Mox → GOX + Mred
Mred → Mox + 2e−
To confirm the electron transfer in between GOx and iridium oxide took significant effects than the electron transfers due to the presence of oxygen in GOx. Oxygen reduction current has been used as an indicator to evaluate this point. Based on the oxygen reduction current (ORR), another Pt working electrode was used to carry out the measurements, and it possessed a sensitivity of 2.1 mA cm−2 at 0.2 V under O2-saturated solution and 1.3 µA cm−2 at 0.2 V after 40 min of deaeration with Argon. In this case, the oxygen content has been decreased by 1000 times; however, the glucose oxidation currents in deaerated conditions did not drop the same amount, suggesting the electron transfers indeed occurred between the reduced flavin site in GOx and the surrounding IrOx matrix under deaerated conditions. Therefore, they demonstrated dual regeneration of glucose oxidase by oxygen and iridium oxide. This is the first work in which the role of iridium oxide in glucose oxidase-based electron transfer was investigated.
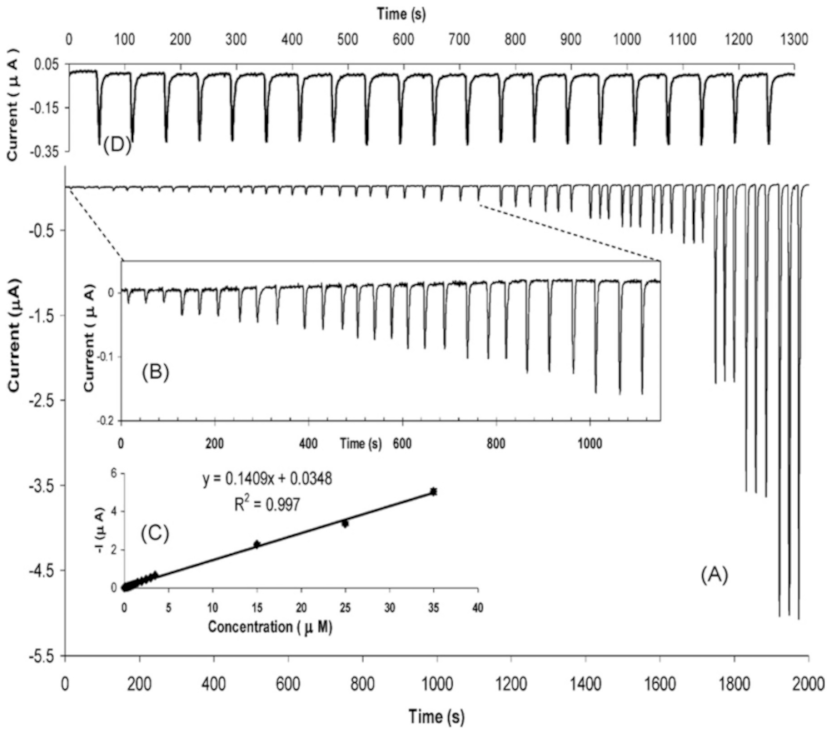
Jhas et al. [13] investigated the role of iridium oxide nanoparticles in the presence of glucose oxidase under chronoamperometric detection at 1.2 V; Figure 1 shows the chronoamperometric response of successive addition of 20 µL aliquots of 1.0 M D-glucose to 25 mL of deaerated pH 7 PBS buffer. A detection limit of 0.4 mM glucose was successfully achieved through iterations in conjunction with the Michaelis-Menten equation.
Glucose detection could also be associated with the determination of hydrogen peroxide as glucose and glucose oxidase reaction produces hydrogen peroxide. Therefore, IrO2 was explored to study their selectivity and sensitivity to hydrogen peroxide and glucose by employing carbon paste electrodes (CPEs) and screen-printed carbon electrodes (SPCEs) with glucose oxidase. Using the amperometric method, Kotzian et al. [14] successfully realized the optimization of operating parameters, including pH, voltage, etc. Finally, they achieved a limit of glucose detection as low as 0.90 mg/L (5.00 µM).
Yamaguchi et al. came up with a glucose detection trial incorporation of IrO2 into microflow channel systems [15]. They design two switch-electrode, one is a hydrophilic gold electrode, and the other is the iridium oxide electrode. In this system, when pH is higher than a threshold, the gold valve electrode is open at a specific voltage, and on the other hand, the gold valve electrode would be auxiliary and would not allow the pass of reagents. In terms of the enzymatic reactions that could induce the basic or acidic change of liquid solution, the glucose concentration could be evaluated by coupling the enzymatic reaction with the shift in pH. Figure 2 illustrates the configuration of the electrode below.
Irhayem et al. [16] employed two different configurations to entrap the glucose oxidase and iridium wire. Figure 3 shows how the iridium oxide and GOx were trapped together. The amperometric responses under stirred or non-stirred conditions were investigated, and the results showed that both led to a good glucose detection range (up to 70 mM). The more layers in configuration A in Figure 3, the more stable the signal is. However, the SEM image showed that more layers accompanied more clusters formed on the electrode surface, which resulted in a lower sensitivity of the system.
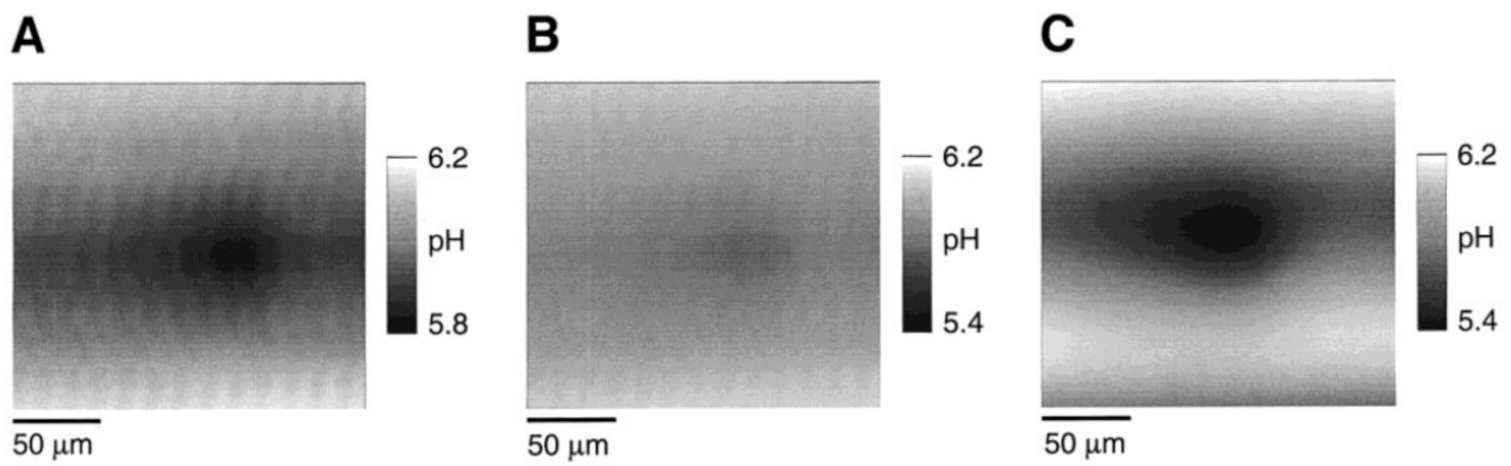
It can image chemical species near the surface of the substrate by using a scanning electrochemical microscope (SECM). By measuring the output of SECM and combining it with the iridium oxide probe position, pH can be obtained by using the calibration curve. Iridium oxide can be electrodeposited by different casting electrolytes by Wipf et al. [17], in which 27 mM Na3IrCl6 in 0.1 M HCl was boiled until the solution changed from olive green to light brown. By spurging with nitrogen to avoid oxygen in the solution, 6 M NaOH was added until pH was ~12.5. Iridium oxide was deposited on a homemade carbon fiber electrode, which was prepared by sealing individual carbon fiber (CF) into glass capillaries with epoxy, at a constant potential of between 0.6 and 0.7 V vs. Ag/AgCl for 2 min. Biotinylated glucose oxidase was covalently bonded onto the surface of the CF/IrOx electrode by biotin-avidin coupling pretreatment. SECM was used at the scan rate of less than 2.5 µm/s, and the potentiometric response was reproduced by potentiometry results. Figure 4 is the illustration of pH imaging for glucose detection.
The reaction on the electrode is as follows:
Glucose + H2O + 2FeCp2+ → gluconic acid + 2FeCp2 + 2H+
FeCp2 → FeCp2+ + e−
The overall reaction is as follows:
Glucose + H2O → Gluconic acid + 2H+ + 2e−
Not only can iridium oxide work as a working electrode in the current measuring system, but it can use as a reference electrode as well. KiláKang, Sun, et al. [18] designed a two-electrode system for glucose detection.
The IrOx worked as a quasi-steady-state reference electrode, electrodeposited onto the micro-fabricated Pt electrodes following the recipe of Marzouk et al. [19] To make this iridium oxide reference electrode for actual field application, the revised design of the iridium oxide-based sensor was constructed. On the top of the Pt layer, poly(m-phenylenediamine)/GOx (PMPD/GOx) film was electropolymerized at 0.7 V. Teflon, and polyurethane [20] films were used to serve as protective outer layers to sustain sufficient using time and to increase the stability and reusability of the as-prepared three electrodes system. Such a system achieved a detection limit of 1 mM for glucose by the amperometric method at 0.45 V. The response of glucose amperometric signal in PBS solution was investigated as well from 1 mM to 30 mM.
Years later, in 2009, Li et al. [21] reported an IrOx reference electrode for glucose detections with an oxygen compensated system and temperature compensation by LabViewTM software (National Instruments, Austin, TX, USA). The combined oxygen sensor, temperature sensor and glucose sensor provided a route for in vivo real application on a small catheter. Even though the detection limit was not that low compared with other researchers, the detection range can range from 0.1 to 10 mM, far more than a real application case. IrOx became widely accepted for its reference performance afterward.
Recently, Li et al. [22] developed a dual IrOx reference electrode, which can provide much better accuracy towards glucose (0–4 mM range with detection of limit 31 ± 8 μM) and oxygen concentration (0–60 mmHg with detection of limit 0.4 ± 0.07 mmHg).
Either the morphology of iridium oxide can be modified by different growth methods relying on the template-based way or some pre-modified electrode coated with iridium oxide. Here, we summarized a paper discussing the microelectrode by Marzouk. Ultra-miniaturization has led to the microelectrode design for glucose monitoring. Ribet et al. [23] came up with continuous intradermal glucose monitoring based on IrOx as a reference electrode with glucose oxidase enzymatic system for invasive glucose monitoring amperometric detection method with 0.6 V applied potential. The mass transfer mechanism for glassy carbon electrodes and microelectrode is different. Based on the theory of ultramicroelectrode mass transfer from [24] hemispherical diffusion played a much more role than linear diffusion at a relatively lower scan rate. We believe that researchers could utilize such microelectrode to detect the different sensing systems.
3.1.2. Iridium Oxides Nanomaterials for Direct Glucose Oxidation
Dong et al. [25] has most recently reported the first iridium oxide-nanomaterials based direct glucose oxidation in a non-enzymatic glucose sensing system. The precursor iridium tetrachloride mixed with polyvinylpolypyrrolidone (PVP) and electrospun to generate nanofiber structure, which further was calcinated to acquire the iridium oxide (IrO2) structure. The as-prepared iridium oxide was further modified onto the glassy carbon electrode and screen-printed electrode to study its direct non-enzymatic glucose detection. The amperometric response showed that the repeatable response of glucose oxidation occurred at 0.68 V. This work is the first time that iridium oxide itself used in the non-enzymatic glucose sensing. The iridium oxide nanomaterials were also modified screen-printed electrode and it maintained similar the non-enzymatic glucose sensing performance with broadened linear range. In the meantime, the proposed sensor also held pH sensitivity in the range of pH 3 to pH 13. Furthermore, Dong et al. [26] also reported the addition of gold precursors into the iridium precursors to form the nanocorals after calcination process. The as-developed sensor also held dual sensitivity towards D-Glucose and pH in the range of pH 3–13.
3.2. Hydrogen Peroxide Detection
A novel electrode, which formed on titanium electrodes by thermo-coating of IrO2 and Ta2O5, was developed by Morimitsu et al. [27] The hydrogen peroxide was oxidized on the electrode by applying the cyclic voltammetry method, and a linear relationship between oxidation current density at 0.5 V and H2O2 concentration was concluded.
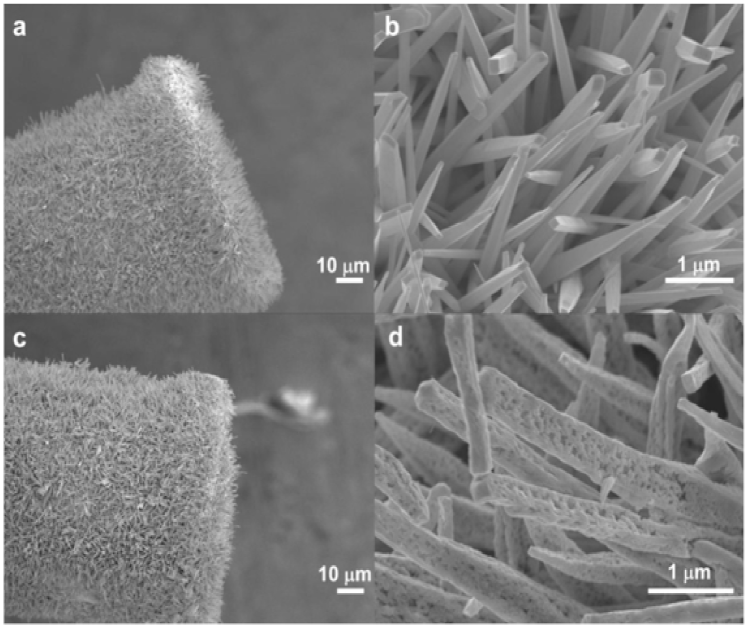
The highly single-crystalline IrO2 nanowires grown on Au microwire (IrO2NW-Au) and reduced by hydrogen at 200 °C forming (Ir/IrO2NW-Au) were prepared by direct vapor transport process by Ha et al. [28] Figure 5 shows the morphology of the as-prepared IrO2NW-Au and Ir/IrO2NW-Au.
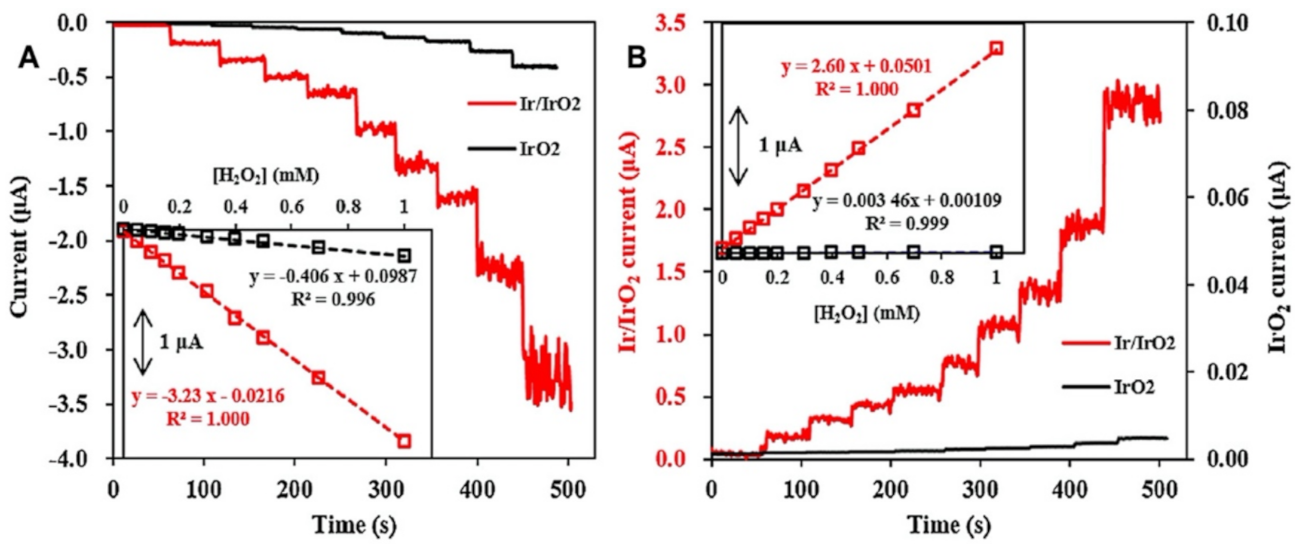
Amperometric responses of IrO2NW-Au and Ir/IrO2NW-Au with changing of hydrogen peroxide concentrations are demonstrated in Figure 6, in which oxidation peak current (at 0.43 V) and reduction peak current (at −0.03 V) were compared. In Figure 6A, it describes the anodic amperometric response of IrO2NW-Au and Ir/IrO2NW-Au to hydrogen peroxide at 0.43 V. Figure 6B describes the cathodic amperometic response to the hydrogen peroxide at −0.03V. The corresponding linear relationship curves were plotted in the insets, respectively.
Based on the comparison of IrO2NW-Au and Ir/IrO2NW-Au to the hydrogen peroxide response, the researchers claimed that Ir/IrO2NW-Au structure gave higher sensitivity at 2.6 μA mM−1 than IrO2NW-Au at 0.0035 μA mM−1 according to H2O2 reduction current. Even though their work is unique considering the special fabrication process, the results are not comparable to others, which made it less acknowledgeable.
3.3. pH Sensing of IrOx Applied Materials
The pH sensing by using iridium oxide materials has been widely studied by the previous research [29,30,31,32,33,34,35,36,37,38,39,40]. The iridium oxide was used for measuring the liquid acidity and basicity in different settings, including extracellular environment pH measurements, in vivo applications, remote water pH monitoring and microelectrode pH sensing [41], etc.
The hydration effects of the iridium oxide-based pH sensors were mentioned in the study [42], and it used the polyaniline as an example to illustrate the more hydration the material was, the higher the Nernst constant would be. Below, these aspects were demonstrated and shown.
3.3.1. pH Sensing of IrOx in the Extracellular Environment
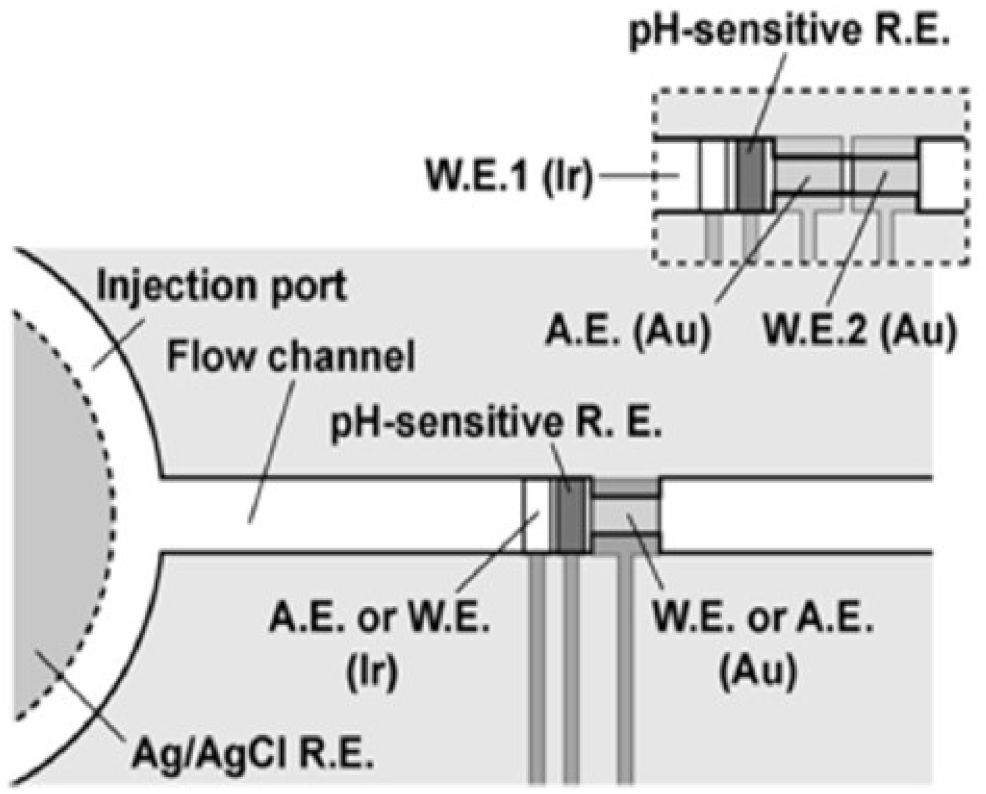
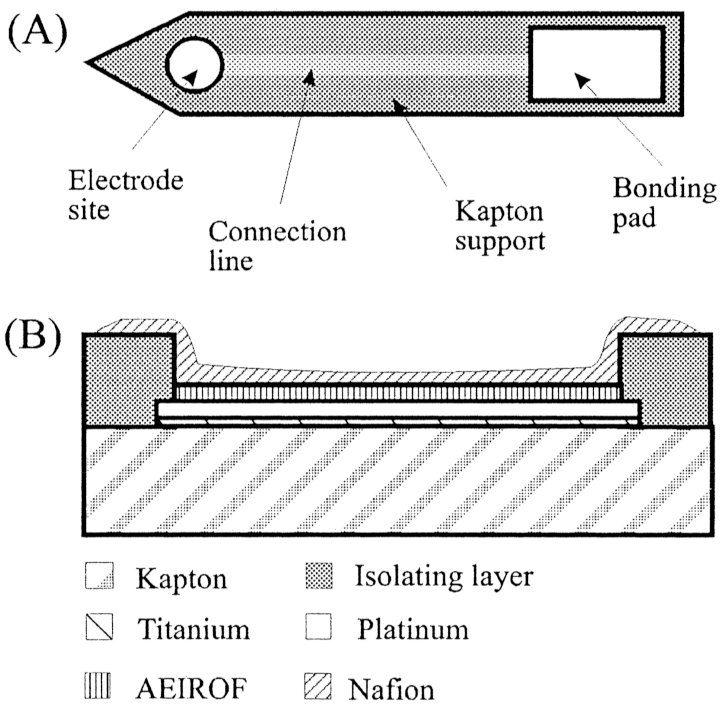
Due to its pH sensitivity, the AEIROF pH electrode (iridium oxide-based pH electrode) was employed to measure pH during no-flow ischemia [19]. The schematic of the electrode was shown in Figure 7. To fabricate such pH electrodes, sputtered circular disk gold electrodes on flexible polyimide Kapton substrate were modified for the platinum electrode fabrication. The electrodes were then cut into individuals, which were wired using conductive silver epoxy and heated at 100 °C for 1 h, followed by insulation using silicone rubber, thus offering a good pH sensor for monitoring pH variation in an extracellular environment.
It is also an excellent way to understand the metabolism of cells by measuring the local pH change in terms of protons released to the outside of cells during the glycolysis process. Anodically oxidized iridium oxide films were electrodeposited on the surface of Au electrode [1] on-chip to achieve this goal, which was dried overnight for an equilibrium of iridium oxide afterward. Then, the chip was coated with another layer of PEI with 5% of 20 µL to increase the mechanical stability of iridium oxide film. Then, the third layer of fibronectin was coated onto the dried surface, suspended in Dulbecco’s modified Eagle’s medium (DMEM). A typical super-Nernstian constant, 66 mV ± 3 mV, was calculated between pH of 4.0 to 7.7. The study showed the real-time local pH measurement of such systems, which has great potential to enable biocompatible and real-time detection.
3.3.2. Fiber-Based pH Sensing for In Vivo Applications
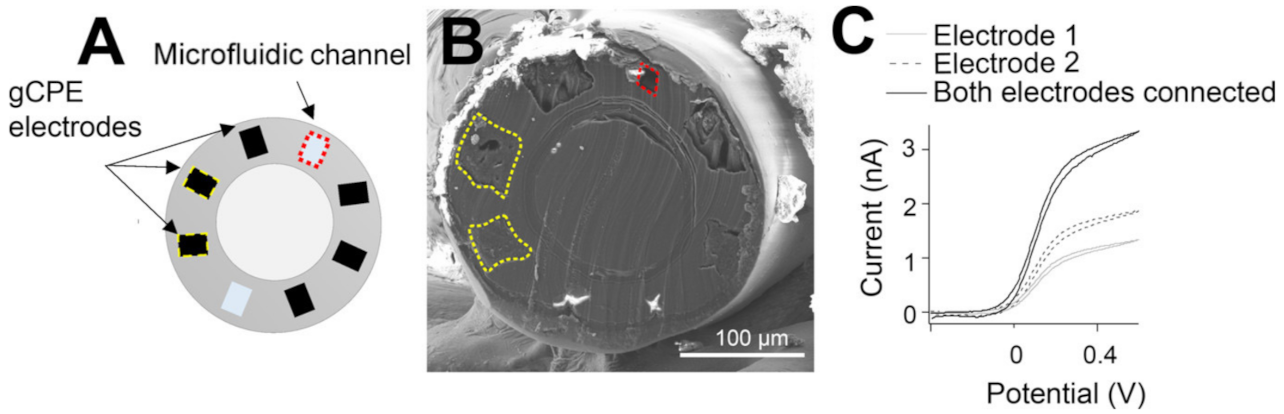
Booth et al. [43] has reported polymer-based fibers with multichannel microfluidics for sensing pH and neurometabolic lactate. The fiber consisted of six electrodes made of a custom conductive polymer composite. An iridium oxide film was electrochemically deposited onto one of six carbon electrodes to fabricate such a pH sensor. Additional reference electrodes and counter electrodes were employed to form a three-electrode system for the measurements of open-circuit potential. The proposed electrode configuration was evidenced with a classical microelectrode for a reversible solution redox species (in Figure 8C). Such fiber-based electrodes expanded the manner of the iridium oxide film in the application of minor volume pH sensing. Experiment demonstrated a pH sensitivity of −56.6 ± 5.3 mV/pH. This research opens the avenue for the miniaturization of the micro-liter volume or nano-liter volume pH sensing applications along with the combination of other targeted molecules.
3.3.3. Nanoliter Cell Trap System for Local pH Change Recording
Not only the bulk size of liquid can adapt iridium oxide-based electrode for extracellular pH sensing, pH in cardiac myocytes with nanoliter volume measurement condition, such as biological cells, could also be measured by the property of iridium oxide. Ges and Baudenbacher et al. [44,45] reported nanoliter cell trap could measure the local pH changes of single cardiac myocyte by electrodepositing iridium oxide on Pt planar surface. The acidification rate of cardiac myocytes [44] and A9 L HD2 fibroblast cells, M3 WT4 CHO cells [46] were measured as an application of the biological cell pH evaluation. This group also prepared another iridium oxide (reference electrode) and iridium oxide (sensing electrode) in nL volume of detecting local pH change in a small number of cells. Ges et al. [45] designed a Y-shape microfluidic channel and proved that the Nernst Constant was around 70 mV/pH, which agreed well with their previous work [44] of using Ag/AgCl reference electrode.
These studies demonstrate that iridium oxide can serve as an electrode for detecting the local pH change of the extracellular environment.
3.3.4. Remote pH Monitoring of Drinking Water
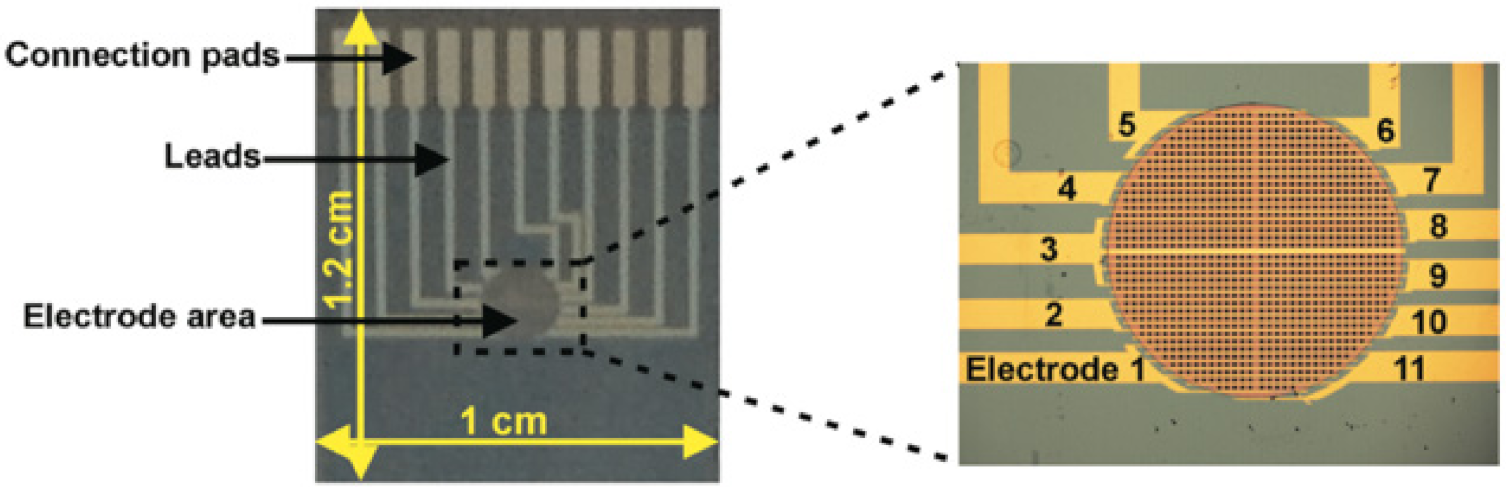
Drinking water plays a vital part in our daily life. Investigation of pH change continuously is an essential part of the monitoring of water quality in real-time. Carroll et al. [47] reviewed the past different techniques of iridium oxide electrodeposition. They found that pulsed potential electrodeposition strategy could improve IrOx films performance, which was realized by pulsing between 0.0 V and +0.55 V (vs. Ag/AgCl) for 40 min, ending up with thick, visually uniform and reproducible IrOx films for pH monitoring. It shows that this kind of film was mechanically stable in buffer solution for months, ending up with very small drifts in absolute potential. In order to realize the recording of reproducibility of the same condition with multiple electrodes, 11 electrodes were fabricated by a photolithography technique, and the results are shown below in Figure 9. One exciting part in this study was that the electrode could be recovered by applying 200 mV (vs. Ag/AgCl) for 3 min at pH 6 buffer or −14 mV for 6 min at pH 10 buffer under different conditions. The electrode Nernst constant was kept unchanged between the 11 electrodes, and the drift issue could be vastly reduced in this way, which was a good way for other researchers to tackle the drifting problems.
Through this, they finally realized a well-calibrated IrOx electrode with slight random drift over 16 days. To expand the electrode in the real application, the large area of electrode needed to further explore to increase its applicability in the practical applications. Jović et al. [34] has developed a method to have layer-by-layer fabrication method by using inkjet printing method to build 1–5 bilayer of iridium oxide (IrOx) suspension and polydiallyldimethylammonium (PDDA) covered on the surface of the ITO upon poly(ethylene terephthalate) substrate. The constructed 5 bi-layer (for a single bi-layer has one IrOx and one PDDA) sensor possessed good pH responsive in the range of 2.91 to 10.36 with minimum drift effects of 10 mV compared with 44 mV for single bi-layer structure sensor.
In addition to experiments and schematic design on different sensing systems, morphology improvements for iridium oxide (nanowire, nanotube, nanorods, etc.) was another hot topic. In addition, other structures of iridium oxide were introduced for real field sensing applications.
3.3.5. Anodic Aluminum Oxide Template Directed Iridium Oxide for pH Sensing
In the past decades, since Yamanaka et al. [1] reported the anodic prepared iridium oxide film, different structures have been reported, including nanotubes [48,49], nanoporous thin films [50], thin films [51,52] of iridium oxide and used for different sensing applications for various targets, such as glucose, hydrogen peroxide, glutamate, dopamine [53], organophosphate pesticide [54], etc. The basic application is for the pH measurements in a liquid phase. By employing anodic aluminum oxide nanotemplate, Nguyen et al. [49] developed a micro-scale electrode with an average diameter of 70 nm and length around 725 nm.
The as-prepared micro-electrode exhibited a sensitivity of 74.2 mV/pH, which was a super Nerstern constant. The work presents the first trial of iridium oxide nanotube structure for pH sensing in the conventional situation. They found that the nanotube morphology did lead to a good linear relationship of pH sensing.
3.3.6. Microelectrode for pH Sensing
Following the procedure of prepared iridium oxide deposition, Marzouk et al. [19] and Yamanaka et al. [1], Bezbaruah et al. [55] fabricated a microelectrode based on the pulled glass pipets, with the diameter ranging from 3–10 µM. Figure 10 shows the schematic of the tip of an AEIROF microelectrode.
With the potential to fabricate such microelectrode, aging effects within 70 days of microelectrode were also explored, as well as the temperature effect to the microelectrode. The following mechanisms were mentioned and explained.
Anhydrous IrO2 responds to pH change:
IrO2 + H+ + e− ⟷ IrO OH
Or 2IrO2 + 2H+ + 2e− ⟷ Ir2O3 + H2O
Hydrated iridium oxide present super-Nernst constant:
[IrO2(OH)22H2O] 2− + 3H+ + 2e− ⟷ [Ir2O3(OH)23H2O] 3− + 3H2O
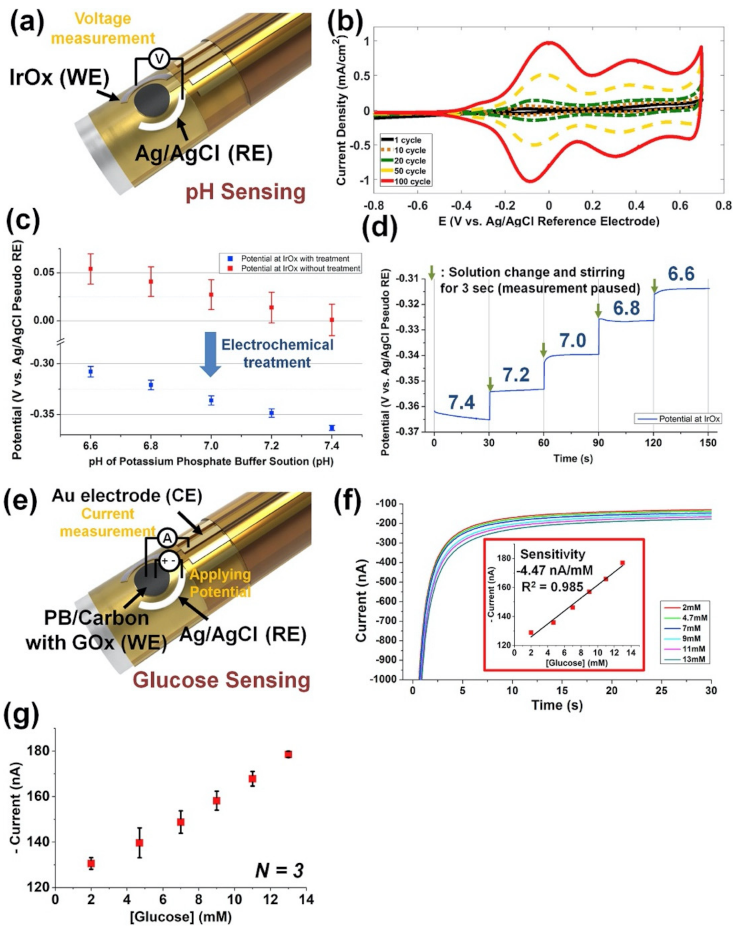
In a microneedle-based configuration, Park et al. [56] reported a multi-modal biopsy needles to construct electrical conductivity, pH, and glucose measurements module in one element. The iridium oxide layer was deposited onto the electrode by using electrodeposition electrolyte formed by iridium chloride hydrate precursor along with the reducing reagent hydrogen peroxide and chelating reagent oxalic acid [1]. A flexible polyimide (PI) substrate was fabricated by following conventional photolithography to the stainless-steel needle (dia. 1.2 mm). Multilayer of Titanium/gold electrode were fabricated to serve as conductive sensor and the substrate of the pH sensor. The pH sensor held a sensitivity of −69.3 mV/pH and it can also differentiate the pH differences between the normal tissue and cancerous tissue. Figure 11 depicted the configuration of the iridium oxide sensor and its pH sensing performance (Figure 11c,d) and its glucose oxidase-based glucose-sensing performance (Figure 11f,g).
Another paper reported using iridium oxide as a reference electrode in 2005. Franklin et al. [57] activated the Ir seed layer by using Pulsed Voltammetry (PV) or Cyclic Voltammetry [58] and realized good stability for two weeks. However, the pH sensitivity lost its stability after 23 days. Iridium oxide, serving as a reference electrode, was applied for the system for in vivo detection of dopamine and serotonin.
Later, a different iridium oxide fabrication method was introduced using polymeric precursors. Except for improving the iridium oxide fabrication method and the configuration of three electrodes system or changing the reference electrode to improve the amperometric performance of iridium oxide films, another polymeric precursor to mix with iridium oxide was proposed which could also be another way to improve the amperometric performance. Da Silva et al. [59] used citric acid and ethylene glycol contained solution under stirring at 60 °C. Then the metallic precursor’s iridium chloride and titanium (IV) isopropoxide were added slowly. In testing different molar ratio of iridium chloride with titanium isopropoxide, different pH response was evaluated and the results showed that 30–70 mol% was the best electrode formations, which suffered less especially from potassium ions interference. The additional study pursued to modify the iridium oxide on a flexible wearable sensor through electrodeposition method to realize the medium-distance wireless pH sensor data logging and transmission [60]. The as-prepared wearable pH sensor realized close to theoretical Nernst value of −79 ± 2 mV for the collected sweat sample from the human body. This study provided a method to integrate the iridium oxide-based pH sensor in the measurements of the human sweat pH sensing with wireless data transfer capacity.
All the iridium oxide suffered from a drift problem to certain extent, which is also one reason why many electrodes were dipped into phosphate buffer for at least 2 days to stabilize the as-prepared iridium oxide. However, researchers reported that a drift–free way to come across such a problem, even though others have not widely used it.
The drifting issue in iridium oxide pH sensing has perplexed the researchers for a long time. It is always related to buffer capacity, with changing of pH as well as temperature. Hendrikse et al. [61] claimed that electrodes made of hydrated metal oxides MeO(OH), where Me can be Ir, W, Pt, take part in a reaction as below:
The potential of these electrodes concerning reference electrode, E, could be derived as:
where E0 is the standard electrode potential, and = is the activity of species I. T is the temperature of the solution, k and q stand for constant and electron number of the system.
Hendrikse, J. et. Al. [61] introduced another parameter as VT.
where C is a constant and is the potential difference between the metal oxide and the electrolyte solution. It was determined by pH.
Equation (11) was subtracted by Equation (10), then
Based on such a concept, they designed their measurement set-up to measure E and VT separately and solved the drift problem by recording potential changes.
However, this paper mainly worked on the ISFET mechanism, which was not widely used in iridium oxide sensing systems. Not many researchers took advantage of this until 1997.
Interestingly, another research group, Wang et al. [62] found a “drift-free” behavior iridium oxide-based pH sensor by applying ‘carbonate melt oxidation’ process. In brief, Ir metal wires were pre-cleaned by 6 M HCl solution followed with de-ionized water. The cleaned wires were then further oxidized in an alumina crucible lined with gold foil and covered with lithium carbonate powder at 870 °C 5 h at the presence of air atmosphere. The prepared iridium oxide pH sensor possessed Nertnst constant −58.4 ±0.2 mV/pH over 2.5 years among the 10 tests for the same electrode, indicating potential commercialization fabrications and applications. However, the storage condition for the prepared electrode was not fully investigated. To understand the actual “drift-free” characteristics, researchers are encouraged to investigate the relationship between synthesis methods vs. drift-free features [63,64]. Future applications for the iridium oxide-based pH sensors may require the integration of the wireless transmission system for wearable applications [65].
3.4. Glutamate Sensor
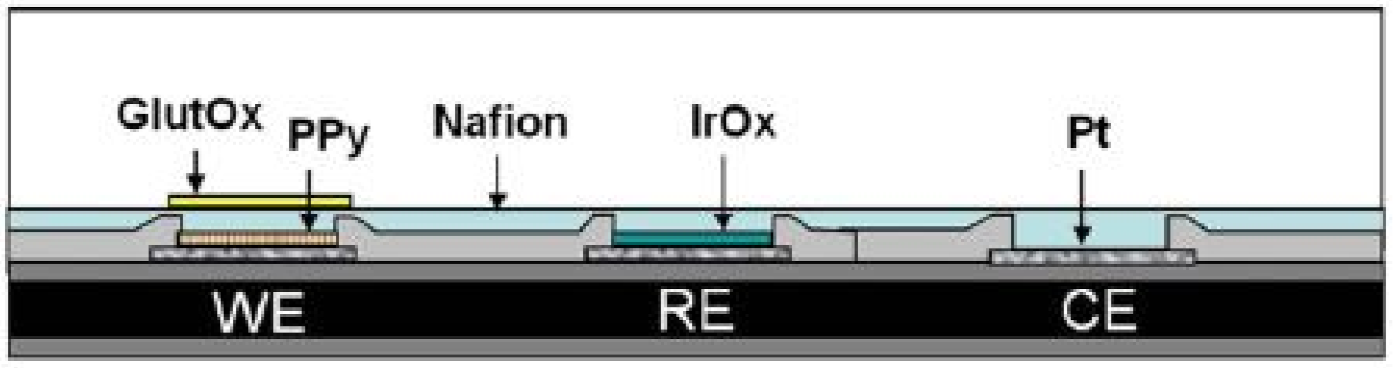
Iridium oxide can also serve as a reference electrode (RE) on the microprobe for glutamate detection under the configuration presented in Figure 12.
To prepare such sensing electrodes, polypyrrole was electrodeposited by applying amperometric method at a constant voltage of 0.85 V for 5 min. Iridium oxide was fabricated using the recipe developed Yamanaka et al. [1]. By cycling voltammetry between 0.0 V and 0.6 V versus Ag/AgCl at a scan rate of 50 mV·s−1 for 100 cycles, iridium oxide was formed on the reference electrode site. Afterwards, the surface was coated with Nafion layer by dip-coating and followed by baking at 180 °C for 4 min, and the whole process was repeated for two times to form a permselective film. The working electrode was decorated with GlutOx (2 wt%), BSA (2 wt%) and glutaraldehyde (0.125%). Figure 13 shows the as-prepared electrode for the detection of glutamate, and the unstable performance at higher glutamate concentration was observed.
3.5. Immunosensor Composed of Iridium Oxides for IgG and Human Transferrin Detection
Electrochemical immunosensors are an attractive tool that produces excellent detection limits. By applying square wave potential pulses (0.1 Hz) ranging from +0.8 V to −0.6 V (versus Ag/AgCl), the Ir disk electrode was converted to IrOx electrode, which served as working electrode, with Pt flag serving as the counter electrode, and Ag/AgCl as a reference electrode. Wilson et al. [67] developed such rabbit IgG immunosensor by incubating electrodes in blocking buffer solution which contained target analyte. Iridium oxide thin film formed a three-dimensional matrix by physical entrapment through anti-IgG/IgG/anti-IgG-alkaline phosphatase complex on the electrode. Hydroquinone diphosphate (HQDP) was used as an enzyme substrate. Electrode-bound IgG was detected by the oxidation of HQDP to HQ at the same time two electrons were released. Such as-prepared electrode gave a linear relationship in the range of 10 to 200 ng/mL, while the response saturated when above 600 ng/mL.
To demonstrate the application of IrOx immunosensors in a clinical assay, human transferrin IrOx sensor was developed for quantification by immobilizing anti-human transferrin in the iridium oxide matrix, with the presence of HQDP. Human transferrin was determined in the range between 100 and 600 ng/mL.
3.6. Organophosphate Pesticides (Ops) Detection
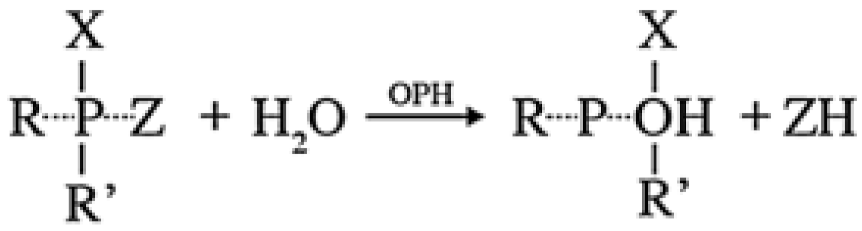
Organophosphate pesticides are one type of pesticide that is widely used and also critical for damaging an enzyme (acetylcholinesterase) in the targeted body. However, such an enzyme controls the nerve signals in the body, resulting in the killing of pests and unwanted side effects. Therefore, some researchers have explored the colorimetric detection method by using acetylthiocholine as the substrate to produce the acetic acid and thiocholine in the presence of acetylcholinesterase [68].
As shown in the pesticide’s reaction scheme (Figure 14), paraoxonase 1(PON1) triggers the dissociation of diethylphosphate while releasing the protons which decreases the pH of the bulk solution. Due to its pH sensitivity, iridium oxide was thus applied for pesticide detection in conjunction with enzymes (Figure 15).
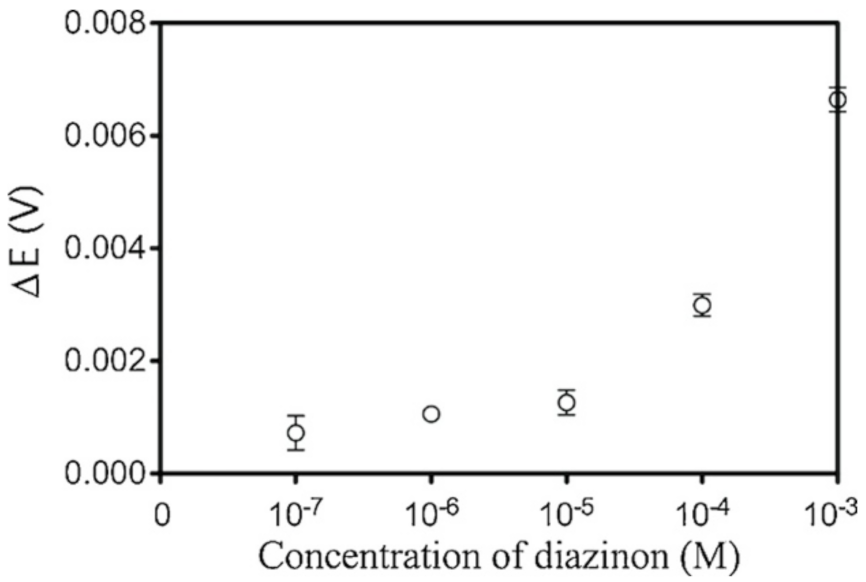
Figure 16 illustrates the detection limit of diazinon down to 3 µM. Even though this work has a limit of detection, which is three orders of magnitude higher than that of the acety cholinesterase (AchE) based sensor, it could provide online monitoring of detoxification processes that inhibition based AIChE sensors cannot accomplish.
Chlorpyrifos (CPF) is one of the widely used Organophosphate Pesticides (Ops), which interfered with brain development due to the alternation in cell replication and differentiation. Capoferri et al. [69] reported two types of methods to detect and quantify the analyte (chlorpyrifos) by forming IrOx nanoparticles onto the indium tin oxide working electrode, which followed by thermal polymerization of polypyrrole. The detection methods involved with the direct visual color change of iridium oxide in the presence of the analyte. However, this method was limited by the electrochromic properties of the iridium oxide. Thus. The smartphone was introduced to enhance the color differentiation.
3.7. Metal Ions Detection
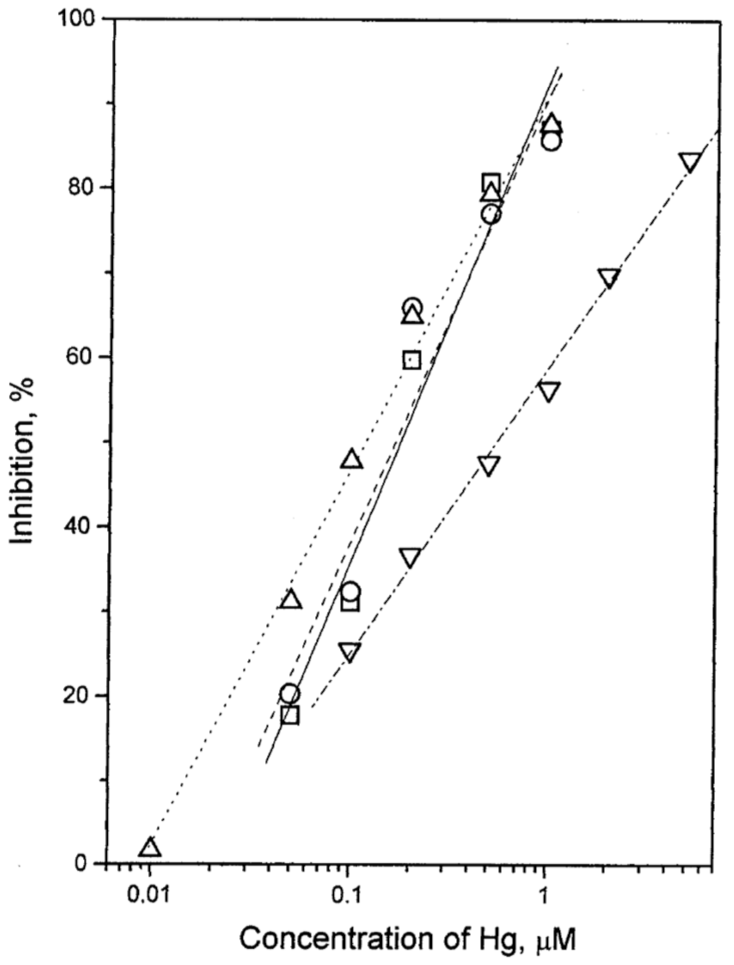
By employing the inhibition effect of heavy metal on the activity of urease, Vel Krawczyk et al. [70] pioneered the use of urease for the determination of mercury ions. Urease was physically entrapped onto the surface of the iridium oxide layer, which leads to pH sensitivity ranging from 2 to 11 with a slope close to the theoretical Nernst value. The inhibition effect of Hg(NO3)2, HgCl2, Hg2(NO3)2 and PhHgCl on urease activity were studied using 1.0 mM of urea as the substrate. It showed that inhibitions of inorganic Hg (II) forms were similar, demonstrated in Figure 17.
3.8. Urea Detection
Urea was estimated usually in the range of 2.5–7.5 mM (0.15–0.4 g/L) and 155–388 mM in human blood and urine, respectively. It is the majorly produced by the liver as the result of protein and amino acid metabolism. Renal failure, severe dehydration, etc. can lead to anomalous urea level, resulting in danger condition of the human body. Even though colorimetric methods [71,72,73] have been readily available for quantification of the urea by diacetyl monoxime method and Berthelot reaction, the colorimetric methods have disadvantages regarding the detection of limit.
With streptavidin-coated micro particles relied on the biotin-streptavidin interaction to modify the urease onto the microparticles covalently. Urease can catalyze the urea into ammonium hydroxide through the hydrolysis process. As a result, ammonium hydroxide accumulated in the solution, leading to the increased pH.
Relying on the reaction below:
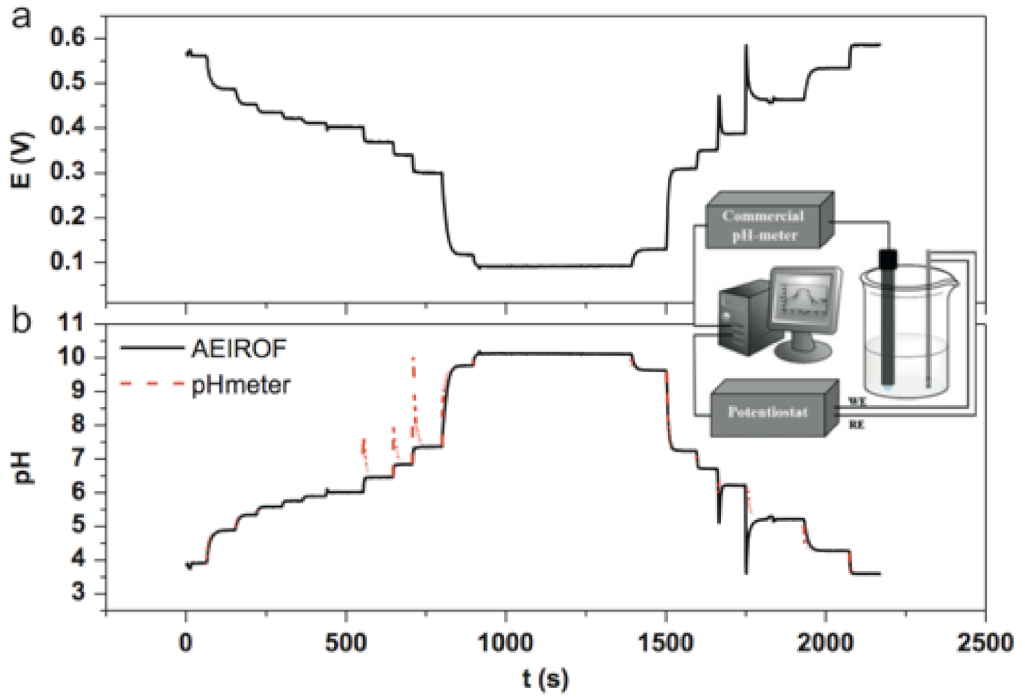
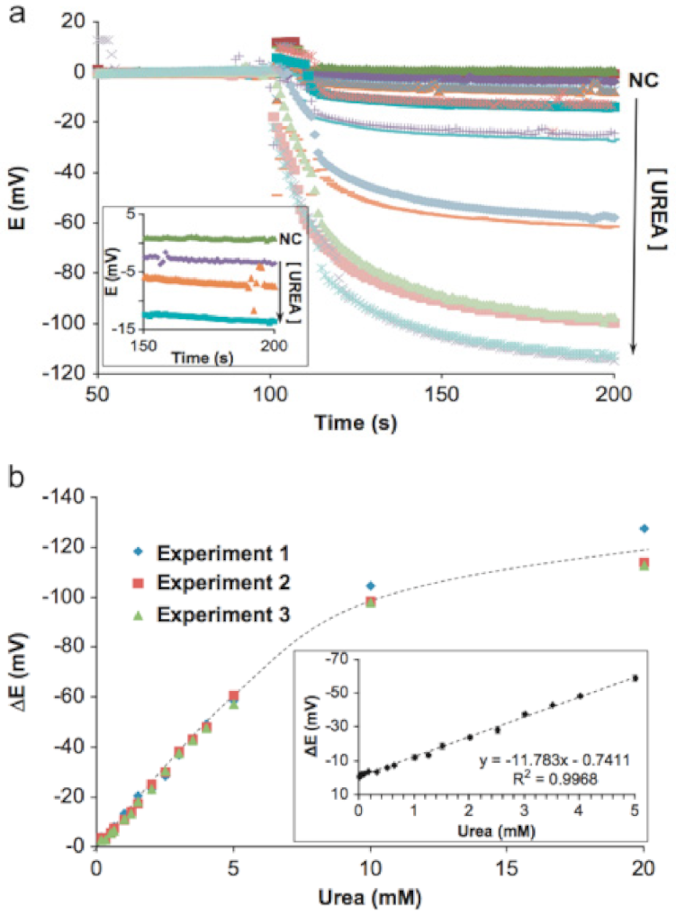
pH change resulted from urea decomposition could be determined using iridium oxide as a pH-sensitive material. By designing iridium oxide electrodes with different areas of 120 µm2, 300 µm2 and 2.27 mm2, the Nernst constant did not change greatly, indicating the independence of the working electrode area on the sensitivity of the pH sensor. The proposed urea sensor held the capacity to sense as low as 78 µM in phosphate buffer with the linear range from 100 µM to 5 mM with a slope of 11.78 mV/mM. Figure 18 demonstrated the pH response of the prepared AEIROF and the commercial pH meter comparison.
3.9. Protein Detection
3.9.1. C-Reactive Protein (CRP) and Myeloperoxidase (MPO)
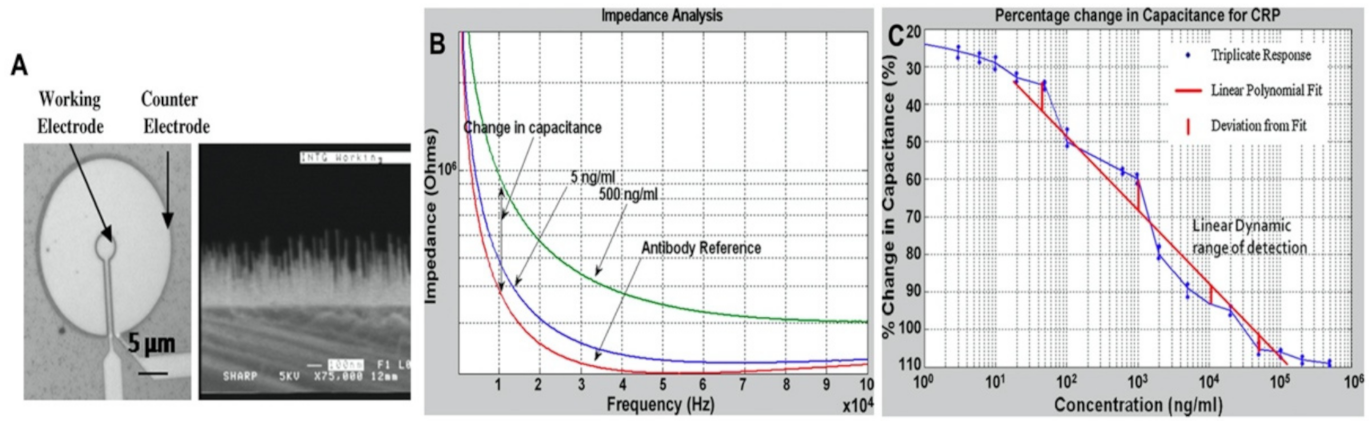
Iridium oxide has good biocompatibility. By changing the morphology of iridium oxide, i.e., nanowires, nanotubes, it is possible to increase protein entrapment capacity. The biotin/streptavidin linker has been widely used in the linkage between biotin and other protein such as avidin. Venkatraman et al. [75] designed a protein detection electrochemistry system using the aforementioned linker system. Briefly, the silicon dioxide wafer was used as the substrate to grow the iridium oxide nanowires from the precursor of methylcyclopentadienyl(1,5-cyclooctadiene) iridium (I) along with the oxygen to induce at 350 to 400 °C with a chamber pressure of 33 Torr for 60 min [75]. Once the iridium oxide nanowires were formed in the gap of the TiN surface, it followed three major steps. (a). Identified the background resistance; (b). Physical absorption of streptavidin on nanowires and incubated with biotin and antibodies of target protein; (c). antibody immobilized until the saturation reached per the resistance measurements. The target protein C-reactive protein (CRP) and Myeloperoxidase (MPO) were quantified in a way to measure the resistance change when the protein bind with the anti-CRP or anti-MPO to create the resistance difference. All these linkages’ reaction on the working electrode was shown in Figure 20A.
The sensing mechanism was relied on Electrochemistry Impedance Spectroscopy (EIS) (Figure 20). The detection limit was calculated as 1 ng/mL for CRP and ~500 pg/mL for MPO. This is a good exploration of nanowires-based protein detection. The work not only broadens iridium oxide-based detection but improved sensitivity and selectivity among other metal oxides [76]. However, the authors did not disclose these results.
3.9.2. Insulin Detection
Three electrodes system, including glassy carbon electrode, platinum as counter electrode and Ag/AgCl as reference electrode was reported by Pikulski et al. [77] By comparing heating different time length of reaction buffer, which included 0.10 mM Na3IrCl6 and 0.20 M HCl, researchers hypothesized such reaction for the different gradient of chloride with iridium on glassy carbon electrode:
They proposed that with increasing of heating time from 10 min to 1 h, the iridium complex changed from to which has much higher electroactivity with insulin. By applying the amperometric method, the detection limit of 20 nM was realized for insulin, and the linearity range was ranged from 0.05 to 0.5 µM. Insulin was also measured in glucose solution by the flow injection analysis system. Figure 21 showed the amperometric peak of insulin did not change obviously with an increase of glucose concentrations. However, the baseline increased somewhat from 3 mM glucose to a higher intensity when in 20 mM glucose, which suggested the potential of being a glucose sensor. However, this was not explored much by the researchers.
3.10. Iodate and Periodate Detection
Iodate and periodate are of paramount importance in our daily life. Potassium iodate and diodine have been used in many countries to deal with the issues of iodide deficiency disorders. However, too much intake of iodate salt could result in goiter and hypothyroidism. Salimi et al. [78] reported iridium oxide modified glassy carbon electrode as the working electrode. The conversion of the iridium ions on the surface of working electrode can be demonstrated as following equations:
IrO2 ·xH2O + H2O + 2e− → Ir2O3 ·xH2O (aq) + 2OH−
3Ir2O3·xH2O (aq) + IO3− + 6H+ → 6IrO2·xH2O(s) + I−
They applied cyclic voltammetry at the bare working electrode and modified electrode in the presence and absence of 50 µM iodate and periodate. The flow injection analysis was used, and the voltage was fixed at 0.7 V in pH 1 electrolyte buffer. Figure 22 illustrates the FIA response to 100 nM−35 µM of iodate.
It also showed that the Effect of NO2−, NO3−, ClO3−, BrO3−, ClO4−, SO4−, Cu2+, Zn2+, Mn2+, Mg2+, Cd2+, Ca2+, Na+, K+, NH4+, K+, CH3COO− and glucose are negligible to iodine detection even at the concentration ratio of more than 1000. The reported detection limit of iodate and diodine were 5 nM and 36 nM, respectively.
3.11. Metalloid Ions Detection-Arsenic (III) Ions
Applying Boron doped diamond (BDD) electrode, Salimi, Abdollah et al. [79] developed a sensing system for arsenic ions detection. The reaction that happened herein is as follows:
Ir (reduced form) → Ir (oxidized form)
Ir (oxidized form) + As (III) → Ir (reduced form) + As (V)
Since cyclic voltammetry was not sensitive for a trace amount of detection, amperometric method was applied for lower concentration measurement. The study showed the amperometric successive addition of arsenic (III) ions in phosphate buffer pH = 4.30 with the detection limit of 2 nM and linearity range from 20 nM–50 µM.
3.12. Ester Type Chemical Detection
Chymotrypsin (EC 3.4.21.1) is a proteolytic enzyme produced by the pancreas. It secrets into the small intestine in the form of the precursor chymotrypsinogen A, which is not an active one. Trypsin and other type of autocatalytic interconversions can activate the Chymotrypsinogen A.
Furthermore, IrO2 or RuO2 were fabricated on Ti substrate using a heat gun to oxidize IrCl3·3H2O and RuCl3·H2O onto a rotating electrode, [80] serving as a pH sensing electrode. Then proteolytic enzyme (chymotrypsin or trypsin) was physically entrapped onto electrode to measure the local pH change in terms of the hydrolysis of N-benzoyl-L-tyrosine ethyl ester (BTEE) and N-acetyl-L-tyrosine ethyl ester (ATEE).
3.13. Nanotube of Iridium Oxide for Cell Action Potential Recording
By recording the action potential ranging from its shape of ion channels information, good signal to noise ratio, to minimal invasiveness and easy scalability, one can tell many activities of cell and state. As nanotubes have a larger area compared with planer structure, they provide higher signals than solid nanoelectrodes regarding to the cell-electrode coupling. Lin et al. [48] recorded the cardiomyocytes action potential by growing cells on the top of iridium oxide nanotube. One can see that cardiomyocytes grew into the nanotube by comparing with planar and vertical nanopillar iridium oxide.
Through changing the geometry of electrode, the surface to volume ratio could be increased, and then much more announced signal recording could be achieved (consider signal to noise ratio 3.3). The work presents a good example for future research on action potential recording on the morphology and structure optimization.
In terms of long time of intracellular time duration by electroporation of IrOx nanotube (Figure 23), measuring the cell membrane reseals duration was applied, which is a transient process induced by electroporation. It realized stable recording up to an hour in a single session and 8 consecutive days recording.
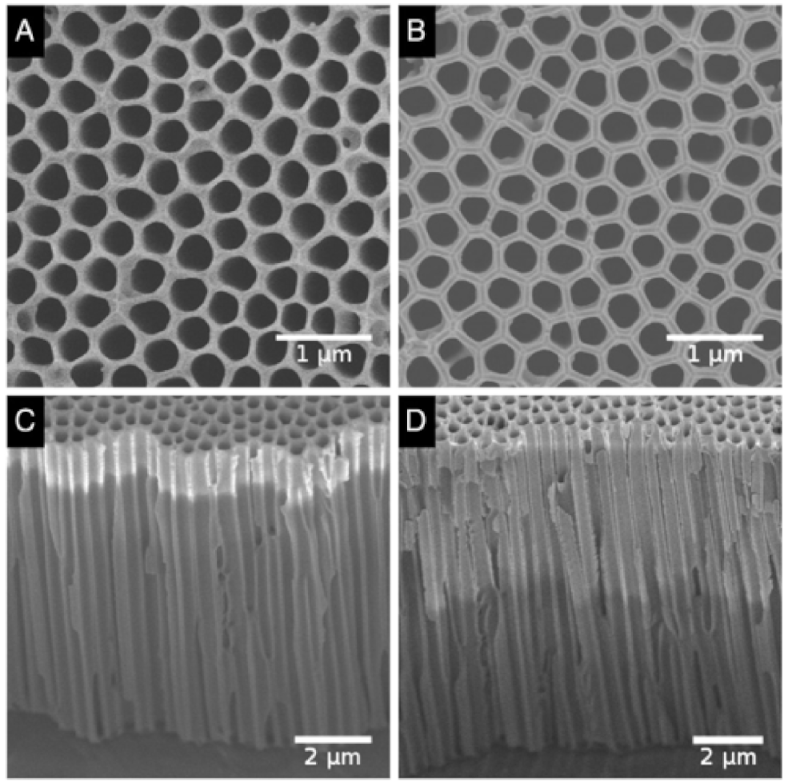
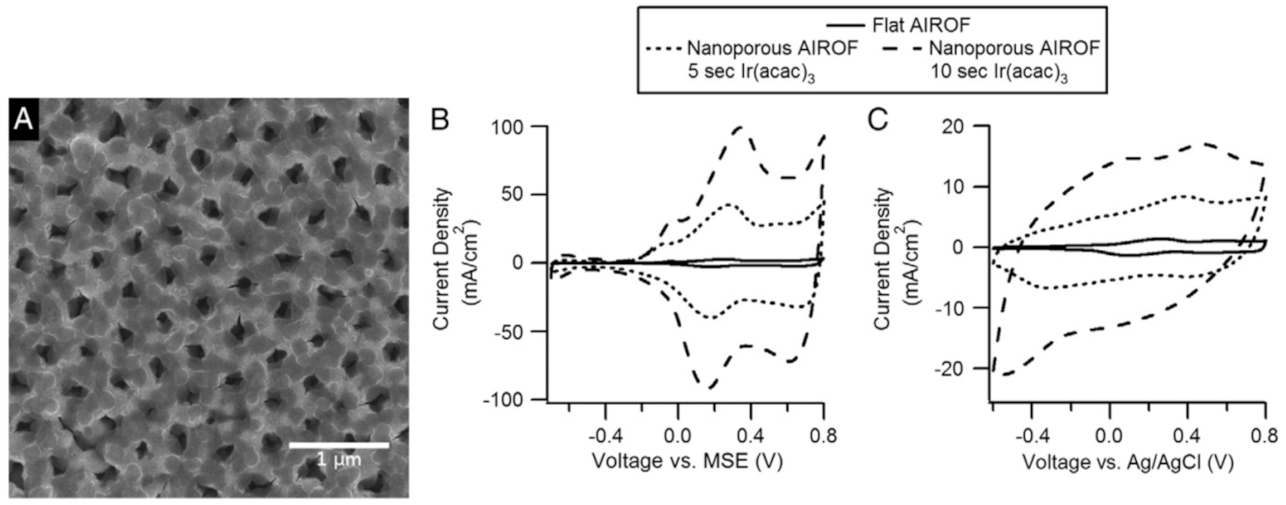
Even though the iridium oxide was prepared though sputtering by many researchers, the thickness of IrOx films cannot be controlled exactly as expected. Atomic layer deposition (ALD) provides a different perspective into solving this issue and realized the thickness control at ~27 nm for 600 cycles of 5–10 s iridium acetylacetonate (Ir(acac)3) exposures with 2 s N2 purge and 2 s O2 exposures with 2 s N2 purge. Figure 23A shows the AAO template before Ir ALD and after as well as the side view of 5 s and 10 s iridium acetylacetonate exposure duration (Figure 23B and 23C) and its corresponding cyclic voltammetry performance in sulfuric acid and phosphate-buffered saline (Figure 24B,C).
One can conclude that the nanoporous AIROFs structure has larger current density than nonporous AIROFs, indicating that the nanoporous structure greatly helps improving the detection sensitivity (Figure 24B,C).
Upon discussed IrOx electrochemical applications, iridium oxide was utilized as or coated on working electrode. However, IrOx could also serve as reference electrodes by some researchers, which can improve sensitivity of the sensors developed.
3.14. Iridium Oxide-Based Gas Sensors
3.14.1. Iridium Oxide-Based Propane Sensors
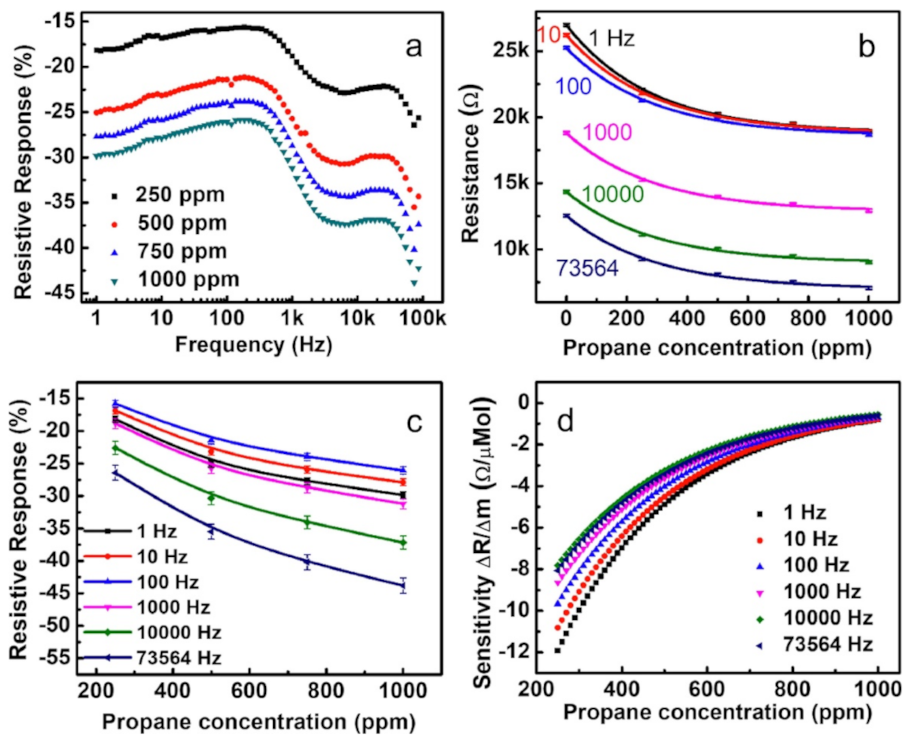
Propane is an achromatic, odorless, flammable, and non-toxic gas; however, the accidental high concentration exposure can lead to explosion risks. Even though it is considered as non-toxic, the inhalation due to over-exposure may pertain to prolonged effects, such as dizziness and nausea. The iridium oxide was rarely investigated for the propane detection from both theoretical and experimental aspects. Avila-García et al. [81] reported the spin-coated iridium oxide thin films for the measurements of different concentrations of propane by recording the voltages change under different frequencies. The measurements were to record the voltage information and calculated the complex impedance of the sample to the voltages at the Lock-in input for each frequency under the varied temperatures. Figure 25 showed the as-proposed sensor held different responsive resistance towards various propane concentrations under different frequencies. Hullavarad N V, Hullavarad S S. et al. [82] reported that the iridium oxide nanoparticles modified microstructures on the fused silica and copper substrate was investigated for the 20–80 ppm range of propanol, acetone and ethanol detection. The results showed that the as-prepared sensor held the highest response sensitivity to the propanol. However, such an experiment did not realize an accurate control of the input gas due to the extremely volatile nature of vapors when heating at 350 °C. The sensing mechanism was explained due to the reaction of the absorbed oxygen species such as O− and O2− to the ethanol, propanol and acetone, forming the acetaldehyde, propionaldehyde and 2-propenal.
3.14.2. Iridium Oxide-Based Hazardous Gases Detection
The formaldehyde, benzene, toluene and xylene are considered harmful gases to the human body for indoor condition with the concentration of 0.075 ppm, 0.034 ppm, 0.047 ppm and 0.042 ppm. Whereas the current commercial metal oxide gas sensors have only 1 ppm detection of limit that is far less capable of sniffing low concentration of the indoor gas. Recently, Wang et al. [83] reported the study involved with Ir-modified SnO2 and Ag-modified SnO2 with high sensing property towards gases at elevated temperature (optimal at 400 °C). The key point that stood out in the materials preparation was that there were 31 kinds of metal ions were mixed with the sol-gel method prepared tin oxide and tested towards these harmful gases. In addition, the sensing materials were further calcined to form the final sensing materials. According to the sensing performance, the iridium-modified tin oxides had the highest response to formaldehyde, benzene, toluene, and xylene at 10 ppm, respectively. The paper did not show the X-ray diffraction and compositional study to the added metal ions. However, the possible oxides (iridium oxide) formed during the calcination process may facilitate the sensing property of the as-prepared sensors. Another study based on the tungsten trioxide nanowires decorated with iridium oxide nanoparticles investigated the pronounced response towards nitrogen dioxide (NO2) when optimized iridium oxide loading and temperature reached [84]. The sensing mechanism was claimed to be the production of -OOH groups with the reaction of water molecules and radical hydroxyl groups in the presence of iridium oxides. When the humidity level is 2–5%, nitrogen dioxide can be absorbed onto the surface of iridium oxide and further react with atomic oxygen (a nucleophile), forming NO3− species and resulting in enhanced total electronic net charge transferring from the host material. During such processes, the iridium were subjected to reduction reaction from Ir(V) to Ir (III), resulting the formation of HIr(III)O2. On the contrary, the iridium oxidized from Ir(III) to Ir(V) with the occurrence of one proton releasing and formed hydrogen gas. This was the reason why such a sensor was not sensitive to the hydrogen detection.
Casanova-Cháfer et al. [85] decorated the iridium oxide with multi-walled carbon nanotubes (MWCNTs) and realized the detection limit of nitrogen dioxide of 1 ppb for IrOx-MWCNTs and 17.8 ppb with only the modification of the carbon nanotubes (CNTs). This further approved the aforementioned sensing mechanism of the iridium oxide to the nitrogen dioxide both in dry (low sensitivity) and humid condition (high sensitivity).
3.14.3. The Multi-Electrode Gas Sensing Configuration for the High-Throughput Impedance Screening
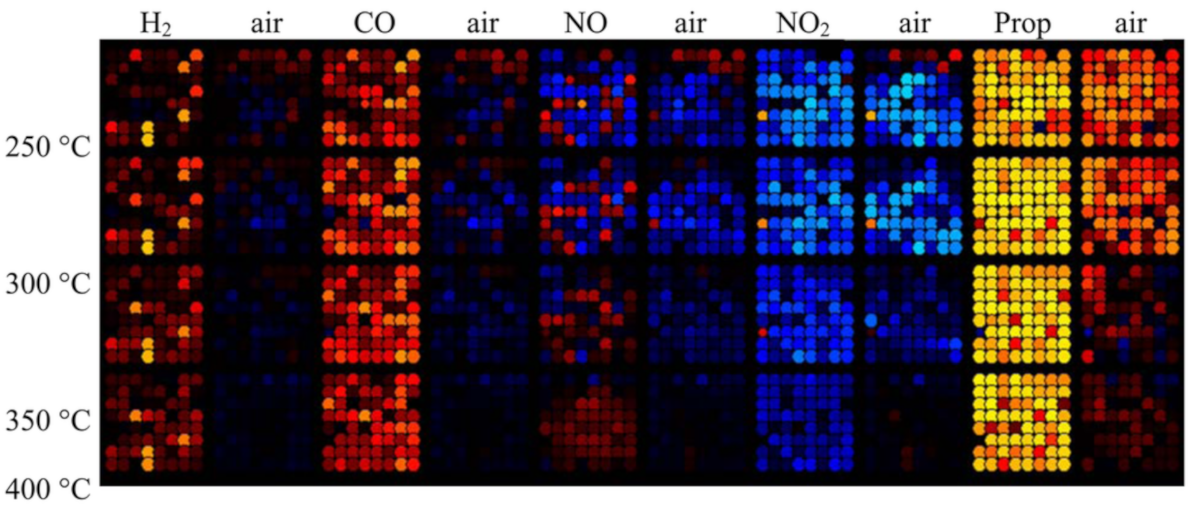
Koplin, Tobias J., et al. [86] reported the method to transfer the impedance signal information into the Trellis-plot and further translated into a color code illustrated below in Figure 26 for five different types of gases detection at elevated temperatures (250 °C–400 °C). The researchers have prepared zinc oxide nanoparticles through polyol method, which involved using zinc acetate dihydrate dissolved diethylene glycol and the following heating process and the annealing process. The as-prepared ZnO was further doped with different concentrations of salts to modify the surface adsorption property. These salts included Au (HAuCl4 3H2O), Ce (as (NH4)2Ce(NO3)6), Ir (as Ir(C5H7O2)3, Pd (as Pd(NO3)22H2O, Pt (as Pt(NH3)4(NO3)2), Rh (as Rh(NO3)3 2H2O with ratio from 0.2 to 0.6 at.% for doping the surface. The impedance signals were converted to Trellis-plot, resulting in the matrix showed in Figure 26. Different types of gas resulted in different patterns on the images. The method involved in this research enabled the future study in the image-assisted gas identification and quantification route. Therefore, the future studies can focus on translating the chemiresistance signals to the different perspective of formats of signals in order to integrate the newly developed technologies in the imaging processing and data mining.
3.15. Iridium Oxides Applications in Monitoring Nucleic Acid Amplification
Many researchers focused the nucleic acid detection by electrochemical methods after 2010. Methylene blue is a common chemical for binding with double-strand DNA amplifying product. Hsieh, Kuangwen, et al. [87] utilized the principle of the redox electron transfer between Methylene blue (MB) and gold working electrode and lead to a measurable current signal. When the target DNA was amplified, methylene blue would bind with double-strand DNA (dsDNA), and thus the current decreased as with the amplification of target DNA, which is S. Typhimurium target genomic DNA here.
Thus, researchers used a small volume of reaction buffer to amplify the target DNA and could quantitatively determine the DNA amplification product, which largely broadened the scope of optical-PCR amplification determination methods.
In fact, methylene blue is not the only electrochemical material that could be used to indicate the quantity of amplified DNA. Hexaammineruthenium (III) chloride is another electrochemically active indicator to interact with the one-target-multi-triggered hybridization chain reaction (MHCR) product. By using the amperometry method, the detection limit of 0.02 fM was achieved according to Zhu, et al. [88]. [was also used as an indicator in the electrochemical detection method.
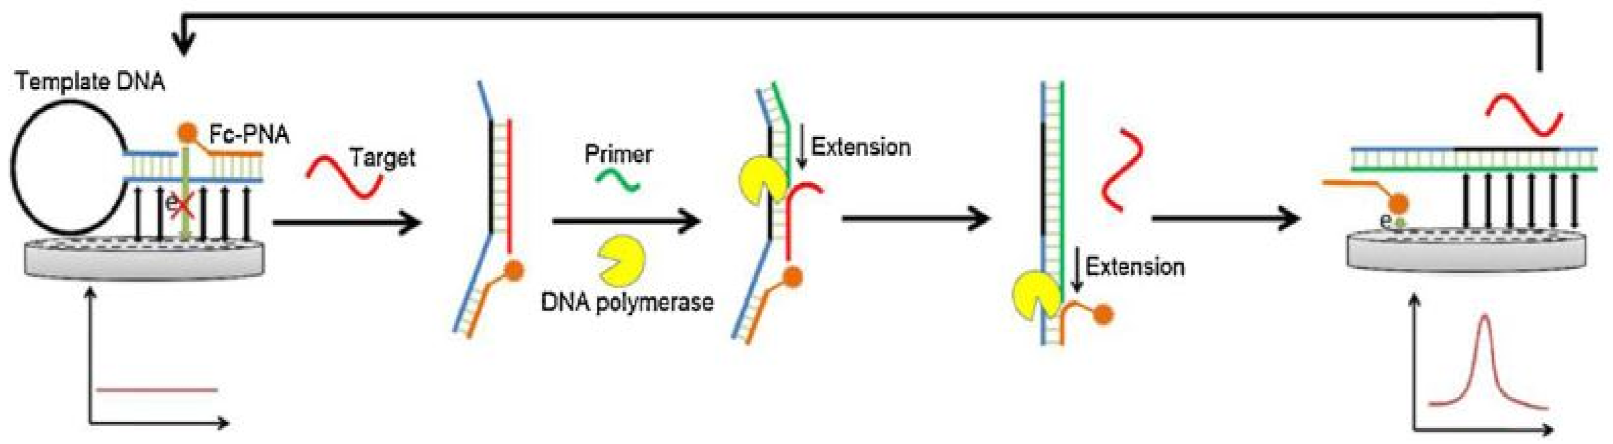
Chen et al. [89] used hybridization chain reaction (HCR) and with the help of two hairpin helper DNAs polymers, leading to intercalation of numerous electrochemiluminescent (ECL) indicators (Ru(phe)32+) into dsDNA grooves, thus, resulting in significantly enhanced ECL signal output. Not only hexaammineruthenium ions and (Ru(phe)32+) could be used to determine the nucleic acid amount, but ferrocene-labeled peptide nucleic acid (Fc-PNA) were able to help quantitatively determine the amount of target DNA. Xuan et al. [90] exploited strand displacement reaction to amplify the target DNA by using ferrocene-labeled peptide nucleic acid (Fc-PNA), which had higher diffusivity with negatively charged working electrode than Fc-PNA combining with a complementary DNA. The Fc-PNA had a structure Fc-O-AACCACCACCA-NH2, where Fc and O were denoted as a ferrocene moiety and an ethylene glycol linker, respectively. Figure 27 illustrates the mechanism of how the signal was generated and amplified.
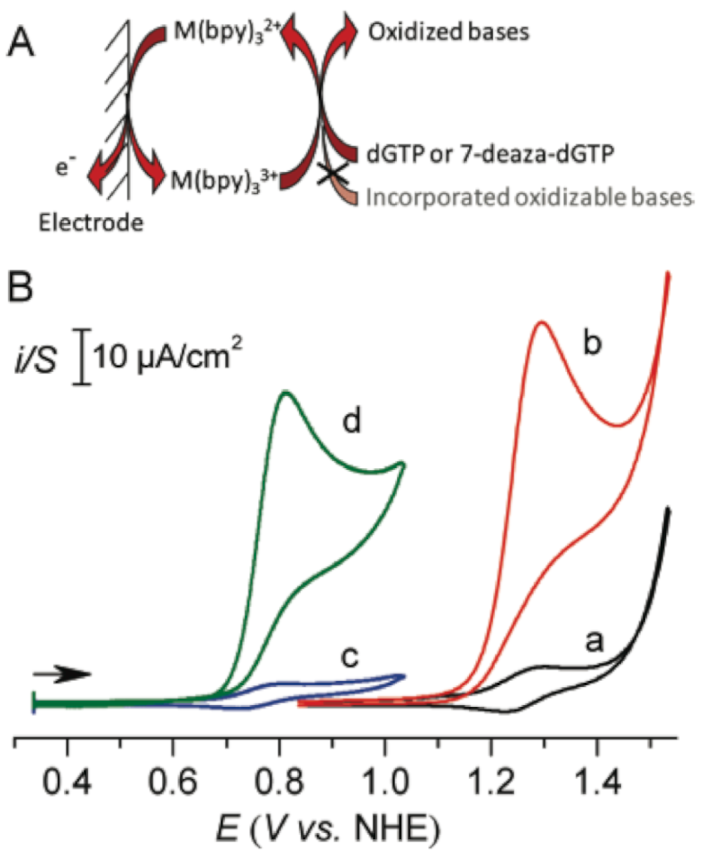
Benoit Limoges and Damien Marchal reported real-time electrochemical monitoring of polymerase chain reaction by using mediated redox catalyst. As a proof-of-principle report, Deféver et al. [91] used M(bpy(with M = Ru or Os) as selective redox catalyst, investigating by cyclic voltammetry monitoring the amplified DNA product generated in the PCR reaction solution after each PCR cycle. Figure 28 shows the schematic of such demonstrations.
The target DNA was quantitatively determined by the catalytic peak current, which followed the equation:
With a mediator concentration higher than 5 μM and scan rate lower than 300 mV, it had a linear relationship between and within the range of 0.2–200 μM for detection limit at 0.1 µM.
Redox probe is another tool for quantitatively determining nucleic acid, Kivlehan, Francine, et al. [92] developed selected redox probe, the (with bpy = 2,2′-bipyridine and DPPZ=dipyrido [3,2-] phenazine) to intercalate with amplified double-stranded DNA (ds-DNA), which was less electrochemically detectable compared with that of its free counterpart.
Zhou, Jun, et al. [93] reported on the electrochemical immunoassays hybridization chain reaction (HCR) by using functionalized gold nanoparticles and two label-free hairpin probes (H1: 5-T T A A C C C A C G C C G A A T C C T A G A C T C A A A G T A G T C T A G G A T T C G G C G T G-3′; H2: 3′-G T T T C A T C A G A T C C T A A G C C G C A C A A T T G G G T G C G G C T T A G G A T C T G A-5′). The sandwiched immunocomplex was formed in the presence of target carcinoembryonic antigen [94] between primary mAb1 antibodies on the electrode and pAb2 antibodies on the AuNPs, resulting in an increasingly large ratio of S0 and CEA analyte. Hairpin underwent an unbiased strand-displacement interaction to be open. Thus, the S0 initiator stood in pair with the sticky end of H1. The sticky end of H1 nucleates with the same region of H2, which was the sticky end, ending in an identical sequence to the initiator strands. In this way, a nicked double-helix was formed by propagating chain reaction by using initiator strand for H1 and H2 alternation. This method was also based on the methylene blue (MB) intercalating with double-helix DNA polymers into their grooves. However, the output was relied on the electrochemical signal with applied potentials of each intercalated indicator, thus leading to an amplified signal.
With modified iridium oxide as solid-state pH electrode, Tabata M.et al. [95] published a conference reporting local pH change of isothermal amplification with modification of IrOx deposited onto Pt wire versus IrOx thermally coated onto Ir wire. The results showed that the IrOx/Pt gave a better response compared with IrOx/Ir for different initial concentration of primer concentration.
Not only could electrochemical methods be a route for ssDNA detection [96], but the optical method could be another method for solving such kind of topic. Zhao Q. et al. [97] developed iridium-ssDNA probe for fluorescence turn-on and GO(graphene)-Ir-ssDNA turn-off mechanism, which might provide a robust and promising approach for biomolecules detection.
To the best of our knowledge, there are only a few researchers explored biological targets or chemicals by using the open circuit potential method [98,99]. Monitoring open circuit potential could be an alternative for the quantification of DNA. Iridium oxides rely on the potential change with real-time detection of proton release in nucleic acid amplification. In our opinion, this could be one future research direction in this field [100].
Quantitatively determining nucleic acid by using iridium oxide as initial material is still limited during the previous reports. In addition, Toumazou, Christofer, et al. [101] reported that Ion-selective FET could relate the potential with the amount of amplified DNA by their equation and calculation; iridium oxide could be another hot topic for such detection in the following years.
4. Conclusions and the Future Trends of Iridium Oxides-Based Sensors
4.1. Future Trends and Developments in the Biosensors for Iridium Oxide-Based Materials
During the past 25 years, various fabrication methods to iridium oxide such as hydraulic (Super-Nernstian Constant), thermally manufactured (Reach Nernstian Constant), sputter-coated and different kinds of electrodeposition methods have been investigated. We believe that how to apply such different methodologies to detect various chemicals would continuously be the hot research topic. Researchers have focused on different methods to reach a lower detection limit. Some other groups worked on combining microfluidic techniques to achieve a lower injection volume level in pursuing a lower volume for medical-related testing. Some groups tried making different kinds of structures of iridium oxide to improve sensing sensitivity. It is widely acknowledged and concerned that human health issues and more real-field applications would gradually increase the attention. Later iridium oxide-based pH sensors could mix with material science to produce a much more oriented structure that benefits measuring the pH changing during DNA amplification.
The iridium oxide involved chemical sensors and biological sensors had greatly relied on the proton exchange in the liquid phase to measure the open circuit potential changes, enabling the super-Nernst constant in the mostly hydrated forms of iridium oxide and close to theoretical Nernst constant in the dehydrated forms of iridium oxide nanostructures or microstructures. The reactions that releasing the protons were one of the most important perspectives to design such type of sensors. Therefore, the future research involved in using the iridium oxide nanostructures may employ such a property. By measuring the open circuit potential, the relationship between pH and the open circuit potential can be realized. Thus, it enables the quantification of the released protons and the concentration of the starting reactants per the stoichiometry of reactions.
4.2. Future Trends and Developments in Gas Sensors for Iridium Oxide-Based Materials
On the other hand, the iridium oxide involved gas sensors will keep on the focus of chemoresistant-type gas sensors, but other methods are to be introduced for better identification of the gas mixtures and quantification, such as the surface-acoustic-wave type of sensors [102,103,104] and the capacitive-type of gas sensors [105,106]. Considering the fact that iridium oxide-based gas sensors operate at elevated temperature, the future researchers may try to explore alternative methods to tackle this problem. In general, there are two major directions that can be further explored. One is to develop composite materials [107] that combine with iridium oxide for low-temperature working conditions. Another is to develop a laser that can locally heat the sensing element so that the whole device can still work at room temperature [108], whereas the locally elevated temperature can enable the iridium oxide for its sensing characteristics.
For the gas identification in the gas mixture, the gas-sensing array is of utmost importance to develop for differentiating and quantifying each gas component. The current gas sensing is majorly explored in the chemoresistant-type of electrochemical sensors, whereas the new methods are in need to develop for tackling such obstacles. The recent reported method relied on converting the electrochemical signals into the imaging-assisted Trellis plot, resulting in a new perspective method that integrates the image processing and pattern recognition [86]. From our own opinion, this direction could further extensively study in the coming years as it combined different disciplines and integrate the cutting-edge technologies of image processing with the gas sensing applications.
Author Contributions
Conceptualization, Q.D. and S.H.; writing—original draft preparation, Q.D.; writing—review and editing, X.S. and S.H.; visualization, X.S.; supervision, Q.D.; project administration, Q.D., S.H.; funding acquisition, S.H. All authors have read and agreed to the published version of the manuscript.
Funding
This work was partially supported by National Science Foundation (NSF) of Jiangsu Province of China (BK20191172), Project of Gusu Medical Key Talent of Suzhou City of China (GSWS2020005; SH) and Project of New Pharmaceutics and Medical Apparatuses of Suzhou City of China (SLJ2021007; SH).
Data Availability Statement
There is no new data reported in this review paper.
Conflicts of Interest
The authors declare no conflict of interest. The funders had no role in the design of the study; in the collection, analyses or interpretation of data; in the writing of the manuscript or in the decision to publish the results.
References
- Yamanaka, K. Anodically Electrodeposited Iridium Oxide Films (AEIROF) from Alkaline Solutions for Electrochromic Display Devices. Jpn. J. Appl. Phys. 1989, 28, 632–637. [Google Scholar] [CrossRef]
- Terashima, C.; Rao, T.N.; Sarada, B.V.; Spataru, N.; Fujishima, A. Electrodeposition of hydrous iridium oxide on conductive diamond electrodes for catalytic sensor applications. J. Electroanal. Chem. 2003, 544, 65–74. [Google Scholar] [CrossRef]
- Kinoshita, K.; Madou, M. Electrochemical measurements on Pt, Ir, and Ti oxides as pH probes. J. Electrochem. Soc. 1984, 131, 1089–1094. [Google Scholar] [CrossRef]
- Ardizzone, S.; Carugati, A.; Trasatti, S. Properties of thermally prepared iridium dioxide electrodes. J. Electroanal. Chem. Interfac. Electrochem. 1981, 126, 287–292. [Google Scholar] [CrossRef]
- Chalamala, B.R.; Wei, Y.; Reuss, R.H.; Aggarwal, S.; Gnade, B.E.; Ramesh, R.; Bernhard, J.M.; Sosa, E.D.; Golden, D.E. Effect of growth conditions on surface morphology and photoelectric work function characteristics of iridium oxide thin films. Appl. Phys. Lett. 1999, 74, 1394–1396. [Google Scholar] [CrossRef]
- Kinlen, P.J.; Heider, J.E.; Hubbard, D.E. A solid-state pH sensor based on a Nafion-coated iridium oxide indicator electrode and a polymer-based silver chloride reference electrode. Sens. Actuators B Chem. 1994, 22, 13–25. [Google Scholar] [CrossRef]
- Klein, J.D.; Clauson, S.L.; Cogan, S.F. Morphology and charge capacity of sputtered iridium oxide films. J. Vac. Sci. Technol. A 1989, 7, 3043–3047. [Google Scholar] [CrossRef]
- Kreider, K. IrO2 radio frequency sputtered thin film properties. J. Vac. Sci. Technol. A 1986, 4, 606–607. [Google Scholar] [CrossRef]
- Sato, Y. Electrochromis in Thermally Oxidized Iridium Oxide Films in LiClO4/Propylene Carbonate. Jpn. J. Appl. Phys. 1989, 28, 1290–1291. [Google Scholar] [CrossRef]
- Yao, S.; Wang, M.; Madou, M. A pH Electrode Based on Melt-Oxidized Iridium Oxide. J. Electrochem. Soc. 2001, 148, H29–H36. [Google Scholar] [CrossRef]
- Yagi, M.; Tomita, E.; Kuwabara, T. Remarkably high activity of electrodeposited IrO2 film for electrocatalytic water oxidation. J. Electroanal. Chem. 2005, 579, 83–88. [Google Scholar] [CrossRef]
- Jhas, A.S.; Elzanowska, H.; Sebastian, B.; Birss, V. Dual oxygen and Ir oxide regeneration of glucose oxidase in nanostructured thin film glucose sensors. Electrochim. Acta 2010, 55, 7683–7689. [Google Scholar] [CrossRef]
- Campbell, H.; Elzanowska, H.; Birss, V. Towards a reliable and high sensitivity O2-independent glucose sensor based on Ir oxidenanoparticles. Biosens. Bioelectron. 2013, 42, 563–569. [Google Scholar] [CrossRef]
- Kotzian, P.; Brázdilová, P.; Kalcher, K.; Handlíř, K.; Vytřas, K. Oxides of platinum metal group as potential catalysts in car-bonaceous amperometric biosensors based on oxidases. Sens. Actuators B Chem. 2007, 124, 297–302. [Google Scholar] [CrossRef]
- Yamaguchi, S.; Morimoto, K.; Fukuda, J.; Suzuki, H. Electrowetting-based pH- and biomolecule-responsive valves and pH filters. Biosens. Bioelectron. 2009, 24, 2171–2176. [Google Scholar] [CrossRef] [PubMed]
- Abu Irhayem, E.; Elzanowska, H.; Jhas, A.S.; Skrzynecka, B.; Birss, V. Glucose detection based on electrochemically formed Ir oxide films. J. Electroanal. Chem. 2002, 538-539, 153–164. [Google Scholar] [CrossRef]
- Wipf, D.O.; Ge, F.; Spaine, T.W.; Baur, J.E. Microscopic Measurement of pH with Iridium Oxide Microelectrodes. Anal. Chem. 2000, 72, 4921–4927. [Google Scholar] [CrossRef] [PubMed]
- KiláKang, S.; AuckáChoi, C.; ShináKim, Y.; TaeáKim, Y. An iridium oxide reference electrode for use in microfabricated biosensors and biochips. Lab Chip 2004, 4, 42–46. [Google Scholar]
- Marzouk, S.A.; Ufer, S.; Buck, R.P.; Johnson, T.A.; Dunlap, L.A.; Cascio, W.E. Electrodeposited iridium oxide pH electrode for meas-urement of extracellular myocardial acidosis during acute ischemia. Anal. Chem. 1998, 70, 5054–5061. [Google Scholar] [CrossRef]
- Hsu, Y.-W.; Hsu, T.-K.; Sun, C.-L.; Nien, Y.-T.; Pu, N.-W.; Ger, M.-D. Synthesis of CuO/graphene nanocomposites for nonenzymatic electrochemical glucose biosensor applications. Electrochim. Acta 2012, 82, 152–157. [Google Scholar] [CrossRef]
- Li, C.; Ahn, C.H.; Shutter, L.; Narayan, R.K. Toward real-time continuous brain glucose and oxygen monitoring with a smart catheter. Biosens. Bioelectron. 2009, 25, 173–178. [Google Scholar] [CrossRef]
- Li, C.; Limnuson, K.; Wu, Z.; Amin, A.; Narayan, A.; Golanov, E.; Ahn, C.H.; Hartings, J.; Narayan, R.K. Single probe for real-time simultaneous monitoring of neurochemistry and direct-current electrocorticography. Biosens. Bioelectron. 2016, 77, 62–68. [Google Scholar] [CrossRef] [Green Version]
- Ribet, F.; Stemme, G.; Roxhed, N. Ultra-miniaturization of a planar amperometric sensor targeting continuous intradermal glucose monitoring. Biosens. Bioelectron. 2017, 90, 577–583. [Google Scholar] [CrossRef] [PubMed]
- Bard, A.J.; Faulkner, L.R. Fundamentals and applications. Electrochem. Methods 2001, 2, 580–632. [Google Scholar]
- Dong, Q.; Song, D.; Huang, Y.; Xu, Z.; Chapman, J.H.; Willis, W.S.; Li, B.; Lei, Y. High-temperature annealing enabled iridium oxide nanofibers for both non-enzymatic glucose and solid-state pH sensing. Electrochim. Acta 2018, 281, 117–126. [Google Scholar] [CrossRef]
- Dong, Q.; Wang, X.; Liu, H.; Ryu, H.; Zhao, J.; Li, B.; Lei, Y. Heterogeneous Iridium Oxide/Gold Nanocluster for Non-enzymatic Glucose Sensing and pH Probing. Eng. Sci. 2019, 8, 46–53. [Google Scholar] [CrossRef]
- Morimitsu, M.; Okazaki, A. A Novel Electrode Material for H2O2 Oxidation of Electrochemical Glucose Sensors. ECS Meet. Abstr. 2009, 19, 6. [Google Scholar] [CrossRef]
- Ha, Y.; Jung, H.; Lee, C.; Kim, M.H.; Lee, Y. Alteration of the morphology and electrocatalytic activity of IrO2 nanowires upon reduction by hydrogen gas. Sens. Actuators B Chem. 2015, 216, 159–164. [Google Scholar] [CrossRef]
- Smiechowski, M.F.; Lvovich, V.F. Iridium oxide sensors for acidity and basicity detection in industrial lubricants. Sens. Actuators B Chem. 2003, 96, 261–267. [Google Scholar] [CrossRef]
- Tarlov, M.; Semancik, S.; Kreider, K. Mechanistic and response studies of iridium oxide pH sensors. Sens. Actuators B Chem. 1990, 1, 293–297. [Google Scholar] [CrossRef]
- Kakooei, S.; Ismail, M.C.; Ari-Wahjoedi, B. An overview of pH sensors based on iridium oxide: Fabrication and application. Int. J. Mater Sci. Innovat. 2013, 1, 62–72. [Google Scholar]
- Elsen, H.A.; Monson, C.F.; Majda, M. Effects of Electrodeposition Conditions and Protocol on the Properties of Iridium Oxide pH Sensor Electrodes. J. Electrochem. Soc. 2009, 156, F1–F6. [Google Scholar] [CrossRef] [Green Version]
- Rouhi, J.; Kakooei, S.; Ismail, M.C.; Karimzadeh, R.; Mahmood, M.R. Development of iridium oxide sensor for surface pH meas-urement of a corroding metal under deposit. Int. J. Electrochem. Sci. 2017, 12, 9933–9943. [Google Scholar] [CrossRef]
- Jovic, M.; Hidalgo-Acosta, J.C.; Lesch, A.; Bassetto, V.C.; Smirnov, E.; Cortés-Salazar, F.; Girault, H.H. Large-scale layer-by-layer inkjet printing of flexible iridium-oxide based pH sensors. J. Electroanal. Chem. 2018, 819, 384–390. [Google Scholar] [CrossRef]
- Izutsu, K.; Yamamoto, H. Response of an iridium oxide pH-sensor in nonaqueous solutions. Comparison with other pH-sensors. Anal. Sci. 1996, 12, 905–909. [Google Scholar] [CrossRef] [Green Version]
- Zhu, Z.; Liu, X.; Ye, Z.; Zhang, J.; Cao, F.; Zhang, J. A fabrication of iridium oxide film pH micro-sensor on Pt ultramicroelectrode and its application on in-situ pH distribution of 316L stainless steel corrosion at open circuit potential. Sens. Actuators B Chem. 2018, 255, 1974–1982. [Google Scholar] [CrossRef]
- Hitchman, M.L.; Ramanathan, S. Evaluation of iridium oxide electrodes formed by potential cycling as pH probes. Analyst 1988, 113, 35–39. [Google Scholar] [CrossRef]
- Nguyen, C.M.; Rao, S.; Seo, Y.-S.; Schadt, K.; Hao, Y.; Chiao, J.-C. Micro pH Sensors Based on Iridium Oxide Nanotubes. IEEE Trans. Nanotechnol. 2014, 13, 945–953. [Google Scholar] [CrossRef]
- Yang, J.; Kwak, T.J.; Zhang, X.; McClain, R.; Chang, W.-J.; Gunasekaran, S. Digital pH Test Strips for In-Field pH Monitoring Using Iridium Oxide-Reduced Graphene Oxide Hybrid Thin Films. ACS Sens. 2016, 1, 1235–1243. [Google Scholar] [CrossRef]
- Khalil, M.; Wang, S.; Yu, J.; Lee, R.L.; Liu, N. Electrodeposition of Iridium Oxide Nanoparticles for pH Sensing Electrodes. J. Electrochem. Soc. 2016, 163, B485–B490. [Google Scholar] [CrossRef]
- Huang, X.-R.; Ren, Q.-Q.; Yuan, X.-J.; Wen, W.; Chen, W.; Zhan, D.-P. Iridium oxide based coaxial pH ultramicroelectrode. Electro Chem. Commun. 2014, 40, 35–37. [Google Scholar] [CrossRef]
- Madeira, G.D.M.; Mello, H.J.N.P.D.; Faleiros, M.C.; Mulato, M. Model improvement for super-Nernstian pH sensors: The effect of surface hydration. J. Mater. Sci. 2020, 56, 2738–2747. [Google Scholar] [CrossRef]
- Booth, M.A.; Gowers, S.A.N.; Hersey, M.; Samper, I.C.; Park, S.; Anikeeva, P.; Hashemi, P.; Stevens, M.M.; Boutelle, M.G. Fiber-Based Electrochemical Biosensors for Monitoring pH and Transient Neurometabolic Lactate. Anal. Chem. 2021, 93, 6646–6655. [Google Scholar] [CrossRef]
- Ges, I.; Baudenbacher, F. Microfluidic device to confine single cardiac myocytes in sub-nanoliter volumes for extracellular pH measurements. J. Exp. Nanosci. 2008, 3, 63–75. [Google Scholar] [CrossRef]
- Ges, I.A.; Ivanov, B.L.; Werdich, A.A.; Baudenbacher, F.J. Differential pH measurements of metabolic cellular activity in nl culture volumes using microfabricated iridium oxide electrodes. Biosens. Bioelectron. 2007, 22, 1303–1310. [Google Scholar] [CrossRef]
- Ges, I.A.; Ivanov, B.L.; Schaffer, D.K.; Lima, E.A.; Werdich, A.A.; Baudenbacher, F.J. Thin-film IrO x pH microelectrode for microflu-idic-based microsystems. Biosens. Bioelectron. 2005, 21, 248–256. [Google Scholar] [CrossRef]
- Carroll, S.; Baldwin, R.P. Self-Calibrating Microfabricated Iridium Oxide pH Electrode Array for Remote Monitoring. Anal. Chem. 2010, 82, 878–885. [Google Scholar] [CrossRef]
- Lin, Z.C.; Xie, C.; Osakada, Y.; Cui, Y.; Cui, B. Iridium oxide nanotube electrodes for sensitive and prolonged intracellular meas-urement of action potentials. Nat. Commun. 2014, 5, 1. [Google Scholar] [CrossRef] [PubMed]
- Nguyen, C.M.; Gurung, I.; Cao, H.; Rao, S.; Chiao, J.-C. Fabrication of pH-sensing iridium oxide nanotubes on patterned electrodes using anodic aluminum oxide nanotemplate. In Proceedings of the SENSORS, 2013 IEEE, Baltimore, MD, USA, 3–6 November 2013; pp. 1–4. [Google Scholar]
- Comstock, D.J.; Christensen, S.T.; Elam, J.W.; Pellin, M.J.; Hersam, M.C. Synthesis of nanoporous activated iridium oxide films by anodized aluminum oxide templated atomic layer deposition. Electrochem. Commun. 2010, 12, 1543–1546. [Google Scholar] [CrossRef]
- Lu, Y.; Wang, T.; Cai, Z.; Cao, Y.; Yang, H.; Duan, Y.Y. Anodically electrodeposited iridium oxide films microelectrodes for neural microstimulation and recording. Sens. Actuators B Chem. 2009, 137, 334–339. [Google Scholar] [CrossRef]
- Jung, Y.; Lee, J.; Tak, Y. Electrochromic mechanism of IrO2 prepared by pulsed anodic electrodeposition. Electrochem. Solid State Lett. 2004, 7, H5–H8. [Google Scholar] [CrossRef]
- Nguyen, C.M.; Rao, S.; Yang, X.; Dubey, S.; Mays, J.; Cao, H.; Chiao, J.-C. Sol-Gel Deposition of Iridium Oxide for Biomedical Micro-Devices. Sensors 2015, 15, 4212–4228. [Google Scholar] [CrossRef] [Green Version]
- Wang, J.; Yokokawa, M.; Satake, T.; Suzuki, H. A micro IrO x potentiometric sensor for direct determination of organophosphate pesticides. Sens. Actuators B Chem. 2015, 220, 859–863. [Google Scholar] [CrossRef]
- Bezbaruah, A.N.; Zhang, T.C. Fabrication of anodically electrodeposited iridium oxide film pH microelectrodes for microenvi-ronmental studies. Anal. Chem. 2002, 74, 5726–5733. [Google Scholar] [CrossRef] [PubMed]
- Park, J.; Jeong, Y.; Kim, J.; Gu, J.; Wang, J.; Park, I. Biopsy needle integrated with multi-modal physical/chemical sensor array. Biosens. Bioelectron. 2019, 148, 111822. [Google Scholar] [CrossRef] [PubMed]
- Franklin, R.K.; Johnson, M.D.; Scottt, K.A.; Shim, J.H.; Nam, H.; Kipket, D.R.; Brown, R.B. Iridium oxide reference electrodes for neu-rochemical sensing with MEMS microelectrode arrays. In Proceedings of the SENSORS, 2005 IEEE, Irvine, CA, USA, 30 October–3 November 2005. [Google Scholar]
- Manjakkal, L.; Cvejin, K.; Kulawik, J.; Zaraska, K.; Szwagierczak, D. A Low-Cost pH Sensor Based on RuO2 Resistor Material. Nano Hybrids 2013, 5, 1–15. [Google Scholar] [CrossRef] [Green Version]
- Da Silva, G.; Lemos, S.; Pocrifka, L.; Marreto, P.; Rosario, A.; Pereira, E. Development of low-cost metal oxide pH electrodes based on the polymeric precursor method. Anal. Chim. Acta 2008, 616, 36–41. [Google Scholar] [CrossRef] [PubMed]
- Mazzaracchio, V.; Fiore, L.; Nappi, S.; Marrocco, G.; Arduini, F. Medium-distance affordable, flexible and wireless epidermal sensor for pH monitoring in sweat. Talanta 2020, 222, 121502. [Google Scholar] [CrossRef]
- Hendrikse, J.; Olthuis, W.; Bergveld, P. A drift free nernstian iridium oxide pH sensor. In Proceedings of the International Solid State Sensors and Actuators Conference (Transducers’ 97), Chicago, IL, USA, 19 June 1997. [Google Scholar]
- Wang, M.; Yao, S.; Madou, M. A long-term stable iridium oxide pH electrode. Sens. Actuators B Chem. 2002, 81, 313–315. [Google Scholar] [CrossRef]
- Ratanaporncharoen, C.; Tabata, M.; Watanagool, N.; Goda, T.; Matsumoto, A.; Sriyudthsak, M.; Miyahara, Y. Characterization and opti-mization of thermally grown iridium oxide and its application to pH sensors. Sens. Mater. 2018, 30, 1175–1185. [Google Scholar]
- Mingels, R.; Kalsi, S.; Cheong, Y.; Morgan, H. Iridium and Ruthenium oxide miniature pH sensors: Long-term performance. Sens. Actuators B Chem. 2019, 297, 126779. [Google Scholar] [CrossRef]
- Marsh, P.; Manjakkal, L.; Yang, X.; Huerta, M.; Le, T.; Thiel, L.; Chiao, J.C.; Cao, H.; Dahiya, R. Flexible iridium oxide based pH sensor integrated with inductively coupled wireless transmission system for wearable applications. IEEE Sens. J. 2020, 20, 5130–5138. [Google Scholar] [CrossRef] [Green Version]
- Tolosa, V.M.; Wassum, K.M.; Maidment, N.T.; Monbouquette, H.G. Electrochemically deposited iridium oxide reference electrode integrated with an electroenzymatic glutamate sensor on a multi-electrode arraymicroprobe. Biosens. Bioelectron. 2013, 42, 256–260. [Google Scholar] [CrossRef] [PubMed]
- Wilson, M.S.; Rauh, R. Novel amperometric immunosensors based on iridium oxide matrices. Biosens. Bioelectron. 2004, 19, 693–699. [Google Scholar] [CrossRef]
- Badawy, M.E.; El-Aswad, A.F. Bioactive paper sensor based on the acetylcholinesterase for the rapid detection of organophos-phate and carbamate pesticides. Int. J. Anal. Chem. 2014, 2014, 536823. [Google Scholar] [CrossRef] [PubMed] [Green Version]
- Capoferri, D.; Álvarez-Diduk, R.; Del Carlo, M.; Compagnone, D.; Merkoçi, A. Electrochromic molecular imprinting sensor for visual and smartphone-based detections. Anal. Chem. 2018, 90, 5850–5856. [Google Scholar] [CrossRef] [PubMed] [Green Version]
- vel Krawczyk, T.K.; Moszczyńska, M.; Trojanowicz, M. Inhibitive determination of mercury and other metal ions by potenti-ometric urea biosensor. Biosens. Bioelectron. 2000, 15, 681–691. [Google Scholar] [CrossRef]
- Greenan, N.; Mulvaney, R.; Sims, G.K. A microscale method for colorimetric determination of urea in soil extracts. Commun. Soil Sci. Plant Anal. 1995, 26, 2519–2529. [Google Scholar] [CrossRef] [Green Version]
- Baumgartner, M.; Flöck, M.; Winter, P.; Al, E. Evaluation of flow injection analysis for determination of urea in sheep’s and cow’s milk. Acta Vet. Hung. 2002, 50, 263–271. [Google Scholar] [CrossRef]
- Francis, P.; Lewis, S.W.; Lim, K. Analytical methodology for the determination of urea: Current practice and future trends. TrAC Trends Anal. Chem. 2002, 21, 389–400. [Google Scholar] [CrossRef]
- Alfonso, E.P.; Abad, L.; Casan-Pastor, N.; Gonzalo-Ruiz, J.; Baldrich, E. Iridium oxide pH sensor for biomedical applications. Case urea–urease in real urine samples. Biosens. Bioelectron. 2013, 39, 163–169. [Google Scholar] [CrossRef]
- Venkatraman, V.L.; Reddy, R.K.; Zhang, F.; Evans, D.; Ulrich, B.; Prasad, S. Iridium oxide nanomonitors: Clinical diagnostic devices for health monitoring systems. Biosens. Bioelectron. 2009, 24, 3078–3083. [Google Scholar] [CrossRef]
- Zhang, F.; Ulrich, B.; Reddy, R.K.; Venkatraman, V.L.; Prasad, S.; Vu, T.Q.; Hsu, S.-T. Fabrication of Submicron IrO2Nanowire Array Biosensor Platform by Conventional Complementary Metal–Oxide–Semiconductor Process. Jpn. J. Appl. Phys. 2008, 47, 1147–1151. [Google Scholar] [CrossRef]
- Pikulski, M.; Gorski, W. Iridium-based electrocatalytic systems for the determination of insulin. Anal. Chem. 2000, 72, 2696–2702. [Google Scholar] [CrossRef]
- Salimi, A.; Hallaj, R.; Kavosi, B.; Hagighi, B. Highly sensitive and selective amperometric sensors for nanomolar detection of iodate and periodate based on glassy carbon electrode modified with iridium oxide nanoparticles. Anal. Chim. Acta 2010, 661, 28–34. [Google Scholar] [CrossRef]
- Salimi, A.; Hyde, M.E.; Banks, C.; Compton, R.G. Boron doped diamond electrode modified with iridium oxide for amperometic detection of ultra trace amounts of arsenic(iii). Analyst 2003, 129, 9–14. [Google Scholar] [CrossRef]
- Roberts, D.C.; Osborn, J.A.; Yacynych, A.M. Proteolytic enzyme modified metal oxide electrodes as potentiometric sensors. Anal. Chem. 1986, 58, 140–144. [Google Scholar] [CrossRef]
- Avila-García, A.; Chaudhary, A.; Rojas-Chávez, H. Iridium oxide films as propane sensors. Thin Solid Films 2021, 724, 138617. [Google Scholar] [CrossRef]
- Hullavarad, N.V.; Hullavarad, S.S. Direct-Vapor-Phase Grown IrO2 Micronanostructures for Ethanol, Acetone, and Propanol Gas Sensor. IEEE Trans. Nanotechnol. 2010, 9, 625–629. [Google Scholar] [CrossRef]
- Wang, J.; Gao, S.; Zhang, C.; Zhang, Q.; Li, Z.; Zhang, S. A high throughput platform screening of ppb-level sensitive materials for hazardous gases. Sens. Actuators B Chem. 2018, 276, 189–203. [Google Scholar] [CrossRef]
- Navarrete, E.; Bittencourt, C.; Umek, P.; Cossement, D.; Güell, F.; Llobet, E. Tungsten trioxide nanowires decorated with iridium oxide nanoparticles as gas sensing material. J. Alloy. Compd. 2019, 812, 152156. [Google Scholar] [CrossRef]
- Casanova-Cháfer, J.; Navarrete, E.; Noirfalise, X.; Umek, P.; Bittencourt, C.; Llobet, E. Gas Sensing with Iridium Oxide Nanoparticle Decorated Carbon Nanotubes. Sensors 2018, 19, 113. [Google Scholar] [CrossRef] [Green Version]
- Koplin, T.J.; Siemons, M.; Océn-Valéntin, C.; Sanders, D.; Simon, U. Workflow for high throughput screening of gas sensing mate-rials. Sensors 2006, 6, 298–307. [Google Scholar] [CrossRef] [Green Version]
- Hsieh, K.; Patterson, A.S.; Ferguson, B.S.; Plaxco, K.W.; Soh, H.T. Rapid, Sensitive, and Quantitative Detection of Pathogenic DNA at the Point of Care through Microfluidic Electrochemical Quantitative Loop-Mediated Isothermal Amplification. Angew. Chem. 2012, 124, 4980–4984. [Google Scholar] [CrossRef]
- Zhu, Z.; Lei, J.; Liu, L.; Ju, H. Label-free electrochemical DNA sensing with a one-target-multitriggered hybridization chain reac-tion strategy. Analyst 2013, 138, 5995–6000. [Google Scholar] [CrossRef]
- Chen, Y.; Xu, J.; Su, J.; Xiang, Y.; Yuan, R.; Chai, Y. In situ hybridization chain reaction amplification for universal and highly sen-sitive electrochemiluminescent detection of DNA. Anal. Chem. 2012, 84, 7750–7755. [Google Scholar] [CrossRef]
- Xuan, F.; Luo, X.; Hsing, I.-M. Sensitive immobilization-free electrochemical DNA sensor based on isothermal circular strand displacement polymerization reaction. Biosens. Bioelectron. 2012, 35, 230–234. [Google Scholar] [CrossRef]
- Deféver, T.; Druet, M.; Rochelet-Dequaire, M.; Joannes, M.; Grossiord, C.; Limoges, B.; Marchal, D. Real-Time Electrochemical Monitoring of the Polymerase Chain Reaction by Mediated Redox Catalysis. J. Am. Chem. Soc. 2009, 131, 11433–11441. [Google Scholar] [CrossRef] [PubMed]
- Kivlehan, F.; Mavré, F.; Talini, L.; Limoges, B.; Marchal, D. Real-time electrochemical monitoring of isothermal helicase-dependent amplification of nucleic acids. Analyst 2011, 136, 3635–3642. [Google Scholar] [CrossRef] [PubMed]
- Zhou, J.; Xu, M.; Tang, D.; Gao, Z.; Tang, J.; Chen, G. Nanogold-based bio-bar codes for label-free immunosensing of proteins cou-pling with an in situ DNA-based hybridization chain reaction. Chem. Commun. 2012, 48, 12207–12209. [Google Scholar] [CrossRef] [PubMed]
- Campbell, M.G.; Sheberla, D.; Liu, S.F.; Swager, T.M.; Dincă, M. Cu3(hexaiminotriphenylene)2: An Electrically Conductive 2D Metal-Organic Framework for Chemiresistive Sensing. Angew. Chem. Int. Ed. 2015, 54, 4349–4352. [Google Scholar] [CrossRef]
- Tabata, M.; Katayama, Y.; Mannan, F.; Seichi, A.; Suzuki, K.; Goda, T.; Matsumoto, A.; Miyahara, Y. Label-free and Electrochemical Detection of Nucleic Acids Based on Isothermal Amplification in Combination with Solid-state pH Sensor. Procedia Eng. 2016, 168, 419–422. [Google Scholar] [CrossRef]
- Mayorga-Martinez, C.C.; Chamorro-García, A.; Serrano, L.; Rivas, L.; Quesada-Gonzalez, D.; Altet, L.; Francino, O.; Sánchez, A.; Merkoçi, A. An iridium oxide na-noparticle and polythionine thin film based platform for sensitive Leishmania DNA detection. J. Mater. Chem. B 2015, 3, 5166–5171. [Google Scholar] [CrossRef] [Green Version]
- Zhao, Q.; Zhou, Y.; Li, Y.; Gu, W.; Zhang, Q.; Liu, J. Luminescent Iridium(III) Complex Labeled DNA for Graphene Oxide-Based Biosensors. Anal. Chem. 2016, 88, 1892–1899. [Google Scholar] [CrossRef] [PubMed]
- Tabata, M.; Yang, H.; Mannan, F.; Katayama, Y.; Goda, T.; Matsumoto, A.; Seichi, A.; Suzuki, K.; Miyahara, Y. Electrochemical real-time monitoring of isothermal nucleic acid amplification for quantitative analysis. In Proceedings of the 2015 Transducers—2015 18th International Conference on Solid-State Sensors, Actuators and Microsystems (TRANSDUCERS), Anchorage, AK, USA, 21–25 June 2015; pp. 1553–1556. [Google Scholar] [CrossRef]
- Salm, E.; Zhong, Y.; Reddy, B., Jr.; Duarte-Guevara, C.; Swaminathan, V.; Liu, Y.S.; Bashir, R. Electrical detection of nucleic acid ampli-fication using an on-chip quasi-reference electrode and a PVC REFET. Anal. Chem. 2014, 86, 6968–6975. [Google Scholar] [CrossRef] [PubMed]
- Xu, Z.; Yin, K.; Ding, X.; Li, Z.; Sun, X.; Li, B.; Lalla, R.V.; Gross, R.; Liu, C. An integrated E-Tube cap for sample preparation, isothermal amplification and label-free electrochemical detection of DNA. Biosens. Bioelectron. 2021, 186, 113306. [Google Scholar] [CrossRef]
- Toumazou, C.; Shepherd, L.M.; Reed, S.C.; Chen, G.I.; Patel, A.; Garner, D.M.; Wang, C.J.A.; Ou, C.P.; Amin-Desai, K.; Athanasiou, P.; et al. Simultaneous DNA amplification and detection using a pH-sensing semiconductor system. Nat. Methods 2013, 10, 641–646. [Google Scholar] [CrossRef] [PubMed]
- Kim, B.-H.; Lee, Y.-J.; Lee, H.-J.; Hong, Y.; Yook, J.-G.; Chung, M.H.; Cho, W.; Choi, H.H. A gas sensor using double split-ring resonator coated with conducting polymer at microwave frequncies. In Proceedings of the SENSORS, 2014 IEEE, Valencia, Spain, 2–5 November 2014; pp. 1815–1818. [Google Scholar] [CrossRef]
- Hsu, Y.-C.; Le, N.-B. Coupling coefficient determination based on simulation and experiment for ST-Cut quartz saw delay-line response. Microsyst. Technol. 2007, 14, 615–622. [Google Scholar] [CrossRef]
- Zakaria, M.; Hashim, U.; Amin, M.M.; Adam, T.; Al-Mufti, M.W. Simulation of 1Ghz center frequency saw using cst software for biosensor application. Middle-East J. Sci. Res. 2013, 18, 1286–1291. [Google Scholar]
- Yuan, H.; Tao, J.; Li, N.; Karmakar, A.; Tang, C.; Cai, H.; Pennycook, S.J.; Singh, N.; Zhao, D. On-Chip Tailorability of Capacitive Gas Sensors Integrated with Metal–Organic Framework Films. Angew. Chem. Int. Ed. 2019, 58, 14089–14094. [Google Scholar] [CrossRef]
- Homayoonnia, S.; Zeinali, S. Design and fabrication of capacitive nanosensor based on MOF nanoparticles as sensing layer for VOCs detection. Sens. Actuators B Chem. 2016, 237, 776–786. [Google Scholar] [CrossRef]
- Chidambaram, A.; Stylianou, K.C. Electronic metal–organic framework sensors. Inorg. Chem. Front. 2018, 5, 979–998. [Google Scholar] [CrossRef]
- Pham, T.; Li, G.; Bekyarova, E.; Itkis, M.E.; Mulchandani, A. MoS2-Based Optoelectronic Gas Sensor with Sub-parts-per-billion Limit of NO2 Gas Detection. ACS Nano 2019, 13, 3196–3205. [Google Scholar] [CrossRef] [PubMed]
Figure 1.
Glucose chronoamperometric response in anaerobic and aerobic condition on IrOx/Nafion/GOx at 1.2 V. Inset shows the first glucose aliquot added into the solution. Reprinted with permission from reference [13]. Copyright 2010 Elsevier Ltd.
Figure 1.
Glucose chronoamperometric response in anaerobic and aerobic condition on IrOx/Nafion/GOx at 1.2 V. Inset shows the first glucose aliquot added into the solution. Reprinted with permission from reference [13]. Copyright 2010 Elsevier Ltd.
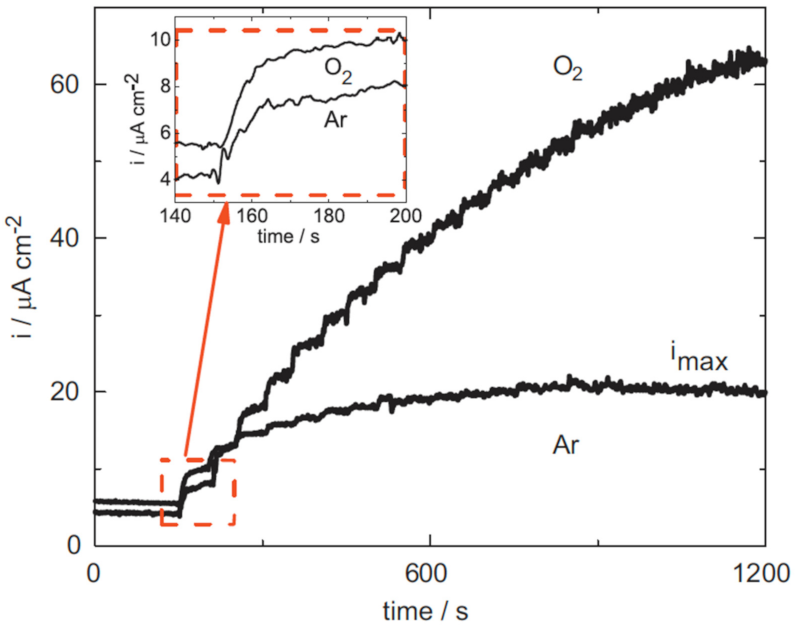
Figure 2.
pH-responsive valve. For the biomolecule-responsive valve, Ag/AgCl electrode was additionally formed in the injection port (dashed line). The inset on the upper right shows the valve area of the pH filter. W.E., working electrode; R.E. reference electrode; A.E. auxiliary electrode. Reprinted permission from reference [15]. Copyright 2008 Elsevier B.V.

Figure 3.
Schematic diagram showing the desired structures of IrOx/GOx in both Type A and Type B electrodes. Reprinted with permission from reference [16]. Copyright 2002 Elsevier Science B.V.
Figure 3.
Schematic diagram showing the desired structures of IrOx/GOx in both Type A and Type B electrodes. Reprinted with permission from reference [16]. Copyright 2002 Elsevier Science B.V.
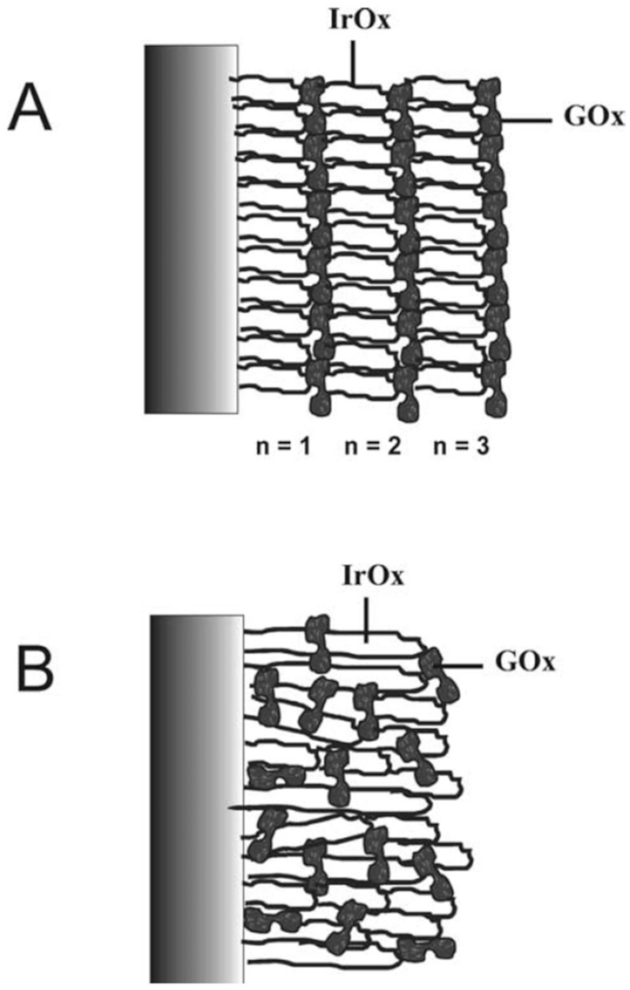
Figure 4.
A pH imaging of glucose oxidase immobilized onto a carbon microelectrode substrate (33 μm diameter). (A) Image obtained with FeCp2+ in solution and the substrate at open circuit. (B) Same as (A) but plotted on the same pH scale as (C) for comparison purposes. (C) Image obtained with the substrate biased at +0.6 V to regenerate FeCp2+ from FeCp2 produced by an enzymatic reaction. Reprinted with permission from reference [17]. Copyright 2000, American Chemical Society.

Figure 5.
SEM images with different magnifications of (a,b) IrO2 NW (c,d) Ir/IrO2 NW on an Au microwire. Reprinted with permission of reference [28]. Copyright 2015 Elsevier B.V.
Figure 5.
SEM images with different magnifications of (a,b) IrO2 NW (c,d) Ir/IrO2 NW on an Au microwire. Reprinted with permission of reference [28]. Copyright 2015 Elsevier B.V.

Figure 6.
Anodic amperometric responses of IrO2NW-Au (black) and Ir/IrO2NW-Au (red) to H2O2 concentration (from 0 to 1.0 mM) at 0.43 V (A) and cathodic amperometric at −0.03 V behavior of two sets (B). Insets show the corresponding calibration curves. Reprinted with permission of reference [28]. Copyright 2015 Elsevier B.V.

Figure 7.
(A) Kapton-based single planar electrodes. The edge was tapered to facilitate the electrode implantation in the myocardium. (B) The layer structure of the AEIROF-based planar pH electrode. Reprinted from the permission of reference [19]. Copyright 1998, American Chemical Society.
Figure 7.
(A) Kapton-based single planar electrodes. The edge was tapered to facilitate the electrode implantation in the myocardium. (B) The layer structure of the AEIROF-based planar pH electrode. Reprinted from the permission of reference [19]. Copyright 1998, American Chemical Society.

Figure 8.
(A) Schematic drawing of the cross-section of the as-prepared fiber. Two of six graphite carbon paste electrodes and two microfluidic channels were highlighted in yellow and red boxes. (B) The razor blade-sliced fiber surface under Scanning Electron Microscopy image. (C) Cyclic voltammetry of two bare electrode surface in the response of ferrocene monocarboxylate solution individually (dotted lines) and when connected together (thick black line). Reprinted with permission from reference [43]. (https://0-pubs-acs-org.brum.beds.ac.uk/doi/full/10.1021/acs.analchem.0c05108, accessed on 2 April 2021) Further permissions related to the material excerpted should be directed to the ACS. Copyright 2021, American Chemical Society.

Figure 9.
Schematic of 11 microelectrodes fabricated on the surface of Au electrode. Reprinted with permission from reference [47]. Copyright 2010 American Chemical Society.
Figure 9.
Schematic of 11 microelectrodes fabricated on the surface of Au electrode. Reprinted with permission from reference [47]. Copyright 2010 American Chemical Society.

Figure 10.
Schematic of the tip of an AEIROF microelectrode. The diagram is not to scale. Reprinted from the permission of reference [55]. Copyright 2002 American Chemical Society.
Figure 10.
Schematic of the tip of an AEIROF microelectrode. The diagram is not to scale. Reprinted from the permission of reference [55]. Copyright 2002 American Chemical Society.
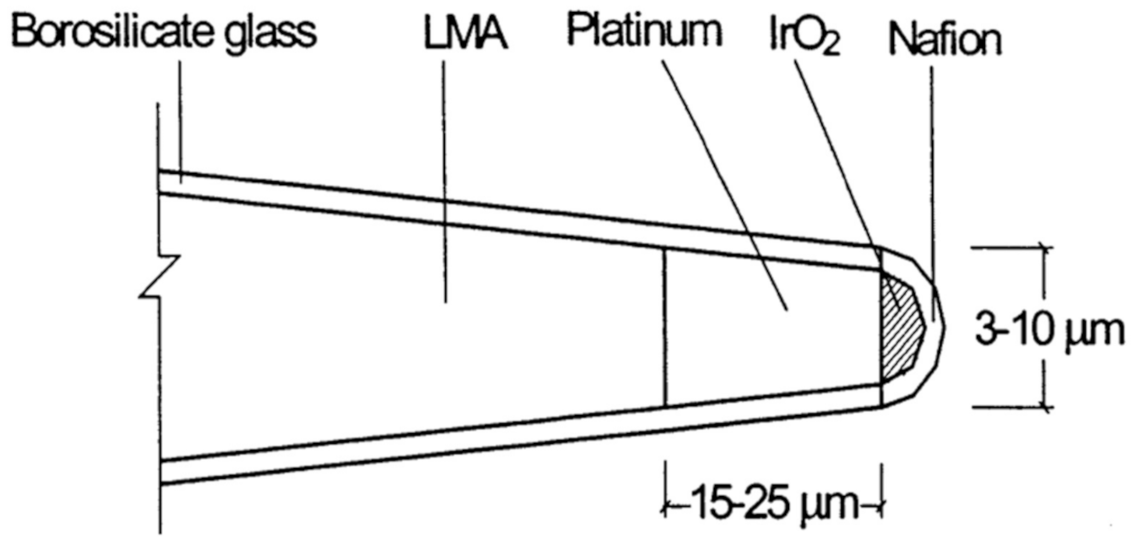
Figure 11.
(a) The measurements principles of the iridium oxide-based pH sensor. (b) Cyclic Voltammetry plot of the electrodeposition of iridium oxide with the precursor electrolyte. (c) the pH responses before and after electrochemical treatment. (d) the pH response of the constructed iridium oxide sensor. (e) the glucose sensor configuration. (f) the amperometric glucose sensing performance. (g) the linear range of the glucose measurement for three replicates. Reprinted with permission from reference [56]. Copyright 2019 Elsevier B.V.

Figure 12.
The schematic of fabrication configuration. Reprinted with the permission of reference [66]. Copyright 2012 Elsevier B.V.
Figure 12.
The schematic of fabrication configuration. Reprinted with the permission of reference [66]. Copyright 2012 Elsevier B.V.

Figure 13.
(A) Glutamate sensing using three electrodes. (B) Glutamate sensing using two electrodes. Reprinted with permission from reference [66]. Copyright 2012 Elsevier B.V.
Figure 13.
(A) Glutamate sensing using three electrodes. (B) Glutamate sensing using two electrodes. Reprinted with permission from reference [66]. Copyright 2012 Elsevier B.V.
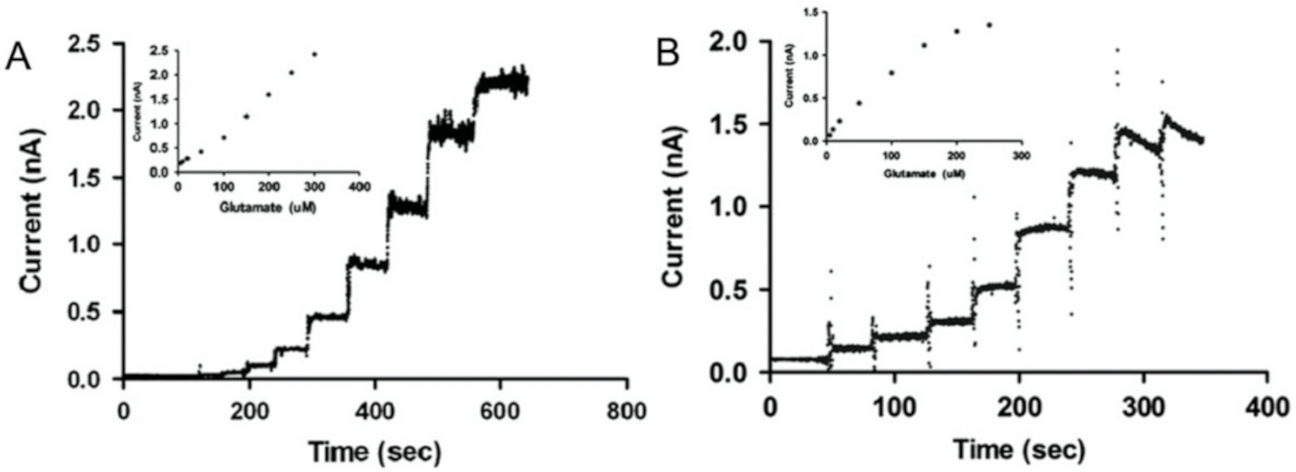
Figure 14.
The reaction scheme demonstrates the pesticides reaction triggers the dissociation of diethylphosphate. Reprint with permission from reference [68]. Copyright 2015 Elsevier B.V.
Figure 14.
The reaction scheme demonstrates the pesticides reaction triggers the dissociation of diethylphosphate. Reprint with permission from reference [68]. Copyright 2015 Elsevier B.V.

Figure 15.
Construction of the device. (A) Expanded view of the device. (B) Top view showing the mutual relationship between the structures of the layers. (C) Cross-section along the X-X’ line in A. (D) The device on a finger. Planar dimensions are 20 mm × 11 mm. Reprinted with permission from reference [54]. Copyright 2015 Elsevier B.V.

Figure 16.
Calibration plots for organophosphate pesticide (diazinon). Reprinted with permission of reference [54]. Copyright 2015 Elsevier B.V.
Figure 16.
Calibration plots for organophosphate pesticide (diazinon). Reprinted with permission of reference [54]. Copyright 2015 Elsevier B.V.

Figure 17.
Calibration curves for different forms of mercury obtained after 30 min of inhibition. Concentration of added urea, 1.0 mM; Hg(NO3)2 (square) HgCl2 (circle) Hg2(N03)2 (up-pint triangle) PhHgCl (Down-point triangle). Reprinted with permission from reference [70]. Copyright 2000 Elsevier Science S.A.

Figure 18.
Response of AEIROF pH sensor (a) Change in the open circuit potential of the AEROF electrode over time when exposed to pH between 4 and 10. (b) Results were obtained for the AEIROF in terms of pH and those of a commercial pH meter. The insert illustrates the measurement set-up. The AEIROF pH sensor and a commercial pH meter were simultaneously immersed in a sample solution, and their response was registered in parallel while the solution pH was modified by drop-wise addition of either NaOH or HCl under stirring. Reprinted with permission from reference [74]. Copyright 2012 Elsevier B.V.

Figure 19.
(a) Response with Different concentrations of urea (up to down 0.3, 0.6, 1.25, 2.5, 5, 10 and 20 mM). Inset showed the zoom-in part of the first three concentration gradient and negative control comparison. (b) Three parallel experiments of urea real sample detection. Inset showed the linear regression of urea with voltage under 5 mM. Reprinted with permission from reference [74]. Copyright 2012 Elsevier B.V.

Figure 20.
(A) Image of protein sensing area and Iridium oxide nanowires. (B) The impedance analysis of different concentrations of CRP and corresponding concentration vs. change of the capacitance (%) relationship (C). Reprinted with permission from references [75]. Copyright 2009 Elsevier B.V.
Figure 20.
(A) Image of protein sensing area and Iridium oxide nanowires. (B) The impedance analysis of different concentrations of CRP and corresponding concentration vs. change of the capacitance (%) relationship (C). Reprinted with permission from references [75]. Copyright 2009 Elsevier B.V.

Figure 21.
Repetitive Insulin injection response at 0.7 V of chronoamperometry. “a” indicated the blank injections. (A) and (B) were the response of insulin in the presence of 3 mM and 20 mM glucose, respectively. The other common reagent included phosphate buffer (0.20 M), NaCl (0.15 M). Reprinted with permission from reference [77]. Copyright 2000 American Chemical Society.
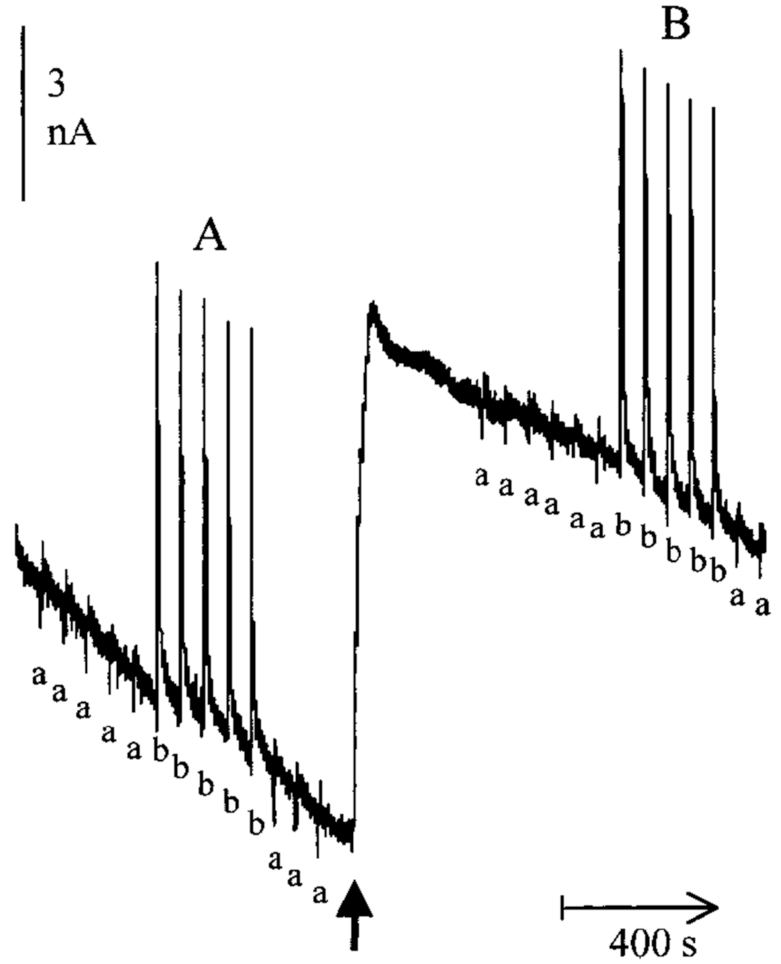
Figure 22.
(A) Flow Injection Analysis response to 100 nM to 35 µM of iodate. (B) The zoom-in part was corresponding to the low concentration of iodate. (C) The calculation curve was based on the FIA. (D) The 21 repetitive injections of 1.5 µM iodates. Reproduced by permission from reference [78]. Copyright 2009 Elsevier B.V.

Figure 23.
SEM images of the top surface of the AAO template (A) before Ir ALD and (B) after 600 cycles of Ir ALD. Cross—sectional SEM images of AAO templates with a 600 cycle Ir ALD film deposited with (C) 5 s Ir (acac)3 exposures and (D) 10 s Ir(acac)3 exposures. Reprinted with permission from reference [50]. Copyright 2010 Elsevier B.V.

Figure 24.
(A) SEM image of the top surface of the AAO template following 200 cycles of activation in 0.1 M H2SO4. (B) CV scans in 1 M H2SO4 of flat and nanoporous AIROFs. (C) CV scans in phosphate-buffered saline of flat and nanoporous AIROFs, demonstrating the enhancement in CSCc. Reprinted with permission from reference [50]. Copyright 2010 Elsevier B.V.

Figure 25.
(a) Resistive response vs. frequency for different propane concentrations. (b) Experimental resistance values replotted as a function of the propane concentration. The solid line corresponded to the exponential fitted line to the experimental data. (c) The resistive response towards different concentrations of propane in different frequencies. (d) The sensitivity of the device as of different concentration of propane for the selected frequencies. Reprinted with permission from [82]. Copyright 2010, IEEE.

Figure 26.
The relative sensitivities of the sample plate for Trellis-plot. The temperature increased from low to high on the left with sequences of five different types of gases. The concentration of the gases is H2 25 ppm, CO 50 ppm, NO 5 ppm and propene 25 ppm. Reprint with the permission from reference [86]. MDPI Open access.

Figure 27.
The mechanism of Fc-PNA combined signal-amplified electrochemical DNA sensor based on isothermal circular strand-displacement polymerization reaction. Reprinted with permission from reference [90]. Copyright 2012 Elsevier B.V.
Figure 27.
The mechanism of Fc-PNA combined signal-amplified electrochemical DNA sensor based on isothermal circular strand-displacement polymerization reaction. Reprinted with permission from reference [90]. Copyright 2012 Elsevier B.V.

Figure 28.
(A) Scheme principle of selective redox catalyst based on M(bpy (with M = Ru or Os) (B) Cyclic voltammetry at the scan rate of 100 mV/s recording (a) 20 μM Ru alone. (b) 20 μM Ru and 150 μM dGTP; (c) 10 μM Os alone. (d) 10 μM Os and 100 μM 7-deaza-dGTP. All solutions were prepared in the form of Tris-HCl buffer (50 mM, pH 8.7). Reprinted with permission from reference [91]. Copyright 2009 American Chemical Society.

Publisher’s Note: MDPI stays neutral with regard to jurisdictional claims in published maps and institutional affiliations. |
© 2021 by the authors. Licensee MDPI, Basel, Switzerland. This article is an open access article distributed under the terms and conditions of the Creative Commons Attribution (CC BY) license (https://creativecommons.org/licenses/by/4.0/).
Share and Cite
MDPI and ACS Style
Dong, Q.; Sun, X.; He, S. Iridium Oxide Enabled Sensors Applications. Catalysts 2021, 11, 1164. https://0-doi-org.brum.beds.ac.uk/10.3390/catal11101164
AMA Style
Dong Q, Sun X, He S. Iridium Oxide Enabled Sensors Applications. Catalysts. 2021; 11(10):1164. https://0-doi-org.brum.beds.ac.uk/10.3390/catal11101164
Chicago/Turabian StyleDong, Qiuchen, Xiangcheng Sun, and Songbing He. 2021. "Iridium Oxide Enabled Sensors Applications" Catalysts 11, no. 10: 1164. https://0-doi-org.brum.beds.ac.uk/10.3390/catal11101164
Note that from the first issue of 2016, this journal uses article numbers instead of page numbers. See further details here.