
Morphology and Catalytic Performance of MoS2 Hydrothermally Synthesized at Various pH Values


1
Energy Resources Upcycling Research Laboratory, Korea Institute of Energy Research, 152 Gajeong-ro, Yuseong-gu, Daejeon 34129, Korea
2
Department of Chemical and Biomolecular Engineering, Sogang University, 35 Baekbeom-ro, Mapo-gu, Seoul 04107, Korea
*
Authors to whom correspondence should be addressed.
Catalysts 2021, 11(10), 1229; https://0-doi-org.brum.beds.ac.uk/10.3390/catal11101229
Submission received: 13 August 2021
/
Revised: 7 October 2021
/
Accepted: 7 October 2021
/
Published: 12 October 2021
(This article belongs to the Special Issue New Horizons for Heterogeneous Catalysts)
Abstract
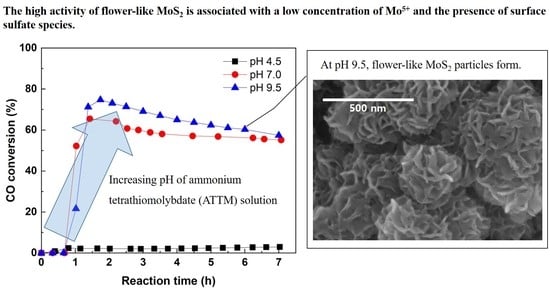
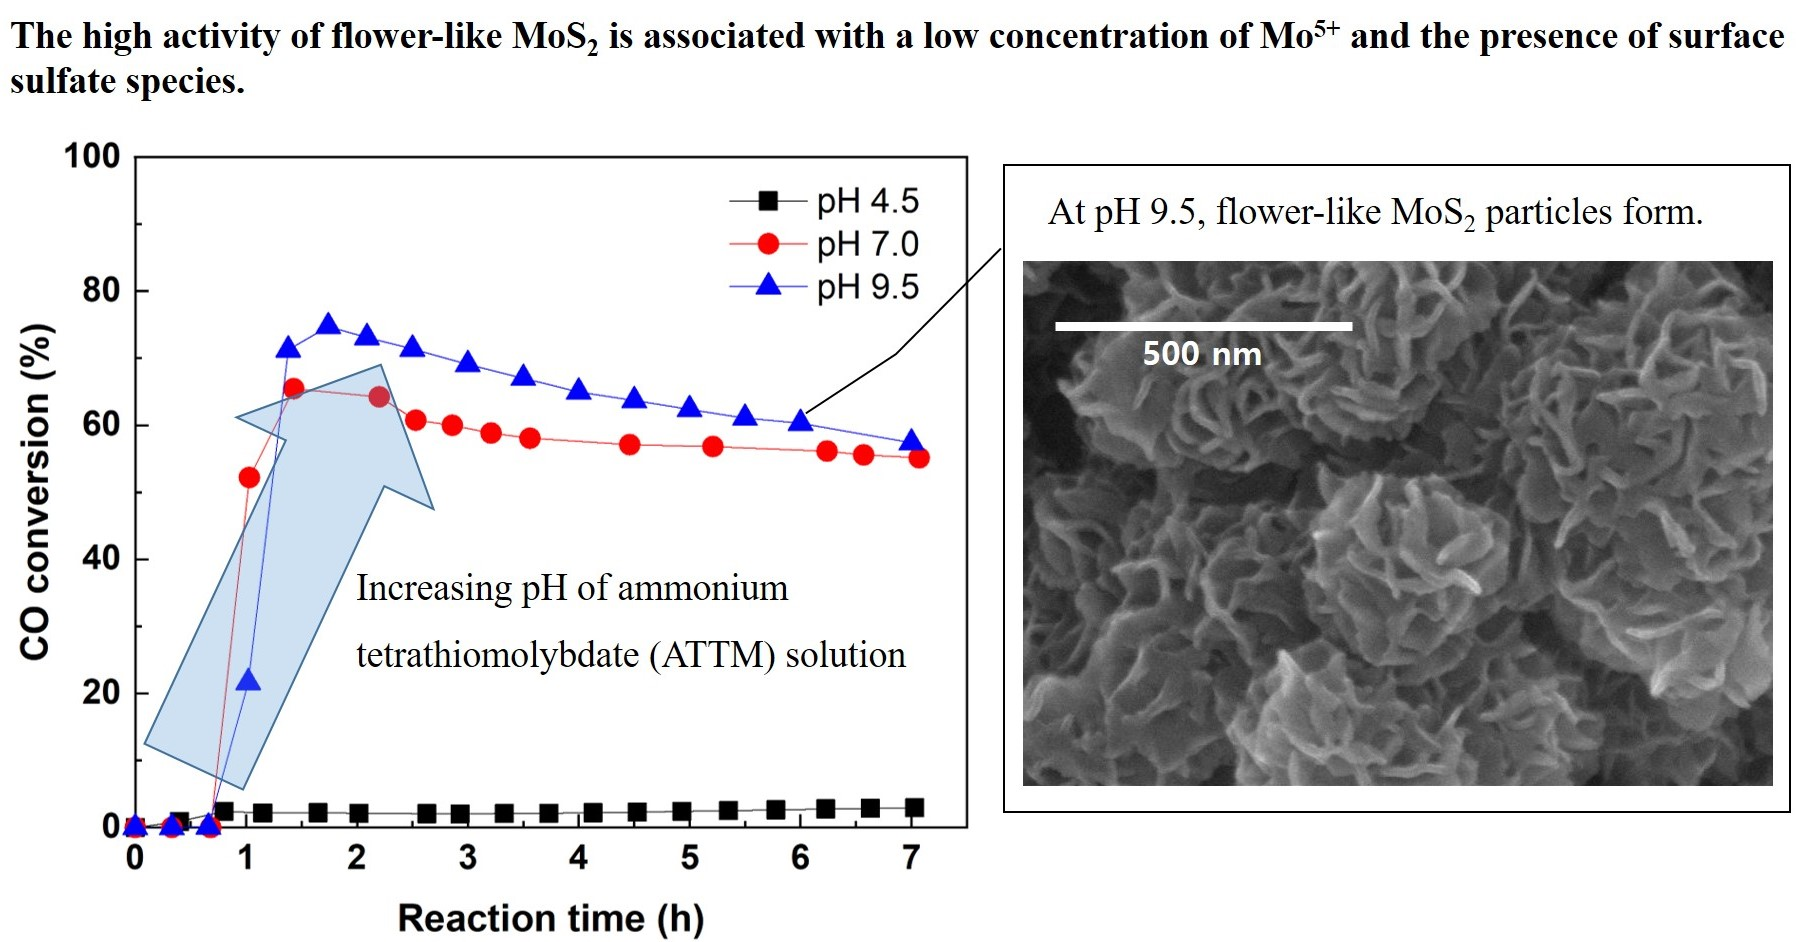
:Although preparation conditions are known to affect the morphology and catalytic performance of hydrothermally synthesized MoS2, the influence of pH remains unclear. Herein, unsupported MoS2 was prepared from ammonium tetrathiomolybdate (ATTM) by a hydrothermal reaction at various pH values under a reaction pressure of 2 MPa. The physical and chemical properties of the MoS2 samples were characterized, and the catalytic performance for CO methanation was examined. With increasing pH, the morphology of the MoS2 particles transformed from aggregates of irregular grain-like particles to flower-like particles through the agglomeration of fine mesoporous nanoflakes. Hydrothermal synthesis at a pH of 9.5 increased the MoS2 crystallinity by enhancing the stacking of the (0 0 2) lattice plane. The MoS2 samples prepared at pH 7.0 and 9.5 showed increased CO conversion during methanation, which was associated with a low concentration of Mo5+ species and the presence of surface sulfate species. Thus, a high pH during catalyst preparation may promote the complete decomposition of ATTM to MoS2 and the formation of sulfur vacancies, which can facilitate methanation.
1. Introduction
MoS2 is a transition metal dichalcogenide material with a layered structure consisting of stacked S-Mo-S units in the form of a Mo atomic layer interposed between two S layers. The stacked structure of MoS2 can be classified into three polytypes based on symmetry, namely, tetragonal (1T-MoS2), hexagonal (2H-MoS2), and rhombic (3R-MoS2). The S and Mo atoms at the edges of MoS2 crystals are present as anionic and cationic species, respectively, between which strong covalent bonds are formed [1,2,3]. In addition, the S atoms between the stacked layers of MoS2 are bonded by weak Van der Waals forces, which can be easily broken [1,2,3]. MoS2 has been applied as a catalyst for various hydrogenation reactions, including hydrodesulfurization [4,5], hydrodenitrogenation [4,6], and methanation [7,8]. Moreover, it has been utilized in hydrogen storage containers [9], manganese and lithium batteries [10,11,12], and lubricants [13,14]. Recent studies have especially focused on the application of MoS2-based electrodes in beyond-lithium-ion batteries [15,16]. Further, several researchers have thoroughly reviewed the synthesis and structure of MoS2 [2,3] and its applications in fields such as optoelectronics [17,18].
The most commonly used polytype of MoS2 is 2H-MoS2 because it is more stable than 1T-MoS2 and 3R-MoS2. Various morphologies have been reported for 2H-MoS2, including nanorods [19], nanotubes [20], nanoflowers [21], inorganic fullerenes [22], and spherical particles [23,24]. Various methods, such as chemical vapor desorption [25], electrochemical and chemical methods [26], and hydrothermal synthesis [27], have been used to prepare MoS2, and the type of MoS2 structure formed varies depending on the synthesis method. In particular, the hydrothermal method is known to produce well-crystallized MoS2 via a simple procedure under moderate operating conditions [27]. Moreover, diverse MoS2 particle shapes, including nanotubes, nanoflowers, and spherical particles, can be synthesized hydrothermally [28]. The aging time can be tuned, and the amount of ionic liquid added can be varied to yield nanoflower-shaped MoS2 with high crystallinity and a uniform particle size, which is advantageous for use in lithium batteries or lubricants [28,29,30]. In addition, porous flower-like microspheres of MoS2/C that show high electrochemical performance as anode materials for lithium-ion batteries can be synthesized solvothermally [31].
Many researchers have reported the effects of different types of catalyst precursors on the thermal decomposition properties of the products [32,33,34]. The thermal decomposition of the ammonium heptamolybdate (AHM) precursor with sulfur powder under various sulfidation conditions affected the surface area and catalytic activity during methanation. The optimum S/AHM weight ratio for the as-prepared catalyst was 3:1 [32]. The use of tetra-alkylammonium thiosalts in thermal decomposition resulted in the formation of cheese-like (or sponge-like) MoS2 [33,34]. The hydrothermal synthesis of ATTM under conditions of high pressure (≤4 MPa) and at a reaction temperature of 350 °C resulted in the improved catalytic performance of MoS2 during methanation [35]. Although Tian et al. varied the pH of the hydrothermal solution in a narrow range near pH 7.0 to produce amorphous MoS2 nanospheres [24], the effect of this parameter has not been investigated in detail. Therefore, in this study, MoS2 was hydrothermally synthesized at a wide range of pH values to investigate the influence of pH on morphology and catalytic performance.
2. Results and Discussion
2.1. Catalyst Morphology
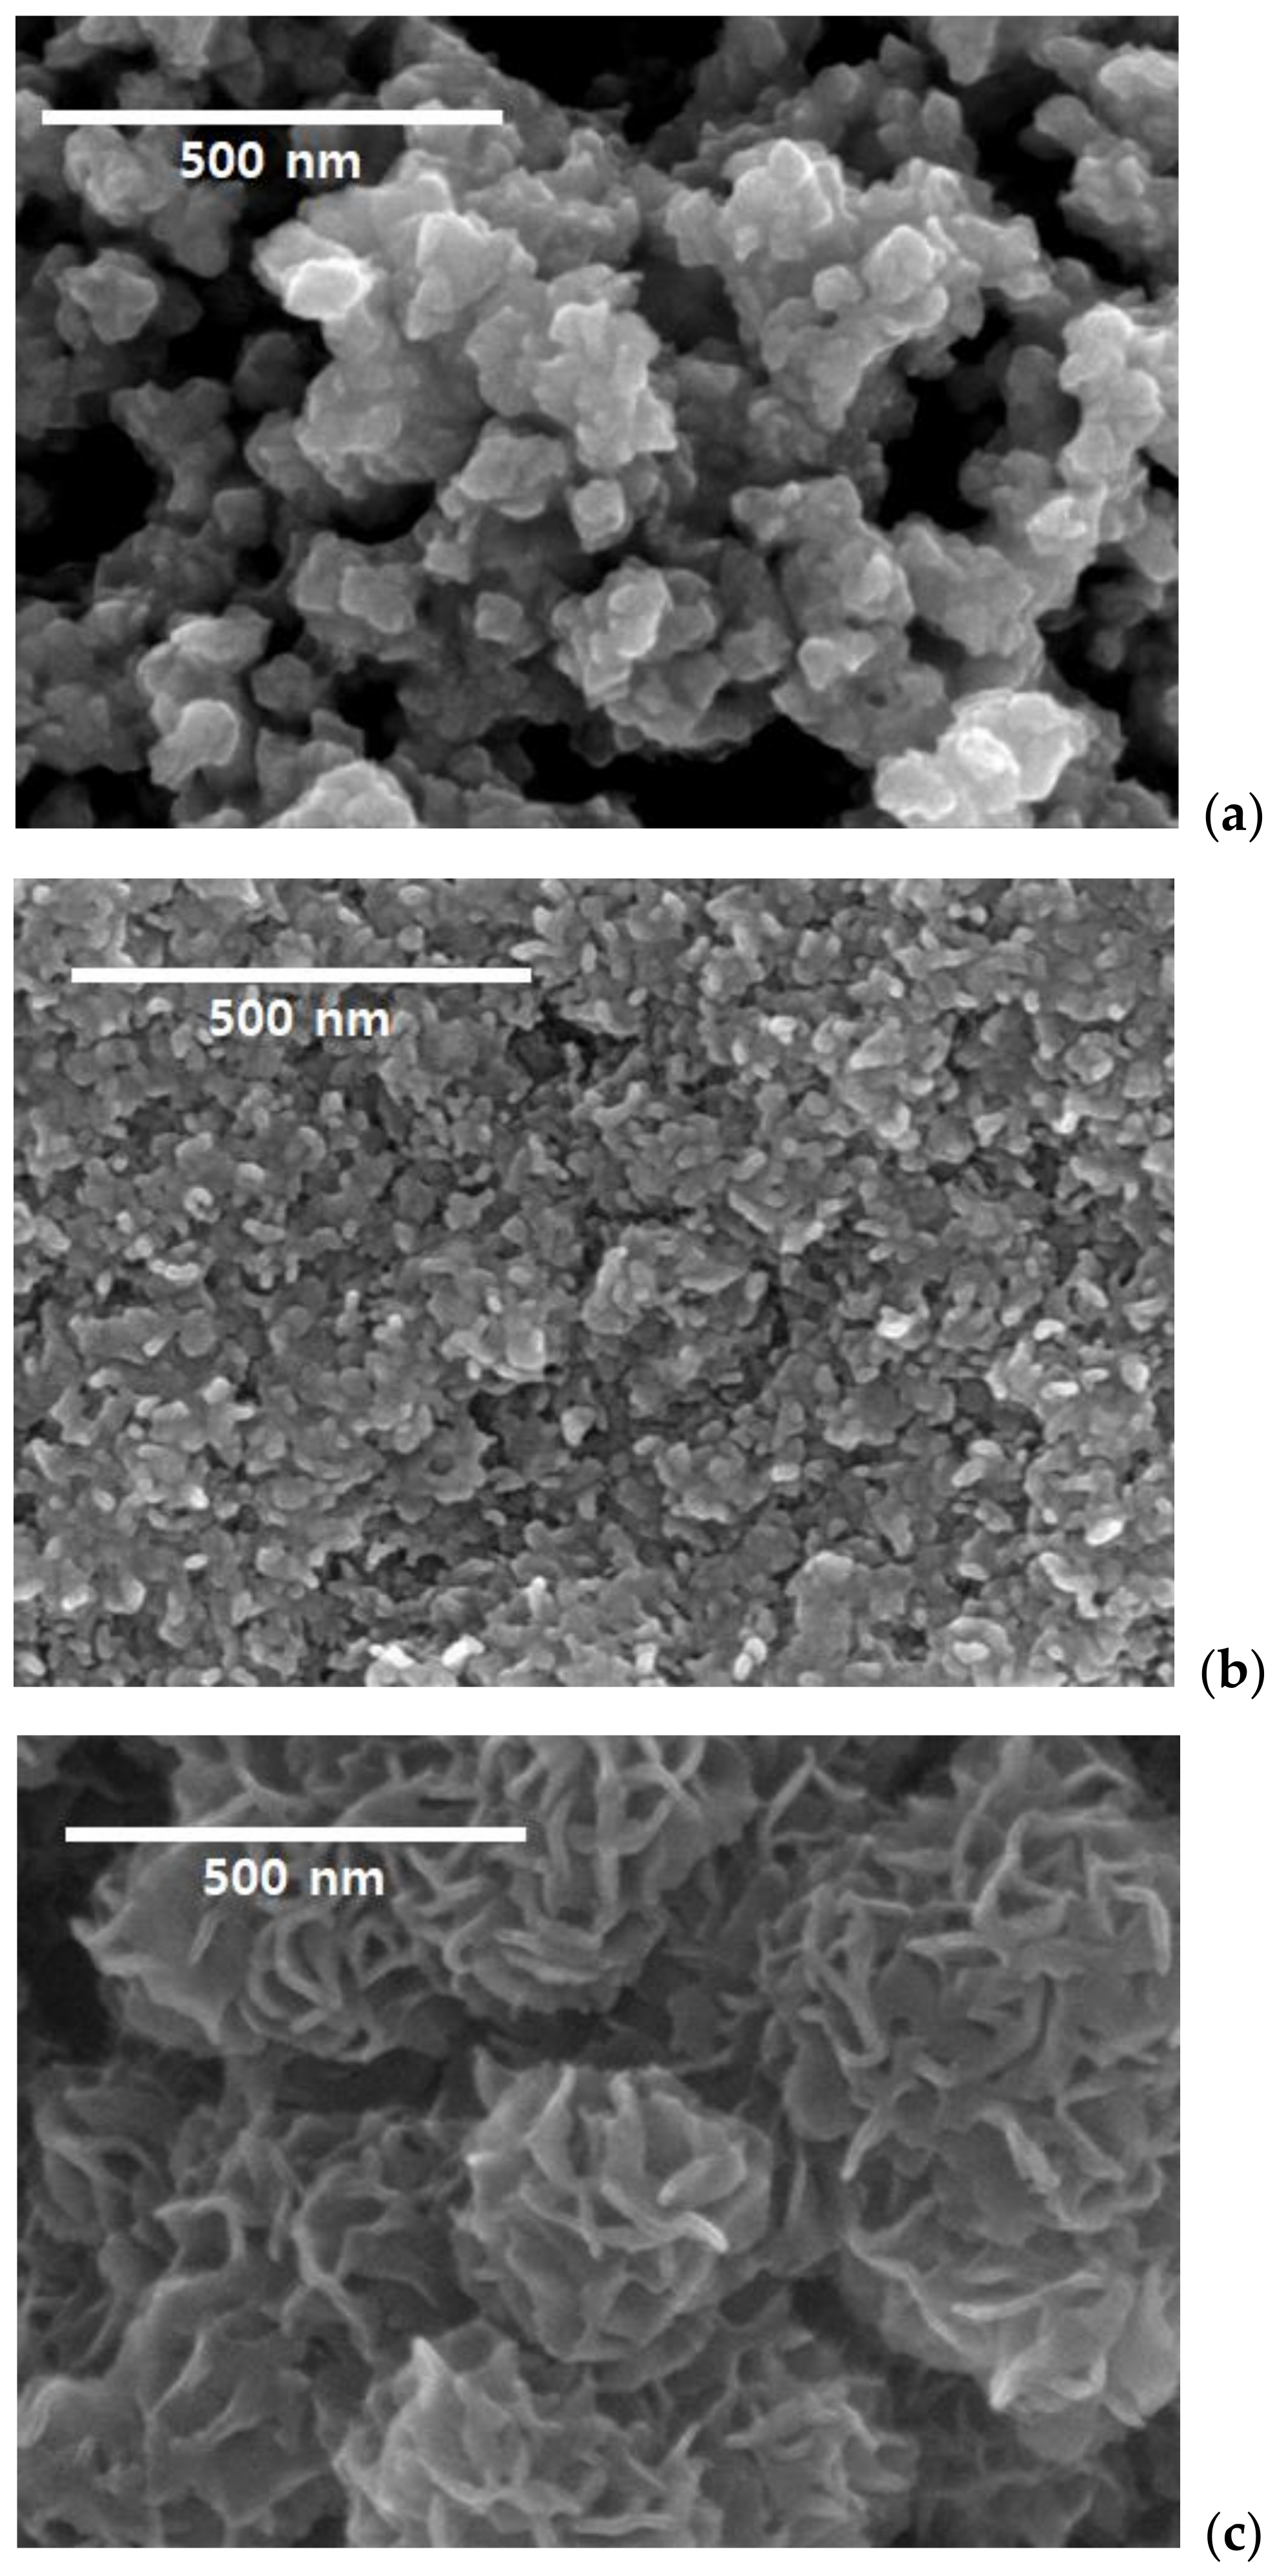
SEM images of the hydrothermally prepared catalysts are shown in Figure 1. The particle sizes of the samples prepared at pH 4.5 and 7.0 ranged between 30 and 50 nm. The catalyst prepared at pH 4.5 consisted of aggregates, in which irregularly shaped particles were interconnected (Figure 1a), whereas the catalyst prepared at pH 7 consisted of particles of varying shapes, instead of agglomerates (Figure 1b). By contrast, the particles prepared at pH 9.5 had a flower-like shape and consisted of petals with a thickness of 10 nm and a length of 100–200 nm that agglomerated to form 300–400 nm microspheres (Figure 1c).
Wei et al. [28] hydrothermally synthesized flower-shaped MoS2 at 180 °C by adding sodium dithionite (Na2S2O4) and thioacetamide (CH3CSNH2) to a mixture of ammonia and ammonium molybdate ((NH4)6Mo7O24·4H2O). The authors proposed that the reaction of thioacetamide and hydroxyl ions produced sulfur ions that reduced Mo from Mo6+ in the oxide precursor to Mo4+ in the sulfide product. Additionally, Sen and Mitra [36] prepared MoS2 with a flower-like morphology from a solution of ammonium heptamolybdenum and ammonium hydroxide by heating the solution to 60 °C in H2S gas and hydrothermally treating it at 180 °C in an autoclave. They suggested that the excess hydroxyl ions present in the precursor solution caused the MoS2 crystallites to grow in a lamellar structure by blocking the (0 0 1) plane of the crystallites. Further, it has been found that a nanoflake morphology can be obtained by thermally decomposing ATTM under H2 in the presence of elemental sulfur, which might play an important role in suppressing the aggregation of MoS2 nanoflakes [37]. Consequently, the observation of a flower-like MoS2 morphology at a high pH was likely due to the presence of excess hydroxyl ions from ammonium hydroxide and abundant sulfur from ATTM [38]. In the hydrothermal reaction system, we suggest that the MoS2 nanoflakes were created owing to the obstruction of the growth of the (0 0 1) plane by the excess hydroxyl ions. Furthermore, the supply of sulfur during the reaction could induce the self-assembly of the nanoflakes to form flower-like MoS2 particles.
2.2. Crystalline Structure of Catalysts
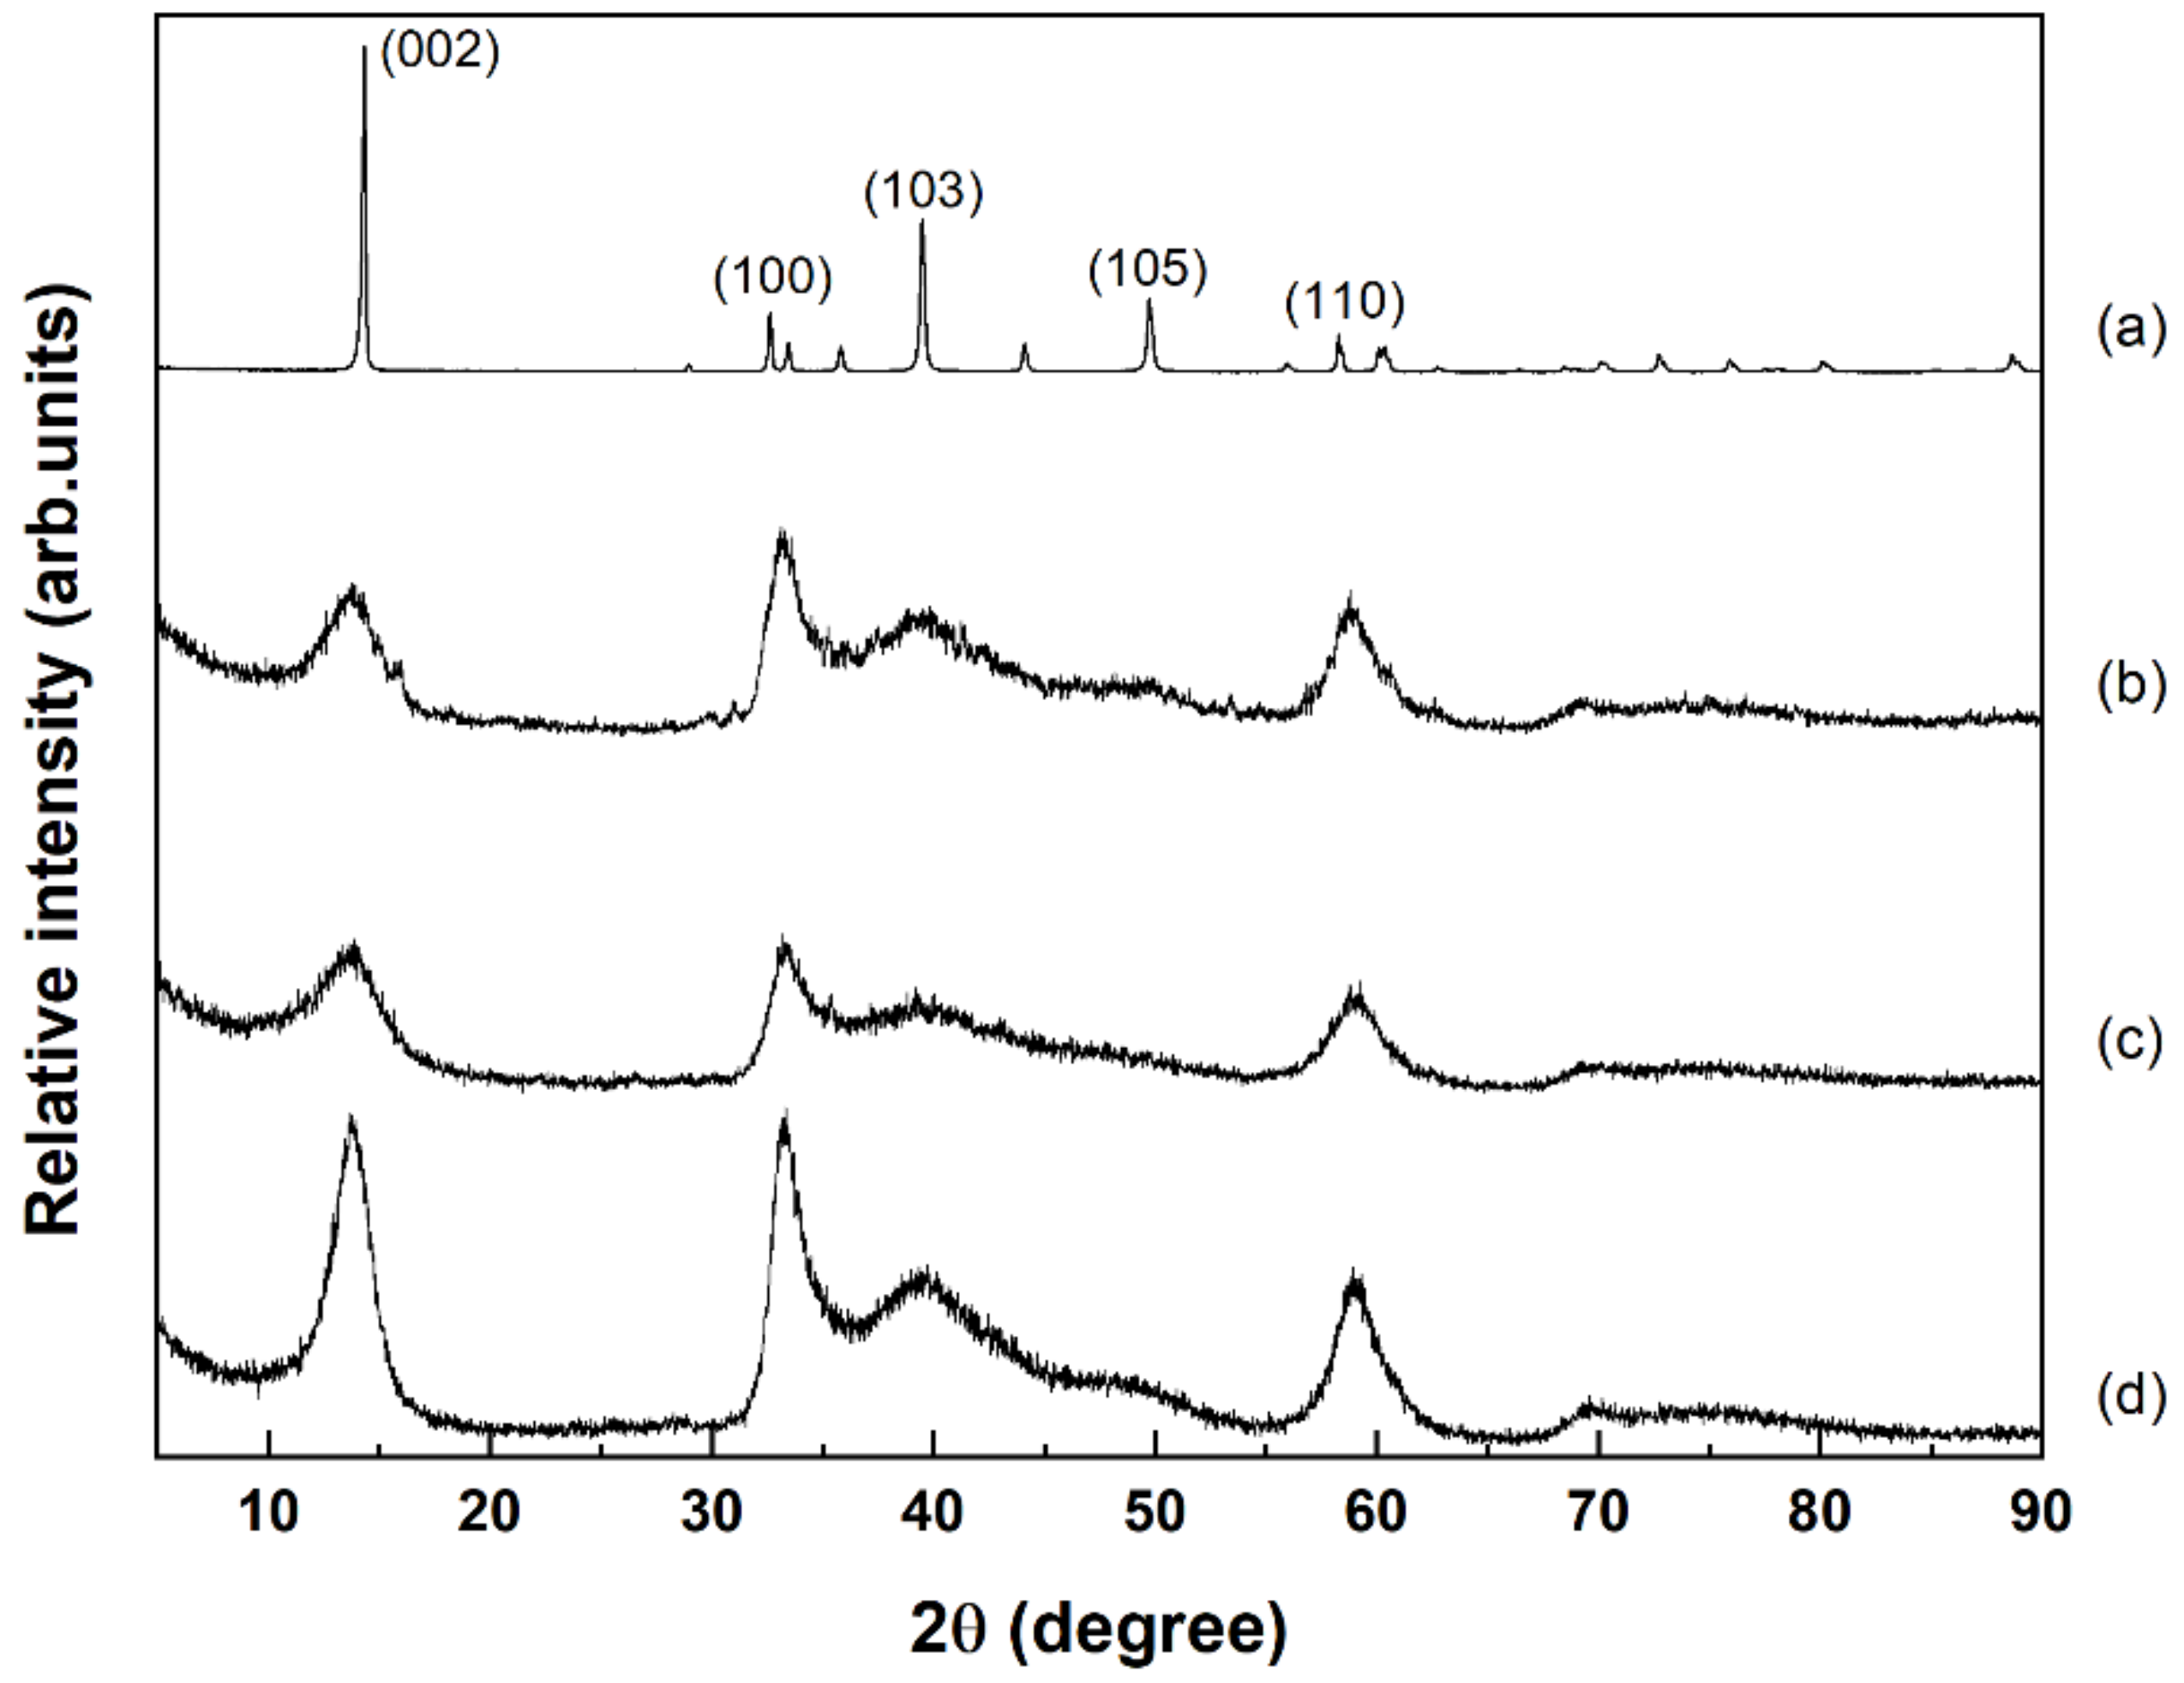
A comparison of the XRD patterns of the prepared catalysts with that of commercial MoS2 (Figure 2) confirmed that the samples consisted of the hexagonal phase of MoS2 (JCPDS card No. J87-2416) [39]. However, the diffraction peaks of the prepared MoS2 samples were much broader than those of the commercial sample. As reported by the Chianelli group [40,41], such broad peaks could imply the presence of poorly crystalline MoS2. The strongest diffraction peak at 14° corresponded to the (0 0 2) lattice plane of MoS2 crystallites, whereas the diffraction peaks at 33°, 40°, and 59° were assigned to the (1 0 0), (1 0 3), and (1 1 0) planes, respectively. The XRD patterns of the MoS2 samples prepared at pH 4.5 and 7.0 showed a broad and weak peak corresponding to the (1 0 3) lattice plane, but the (1 0 5) peak was absent. However, for the MoS2 sample prepared at pH 9.5, the peak intensities slightly increased, which indicated that the crystallinity of MoS2 could be enhanced by increasing the pH of the precursor solution to 9.5. Applying the Scherrer equation [41] to the peak at 14°, the average crystallite size of the (0 0 2) lattice plane was found to increase from 2.7 nm at pH 4.5 to 3.3 nm at pH 9.5 (Table 1). Considering that the d-spacing of the (0 0 2) lattice plane is 6.17 Å [41], the numbers of stacked lattice planes at pH 4.5, 7.0, and 9.5 were calculated to be 4.4, 4.8, and 5.3, respectively.
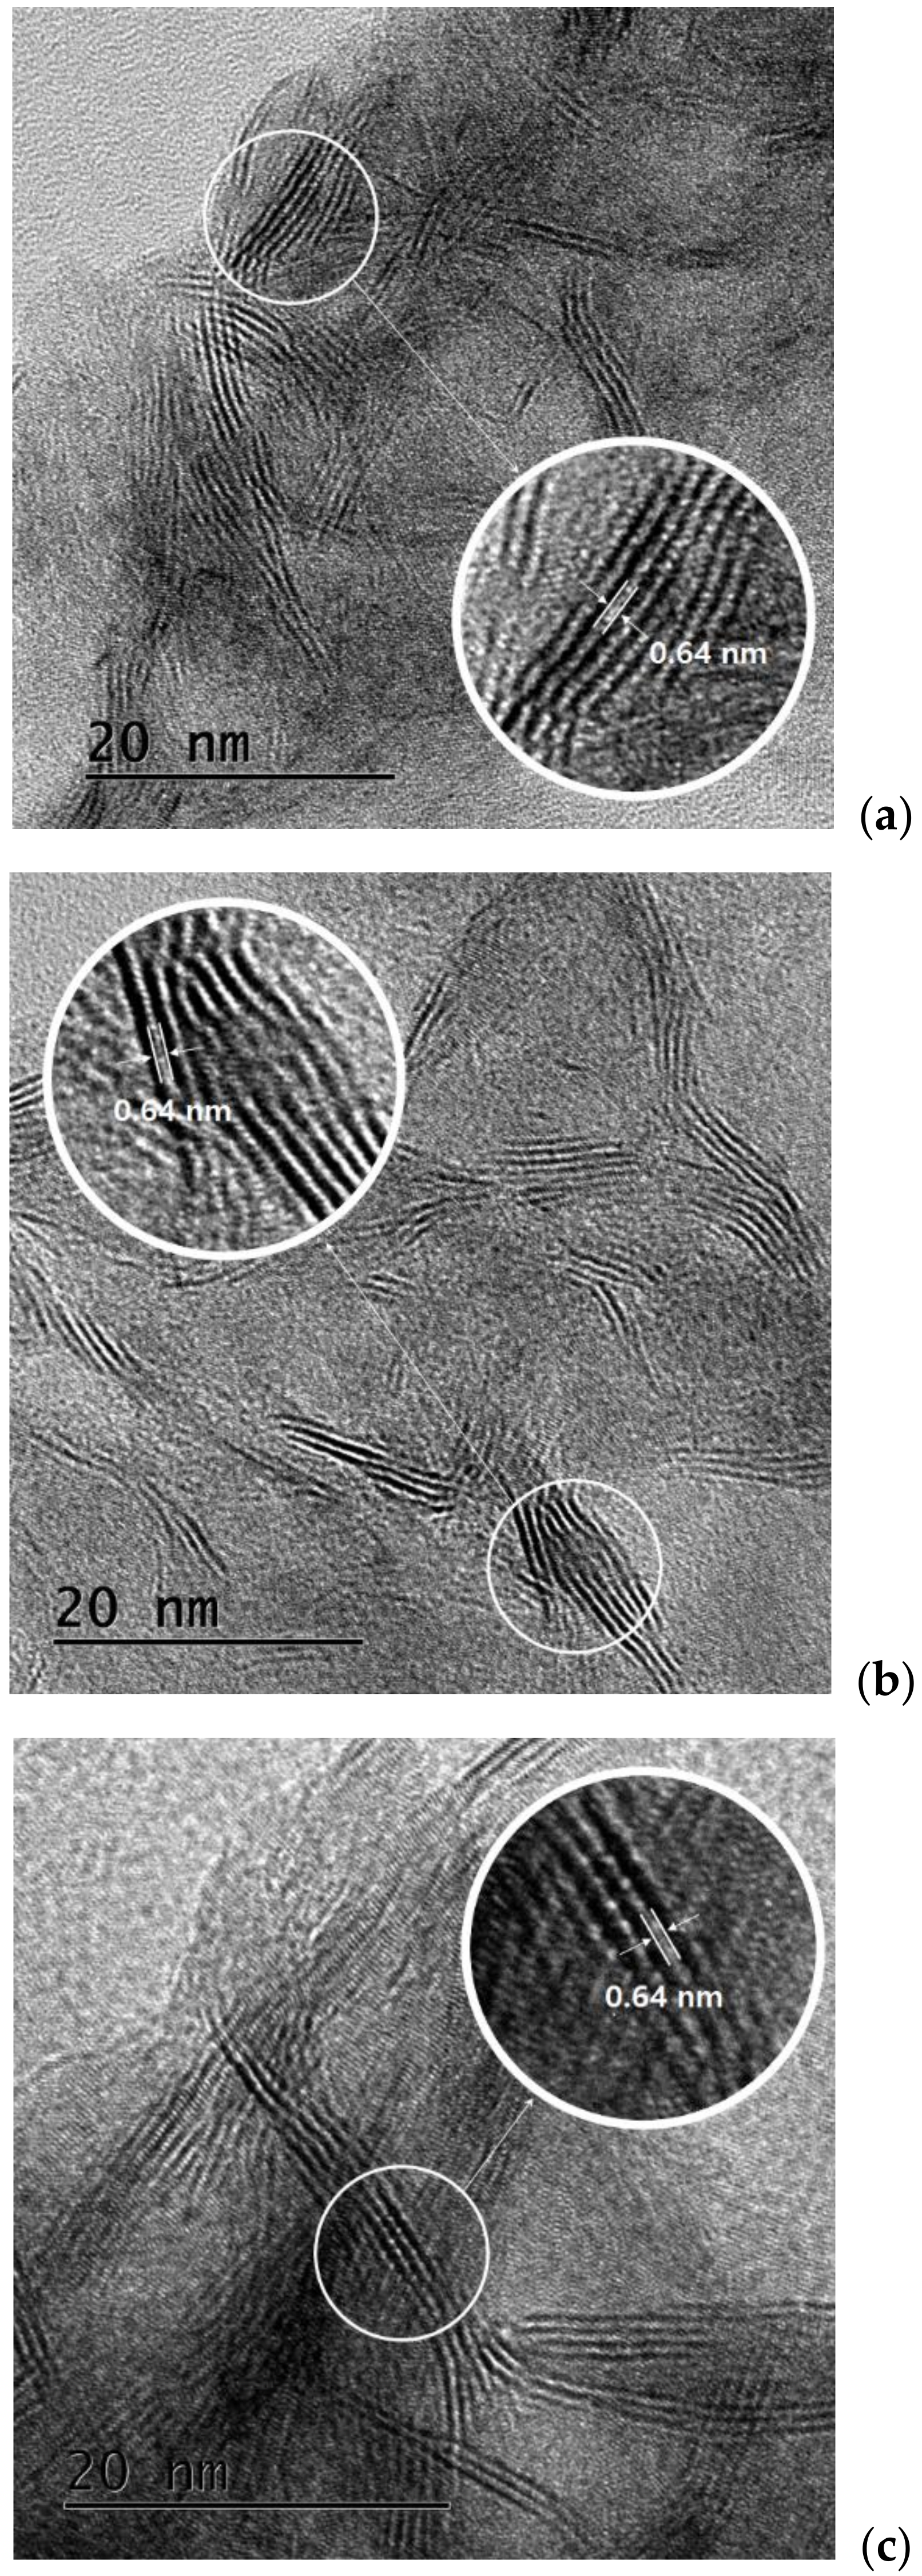
The HRTEM images (Figure 3) revealed that several MoS2 layers were stacked to produce a striped pattern along the length of the samples. Moreover, the MoS2 layers of the samples prepared at pH 9.5 had a higher lateral length than those prepared at pH 4.5 and 7.0. In all the samples, the interlayer distance was observed to be ~0.64 nm (insets, Figure 3), which is similar to that of the (0 0 2) lattice plane in MoS2 (0.617 nm) [36,42]. Further, the crystallites of MoS2 prepared at pH 4.5 and 7.0 consisted of 3–5 stacking layers, whereas those prepared at pH 9.5 consisted of 5–9 stacking layers. Considering that the XRD analysis gave mean values, the TEM results were reasonable, and the number of stacking layers in MoS2 prepared at pH 9.5 likely exceeded those in the samples prepared at pH 4.5 and 7.0.
2.3. Pore Structure of Catalysts
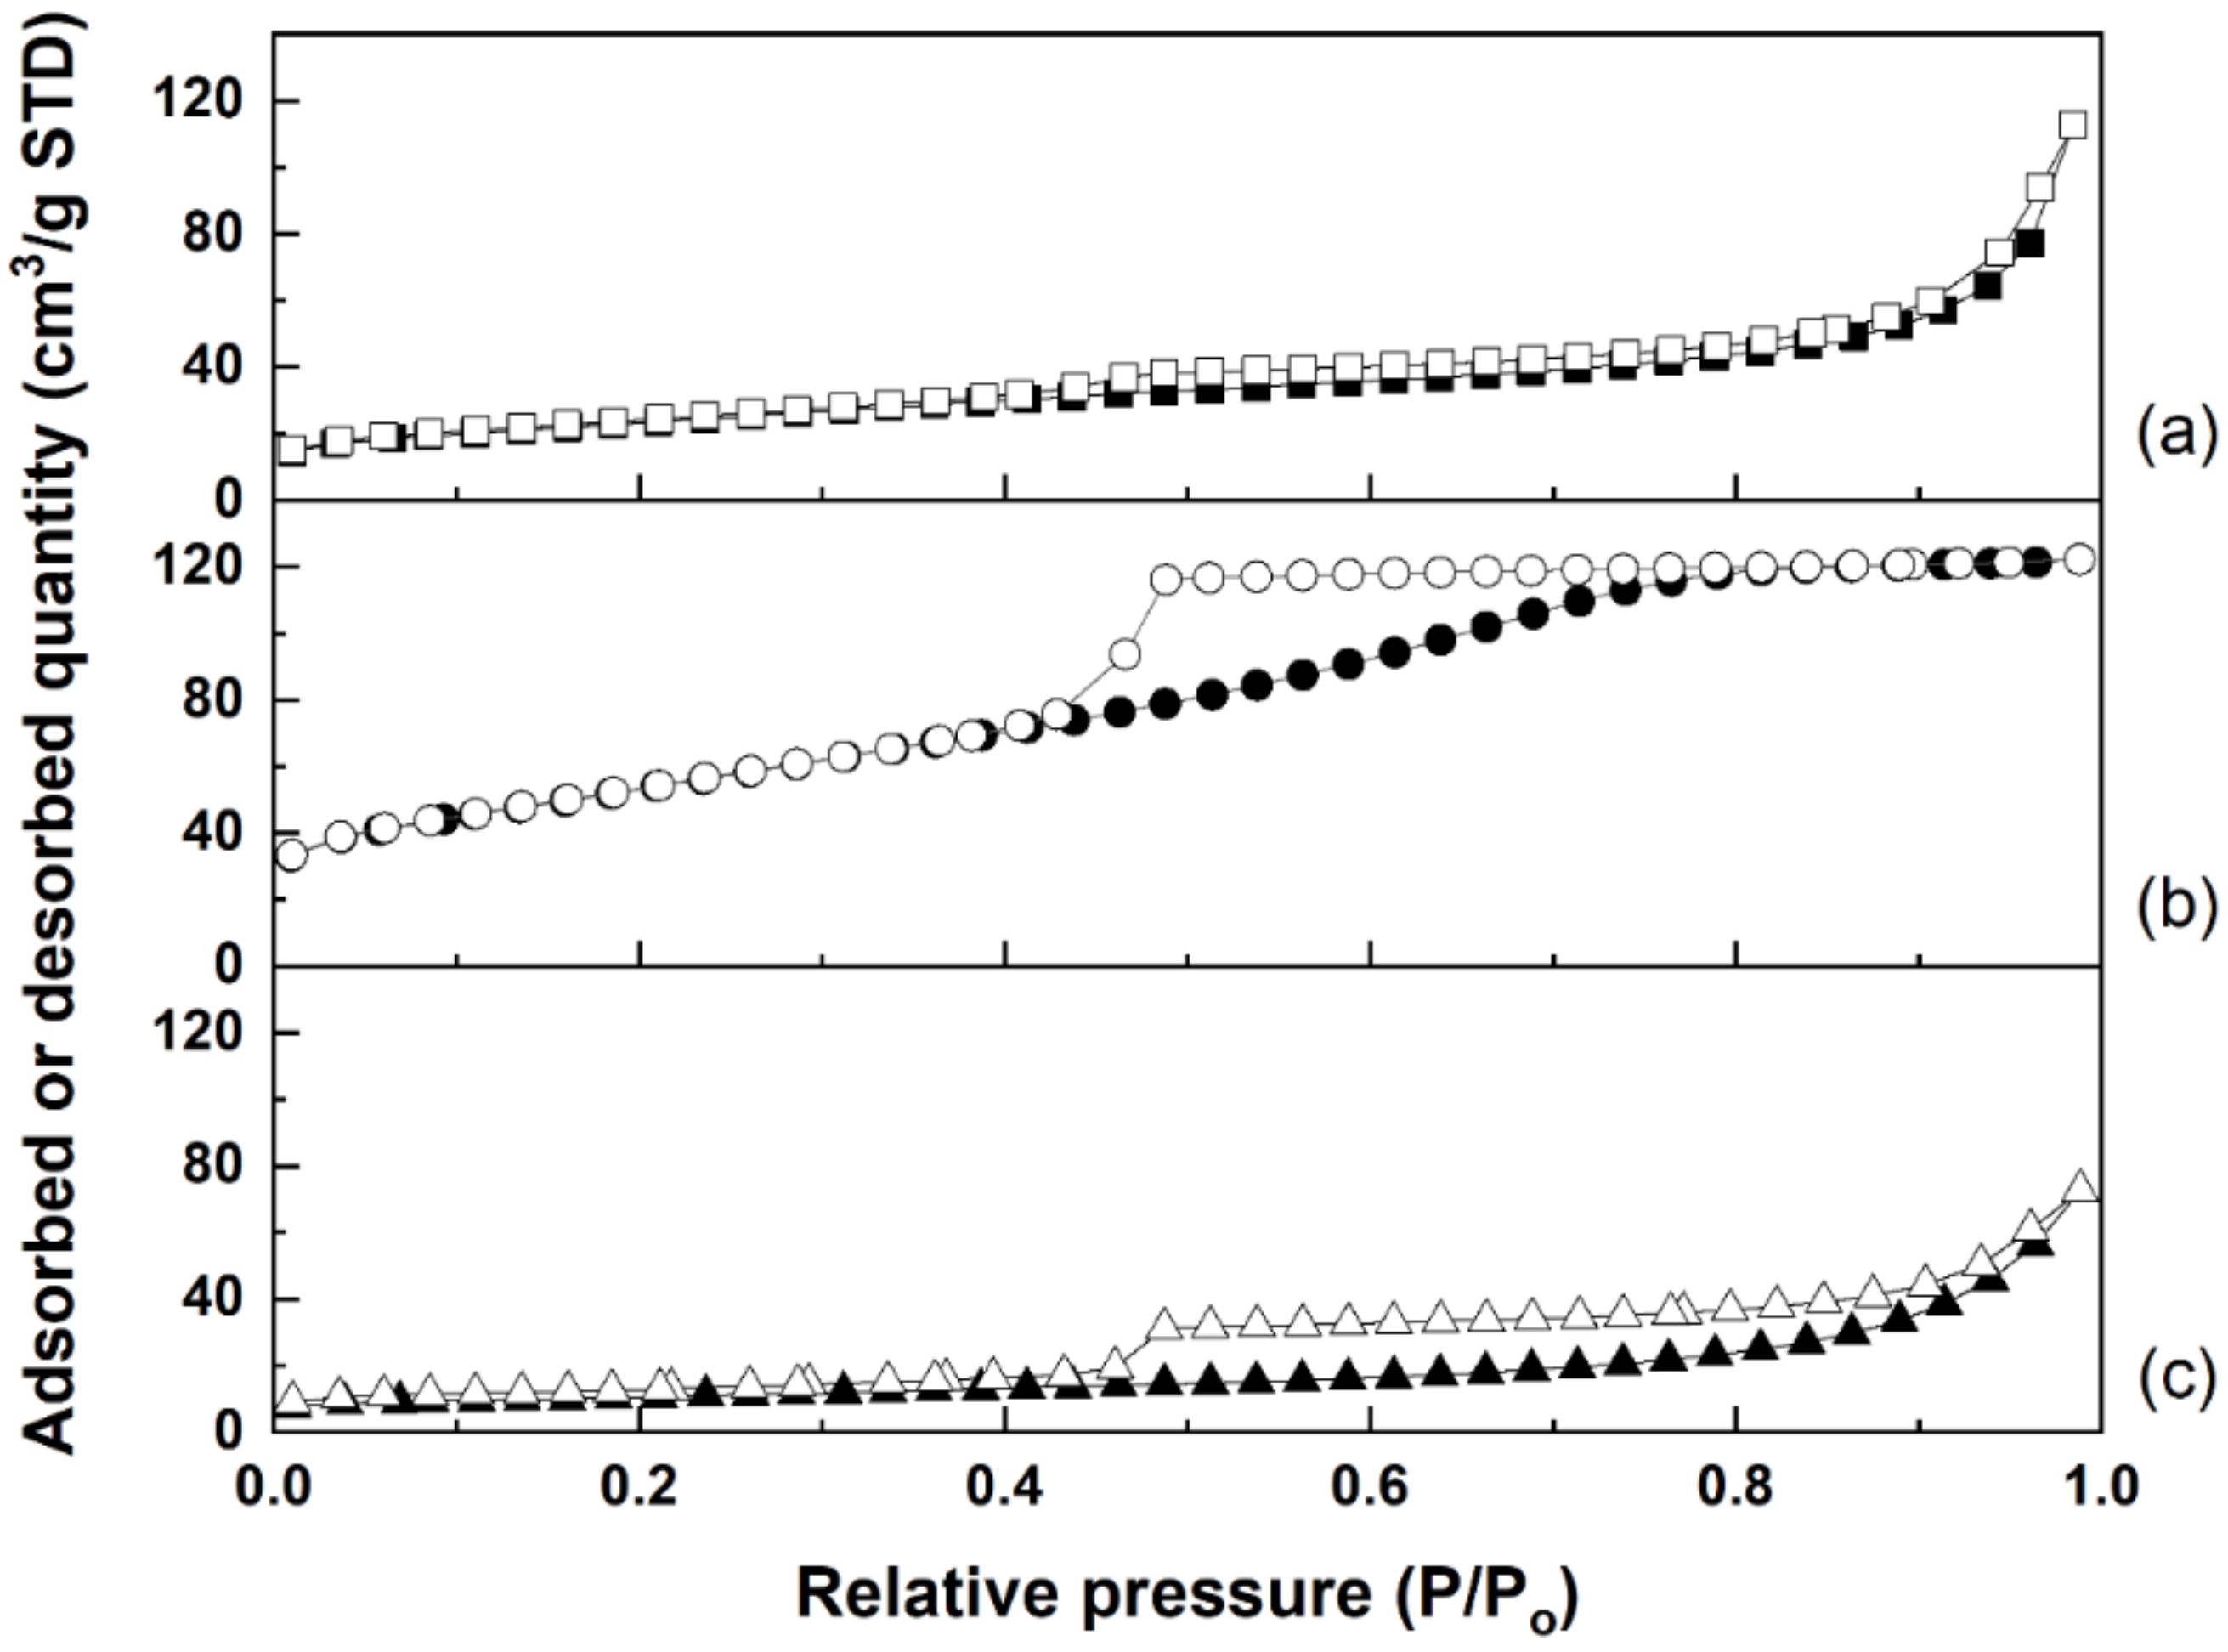
The N2 adsorption–desorption isotherms of the MoS2 samples (Figure 4) could be characterized based on the IUPAC classification [43]. MoS2 prepared at pH 4.5 exhibited a type II isotherm, which could be attributed to the absence of pores or the presence of macropores [43]. In addition, the observation of a type H3 hysteresis loop suggested that the pores were slit shaped and produced by the agglomeration of plate-like particles [39,43]. MoS2 produced at pH 7.0 exhibited a type IV adsorption isotherm, indicating the existence of mesopores, and showed a type H2 hysteresis loop, suggesting that the pores were ink-bottle-shaped [43]. MoS2 produced at pH 9.5 showed a type II adsorption isotherm similar to that of the sample produced at pH 4.5. However, the hysteresis loop could be classified as type H4 [43]. Consequently, although these pores are also slit shaped, their interiors are narrow and uniform. The predicted pore structures were consistent with the SEM observations.
The pore properties of the prepared MoS2 samples are summarized in Table 2. The Brunauer–Emmett–Teller (BET) surface area of the MoS2 sample increased from 83.21 to 167.00 m2/g as the pH of the precursor solution increased from 4.5 to 7.0. This increase was probably due to the creation of mesopores from macropores by the interconnection of the particles, as suggested by the observed changes in morphology. However, further increasing the pH from 7.0 to 9.5 slightly lowered the BET surface area from 167.00 to 158.38 m2/g, which might be caused by the destruction of micropores to form larger pores during the production of the flower-like particles.
2.4. Surface Composition of Catalysts
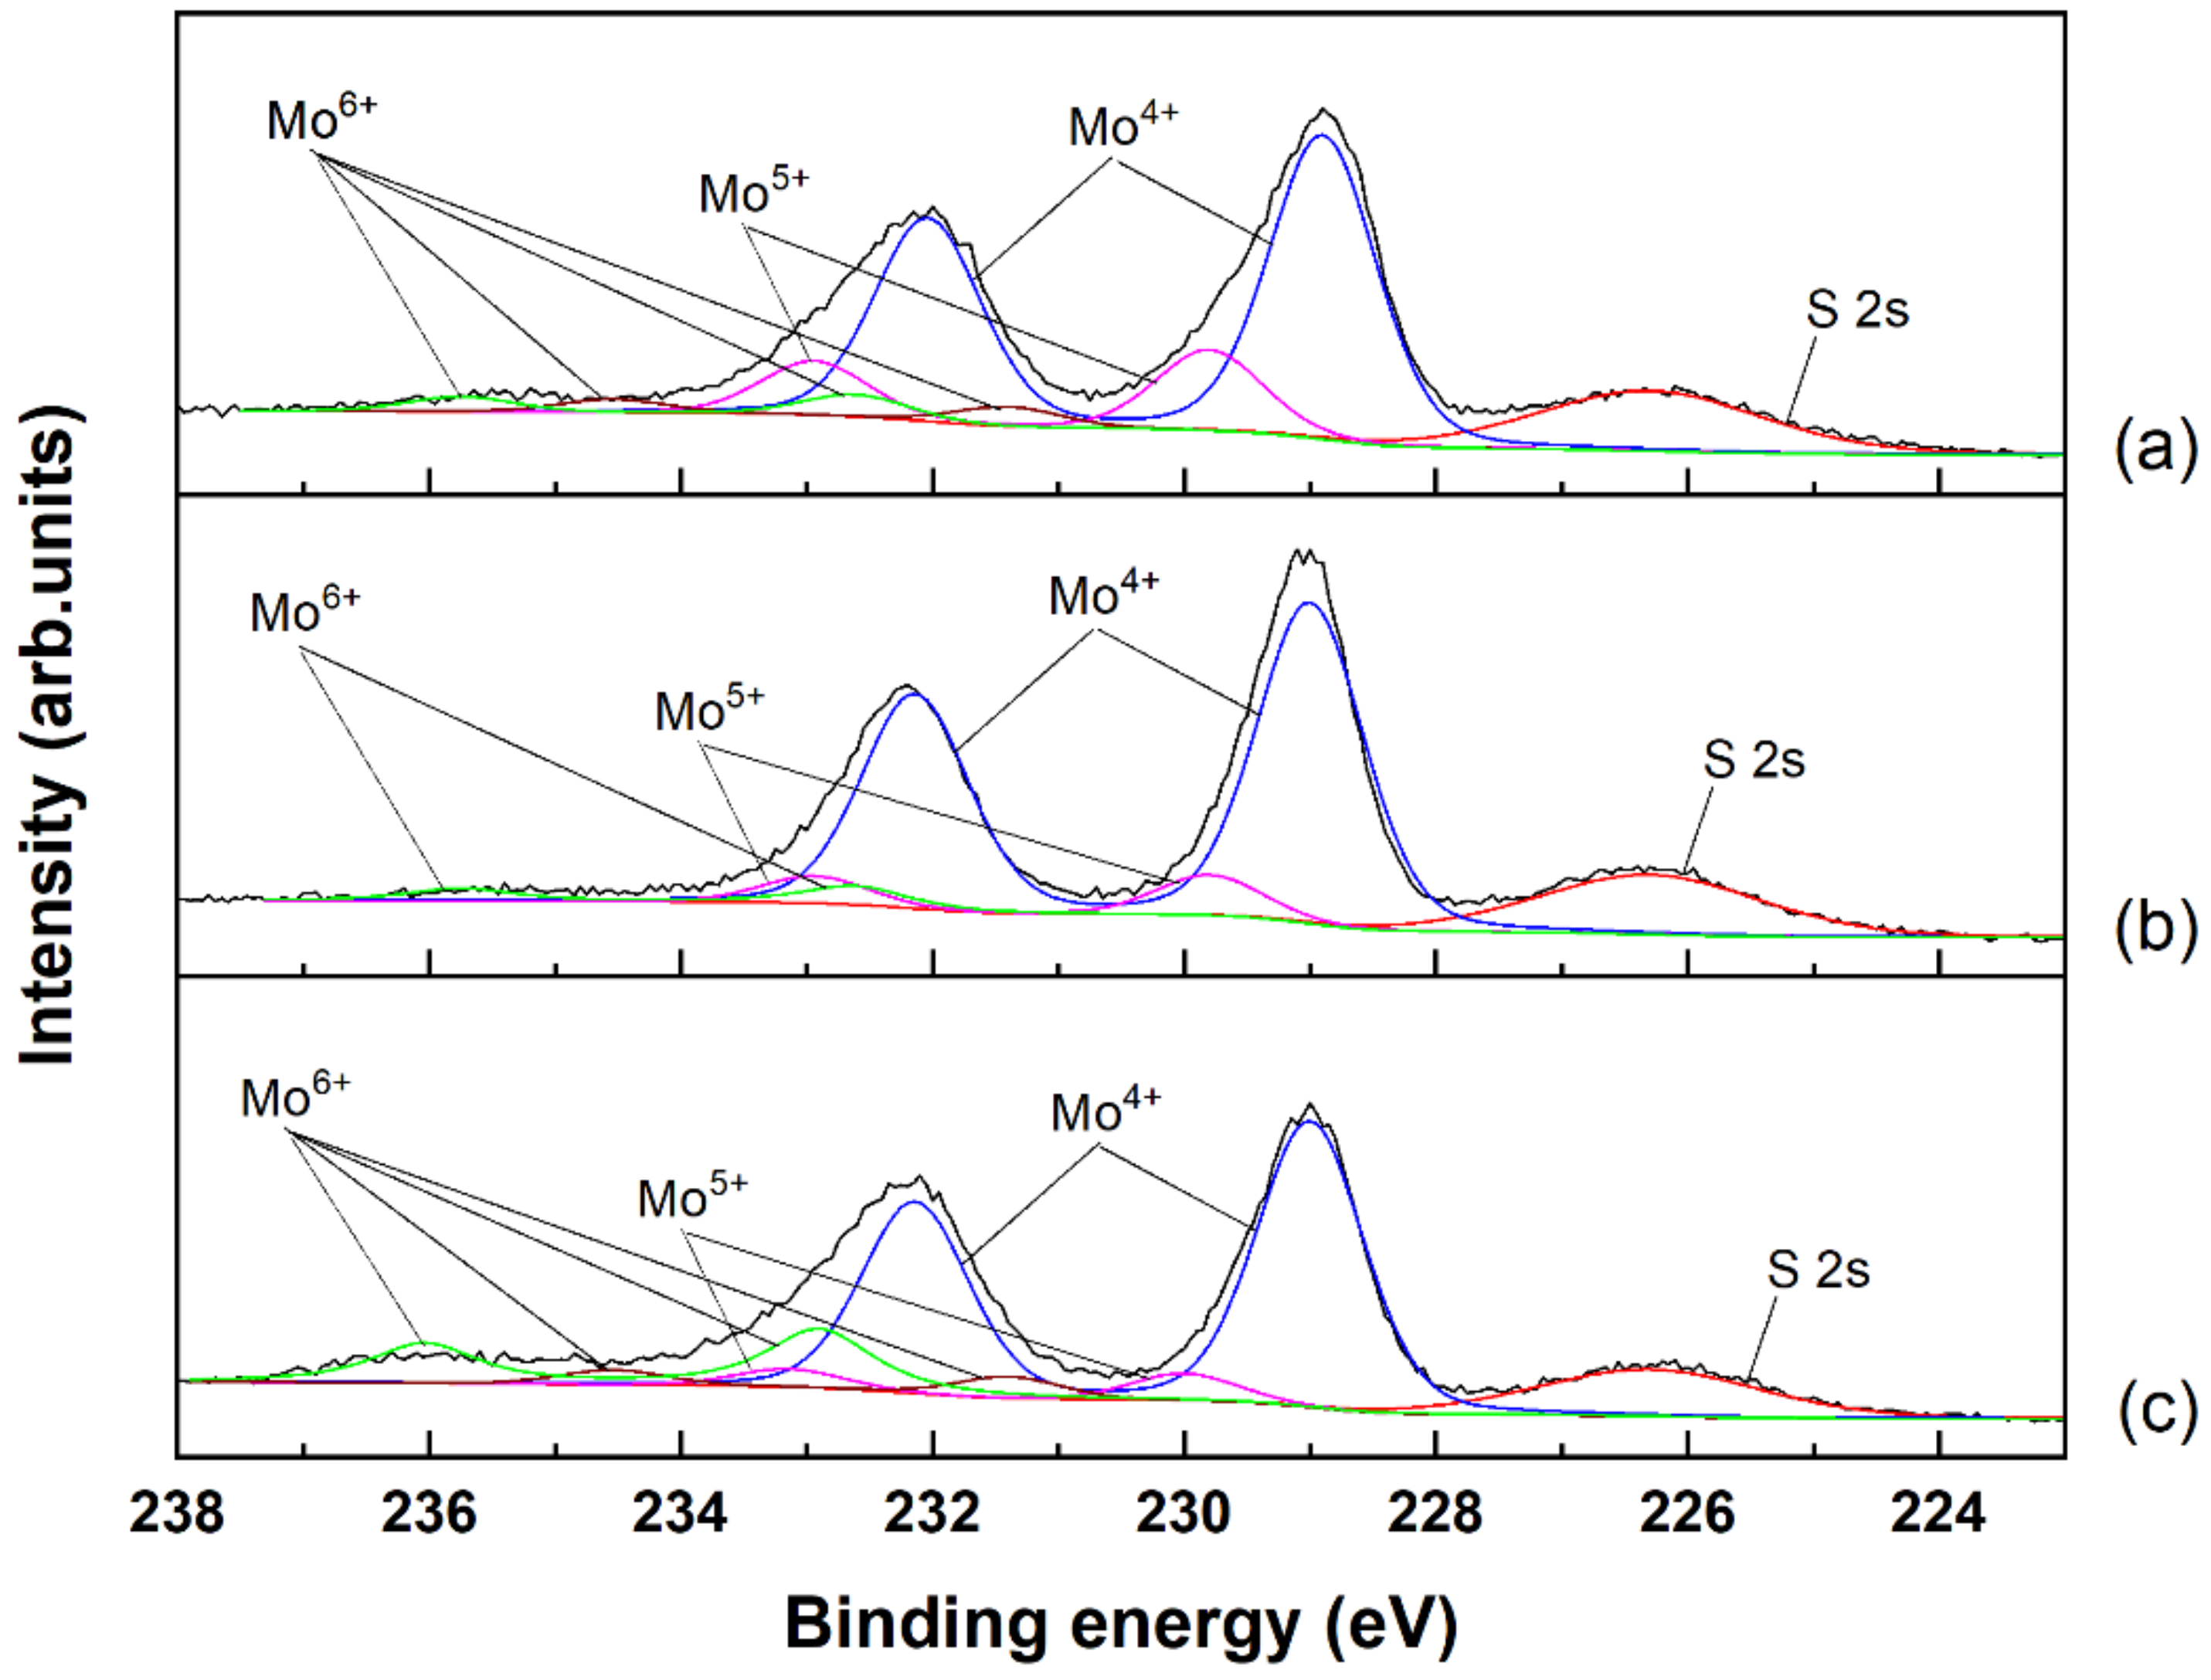
The surface composition of the MoS2 samples was evaluated using XPS. Figure 5 and Figure 6 display the Mo 3d and S 2p XPS spectra, respectively, with the corresponding deconvoluted Lorentzian–Gaussian peaks obtained by the Shirley baseline correction method. In general, Mo 3d peaks consist of Mo 3d5/2 and Mo 3d3/2 states with a peak area ratio of 3:2 and a separation energy of ~3.1 eV [44]. The Mo 3d5/2 binding energies are known to be 228.2–230.1 eV for Mo2+ [44,45], 228.7 eV for Mo3+ [44], 229.1–230.1 eV for Mo4+ [44], 230.9–231.8 eV for Mo5+ [44,45], and 231.6–232.7 eV for Mo6+ [44]. Moreover, the peak at a binding energy of 226.4 eV can be assigned as S 2S. As shown in Figure 5, most Mo in the prepared MoS2 samples is present as Mo4+ in the form of MoS2, as indicated by the strong peaks at binding energies of 229.0 and 232.2 eV, with some Mo6+ in the form of MoS3 and MoO3, as indicated by the peaks at 231.4 and 232.1 eV. Wang et al. [44] reported that MoS3 can be produced from ATTM during the MoS2 preparation process by vacuum annealing at 450 °C and that some MoS3 may be oxidized to MoO3 when exposed to air. The peak at a binding energy of 230.3 eV can be attributed to Mo5+ in the form of Mo2S5. Based on the results of a TG/DTA analysis, it has been suggested that intermediates such as Mo2S5 could form during the phase transformation of MoS3 into MoS2 [44]. Thus, the Mo5+ could be formed by the incomplete hydrothermal decomposition of ATTM into MoS2.
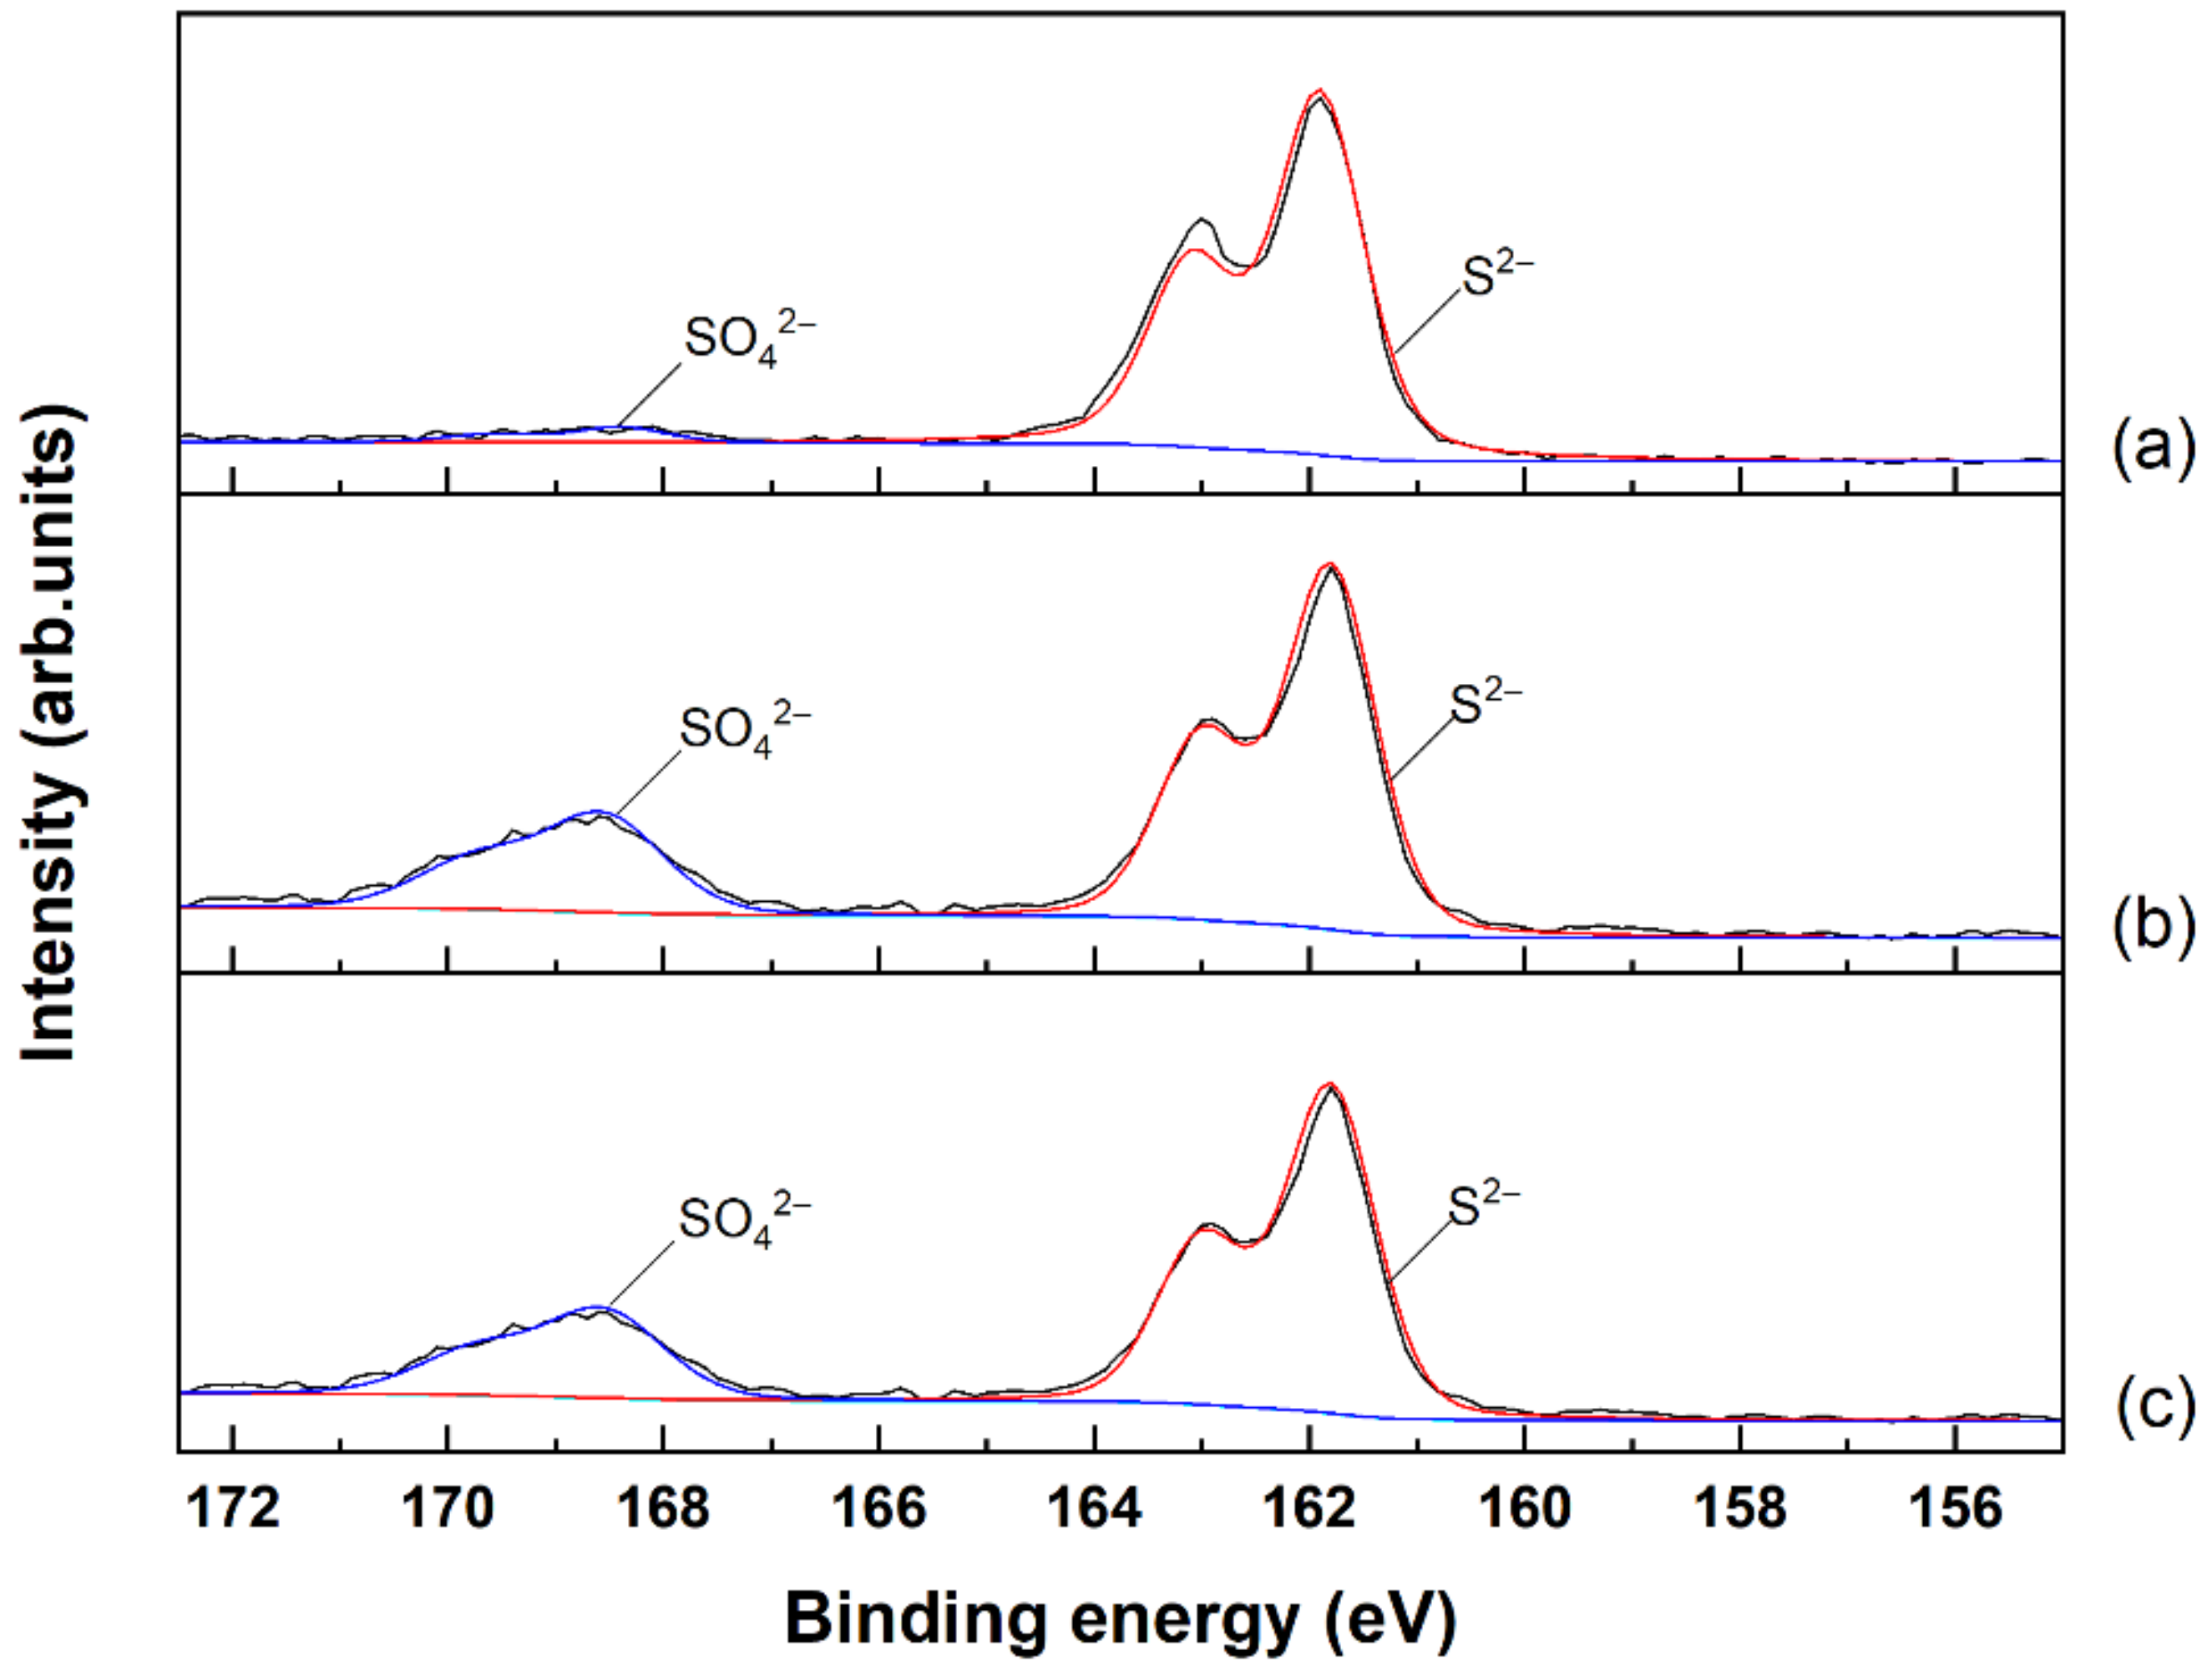
Typical S 2p peaks consist of S 2p3/2 and S 2p1/2 states with a peak area ratio of 2:1 and a separation energy of ~1.2 eV [44]. As shown in Figure 6, the main S 2p3/2 and S 2p1/2 peaks appear at binding energies of 161.9 and 163.0 eV, respectively, which probably correspond to S2− in MoS2. The minor peaks observed at 168.9 and 169.9 eV could be associated with sulfate species created by surface oxidation in air [35]. In a previous work, wherein MoS2 was hydrothermally prepared at 350 °C in 2 MPa without pH adjustment, it was found that the presence of H2 in the preparation may deplete the surface sulfur of MoS3 and Mo2S5 to create surface vacancies, which might produce surface sulfates upon exposure to the atmosphere [35]. It is worth noting that the peak areas of the minor peaks increased slightly as the pH values used for MoS2 preparation increased. Thus, it was postulated that the sulfate species were produced by the oxidation of H2S adsorbed on the sample prepared at pH 9.5, which might cause the creation of sulfur vacancies on the catalyst surface.
2.5. Catalytic Methanation
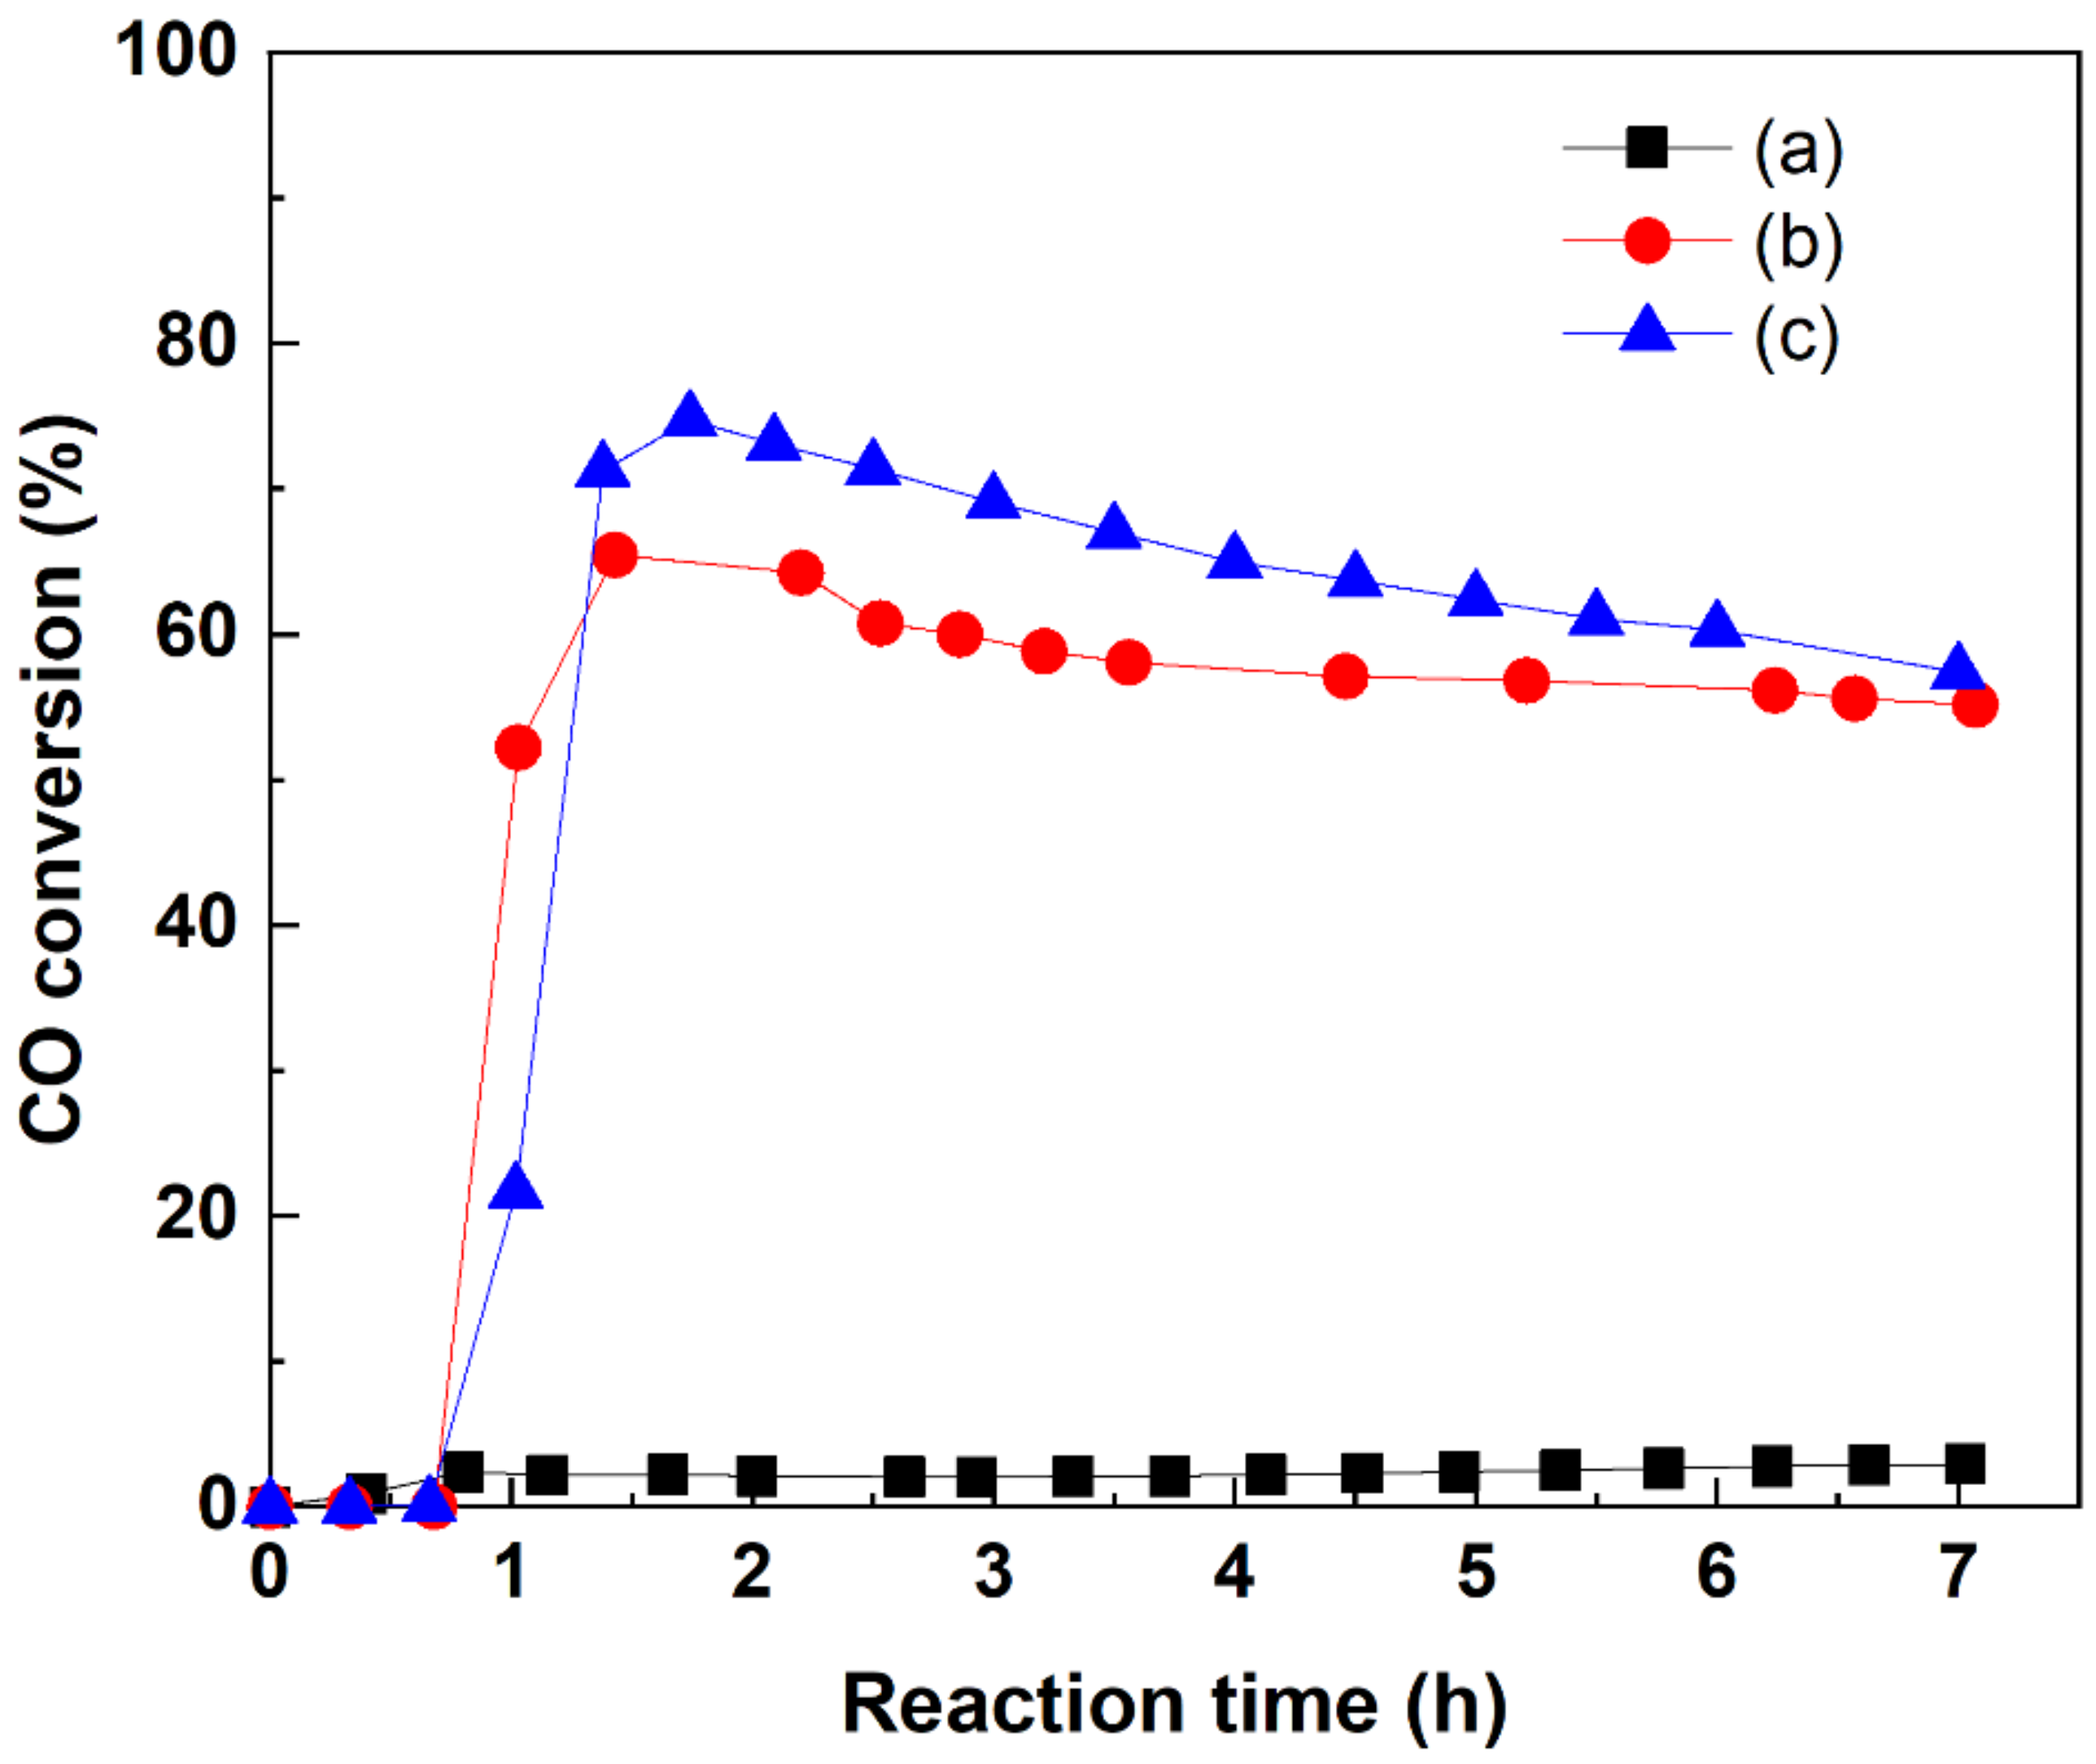
The catalytic activities of the prepared MoS2 samples were evaluated based on CO conversion during methanation (Figure 7). The CO conversion over MoS2 prepared at pH 4.5 was lower than 3% for reaction times up to 7 h. The poor catalytic activity of this sample was probably due to its low BET surface area and large amount of surface Mo5+ species in the form of Mo2S5 owing to the incomplete decomposition of ATTM. A previous study found that sulfur in Mo2S5 may react with H2 to form H2S during methanation at 400 °C in 3 MPa [35]. Thus, during the catalytic reaction, H2 could be consumed in the reduction of Mo2S5 rather than in the methanation of CO. Furthermore, the presence of sulfate species on the MoS2 surface can be related to sulfur vacancies that can facilitate catalytic reactions [46,47]. The low concentration of sulfate species in the catalyst prepared at pH 4.5 suggested that the creation of sulfur vacancies was suppressed by the low pH value.
With the samples prepared at pH 7.0 and 9.5, the maximum CO conversions were reached within 120 min. At longer reaction times, the CO conversion decreased monotonically. No CO conversion was observed at reaction times shorter than 40 min, likely owing to the aforementioned consumption of H2 by Mo2S5. In general, CO conversion over the sample prepared at pH 9.5 was higher than that over the sample prepared at pH 7.0, with maximum CO conversions of ~75% and 65%, respectively. Although the sample prepared at pH 9.5 had a slightly lower BET surface area than the sample prepared at pH 7.0, the former exhibited a higher CO conversion, which might be induced by the presence of more sulfur vacancies, as evidenced by the sulfate species observed in the XPS spectra. The observed surface sulfate would be initially converted to the vacancies by the reactants of H2 and CO during the methanation reaction. In general, such surface vacancies could improve the catalytic activity of MoS2 [32,48,49]. Furthermore, it has been proposed that active sites such as sulfur vacancies could exist on the curvature of the basal planes of MoS2, as well as on the edge planes [50,51]. Hence, the samples with a flower-like MoS2 morphology (prepared at higher pH) might include more surface vacancies of MoS2 than those with a simple morphology (prepared at lower pH).
3. Materials and Methods
3.1. Catalyst Synthesis
MoS2 catalysts were prepared using a hydrothermal method by varying the pH value of the precursor solution. First, 5 g of ammonium tetrathiomolybdate (ATTM, (NH4)2MoS4; Alfa Aesar, 99.99%) as a precursor of MoS2 was added to 250 mL of deionized water. Then, the pH of the mixture was adjusted to 4.5, 7.0, or 9.5 by adding 0.1 M HCl or 0.1 M NH4OH. Once the pH was stable, the mixture was transferred to a hydrothermal reactor and then agitated under Ar gas (80 mL/min) for 30 min and H2 gas (30 mL/min) for 1 h at ambient temperature and pressure. The reactor was pressurized to 2 MPa using a back-pressure regulator. The temperature of the reactor was maintained at 350 °C for 2 h under an atmosphere of H2 gas (30 mL/min). After the hydrothermal reaction, the pressure and temperature of the reactor were decreased to ambient conditions under Ar gas (200 mL/min) for 12 h. The obtained samples were washed several times with deionized water and acetone, centrifuged at 15,000 rpm for 10 min, and dried in air.
3.2. Catalyst Characterization
The morphologies of the prepared samples were analyzed using scanning electron microscopy (SEM; Hitachi S-4800) and high-resolution transmission electron microscopy (HRTEM; JEOL JEM-2010). To examine the crystalline structures of the samples, X-ray diffraction (XRD) patterns were collected using a Rigaku D/Max-2500 diffractometer equipped with a Cu Kα radiation source (λ = 1.5414 Å) operated at 40 kV and 100 mA. The scanning rate was 2°/min in the 2θ range of 5–90°. The crystalline structure was identified using the Joint Committee on Powder Diffraction Standards (JCPDS) library. To investigate the oxidation states of Mo and S on the sample surface, X-ray photoelectron spectroscopy (XPS) was performed using an Axis Nova spectrometer (Kratos) with a monochromatic Al Kα X-ray source (1486.6 eV) operated at 15 kV and 10 mA under a chamber pressure of 10−8 Torr. All binding energies were referenced to that of O 1s (531.0 eV). The baseline corrections for peak fitting were performed using the Shirley method. N2 adsorption–desorption isotherms of the samples were obtained at 77 K using an ASAP 2020 instrument (Micromeritics Instruments).
3.3. Catalytic Activity for CO Methanation
The catalytic activities of the prepared MoS2 catalysts were examined for the methanation of CO (Equation (1)).
H2 + CO → ½CH4 + ½CO2
The catalytic reaction was performed in a fixed-bed reactor equipped with two K-type thermocouples to monitor the temperatures at the top and bottom of the catalyst bed. The catalyst (0.5 g) was mounted in the reactor, which was then purged with Ar gas (80 mL/min) for 30 min. The methanation reaction was performed at 400 °C under a pressure of 3 MPa using a reactant gas mixture composed of H2 (50 vol.%) and CO (50 vol.%) (i.e., a H2/CO ratio of 1.0). The flow rate of the reactant gas mixture was 80 mL/min, corresponding to a gas hourly space velocity (GHSV) of 4800 h−1. The composition of the gaseous reaction products was analyzed using an HP 6890 Series II gas chromatograph equipped with a packed column (Carbosphere®) and a thermal conductivity detector. As a measure of the catalytic activity of MoS2, the CO conversion was calculated using Equation (2) under the assumption that the mass balance is satisfied by 100%.
where ni is the number of carbon atoms in product i, Vi is the volume fraction of product i, and VCO is the volume fraction of carbon monoxide in the reactant gas.
CO conversion (%) = (∑niVi/VCO) × 100
4. Conclusions
MoS2 was synthesized from ATTM as a precursor using a high-pressure hydrothermal method at various pH values. The MoS2 sample prepared at pH 4.5 consisted of aggregates of irregular particles. However, increasing the pH from 4.5 to 9.5 resulted in the formation of flower-like MoS2 particles through the agglomeration of fine nanoflakes with mesopores. Based on the XRD and TEM results, hydrothermal synthesis at a pH of 9.5 could improve the crystallinity of MoS2 by enhancing the stacking of the (0 0 2) lattice planes and increasing their lateral length. The XPS spectra confirmed that the surface Mo and S species mostly existed as Mo4+ and S2− in the form of MoS2. However, the sample prepared at pH 4.5 contained a large amount of Mo5+ in the form of Mo2S5 and fewer sulfate species, which led to very low CO conversion during the methanation reaction. By contrast, the high CO conversion over the samples prepared at pH 7.0 and 9.5 exhibited a low concentration of Mo5+ species and the presence of sulfate species that might have created sulfur vacancies that facilitated methanation. Therefore, it was concluded that using the precursor solution with pH 9.5 for hydrothermal synthesis could promote the development of MoS2 with a flower-like morphology and the decomposition of ATTM to generate active sites for CO methanation.
Author Contributions
Conceptualization, S.-S.K.; data curation, S.-J.L. and S.-Y.P.; funding acquisition, S.-J.L.; investigation, Y.-S.S.; methodology, Y.-S.S.; project administration, S.-J.L.; resources, Y.-S.S.; supervision, J.-H.C. and S.-Y.P.; validation, J.-H.C., S.-S.K. and S.-Y.P.; visualization, S.-J.L.; writing—original draft, Y.-S.S.; writing—review and editing, S.-J.L. All authors have read and agreed to the published version of the manuscript.
Funding
This research was funded by the Ministry of Environment of the Republic of Korea, grant number 2019002740003.
Institutional Review Board Statement
Not applicable.
Informed Consent Statement
Not applicable.
Data Availability Statement
Not applicable.
Acknowledgments
We acknowledge financial support from the Household Waste Recycling Technology Development Project (2019002740003) funded by the Ministry of Environment of the Republic of Korea.
Conflicts of Interest
The authors declare no conflict of interest.
References
- Wang, Q.; Kalantar-Zadeh, K.; Kis, A.; Coleman, J.N.; Strano, M.S. Electronics and optoelectronics of two-dimensional transition metal dichalcogenides. Nat. Nanotechnol. 2012, 7, 699–712. [Google Scholar] [CrossRef]
- Gupta, D.; Chauhan, V.; Kumar, R. A comprehensive review on synthesis and applications of molybdenum disulfide (MoS2) material: Past and recent developments. Inorg. Chem. Commun. 2020, 121, 108200. [Google Scholar] [CrossRef]
- Krishnan, U.; Kaur, M.; Singh, K.; Kumar, M.; Kumar, A. A synoptic review of MoS2: Synthesis to applications. Superlattice Microst. 2019, 128, 274–297. [Google Scholar] [CrossRef]
- Tye, C.T.; Smith, K.J. Catalytic activity of exfoliated MoS2 in hydrodesulfurization, hydrodenitrogenation and hydrogenation reactions. Top. Catal. 2006, 37, 129–135. [Google Scholar] [CrossRef]
- Rivera-Muñoz, E.; Lardizabal, D.; Alonso, G.; Aguilar, A.; Siadati, M.H.; Chianelli, R.R. Silica Gel- and MCM-41-supported MoS2 catalysts for HDS reactions. Catal. Lett. 2003, 85, 147–151. [Google Scholar] [CrossRef]
- Jian, M.; Prins, R. The effect of phosphorus on the HDN reaction of piperidine, decahydroquinoline and ortho-propylaniline over Ni-MoS2/Al2O3 catalysts. Catal. Lett. 1995, 35, 193–203. [Google Scholar] [CrossRef]
- Lee, J.S.; Kim, S.; Lee, K.H.; Nam, I.-S.; Chung, J.S.; Kim, Y.G.; Woo, H.C. Role of alkali promoters in K/MoS2 catalysts for CO-H2 reactions. Appl. Catal. A 1994, 110, 11–25. [Google Scholar] [CrossRef]
- Youchang, X.; Naasz, B.N.; Somorjai, G.A. Alcohol synthesis from Co and H2 over molybdenum sulfide. The effect of pressure and promotion by potassium carbonate. Appl. Catal. A 1986, 27, 233–241. [Google Scholar] [CrossRef]
- Chen, J.; Kuriyama, N.; Yuan, H.; Takeshita, H.T.; Sakai, T. Electrochemical hydrogen storage in MoS2 nanotubes. J. Am. Chem. Soc. 2001, 123, 11813–11814. [Google Scholar] [CrossRef]
- Li, X.-L.; Li, Y.-D. MoS2 nanostructures: synthesis and electrochemical Mg2+ intercalation. J. Phys. Chem. B 2004, 108, 13893–13900. [Google Scholar] [CrossRef]
- Wang, Q.; Li, J. Facilitated lithium storage in MoS2 overlayers supported on coaxial carbon nanotubes. J. Phys. Chem. C 2007, 111, 1675–1682. [Google Scholar] [CrossRef]
- Du, G.; Guo, Z.; Wang, S.; Zeng, R.; Chen, Z.; Liu, H. Superior stability and high capacity of restacked molybdenum disulfide as anode material for lithium ion batteries. Chem. Commun. 2010, 46, 1106–1108. [Google Scholar] [CrossRef]
- Rapoport, L.; Bilik, Y.; Feldman, Y.; Homyonfer, M.; Cohen, S.R.; Tenne, R. Hollow nanoparticles of WS2 as potential solid-state lubricants. Nature 1997, 387, 791–793. [Google Scholar] [CrossRef]
- Chen, W.X.; Tu, J.P.; Xu, Z.D.; Tenne, R.; Rosenstveig, R.; Chen, W.L.; Gan, H.Y. Wear and friction of Ni-P electroless composite coating including inorganic fullerene-WS2 nanoparticles. Adv. Eng. Mater. 2002, 4, 686–690. [Google Scholar] [CrossRef]
- David, L.; Bhandavat, R.; Singh, G. MoS2/graphene composite paper for sodium-ion battery electrodes. ACS Nano 2014, 8, 1759–1770. [Google Scholar] [CrossRef] [Green Version]
- Yang, F.; Feng, X.; Glans, P.-A.; Guo, J. MoS2 for beyond lithium-ion batteries. APL Mater. 2021, 9, 050903. [Google Scholar] [CrossRef]
- Nawz, T.; Safdar, A.; Hussain, M.; Lee, D.S.; Siyar, M. Graphene to Advanced MoS2: A Review of structure, synthesis, and optoelectronic device application. Crystals 2020, 10, 902. [Google Scholar] [CrossRef]
- Samy, O.; Zeng, S.; Birowosuto, M.D.; Moutaouakil, A.E. A Review on MoS2 properties, synthesis, sensing applications and challenges. Crystals 2021, 11, 355. [Google Scholar] [CrossRef]
- Zhang, C.; Wu, H.B.; Guo, Z.; Lou, X.W. Facile synthesis of carbon-coated MoS2 nanorods with enhanced lithium storage properties. Electrochem. Commum. 2012, 20, 7–10. [Google Scholar] [CrossRef]
- Remskar, M.; Mrzel, A.; Virsek, M.; Godec, M.; Krause, M.; Kolitsch, A.; Singh, A.; Seabaugh, A. The MoS2 nanotubes with defect-controlled electric properties. Nanoscale Res. Lett. 2011, 6, 26. [Google Scholar] [CrossRef] [Green Version]
- Li, Y.B.; Bando, Y.; Golberg, D. MoS2 nanoflowers and their field-emission properties. Appl. Phys. Lett. 2003, 82, 1962–1964. [Google Scholar] [CrossRef]
- Wiesel, I.; Popovitz-Biro, R.; Tenne, R. Encapsulation of Mo2C in MoS2 inorganic fullerene-like nanoparticles and nanotubes. Nanoscale 2013, 5, 1499–1502. [Google Scholar] [CrossRef] [Green Version]
- Ramos, M.A.; Correa, V.; Torres, B.; Flores, S.; Farias Mancilla, J.R.; Chianelli, R.R. Spherical MoS2 micro particles and their surface dispersion due to addition of cobalt promoters. Rev. Mex. Fis. 2011, 57, 220–223. [Google Scholar]
- Tian, Y.; Zhao, X.; Shen, L.; Meng, F.; Tang, L.; Deng, Y.; Wang, Z. Synthesis of amorphous MoS2 nanospheres by hydrothermal reaction. Mater. Lett. 2006, 60, 527–529. [Google Scholar] [CrossRef]
- Cheon, J.; Gozum, J.E.; Girolami, G.S. Chemical vapor deposition of MoS2 and TiS2 films from the metal−organic precursors Mo(S-t-Bu)4 and Ti(S-t-Bu)4. Chem. Mater. 1997, 9, 1847–1853. [Google Scholar] [CrossRef]
- Li, Q.; Newberg, J.T.; Walter, E.C.; Hemminger, J.C.; Penner, R.M. Polycrystalline molybdenum disulfide (2H−MoS2) nano- and microribbons by electrochemical/chemical synthesis. Nano Lett. 2004, 4, 277–281. [Google Scholar] [CrossRef]
- Ma, L.; Xu, L.-M.; Xu, X.-Y.; Luo, Y.-L.; Chen, W.-X. Synthesis and characterization of flower-like MoS2 microspheres by a facile hydrothermal route. Mater. Lett. 2009, 63, 2022–2024. [Google Scholar] [CrossRef]
- Wei, R.; Yang, H.; Du, K.; Fu, W.; Tian, Y.; Yu, Q.; Liu, S.; Li, M.; Zou, G. A facile method to prepare MoS2 with nanoflower-like morphology. Mater. Chem. Phys. 2008, 108, 188–191. [Google Scholar] [CrossRef]
- Ma, L.; Chen, W.-X.; Li, H.; Zheng, Y.-F.; Xu, Z.-D. Ionic liquid-assisted hydrothermal synthesis of MoS2 microspheres. Mater. Lett. 2008, 62, 797–799. [Google Scholar] [CrossRef]
- Ma, L.; Chen, W.-X.; Li, H.; Xu, Z.-D. Synthesis and characterization of MoS2 nanostructures with different morphologies via an ionic liquid-assisted hydrothermal route. Mater. Chem. Phys. 2009, 116, 400–405. [Google Scholar] [CrossRef]
- Xiong, Q.Q.; Ji, Z.G. Controllable growth of MoS2/C flower-like microspheres with enhanced electrochemical performance for lithium ion batteries. J. Alloys Compd. 2016, 673, 215–219. [Google Scholar] [CrossRef]
- Liu, J.; Wang, E.; Lv, J.; Li, Z.; Wang, B.; Ma, X.; Qin, S.; Sun, Q. Investigation of sulfur-resistant, highly active unsupported MoS2 catalysts for synthetic natural gas production from CO methanation. Fuel Process. Technol. 2013, 110, 249–257. [Google Scholar] [CrossRef]
- Alonso, G.; Berhault, G.; Aguilar, A.; Collins, V.; Ornelas, C.; Fuentes, S.; Chianelli, R.R. Characterization and HDS activity of mesoporous MoS2 catalysts prepared by in situ activation of tetraalkylammonium thiomolybdates. J. Catal. 2002, 208, 359–369. [Google Scholar] [CrossRef]
- Alonso, G.; Del Valle, M.; Cruz, J.; Petranovskii, V.; Licea-Claverie, A.; Fuentes, S. Preparation of MoS2 catalysts by in situ decomposition of tetraalkylammonium thiomolybdates. Catal. Today 1998, 43, 117–122. [Google Scholar] [CrossRef]
- Choi, J.-M.; Kim, S.-H.; Lee, S.-J.; Kim, S.-S. Effects of pressure and temperature in hydrothermal preparation of MoS2 catalyst for methanation reaction. Catal. Lett. 2018, 148, 1803–1814. [Google Scholar] [CrossRef]
- Sen, U.K.; Mitra, S. High-rate and high-energy-density lithium-ion battery anode containing 2D MoS2 nanowall and cellulose binder. ACS Appl. Mater. Interfaces 2013, 5, 1240–1247. [Google Scholar] [CrossRef]
- Poh, C.K.; Onga, S.W.D.; Du, Y.H.; Kamata, H.; Choong, K.S.C.; Chang, J.; Izumi, Y.; Nariai, K.; Mizukami, N.; Chen, L.; et al. Direct methanation with supported MoS2 nano-flakes: Relationship between structure and activity. Catal. Today 2020, 342, 21–31. [Google Scholar] [CrossRef]
- Zhang, J.; Wang, Y.; Lin, Z.; Huang, F. Formation and self-assembly of cadmium hydroxide nanoplates in molten composite-hydroxide solution. Cryst. Growth Des. 2010, 10, 4285–4291. [Google Scholar] [CrossRef]
- Ge, L.; Han, C.; Xiao, X.; Guo, L. Synthesis and characterization of composite visible light active photocatalysts MoS2–g-C3N4 with enhanced hydrogen evolution activity. Int. J. Hydrogen Energy 2013, 38, 6960–6969. [Google Scholar] [CrossRef]
- Chianelli, R.R.; Prestridge, E.B.; Pecoraro, T.A.; Deneufville, J.P. Molybdenum Disulfide in the poorly crystalline “rag” structure. Science 1979, 203, 1105–1107. [Google Scholar] [CrossRef]
- Liang, K.S.; Chianelli, R.R.; Chien, F.Z.; Moss, S.C. Structure of poorly crystalline MoS2-A modeling study. J. Non-Cryst. Solids 1986, 79, 251–273. [Google Scholar] [CrossRef]
- Daage, M.; Chianelli, R.R. Structure-function relations in molybdenum sulfide catalysts: The “rim-edge” model. J. Catal. 1994, 149, 414–427. [Google Scholar] [CrossRef]
- Sing, K.S.W.; Everett, D.H.; Haul, R.A.W.; Moscou, L.; Pierotti, R.A.; Rouquérol, J.; Siemieniewska, T. Reporting physisorption data for gas/solid systems with special reference to the determination of surface area and porosity. Pure Appl. Chem. 1985, 57, 603–619. [Google Scholar] [CrossRef]
- Wang, H.W.; Skeldon, P.; Thompson, G.E. XPS studies of MoS2 formation from ammonium tetrathiomolybdate solutions. Surf. Coat. Technol. 1997, 91, 200–207. [Google Scholar] [CrossRef]
- Wang, H.W.; Skeldon, P.; Thompson, G.E. Thermogravimetric—Differential thermal analysis of the solid-state decomposition of ammonium tetrathiomolybdate during heating in argon. J. Mater. Sci. 1998, 33, 3079–3083. [Google Scholar] [CrossRef]
- Topsøe, H.; Clausen, B.S.; Massoth, F.E. Hydrotreating Catalysis. In Catalysis. Catalysis–Science and Technology; Anderson, J.R., Boudart, M., Eds.; Springer: Berlin/Heidelberg, Germany, 1996; Volume 11, pp. 1–269. [Google Scholar] [CrossRef]
- Byskov, L.S.; Nørskov, J.K.; Clausen, B.S.; Topsøe, H. DFT Calculations of unpromoted and promoted MoS2-based hydrodesulfurization catalysts. J. Catal. 1999, 187, 109–122. [Google Scholar] [CrossRef]
- Afanasiev, P. On the interpretation of temperature programmed reduction patterns of transition metals sulphides. Appl. Catal. A 2006, 303, 110–115. [Google Scholar] [CrossRef]
- Li, X.S.; Xin, Q.; Guo, X.X.; Grange, P.; Delmon, B. Reversible hydrogen adsorption on MoS2 studied by Temperature-programmed desorption and Temperature-programmed reduction. J. Catal. 1992, 137, 385–393. [Google Scholar] [CrossRef]
- Iwata, Y.; Sato, K.; Yoneda, T.; Miki, Y.; Sugimoto, Y.; Nishijima, A.; Shimada, H. Catalytic functionality of unsupported molybdenum sulfide catalysts prepared with different methods. Catal. Today 1998, 45, 353–359. [Google Scholar] [CrossRef]
- Iwata, Y.; Araki, Y.; Honna, K.; Miki, Y.; Sato, K.; Shimada, H. Hydrogenation active sites of unsupported molybdenum sulfide catalysts for hydroprocessing heavy oils. Catal. Today 2001, 65, 335–341. [Google Scholar] [CrossRef]
Figure 1.
SEM images of MoS2 prepared at (a) pH 4.5; (b) pH 7.0; and (c) pH 9.5.

Figure 2.
XRD patterns of (a) commercial MoS2 and MoS2 samples prepared at (b) pH 4.5; (c) pH 7.0; and (d) pH 9.5.
Figure 2.
XRD patterns of (a) commercial MoS2 and MoS2 samples prepared at (b) pH 4.5; (c) pH 7.0; and (d) pH 9.5.

Figure 3.
HRTEM images of MoS2 prepared at (a) pH 4.5; (b) pH 7.0; and (c) pH 9.5.

Figure 4.
Nitrogen adsorption–desorption isotherms of MoS2 samples prepared at (a) pH 4.5; (b) pH 7.0; and (c) pH 9.5 (The open and filled symbols denote adsorption and desorption, respectively).
Figure 4.
Nitrogen adsorption–desorption isotherms of MoS2 samples prepared at (a) pH 4.5; (b) pH 7.0; and (c) pH 9.5 (The open and filled symbols denote adsorption and desorption, respectively).

Figure 5.
Mo 3d XPS spectra of MoS2 samples prepared at (a) pH 4.5; (b) pH 7.0; and (c) pH 9.5.

Figure 6.
S 2p XPS spectra of MoS2 samples prepared at (a) pH 4.5; (b) pH 7.0; and (c) pH 9.5.

Figure 7.
CO conversion over MoS2 samples prepared at (a) pH 4.5; (b) pH 7.0; and (c) pH 9.5.


Table 1.
Crystalline characteristics of MoS2 samples.
| Catalyst Preparation Conditions | Slab Height (nm) | Number of Stacking Layers | |
|---|---|---|---|
| pH | Temperature (°C) | ||
| 4.5 | 350 | 2.7 ± 0.1 | 4.4 |
| 7.0 | 350 | 2.9 ± 0.1 | 4.8 |
| 9.5 | 350 | 3.3 ± 0.1 | 5.3 |
Table 2.
Pore properties of MoS2 samples.
| Catalyst Preparation Conditions | BET Surface Area (m2/g) | Average Pore Volume (cm3/g) | Average Pore Size (nm) | |
|---|---|---|---|---|
| pH | Temperature (°C) | |||
| 4.5 | 350 | 83.21 | 0.17 | 8.39 |
| 7.0 | 350 | 167.00 | 0.13 | 3.42 |
| 9.5 | 350 | 158.38 | 0.36 | 6.15 |
Publisher’s Note: MDPI stays neutral with regard to jurisdictional claims in published maps and institutional affiliations. |
© 2021 by the authors. Licensee MDPI, Basel, Switzerland. This article is an open access article distributed under the terms and conditions of the Creative Commons Attribution (CC BY) license (https://creativecommons.org/licenses/by/4.0/).
Share and Cite
MDPI and ACS Style
Lee, S.-J.; Son, Y.-S.; Choi, J.-H.; Kim, S.-S.; Park, S.-Y. Morphology and Catalytic Performance of MoS2 Hydrothermally Synthesized at Various pH Values. Catalysts 2021, 11, 1229. https://0-doi-org.brum.beds.ac.uk/10.3390/catal11101229
AMA Style
Lee S-J, Son Y-S, Choi J-H, Kim S-S, Park S-Y. Morphology and Catalytic Performance of MoS2 Hydrothermally Synthesized at Various pH Values. Catalysts. 2021; 11(10):1229. https://0-doi-org.brum.beds.ac.uk/10.3390/catal11101229
Chicago/Turabian StyleLee, Seung-Jae, Yang-Seung Son, Jin-Hoon Choi, Seong-Soo Kim, and Sung-Youl Park. 2021. "Morphology and Catalytic Performance of MoS2 Hydrothermally Synthesized at Various pH Values" Catalysts 11, no. 10: 1229. https://0-doi-org.brum.beds.ac.uk/10.3390/catal11101229
Note that from the first issue of 2016, this journal uses article numbers instead of page numbers. See further details here.