
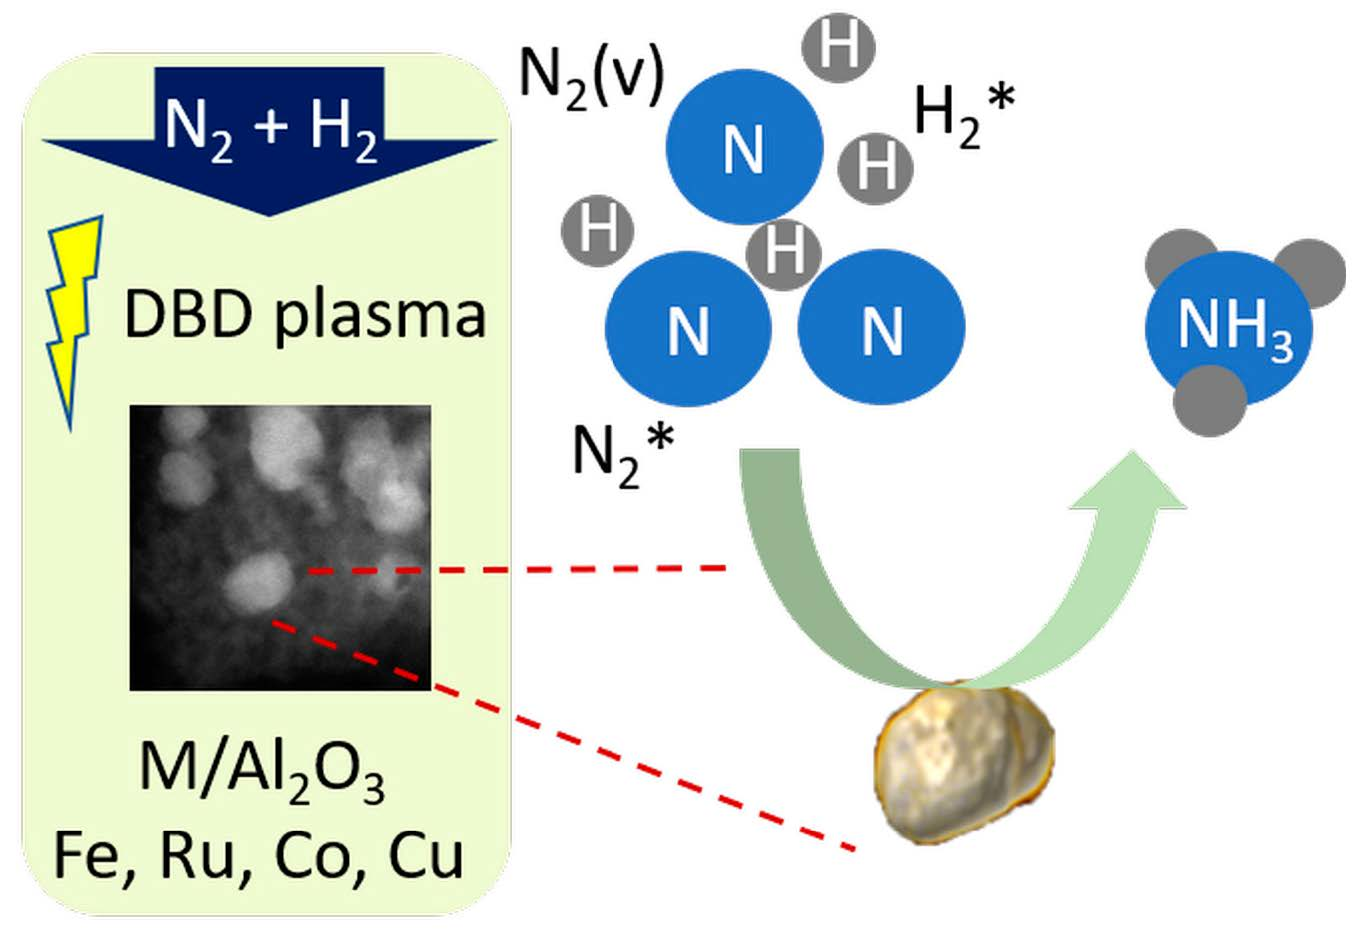
Al2O3-Supported Transition Metals for Plasma-Catalytic NH3 Synthesis in a DBD Plasma: Metal Activity and Insights into Mechanisms

 , , , ,
Abstract
:
1. Introduction
2. Results
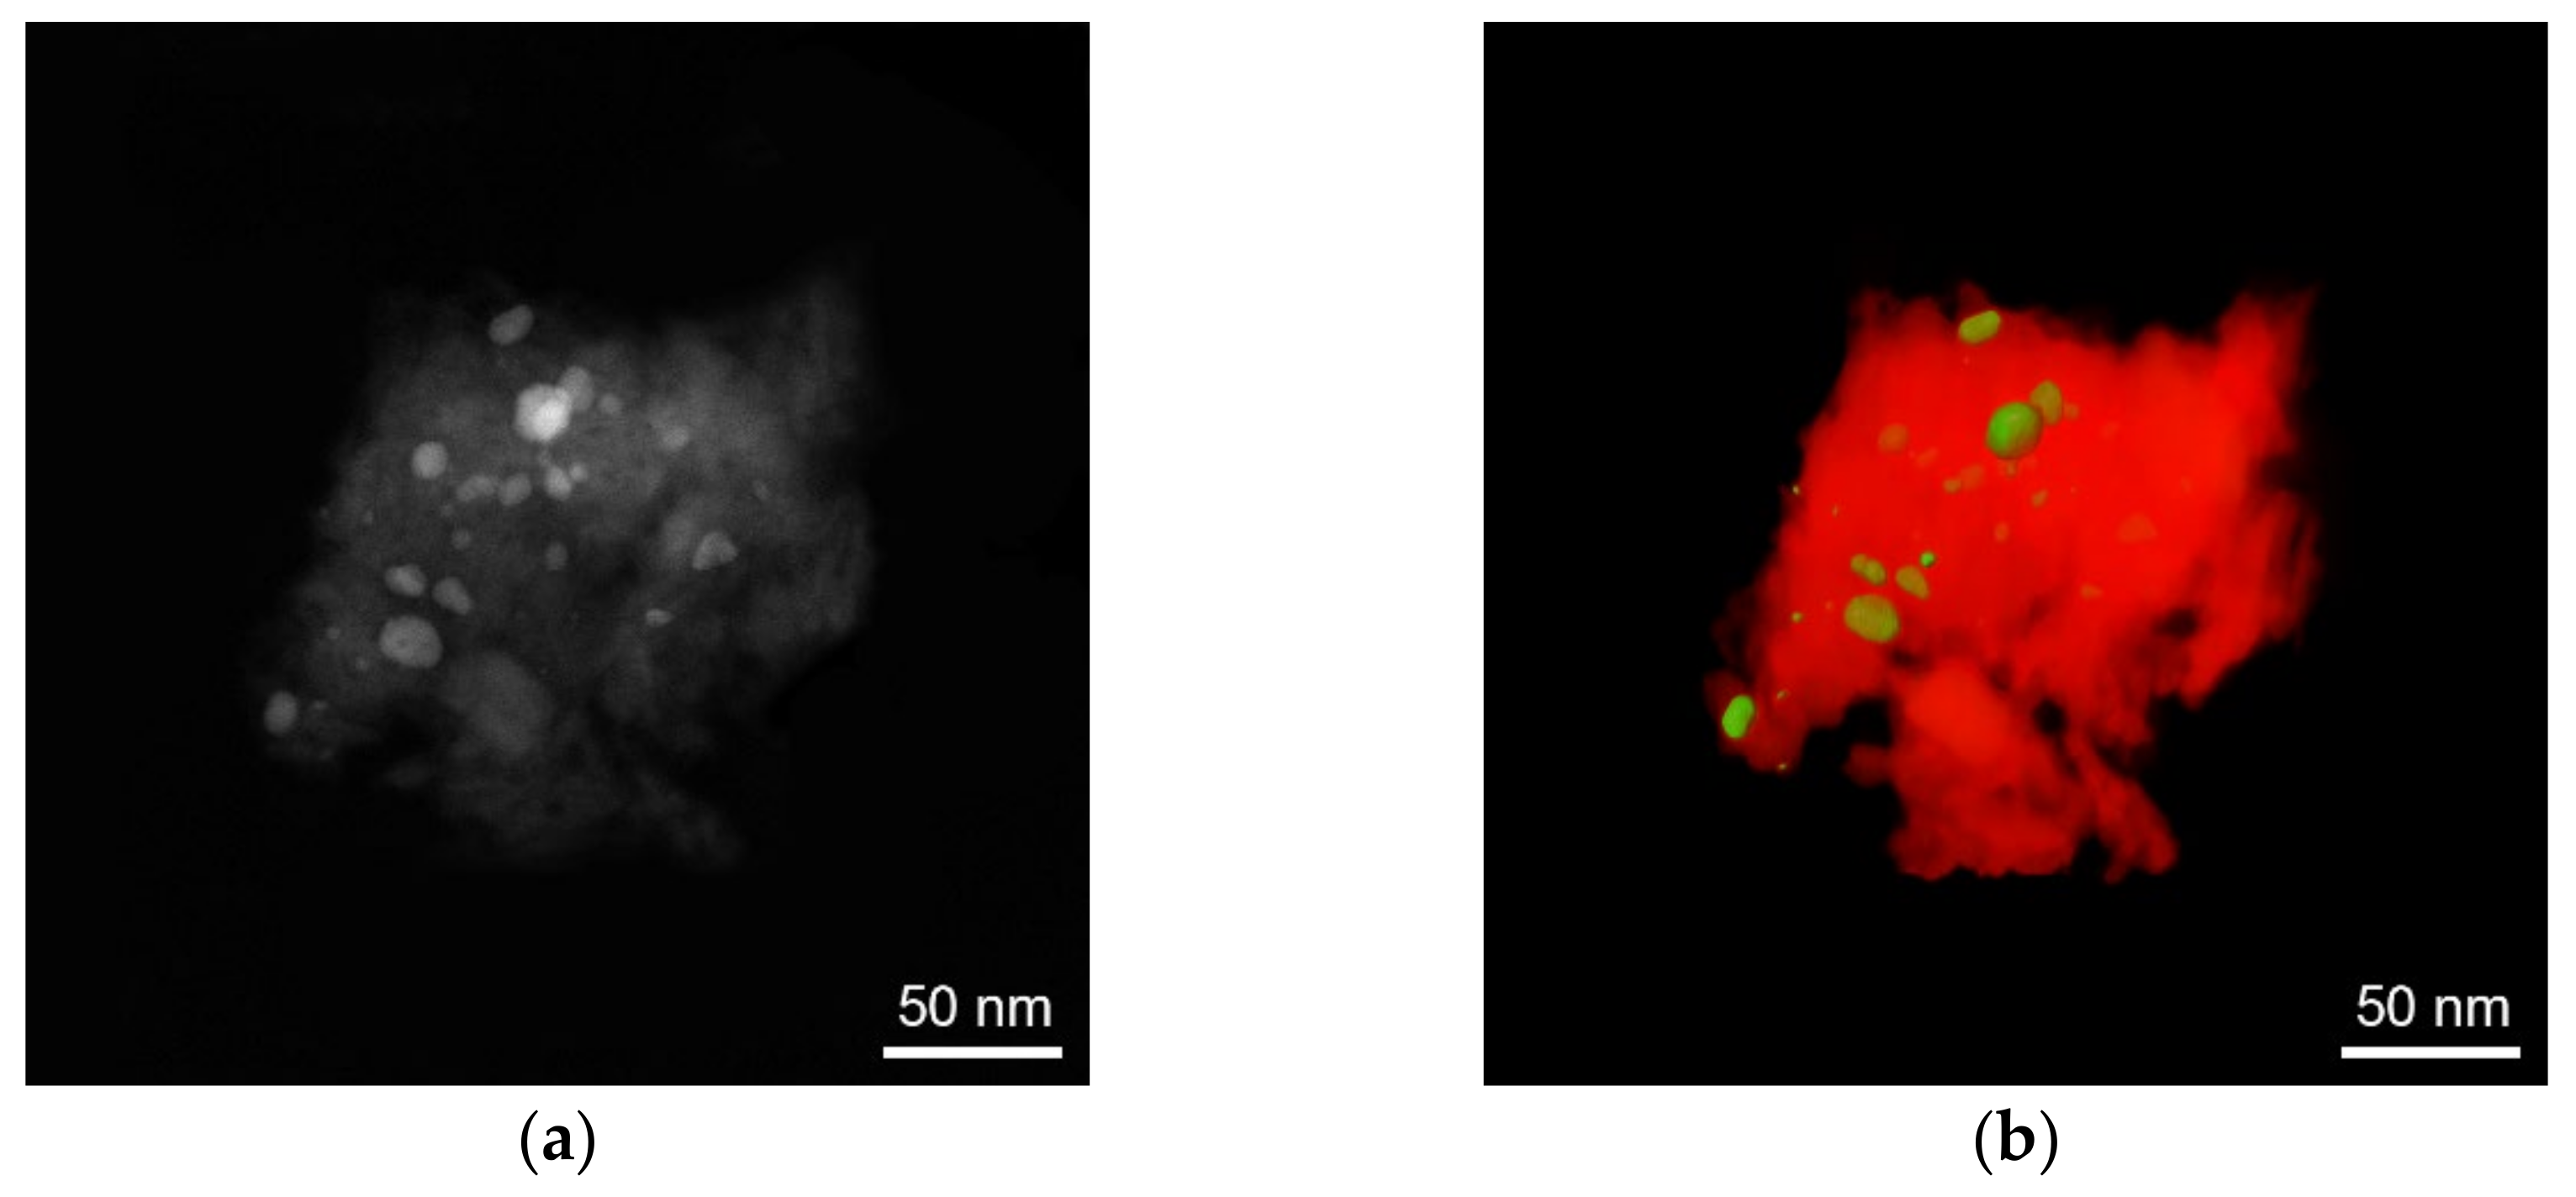
2.1. Catalyst Characterisation
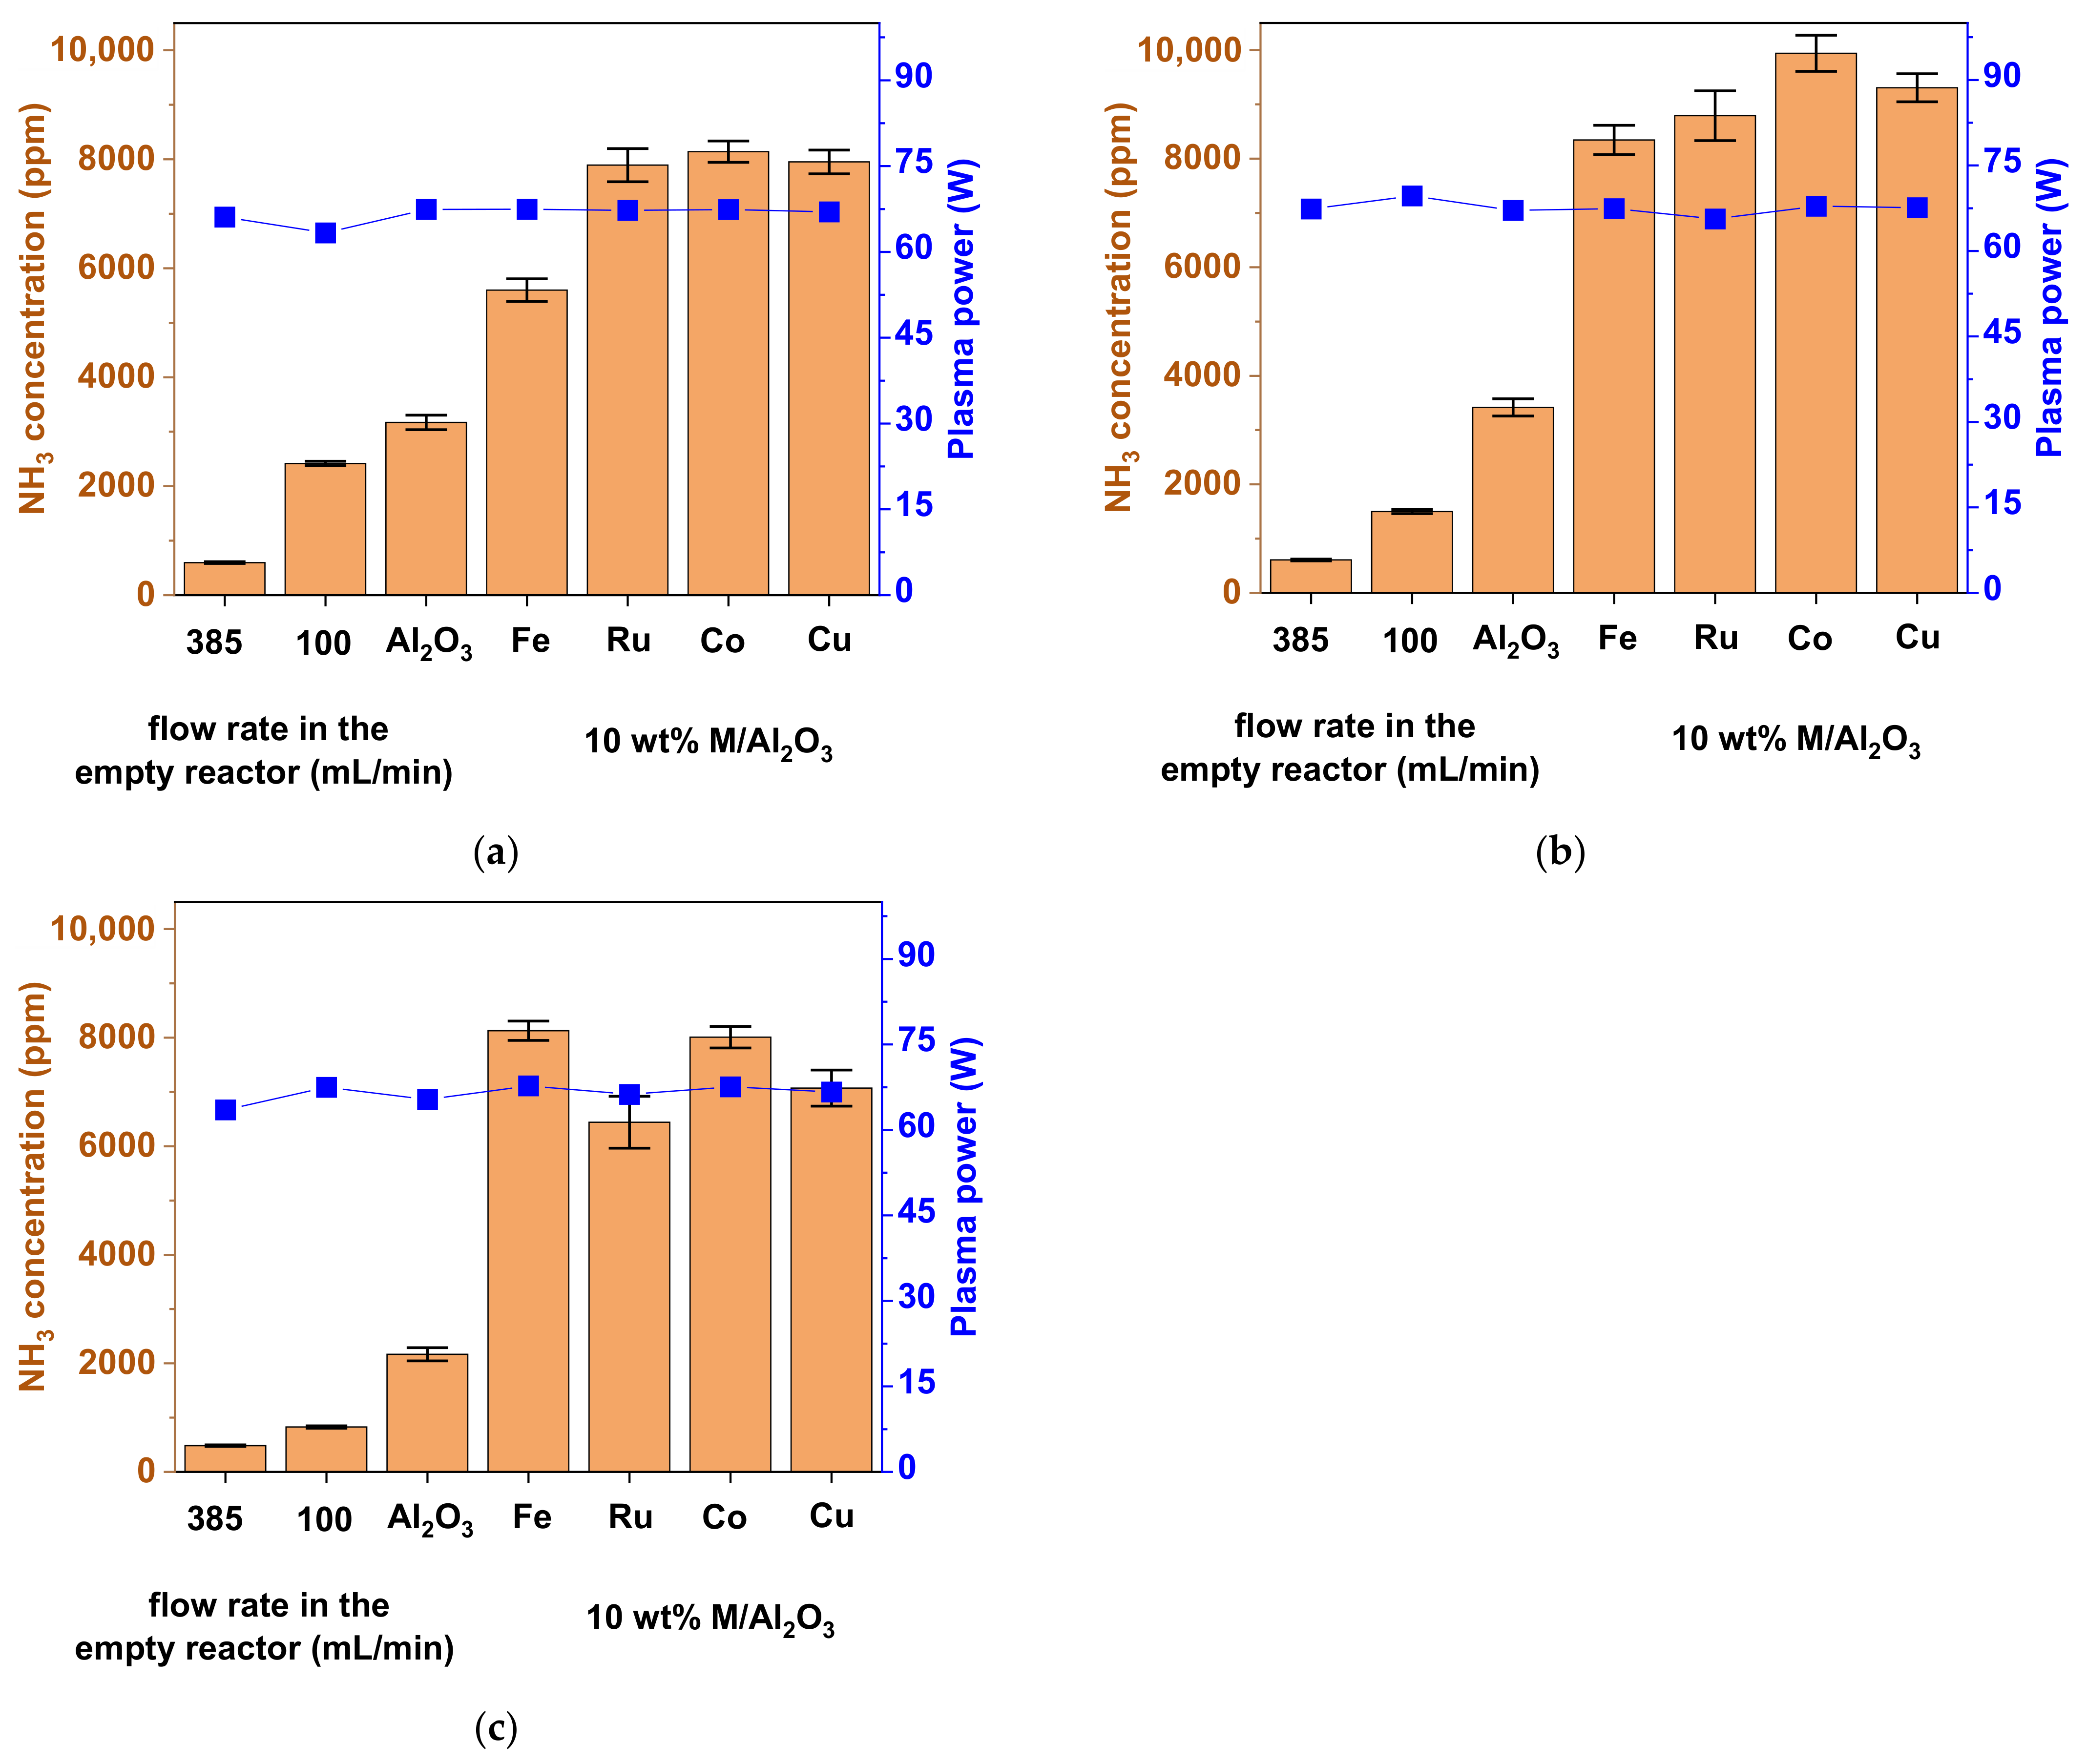
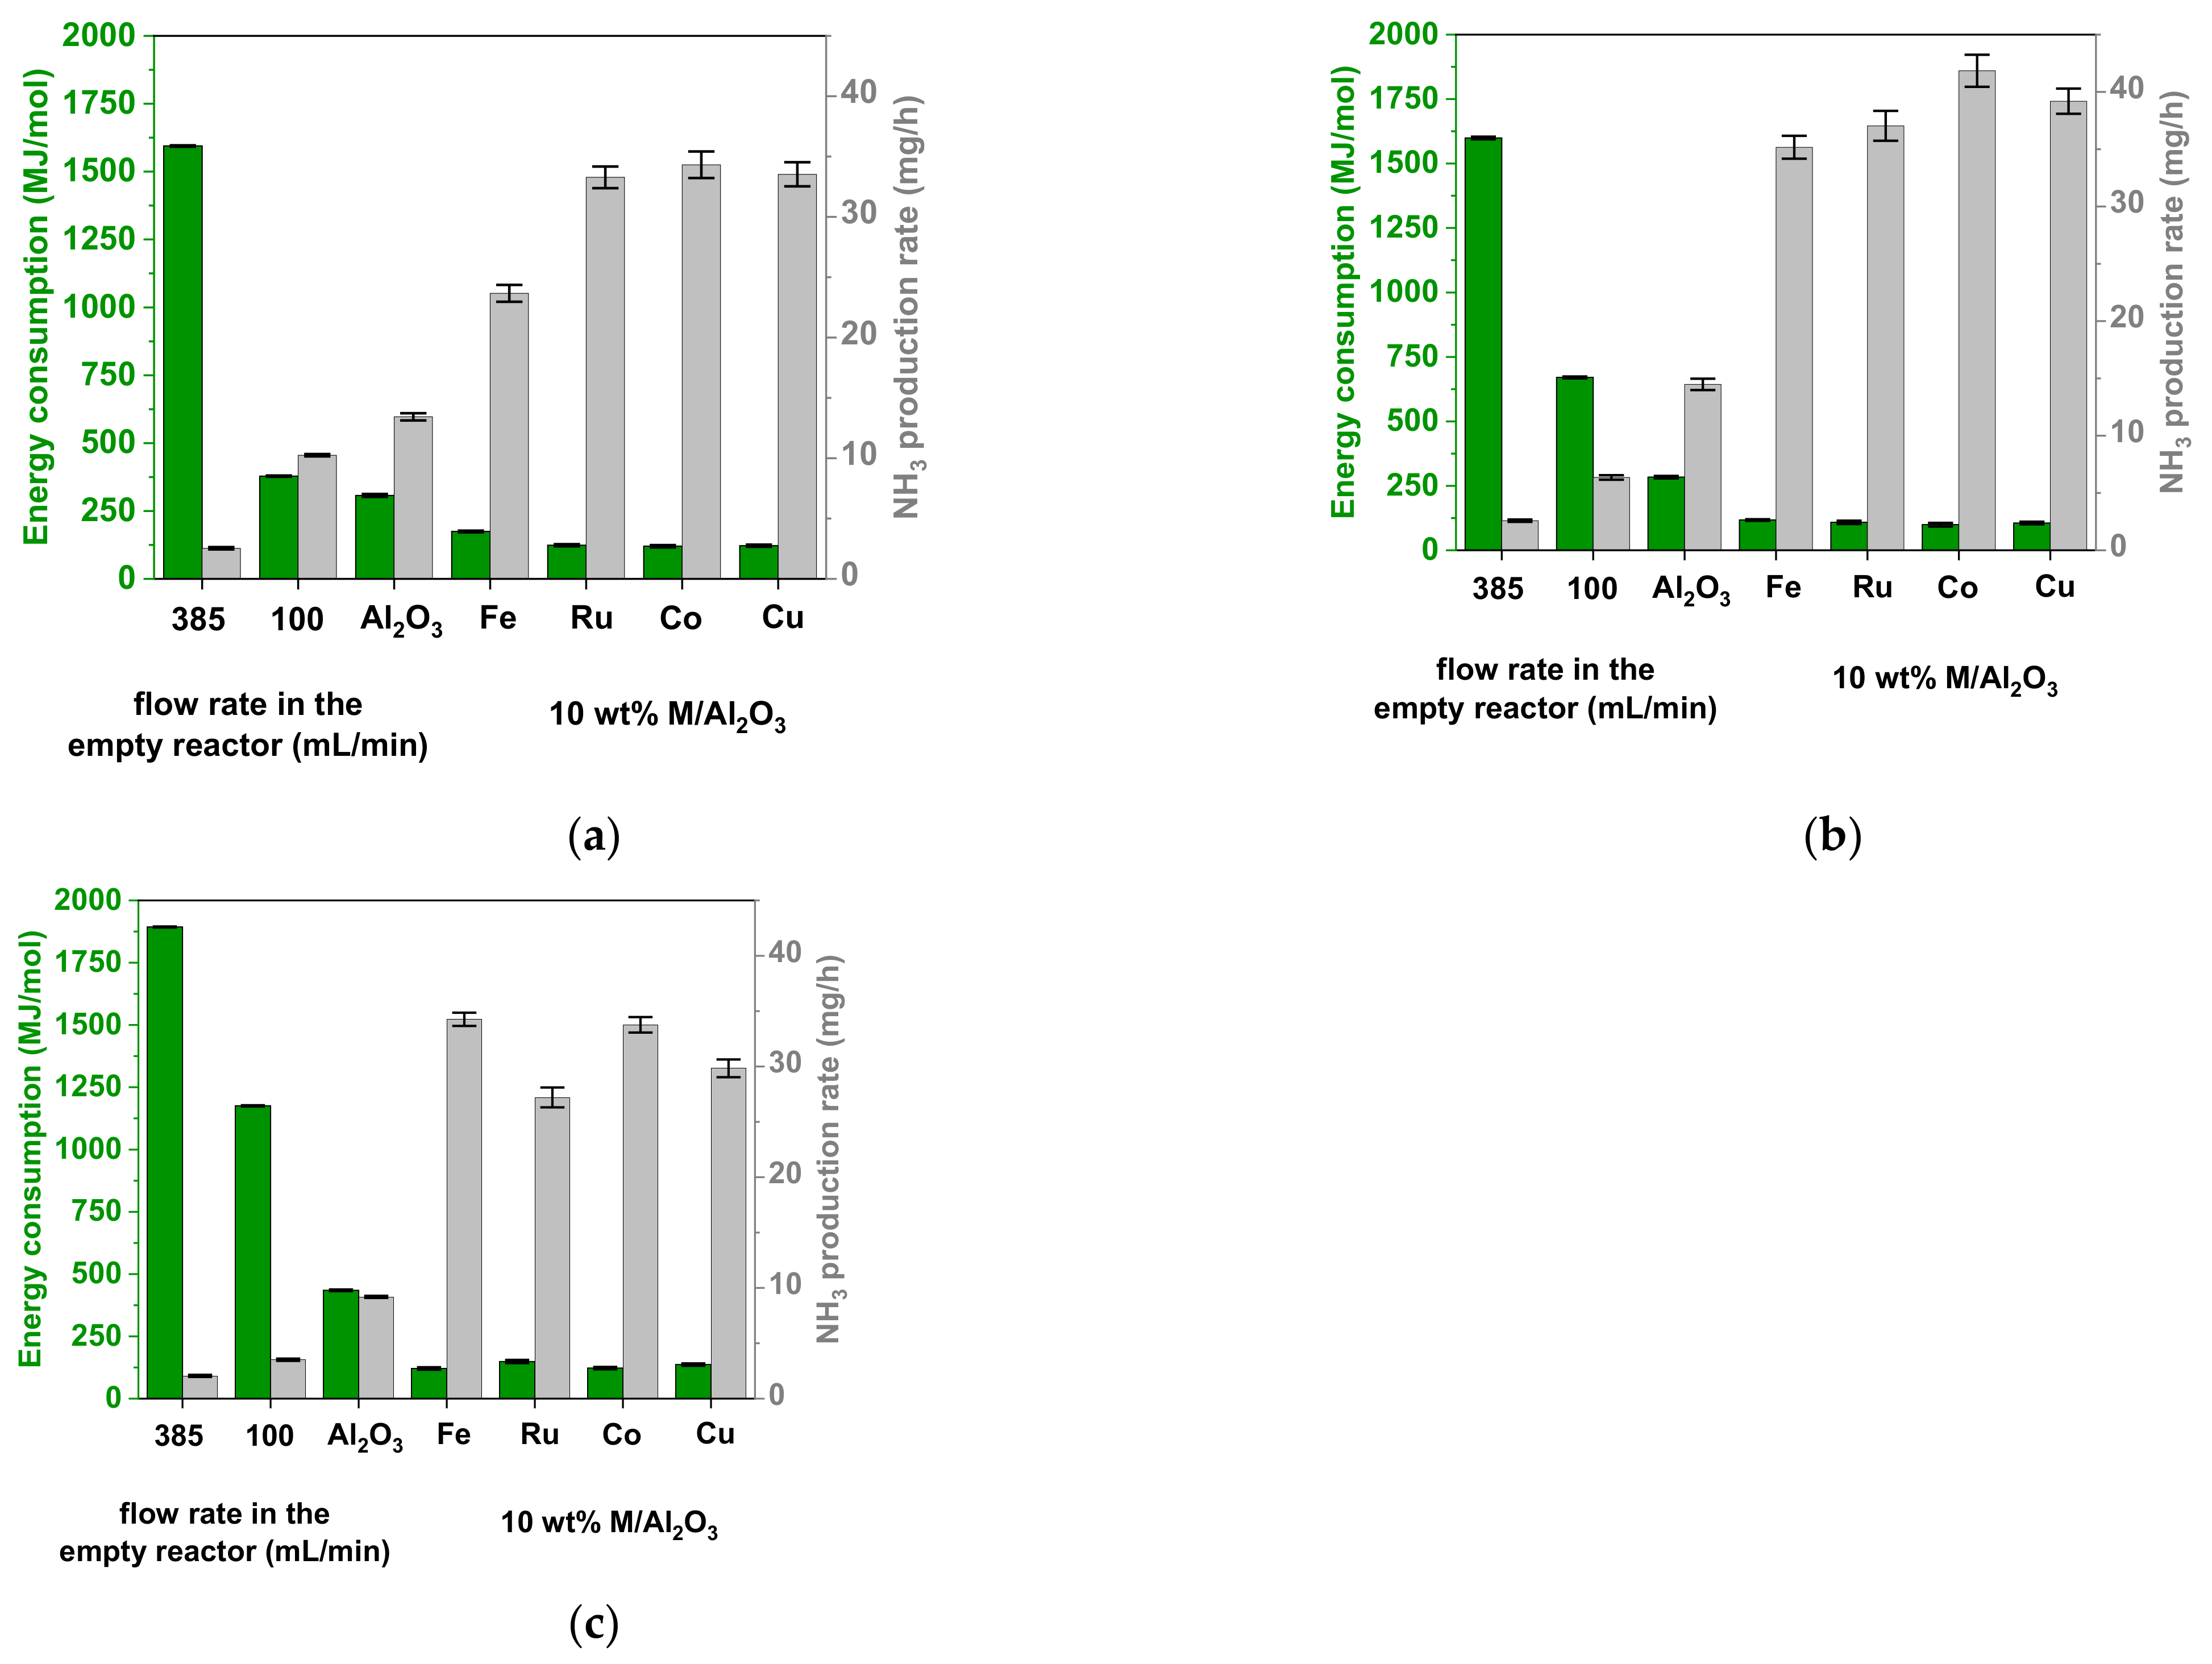
2.2. Plasma-Catalytic NH3 Formation: Performance of the Al2O3-Supported Catalysts
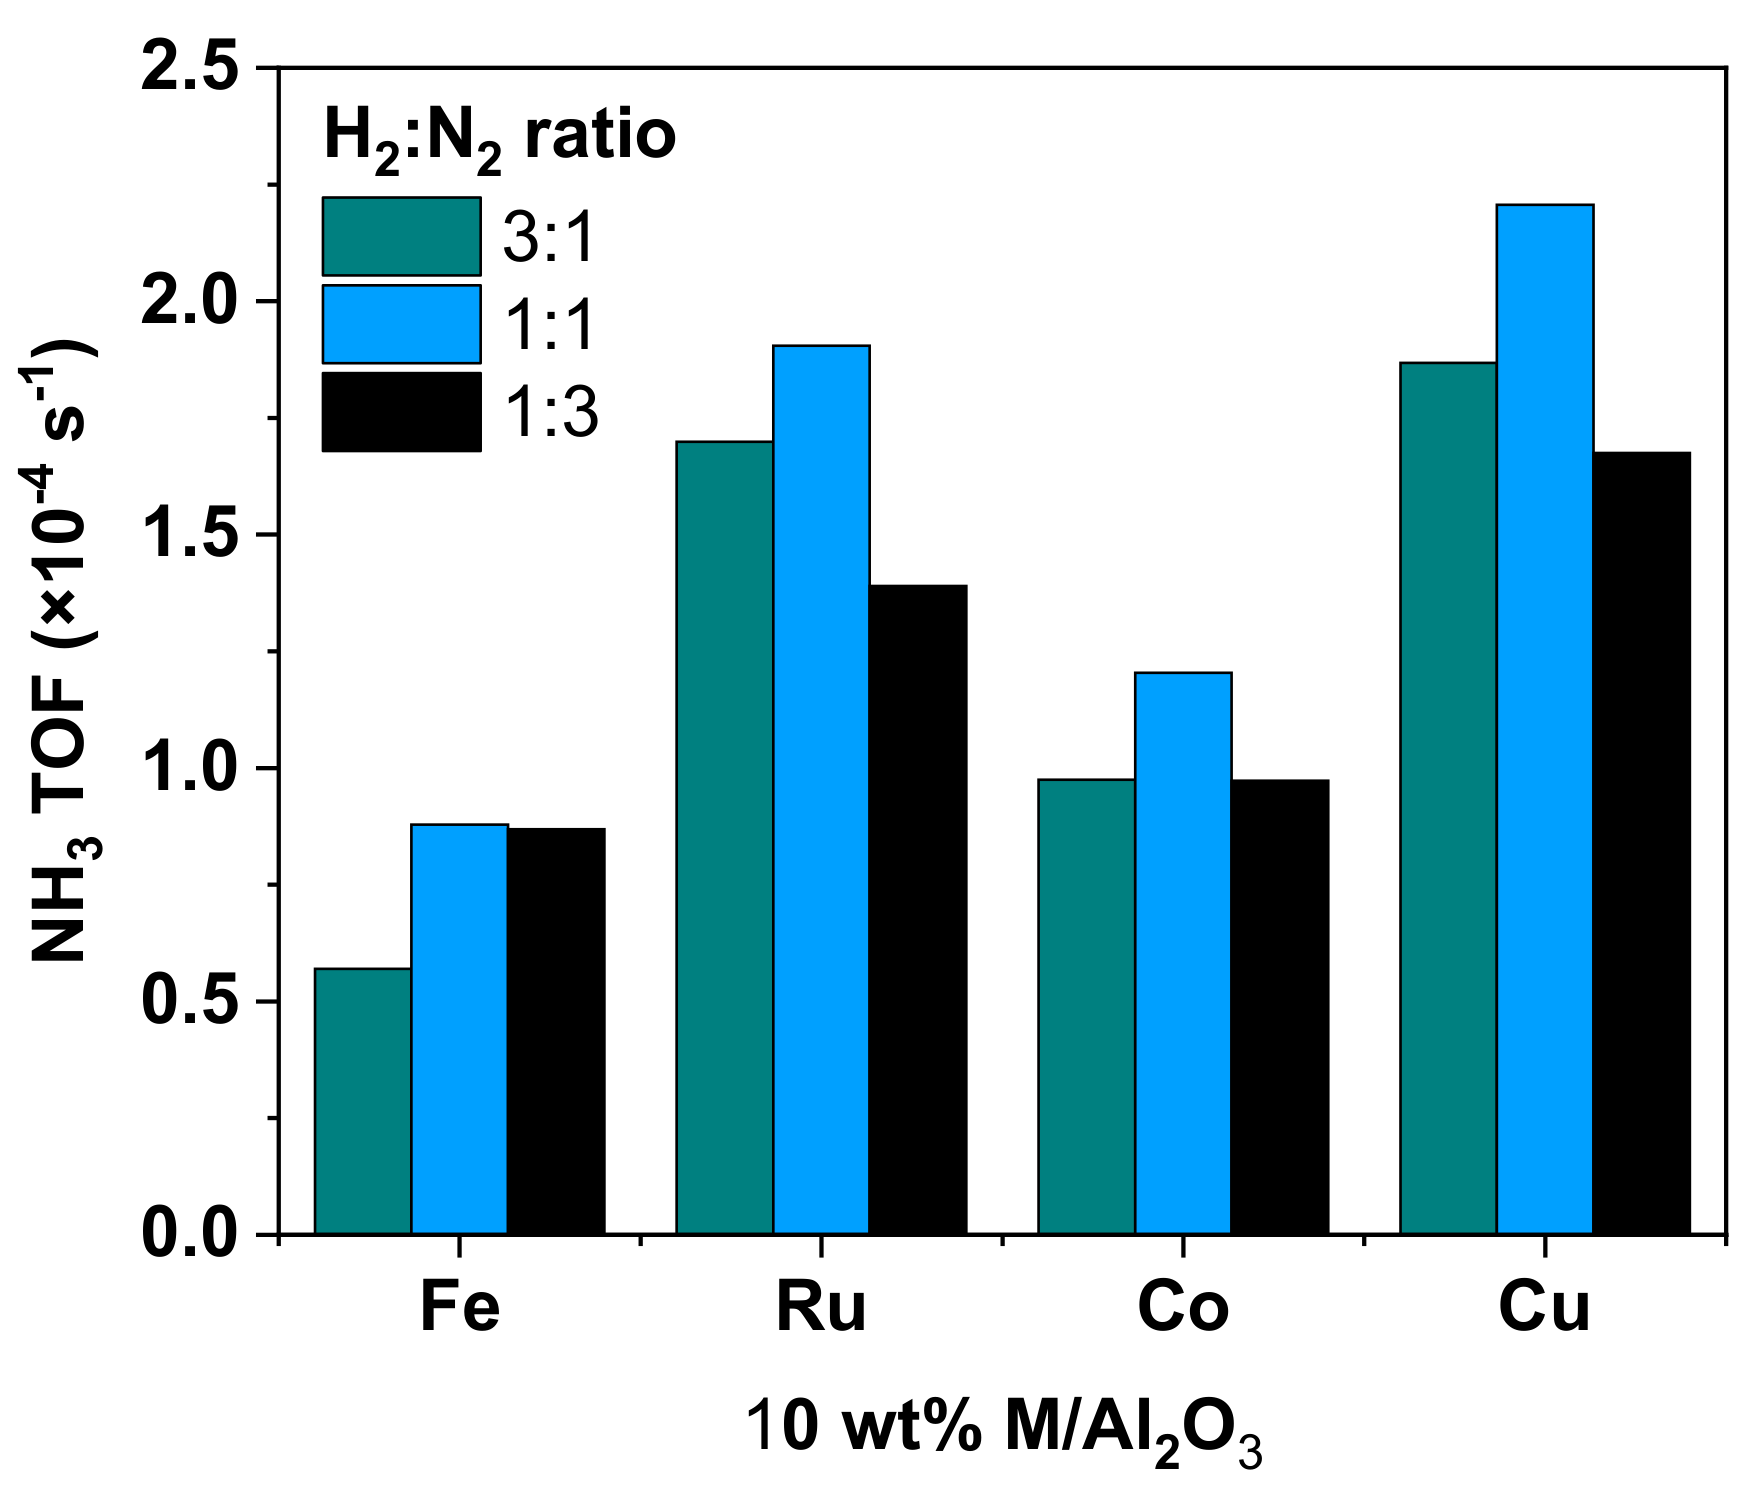
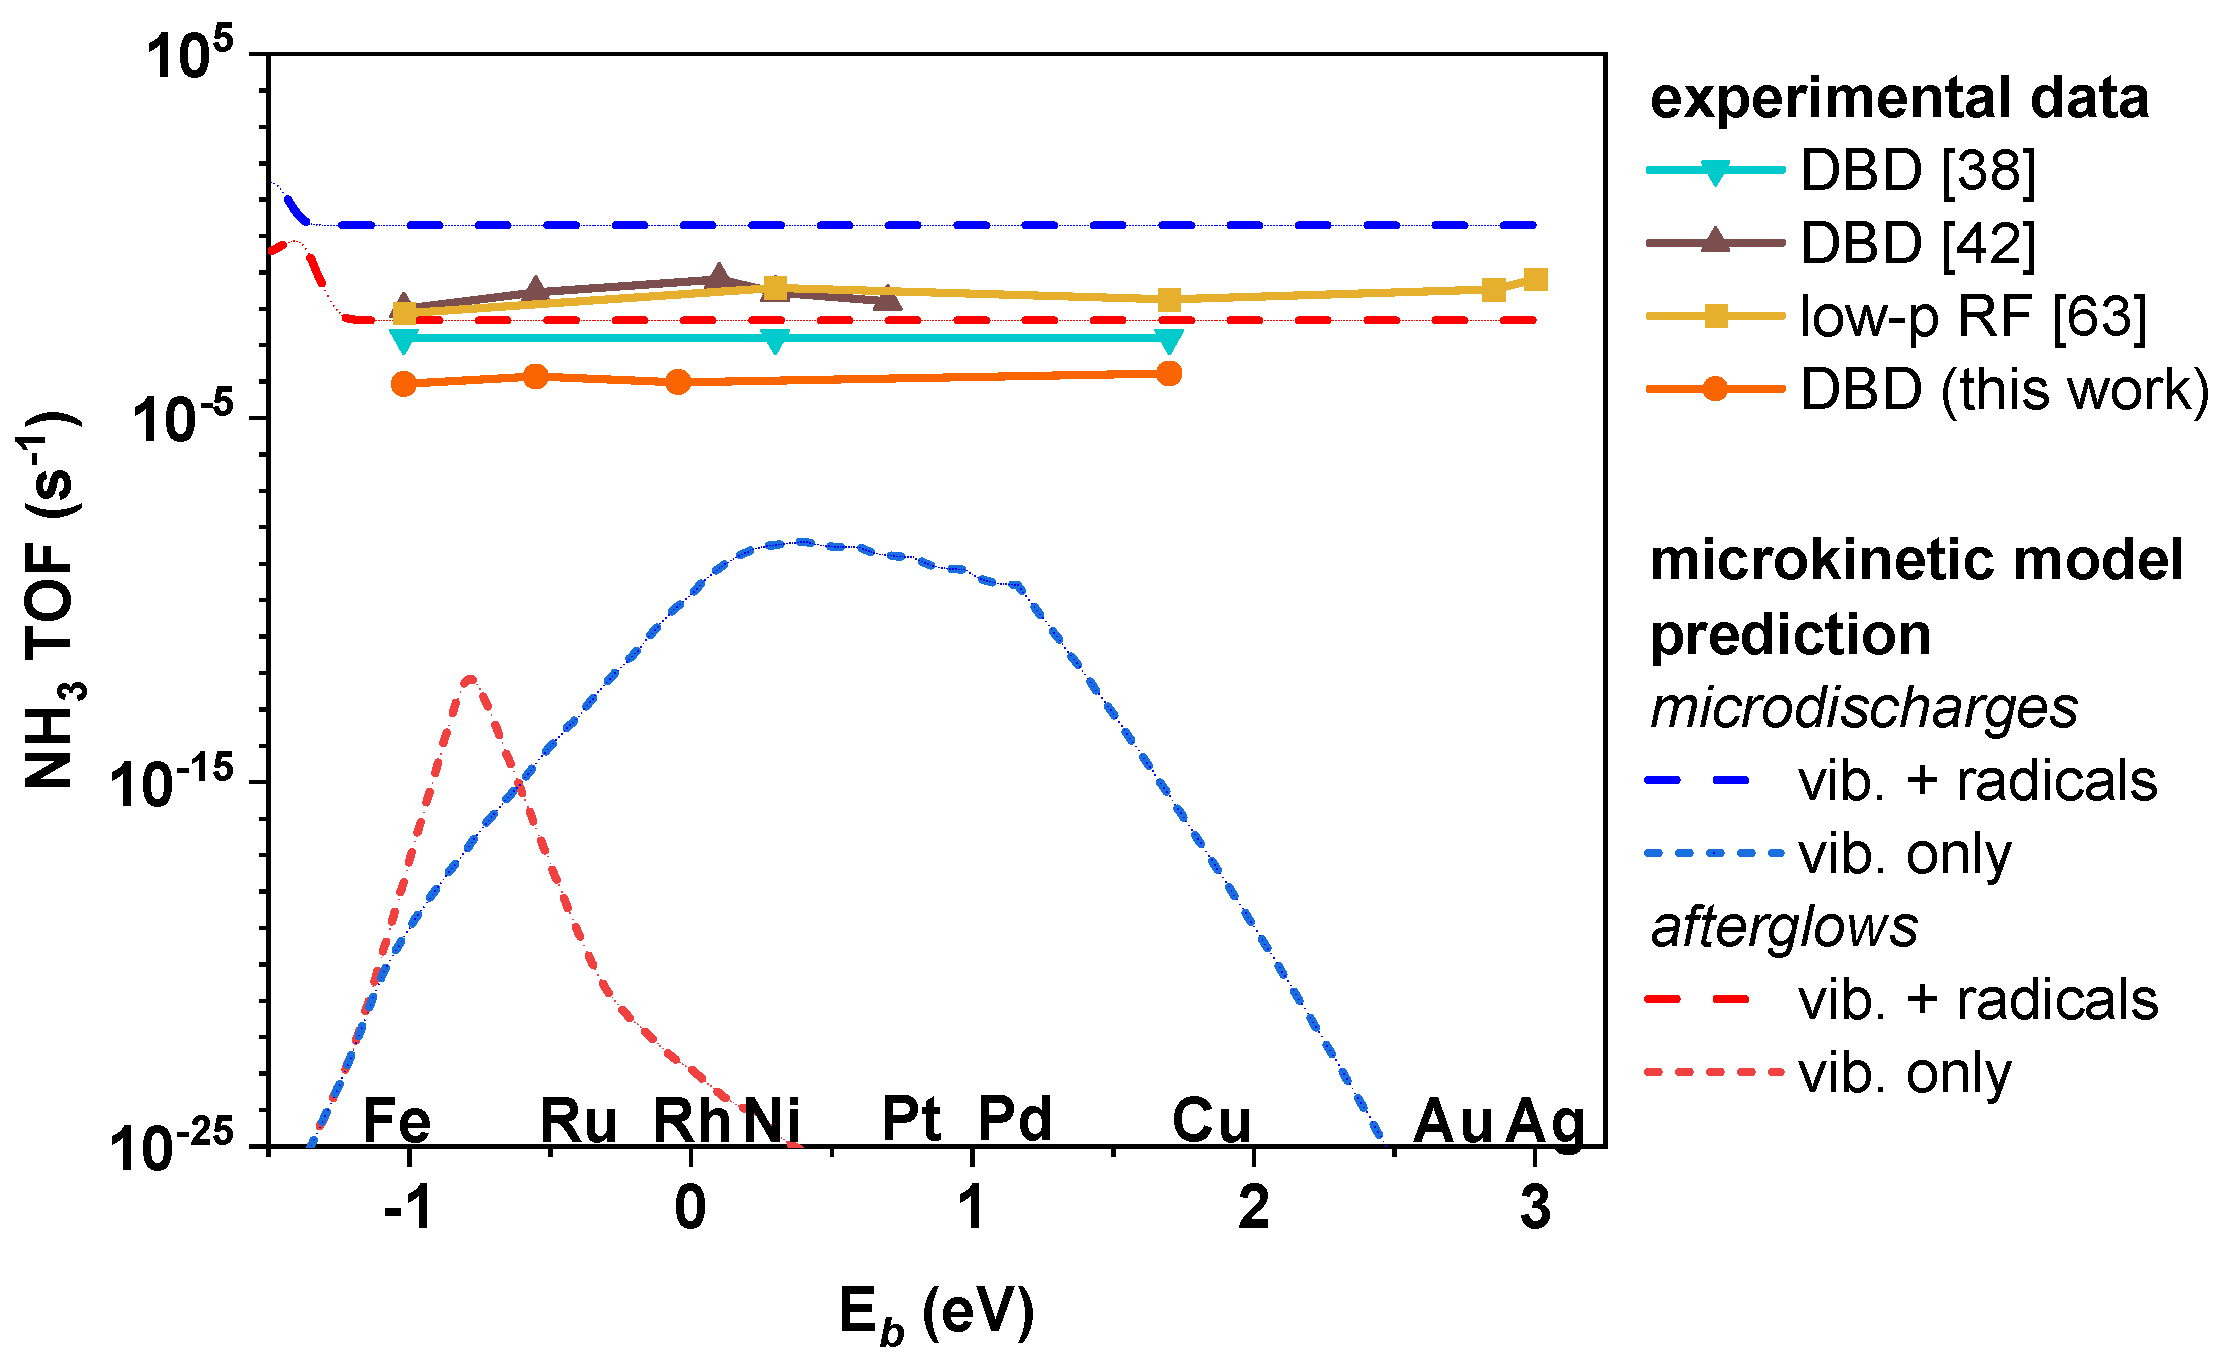
2.3. TOFs and Implications with Respect to Reaction Mechanisms
3. Discussion
4. Materials and Methods
4.1. Preparation of Catalyst Beads
4.2. Catalyst Characterisation
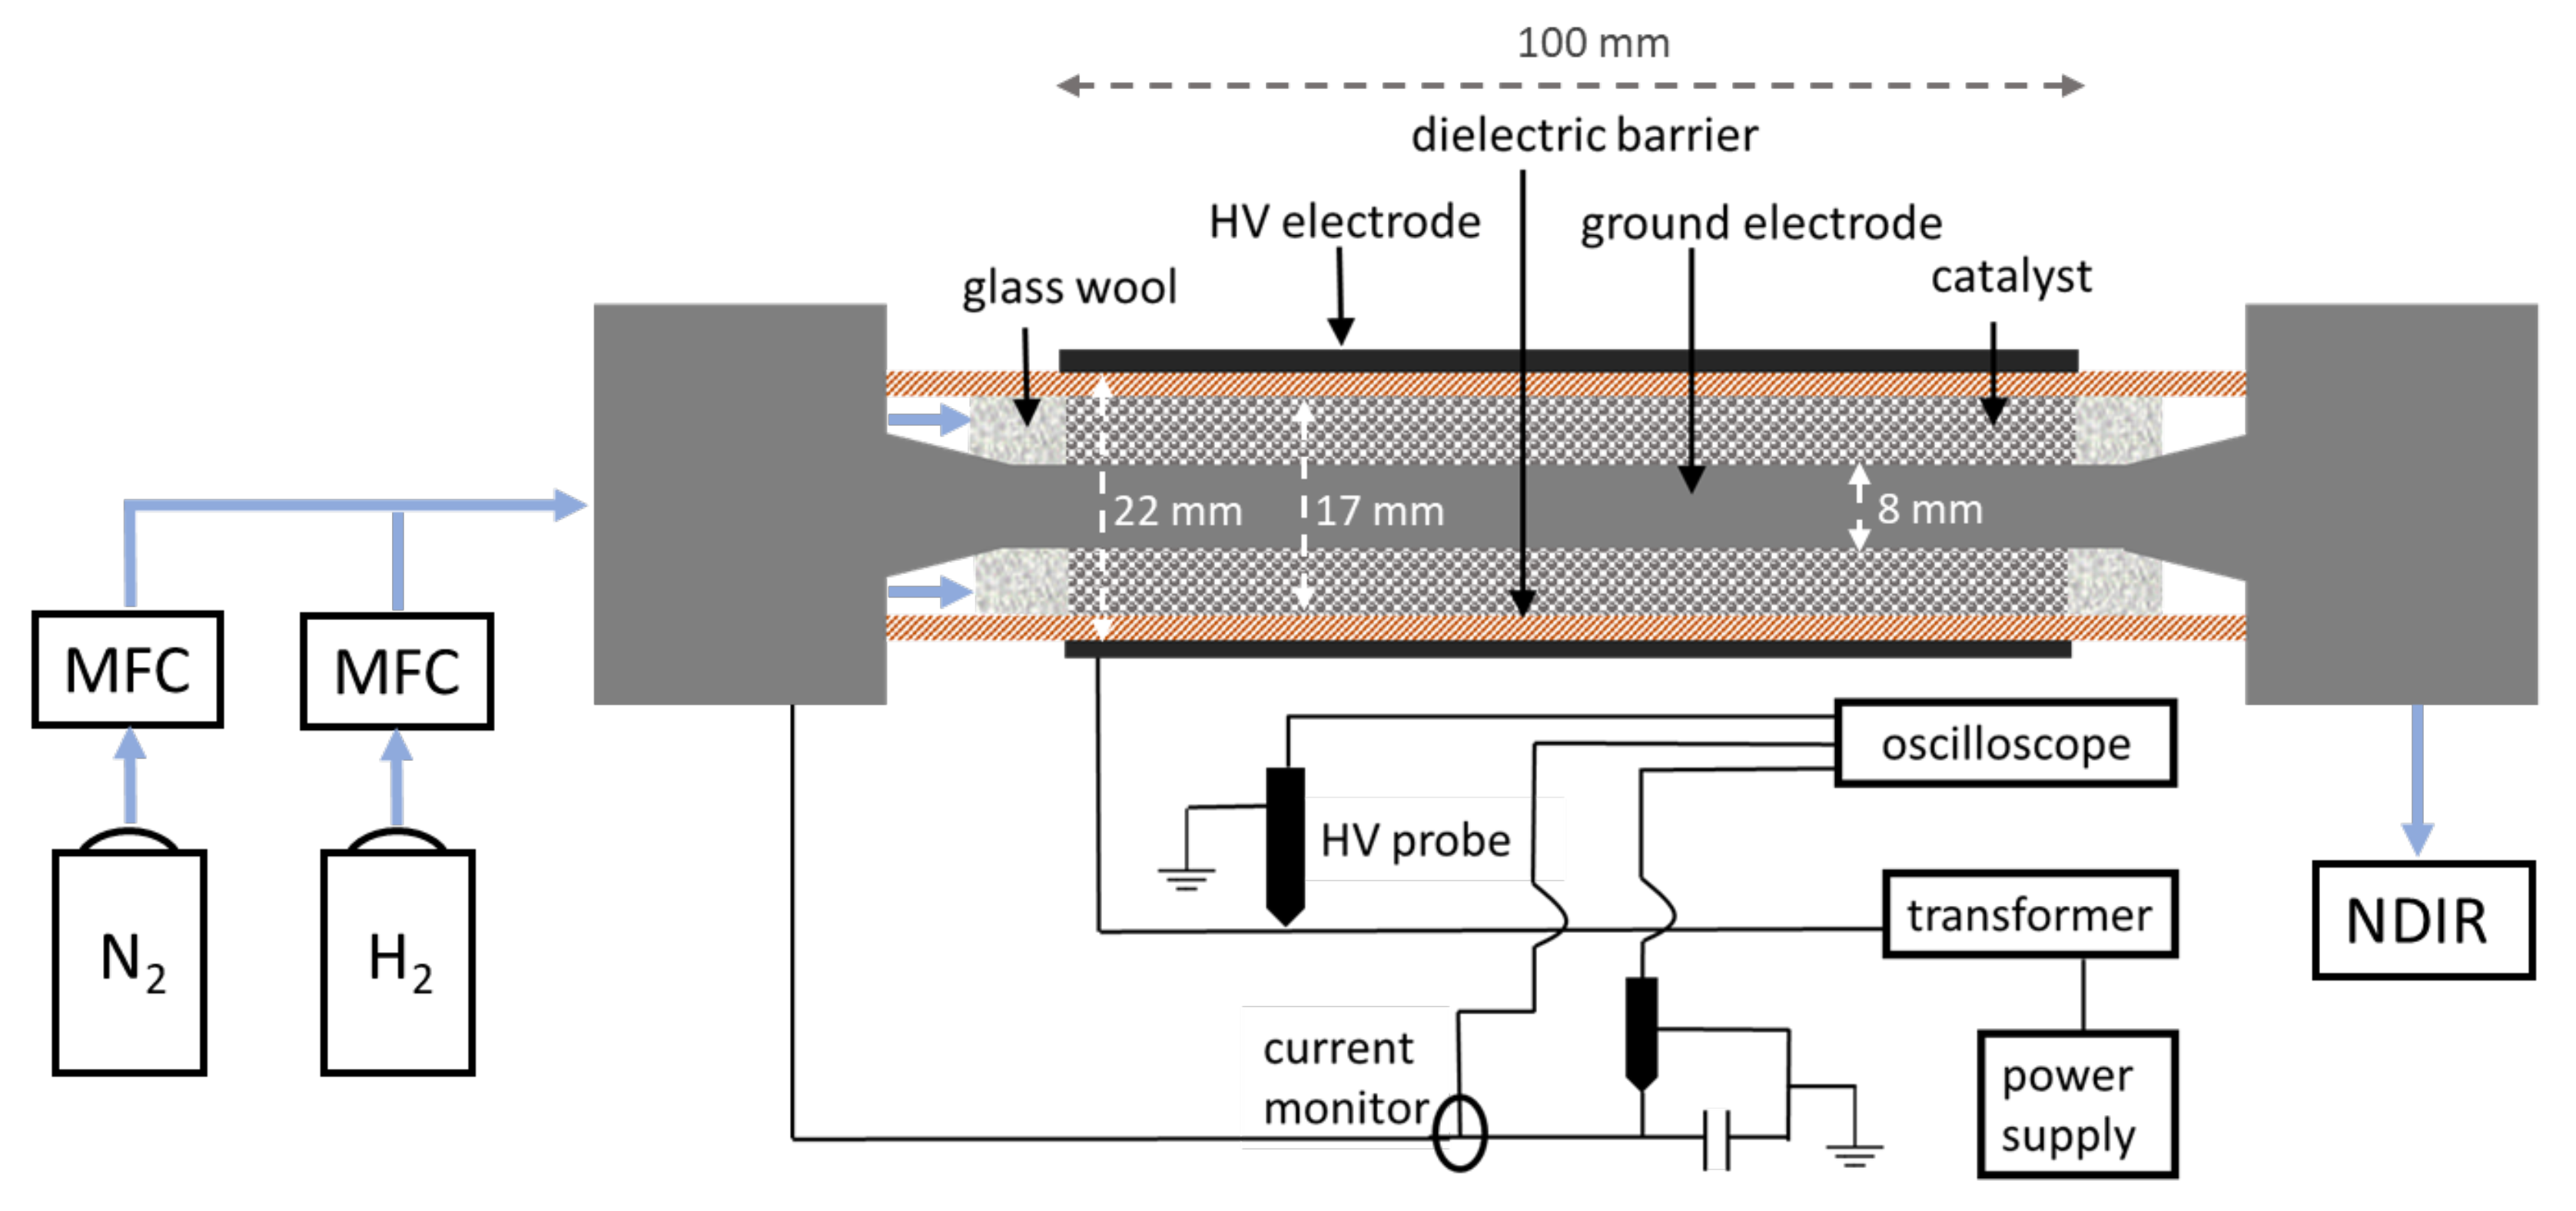
4.3. Plasma Setup
5. Conclusions
Supplementary Materials
Author Contributions
Funding
Data Availability Statement
Acknowledgments
Conflicts of Interest
References
- Erisman, J.W.; Sutton, M.A.; Galloway, J.; Klimont, Z.; Winiwarter, W. How a century of ammonia synthesis changed the world. Nat. Geosci. 2008, 1, 636–639. [Google Scholar] [CrossRef]
- Hoffman, B.M.; Lukoyanov, D.; Yang, Z.-Y.; Dean, D.R.; Seefeldt, L.C. Mechanism of nitrogen fixation by nitrogenase: The next stage. Chem. Rev. 2014, 114, 4041–4062. [Google Scholar] [CrossRef] [PubMed]
- Sun, J.; Alam, D.; Daiyan, R.; Masood, H.; Zhang, T.; Zhou, R.; Cullen, P.J.; Lovell, E.C.; Jalili, A.; Amal, R. A hybrid plasma electrocatalytic process for sustainable ammonia production. Energy Environ. Sci. 2021, 14, 865–872. [Google Scholar] [CrossRef]
- Wang, M.; Khan, M.A.; Mohsin, I.; Wicks, J.; Ip, A.H.; Sumon, K.Z.; Dinh, C.-T.; Sargent, E.H.; Gates, I.D.; Kibria, M.G. Can sustainable ammonia synthesis pathways compete with fossil-fuel based Haber-Bosch processes? Energy Environ. Sci. 2021, 14, 2535–2548. [Google Scholar] [CrossRef]
- Smith, C.; Hill, A.K.; Torrente-Murciano, L. Current and future role of Haber-Bosch ammonia in a carbon-free energy landscape. Energy Environ. Sci. 2020, 13, 331–344. [Google Scholar] [CrossRef]
- Kobayashi, H.; Hayakawa, A.; Somarathne, K.K.A.; Okafor, E.C. Science and technology of ammonia combustion. Proc. Combust. Inst. 2019, 37, 109–133. [Google Scholar] [CrossRef]
- Nayak-Luke, R.M.; Bañares-Alcántara, R. Techno-economic viability of islanded green ammonia as a carbon-free energy vector and as a substitute for conventional production. Energy Environ. Sci. 2020, 13, 2957–2966. [Google Scholar] [CrossRef]
- Kyriakou, V.; Garagounis, I.; Vourros, A.; Vasileiou, E.; Stoukides, M. An electrochemical Haber-Bosch process. Joule 2020, 4, 142–158. [Google Scholar] [CrossRef]
- Pfromm, P.H. Towards sustainable agriculture: Fossil-free ammonia. J. Renew. Sustain. Energy 2017, 9, 034702. [Google Scholar] [CrossRef] [Green Version]
- Cui, X.; Tang, C.; Zhang, Q. A review of electrocatalytic reduction of dinitrogen to ammonia under ambient conditions. Adv. Energ. Mater. 2018, 8, 1800369. [Google Scholar] [CrossRef]
- Hargreaves, J.S.J.; Chung, Y.-M.; Ahn, W.-S.; Hisatomi, T.; Domen, K.; Kung, M.C.; Kung, H.H. Minimizing energy demand and environmental impact for sustainable NH3 and H2O2 production—A perspective on contributions from thermal, electro-, and photo-catalysis. Appl. Catal. A Gen. 2020, 594, 117419. [Google Scholar] [CrossRef]
- Chen, J.G.; Crooks, R.M.; Seefeldt, L.C.; Bren, K.L.; Bullock, R.M.; Darensbourg, M.Y.; Holland, P.L.; Hoffman, B.; Janik, M.J.; Jones, A.K.; et al. Beyond fossil fuel-driven nitrogen transformations. Science 2018, 360, 6391. [Google Scholar] [CrossRef] [PubMed] [Green Version]
- Bogaerts, A.; Neyts, E.C. Plasma technology: An emerging technology for energy storage. ACS Energy Lett. 2018, 3, 1013–1027. [Google Scholar] [CrossRef] [Green Version]
- Rouwenhorst, K.H.R.; Jardali, F.; Bogaerts, A.; Lefferts, L. From the birkeland-eyde process towards energy-efficient plasma-based NOx synthesis: A techno-economic analysis. Energy Environ. Sci. 2021, 14, 2520–2534. [Google Scholar] [CrossRef]
- Gorbanev, Y.; Privat-Maldonado, A.; Bogaerts, A. Analysis of short-lived reactive species in plasma-air-water systems: The dos and the do nots. Anal. Chem. 2018, 90, 13151–13158. [Google Scholar] [CrossRef] [Green Version]
- Hollevoet, L.; Jardali, F.; Gorbanev, Y.; Creel, J.; Bogaerts, A.; Martens, J.A. Towards green ammonia synthesis through plasma-driven nitrogen oxidation and catalytic reduction. Angew. Chem. Int. Ed. 2020, 59, 23825–23829. [Google Scholar] [CrossRef]
- Li, L.; Tang, C.; Cui, X.; Zheng, Y.; Wang, X.; Xu, H.; Zhang, S.; Shao, T.; Davey, K.; Qiao, S.-Z. Efficient nitrogen fixation to ammonia through integration of plasma oxidation with electrocatalytic reduction. Angew. Chem. Int. Ed. 2021, 60, 14131–14137. [Google Scholar] [CrossRef]
- Rouwenhorst, K.H.R.; Burbach, H.G.B.; Vogel, D.W.; Núñez Paulí, J.; Geerdink, B.; Lefferts, L. Plasma-catalytic ammonia synthesis beyond thermal equilibrium on Ru-based catalysts in non-thermal plasma. Catal. Sci. Technol. 2021, 11, 2834–2843. [Google Scholar] [CrossRef]
- Patil, B.S.; Cherkasov, N.; Srinath, N.V.; Lang, J.; Ibhadon, A.O.; Wang, Q.; Hessel, V. The role of heterogeneous catalysts in the plasma-catalytic ammonia synthesis. Catal. Today 2021, 362, 2–10. [Google Scholar] [CrossRef]
- Gorbanev, Y.; Vervloessem, E.; Nikiforov, A.; Bogaerts, A. Nitrogen fixation with water vapor by nonequilibrium plasma: Toward sustainable ammonia production. ACS Sustain. Chem. Eng. 2020, 8, 2996–3004. [Google Scholar] [CrossRef]
- Toth, J.R.; Abuyazid, N.H.; Lacks, D.J.; Renner, J.N.; Sankaran, R.M. A plasma-water droplet reactor for process-intensified, continuous nitrogen fixation at atmospheric pressure. ACS Sustain. Chem. Eng. 2020, 8, 14845–14854. [Google Scholar] [CrossRef]
- Haruyama, T.; Namise, T.; Shimoshimizu, N.; Uemura, S.; Takatsuji, Y.; Hino, M.; Yamasaki, R.; Kamachi, T.; Kohno, M. Non-catalyzed one-step synthesis of ammonia from atmospheric air and water. Green Chem. 2016, 18, 4536–4541. [Google Scholar] [CrossRef] [Green Version]
- Winter, L.R.; Chen, J.G. N2 fixation by plasma-activated processes. Joule 2021, 5, 300–315. [Google Scholar] [CrossRef]
- Li, S.; Medrano, J.A.; Hessel, V.; Gallucci, F. Recent progress of plasma-assisted nitrogen fixation research: A review. Processes 2018, 6, 248. [Google Scholar] [CrossRef] [Green Version]
- Bogaerts, A.; Tu, X.; Whitehead, J.C.; Centi, G.; Lefferts, L.; Guaitella, O.; Azzolina-Jury, F.; Kim, H.-H.; Murphy, A.B.; Schneider, W.F.; et al. The 2020 plasma catalysis roadmap. J. Phys. D Appl. Phys. 2020, 53, 443001. [Google Scholar] [CrossRef]
- Rouwenhorst, K.H.R.; Engelmann, Y.; van’t Veer, K.; Postma, R.S.; Bogaerts, A.; Lefferts, L. Plasma-driven catalysis: Green ammonia synthesis with intermittent electricity. Green Chem. 2020, 22, 6258–6287. [Google Scholar] [CrossRef]
- Mehta, P.; Barboun, P.M.; Engelmann, Y.; Go, D.B.; Bogaerts, A.; Schneider, W.F.; Hicks, J.C. Plasma-catalytic ammonia synthesis beyond the equilibrium limit. ACS Catal. 2020, 10, 6726–6734. [Google Scholar] [CrossRef]
- Van’t Veer, K.; Engelmann, Y.; Reniers, F.; Bogaerts, A. Plasma-catalytic ammonia synthesis in a DBD plasma: Role of microdischarges and their afterglows. J. Phys. Chem. C 2020, 124, 22871–22883. [Google Scholar] [CrossRef]
- Bai, M.; Zhang, Z.; Bai, X.; Bai, M.; Ning, W. Plasma synthesis of ammonia with a microgap dielectric barrier discharge at ambient pressure. IEEE Trans. Plasma Sci. 2003, 31, 1285–1291. [Google Scholar] [CrossRef]
- Mizushima, T.; Matsumoto, K.; Sugoh, J.-I.; Ohkita, H.; Kakuta, N. Tubular membrane-like catalyst for reactor with dielectric-barrier-discharge plasma and its performance in ammonia synthesis. Appl. Catal. A Gen. 2004, 265, 53–59. [Google Scholar] [CrossRef]
- Gómez-Ramírez, A.; Cotrino, J.; Lambert, R.M.; González-Elipe, A.R. Efficient synthesis of ammonia from N2 and H2 alone in a ferroelectric packed-bed DBD reactor. Plasma Sources Sci. Technol. 2015, 24, 065011. [Google Scholar] [CrossRef]
- Aihara, K.; Akiyama, M.; Deguchi, T.; Tanaka, M.; Hagiwara, R.; Iwamoto, M. Remarkable catalysis of a wool-like copper electrode for NH3 synthesis from N2 and H2 in non-thermal atmospheric plasma. Chem. Commun. 2016, 52, 13560–13563. [Google Scholar] [CrossRef]
- Iwamoto, M.; Akiyama, M.; Aihara, K.; Deguchi, T. Ammonia synthesis on wool-like Au, Pt, Pd, Ag, or Cu electrode catalysts in nonthermal atmospheric-pressure plasma of N2 and H2. ACS Catal. 2017, 7, 6924–6929. [Google Scholar] [CrossRef]
- Peng, P.; Li, Y.; Cheng, Y.; Deng, S.; Chen, P.; Ruan, R. Atmospheric pressure ammonia synthesis using non-thermal plasma assisted catalysis. Plasma Chem. Plasma Process. 2016, 36, 1201–1210. [Google Scholar] [CrossRef]
- Kim, H.-H.; Teramoto, Y.; Ogata, A.; Takagi, H.; Nanba, T. Atmospheric-pressure nonthermal plasma synthesis of ammonia over ruthenium catalysts. Plasma Process. Polym. 2017, 14, 1600157. [Google Scholar] [CrossRef]
- Akay, G.; Zhang, K. Process Intensification in ammonia synthesis using novel coassembled supported microporous catalysts promoted by nonthermal plasma. Ind. Eng. Chem. Res. 2017, 56, 457–468. [Google Scholar] [CrossRef] [Green Version]
- Barboun, P.; Mehta, P.; Herrera, F.A.; Go, D.B.; Schneider, W.F.; Hicks, J.C. Distinguishing plasma contributions to catalyst performance in plasma-assisted ammonia synthesis. ACS Sustain. Chem. Eng. 2019, 7, 8621–8630. [Google Scholar] [CrossRef]
- Wang, Y.; Craven, M.; Yu, X.; Ding, J.; Bryant, P.; Huang, J.; Tu, X. Plasma-enhanced catalytic synthesis of ammonia over a Ni/Al2O3 catalyst at near-room temperature: Insights into the importance of the catalyst surface on the reaction mechanism. ACS Catal. 2019, 9, 10780–10793. [Google Scholar] [CrossRef] [PubMed] [Green Version]
- Li, S.; van Raak, T.; Gallucci, F. Investigating the operation parameters for ammonia synthesis in dielectric barrier discharge reactors. J. Phy. D Appl. Phys. 2019, 53, 014008. [Google Scholar] [CrossRef]
- Michielsen, I.; Uytdenhouwen, Y.; Pype, J.; Michielsen, B.; Mertens, J.; Reniers, F.; Meynen, V.; Bogaerts, A. CO2 dissociation in a packed bed DBD reactor: First steps towards a better understanding of plasma catalysis. Chem. Eng. J. 2017, 326, 477–488. [Google Scholar] [CrossRef]
- Medford, A.J.; Vojvodic, A.; Hummelshøj, J.S.; Voss, J.; Abild-Pedersen, F.; Studt, F.; Bligaard, T.; Nilsson, A.; Nørskov, J.K. From the Sabatier principle to a predictive theory of transition-metal heterogeneous catalysis. J. Catal. 2015, 328, 36–42. [Google Scholar] [CrossRef] [Green Version]
- Mehta, P.; Barboun, P.; Herrera, F.A.; Kim, J.; Rumbach, P.; Go, D.B.; Hicks, J.C.; Schneider, W.F. Overcoming ammonia synthesis scaling relations with plasma-enabled catalysis. Nat. Catal. 2018, 1, 269–275. [Google Scholar] [CrossRef]
- Engelmann, Y.; van’t Veer, K.; Gorbanev, Y.; Neyts, E.C.; Schneider, W.F.; Bogaerts, A. Plasma catalysis for ammonia synthesis: A microkinetic modelling study on the contributions of Eley-Rideal reactions. ACS Sustain. Chem. Eng. 2021, 9, 13151–13163. [Google Scholar] [CrossRef]
- Wang, Z.; Zhang, Y.; Neyts, E.C.; Cao, X.; Zhang, X.; Jang, B.W.L.; Liu, C.-J. Catalyst preparation with plasmas: How does it work? ACS Catal. 2018, 8, 2093–2110. [Google Scholar] [CrossRef]
- Gao, M.; Zhang, Y.; Wang, H.; Guo, B.; Zhang, Q.; Bogaerts, A. Mode transition of filaments in packed-bed dielectric barrier discharges. Catalysts 2018, 8, 248. [Google Scholar] [CrossRef] [Green Version]
- Xie, Q.; Zhuge, S.; Song, X.; Lu, M.; Yu, F.; Ruan, R.; Nie, Y. Non-thermal atmospheric plasma synthesis of ammonia in a DBD reactor packed with various catalysts. J. Phys. D Appl. Phys. 2019, 53, 064002. [Google Scholar] [CrossRef]
- Haley, S.M.; Tappin, A.D.; Bond, P.R.; Fitzsimons, M.F. A comparison of SEM-EDS with ICP-AES for the quantitative elemental determination of estuarine particles. Environ. Chem. Lett. 2006, 4, 235–238. [Google Scholar] [CrossRef]
- Midgley, P.A.; Weyland, M. 3D electron microscopy in the physical sciences: The development of Z-contrast and EFTEM tomography. Ultramicroscopy 2003, 96, 413–431. [Google Scholar] [CrossRef]
- Van Aarle, W.; Palenstijn, W.J.; De Beenhouwer, J.; Altantzis, T.; Bals, S.; Batenburg, K.J.; Sijbers, J. The ASTRA toolbox: A platform for advanced algorithm development in electron tomography. Ultramicroscopy 2015, 157, 35–47. [Google Scholar] [CrossRef] [Green Version]
- Jiang, H.; Shao, T.; Zhang, C.; Li, W.; Yan, P.; Che, X.; Schamiloglu, E. Experimental study of Q-V Lissajous figures in nanosecond-pulse surface discharges. IEEE Trans. Dielectr. Electr. Insul. 2013, 20, 1101–1111. [Google Scholar] [CrossRef]
- Peeters, F.J.J.; van de Sanden, M.C.M. The influence of partial surface discharging on the electrical characterization of DBDs. Plasma Sources Sci. Technol. 2014, 24, 015016. [Google Scholar] [CrossRef] [Green Version]
- Herrera, F.A.; Brown, G.H.; Barboun, P.; Turan, N.; Mehta, P.; Schneider, W.F.; Hicks, J.C.; Go, D.B. The impact of transition metal catalysts on macroscopic dielectric barrier discharge (DBD) characteristics in an ammonia synthesis plasma catalysis reactor. J. Phys. D Appl. Phys. 2019, 52, 224002. [Google Scholar] [CrossRef]
- Dai, W.; Reimann, J.; Hanaor, D.; Ferrero, C.; Gan, Y. Modes of wall induced granular crystallisation in vibrational packing. Gran. Matter 2019, 21, 26. [Google Scholar] [CrossRef] [Green Version]
- Van Laer, K.; Bogaerts, A. Fluid modelling of a packed bed dielectric barrier discharge plasma reactor. Plasma Sources Sci. Technol. 2016, 25, 015002. [Google Scholar] [CrossRef]
- Jardali, F.; Van Alphen, S.; Creel, J.; Ahmadi Eshtehardi, H.; Axelsson, M.; Ingels, R.; Snyders, R.; Bogaerts, A. NOx production in a rotating gliding arc plasma: Potential avenue for sustainable nitrogen fixation. Green Chem. 2021, 23, 1748–1757. [Google Scholar] [CrossRef]
- Zhu, X.; Hu, X.; Wu, X.; Cai, Y.; Zhang, H.; Tu, X. Ammonia synthesis over γ-Al2O3 pellets in a packed-bed dielectric barrier discharge reactor. J. Phys. D Appl. Phys. 2020, 53, 164002. [Google Scholar] [CrossRef]
- Carrasco, E.; Jiménez-Redondo, M.; Tanarro, I.; Herrero, V.J. Neutral and ion chemistry in low pressure dc plasmas of H2/N2 mixtures: Routes for the efficient production of NH3 and NH4+. Phys. Chem. Chem. Phys. 2011, 13, 19561–19572. [Google Scholar] [CrossRef] [Green Version]
- Hong, J.; Aramesh, M.; Shimoni, O.; Seo, D.H.; Yick, S.; Greig, A.; Charles, C.; Prawer, S.; Murphy, A.B. Plasma catalytic synthesis of ammonia using functionalized-carbon coatings in an atmospheric-pressure non-equilibrium discharge. Plasma Chem. Plasma Process. 2016, 36, 917–940. [Google Scholar] [CrossRef]
- Peng, P.; Cheng, Y.; Hatzenbeller, R.; Addy, M.; Zhou, N.; Schiappacasse, C.; Chen, D.; Zhang, Y.; Anderson, E.; Liu, Y.; et al. Ru-based multifunctional mesoporous catalyst for low-pressure and non-thermal plasma synthesis of ammonia. Int. J. Hydrogen Energy 2017, 42, 19056–19066. [Google Scholar] [CrossRef]
- Shah, J.; Wu, T.; Lucero, J.; Carreon, M.A.; Carreon, M.L. Nonthermal plasma synthesis of ammonia over Ni-MOF-74. ACS Sustain. Chem. Eng. 2019, 7, 377–383. [Google Scholar] [CrossRef]
- Patil, B.S.; van Kaathoven, A.S.R.; Peeters, F.J.J.; Cherkasov, N.; Lang, J.; Wang, Q.; Hessel, V. Deciphering the synergy between plasma and catalyst support for ammonia synthesis in a packed dielectric barrier discharge reactor. J. Phys. D Appl. Phys. 2020, 53, 144003. [Google Scholar] [CrossRef]
- Hu, X.; Zhu, X.; Wu, X.; Cai, Y.; Tu, X. Plasma-enhanced NH3 synthesis over activated carbon-based catalysts: Effect of active metal phase. Plasma Process. Polym. 2020, 17, 2000072. [Google Scholar] [CrossRef]
- Shah, J.; Gorky, F.; Psarras, P.; Seong, B.; Gómez-Gualdrón, D.A.; Carreon, M.L. Enhancement of the yield of ammonia by hydrogen-sink effect during plasma catalysis. ChemCatChem 2020, 12, 1200–1211. [Google Scholar] [CrossRef]
- Van Alphen, S.; Jardali, F.; Creel, J.; Trenchev, G.; Snyders, R.; Bogaerts, A. Sustainable gas conversion by gliding arc plasmas: A new modelling approach for reactor design improvement. Sustain. Energy Fuels 2021, 5, 1786–1800. [Google Scholar] [CrossRef]
- Anastasopoulou, A.; Keijzer, R.; Patil, B.; Lang, J.; van Rooij, G.; Hessel, V. Environmental impact assessment of plasma-assisted and conventional ammonia synthesis routes. J. Ind. Ecol. 2020, 24, 1171–1185. [Google Scholar] [CrossRef]
- Anastasopoulou, A.; Keijzer, R.; Butala, S.; Lang, J.; Van Rooij, G.; Hessel, V. Eco-efficiency analysis of plasma-assisted nitrogen fixation. J. Phys. D Appl. Phys. 2020, 53, 234001. [Google Scholar] [CrossRef]


| Material | SBET (m2/g) | V (cm3/g) |
|---|---|---|
| Al2O3 | 321 | n/a |
| 10 wt% Fe/Al2O3 | 204 | 0.42 |
| 10 wt% Ru/Al2O3 | 144 | 0.29 |
| 10 wt% Co/Al2O3 | 175 | 0.37 |
| 10 wt% Cu/Al2O3 | 203 | 0.42 |
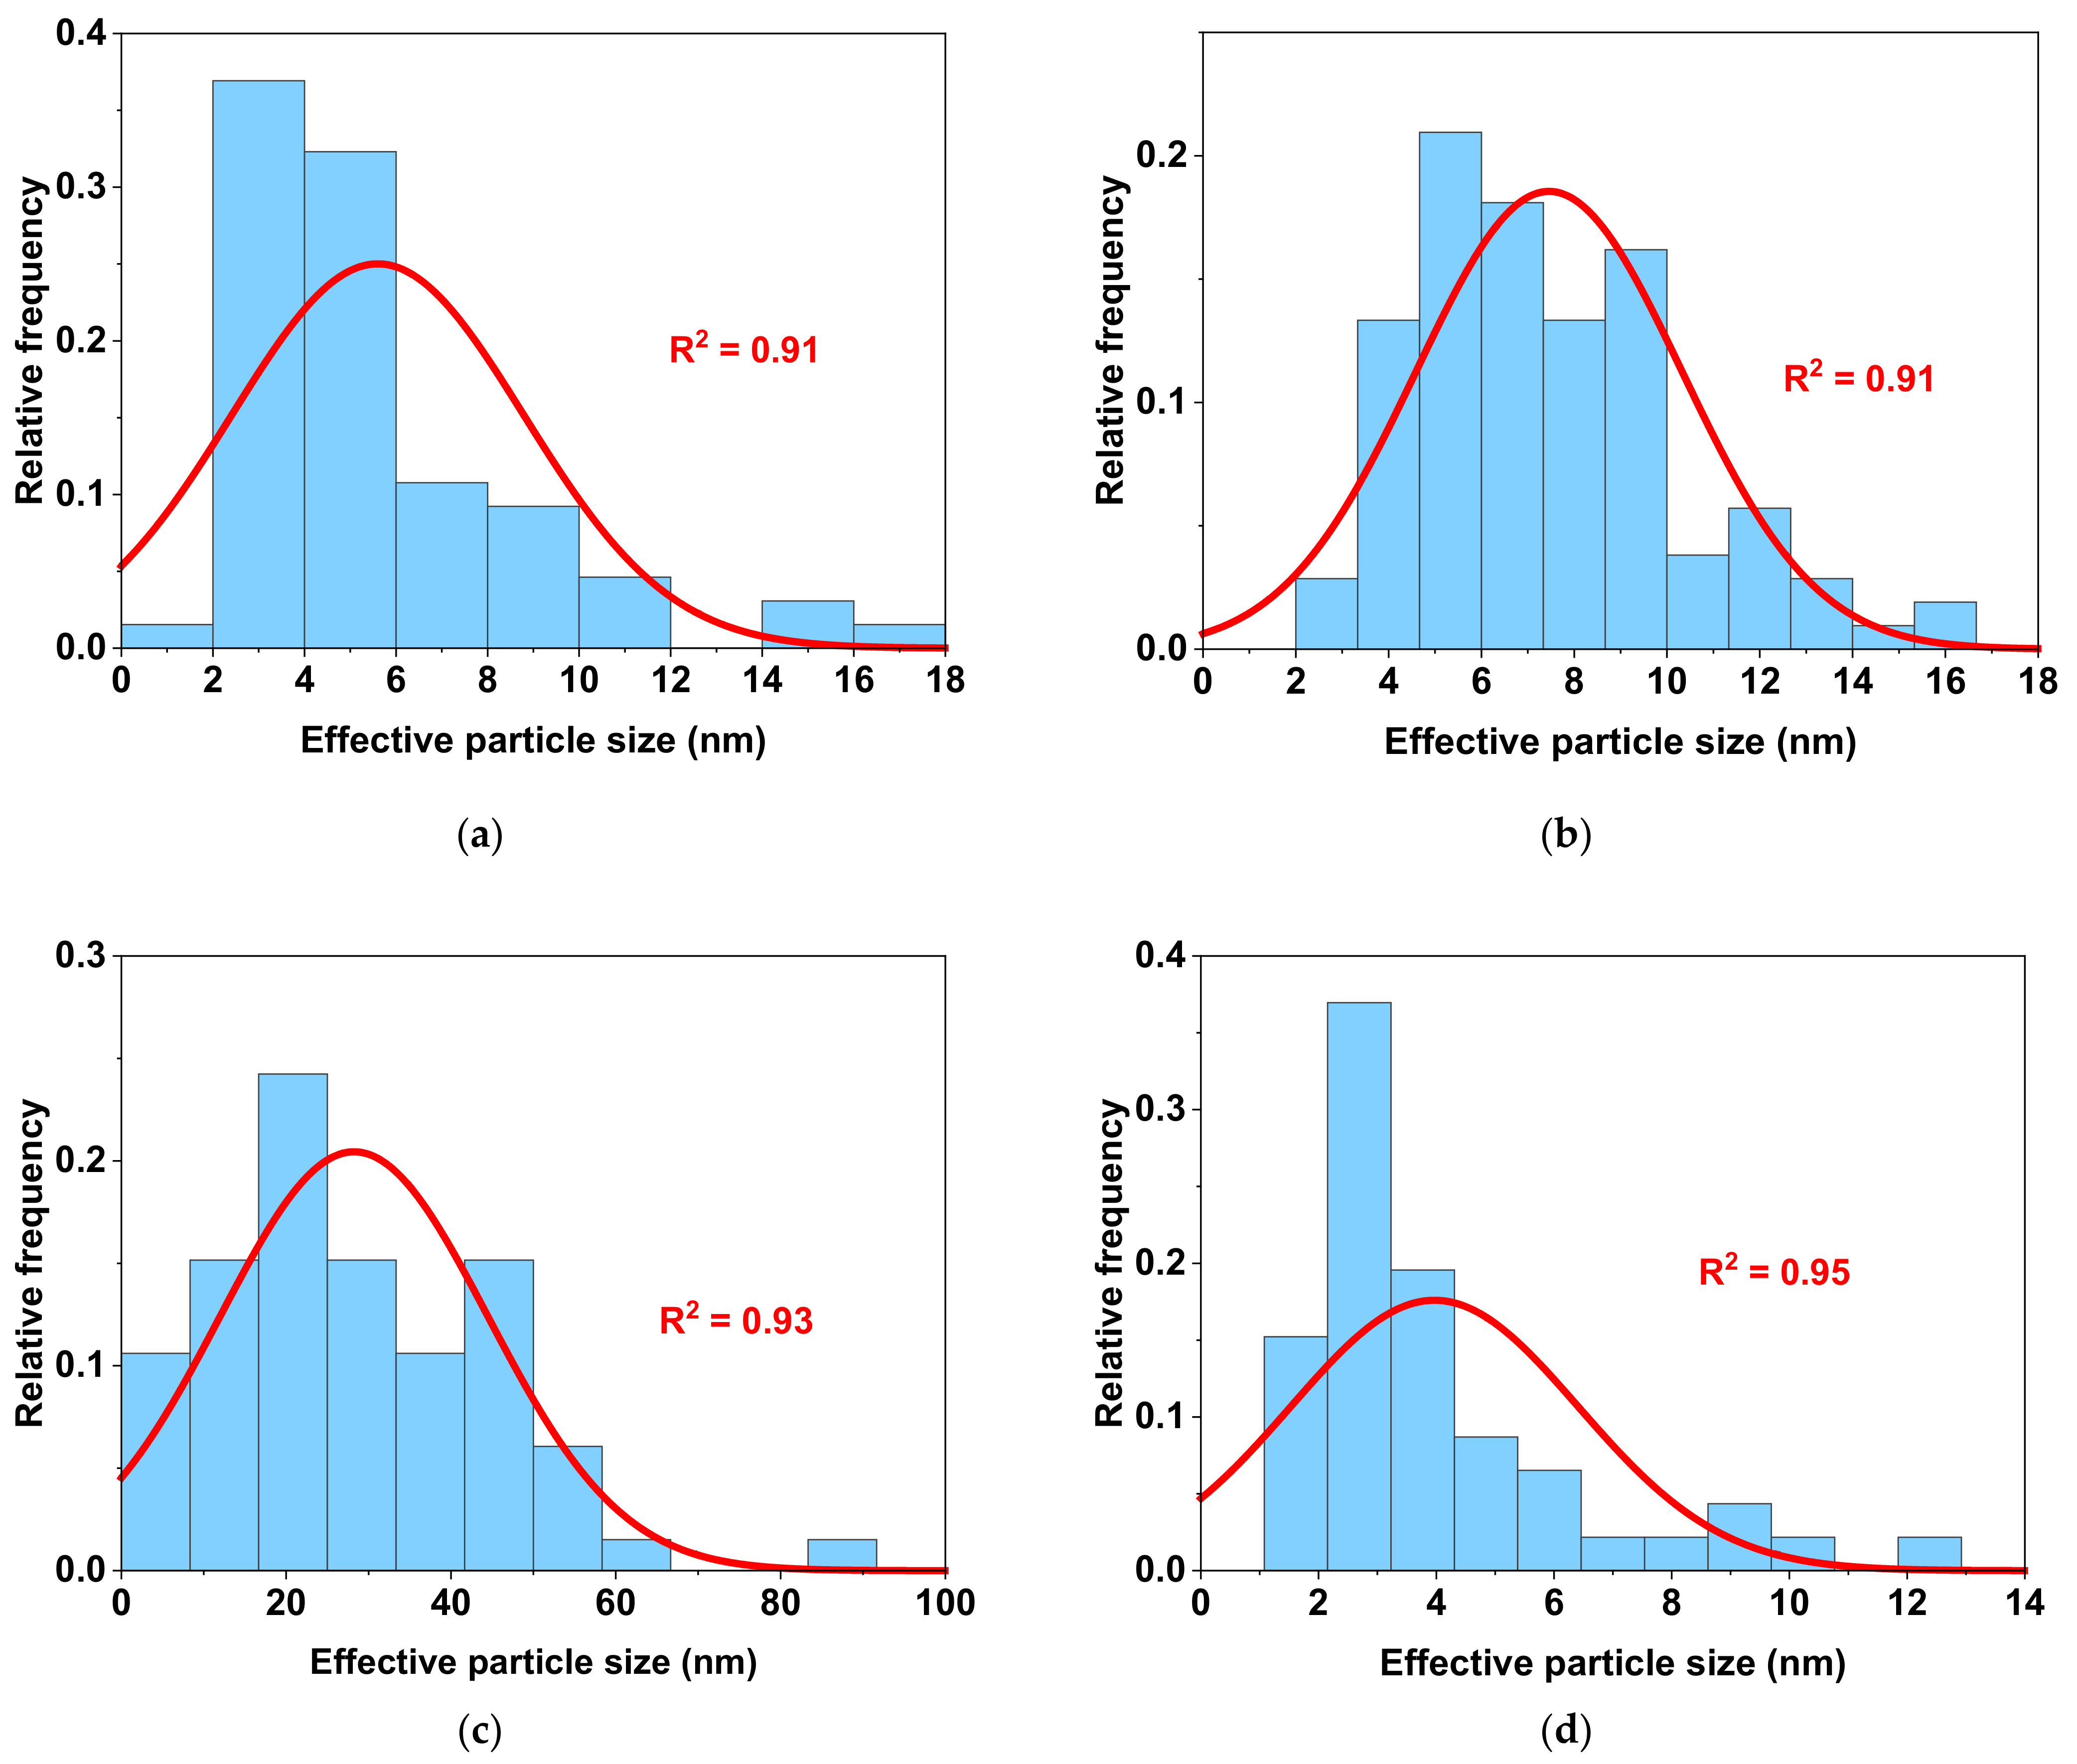
| Catalyst | Metal Loading 1 (wt%) | Particle Size 2 (nm) |
|---|---|---|
| Fe/Al2O3 | 9.9 ± 0.7 | 5.7 ± 3.4 |
| Ru/Al2O3 | 11.0 ± 1.1 | 7.5 ± 3.0 |
| Co/Al2O3 | 8.6 ± 0.5 | 28.8 ± 17.8 |
| Cu/Al2O3 | 12.1 ± 0.6 | 4.1 ± 2.7 |
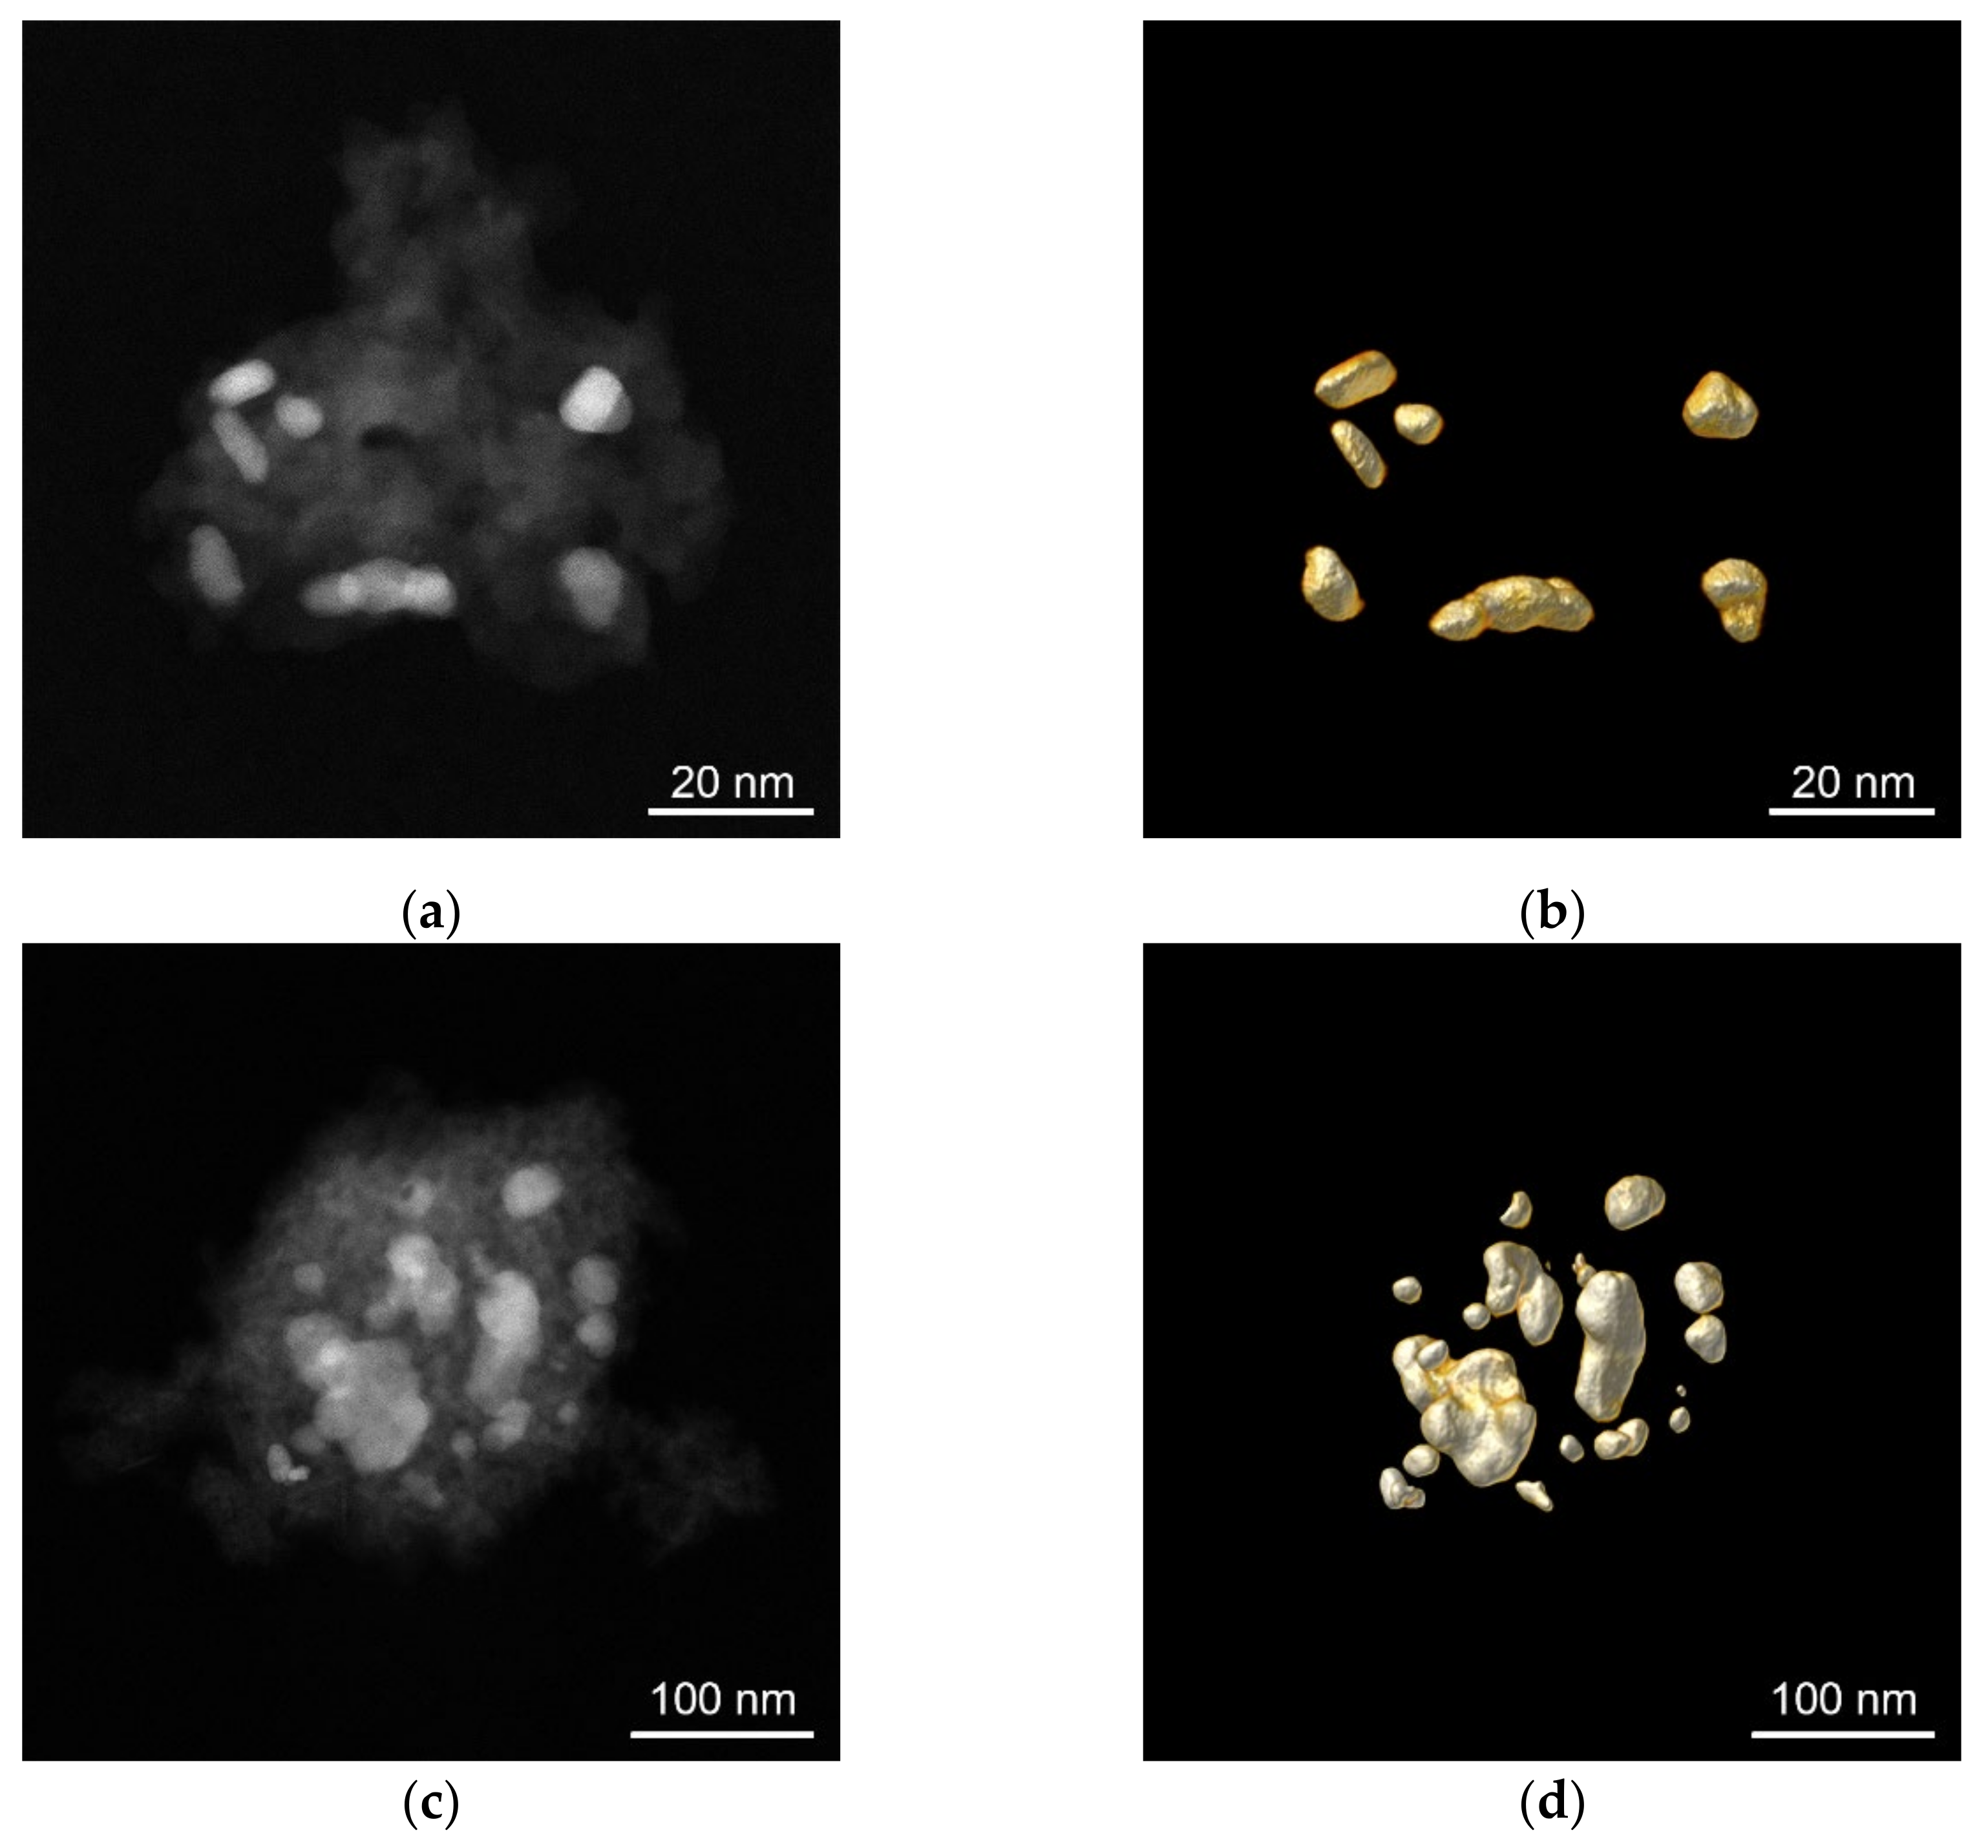
| Material | Average Metal Coverage (%) | |
|---|---|---|
| Extracted from 2D Projection | Extracted from 3D Reconstruction | |
| 10 wt% Fe/Al2O3 | 14.9 | 10.4 |
| 10 wt% Ru/Al2O3 | 10.3 | 8.5 |
| 10 wt% Co/Al2O3 | 16.8 | 15.1 |
| 10 wt% Cu/Al2O3 | 6.7 | n/a 1 |
| Source 1 | Catalyst | T (°C) | Plasma Power (W) | H2:N2 Ratio | Energy Consumption (MJ/mol) | N2 Conversion/ /NH3 Yield (%) | NH3 Production Rate (mg/h) |
|---|---|---|---|---|---|---|---|
| [30] | Ru/Al2O3 | 20 | 127 | 3:1 | 244 | 2.4 | 16 |
| [31] | PZT | 50 | n/a 2 | 3:1 | 68 | 2.7 | 12 |
| [32] | Cu | n/a | n/a | 1:1 | 19 | 1.4 | 71 |
| [58] | DLC-coated Al2O3 | 160 | 70 | 3:1 | 350 | n/a | 12 |
| [59] | Ru-Cs-K-Ba/ /Si-MCM-41 | 150 | n/a | 1:1 | 36 | <0.1 | n/a |
| [35] | RuO-MgO/Al2O3 | 300 | 4 | 1:4 | 2 | <0.1 | 119 |
| [36] | Ni/SiO2 + BaTiO3 | 140 | 87 | 3:1 | 81 | 12.0 | 32 |
| [33] | Au | n/a | 100 | 1:1 | 79 | 2.5 | 77 |
| [42] | Co/Al2O3 | 200 | 10 | 2:1 | 36 | 1.0 | 17 |
| [38] | Ni/Al2O3 | 35 | 10 | 2:1 | 56 | 0.7 | 10 |
| [37] | Co/Al2O3 | 200 | 10 | 1:3 | 102 | 0.1 | 6 |
| [60] | Ni-MOF-74 | n/a | 50 | 4:1 | 265 | n/a | 22 |
| [39] | Ru/Al2O3 | 118 | 38 | 1:2 | 32 | 1.1 | 76 |
| [46] | Ru/MgO | 200 | 26 | 1:2 | 47 | 0.1 | 25 |
| [56] | alkaline Al2O3 | >105 | n/a | 3:1 | 9 | <0.1 | 7 |
| [61] | SiO2 | 440 | n/a | 1:2 | 50 | 0.2 | 60 |
| [19] | Rh/Al2O3 | 325 | n/a | 1:2 | 65 | 1.1 | 29 |
| [62] | Ru/C | n/a | 13 | 3:1 | 85 | 0.5 | 10 |
| [18] | Ru-K/MgO | 325 | 4 | 1:1 | 46 | 0.6 | 5 |
| this work | Co/Al2O3 | <120 | 67 | 1:1 | 99 | 1.0 | 42 |
Publisher’s Note: MDPI stays neutral with regard to jurisdictional claims in published maps and institutional affiliations. |
© 2021 by the authors. Licensee MDPI, Basel, Switzerland. This article is an open access article distributed under the terms and conditions of the Creative Commons Attribution (CC BY) license (https://creativecommons.org/licenses/by/4.0/).
Share and Cite
Gorbanev, Y.; Engelmann, Y.; van’t Veer, K.; Vlasov, E.; Ndayirinde, C.; Yi, Y.; Bals, S.; Bogaerts, A. Al2O3-Supported Transition Metals for Plasma-Catalytic NH3 Synthesis in a DBD Plasma: Metal Activity and Insights into Mechanisms. Catalysts 2021, 11, 1230. https://0-doi-org.brum.beds.ac.uk/10.3390/catal11101230
Gorbanev Y, Engelmann Y, van’t Veer K, Vlasov E, Ndayirinde C, Yi Y, Bals S, Bogaerts A. Al2O3-Supported Transition Metals for Plasma-Catalytic NH3 Synthesis in a DBD Plasma: Metal Activity and Insights into Mechanisms. Catalysts. 2021; 11(10):1230. https://0-doi-org.brum.beds.ac.uk/10.3390/catal11101230
Chicago/Turabian StyleGorbanev, Yury, Yannick Engelmann, Kevin van’t Veer, Evgenii Vlasov, Callie Ndayirinde, Yanhui Yi, Sara Bals, and Annemie Bogaerts. 2021. "Al2O3-Supported Transition Metals for Plasma-Catalytic NH3 Synthesis in a DBD Plasma: Metal Activity and Insights into Mechanisms" Catalysts 11, no. 10: 1230. https://0-doi-org.brum.beds.ac.uk/10.3390/catal11101230