
Synthesis of Nano-ZnO/Diatomite Composite and Research on Photoelectric Application

1
College of Chemsity, Beijing University of Chemical Technology, Beijing 100029, China
2
Analysis and Test Center of Beijing University of Chemical Technology, Beijing University of Chemical Technology, Beijing 100029, China
*
Author to whom correspondence should be addressed.
Catalysts 2021, 11(10), 1232; https://0-doi-org.brum.beds.ac.uk/10.3390/catal11101232
Submission received: 6 September 2021
/
Revised: 9 October 2021
/
Accepted: 11 October 2021
/
Published: 13 October 2021
(This article belongs to the Special Issue 10th Anniversary of Catalysts—Feature Papers in Photocatalysis)
Abstract
:The key to the commercialization of sustainable energy conversion technologies is the development of high-performance catalysts. The discovery of a stable, efficient, and low-cost multi-function catalysts is the key. We used a simple green precipitation method to load nanozinc oxide particles onto a diatomite substrate. The ZnO is nano-sized. This precipitation method produces ZnO nanoparticles in situ on diatomite. The catalysts degraded 90% of Methylene blue solution and also degraded gaseous benzene and gaseous acetone. Not only can the catalysts be used for the organic degradation of wastewater, but it also has the potential to degrade volatile organic compounds. Photocatalytic efficiency is closely related to the generation and separation of photogenerated electrons and holes. The effective suppression of the recombination rate of photoliving carriers and thus improvement of the photocatalytic activity, has become a key research area. At present, photocatalysis is an effective technology to inhibit photogenerated carrier recombination, which is often studied in sewage treatment. Photoelectrochemical decomposition of water reduces the recombination of photogenerated electrons and holes by applying an external bias, thus improving the quantum efficiency for the complete mineralization of organic pollutants. The composite catalysts were used for oxygen and hydrogen extraction reactions, and a comparison of the catalysts with various loading ratios showed that the photoelectrochemical decomposition of water activity of the composite catalysts are due to pure ZnO, and the efficiency is highest when the loading ratio is 10%. This work provides new methods for the design and further optimization of the preparation of photoelectrochemical decomposition of water catalysts.
1. Introduction
Photocatalytic technology is now considered the most promising technology for addressing energy shortages and environmental pollution. TiO2 and ZnO are important semiconductor materials that are widely used in fields such as solar cells [1,2], photocatalysis [3], and environmental restoration. However, the solar energy utilization of photocatalysts is low, and the stability of photogenerated electrons and holes is poor [4]. ZnO is a common semiconductor material with a band gap width of approximately 3.1~3.2 eV, with visible light response properties and appropriate valence band and conduction band positions, possessing strong oxidation-reduction capability. Extensive studies have shown that ZnO has good photocatalytic activity for organic pollutant degradation under visible light [5]. Although ZnO has a suitable band gap, nano ZnO particles in powder state are small, and industrial use will cause harm to the human respiratory tract; nevertheless, it is an effective way to load nano ZnO to a larger substrate material from the perspective of increased use [6]. In addition, in terms of increasing the photocatalytic efficiency, ZnO can be modified with alterations, including appearance regulation [7], elements doping [8], crystal surface regulation [9], and the construction of heterojunctions [10,11,12]. It was shown that an oxygen vacancy, such as a crystal defect, can introduce new Fermi levels into photocatalysts, increase the density of the photogenerated carriers, promote the separation of the photogenerated carriers, broaden the range of the visible light response, and significantly improve the performance of the photocatalysts [13].
In this study, ZnO composites with various loading ratios were synthesized by a precipitation method using diatomite as the carrier. Diatomite has the advantages of large specific surface area, many pores and a large number of hydroxyl groups on the surface [14,15]. Photocatalytic materials were analyzed by X-ray diffraction (XRD), scanning electron microscopy (SEM), and high-resolution transmission electron microscopy (HRTEM). Methylene blue (MB) was chosen as the target pollutant to investigate the effect of oxygen vacancy concentration on the degradation performance of the photocatalysts [16,17].
2. Results and Discussion
2.1. Phase Analysis
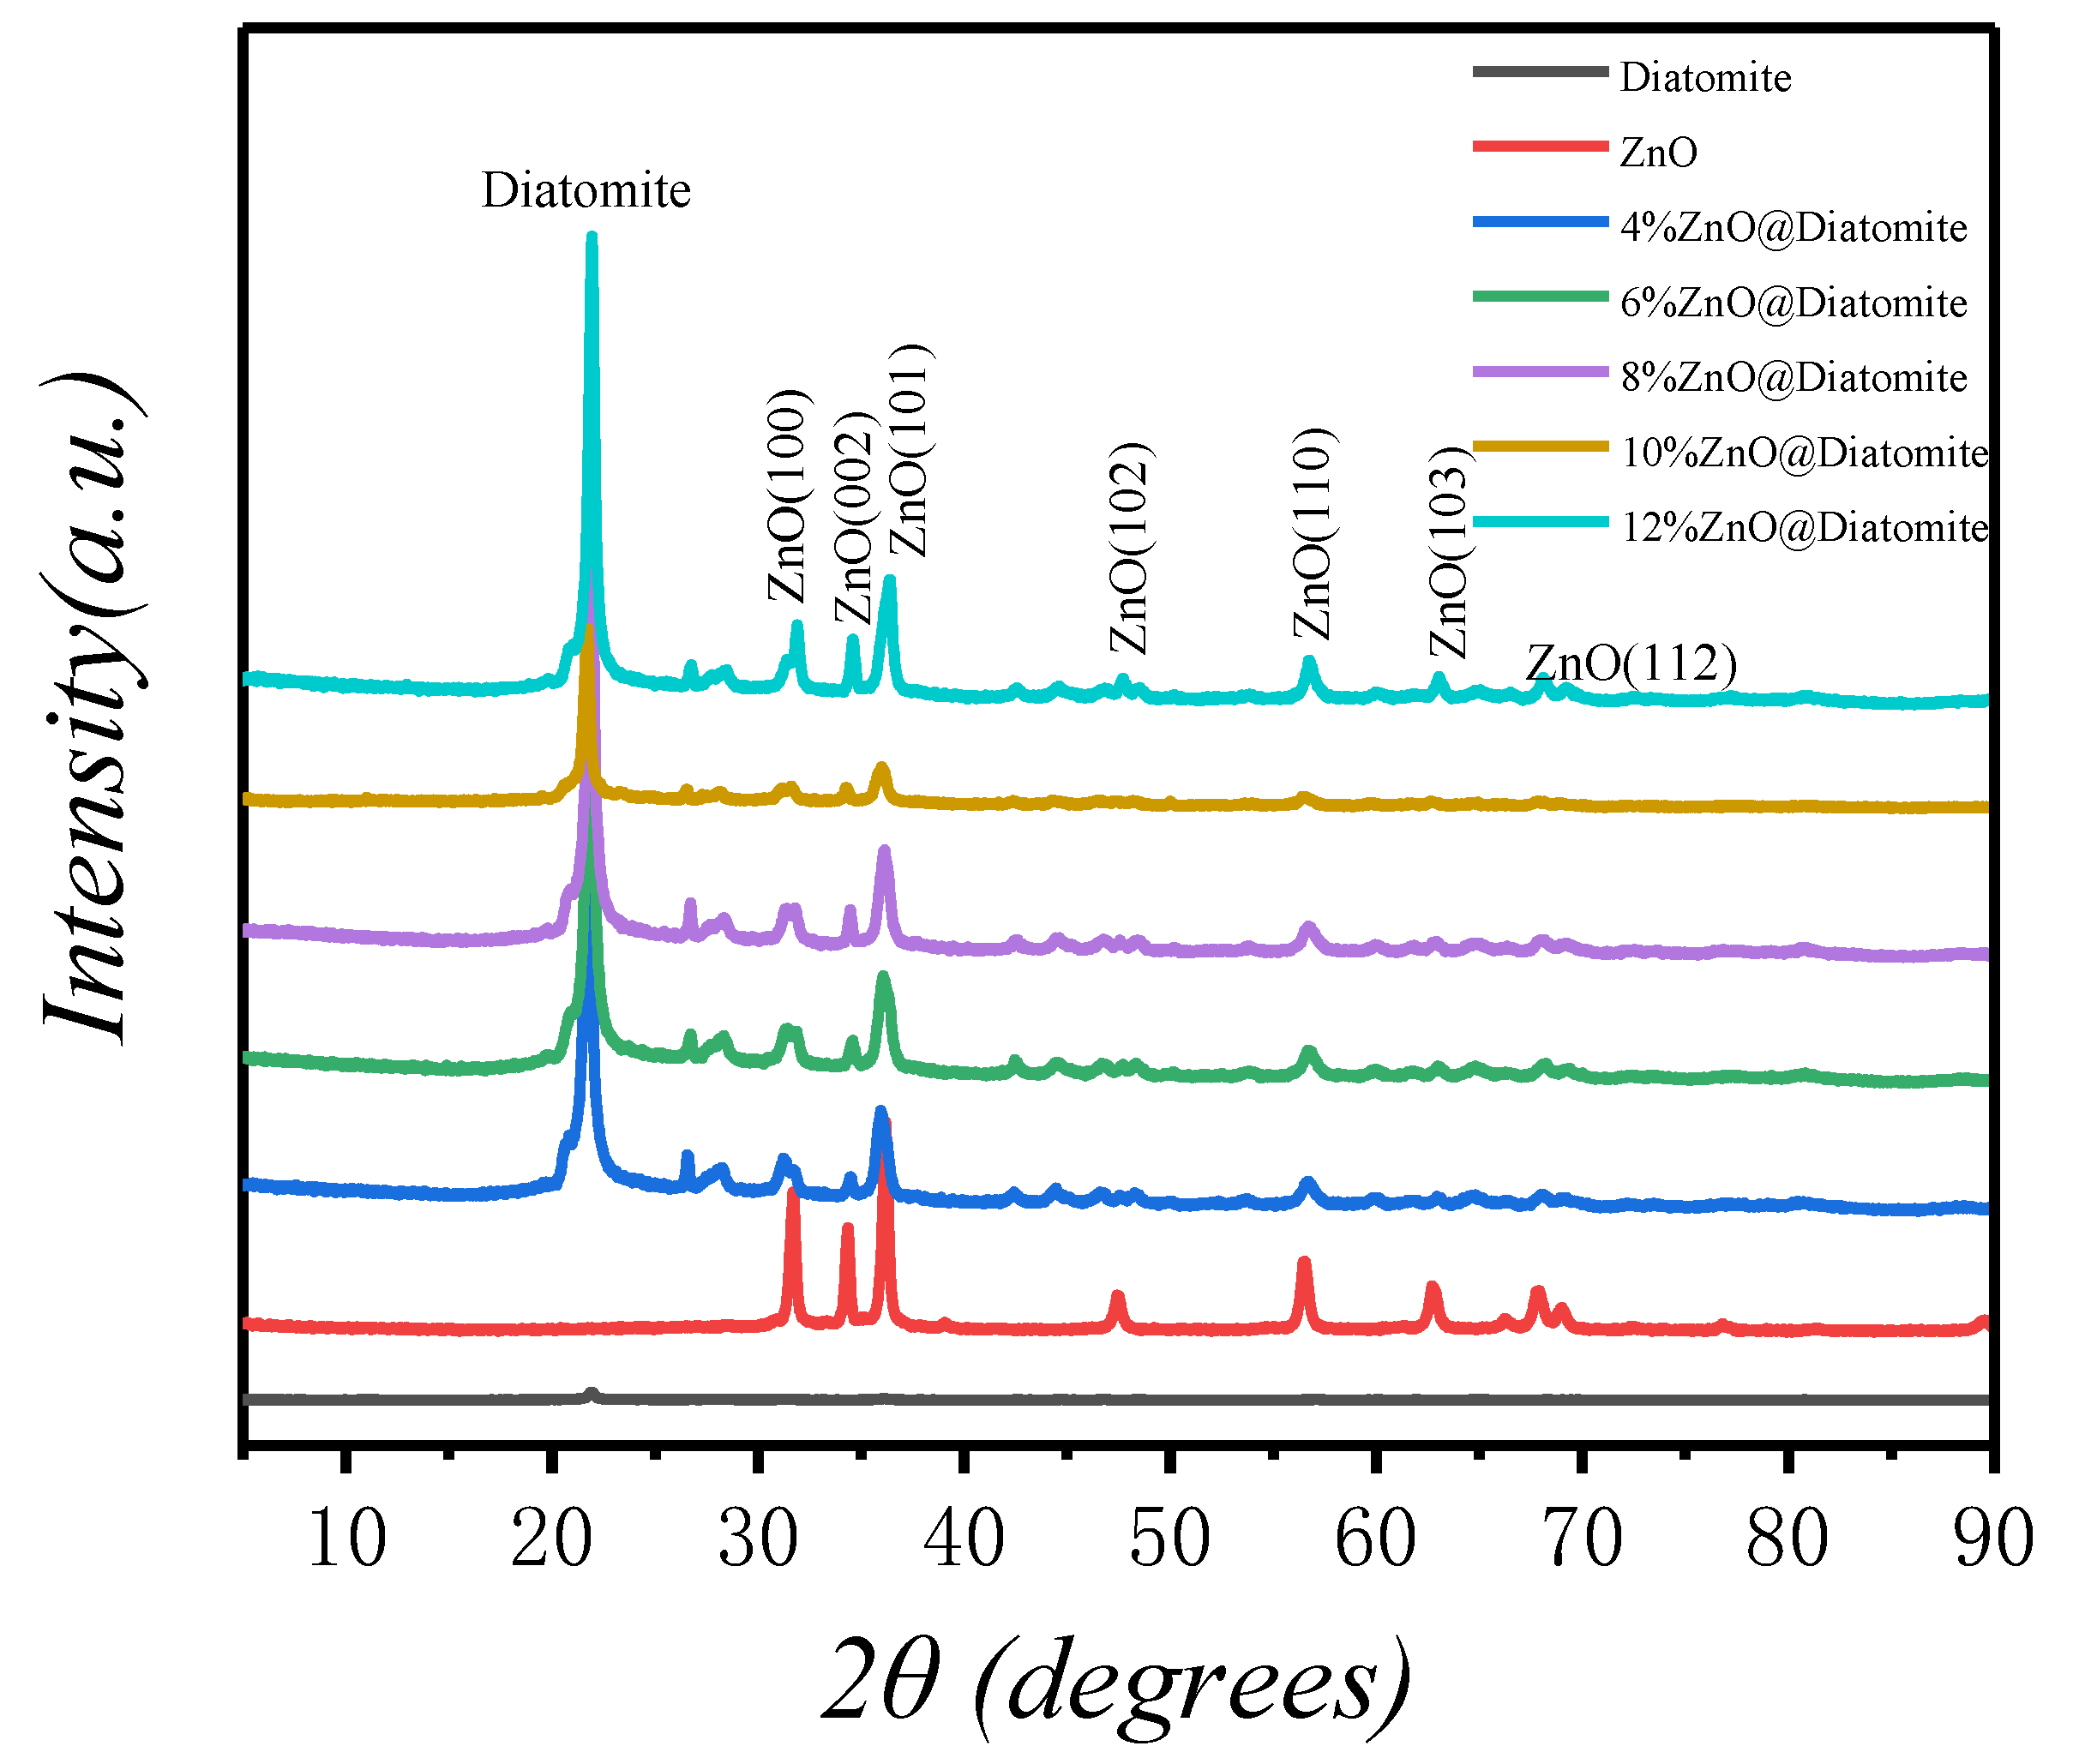
Figure 1 shows the XRD patterns of pure diatomite, pure ZnO, and X%ZnO@diatomite. The diffraction peaks at 31.8°, 34.4°, 36.2°, 47.5°, 56.6°, 62.8°, and 67.9° correspond to the crystal faces (100), (002), (101), (102), (110), (103), and (112) of hexagonal wurtzite ZnO, respectively [18,19]. The peaks at 21.8° and 36.5° are attributed to the SiO2 features in diatomite. All of the catalysts with various loading ratios show the coexistence of an anatase phase with no additional peak, implying that no impurities appear when ZnO is supported on diatomite. The reflection peak of diatomite becomes relatively low compared with that of ZnO, and the pure diatomite peak is not too weak in the X%ZnO@diatomite. Therefore, the introduction of diatomite does not affect the crystal structure of the catalysts. This result is consistent with the SEM and HRTEM characterizations.
2.2. SEM and HRTEM Investigations
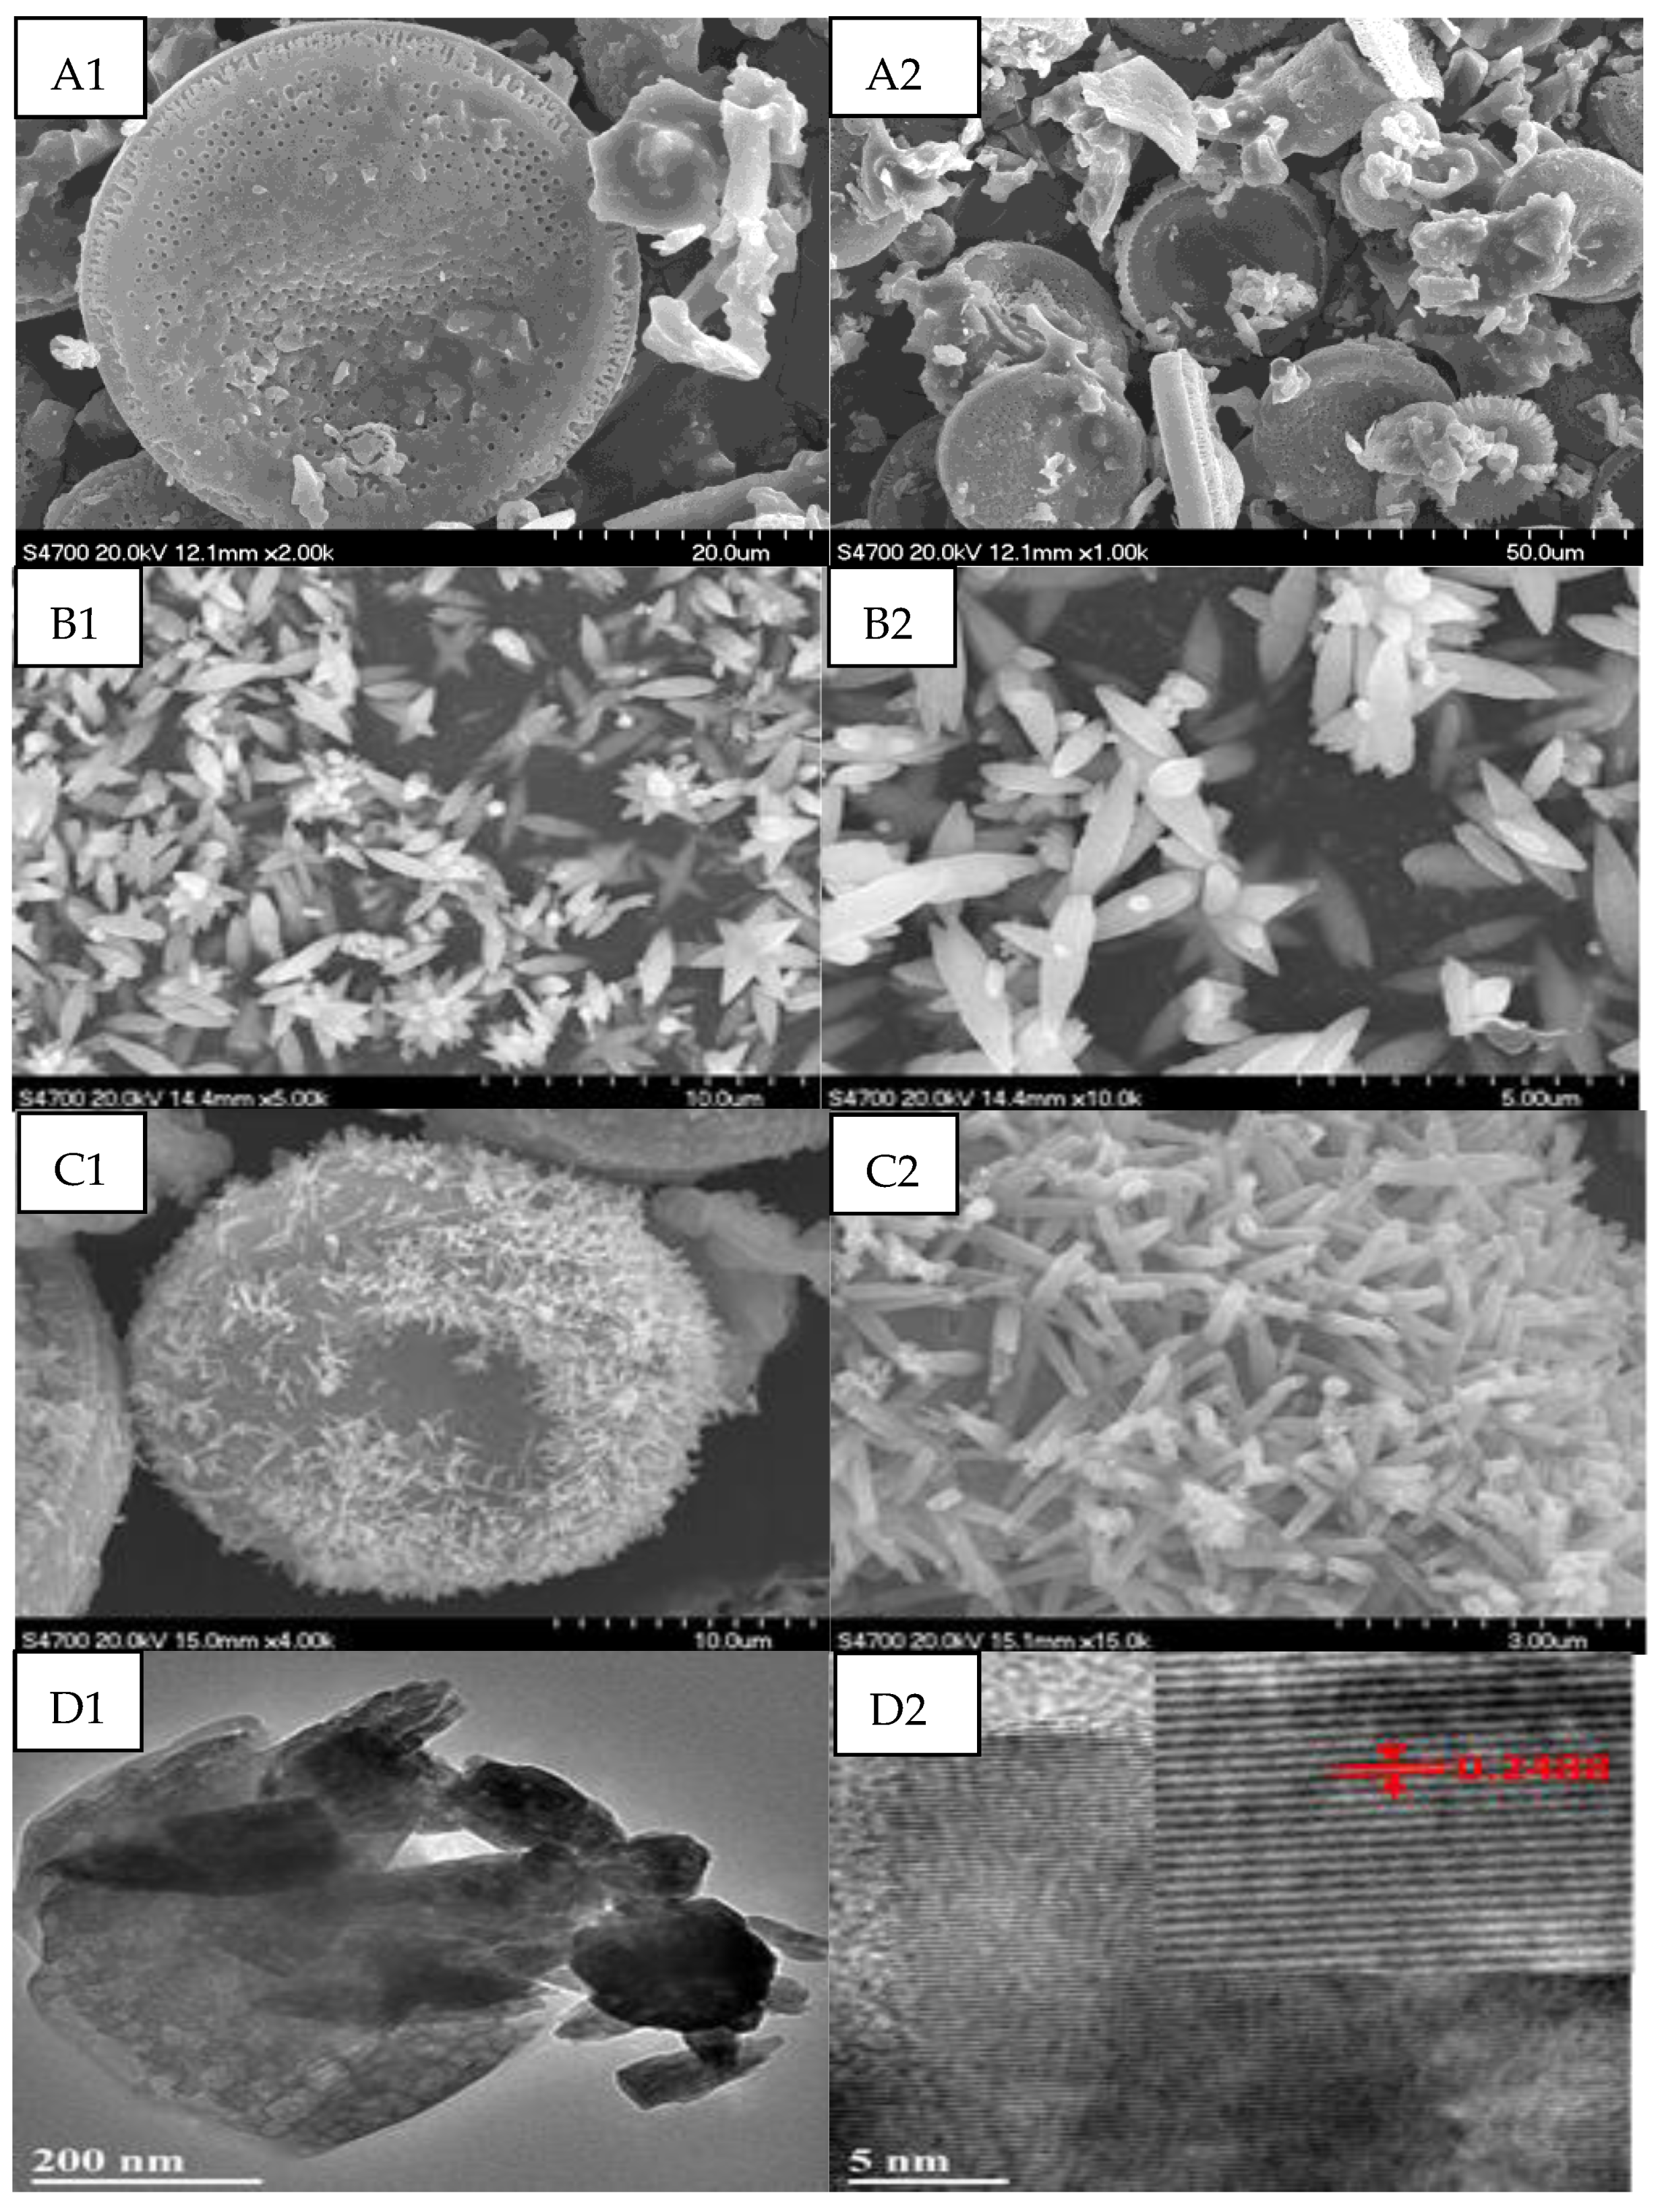
The appearance of the catalysts were characterized by SEM and HRTEM, as shown in Figure 2. It can be seen in Figure 2(A1,A2) that pure diatomite without the loading of ZnO nanoparticles has the appearance of a sunflower, with a smooth surface and numerous pores. The SEM images of pure ZnO displayed in Figure 2(B1,B2) indicate that the ZnO nanoparticles are prism-like, and the diameter of the pure ZnO particles measure approximately 45 nm in size, corresponding to the results of UV diffuse calculations. As is shown in the SEM images, ZnO with molar ratio loads of 10% Figure 2(C1,C2), the size of ZnO with a loading molar ratio of 10% on diatomite is about 15–20 nm. As shown in the HRTEM image in Figure 2(D1,D2), the lattice distance of ZnO is approximately 0.2488 nm, corresponding to the (101) plane of anatase ZnO.
2.3. EDS Analysis
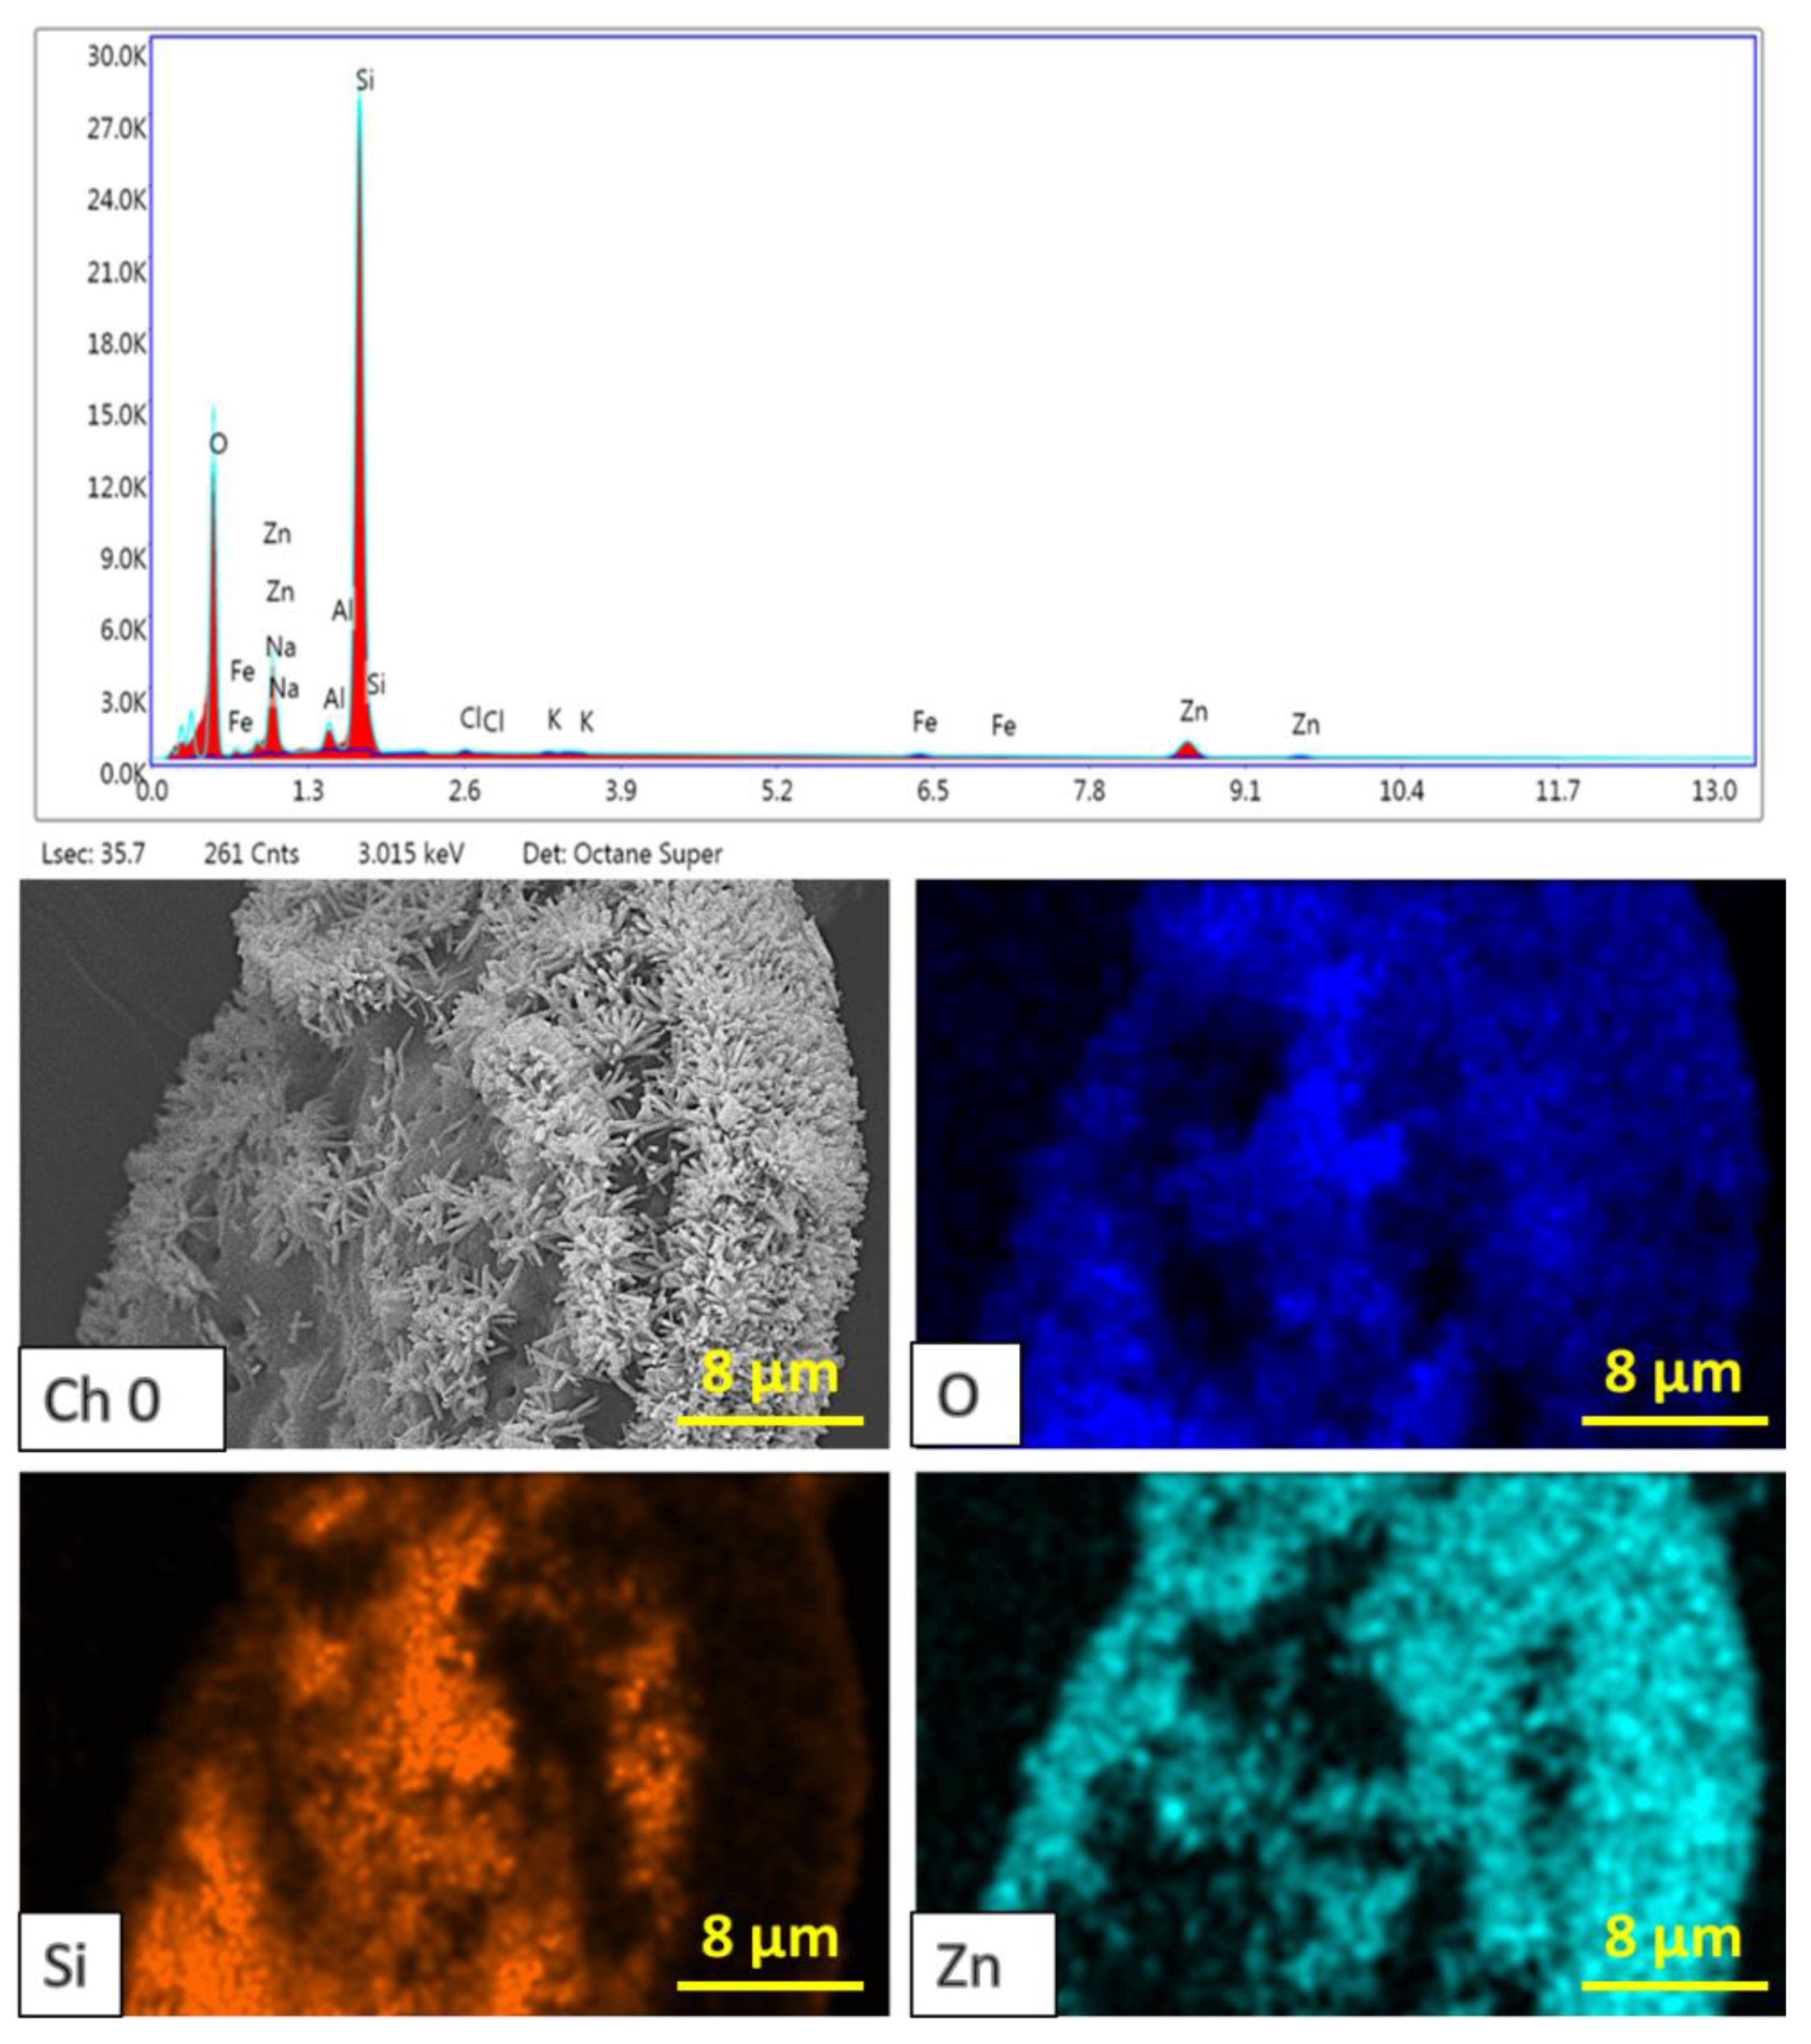
Figure 3 shows the diagram of the energy dispersive spectroscopy (EDS) and elemental mapping of the 10% ZnO@diatomite sample, which clearly shows that ZnO nanoparticles are uniformly distributed on the diatomite surface of silicon, and the Zn, O, and Si elements are evenly distributed.
2.4. EPR Analysis
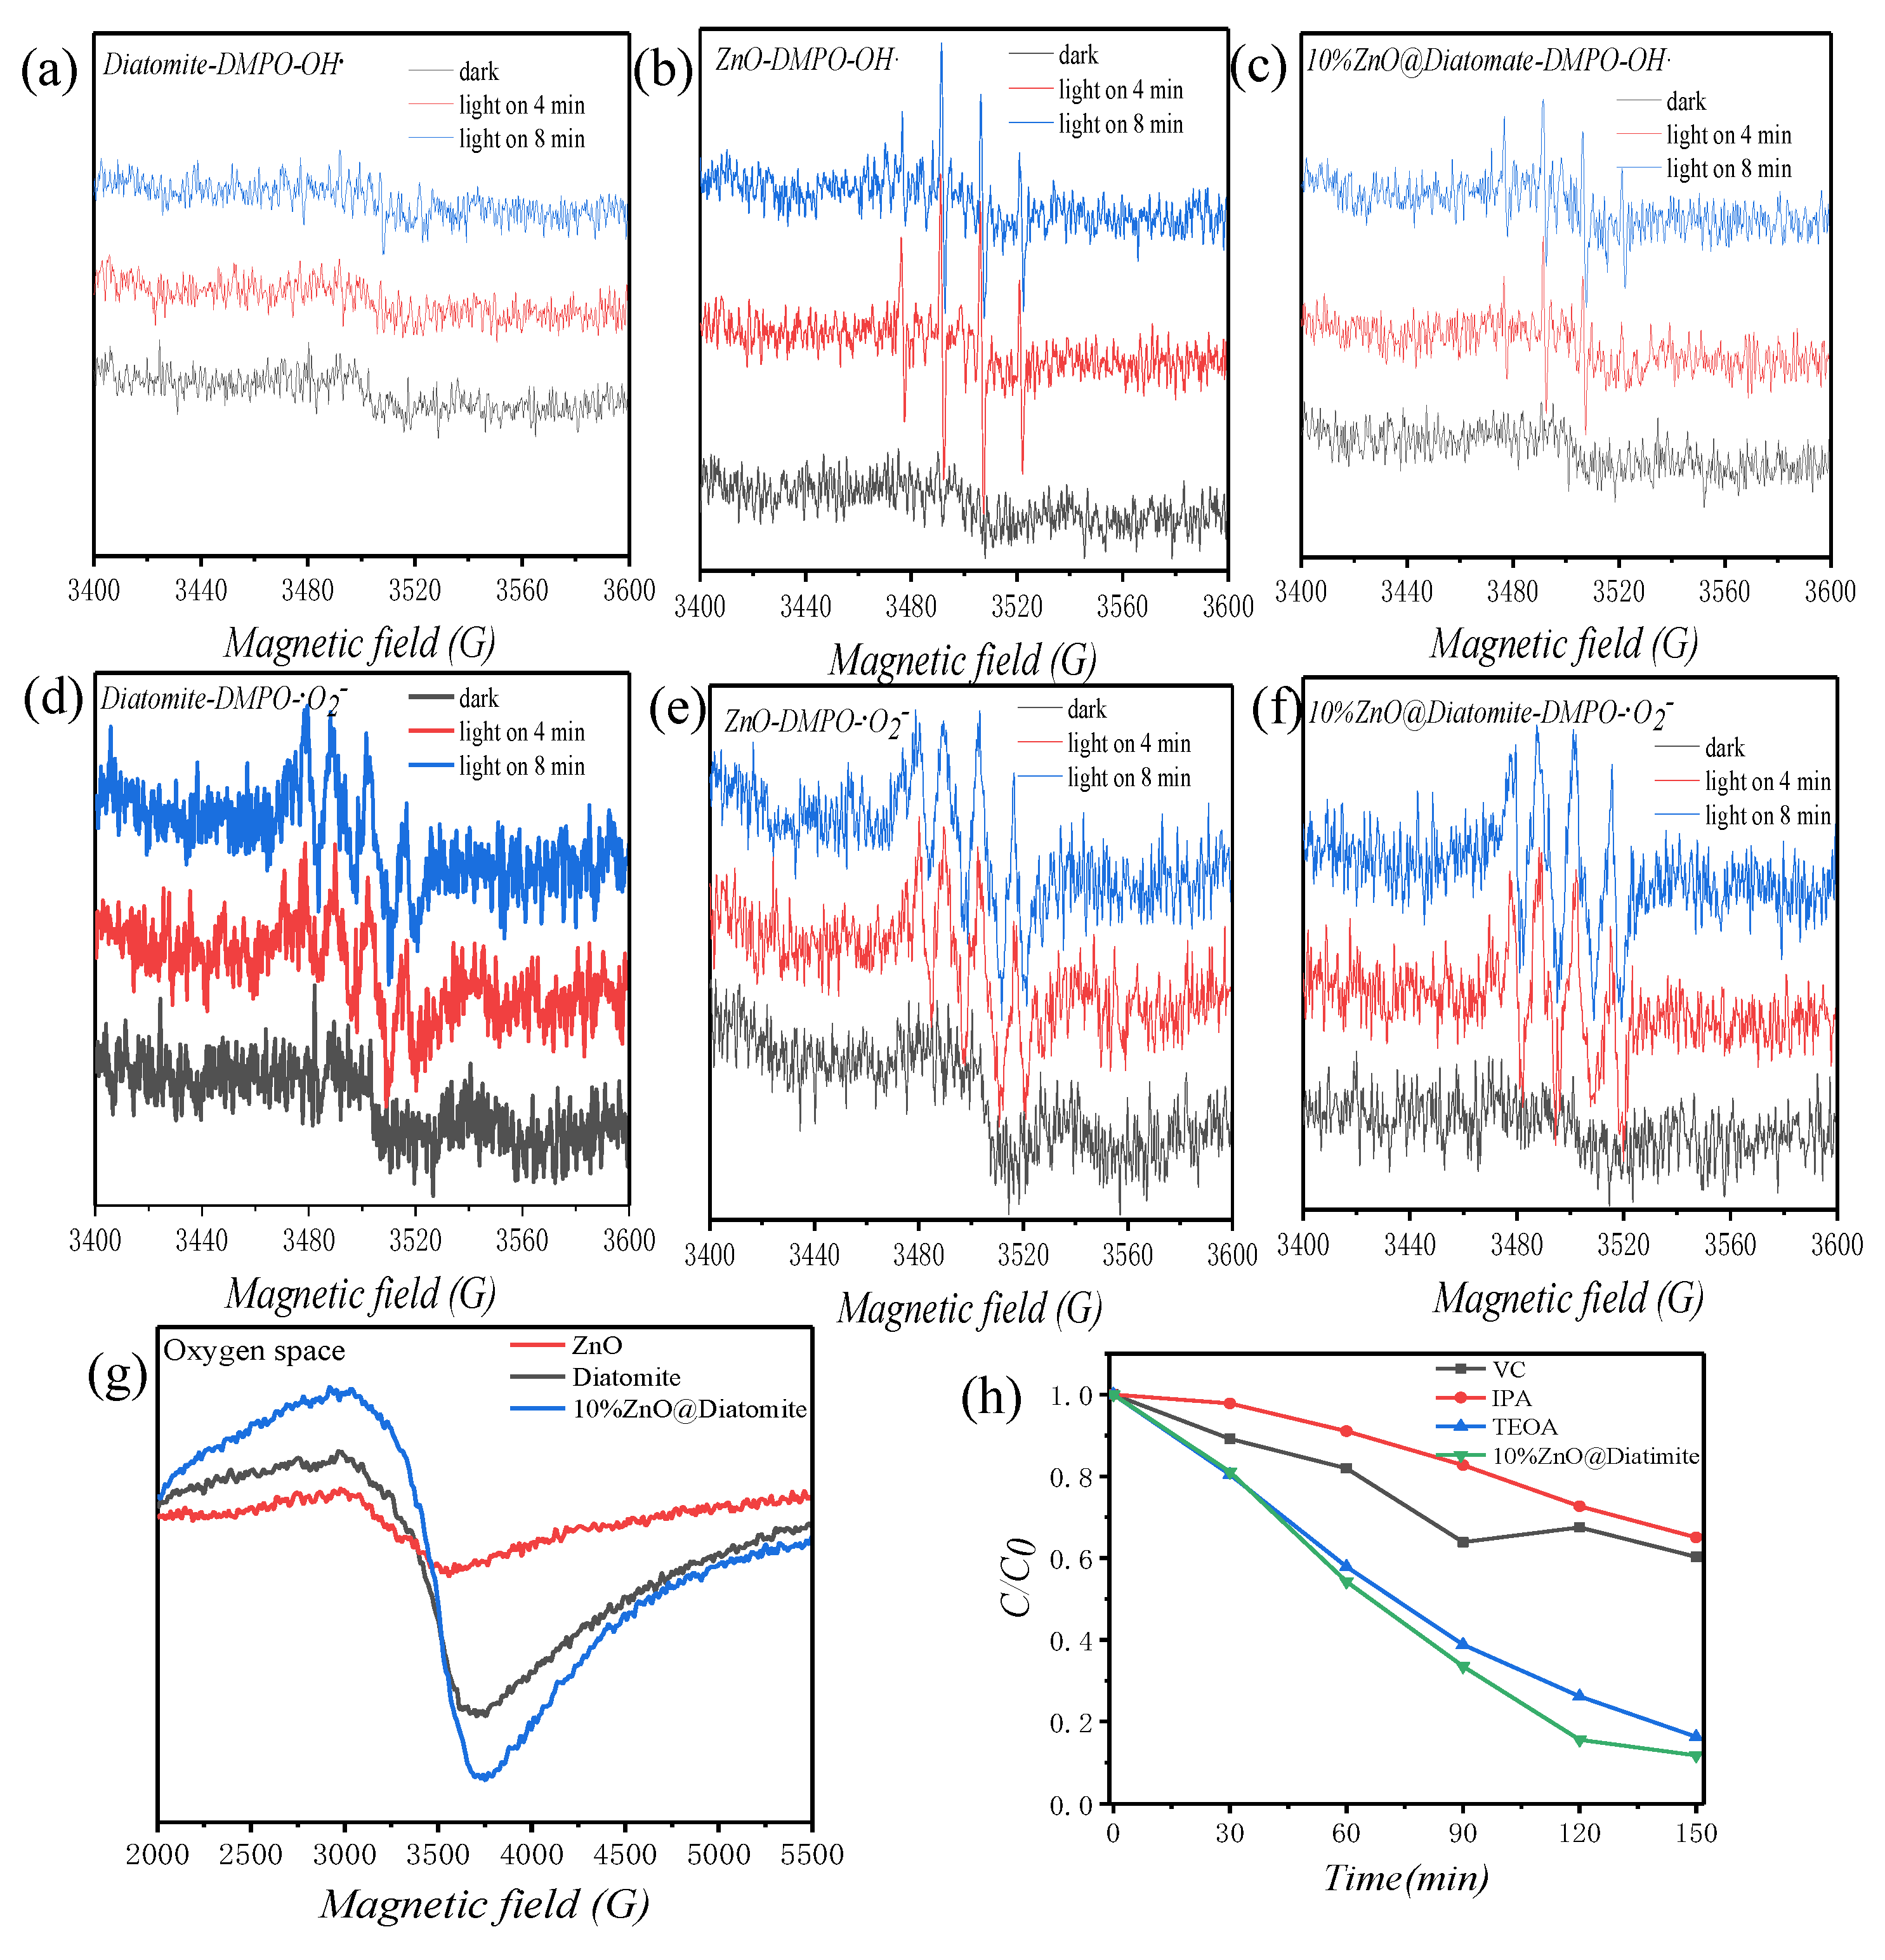
For the photodegradation of organic dyes, three main active substances participate in the reaction, i.e., photoliving holes (), hydroxyl radicals (OH), and hyperoxygen radicals () [20,21]. In order to explore the mechanisms of this photocatalytic process, triethanolamine (TEOA), isopropanol (IPA), and ascorbic acid (VC) were used to capture h+, OH, and O2− active species with capture amounts of 1 mmol, and the results are shown in Figure 4h. Figure 4h shows that the degradation rate of MB solution without any free radical scavengers was 88.28% under visible light, while the degradation rate of the experimental group with the free radical scavengers decreased to different degrees, with TEOA at 83.73%, IPA at 34.96%, and VC at 39.71%, respectively. This result shows that the influence of active species on photocatalytic MB solution is in the order of < < OH. The photocatalytic properties of the material are closely related to the number of active species produced in the reaction system, so the electron paramagnetic resonance(EPR) technique was used to characterize the active species , OH, and . Figure 4a–g shows the signals of active species , OH, and . After irradiation with the xenon lamp, all active species can be detected, and the signal intensity of the active species increases with the increase of xenon lamp irradiation time. In Figure 4a–c, the samples were irradiated with the xenon lamp for 4 min or 8 min, and pure ZnO nanoparticles had the strongest signal of OH. In Figure 4d–f, the samples were irradiated with the xenon lamp for 4 min or 8 min, and 10% ZnO@diatomite had the strongest signal of . In Figure 4g, the oxygen vacancy defect test results showed the largest number of oxygen vacancy defects in 10% ZnO@diatomite, indicating that the ability of the photocatalytic degradation of the MB solution is more closely related to and oxygen vacancies.
2.5. XPS Analysis
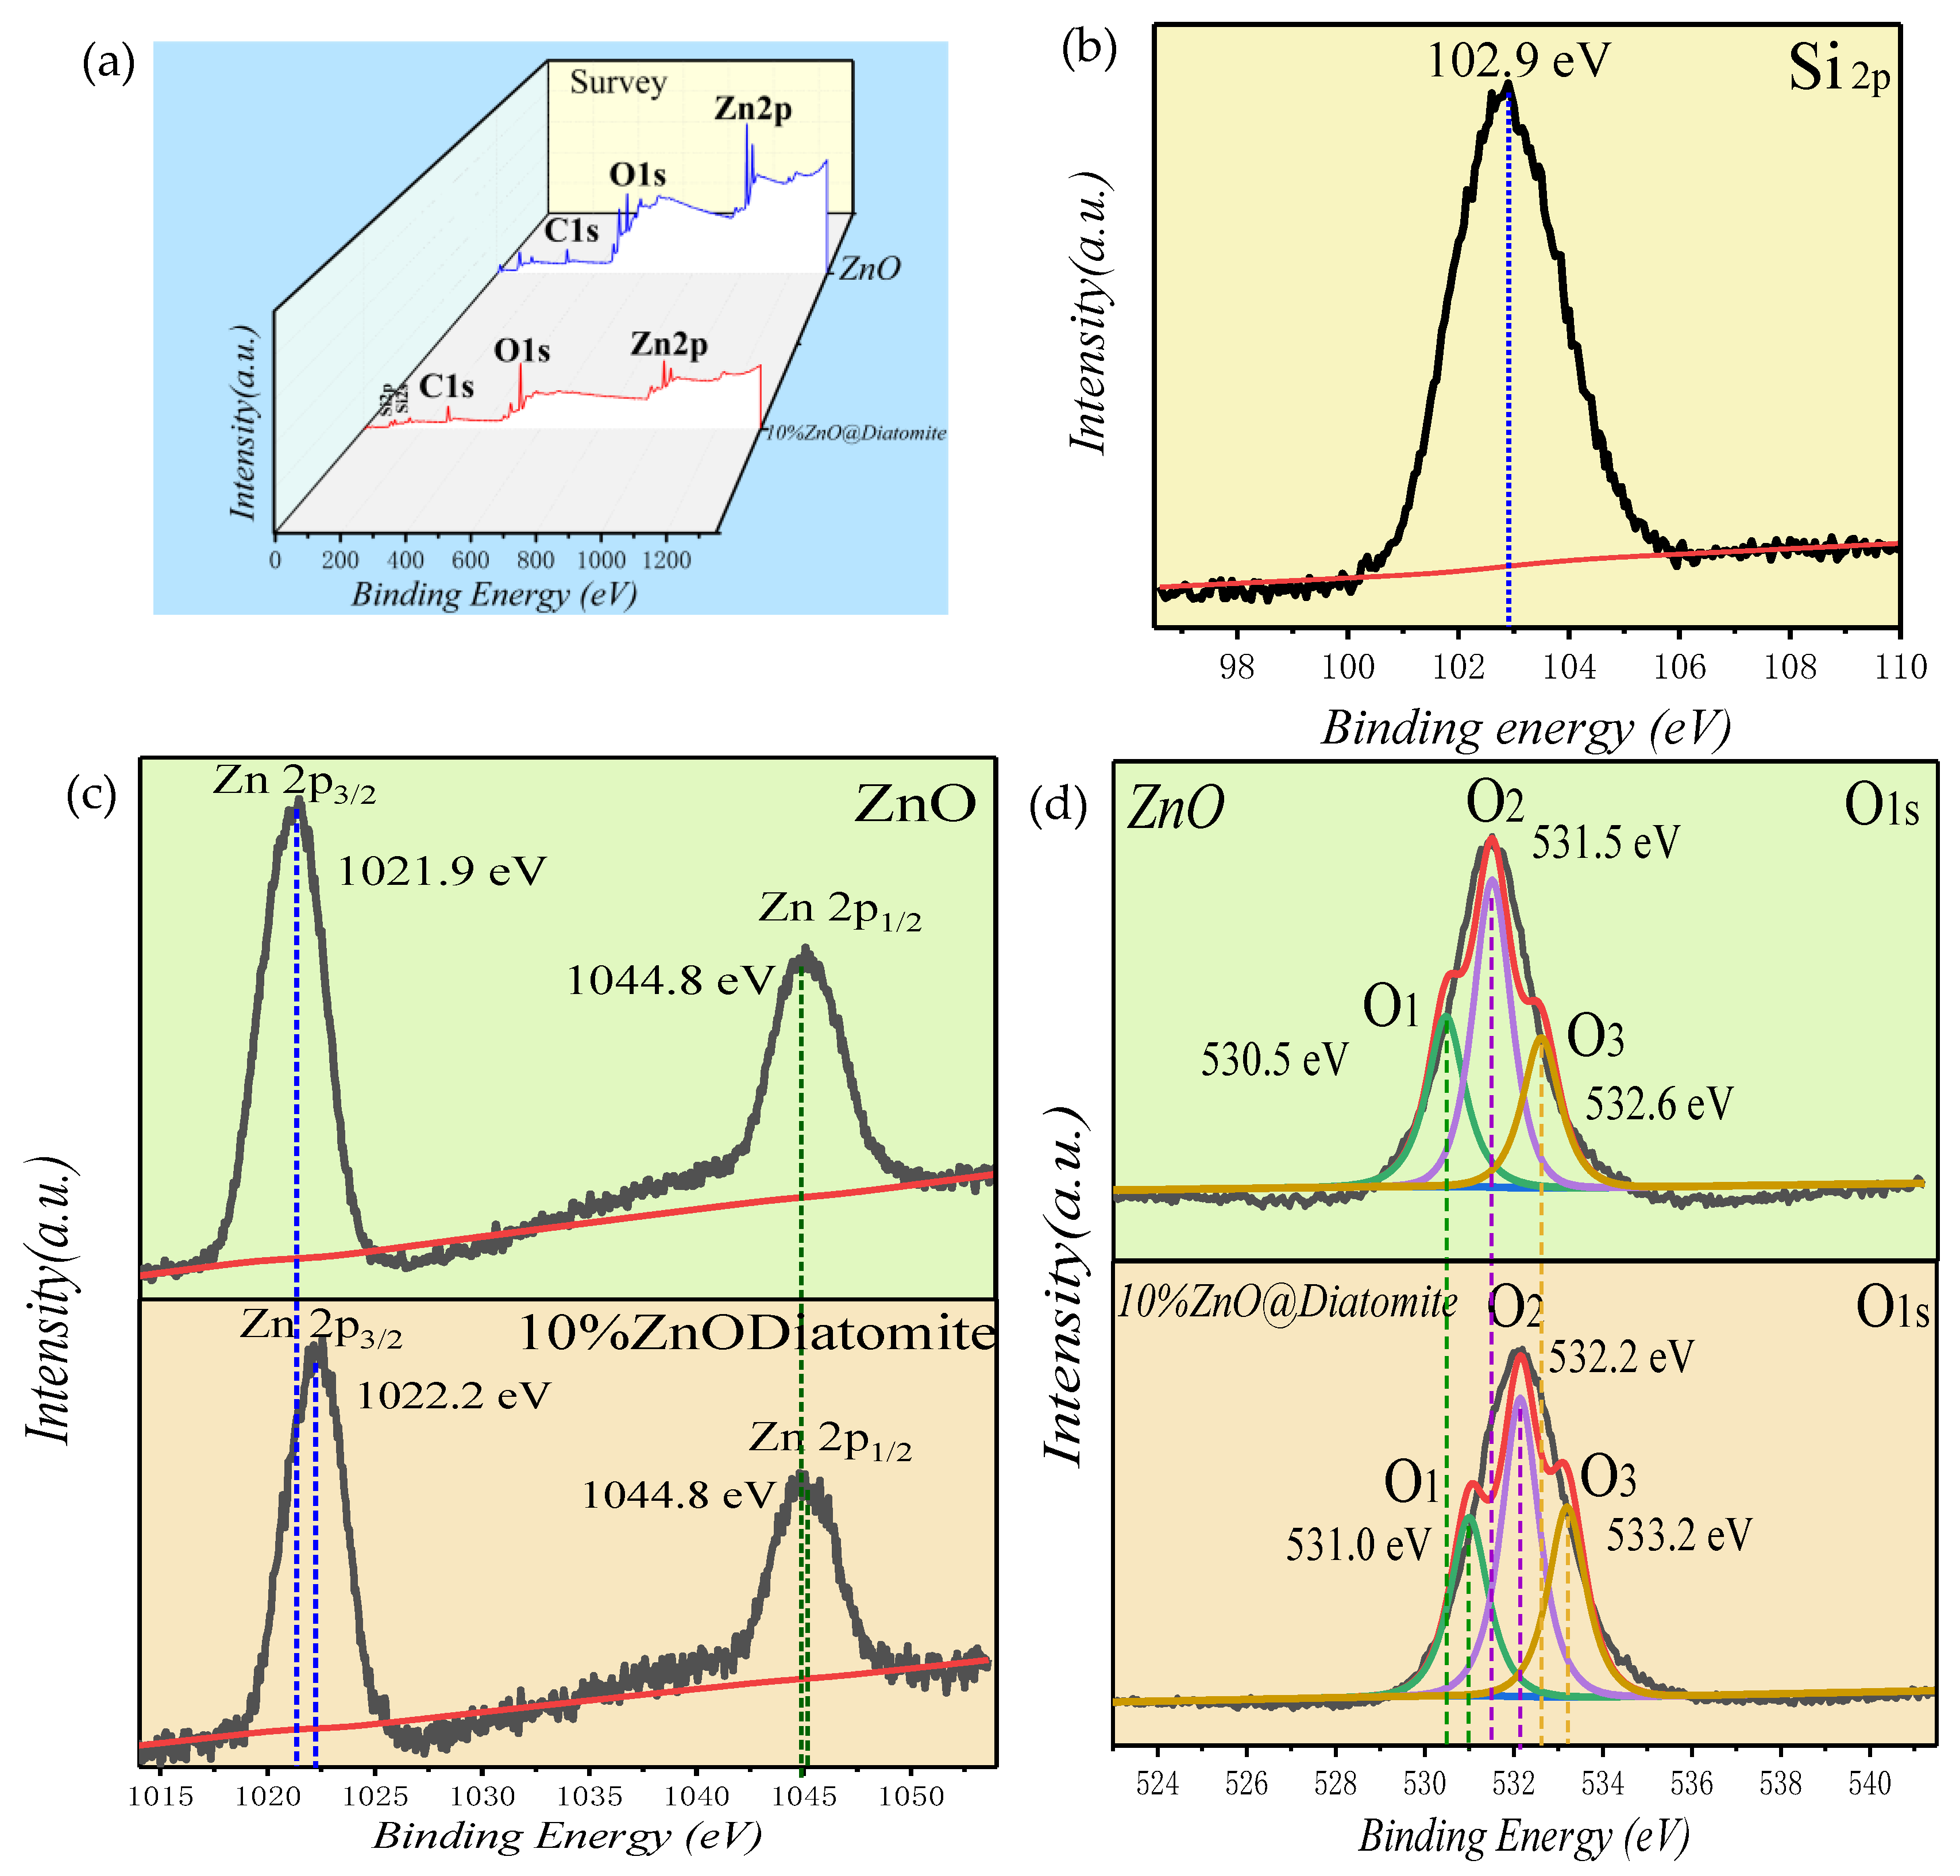
X-ray photoelectron spectroscopy (XPS) was conducted to analyze the elemental chemical environment [22,23]. Figure 5 shows the XPS results for pure ZnO and the composite catalyst with the loading ratio of 10%. The survey spectra of the two catalysts are shown in Figure 5a, where only the three elements Zn, O, and C are displayed for pure ZnO, and the four elements Si, Zn, O, and C are shown for the composite catalyst with a loading ratio of 10%. Figure 5b shows the 2p peak of Si (102.9 eV) for diatomite. The Zn 2p spectrum for pure ZnO (Figure 5c) shows a pair of peaks, at 1021.9 eV (2p3/2) and 1044.8 eV (2p1/2). The Zn 2p spectrum of composite catalysts (Figure 5c) shows a pair of peaks at 1022.2 eV (2p3/2) and 1044.8 eV (2p1/2). The results demonstrate that the ZnO interacts with the diatomite and generates a Zn–O–Si bond. Figure 5d is the O1s for the two catalysts; generally, O1s is divided into surface adsorption oxygen, metal–oxygen bonds, and oxygen vacancies. O1 indicates metal–oxygen, O2 is surface oxygen, and O3 is oxygen vacancies. After comparative analysis, as shown in Table 1, the results show that O1 and O2 decreased slightly, while O3 increased significantly. The presence of oxygen vacancies in the composite catalysts improve photocatalytic performance.
2.6. BET Analysis
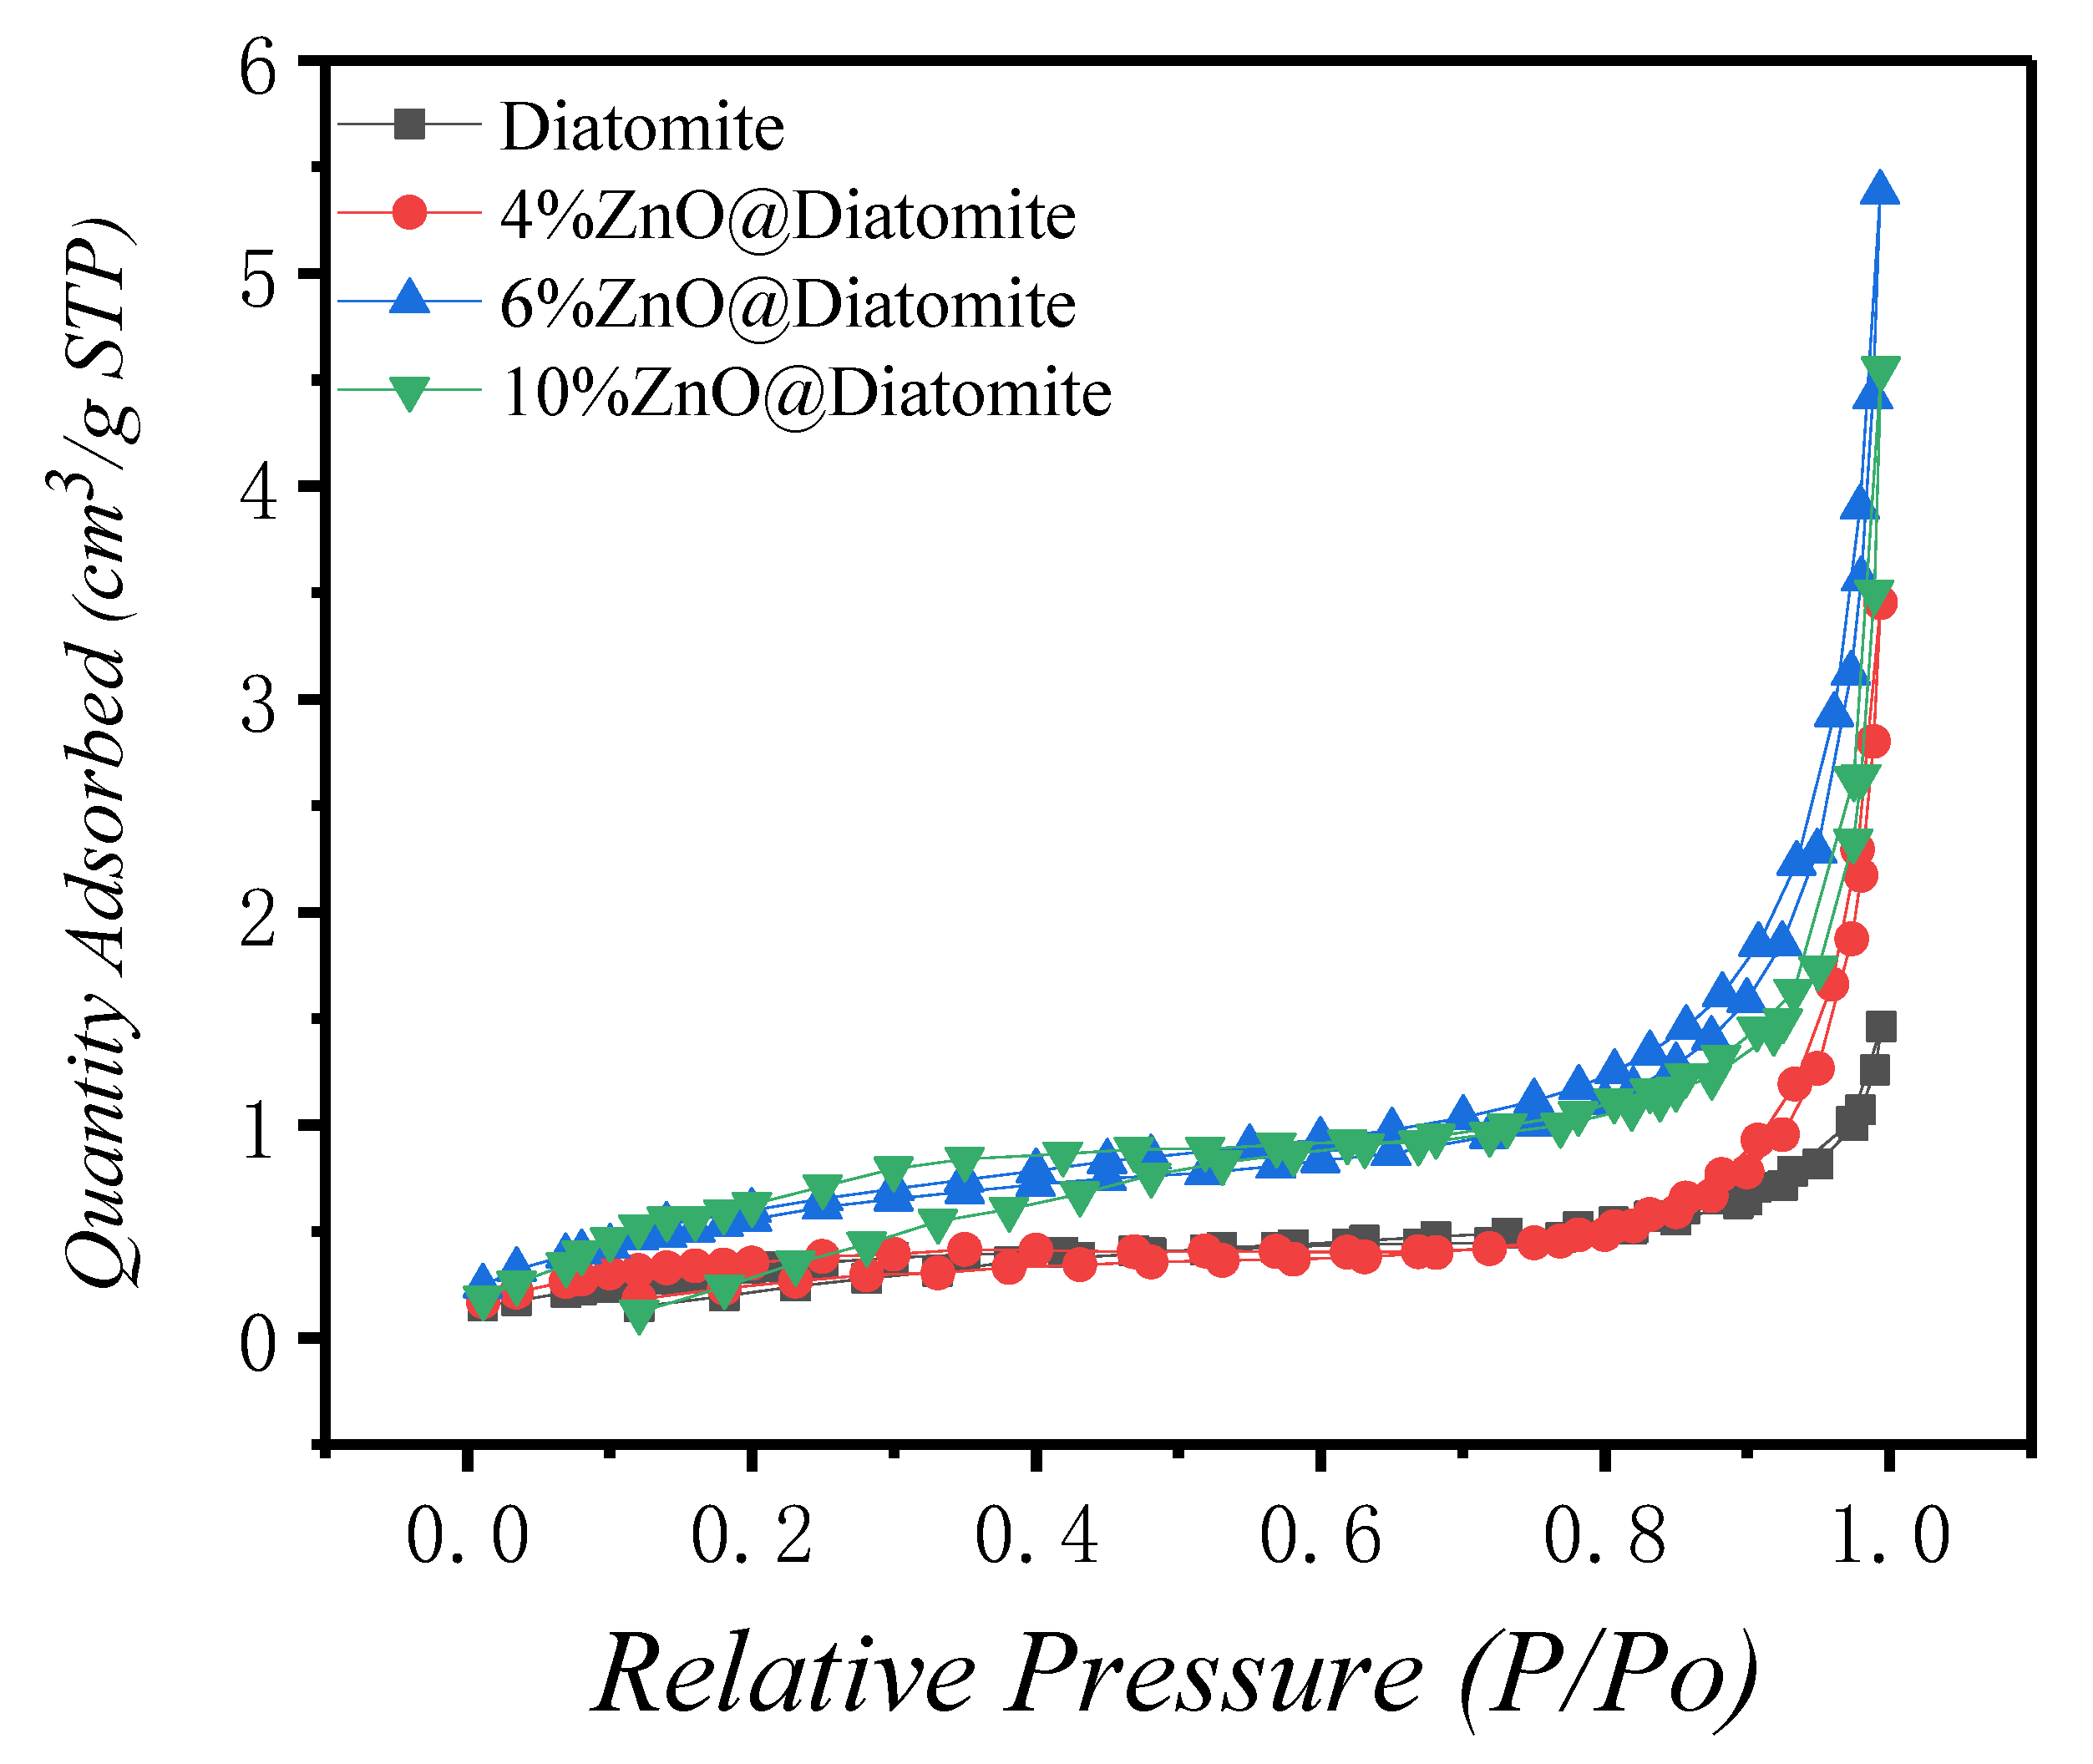
As shown in Table 2, the specific surface areas of different catalysts were analyzed by Brunauer–Emmett–Teller (BET) test. The specific surface area of pure diatomite is small. Therefore, the contribution of diatomite to the specific surface area of the composites is very small. With the increase of loading rate, the specific surface area increases. The specific surface area of the composite catalyst with a loading rate of 10% is larger. These results show that the specific surface area is related to the photocatalytic performance. As can be seen from Figure 6, the diatomite shows International Union of Pure and Applied Chemistry (IUPAC) type-II isotherms, indicating the presence of micropores in the diatomite; the X%ZnO@diatomite composites display type-IV isotherms with an overlap of the H2 and H3 hysteresis loops, which is related to the deposition of ZnO nanoparticles on the surface of the diatomite.
2.7. UV-Vis Diffuse Reflectance Spectra
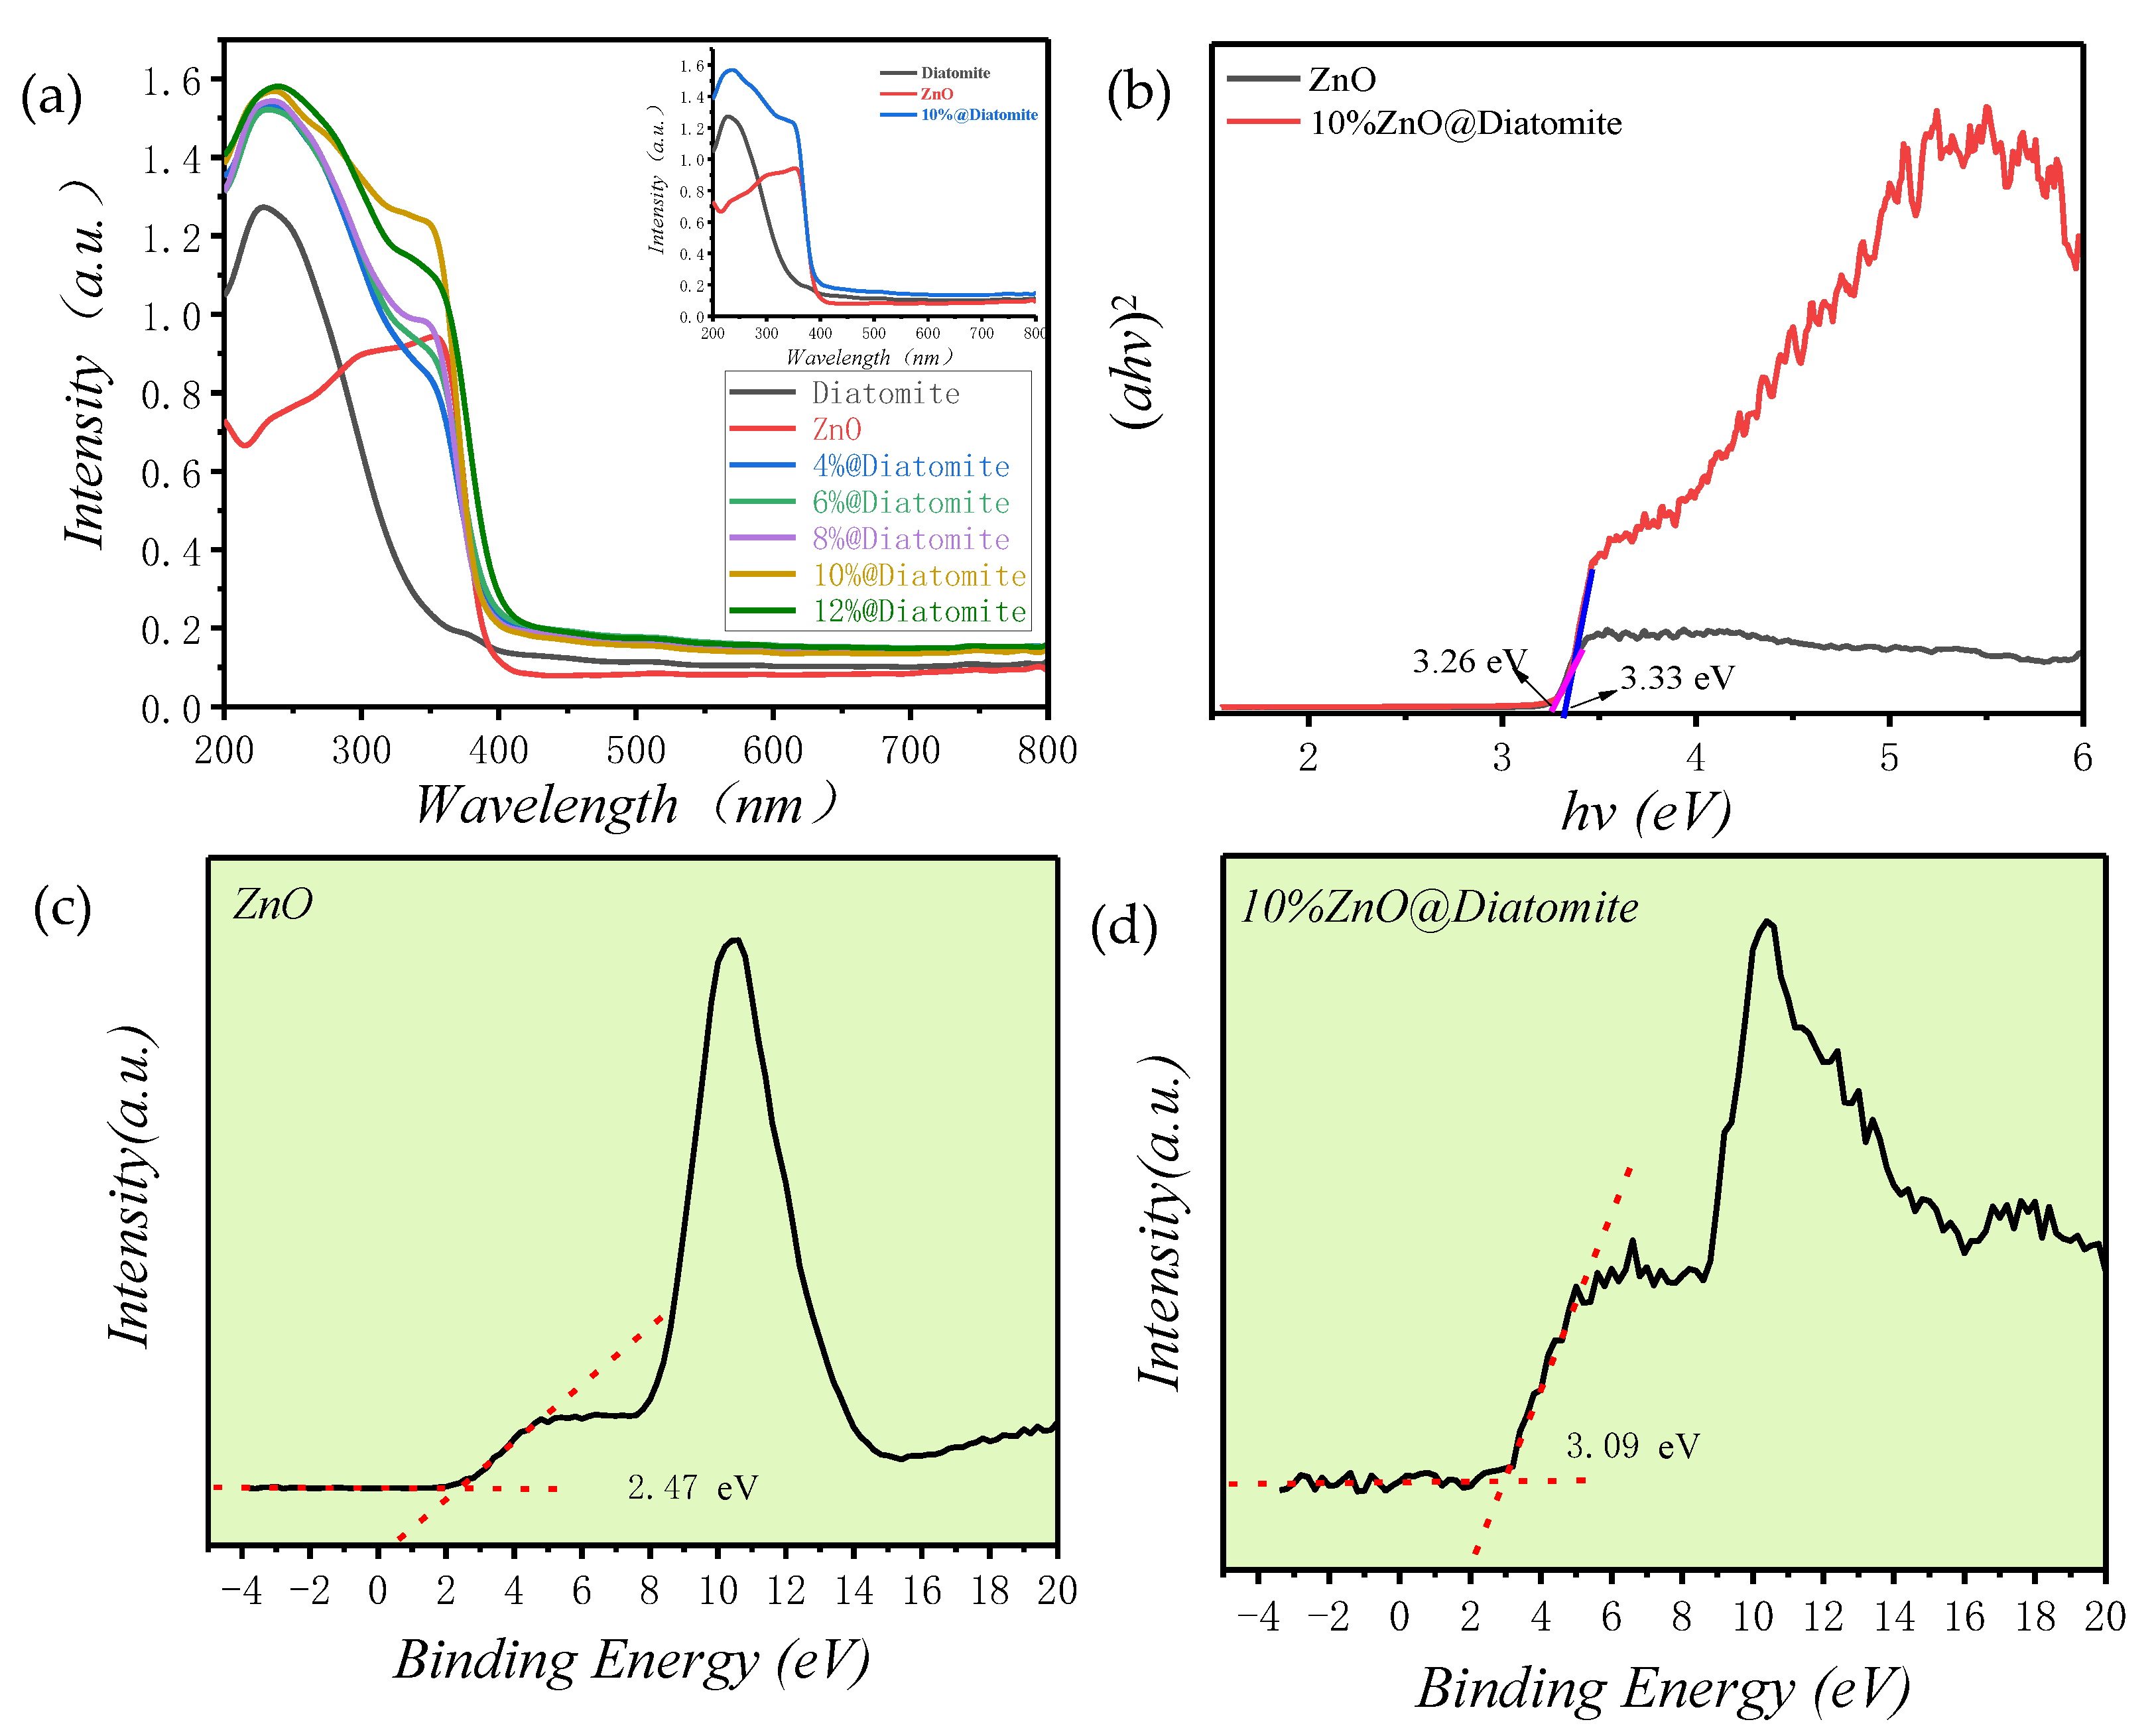
The absorption spectra of the samples were obtained by UV visible spectrophotometer (UV-vis) with a wavelength scanning range of 200~800 nm, to characterize the light absorption characteristics of the catalysts [24]. From Figure 7a, nano ZnO has a distinct UV absorption peak at 376 nm. However, for diatomite, there is no absorption about 400 nm. For the catalysts with various molar loading ratios, there are obvious UV absorption peaks at 376 nm, which proves the successful loading of ZnO. The analytical data show that the composites with various molar loading ratios had strong ultraviolet absorption at 10%. By using the Tauc plot, the band gaps of the samples were calculated. The broadening of the energy spacing of nanomaterials shows the size and the range of momentum and energy changes in electrons.
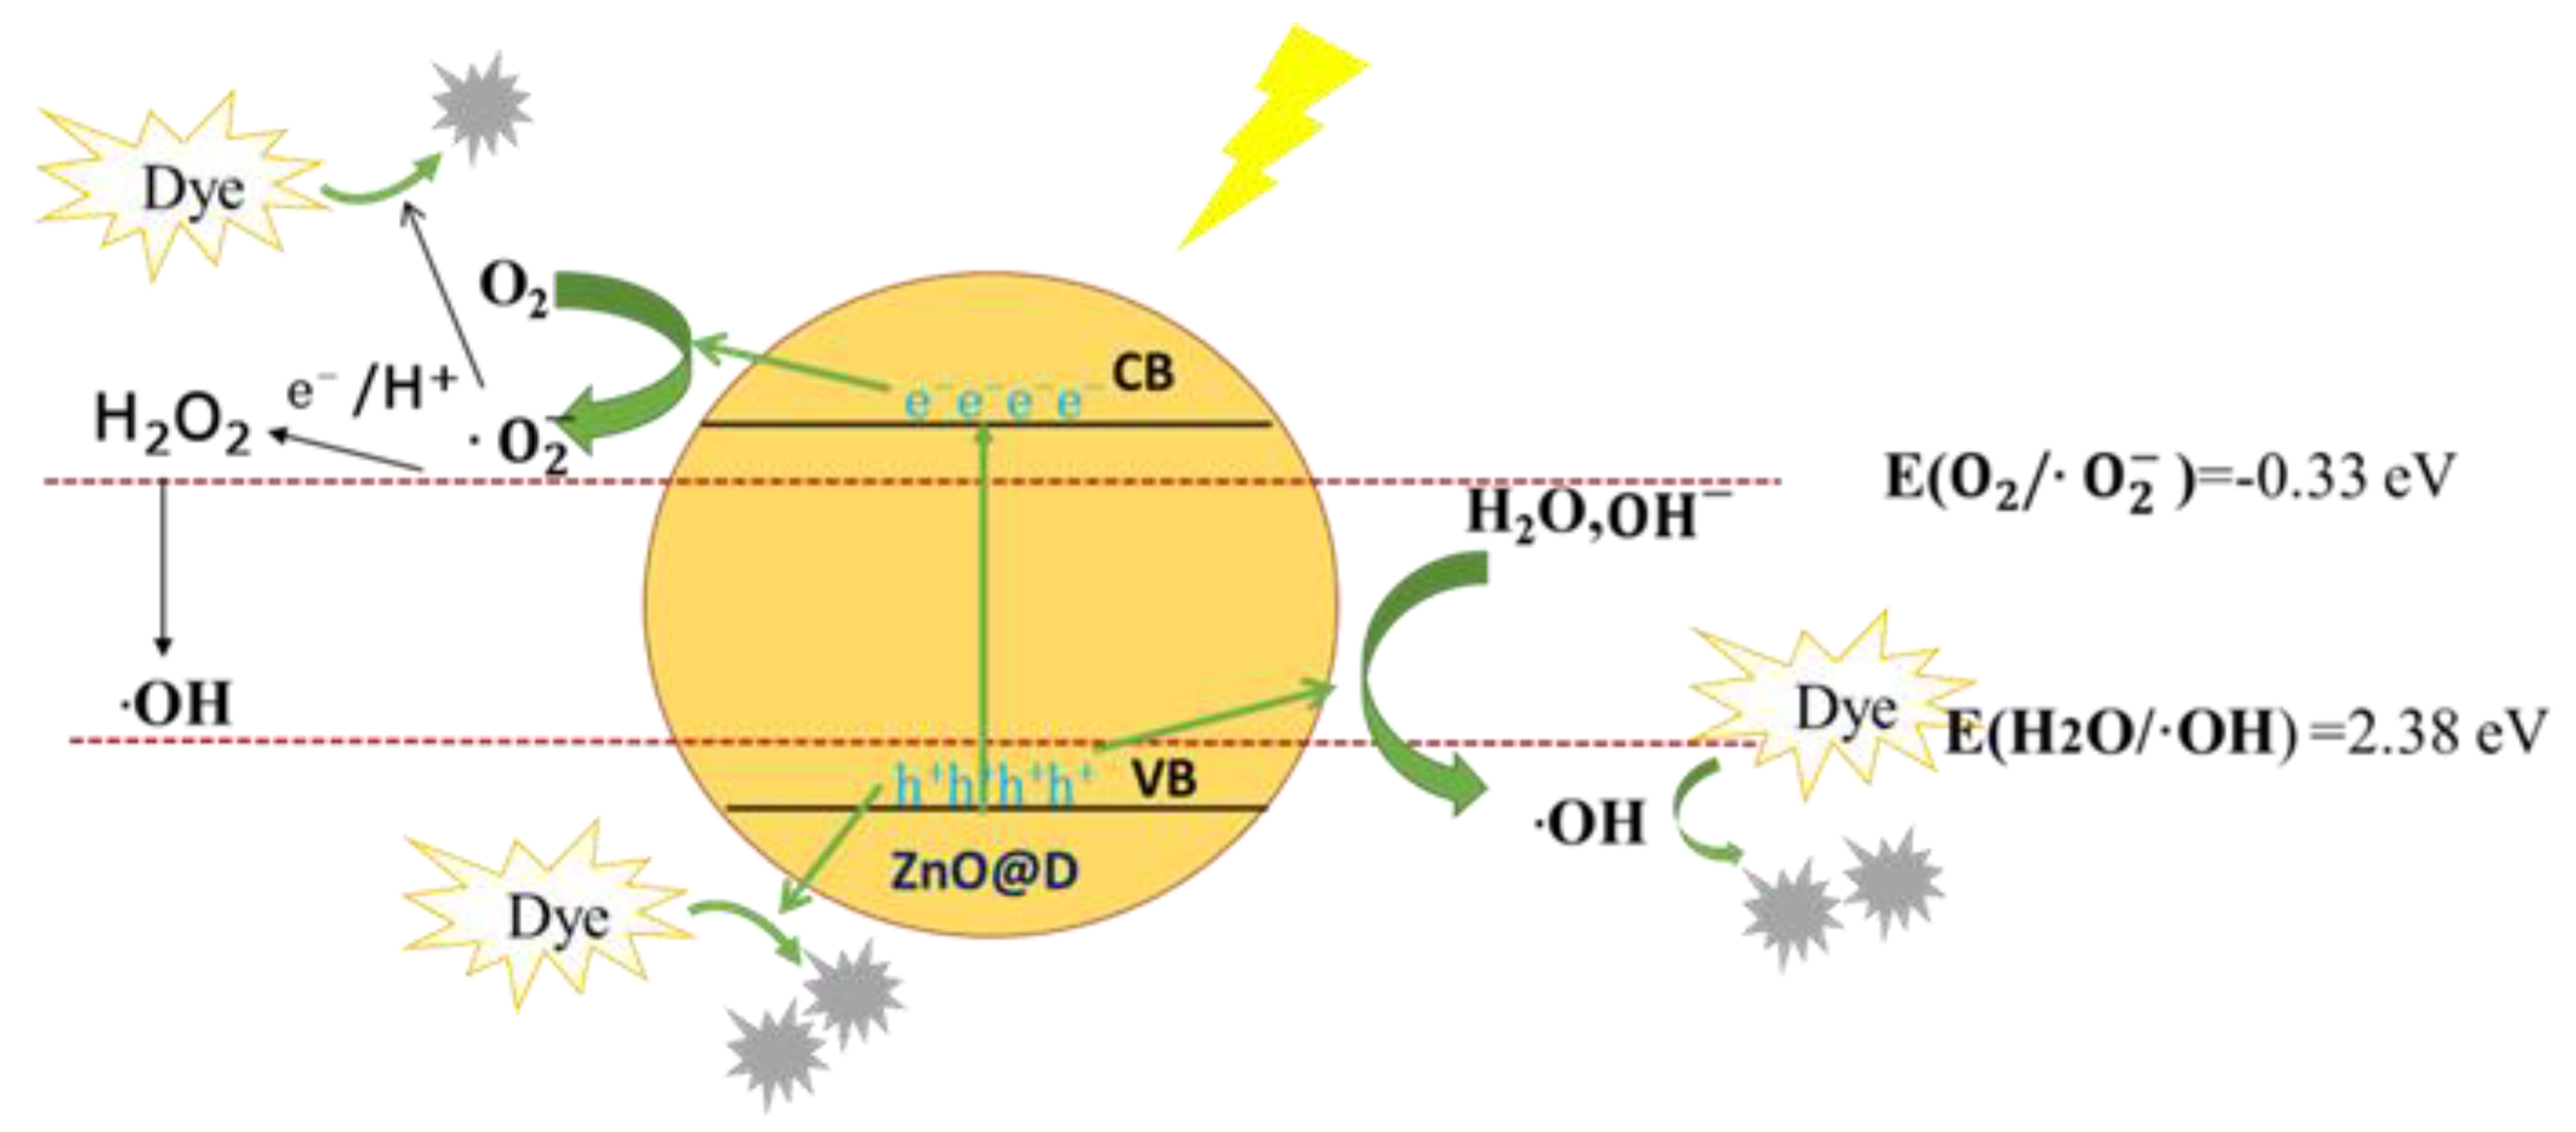
The light absorption coefficient satisfies the equation: , is the light absorption coefficient, A is the proportional constant, h is the Planck constant, ν is the frequency of light, hν is the photon energy, Eg is the energy gap. The value of Eg is obtained by extending the linear part of the curve when α = 0. Figure 7b shows the ()2–() relationship curve of pure ZnO and 10% ZnO@diatomite, from which the band gap values are determined to be 3.26 eV and 3.33 eV, respectively. Figure 7c,d shows the XPS valence band spectra of pure ZnO and 10% ZnO@diatomite, determining that the valence bands are located at 2.47 eV and 3.09 eV, respectively. By combining the band gap values and valence values of the samples, the conduction bands bottom of pure ZnO and 10% ZnO@diatomite are found at −0.79 eV and −0.24 eV, respectively. It was reported in the literature that (H2O/OH) has a redox potential of 2.38 eV, while the (/) redox potential is −0.33 eV. Obviously, the calculated energy band structures for the samples conform to the formation of potential requirements for active species, such as OH and.
2.8. Photoluminescence (PL) Spectra
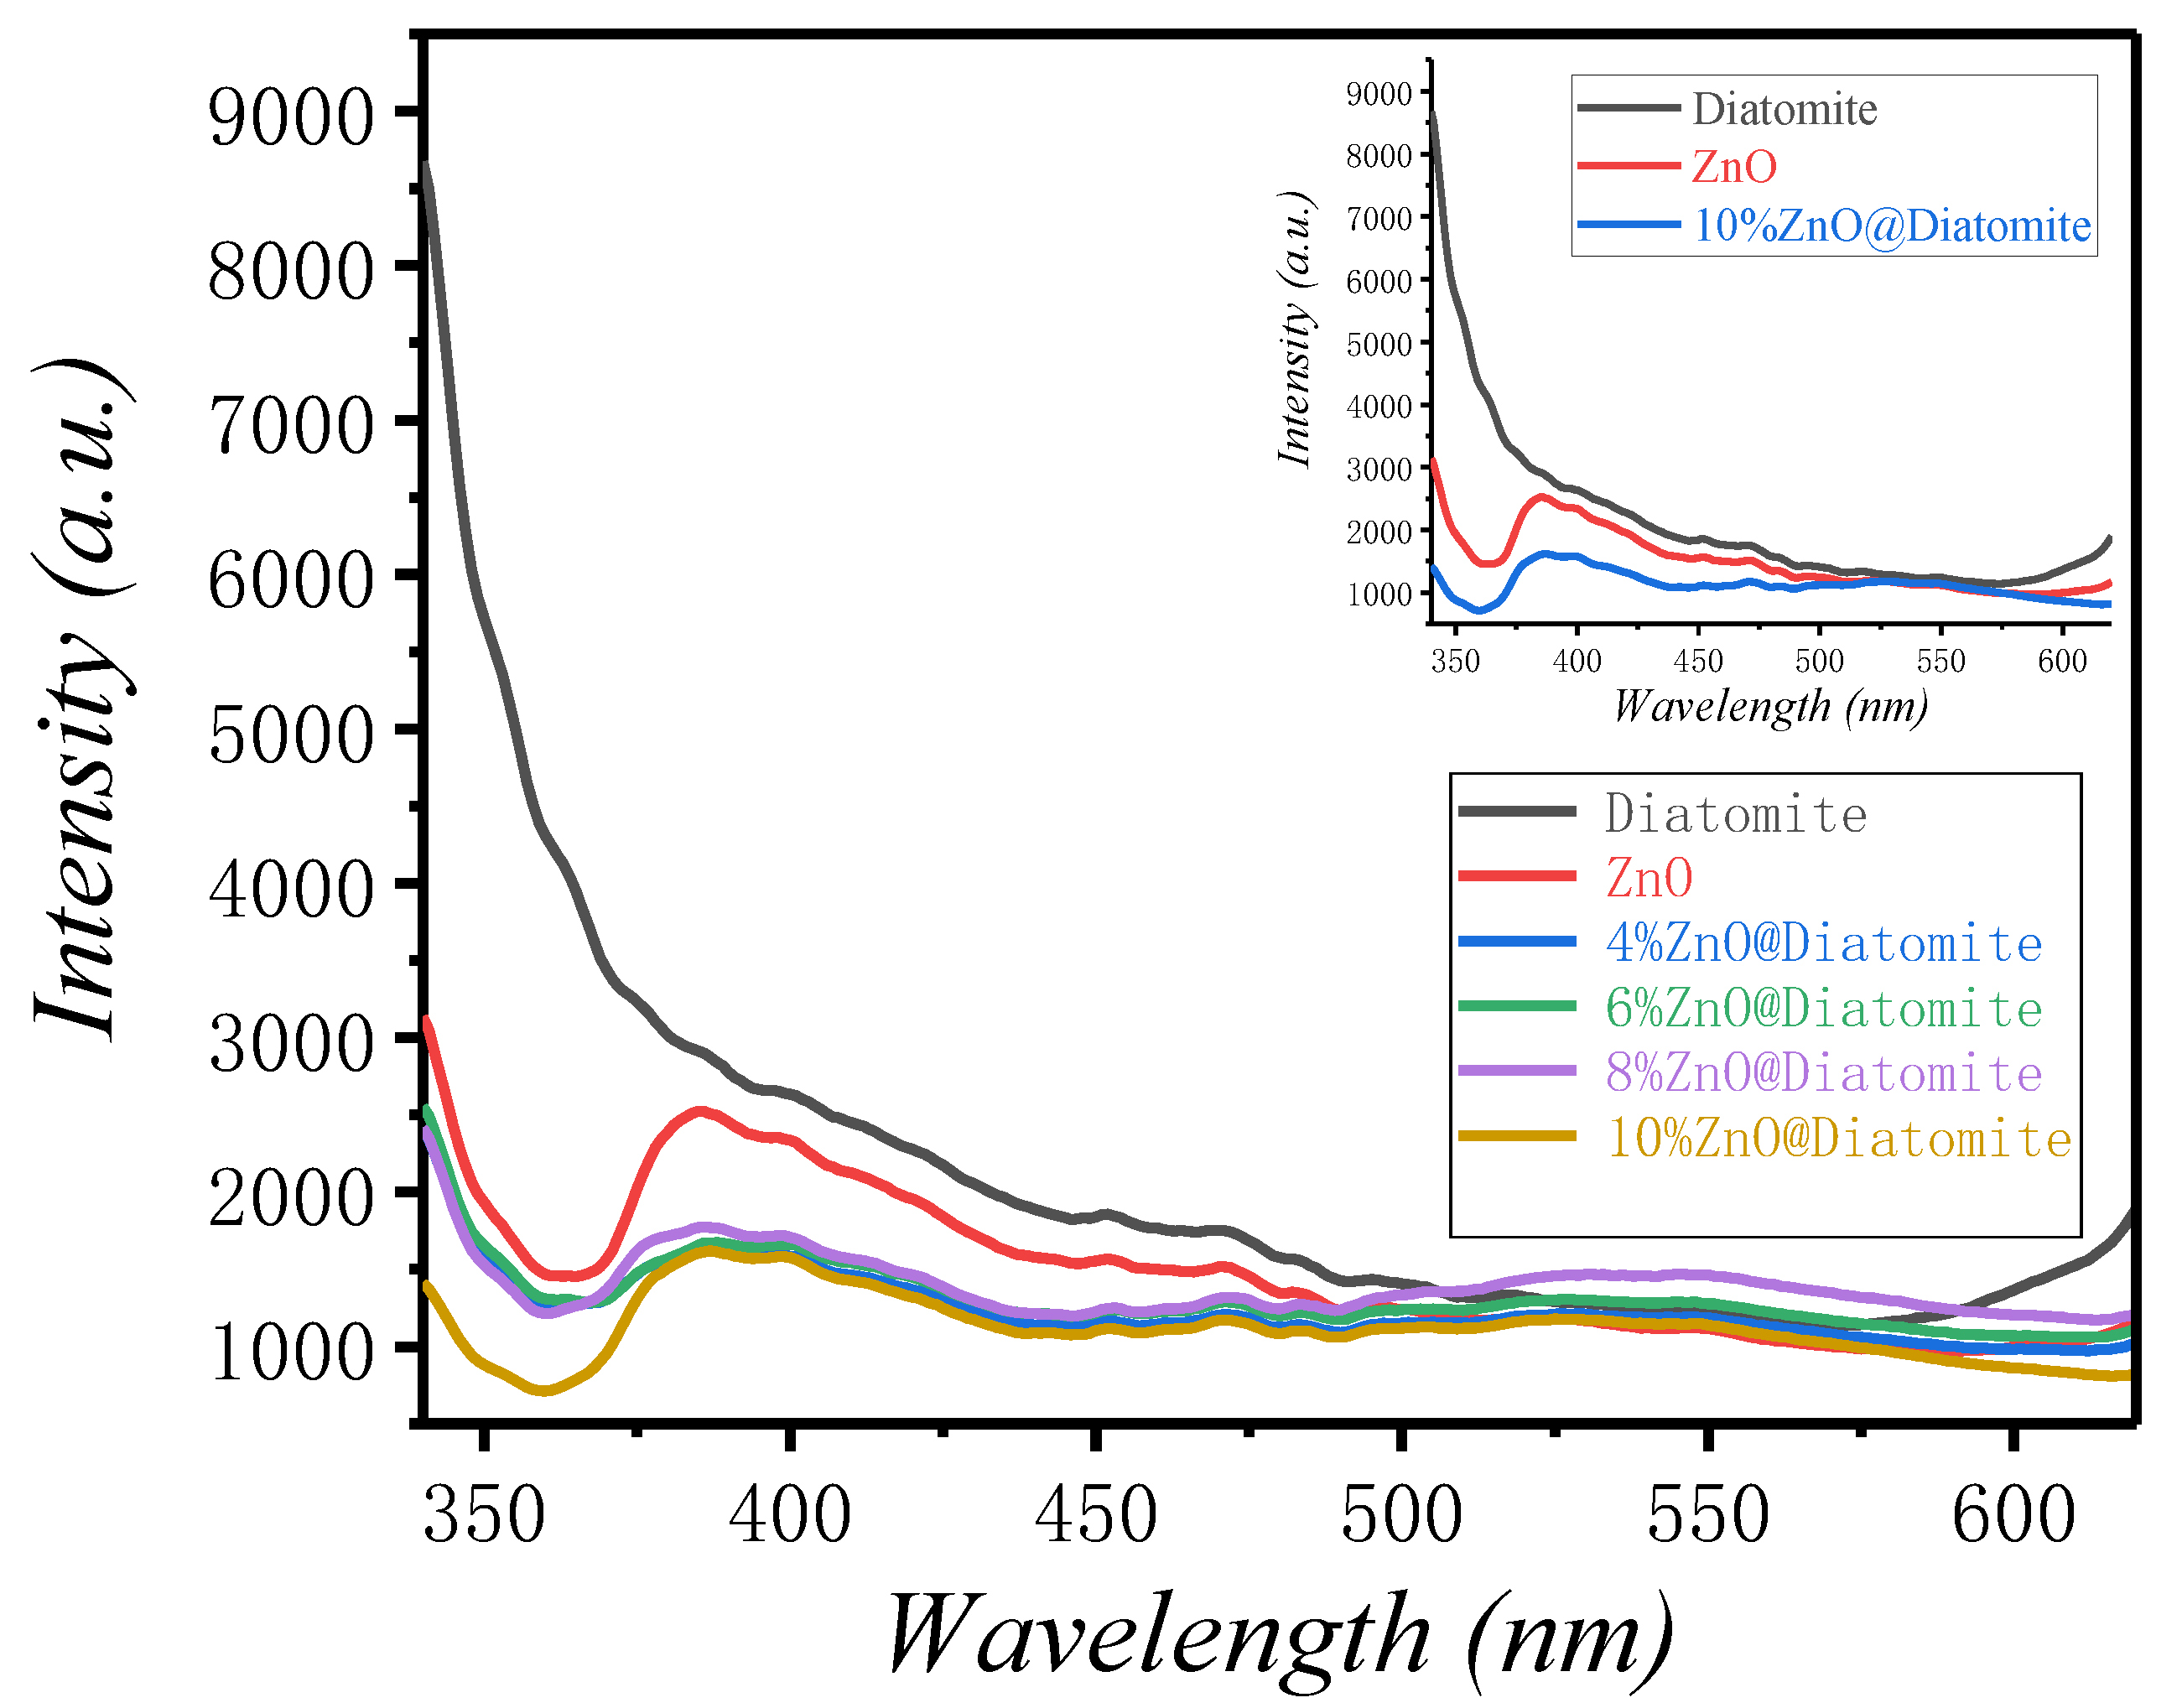
The Photoluminescence (PL) spectra of the prepared samples are shown in Figure 8. Since most of the light absorption and excitation occur in the surface region of the photocatalyst, the emission mainly reflects the recombination of surface charges [25]. The recombination rate of electrons and holes is one of the important indexes to evaluate the photocatalytic performance of catalysts. With the decrease of recombination rate, the photocatalytic performance of catalysts increases [26,27]. The wavelength of the excitation light selected in the experiment was 300 nm. The test results obtained are shown in Figure 8. The fluorescence intensity of zinc oxide loaded diatomite is lower than that of pure diatomite or zinc oxide. The composite with molar loading rate of 10% has the lowest fluorescence intensity and the best photocatalytic performance. The weakening in fluorescence intensity may be due to ZnO loading on diatomite; by forming Si–O–Zn, ZnO nanoparticles can act as good electron captures and reduce the recombination of electrons and holes. Therefore, we concluded that the catalyst with the ZnO molar loading ratio of 10% was the most suitable for the photocatalytic degradation experiment.
2.9. Photocatalytic Performance of Catalysts
Semiconductor photocatalytic technology is a catalytic oxidation technology that has received much research attention. Photocatalytic technology is a heterogeneous photocatalytic process under light irradiation, making it an ideal photocatalytic process to use sunlight as a light source and activate the oxidation-reduction reaction at room temperature [28,29,30]. Free radicals such as OH and generated during the reaction are highly oxidizing, so they can effectively break the chemical bonds in organic compounds, so as to realize the photocatalytic oxidation and decomposition of polluted wastewater, organic polluting substances, or harmful gases on the surface of objects. Scheme 1 illustrates the formation of X%ZnO@diatomite, and the reaction process of the photocatalytic oxidation of pollutants such as MB is shown in Figure 9. The reaction expression is as follows:
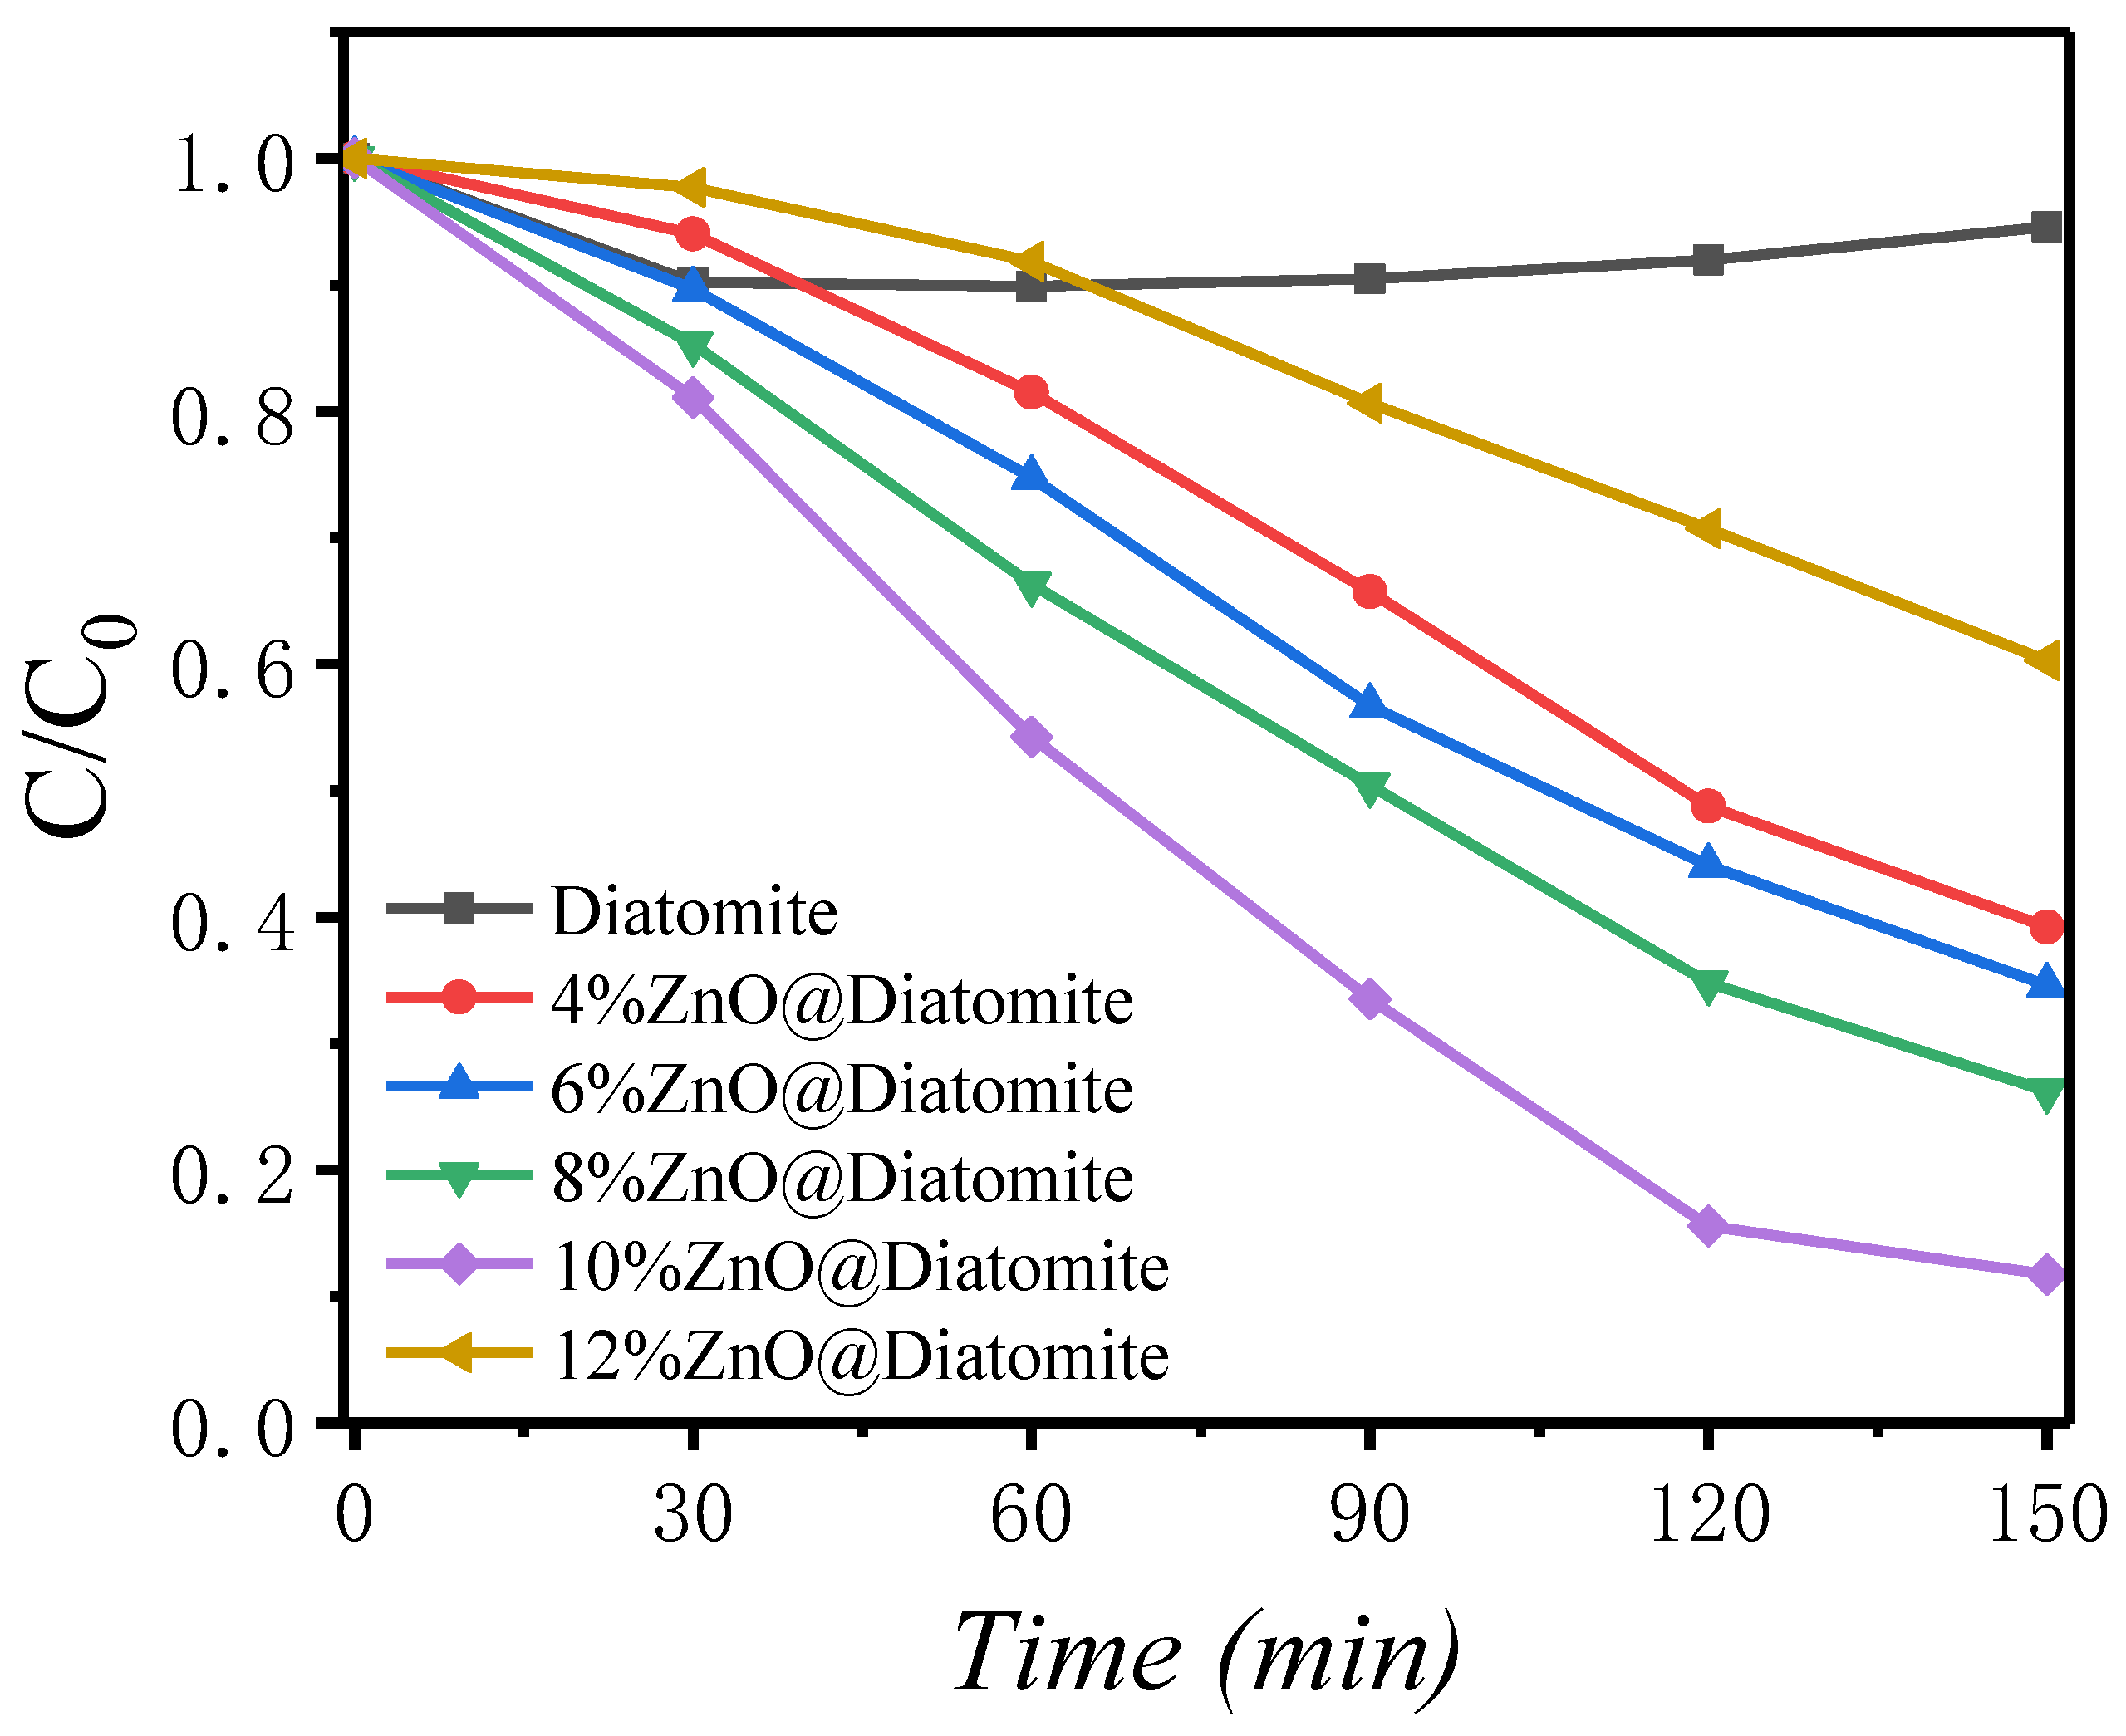
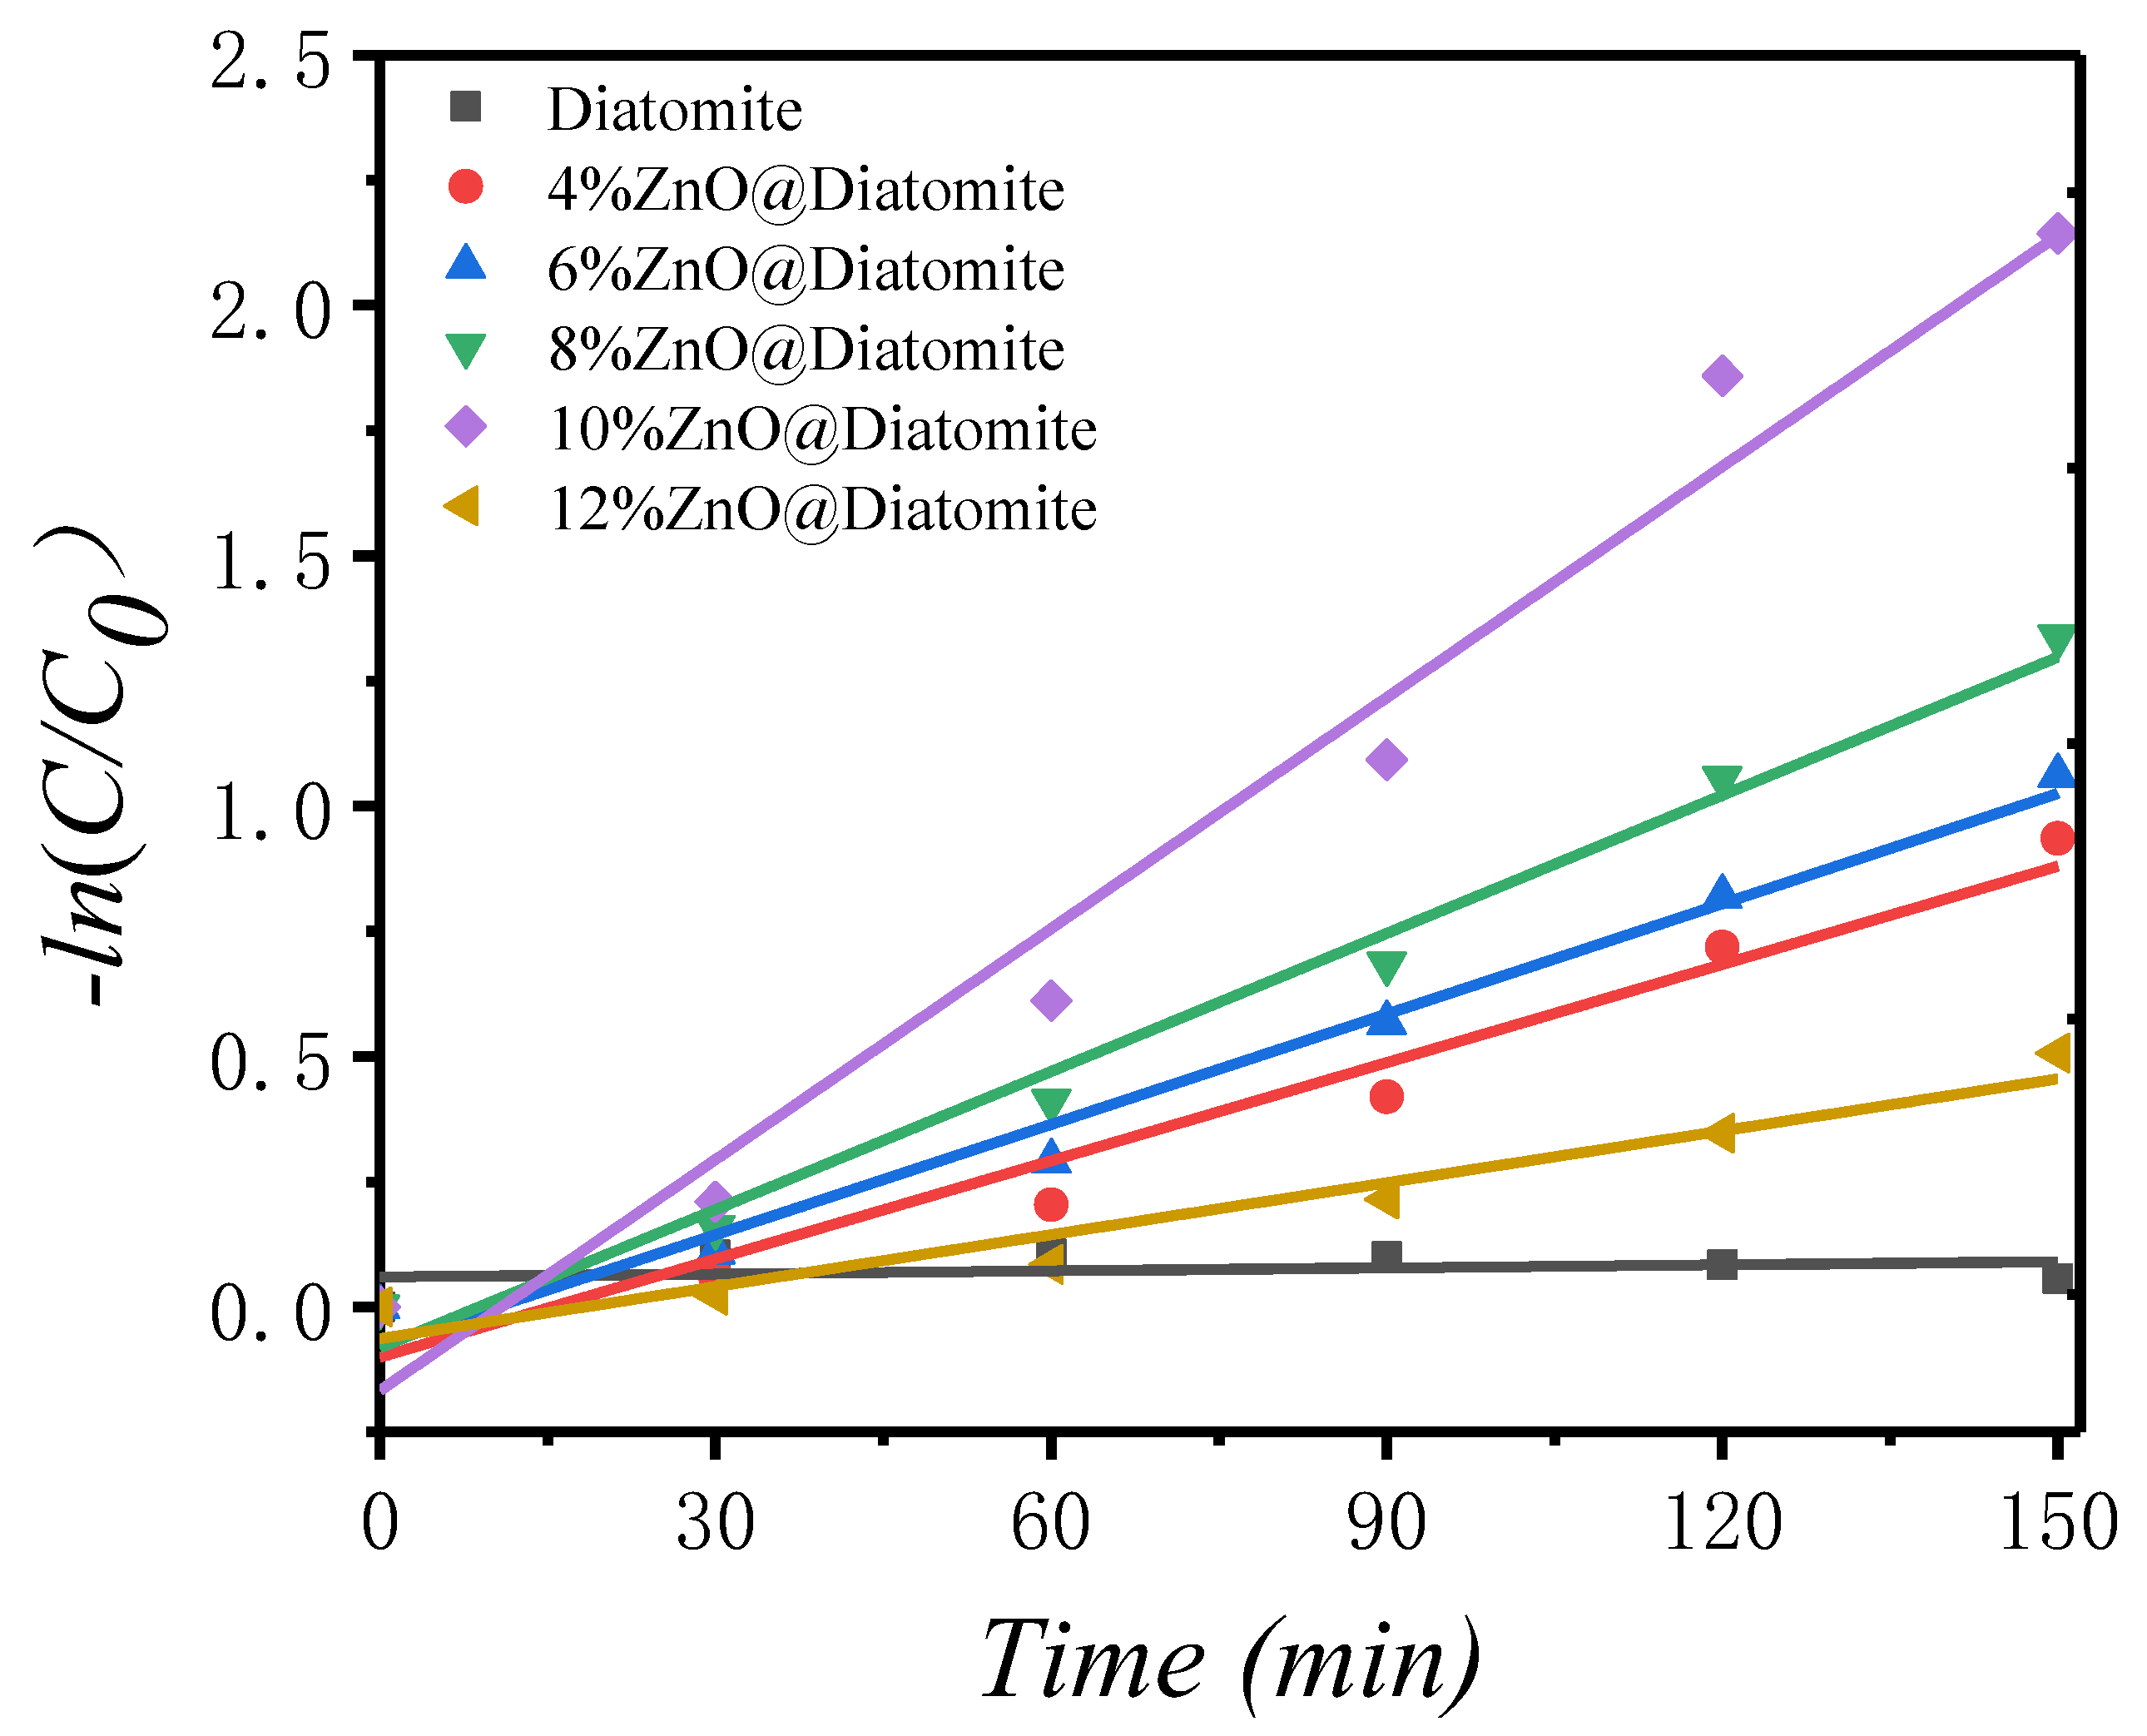
MB solution was used as the target degradator to evaluate the photocatalytic degradation ability of the catalysts with various molar loading ratios. By analyzing the specific surface area of the catalysts with various loading ratios, considering the strong adsorption capacity for MB solution under the condition of a low load, the optical absorption range was obtained by UV-vis spectroscopy, and the electron-hole recombination rate was determined by PL spectroscopy. The catalysts with a molar loading ratio of 10% had the best photocatalytic degradation efficiency, as shown in Figure 10 and Figure 11. At the same degradation time, the catalyst degradation efficiency of the composite with a molar loading ratio of 10% reached 90%, better than the catalysts with other loading ratios. The MB solution showed nearly no degradation with only diatomite. All the results are consistent with the UV-vis and fluorescence analysis conclusions. The optimal value of the load may be due to the aggregation of ZnO nanoparticles and the saturation of the number of Si–O–Zn bonds formed between diatomite and ZnO, resulting in a lower degradation efficiency when the load was 12% compared with that when the loading ratio was 10%.
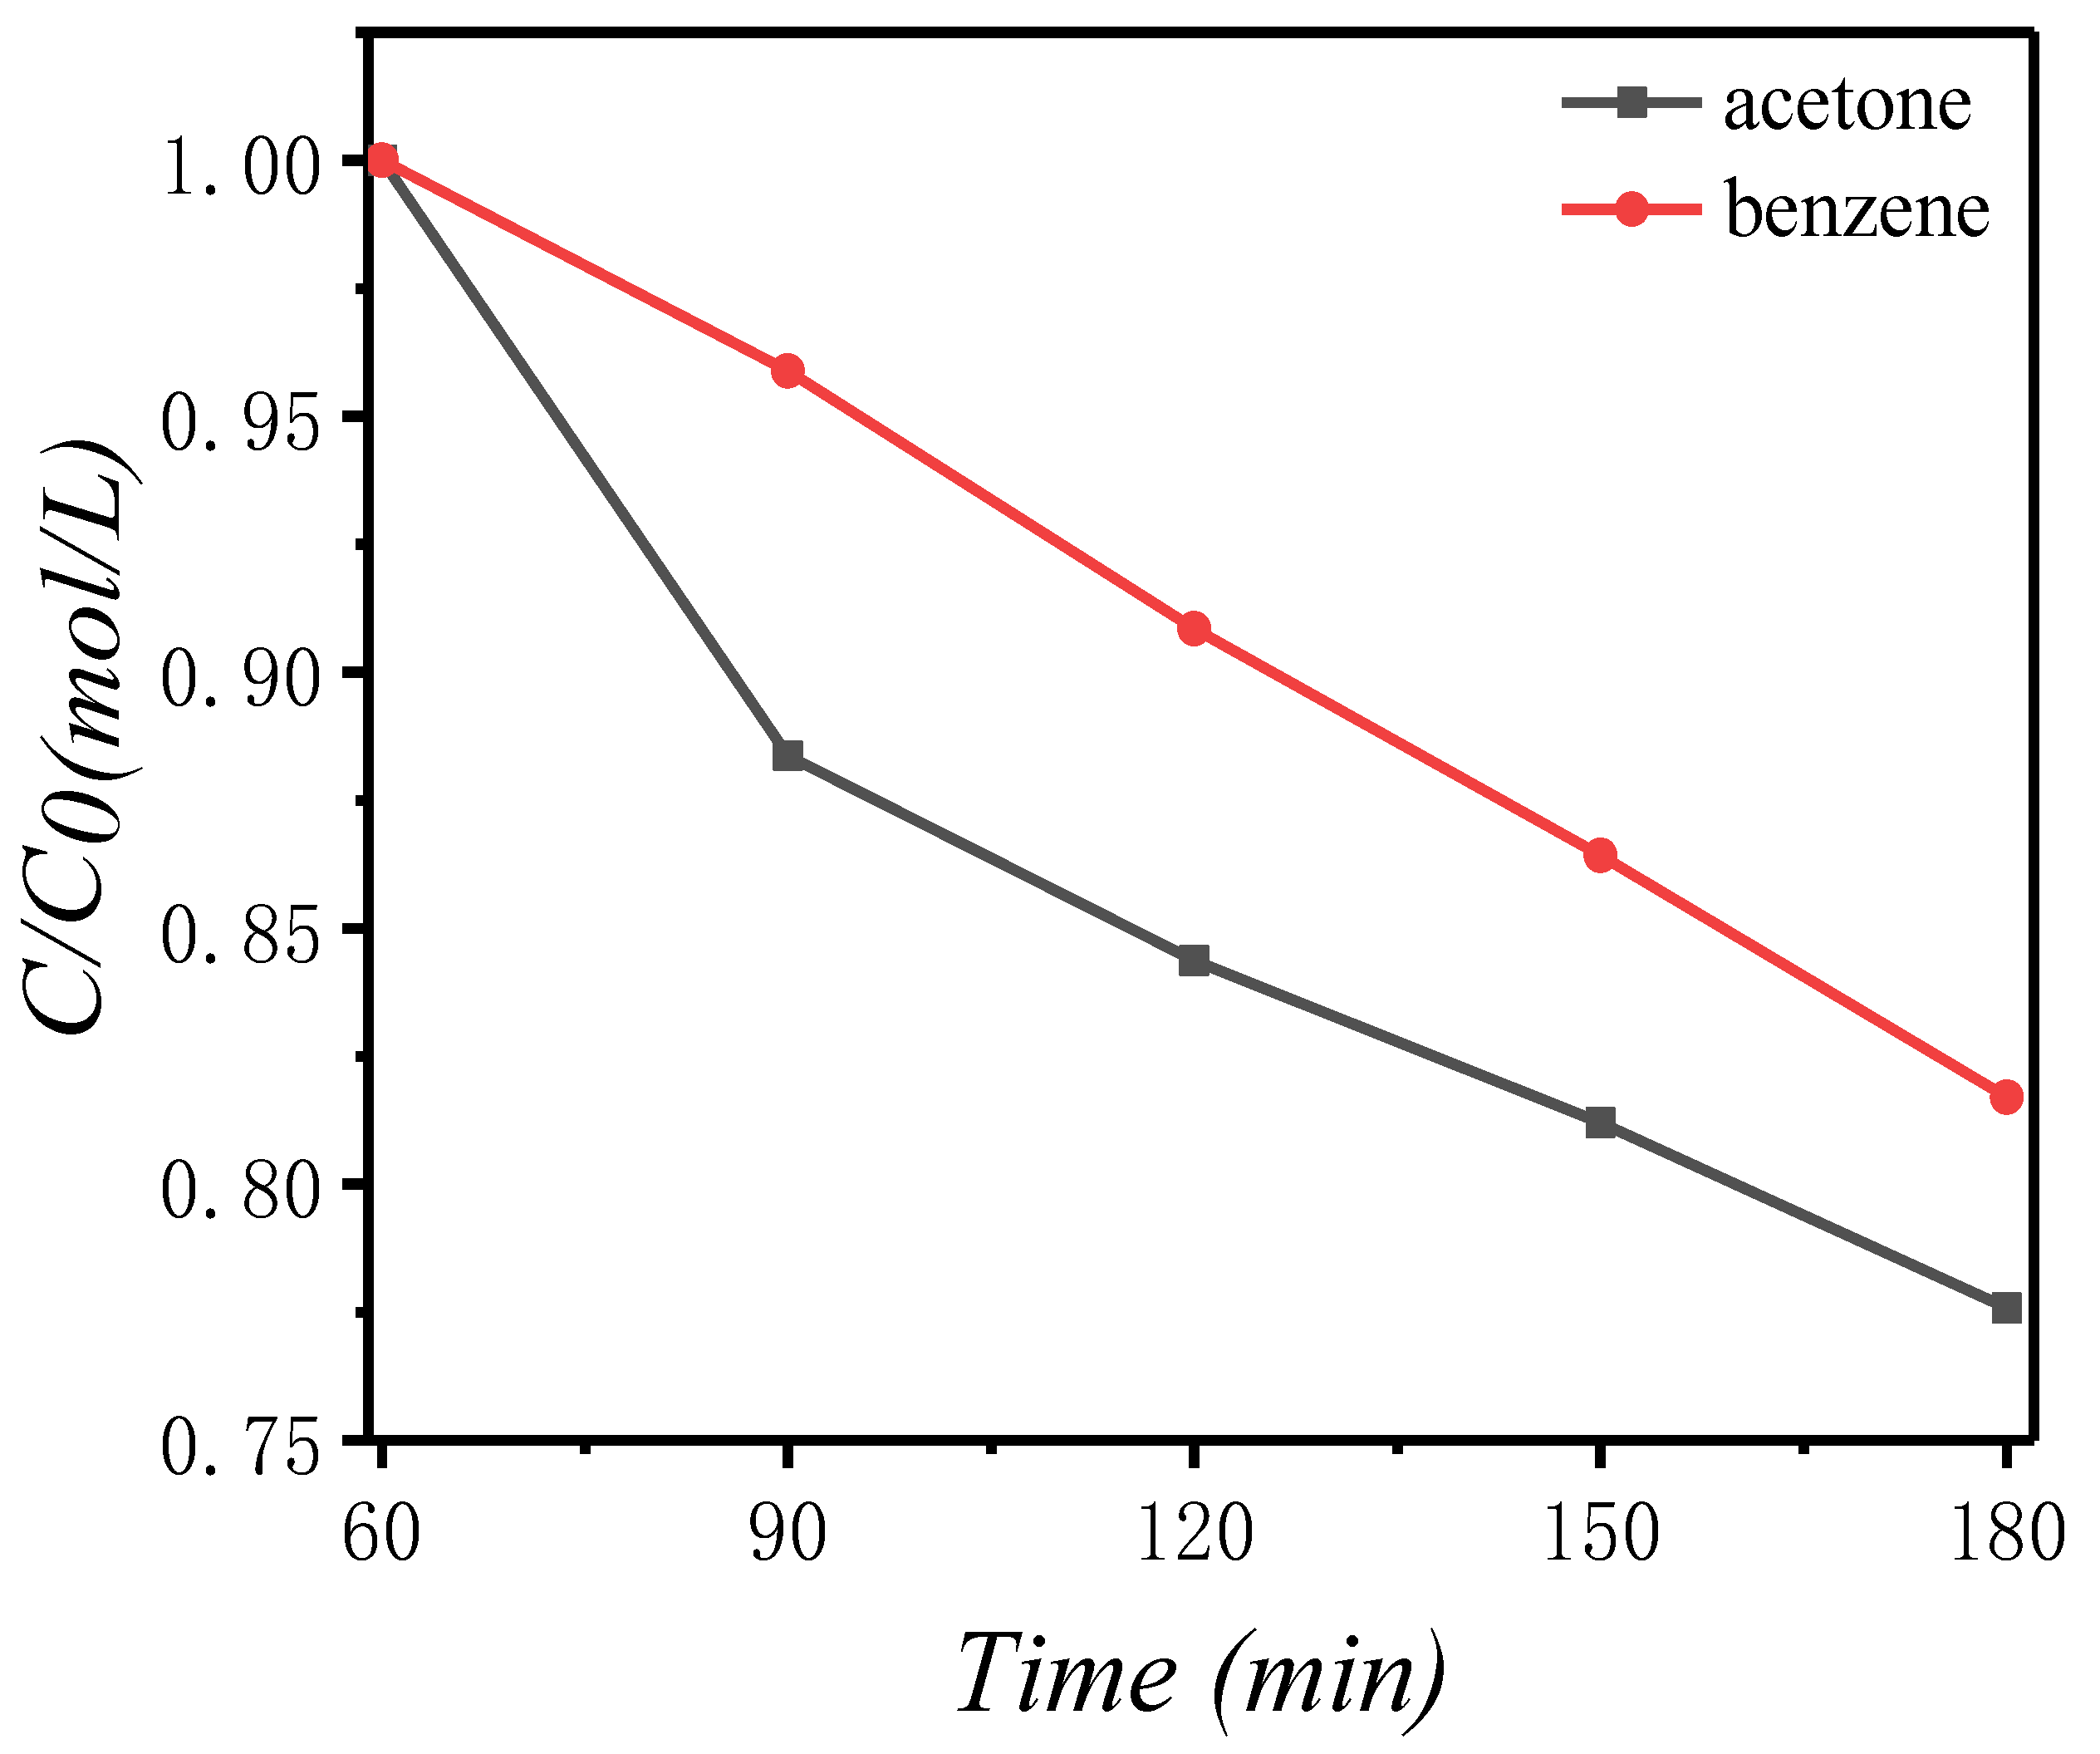
Figure 12 shows the degradation results for gaseous acetone and gaseous benzene. The gas concentration was controlled by adding 1 mL of saturated gas at room temperature to headspace vials. As can be seen from Figure 12, under visible light irradiation, the optimal catalyst showed excellent photocatalytic performance for gaseous acetone and gaseous benzene at a certain concentration condition. As shown, both gaseous benzene and gaseous acetone degraded in various degrees after 180 min of light irradiation, with gaseous acetone having higher degradation efficiency than that of gaseous benzene, but both showed incomplete degradation in a short amount of time because the initial concentration was too high. One of the possible reasons for the analytical degradation results is that the structure of the gaseous benzene molecules is extremely stable and difficult to break. Another possible reason is that the concentration of gaseous benzene is too high or that it is a nonpolar molecule, and the degradation efficiency may be related to molecular polarity. In this study, only two gaseous organic pollutants were studied. In the future, we will study the catalytic degradation of other gaseous organic pollutants (such as methanol, ethanol and formaldehyde) and determine whether the effects on polar organic and non-polar organic properties are the same.
2.10. Photocurrent Analysis
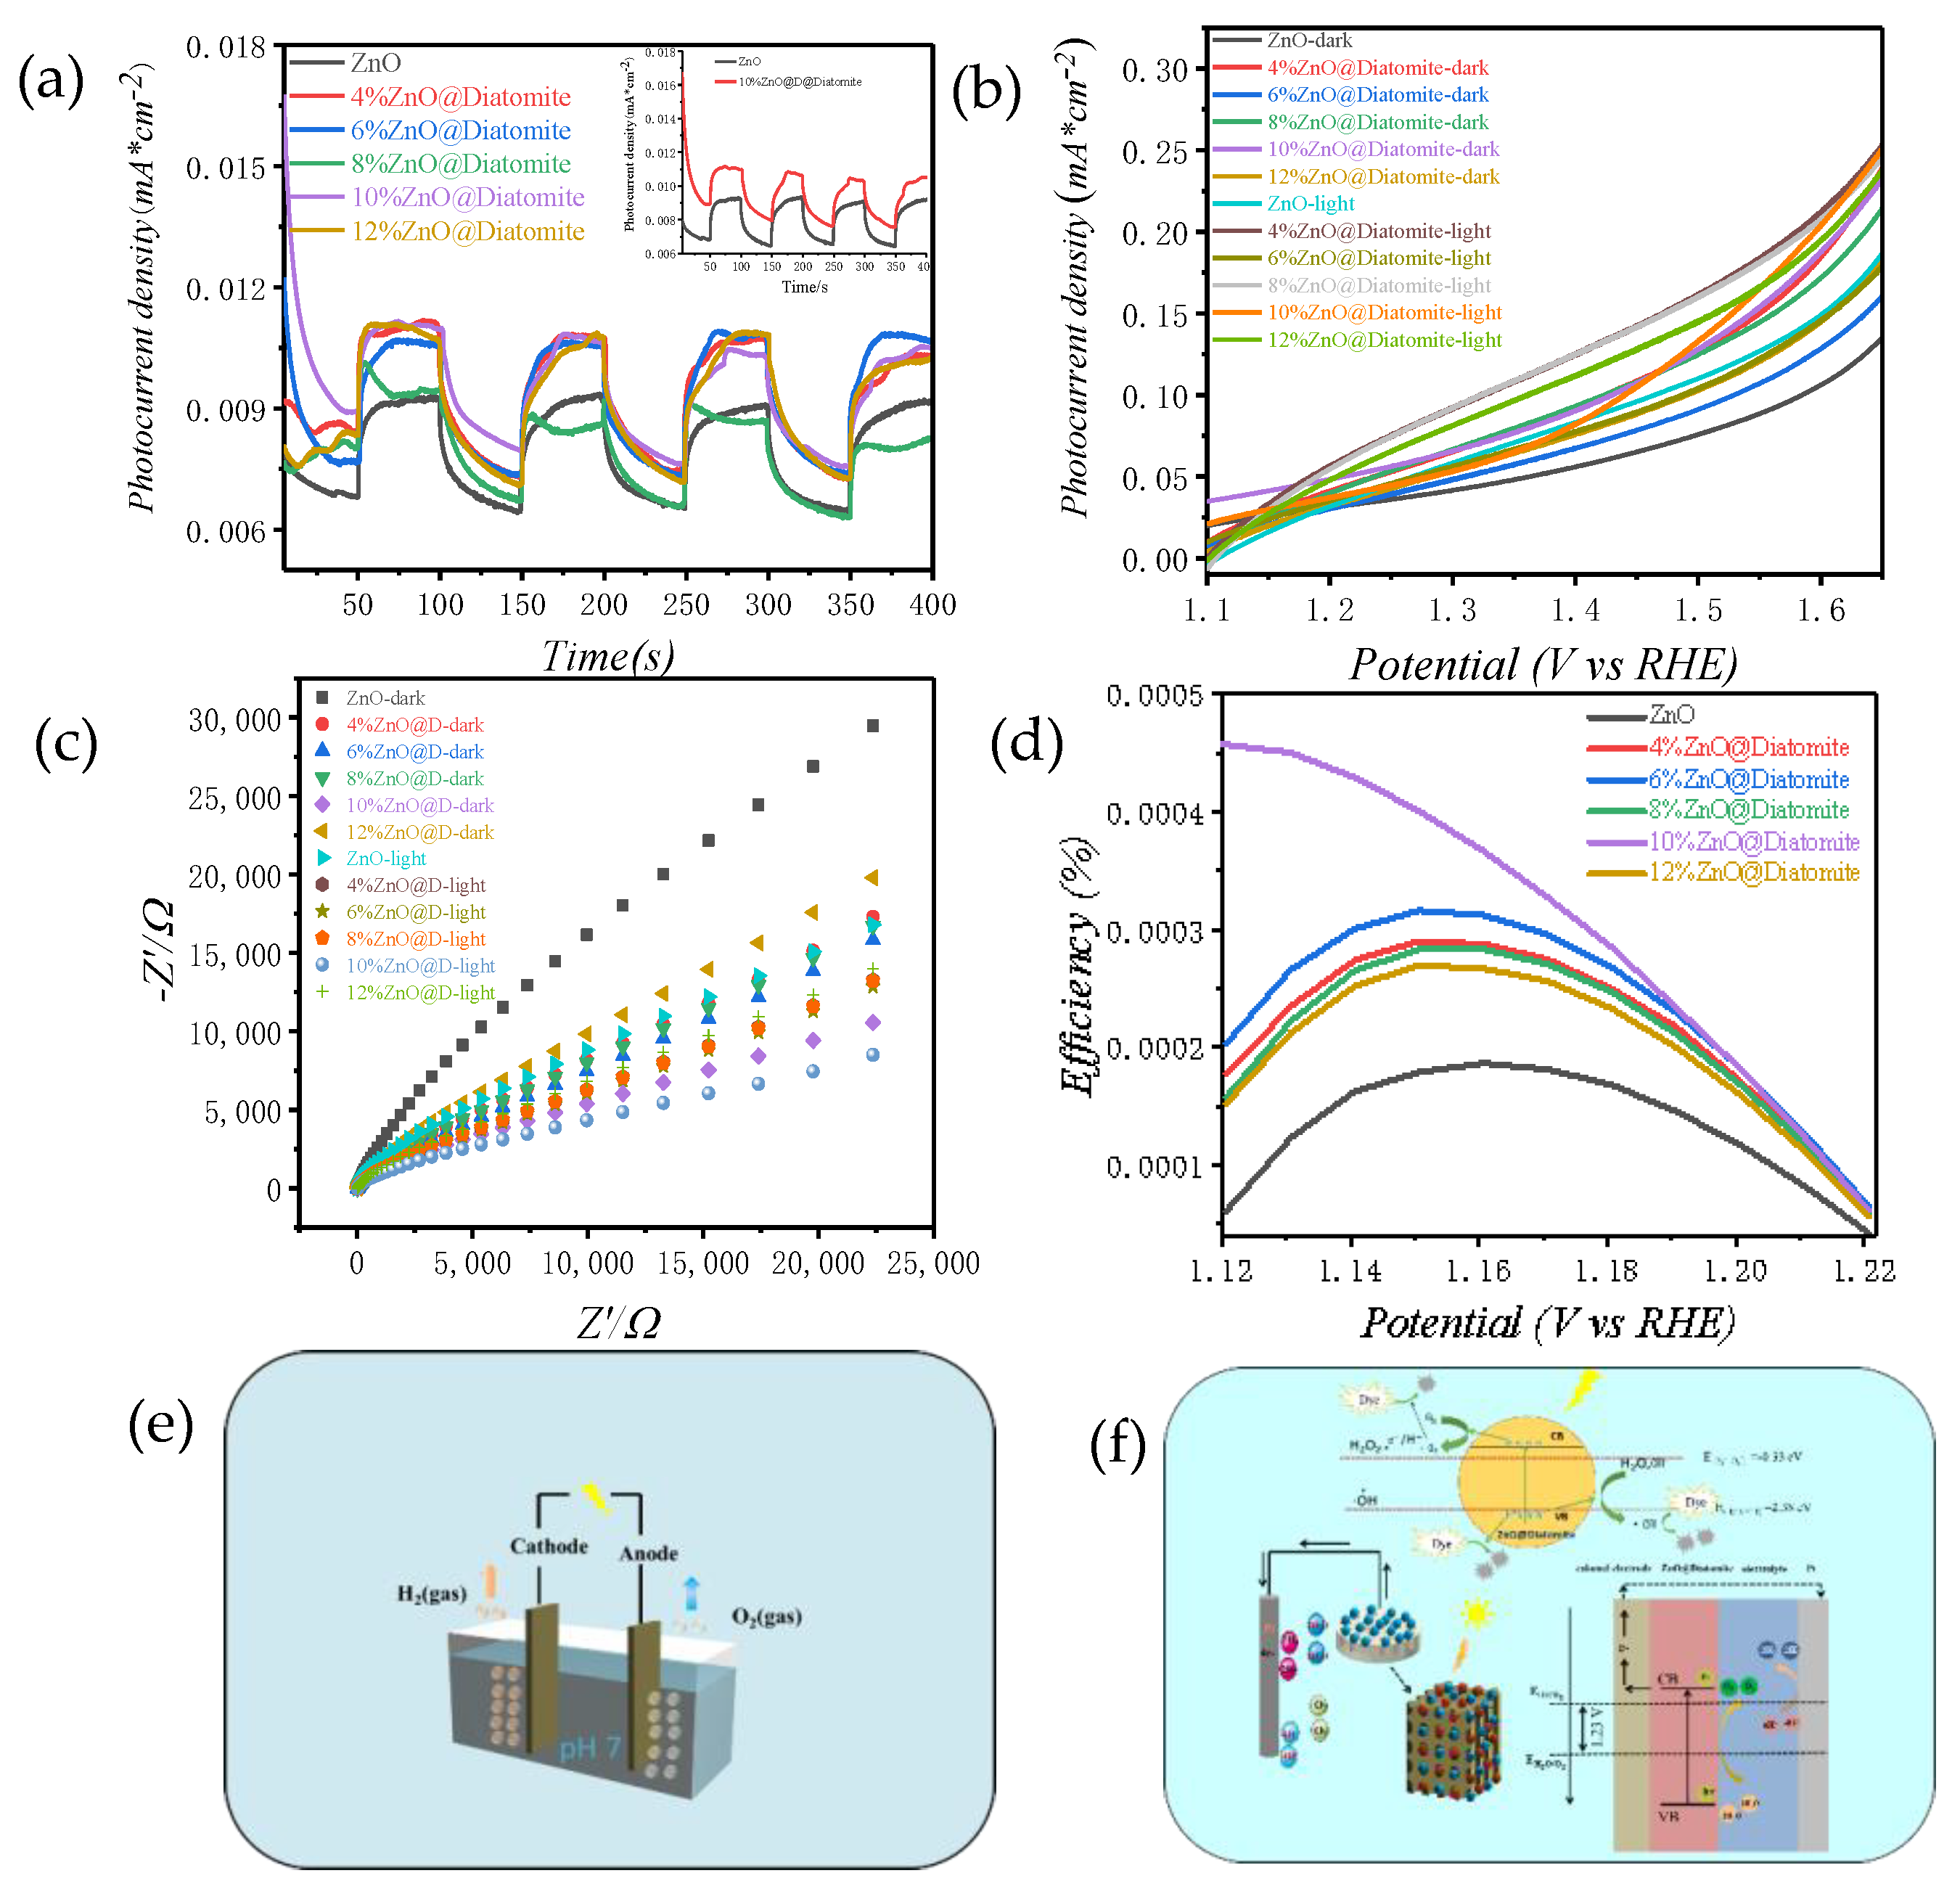
Figure 13a shows the Photocurrent-time dependences curve of pure ZnO and composite catalysts with various molar load ratios. The photocurrent density of ZnO @ diatomite composite catalysts are higher than that of pure ZnO, and the photocurrent density of catalyst with molar loading rate of 10% is the largest, indicating that the existence of oxygen vacancies can improve the separation efficiency of photogenerated electrons and holes, because the more oxygen vacancies, the greater the photocurrent density. The composites with various loading ratios were studied to determine the maximum photocurrent density, as shown in Figure 13b. The comparison between dark and light conditions reveals that the photocurrent density in light conditions is significantly greater than that in dark conditions. Among them, the maximum the photocurrent density of the composite with the loading ratio of 10% was 0.25 mA/cm2 at + 0.8 V vs. Reversible Hydrogen Electrode (RHE). The composite has a high density, a high surface area, a high volume ratio, and a superior charge transport path, maximizing the photocurrent density. It is shown that 10%ZnO@diatomite has the largest photocurrent among the composite catalysts because of its charge collection efficiency and direct path to photoelectrons.
In this study, the ZnO@diatomite composite catalysts generate Zn–O–Si bonds with similar heterogeneous structures, thus improving the Passivated Emitterand Rear Cell (PEC) performance. The ZnO@diatomite composite structure exhibits a higher absorbance in the UV-vis region compared with that of pure ZnO nanoparticles. Furthermore, the ZnO nanoparticles in the ZnO@diatomite composite catalysts have smaller diameters and length compared with pure ZnO nanoparticles, providing a higher surface–volume ratio for the electrode/electrolyte interface. Therefore, when the Fermi level changes because of the strong interface interaction, more electron-hole pairs are produced and separated effectively. Furthermore, ZnO nanoparticles with smaller particle sizes of the composite catalysts are more prone to adsorption and surface reaction, thus further promoting charge separation. Additionally, the recombination of the electorns and holes on the surface of ZnO nanoparticles were significantly reduced, as demonstrated by PL results. Therefore, compared with light absorption, the effective separation and transmission of photogenerated carriers are generally considered to be the main factors determining the performance of PEC [17].When loading rate of the ZnO is low, the electrolyte may directly meet the diatomite because of the small and uneven amounts of ZnO, which hinders the separation of photogenerated charges with low photocurrent density. For the composite with a loading ratio of 10%, the maximum photocurrent density is due to the optimal ratio, leading to the effective separation of the photogenerated carriers. When the load fraction is too high, ZnO nanoparticles can agglomerate, causing reduced photogenerated carriers separation. The optimal loading of nanoparticles is very important to improve the photocurrent density.
Electrochemical impedance spectroscopy (EIS) results are shown in Figure 13c for pure ZnO nanoparticles and ZnO@diatomite composite electrodes. The charge transfer resistance was analyzed by electrochemical impedance spectroscopy (EIS) recorded for catalysts at 0.1 V. Generally, the charge transfer resistance could be indicated by the semicircle in the intermediate frequency region, the lager the diameter, the lager the charge transfer resistance. Figure 13a shows the current versus time (I–t) curves of pure ZnO nanoparticles and X%ZnO@diatomite composites in truncated light with a +0.8 V vs. RHE ≥ 400 s, on/off cycle of 50 s. When the lamp was turned off, both photoanodes displayed a very low dark current of approximately 0.0075 mA/cm2. Under the light, we observed distinct light response platforms with a large and smooth photoflow, indicating a rapid separation of photogenerated electrons. Compared with that of the pure ZnO nanoparticles, the photoresponse currents of the composites were all higher. This result shows a fast light response and reproduces the same light response within 400 s. Furthermore, the electrode material without degradation was observed from the transparent electrolyte solution, suggesting that there may be no change in any structure or morphology in the electrode. Thus, these observations indicate the stability of the photoanode in the PEC process. The obtained fast light response and chemical stability can be attributed to the loading of ZnO, generating Zn–O–Si bonds, which allows photogenerated electrons to separate quickly and efficiently. Figure 13d shows the efficiency diagrams of composites with various loading ratios for photoelectrochemical decomposition of water, where it is clear that the efficiency of the catalyst after loading is greater than that of pure ZnO nanoparticles, indicating that the Si–O–Zn bonds are conducive to the transmission of electrons and improve the efficiency of photoelectrochemical decomposition of water [31].
To summarize, a schematic of the X%ZnO@diatomite composite photoelectrochemical decomposition of water device is shown in Figure 13e, and the interface charge separation process and its energy band diagram are shown in Figure 13f. When the photoelectrode is illuminated, the photogenerated electrons and holes separate as a result of the electric field. The photogenerated electron of X%ZnO@diatomite under light conditions move to the Pt electrode via an external circuit. These photogenerated electrons reduce water to hydrogen by reaction with hydrogen ions in the electrolyte. Meanwhile, the holes produced in the valence band will effectively transfer to the electrode surface through the valence band because of the action of the built-in electric field, where they participate in the oxidation of water. Thus, an enhanced photocurrent is observed with the X%ZnO@diatomite composite. The presence of the X%ZnO@diatomite composite improves the charge separation efficiency.
3. Experimental Section
3.1. Chemicals and Materials
Diatomite (Macklin, Shanghai, China), zinc acetate hexahydrate Zn(OOCCH3)2·2H2O (Alfa Aesar, Shanghai, China), ammonia water (analytical reagent, Beijing, China), acetylacetone (analytical reagent, Tianjin, China), acetone (analytical reagent, Beijing, China), benzene(Aladdin, shanghai, China), TEOA (analytical reagent, Beijing, China), IPA (analytical reagent, Beijing, China), Nafion(Aladdin, shanghai, China), VC (Aladdin, shanghai, China), anhydrous ethanol (analytical reagent, Beijing, China) and deionized water were used for the synthesis of ZnO and ZnO/diatomite. During the process of synthesizing ZnO/diatomite, the molar ratio of ZnO to diatomite was controlled to synthesize composites with various load proportions. All the reagents listed were used as purchased and without further treatment.
3.2. Catalyst Preparation
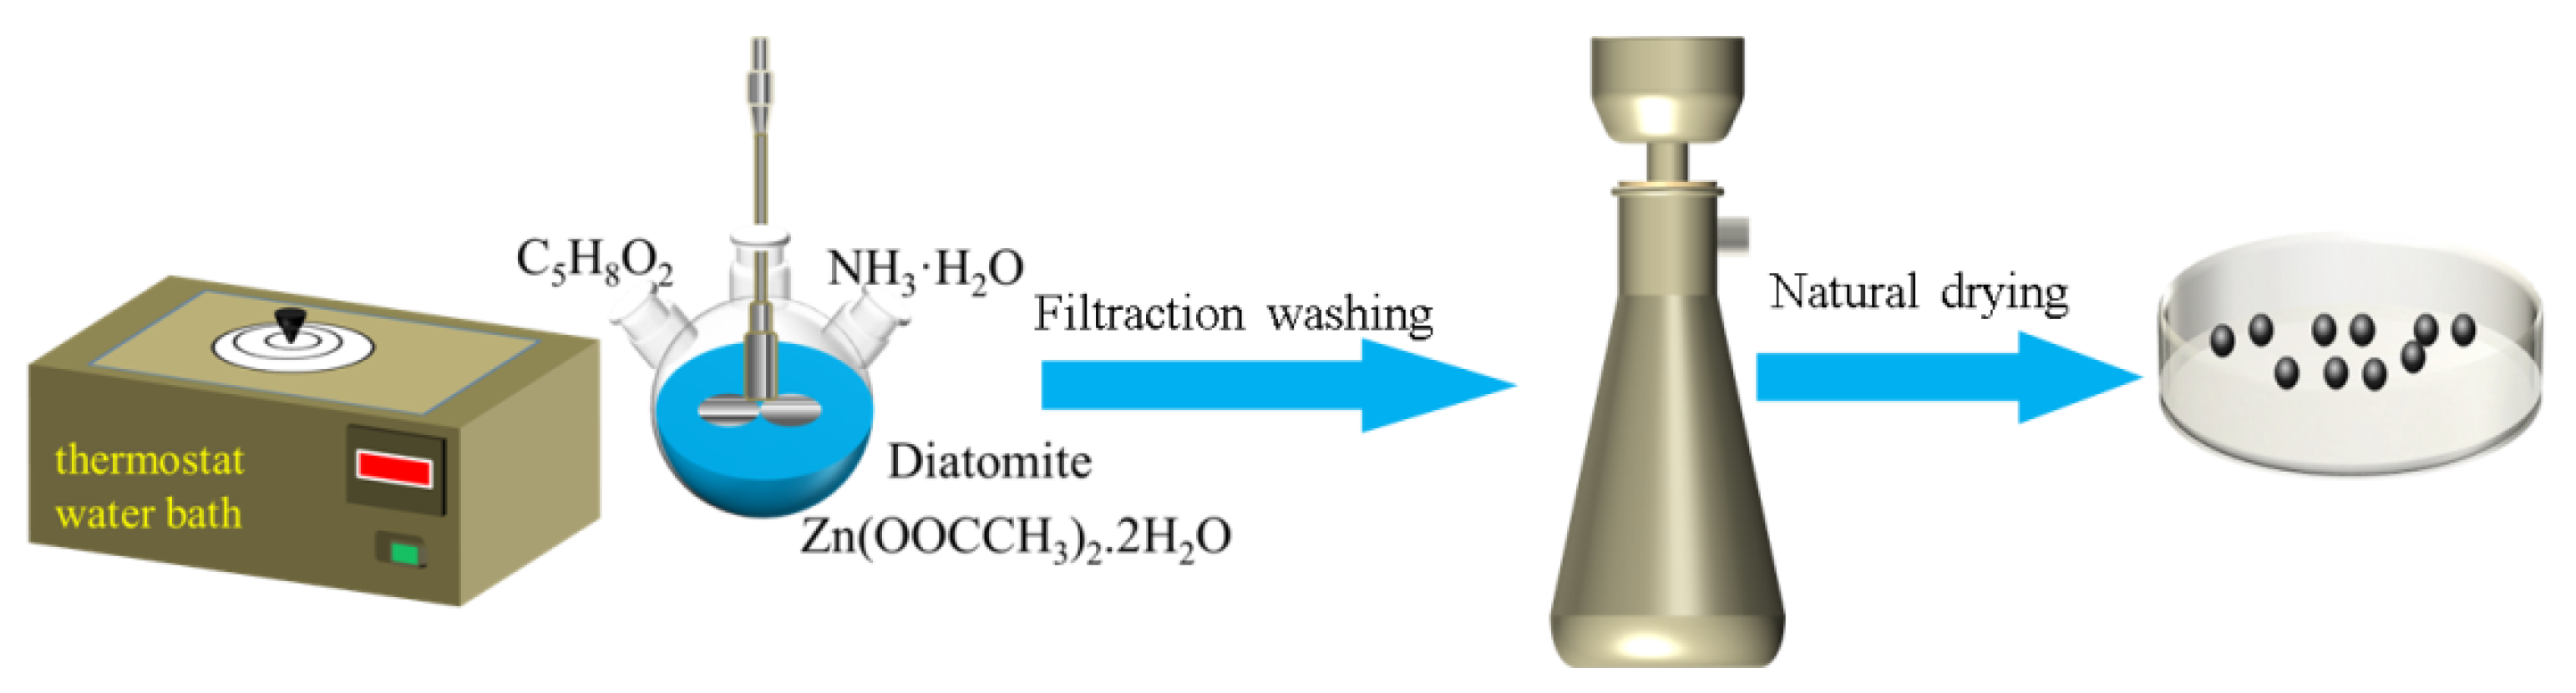
First, a set mass of diatomite was weighed and placed in a 250-mL round-bottom flask; then, 40 mL of deionized water was added, and the mixture was stirred with the magnetic force for 30 min in an ice water bath. Second, Zn(OOCCH3)2·2H2O was added and stirred for 30 min. Third, while stirring in an ice-water bath, 0.3% ammonia solution was added drop by drop into a three-neck flask, with a dropping speed of one drop per second. Then 2 mL of acetylacetone was added 10 min after the ammonia; when the pH value of the solution was 10.00, the dropping of the ammonia solution was stopped. This solution was heated in a water bath at 75 °C for 7 h. Finally, when the reaction was finished, the reacted mixed liquid in the round-bottom flask was washed with deionized water for 3–5 times, washed to neutrality, and naturally dried for 5–15 h. Composites with various proportions of ZnO and diatomite were prepared by the same method, with loading ratios of 4%, 6%, 8%, 10%, and 12%. The pure ZnO was prepared according to the above procedure, except with the addition of diatomite steps. The preparation process is shown in Scheme 2.
3.3. Characterization
3.3.1. Material Characterization
The surface morphology of samples was observed using SEM (JSM-7800F and S-4700, Japan) with EDS. The crystallinity of the prepared samples was characterized by XRD recorded using Cu Kα radiation at a scan rate of 5°/min and HRTEM (ARM-200, Japan). The specific surface area and pore size distribution of the prepared samples were characterized by a BET instrument at 77 K (Micrometrics ASAP 2020, Georgia, USA). UV-vis absorbance was characterized using a UV-VISNIR spectrophotometer (SolidSpec-3700, Shimadzu, Japan). A photoluminescence spectrometer (FL-7000, Hitachi, Japan) was used out to evaluate the photocatalytic activity. XPS was conducted to analyze the elemental chemical environment. EPR (EMX-500 10/12) was used to detect unpaired electrons contained in atoms or molecules from qualitative and quantitative perspectives and to explore the structural properties of their surroundings. At room temperature, in 0.5 M Na2SO4 solution, a CHI660E electrochemical analyzer was used with a traditional three-electrode system. The prepared X%ZnO@diatomite catalysts were used as the working electrode, a glycerol electrode was the parameter electrode, and the pair electrode was composed of graphite.
3.3.2. Photocatalytic Activity
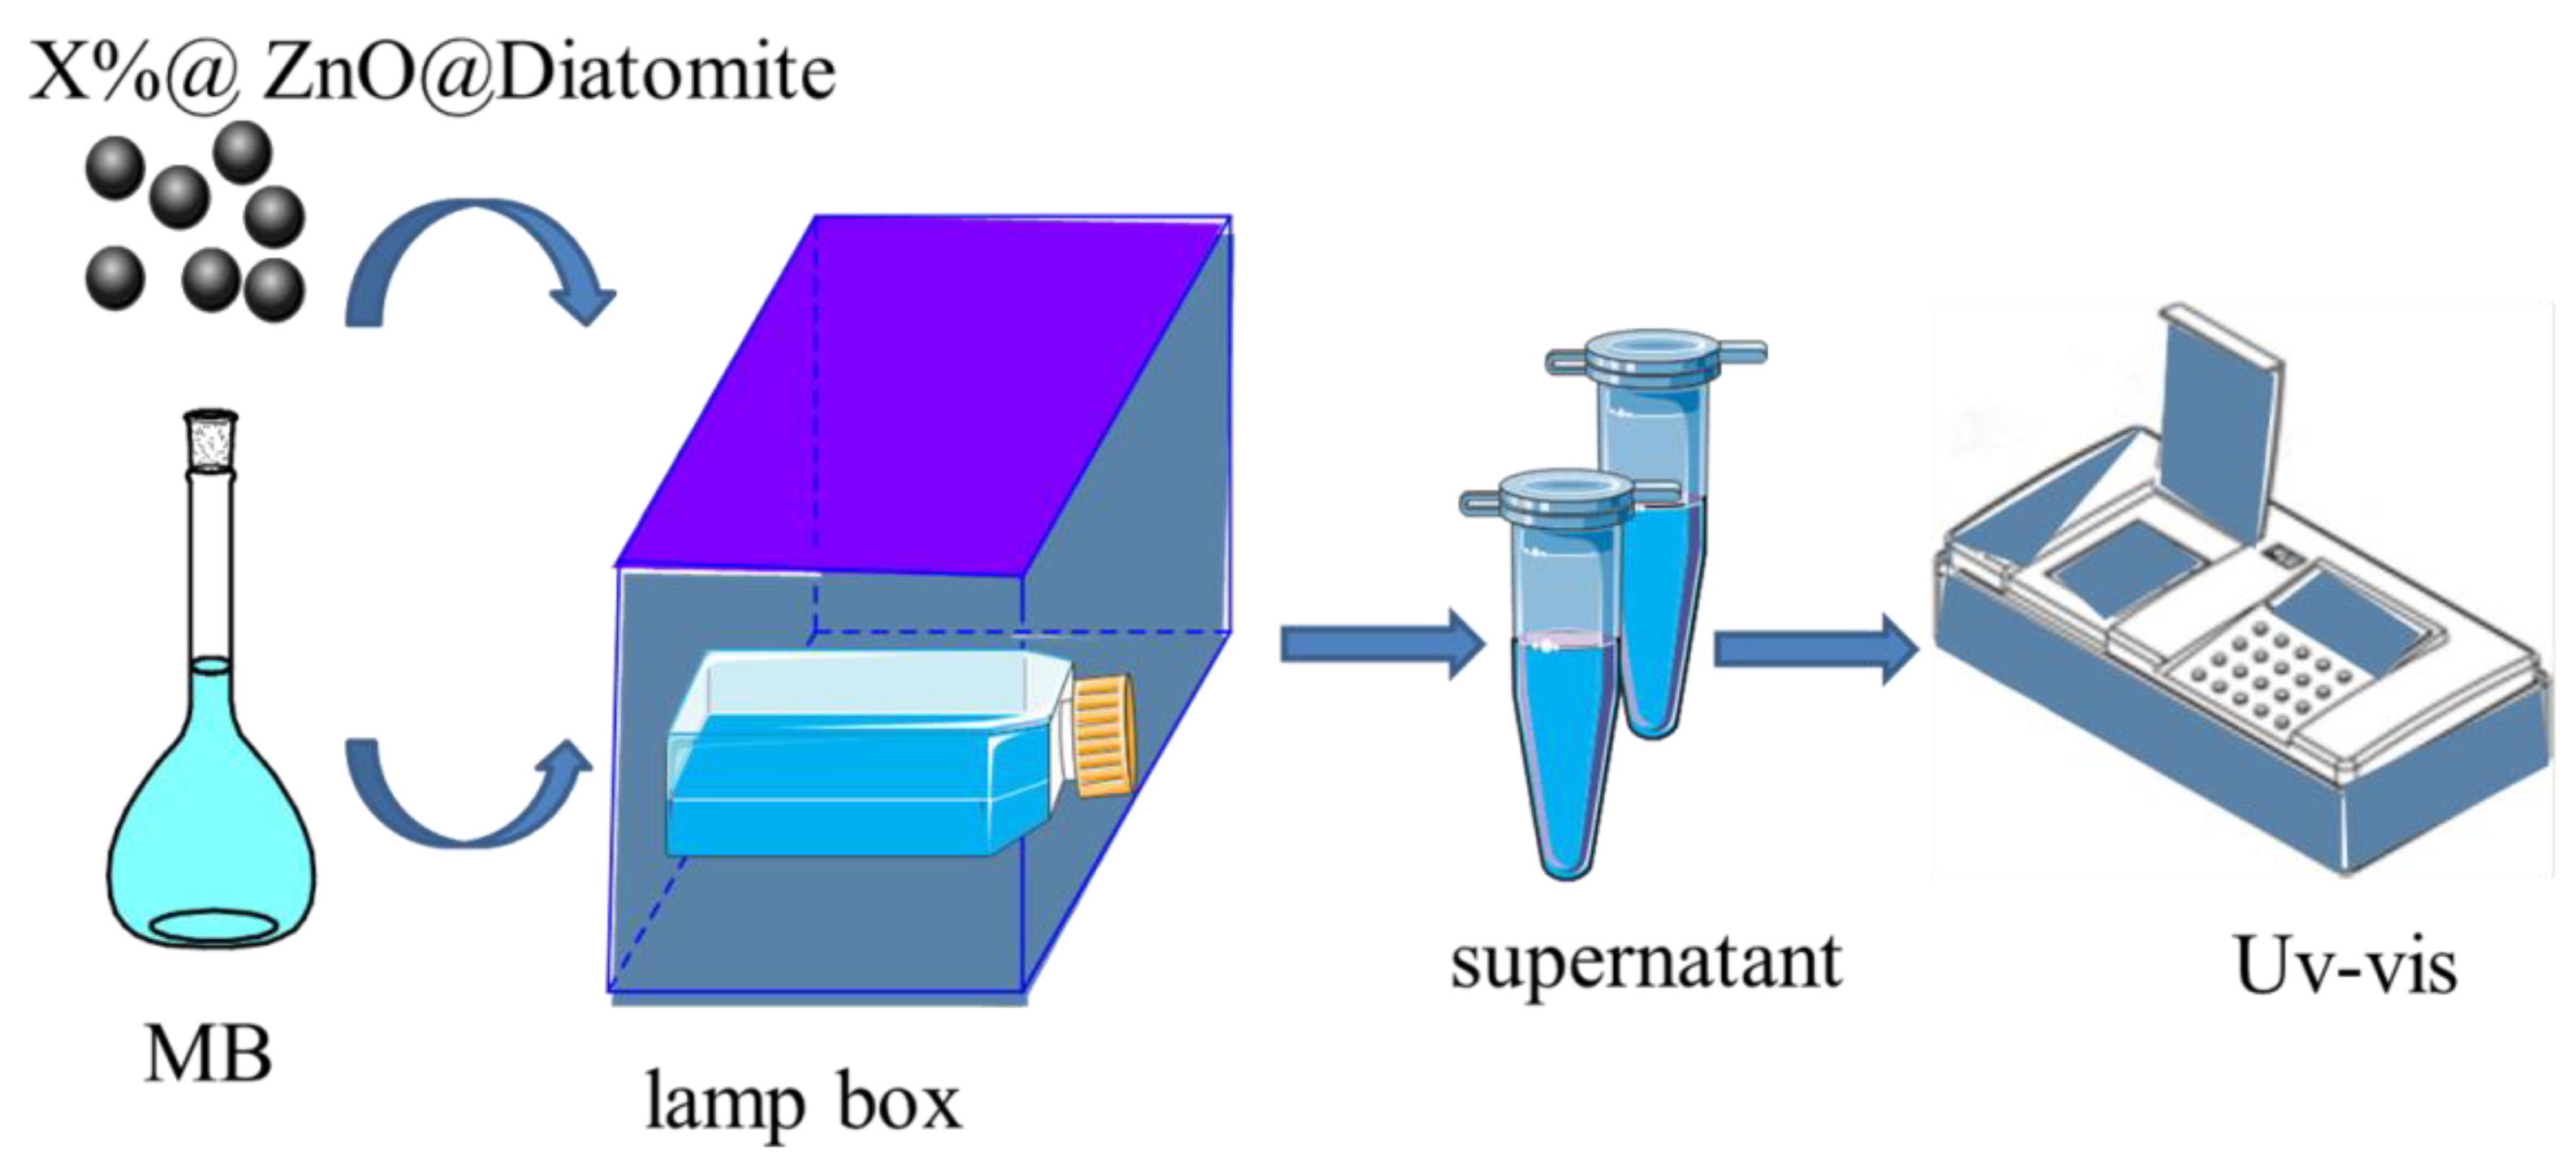
Samples with various loading ratios were evaluated using an MB solution photocatalytic degradation method. The analytical balance weighed 50 mg catalyst with a 30 mL concentration of 5 mg/L MB solution added to a 250 mL glass bottle, as shown in Scheme 3. The bottle was then placed in a heated xenon lamp box. First, static dark adsorption proceeds for 30 min in dark conditions, and then take 4 mL MB solution from the glass bottle into a sample tube measuring 5 mL and mark it as serial number 1. Turn on the xenon light and then take 4 mL MB solution from the glass bottle. The xenon lamp will always be illuminated. Then, 4 mL methylene blue solution is taken out every 30 min and marked as 3–6. The degradation rate was determined by monitoring the variation in MB solution concentration over time using an ultraviolet visible spectrophotometer (ShimUV-3600). The catalyst with the highest degradation rate was selected to degrade gaseous organic pollutants, including acetone and benzene. The degradation process was performed in headspace vials with a volume of 500 mL. Under sealed conditions, the saturated gas has the same concentration as the liquid. The specific experimental details are similar to those for the MB solution degradation process, but MB solution was replaced by gas-phase organic pollutants. The details of the experiment are as follows: the catalyst (0.05 g) was added to a headspace vials bottle, and 1 mL of the saturated gas pollutant was transferred to the headspace vials using a gas chromatographic syringe of 2.5 mL. A xenon lamp (30 W) was used as a light source during photocatalytic degradation. The headspace vials were placed in light, and the bottle was directly irradiated. The whole process was performed at room temperature. No heating or stirring was used throughout the degradation. Meanwhile, the gas was detected every 30 min, and the corresponding concentration of organic gas pollutants was determined by gas chromatography–mass spectrometry (GC–MS).
3.3.3. Electrochemical Measurements of Electrocatalysts
Photoelectrochemical decomposition of water activity testing of the catalysts used a three-electrode system, including a working electrode, calomel electrode as the reference electrode, and graphite is the counter. The 0.5 M Na2SO4 solution acted as an electrolyte solution, and the working electrode was prepared without any conductive substance. A total of 10 mg of catalyst was ultrasonically dispersed into a mixed solution of deionized water (475 μL), aqueous ethanol (475 μL) and Nafion solution (30 μL), where the pipettor took 5-µL droplets to the platinum carbon electrode as the working electrode, and the platinum carbon electrode area was 0.1256 cm2. All electrodes were connected to an external circuit via a small crocodile needle. It was also ensured that there was no contact between the crocodile needle and the electrolyte. The photocurrent was measured under the irradiation of 150-mW/cm2 xenon lamps. Linear scanning voltammetry (LSV) was performed at a rate of 10 mV/s between 0.4 and 1 V. Photochemical measurements were performed in both dark and simulated sunlight conditions. The efficiency of the decomposition of water was calculated using the following formula:
where η (%) is the efficiency of the photoelectrochemical decomposition of water, ERHE is the potential calibrated against RHE and Ilight is photocurrent density.
η(%) = J (1.23 − ERHE)/Ilight
4. Conclusions
X%ZnO@diatomite were successfully prepared by the precipitation method, and the diameter of the synthesized catalysts was 15–20 nm. The ZnO has nanoscale features and was relatively uniformly loaded on diatomite, solving the problem of limited utilization and recovery difficulty of nanomaterials. The catalysts were successfully prepared by the green pollution-free precipitation method. Under visible light irradiation, the optimal catalyst showed excellent photocatalytic performance for MB solution, gaseous acetone, and gaseous benzene. The experiments demonstrate that the catalysts have great potential for application to volatile organic compounds. By adjusting the loading ratio, the composite achieved high catalytic degradation, and the best degradation efficiency occurred at a molar loading ratio of 10%. At + 0.8 V vs. RHE, the maximum hydrocracking efficiency of the 10% ZnO@diatomite composite was 0.045%. XPS results proved the existence of Si–O–Zn bonds, providing a theoretical basis for the degradation mechanism. The results are consistent with conclusions obtained from characterization techniques such as XRD and UV-vis and the Photoluminescence (PL) spectra. The experimental catalysts not only can be conveniently recycled, but it also have great potential for the photocatalytic degradation of pollutants.
Author Contributions
Conceptualization, B.Y. and J.Y.; methodology, B.Y.; software, B.Y., X.L. and Q.W.; validation, B.Y., X.L. and Z.M.; formal analysis, B.Y.; investigation, B.Y.; resources, B.Y.; data curation, B.Y.; writing—original draft preparation, B.Y.; writing—review and editing, B.Y. and J.Y.; visualization, B.Y., J.Y. and X.L.; supervision, J.Y.; project administration, J.Y.; funding acquisition, J.Y. All authors have read and agreed to the published version of the manuscript.
Funding
This research received no external funding.
Data Availability Statement
The raw data supporting the conclusions of this article will be made available by the authors, without undue reservation.
Conflicts of Interest
The authors declare no conflict of interest.
References
- Zhang, R.; Fei, C.; Li, B.; Fu, H.; Tian, J.; Cao, G. Continuous size tuning of monodispersed ZnO nanoparticles and its size effect on the performance of perovskite solar cells. ACS Appl. Mater. Interfaces 2017, 9, 9785–9794. [Google Scholar] [CrossRef] [PubMed]
- Wang, D.; Zhou, Z.-H.; Yang, H.; Shen, K.-B.; Huang, Y.; Shen, S. Preparation of TiO2 loaded with crystalline nano Ag by a one-step low-temperature hydrothermal method. J. Mater. Chem. 2012, 22, 16306–16311. [Google Scholar] [CrossRef]
- Sakthivel, S.; Neppolian, B.; Shankar, M.; Arabindoo, B.; Palanichamy, M.; Murugesan, V. Solar photocatalytic degradation of azo dye: Comparison of photocatalytic efficiency of ZnO and TiO2. Sol. Energy Mater. Sol. Cells 2003, 77, 65–82. [Google Scholar] [CrossRef]
- Kim, D.; Yong, K. Boron doping induced charge transfer switching of a C3N4/ZnO photocatalyst from Z-scheme to type II to enhance photocatalytic hydrogen production. Appl. Catal. B Environ. 2021, 282, 119538. [Google Scholar] [CrossRef]
- Chankhanittha, T.; Nanan, S. Visible-light-driven photocatalytic degradation of ofloxacin (OFL) antibiotic and Rhodamine B (RhB) dye by solvothermally grown ZnO/Bi2MoO6 heterojunction. J. Colloid Interface Sci. 2020, 582, 412–427. [Google Scholar] [CrossRef] [PubMed]
- Gupta, N.K.; Bae, J.; Kim, S.; Kim, K.S. Fabrication of Zn-MOF/ZnO nanocomposites for room temperature H2S removal: Adsorption, regeneration, and mechanism. Chemosphere 2021, 274, 129789. [Google Scholar] [CrossRef] [PubMed]
- Qian, C.; Yin, J.; Zhao, J.; Li, X.; Wang, S.; Bai, Z.; Jiao, T. Facile preparation and highly efficient photodegradation performances of self-assembled Artemia eggshell-ZnO nanocomposites for wastewater treatment. Colloids Surf. A Physicochem. Eng. Aspects 2021, 610, 125752. [Google Scholar] [CrossRef]
- Fernando, J.F.S.; Shortell, M.P.; Noble, C.J.; Harmer, J.R.; Jaatinen, E.A.; Waclawik, E.R. Controlling Au photodeposition on large ZnO nanoparticles. ACS Appl. Mater. Interfaces 2016, 8, 14271–14283. [Google Scholar] [CrossRef] [Green Version]
- Hong, R.; Pan, T.; Qian, J.; Li, H. Synthesis and surface modification of ZnO nanoparticles. Chem. Eng. J. 2006, 119, 71–81. [Google Scholar] [CrossRef]
- Sernelius, B.; Berggren, K.-F.; Jin, Z.-C.; Hamberg, I.; Granqvist, C.G. Band-gap tailoring of ZnO by means of heavy Al doping. Phys. Rev. B 1988, 37, 10244–10248. [Google Scholar] [CrossRef] [PubMed] [Green Version]
- Deng, H.; Fei, X.; Yang, Y.; Fan, J.; Yu, J.; Cheng, B.; Zhang, L. S-scheme heterojunction based on p-type ZnMn2O4 and n-type ZnO with improved photocatalytic CO2 reduction activity. Chem. Eng. J. 2021, 409, 127377. [Google Scholar] [CrossRef]
- Klingshirn, C. ZnO: Material, physics and applications. ChemPhysChem 2007, 8, 782–803. [Google Scholar] [CrossRef] [PubMed]
- Chen, D.; Wang, Z.; Ren, T.; Ding, H.; Yao, W.; Zong, R.; Zhu, Y. Influence of Defects on the photocatalytic activity of ZnO. J. Phys. Chem. C 2014, 118, 15300–15307. [Google Scholar] [CrossRef]
- Li, Q.; Zhai, G.; Xu, Y.; Odoom-Wubah, T.; Jia, L.; Huang, J.; Sun, D.; Li, Q. Diatomite supported Pt nanoparticles as efficient catalyst for benzene removal. Ind. Eng. Chem. Res. 2019, 58, 14008–14015. [Google Scholar] [CrossRef]
- Pookmanee, P.; Thippraphan, P.; Jansanthea, P.; Phanichphant, S. Characterization and adsorption efficiency of the natural and the modified diatomite via the low temperature hydrothermal route. Adv. Mater. Res. 2012, 506, 425–428. [Google Scholar] [CrossRef]
- Chen, C.; Liu, P.; Lu, C. Synthesis and characterization of nano-sized ZnO powders by direct precipitation method. Chem. Eng. J. 2008, 144, 509–513. [Google Scholar] [CrossRef]
- Long, X.; Wang, C.; Wei, S.; Wang, T.; Jin, J.; Ma, J. Layered double hydroxide onto perovskite oxide-decorated ZnO nanorods for modulation of carrier transfer behavior in photoelectrochemical water oxidation. ACS Appl. Mater. Interfaces 2020, 12, 2452–2459. [Google Scholar] [CrossRef]
- Ristic, M.; Music, S.; Ivanda, M.; Popović, S. Sol–gel synthesis and characterization of nanocrystalline ZnO powders. J. Alloy. Compd. 2005, 397, L1–L4. [Google Scholar] [CrossRef]
- Aksoy, S.; Caglar, Y.; Ilican, S.; Caglar, M. Sol–gel derived Li–Mg co-doped ZnO films: Preparation and characterization via XRD, XPS, FESEM. J. Alloys Compd. 2012, 512, 171–178. [Google Scholar] [CrossRef]
- Kaftelen, H.; Ocakoglu, K.; Thomann, R.; Tu, S.; Weber, S.; Erdem, E. EPR and photoluminescence spectroscopy studies on the defect structure of ZnO nanocrystals. Phys. Rev. B 2012, 86, 014113. [Google Scholar] [CrossRef]
- Kappers, L.; Gilliam, O.; Evans, S.; Halliburton, L.; Giles, N. EPR and optical study of oxygen and zinc vacancies in elec-tron-irradiated ZnO. Nucl. Instrum. Methods Phys. Res. Sect. B Beam Interact. Mater. Atoms. 2008, 266, 2953–2957. [Google Scholar] [CrossRef]
- Al-Gaashani, R.; Radiman, S.; Daud, A.; Tabet, N.; Al-Douri, Y. XPS and optical studies of different morphologies of ZnO nanostructures prepared by microwave methods. Ceram. Int. 2013, 39, 2283–2292. [Google Scholar] [CrossRef]
- Abdel-Wahab, M.S.; Jilani, A.; Yahia, I.; Al-Ghamdi, A.A. Enhanced the photocatalytic activity of Ni-doped ZnO thin films: Morphological, optical and XPS analysis. Superlattices Microstruct. 2016, 94, 108–118. [Google Scholar] [CrossRef]
- Wu, L.; Zhou, Y.; Nie, W.; Song, L.; Chen, P. Synthesis of highly monodispersed teardrop-shaped core-shell. SiO2/TiO2 nanoparticles and their photocatalytic activities. Appl. Surf. Sci. 2015, 351, 320–326. [Google Scholar] [CrossRef]
- Yu, X.; Zhao, Z.; Zhang, J.; Guo, W.; Li, L.; Liu, H.; Wang, Z.L. One-step synthesis of ultrathin nanobelts-assembled urchin-like anatase TiO2 nanostructures for highly efficient photocatalysis. CrystEngComm 2017, 19, 129–136. [Google Scholar] [CrossRef]
- Xu, H.-Q.; Hu, J.; Wang, D.; Li, Z.; Zhang, Q.; Luo, Y.; Yu, S.-H.; Jiang, H.-L. Visible-light photoreduction of CO2 in a metal–organic framework: Boosting electron–hole separation via electron trap states. J. Am. Chem. Soc. 2015, 137, 13440–13443. [Google Scholar] [CrossRef]
- Kang, Y.; Yang, Y.; Yin, L.-C.; Kang, X.; Wang, L.; Liu, G.; Cheng, H.-M. Selective breaking of hydrogen bonds of layered carbon nitride for visible light photocatalysis. Adv. Mater. 2016, 28, 6471–6477. [Google Scholar] [CrossRef]
- Azarang, M.; Shuhaimi, A.; Yousefi, R.; Golsheikh, A.M.; Sookhakian, M. Synthesis and characterization of ZnO NPs/reduced graphene oxide nanocomposite prepared in gelatin medium as highly efficient photo-degradation of MB. Ceram. Int. 2014, 40, 10217–10221. [Google Scholar] [CrossRef]
- Neena, D.; Kondamareddy, K.K.; Bin, H.; Lu, D.; Kumar, P.; Dwivedi, R.K.; Pelenovich, V.; Zhao, X.-Z.; Gao, W.; Fu, D. Enhanced visible light photodegradation activity of RhB/MB from aqueous solution using nanosized novel Fe-Cd co-modified ZnO. Sci. Rep. 2018, 8, 1–12. [Google Scholar] [CrossRef]
- Wang, Y.N.; Li, J.; Wang, Q. The performance of daylight photocatalytic activity towards degradation of MB by the flower-like and approximate flower-like complexes of graphene with ZnO and Cerium doped ZnO. Optik 2020, 204, 164131. [Google Scholar] [CrossRef]
- Jeong, K.; Deshmukh, P.R.; Park, J.; Sohn, Y.; Shin, W.G. ZnO-TiO2 core–shell nanowires: A sustainable photoanode for enhanced photoelectrochemical water splitting. ACS Sustain. Chem. Eng. 2018, 6, 6518–6526. [Google Scholar] [CrossRef]
Figure 1.
XRD patterns of pure diatomite, pure ZnO, and X%ZnO@diatomite.

Figure 2.
SEM images with different magnifications of (A1,A2) diatomite, (B1,B2) ZnO, and (C1,C2) 10% ZnO@diatomite; (D1,D2) HRTEM images of 10% ZnO@diatomite.
Figure 2.
SEM images with different magnifications of (A1,A2) diatomite, (B1,B2) ZnO, and (C1,C2) 10% ZnO@diatomite; (D1,D2) HRTEM images of 10% ZnO@diatomite.

Figure 3.
EDS and corresponding elemental mapping of 10% ZnO@diatomite.

Figure 4.
EPR spectra of the samples: (a)·OH in diatomite; (b)·OH in pure ZnO; (c)·OH in 10%ZnO@diatomite; (d) O−2 in diatomite; (e)·O−2 in pure ZnO; (f)·O−2 in 10%ZnO@diatomite; (g) oxygen vacancy; (h) degradation rate of MB solution by 10%ZnO@diatomite with the addition of free radical scavengers.

Figure 5.
XPS survey spectra (a) and Si 2p (b), Zn 2p (c), and O 1s (d) spectra for ZnO and 10% ZnO@diatomite.
Figure 5.
XPS survey spectra (a) and Si 2p (b), Zn 2p (c), and O 1s (d) spectra for ZnO and 10% ZnO@diatomite.

Figure 6.
N2 adsorption-desorption isotherms of diatomite, and X%ZnO@diatomite composites.

Figure 7.
(a) UV-vis spectra of X%ZnO@diatomite, (b) plots of ()2 versus (), (c) XPS valence band spectra of pure ZnO, (d) XPS valence band spectra of 10% ZnO@diatomite.
Figure 7.
(a) UV-vis spectra of X%ZnO@diatomite, (b) plots of ()2 versus (), (c) XPS valence band spectra of pure ZnO, (d) XPS valence band spectra of 10% ZnO@diatomite.

Figure 8.
PL spectra of ZnO, diatomite, and X%ZnO@diatomite.

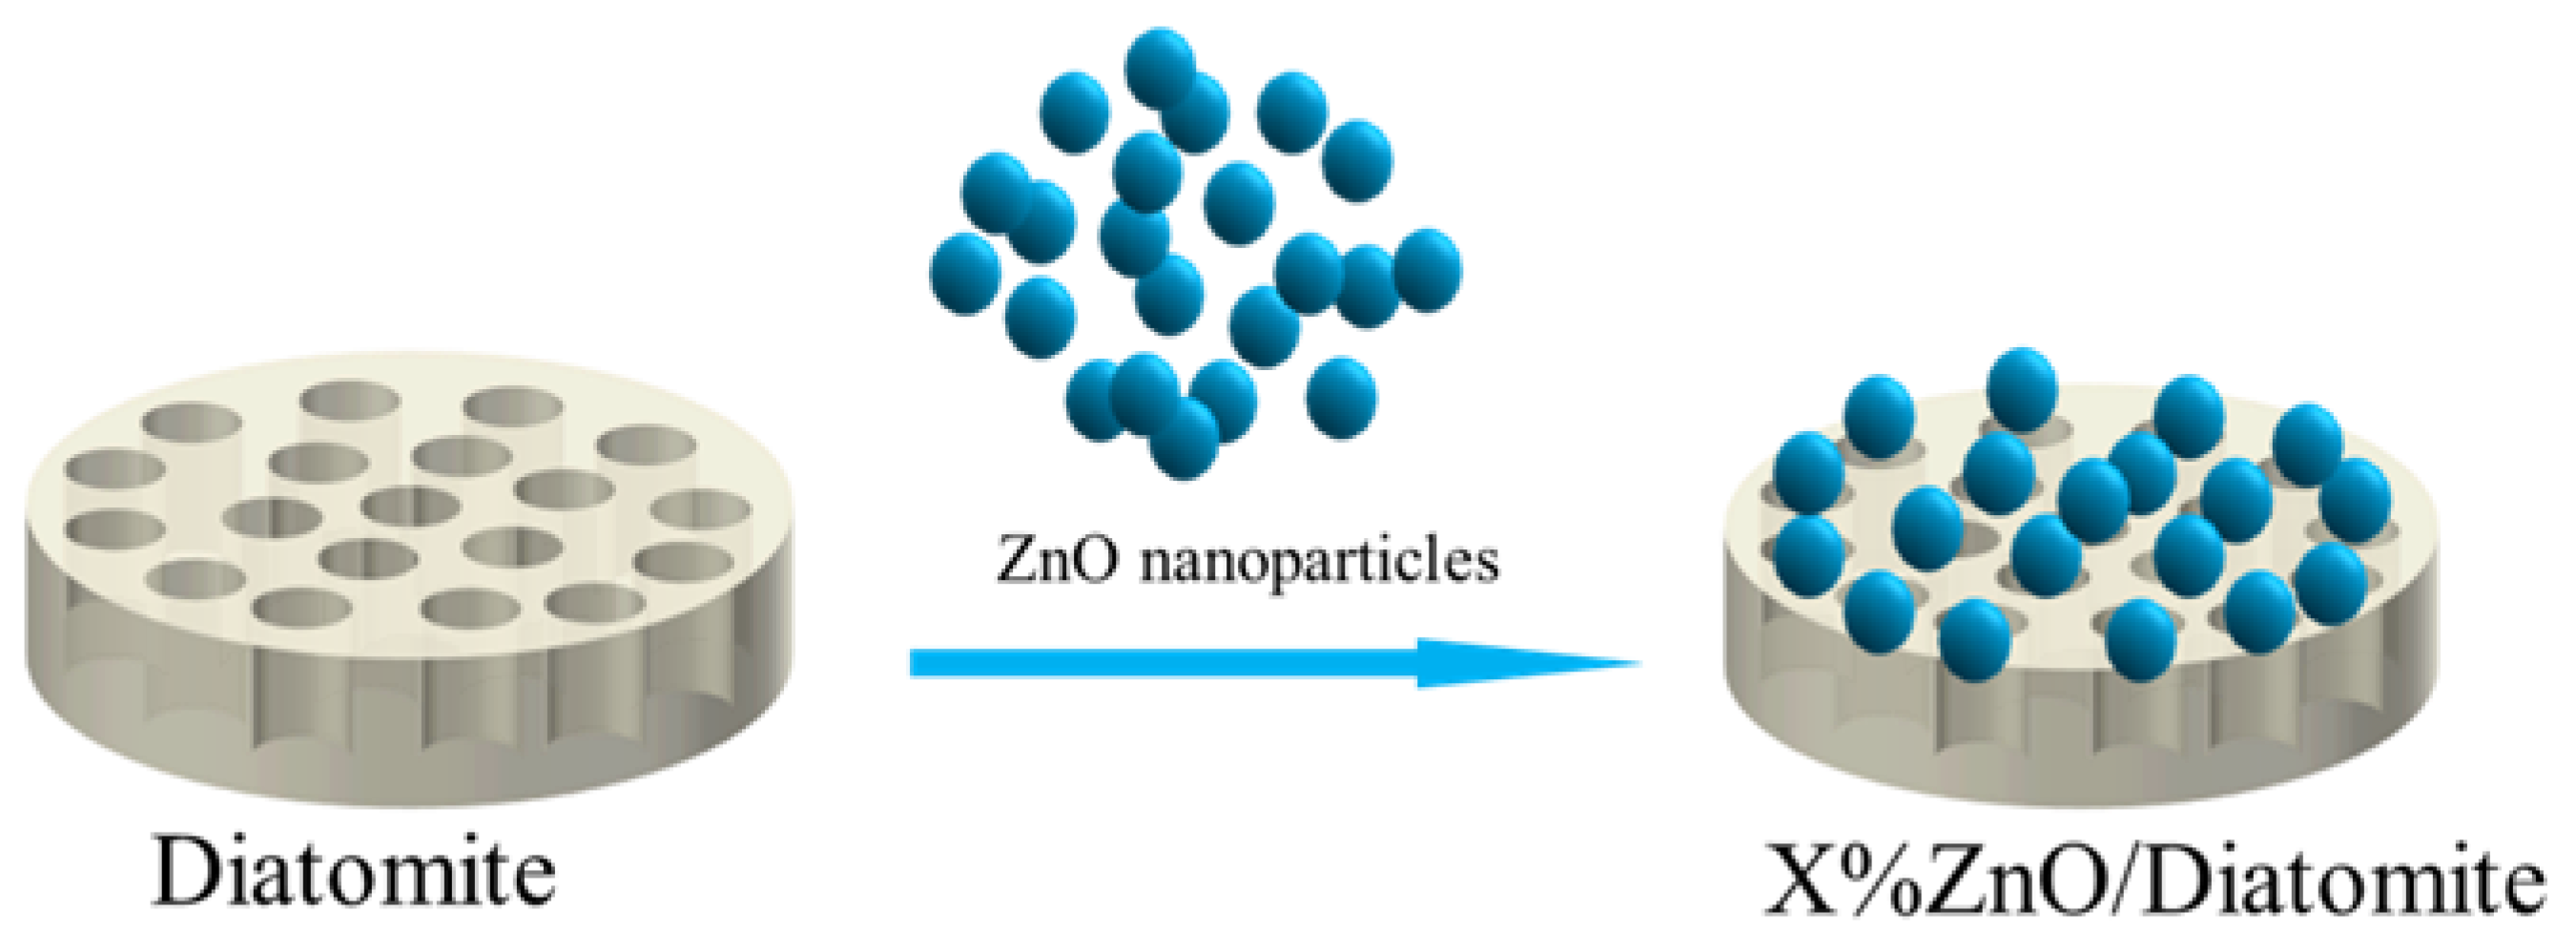
Scheme 1.
Schematic illustration of the formation of ZnO@diatomite composite catalysts.

Scheme 2.
Flow chart of photocatalyst preparation.

Scheme 3.
Flow chart of photocatalyst degradation of MB.

Figure 9.
Schematic drawing of photocatalytic mechanism of ZnO@diatomite.

Figure 10.
MB photodegradation over various catalysts under visible light.

Figure 11.
Primary kinetics fitting curve for photocatalytic degradation of MB.

Figure 12.
Photodegradation of certain concentrations of gaseous acetone and gaseous benzene over 10% ZnO@diatomite under visible light irradiation.
Figure 12.
Photodegradation of certain concentrations of gaseous acetone and gaseous benzene over 10% ZnO@diatomite under visible light irradiation.

Figure 13.
(a) Amperometric I–t curves. (b) Photocurrent density. (c) Nyquist plots of pure ZnO and X%ZnO@diatomite. (d) Water splitting efficiency of pure ZnO and X%ZnO@diatomite. (e,f) Schematic representation of the possible mechanism of photogenerated charge separation at the interface of X%ZnO@diatomite with the corresponding energy band diagram during PEC water splitting.


Table 1.
Ratio of three kinds of surface oxygen species of ZnO and 10% ZnO@diatomite.
| Oxygen Species | O1 | O2 | O3 | |
|---|---|---|---|---|
| Sample | ||||
| ZnO | 28.02% | 47.81% | 24.17% | |
| 10%ZnO@diatomite | 26.77% | 44.67% | 28.56% | |
Table 2.
Surface and structural characterization of the catalysts.
| Sample | BET Specific Surface Area (m2/g) |
|---|---|
| Diatomite | 1.19 |
| 4% ZnO@diatomite | 1.38 |
| 6% ZnO@diatomite | 2.15 |
| 10% ZnO@diatomite | 2.52 |
Publisher’s Note: MDPI stays neutral with regard to jurisdictional claims in published maps and institutional affiliations. |
© 2021 by the authors. Licensee MDPI, Basel, Switzerland. This article is an open access article distributed under the terms and conditions of the Creative Commons Attribution (CC BY) license (https://creativecommons.org/licenses/by/4.0/).
Share and Cite
MDPI and ACS Style
Yang, B.; Liu, X.; Ma, Z.; Wang, Q.; Yang, J. Synthesis of Nano-ZnO/Diatomite Composite and Research on Photoelectric Application. Catalysts 2021, 11, 1232. https://0-doi-org.brum.beds.ac.uk/10.3390/catal11101232
AMA Style
Yang B, Liu X, Ma Z, Wang Q, Yang J. Synthesis of Nano-ZnO/Diatomite Composite and Research on Photoelectric Application. Catalysts. 2021; 11(10):1232. https://0-doi-org.brum.beds.ac.uk/10.3390/catal11101232
Chicago/Turabian StyleYang, Beibei, Xuefei Liu, Zixu Ma, Qian Wang, and Junjiao Yang. 2021. "Synthesis of Nano-ZnO/Diatomite Composite and Research on Photoelectric Application" Catalysts 11, no. 10: 1232. https://0-doi-org.brum.beds.ac.uk/10.3390/catal11101232
Note that from the first issue of 2016, this journal uses article numbers instead of page numbers. See further details here.