Article

Innovative Ag–TiO2 Nanofibers with Excellent Photocatalytic and Antibacterial Actions

1
“Petru Poni” Institute of Macromolecular Chemistry, 41A Grigore Ghica Voda Alley, 700487 Iasi, Romania
2
Center of Materials Technology and Photonics, School of Engineering, Hellenic Mediterranean University, 71410 Heraklion, Greece
3
National Institute for Research and Development in Microtechnologies (IMT-Bucharest), 023573 Bucharest, Romania
*
Authors to whom correspondence should be addressed.
Submission received: 10 August 2021 / Revised: 1 October 2021 / Accepted: 9 October 2021 / Published: 13 October 2021
(This article belongs to the Special Issue Heterogeneous Photocatalysis: A Solution for a Greener Earth)

Abstract

:
Ag–TiO2 nanostructures were prepared by electrospinning, followed by calcination at 400 °C, and their photocatalytic and antibacterial actions were studied. Morphological characterization revealed the presence of one-dimensional uniform Ag–TiO2 nanostructured nanofibers, with a diameter from 65 to 100 nm, depending on the Ag loading, composed of small crystals interconnected with each other. Structural characterization indicated that Ag was successfully integrated as small nanocrystals without affecting much of the TiO2 crystal lattice. Moreover, the presence of nano Ag was found to contribute to reducing the band gap energy, which enables the activation by the absorption of visible light, while, at the same time, it delays the electron–hole recombination. Tests of their photocatalytic activity in methylene blue, amaranth, Congo red and orange II degradation revealed an increase by more than 20% in color removal efficiency at an almost double rate for the case of 0.1% Ag–TiO2 nanofibers with respect to pure TiO2. Moreover, the minimum inhibitory concentration was found as low as 2.5 mg/mL for E. coli and 5 mg/mL against S. aureus for the 5% Ag–TiO2 nanofibers. In general, the Ag–TiO2 nanostructured nanofibers were found to exhibit excellent structure and physical properties and to be suitable for efficient photocatalytic and antibacterial uses. Therefore, these can be suitable for further integration in various important applications.

Graphical Abstract

1. Introduction

Titanium dioxide (TiO2) is considered a suitable compound for decomposing wastes and antimicrobial action due to its photocatalytic nature and because it is a chemically stable, non-toxic, inexpensive, and quite safe substance. In particular, various types of photocatalysts have been developed using TiO2 for wastewater treatment employing various methods including immobilized catalyst systems, membrane separation, and gravitational separation systems. As the TiO2 semiconductor band gap energy (3.2 eV) limits its activity when used in visible light, in many of these studies, an important issue to be considered is the activation of the photocatalysts with solar radiation, as this can improve the energy efficiency and consequently the economic viability of the process. In that respect, TiO2 is doped with various elements to enhance visible light activity. As a result, numerous photocatalysts have been developed, such as composite, co-doped, and co-catalysts compounds, their photocatalytic performance depending strongly on their morphological, structural, and textural properties [1,2,3,4,5,6,7,8].
There are many studies regarding the antifungal and antibacterial properties of TiO2 nanoparticles in various forms against a broad range of both Gram-positive and Gram-negative bacteria, properties needed in sectors such as food, textiles, medicine, water disinfection, and food packaging [9,10]. In general, the antimicrobial activity of nanostructured TiO2 is greatly dependent on the photocatalytic performance of TiO2, which depends strongly on its morphological, structural, and textural properties, as was mentioned before [1,2,3,4].
Studies have shown that the crystalline structure and morphology of TiO2 nanoparticles, are influenced by growth process parameters such as temperatures, starting concentration of precursors, pH, etc. The potential health impact and toxicity to the environment of nanomaterials is also currently an important matter to be addressed. As an example, metal oxide nanoparticles (NPs) conventionally synthesized using chemical methods, have shown different levels of toxicity to test organisms [11,12,13]. Their toxicity seems to be mainly related to the small size that permits easy penetration through cellular membranes and its light dependent properties. One way to avoid nanoparticulate free circulation is to immobilize them onto substrates or larger structures [14].
Regarding the improvement of the electron–hole pair generation and the enlargement of the spectral absorption domain of TiO2, many studies have been performed related to the inclusion of metal/non-metal ions in the structure of TiO2, the dye functionalization on the TiO2 surface in dye-sensitized solar cells (DSSC), and the growth of noble metals onto the TiO2 surface [15]. Silver (Ag) is among the most interesting metals used as a dopant to modify the structure of TiO2 because it has the particular property to prevent the recombination of electron–hole pairs. Moreover, Ag can generate surface plasmon resonance with TiO2 under visible light. These changes provided by Ag doping lead to a significant improvement of the photocatalytic activity, a fact confirmed by other authors [16,17,18]. On the other hand, Ag nanoparticles possess a broad spectrum of antibacterial, antifungal, and antiviral properties. Ag nanoparticles have the ability to penetrate bacterial cell walls, changing the structure of cell membranes and even resulting in cell death. Their efficacy is due not only to their nanoscale size but also to their large ratio of surface area to volume. They can increase the permeability of cell membranes, produce reactive oxygen species, and interrupt the replication of deoxyribonucleic acid by releasing silver ions.
There are studies showing that the inclusion of Ag in the structure of TiO2 leads to enhance photocatalytic efficiency, as well as antimicrobial properties. Over the years, a large volume of reported research was focused on obtaining 0D systems (nanoparticles) based on Ag doped TiO2, which were tested in terms of photocatalytic and antimicrobial performances [13,19,20,21,22]. As an example, studies showed that TiO2-NPs had efficient antimicrobial activity against E. coli, S. aureus, methicillin-resistant S. aureus, K. pneumoniae [23,24]. However, little attention was paid to the development of Ag doped TiO2 nanofibers by the electrospinning-calcination technique, as well as studies of their performances in photocatalytic dye degradation and antimicrobial action. As an example, Zhang et al. [15] prepared hierarchical structures composed of TiO2 fibers on which Ag nanoparticles were grown to improve the photocatalytic efficiency for Rhodamine B (RhB) dye degradation. Moreover, nano-Ag-decorated TiO2-nanofibres proved that the inclusion of Ag exhibited an increased antimicrobial effect on S. aureus and E. coli [25]. Recently, Roongraung et al. [18] reported the photocatalytic performance of Ag doped TiO2 nanofibers for photocatalytic glucose conversion.
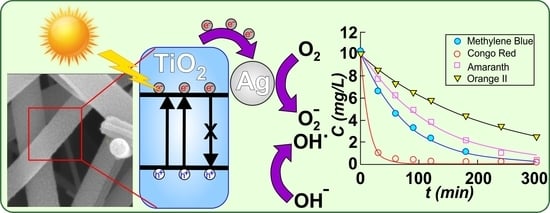
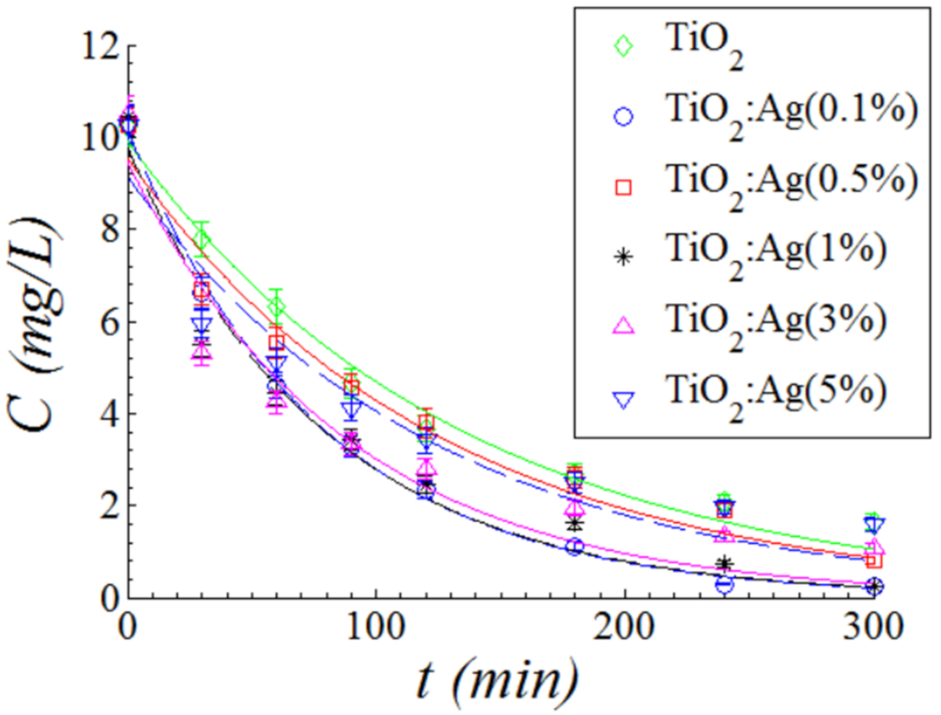
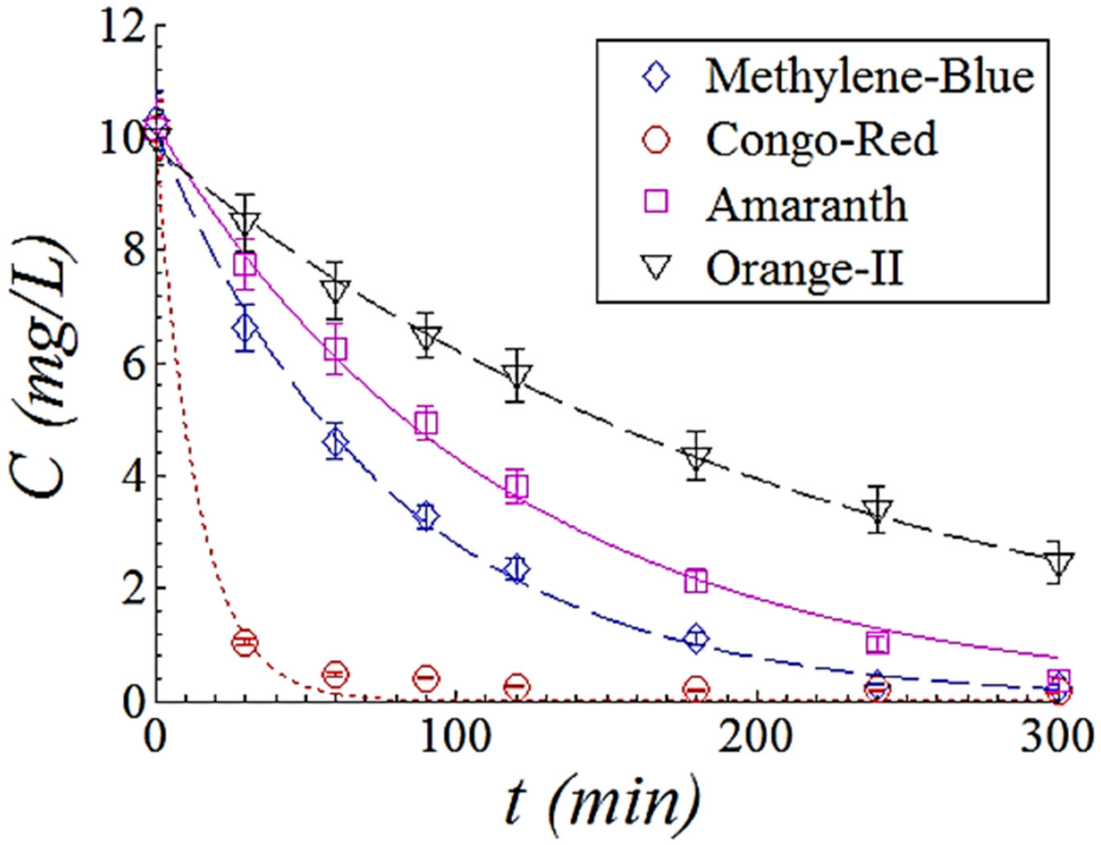
Although the research on TiO2 has a very long history and its applications are almost countless as the respective publications are too, this semiconductor has the potential to offer even today very interesting results worth being further investigated. This paper reports the development and optimization of pure TiO2 and Ag–TiO2 photocatalytic nanostructured nanofibers, fabricated by electrospinning followed by calcination at high temperature. Nanofibers can be well stacked together in larger 3D structures, thus, they can better be immobilized in membranes or other kinds of support, offering at the same time a much larger active surface than that for the case of nano-powders, while they can easily be recovered from the active medium used in applications. At the same time, the presence of Ag can lead to both an effective photocatalytic activity and antimicrobial action and a sunlight-driven activation, as compared to pure TiO2. Therefore, the integration of such materials into food packaging, medical textiles, and other healthcare related items can be a quite innovative approach for real-life applications. In the present study, we report the fabrication of materials with remarkable photocatalytic efficiency of 99% at a constant rate of k = 1.29 × 10⁻² min−1 that was found for the 0.1% Ag–TiO2 sample for the case of Methylene Blue dye degradation. Additionally, these materials proved able to degrade up 99% of other organic dyes with constant rates in the range of 4.57 × 10⁻³ to 7.28 × 10⁻² min−1 depending on the dye nature, all degradation tests being performed under UV-visible light irradiation from a halogen lamp, without intervening to acidify the solution or add H2O2. These materials proved to be also reusable.

2. Results

2.1. X-rays Diffraction (XRD) Analysis

Typical XRD diffractograms of the reference pure TiO2 and the Ag–TiO2 nanostructured nanofibers with different Ag content, analyzed in the range of 2θ = 5–80° are shown in Figure 1.
The grazing incidence X-ray diffraction patterns present multiple diffraction peaks, assigned unambiguously as anatase phase with lattice parameters: a = b = 0.38 nm; c = 0.94 nm according to ICDD (International Center for Diffraction Data) database card No. 001-0562. The diffraction peaks located at 25.30°, 37.96°, 47.94°, 54.41°, 54.93°, 62.77°, 69.24°, and 75.17°, correspond to the (101), (103), (200), (105), (211), (213), (116) and (107) Miller indices. An investigation of the position of the diffraction peaks shows that the lattice constant of anatase is preserved for different Ag content (the respective values for the (101) diffraction peak are shown in Table 1). In order to identify the diffraction peaks, in Figure 1 the positions of Ag diffraction peaks were added according to card no. 001-1164. It is clear that numerous very small diffraction peaks remain unassigned. It exists a possibility to be an unknown organic compound contaminant, but usually, the organic compounds give diffraction peaks below 30°. Additionally, it exists the possibility that some traces of unknown titanates compounds to appear (brookite was unsuccessfully checked). The second possibility is more plausible, as the Energy Dispersive X-ray Analysis (EDX) investigations did not show the presence of other elements. However, the very small peaks cannot be assigned to any expected material.
As the lattice constant remains unmodified, these findings suggest that interstitial doping of Ag did not take place. This observation is strengthened by the observation that the size of the crystalline domains remains practically unchanged at different Ag content. The mean crystallite size was evaluated with two independent methods, Scherrer’s equation and Rietveld refinement [26,27]. The respective values are presented in Table 1. In addition, Rietveld refinement allowed the evaluation of the lattice strain, which was increasing from 0.13% (pure TiO2 sample) to 0.52% (TAg1), reaching 0.53% at the highest Ag content (Table 1). Even though Ag was detected by EDX (as will be shown later), there is no diffraction peak of Ag observed in the XRD patterns, a fact that can be attributed to its existence as small crystals having a size below the resolution limit of the technique, observation that agrees with previous literature data [28,29]. In any case, the XRD findings indicate that the Ag content variation did not affect the unit cell of TiO2 or the crystal quality.

2.2. Morphological Characterization

The morphological characterization of the nanostructured nanofibers was carried out by Scanning Electron Microscopy (SEM) analysis. Representative samples of Ag–TiO2 nanostructured nanofibers, after calcination at 400 °C, were investigated and their images are presented in Figure 2.
As can observe in Figure 2, one-dimensional uniform Ag–TiO2 nanostructured nanofibers were obtained. The average value of the fiber diameters was evaluated from the measurement of 100 diameters for each sample using Image-J software. Histogram of fiber diameter distribution plotted from SEM images analysis of pure TiO2 (T400) and Ag doped TiO2 (TAg1 and TAg5) are given in Figure S1 of the Supplementary material. The average width of the fibers was found to vary between 65 and 100 nm, depending on the Ag loading, the mean fiber diameter decreasing as the Ag concentration increases. It was also observed that Ag doping leads to a slight variation of the dimensional distribution of nanofiber widths. As the Ag concentration increases, less thinner fibers are present. Moreover, it is interesting to indicate the particular nanostructuring of the fibers, that is, each fiber is composed of small crystals interconnected with each other. This observation was confirmed by Transmission Electron Microscopy (TEM). The elemental composition of the obtained nanofibers was studied using the energy dispersive X-ray (EDX) technique. Typical EDX spectra of Ag–TiO2 nanostructured nanofibers (TAg1, TAg3 and TAg5) are presented in Figure 3.
The EDX characterization confirmed the presence of Ti, O, Ag, and Pt elements. No other impurity elements were identified. The appearance of Pt in the EDS spectra is due to the sample’s preparation by Pt metallization for SEM/EDS measurements. The atomic percentages of Ag in the analyzed samples were found to be 0.05%, 0.21%, 0.40%, 0.51% and 0.6% respectively, values depending on the amount of precursor solutions. Some examples of EDX spectra are presented in Figure 3.
TEM characterization of pure and Ag doped TiO2 nanofibers confirmed their polycrystalline nature and nanostructuring. It can be noticed that the crystallites forming the doped materials are slightly smaller than in the case of pure TiO2 and that their order of magnitude is <10 nm as observed by XRD characterization too. Some examples are presented in the TEM images shown in Figure 4.
The specific surface area characterized by BET as a function of Ag concentration is illustrated in Table 2, while the weight change/relative humidity graphs are included in Supplementary material (Figure S2). It was found that as the Ag concentration increased, the specific surface area of the TiO2 nanofibers slightly increased for low Ag concentration but it dropped for the 5% Ag TiO2. This might be due to the lower diameters size of the fibers and the higher degree of crystallites agglomeration.

2.3. Raman Spectroscopy Measurements

Several authors [22,30,31,32,33,34,35,36,37,38] have shown in their research that the anatase phase has a tetragonal structure consisting of six Raman active modes, including A1g located at 516 cm−1, 2B1g corresponding to 397 and 516 cm−1 and 3Eg from 144, 198 and 638 cm−1, where the A1g mode overlapped with the B1g mode at 516 cm−1 [22,32,39].
In Figure 5, which displays the Raman spectra of Ag–TiO2 nanostructured nanofibers with different Ag content, one can be seen that the Raman bands observed correspond to the anatase phase of pure TiO2, even for those samples containing Ag. In particular, the Eg modes at 144 and 638 cm−1 correspond to the symmetric stretching vibration of O–Ti–O bond, whereas the B1g and A1g Raman modes at 397 and 516 cm−1 can be assigned to the symmetric and anti-symmetric bending vibration of O–Ti–O [40,41]. In any case, the peaks for the Ag containing samples were found to present small shifts (about 3 nm) to longer wavelengths. Additional peaks corresponding to Ag were not detected in any of the Ag containing samples.
It can be noted that the results of Raman characterization are in good agreement with the XRD observations. All Ag-containing materials have a similar structure of the TiO2 anatase phase, suggesting that the Ag was successfully integrated as small nanocrystals without affecting the TiO2 crystal lattice as intended. The slight red-shift of the peaks in the Raman spectra may be due to the slight distortion caused by the incorporation of metal, particles of various sizes, nature of defects, and so on [17,18,19,32].

2.4. Optical Properties and Band Gap Energy

It is known that the band gap energy is the most important optical parameter that significantly influences photocatalytic activity. Diffuse reflectance spectra recorded for pure TiO2 and Ag–TiO2 nanostructured nanofibers are illustrated in Figure 6, where a slight shift of about 10 nm to blue can be noticed for the Ag containing samples. The reflectance data were processed according to the method indicated in reference [39] for indirect bandgap semiconductors and the corresponding values are given in Table 1. The Eg values for the Ag/TiO2 nanostructures are much lower than those corresponding to pure TiO2 due to the Ag doping process. As can be observed, the presence of nano-Ag leads to decreased values of around 2.70 eV for the optical band gap, as compared to the 3.01 eV gap of pure TiO2. This means that photons with lower energy can generate electron–hole pairs and the photocatalytic activity of such materials can be activated even under visible light irradiation. Many studies [13,40] have shown that this decrease of the band gap may be due to the occurrence of new energy levels in the band gap range of the composite materials.

2.5. Photoluminescence Analysis

In the context of studies of a photocatalytic material, it is of great importance to gather information on the active surface sites of the catalyst and on how they affect the dynamics of adsorption and photoactivated transformations of the targeted species. In this regard, studies of photoluminescence (PL) properties of the material are very well suited and useful. PL phenomena in semiconductors are driven by diffusion and recombination of photogenerated charges, which typically occurs in a thin region beneath the semiconductor surface (typical widths of few tenths of nm if the excitation is provided at photon energy larger than the bandgap), making it very sensitive to small local variations. To observe how the Ag doping affects the carrier recombination and diffusion phenomena in TiO2, PL characterization using different excitation wavelengths was performed to see the excitation states involved in the emission and to observe the occurrence of sub-bandgaps. Figure 7 shows the PL spectra for the studied materials, excited at different wavelengths (λex = 280, 300, 320 and 340 nm).
TiO2 has an indirect band-edge configuration and hence its PL emission occurs at wavelengths longer than the bandgap wavelength: that is, the PL of TiO2 is not caused by band-to-band transitions but involves localized states. [42] The fluorescence spectra of TiO2 nanostructures normally display three bands, assigned to self-trapped excitons, oxygen vacancies and surface defects [18,24,33,35,36,37]. In particular, these emission bands are located in the violet, the blue (460 nm) and the blue-green (485 nm) regions respectively, which can be attributed to self-trapped excitons localized on TiO6 octahedral (422 nm) [36,37], and to oxygen related defect sites or surface defects (460 and 485 nm) [38]. Moreover, the band edge emission around 364 nm corresponds to free exciton recombination in TiO2 materials [35,36]. As can be seen, all materials present the same emission bands, but with slightly different intensities. In particular, the PL intensity of the Ag–TiO2 nanostructured nanofibers was found lower as compared to that of pure TiO2. As is known, the emission intensity is related to the recombination of electron–hole pairs in the structure of TiO2 [13]. In addition, the low intensity in the fluorescence spectra suggests that the photoexcited electron–hole pairs can be achieved at a longer time, which is beneficial in the processes of photocatalytic degradation. Thus, these findings suggest that the presence of nano Ag has a distinct effect on limiting the electron–hole recombination, as the photoexcited electron may be captured by the Ag nanoparticles that behave as an electron storage source on the TiO2 surface [13]. Nano Ag presence also contributed significantly to reducing the band gap energy and facilitating the activation by the absorption of light in the visible region, along with delaying the electron–hole recombination. Therefore, the presence of nano-Ag offers several advantages in the functionality of the Ag–TiO2 nanostructured nanofibers. Additionally, it is expected that the best photocatalytic activity under the visible irradiation would be performed for an optimal nano Ag concentration level in TiO2.

2.6. Photocatalytic Properties

2.6.1. Methylene Blue Dye Degradation

Methylene blue (MB) (C0 = 10 mg/L) was used to evaluate the photocatalytic activity of the grown materials. The dye degradation was performed under a halogen lamp light irradiation (400 W) and the amount of photocatalyst was maintained at 0.4 g/L for all samples. Typical UV-VIS absorption spectra recorded for MB dye solution degradation up 300 min under halogen lamp light irradiation in presence of pristine TiO2 and 0.1% Ag–TiO2 nanostructured nanofibers are shown in Figure 8. It can be observed that the intensity of the absorption band corresponding to a wavelength at 665 nm decreases with the increase of the irradiation time. In addition, all Ag–TiO2 nanostructured nanofibers show a faster decreasing tendency of colorant concentration as compared to pure TiO2. Regarding the color removal efficiency, this is shown in Figure 8c. The maximum degradation efficiency was found for the TAg1 sample, having a value of 97.05%. The kinetics of the photodegradation process under visible light irradiation was also evaluated.

2.6.2. Kinetics of the Photodegradation Process

Kinetics plots of the photodegradation of MB in aqueous solutions under the halogen lamp irradiation in the presence of Ag–TiO2 nanostructured nanofibers are presented in Figure 9. The data were interpolated to the pseudo-first-order (PFO) kinetic model by using the nonlinear regression technique. The goodness-of-fit was estimated by chi-square statistic test (χ2-value). Thus, the decay of MB dye concentration versus time was fitted to PFO equation, which can be expressed as:
C t = C 0 e k t
where C0 is the initial MB dye concentration (~10 mg/L), k is the pseudo-first-order reaction rate constant (min−1), and t is the irradiation time (min). The calculated parameters of the PFO model are listed in Table 3.
As observed from Table 3, the presence of nano Ag in TiO2 nanofibers increases the rate constant (k). This effect was found more important for a 0.1% content of Ag in the electrospun solution. Thus, the optimal formulation of the developed materials when acting as photocatalyst seems to be the 0.1% Ag–TiO2 (TAg1 sample), as this presents the maximum value of both the constant rate (k = 1.29 × 10⁻² min−1) and the degradation efficiency of MB dye (97.05%). Furthermore, the kinetics for the degradation of methylene blue (MB), Congo red (CR), amaranth and orange II dyes under TAg1 photocatalyst are presented below, in which the dye concentration was maintained at 10 mg/L (Figure 10). The photolysis test (without catalysts) for all four dyes was performed under fluorescent bulb light irradiation for 300 min of irradiation, and the corresponding spectra are presented in Figure S3, Supplementary material.
The UV-visible absorption spectra (Figure S4, Supplementary material) have been recorded for the degradation of MB, CR, amaranth, and orange II dye solutions in the following experimental conditions: initial dye concentration=10 mg/L for all dyes, catalyst dosage = 0.4 g/L, irradiation time = 300 min, T = 23 ± 2 °C and pH 7.0 ± 0.2. From Figure S3, it can be noted that color removal efficiency varies between 75% and 98%, depending on the type of dye. The highest degradation efficiency (99%) was found for Congo red dye, the efficiency being achieved in a shorter time (30 min) as compared to other dyes.
A comparative study is reported in Figure 10 showing the photodegradation kinetics of different dyes under visible light using TAg1 as a catalyst. Experimental data were interpolated to PFO-kinetic model and the calculated parameters are summarized in Table 4.
According to Table 4, the highest rate constant (7.28 × 10⁻² min−1) was observed for Congo red dye photodegradation, and the lowest one (4.57 × 10⁻³ min−1) for the orange-II dye, respectively. Comparing the present results with others reported on appropriate photocatalysts (Ag doped TiO2 nanostructures) [16,17,18,19,20,21,22,43], one can observe the excellent performance of our samples, as these are capable to degrade up 99% of dyes depending on the dye nature, with constant rates between 4.57 × 10⁻³ and 7.28 × 10⁻² min−1. In addition, all the degradation tests on the fabricated samples were done using a moderate amount of catalyst 0.4 g/L, fluorescent bulb light irradiation (400 W), and temperature (23 ± 2 °C), pH (7.0 ± 0.2) and without intervening to acidify the solution or add H2O2. For comparative purposes, Harikishore et al. reported a rate constant value of 8.16 × 10⁻³ min−1 for methylene blue (C0 = 5 ppm) dye degradation in the presence of 1.5g/L amount of catalyst under UV lamp irradiation [43]. Recently, Ali et al. [22] obtained Ag-doped TiO2 nanoparticles with improved photocatalytic and antibacterial properties. They found a degradation efficiency of 96% for MB degradation (C0 = 10 mg/L) in the presence of a 1g/L catalyst under visible light irradiation (500 W).

2.6.3. Photocatalyst Reuse

The degradation efficiency after several photodegradation cycles is an important parameter to evaluate the stability of the photocatalyst. Figure 11c) shows a degradation efficiency registered after 5 cycles of reuse under visible light irradiation for one hour. It was noticed that the photocatalytic efficiency was maintained at about 98% even after five cycles for Congo red (C0 = 10 mg/L) dye degradation. In addition, the stability of the reused photocatalyst was confirmed by XRD and SEM characterization. XRD pattern and an SEM image for recycled photocatalyst are presented in Figure 11a,b. It can be observed that both, crystallinity and morphology are preserved after its use.

2.7. Antimicrobial Activity

All samples were also tested for their antibacterial activity against S. aureus and E. coli. Samples T400 and TAg1 did not show any antibacterial action. TAg3 and TAg5 proved to be quite effective against the Gram-positive bacterial strain represented by S. aureus, while TAg2 and TAg5 against the Gram-negative bacterial strain represented by E. coli. The highest efficiency observed, regardless of the bacterial strain, was found in sample TAg5 that is at the highest Ag concentration (5%). The nanostructures were in general more efficient against E. coli (19 mm of inhibition zone) than against S. aureus (16 mm of inhibition zone). An image of a culture plate is presented in Figure 12.
From this image, the diameters of the inhibition zones of each tested sample can be calculated and are presented in Table 5.
The MIC of the samples against E. coli was as low as 2.5 mg/mL for sample TAg5, and 5 mg/mL for the same sample against S. aureus (see Table 6).
The final trial was focused on the determination of the minimum bactericidal concentration (MBC), which is recognized as the lowest concentration that destroyed all bacterial cells. This was investigated by spreading 10 µL samples from the wells on MH agar plates. However, MBC against both bacterial strains could not be estimated, as a higher concentration of Ag within the samples was probably required. The samples had better antibacterial activity against the Gram-negative strain represented by E. coli probably due to its cell wall composition, distinctive rod shape and extracellular matrix [44]. Literature states that when E. coli is exposed to light activated Ag–TiO2 the oxidative damage to the bacterial cell envelope may occur which plays a significant role in biocidal activity [45]. In this particular case, the antibacterial activity is directly correlated with the silver concentration within the samples [46].

3. Materials and Methods

3.1. Materials

Titanium (IV) isopropoxide (TTIP), silver nitrate (AgNO3), glacial acetic acid (CH3COOH), ethanol, polyvinylpyrrolidone (PVP) (Mw = 1.300.000) of analytical grade purchased from Sigma-Aldrich (Sigma-Aldrich/Merck KGaA, Darmstadt, Germany) were used for the preparation of the Ag-doped TiO2 nanostructures. Methylene blue, Congo red, orange II, and amaranth dyes were procured from Sigma-Aldrich (Sigma-Aldrich/Merck KGaA, Darmstadt, Germany) and utilized without further purification.

3.2. Preparation of Ag–TiO2 Nanostructured Nanofibers

Pure TiO2 and Ag–TiO2 nanostructured nanofibers were developed using electrospun solutions, which were obtained by mixing two initial solutions, solution 1 containing 0.75 mL of TTIP in 1.5 mL acetic acid and solution 2 consisting of 0.25 g PVP in 2.5 mL ethanol. This solution was used to prepare the pure TiO2 blank sample (named T400), while in the case of Ag–TiO2 nanostructures, these were prepared by adding to solution 2 different amounts of AgNO3 as follows: 0.5 mg corresponding to a 0.1% mass percentage (sample TAg1), 2.5 mg for 0.5% (sample TAg2), 5 mg for 1.0% (sample TAg3), 15 mg for 3.0% (sample TAg4) and 25 mg for 5.0% (sample TAg5). The electrospinning was performed using the set-up already described in our previous publications [47,48]. The electrospinning parameters used to obtain the fibrous materials were: 25 kV high voltage, 15 cm tip to collector distance, and 0.75 mL/h feed flow rate. The Ag–TiO2 nanostructured nanofibers were obtained after removal of PVP matrix using calcination in air at 400 °C with a heating rate of 15 °C/min for 4 h.

3.3. Characterization

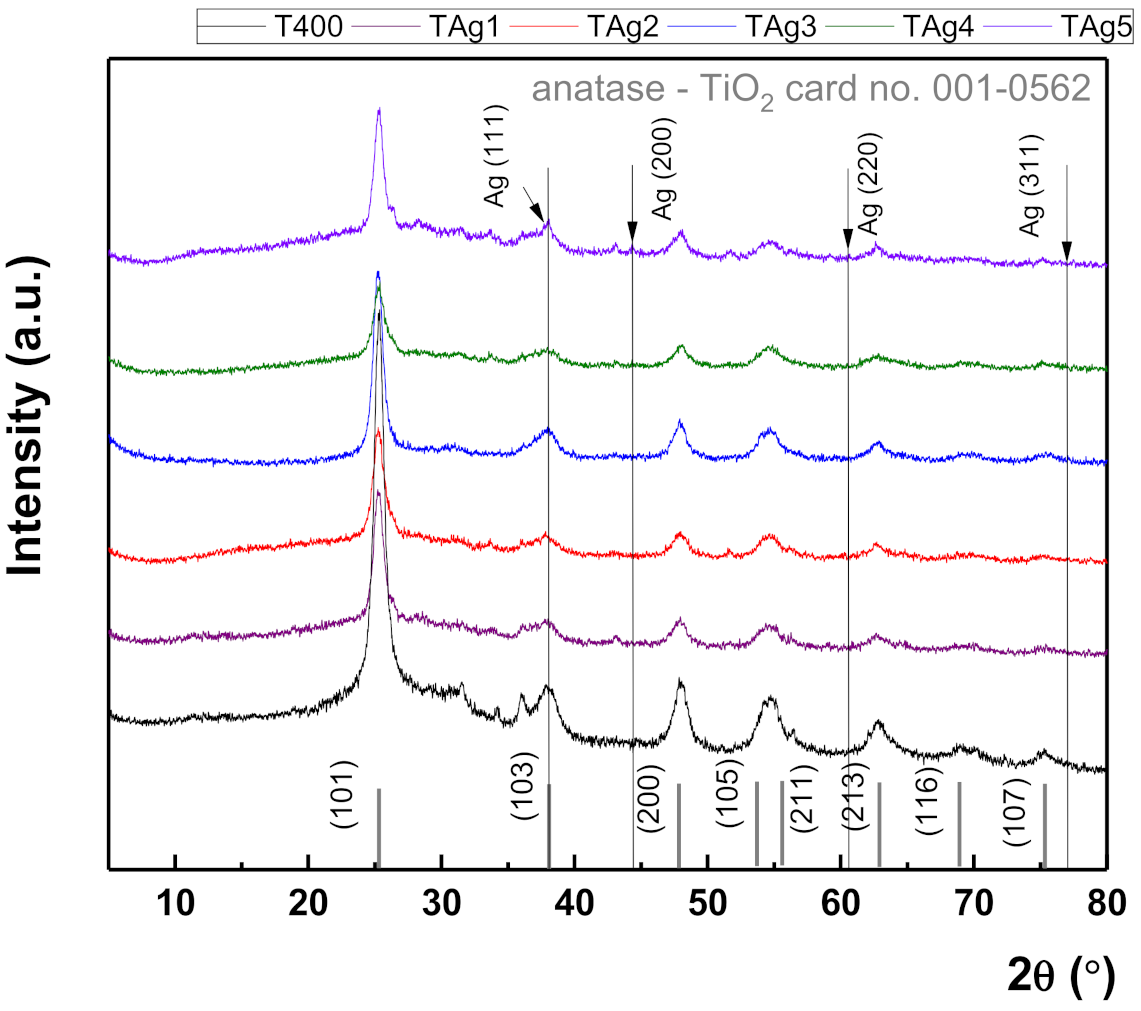
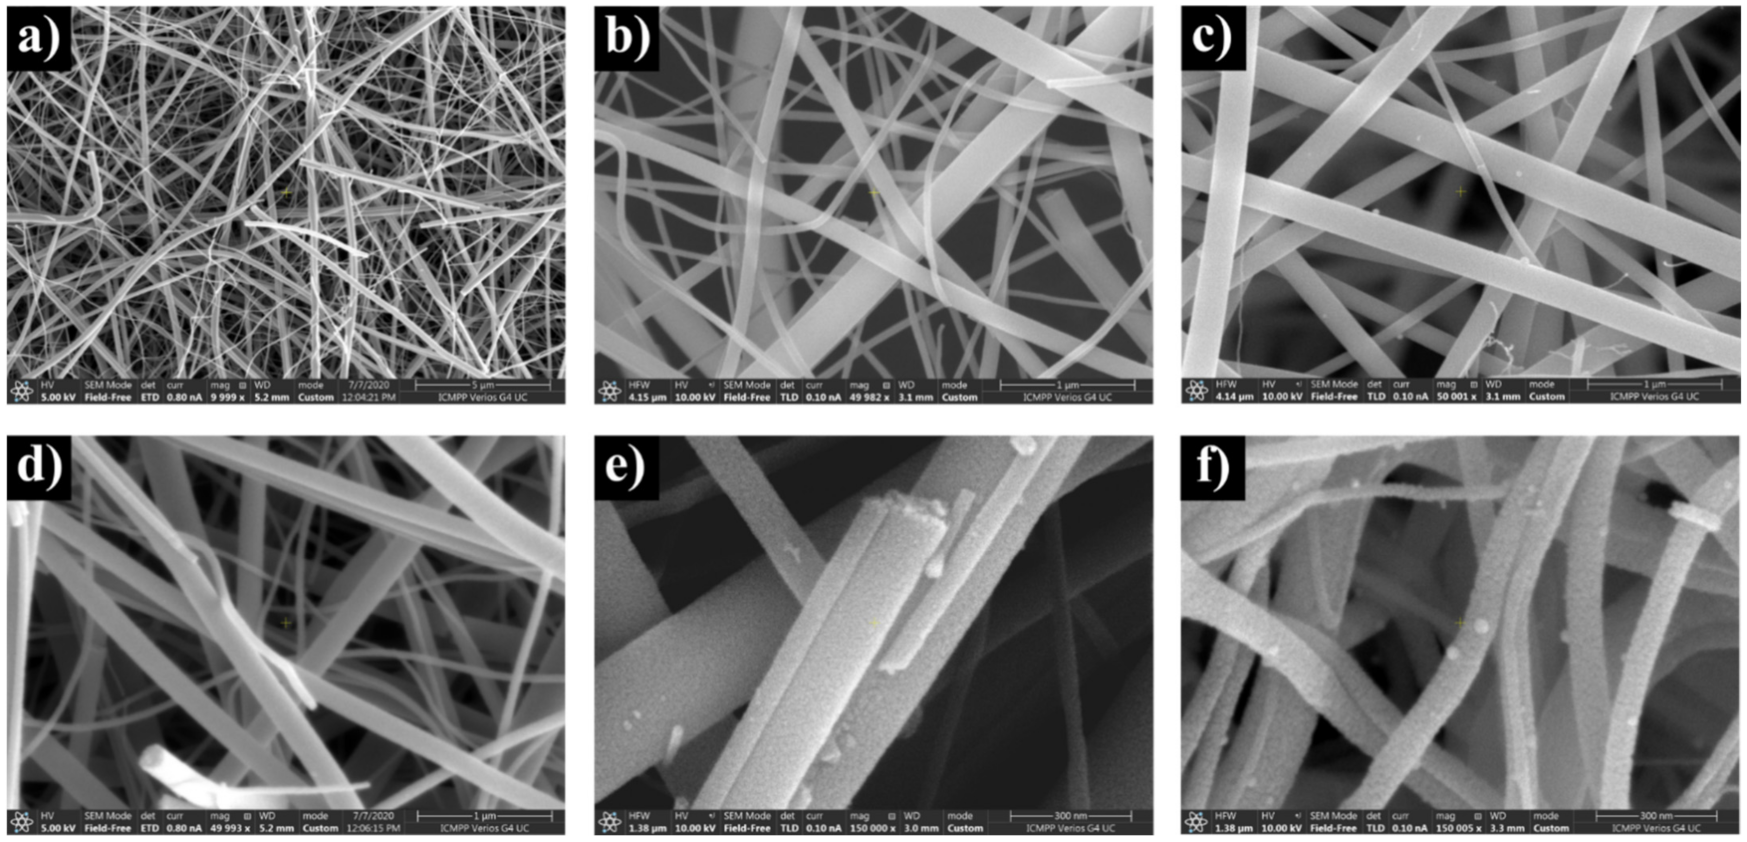
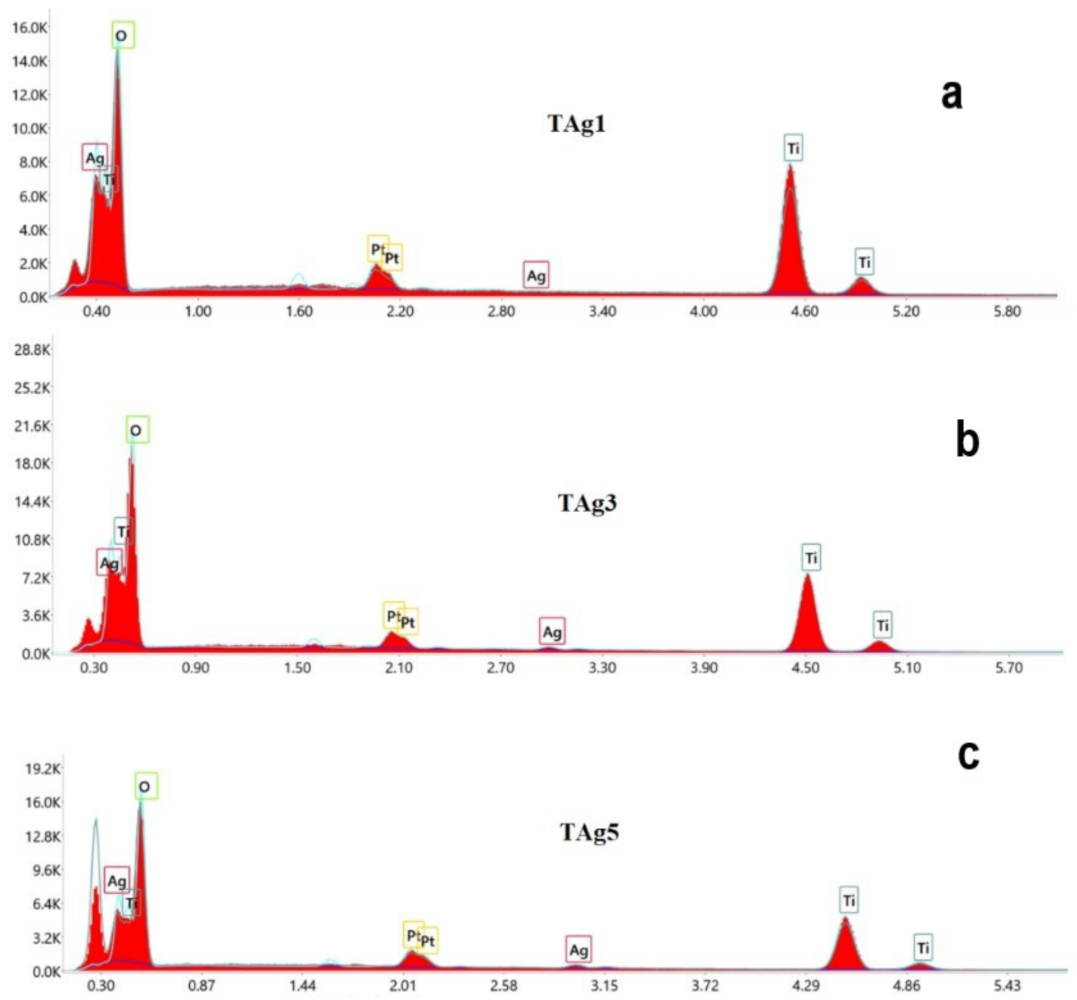
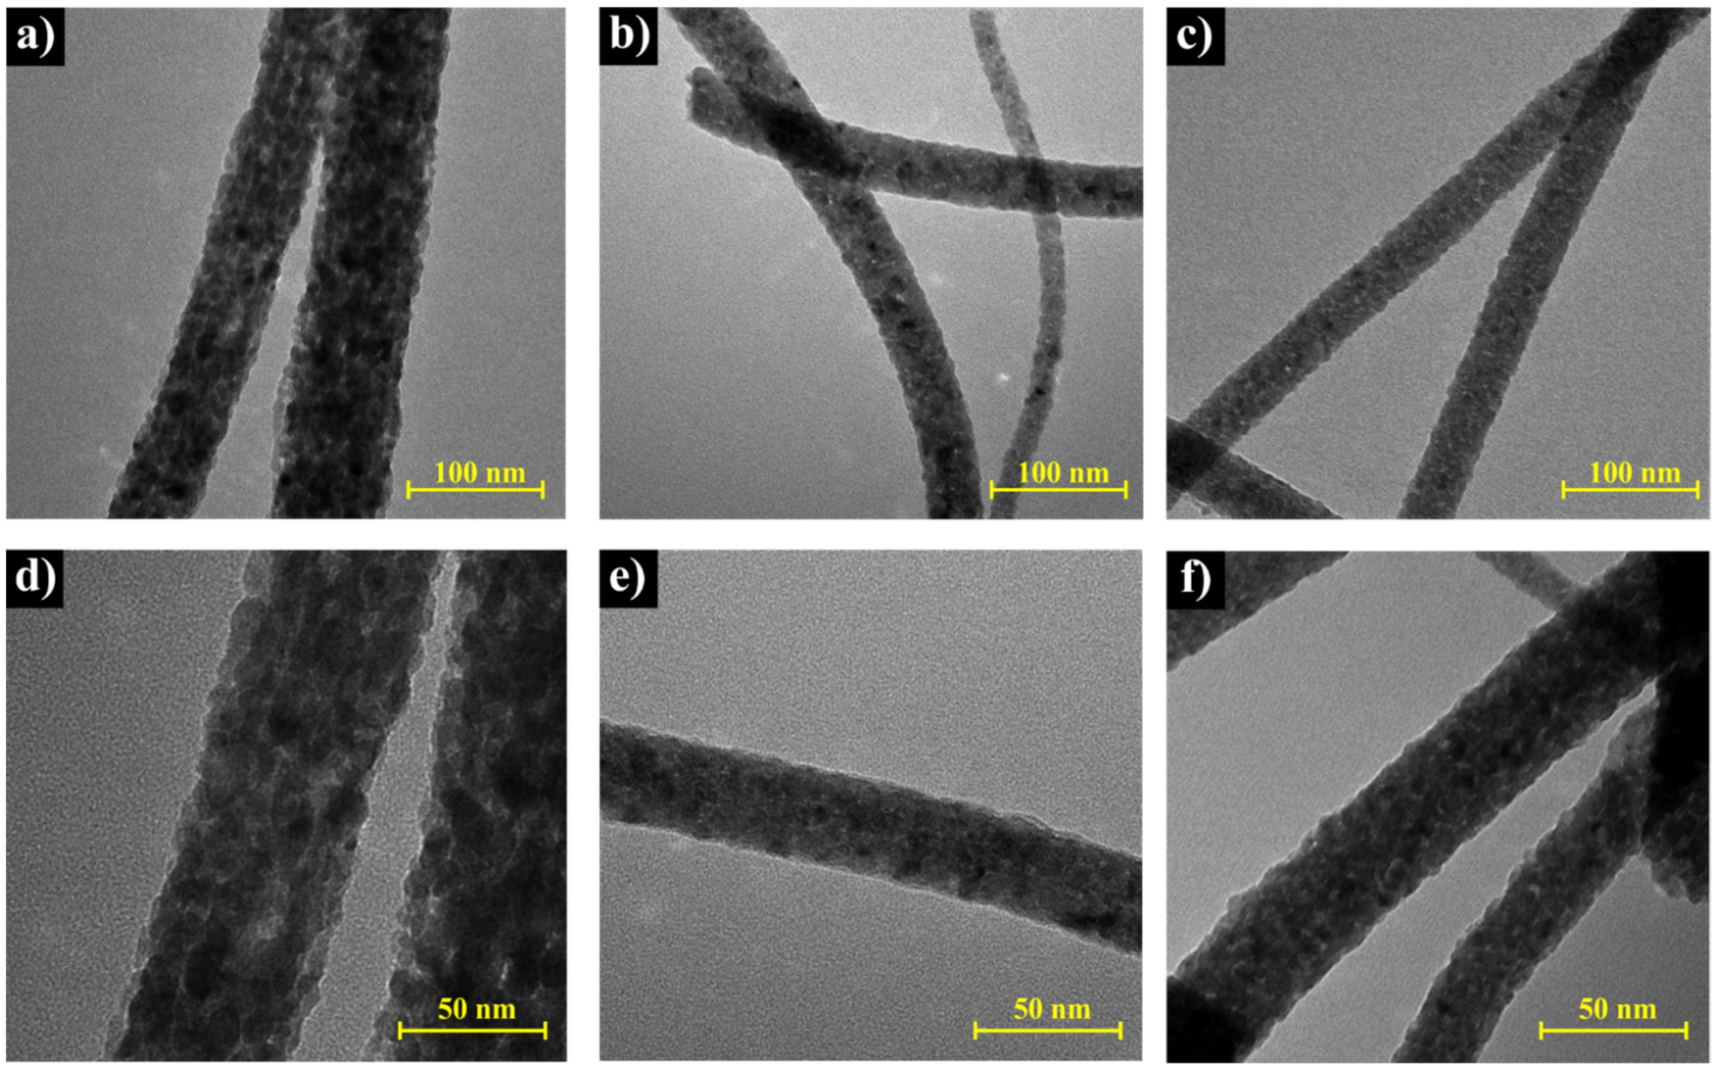
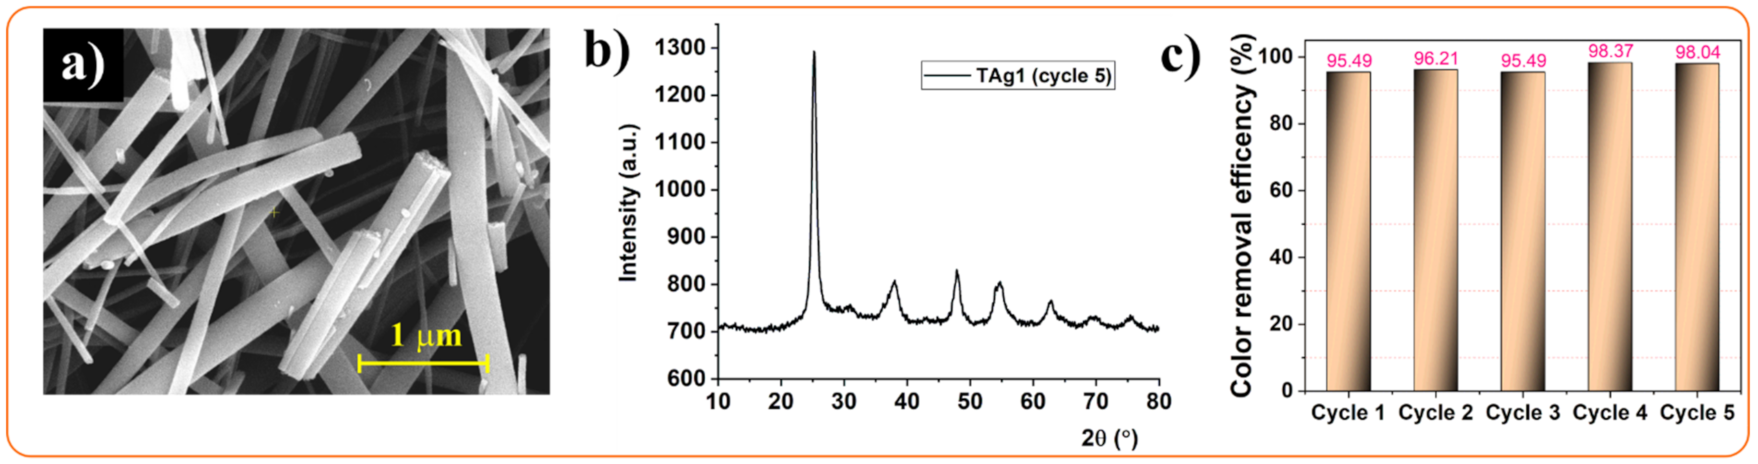
The crystallographic structure of all materials was studied using X-ray diffraction (XRD) technique performed with a Rigaku SmartLab-9kW diffractometer (Rigaku Corporation, Tokyo, Japan). The experimental spectra were analyzed using PDXL software developed by Rigaku Corp., Tokyo, Japan. The respective morphological characteristics were examined using a Verios G4 UC Scanning Electron Microscope (Thermo Fisher Scientific, Waltham, MA, USA) equipped with an energy dispersive spectrometer (EDX) (AMETEK, Tokyo, Japan), EDAX Octane Elite. The morphology of the fibers based on pure and doped TiO2 was studied using a Hitachi High-Tech HT7700 Transmission Electron Microscope (TEM) (Hitachi, Tokyo, Japan), operated in high contrast mode at 120 kV accelerating voltage. BET analysis was performed using a fully automated gravimetric analyzer IGASorp supplied by Hidden Analytical, Warrington (UK), with an ultrasensitive microbalance, which was used to measure dynamic water vapor sorption capacity of the samples by the weight change with variation of humidity at a constant temperature. Each sample was dried in flowing nitrogen (250 mL/min) until the weight of the sample was in equilibrium at RH < 1%. Experiments were carried out at 25 °C in the relative humidity (RH) range 0–90%, with 10% humidity steps, each having a pre-established equilibrium time between 10 and 20 min (minimum time and time out, respectively).
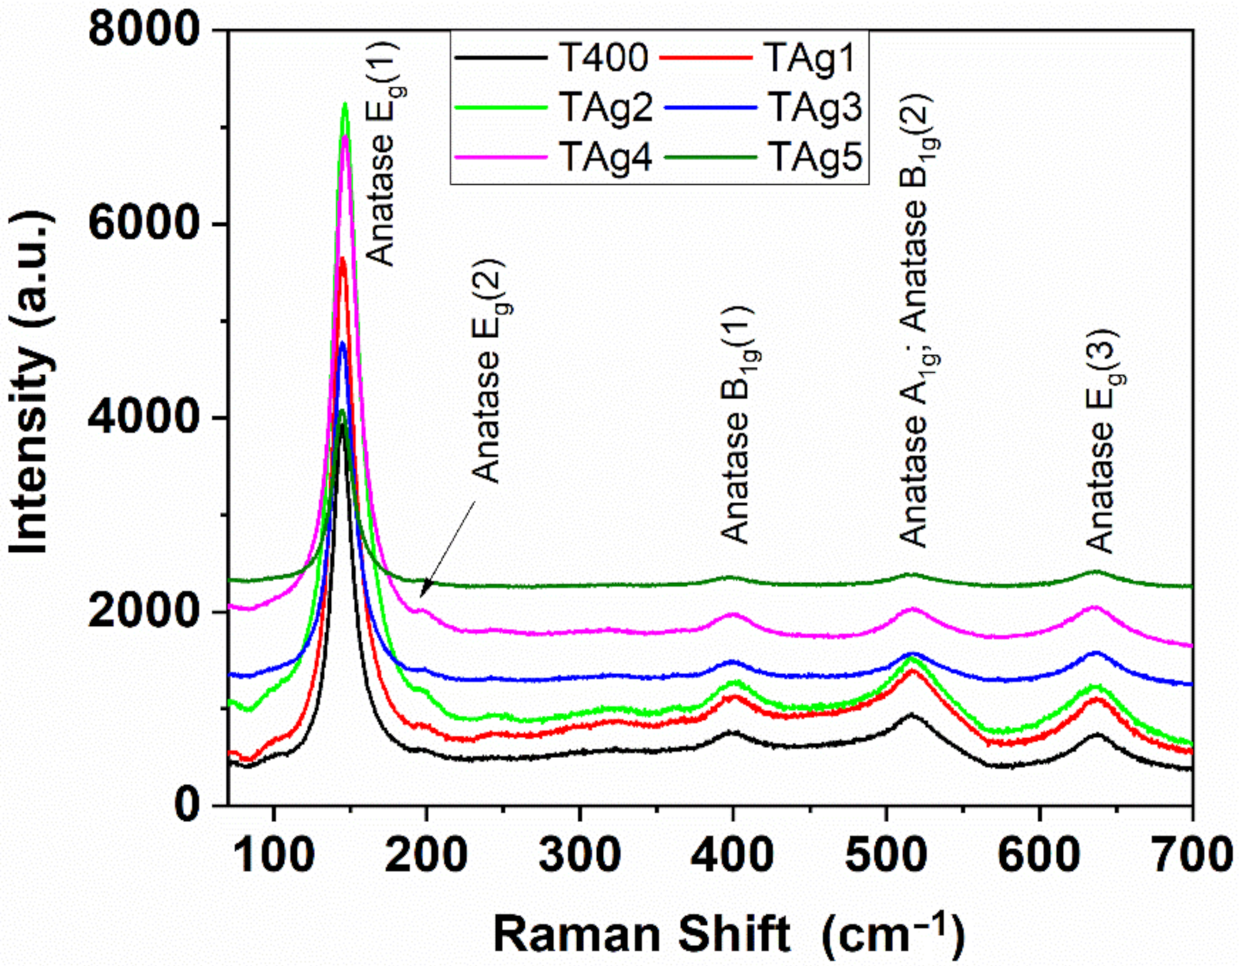
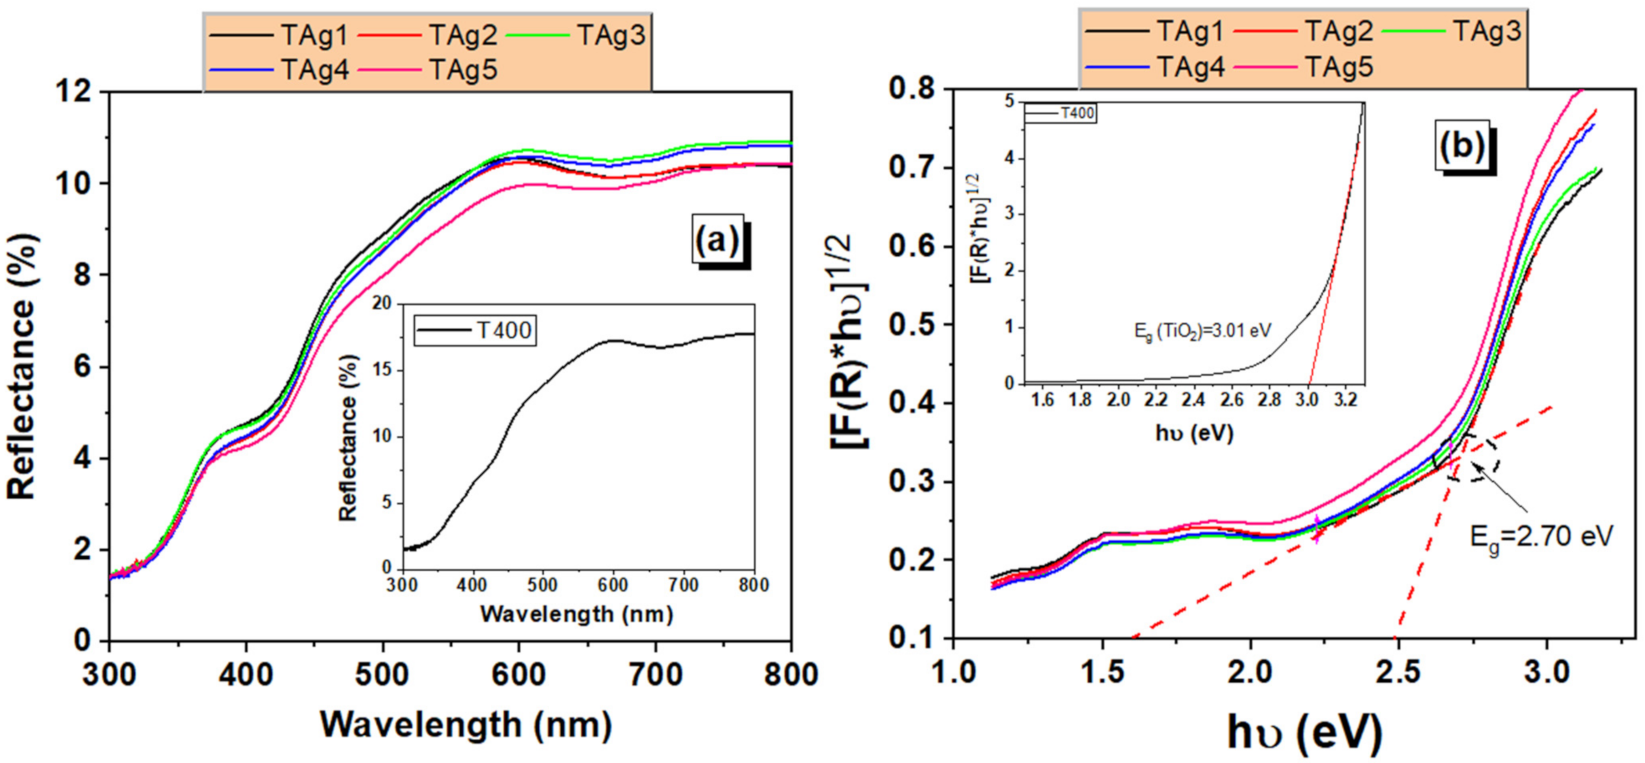
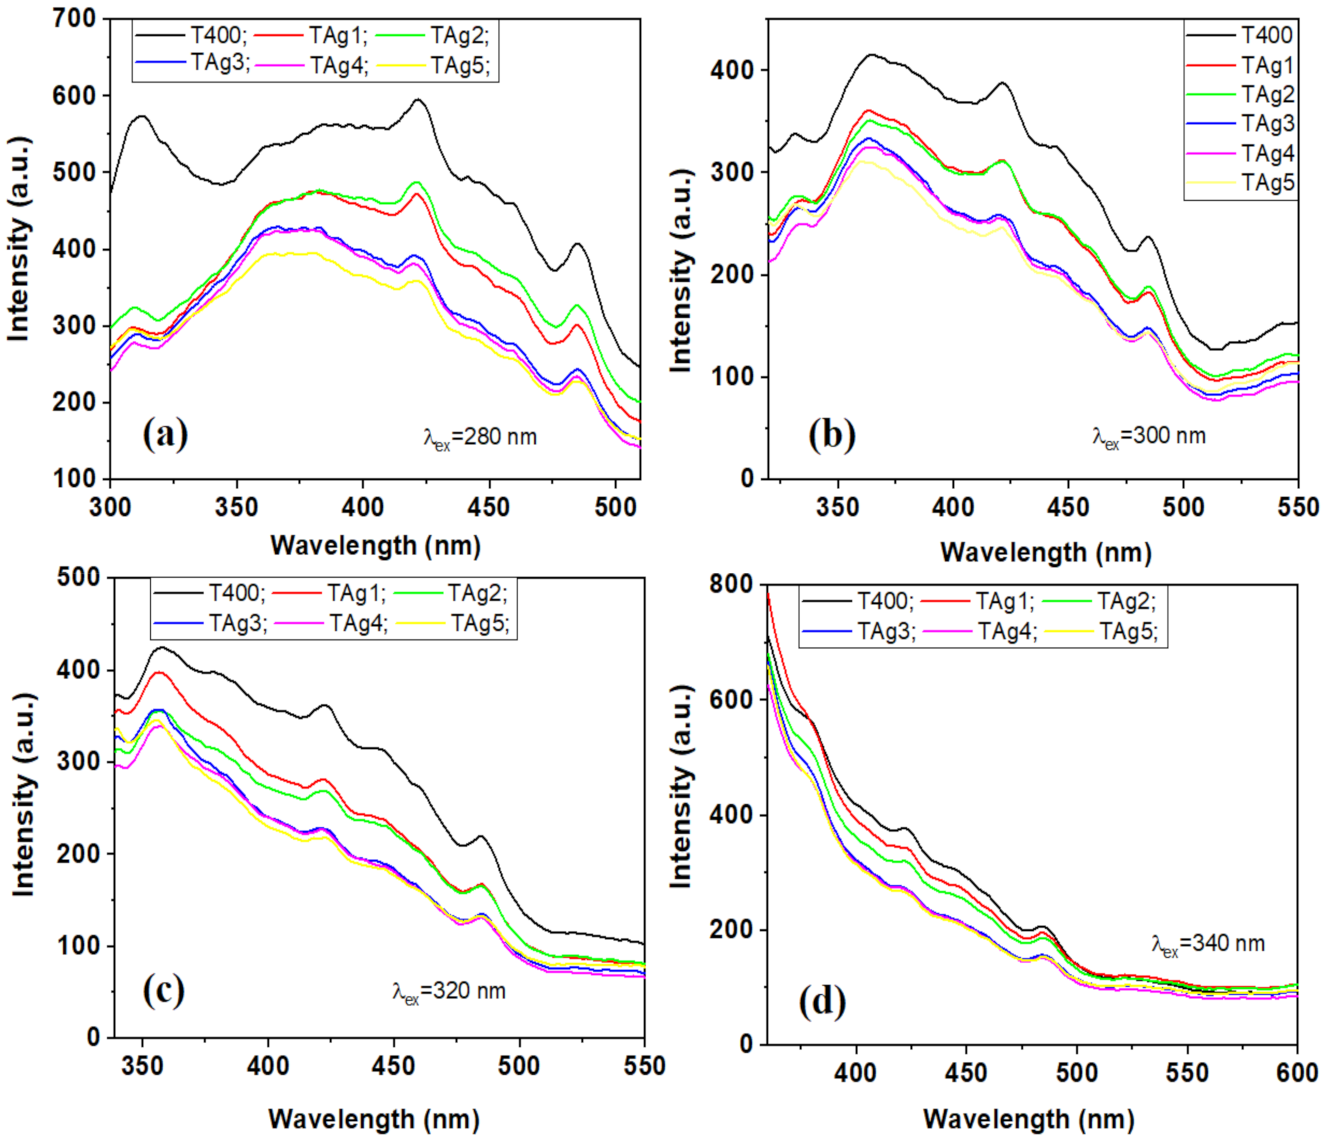
A Horiba Scientific LabRam HR Evolution spectrometer (HORIBA Scientific, Palaiseau, France) was used for Raman spectroscopy measurements, which were done in the 25–1650 cm−1 frequency range, employing excitation at 532 nm, acquisition time 100 s, 3 accumulations and a grating of 600 gr/mm. The optical properties were evaluated by UV-vis diffuse reflectance spectra, recorded on an Analytik Jena (Jena, Germany) SPECORD UV/Vis 210+ spectrophotometer with an integrating sphere. Emission spectra were recorded employing a luminescence spectrometer Perkin Elmer LS55 (PerkinElmer, Inc., Waltham, MA, USA).

3.4. Photocatalytic Activity

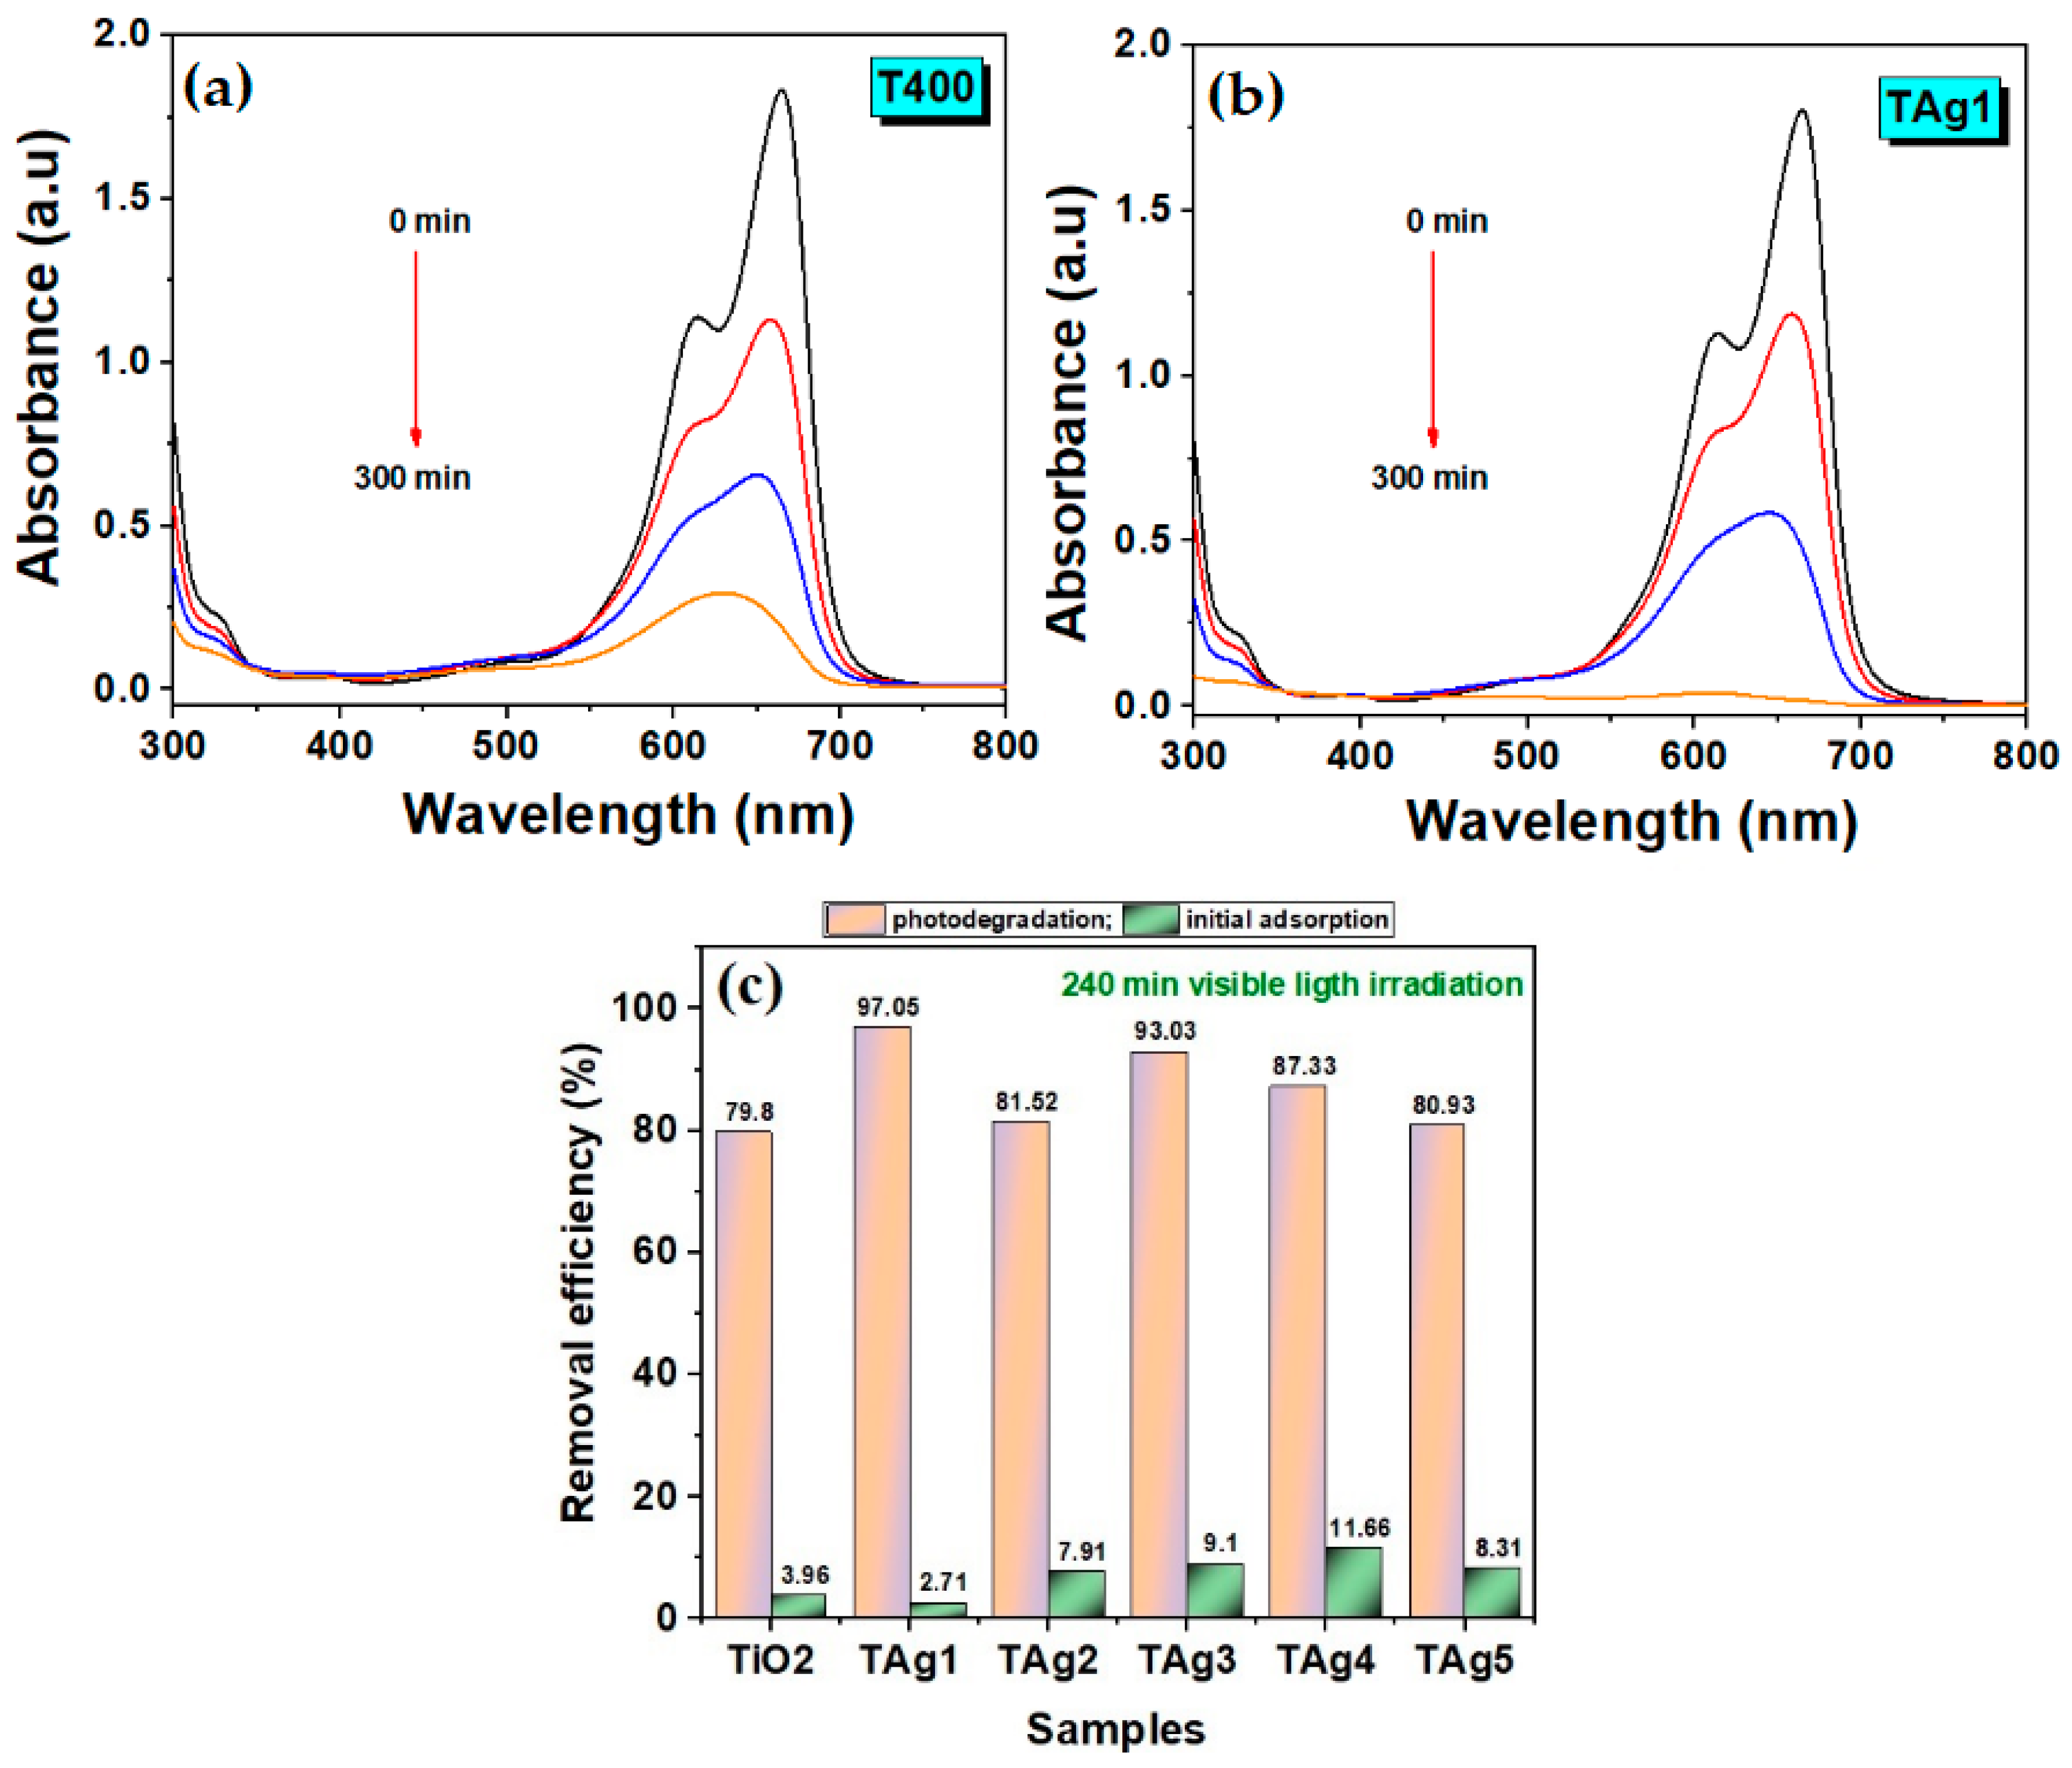
The photocatalytic activity of Ag–TiO2 nanostructured nanofibers was evaluated by studying the photodegradation of methylene blue (MB), amaranth, Congo red (CR) and orange II dye solutions under UV-visible light irradiation supplied by a 400 W halogen lamp (Model TG-2503.0l, Elbi Electric and Lighting, Bragadiru, Romania) with the emission spectrum presented in Figure S5 in supporting material file. The distance between the light source (lamp) and the reactor was 30 cm. Deionized water was used to prepare the dye solution. In all photocatalytic measurements, the following experimental conditions were employed: initial dye concentration=10 mg/L for all dyes, catalyst dosage = 0.4 g/L (the catalyst loading that proved previously optimal for reference sample T400), maximum irradiation time = 300 min, T = 23 ± 2 °C and pH 7.0 ± 0.2. The pH was recorded for the initial and final solutions and was found to be 7 in both cases. Initially, the dye solution and the catalyst were continuously magnetically stirred (500 rotation/min) in the absence of light for 30 min (time needed to establish an adsorption equilibrium). After this, the solution was irradiated with visible light for 5 hours, and during photodegradation, a quantity of 3 ml of the solution was extracted at the given time intervals to assess the change in the concentration. All absorption spectra for collected samples were measured after 12 h of settling when the catalyst was completely found as sediment. Absorption spectra were recorded using UV–Vis spectrophotometer SPECORD 210+ (Analytik Jena gmbh, Jena, Germany).
The photocatalytic efficiency (%) for degradation of the dyes was evaluated using the following relationship [13]:
Photocatalytic efficiency   % = C 0 C e C 0 × 100
where C0 = initial dye concentration (mg/L); Ce = the dye concentration after irradiation time (mg/L).

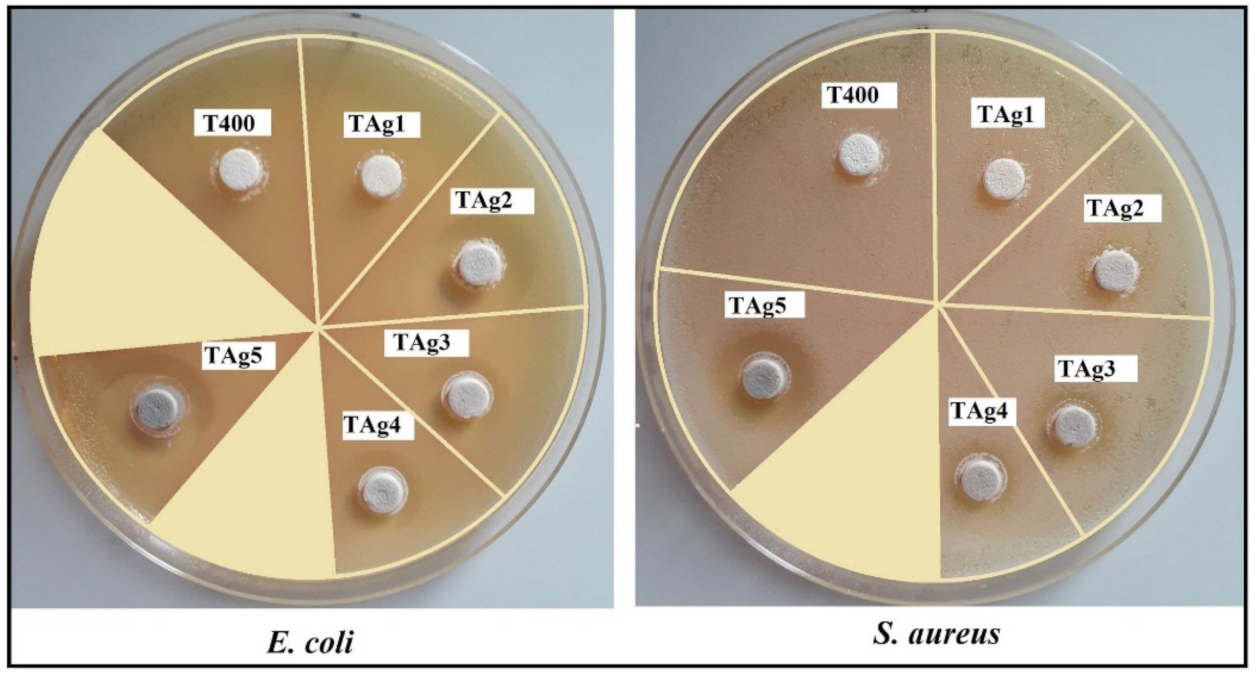
3.5. Antimicrobial Activity

The antimicrobial activity of the materials was determined by disk diffusion assay against Staphylococcus aureus ATCC25923 and Escherichia coli ATCC25922. Both microorganisms were stored at −80 °C in 20–40% glycerol. The bacterial strains were refreshed in tryptic soy agar (TSA) at 36 ± 1 °C for 24 h. Microbial suspensions were prepared with these cultures in sterile solutions to obtain turbidity optically comparable to that of 0.5 McFarland standards.
Volumes of 0.3 ml from each inoculum were spread on the Petri dishes. The sterilized paper disks were placed on plates and an aliquot (20 µL) of the samples with a concentration of 10 mg/ml was added. To evaluate the antimicrobial properties, the growth inhibition was measured under standard conditions after 24 h of incubation at 36 ± 1 °C under solar light illumination. All tests were carried out in triplicate to verify the results. After incubation, the diameters of inhibition zones were measured by using Image J version 1.53e software (Madison, WI, USA), and were expressed as the mean ± standard deviation (SD) performed with XLSTAT software Ecology version 2019.4.1 software (New York, NY, USA) [49,50].

3.6. Determination of Minimum Inhibitory Concentration (MIC)

The concentration of a sample that prevented the growth of bacteria is in general recognized as minimum inhibitory concentration (MIC). This was investigated by a broth dilution method, which was performed in 96-well microtiter plates using the resazurin reduction assay concept [49]. Bacterial culture grown to log phase was adjusted to 1 × 10⁸ cells/mL in Muller–Hinton (MH) broth. Inoculants of 50 µL were mixed with 50 µL of serial dilutions of samples and were subsequently incubated at 36 ± 1 °C for 24 h. Resazurin was prepared at 0.015% by dissolving 0.015 g, vortexed and filter sterilized (0.22 µm filter) and stored at 4 °C for a maximum of 2 weeks after preparation. After incubation for 24 h at 36 ± 1 °C, resazurin (0.015%) was added to all wells (20 µL per well), and these were further incubated for 2–4 h more. MIC was determined by reading the fluorescence at λex = 575 nm and λem = 590 nm with FLUOstar Omega Microplate Reader (BMG LABTECH, Ortenberg, Germany). To determine accurately the MIC values, the experiments were performed in triplicate.

4. Conclusions

Ag–TiO2 nanostructured nanofibers with different Ag content were produced using the electrospinning technique followed by calcination at 400 °C for 4 h and were tested regarding their photocatalytic and antimicrobial action. XRD characterization confirmed the formation of anatase TiO2 crystalline structure, without identifying additional peaks corresponding to other phases (brookite, rutile) or other secondary peaks corresponding to the Ag presence, which indicates that Ag was successfully integrated as small nanocrystals without affecting much of the TiO2 crystal lattice. Regarding the lattice strain, this was found to increase from 0.13% (pure TiO2 sample) to 0.52% (TAg1), reaching 0.53% at the highest Ag content. These observations were also confirmed by the Raman spectroscopy analysis. SEM characterization proved the formation of one-dimensional uniform Ag–TiO2 nanostructured nanofibers of excellent quality, with a diameter in the range of 65 to 100 nm. The optical band gap energy decreased to 2.4 eV for the Ag–TiO2 nanostructured nanofibers as compared to 3.01 eV of pure TiO2, which leads to an improvement of the photocatalytic activity under visible light irradiation. A remarkable photocatalytic efficiency of 99% at a constant rate of k = 1.29 × 10⁻² min−1 was found for the 0.1% Ag–TiO2 sample for the case of methylene blue dye degradation. Additionally, these materials proved able to degrade up 99% of other organic dyes with constant rates in the range of 4.57 × 10⁻³ to 7.28 × 10⁻² min−1 depending on the dye nature, all degradation tests being performed under visible light irradiation, without intervening to acidify the solution or add H2O2. The present study focused on materials optimization for photocatalytic applications. Further studies regarding the structure and nano-properties of these materials as well as solving the photocatalytic mechanism and by-products are ongoing. The Ag–TiO2 nanostructured nanofibers materials showed promising antimicrobial responses against Gram-positive (S. aureus) and Gram-negative (E. coli) strains. The sample with a higher concentration of Ag (5%) was found to present a MIC value of 2.5 mg/mL against E. coli and 5 mg/mL against S. aureus. Based on these results, one can conclude that Ag–TiO2 nanostructured nanofibers were developed with excellent structure and suitable physical properties for photocatalytic and antibacterial action. Further studies regarding the possibility of integration of these materials into food packaging, medical textiles, and other healthcare related items will be performed.

Supplementary Materials

The following are available online at https://0-www-mdpi-com.brum.beds.ac.uk/article/10.3390/catal11101234/s1, Figure S1. Histogram of fiber diameter distribution plotted from SEM images analysis of pure TiO2 (T400) and Ag doped TiO2 (TAg1 and TAg5). Figure S2. Dynamic vapor sorption isotherms for pure TiO2 and Ag doped TiO2 materials. Figure S3. UV-VIS absorption spectra of the photolysis test for all 4 dyes performed under visible light irradiation for 300 minutes. Figure S4. UV-VIS absorption spectra recorded for the degradation of (a) MB, (b) CR, (c) Amaranth and (d) Orange II dyes. Figure S5. Lamp spectrum.

Author Contributions

Data Curation, P.P., C.C., N.O., E.K. and M.P.S.; Formal Analysis, P.P., A.A., I.R., E.K. and M.P.S.; Funding Acquisition, P.P.; Investigation, P.P. and I.R.; Methodology, P.P. and I.R.; Project Administration, P.P.; Resources, P.P., C.C., A.A. and N.O.; Supervision, P.P.; Validation, P.P., E.K. and M.P.S.; Visualization, P.P. and M.P.S.; Writing—Original Draft, P.P., C.C., E.K. and M.P.S.; Writing—Review and Editing, P.P., E.K. and M.P.S. All authors have read and agreed to the published version of the manuscript.

Funding

This work was partially supported by a grant of the Romanian Ministry ofResearch, Innovation and Digitization, CNCS/CCCDIUEFISCDI, project number PN-III-P1-1.1-TE-2019-0594, within PNCDI III.

Data Availability Statement

The raw and processed data required to reproduce these findings cannot be shared at this time due to technical or time limitations. The raw and processed data will be provided upon reasonable request to anyone interested anytime until technical problems are being solved.

Acknowledgments

Special thanks to Cosmin Romanitan for helping with the XRD characterization. M. P. Suchea contribution was partially financed by the Romanian Ministry of Research, Innovation and Digitization through “MICRO-NANO-SIS PLUS” core Programme.

Conflicts of Interest

The authors declare that they have no known competing financial interests or personal relationships that could have appeared to influence the work reported in this paper.

References

  1. Estrada-Flores, S.; Martinez-Luevanosa, A.; Perez-Berumen, C.M.; Garcia-Cerda, L.A.; Flores-Guia, T.E. Relationship between morphology, porosity, and the photocatalytic activity of TiO2 obtained by sol–gel method assisted with ionic and nonionic surfactants. Bol. Soc. Esp. Ceram. Vidr. 2020, 59, 209–218. [Google Scholar] [CrossRef]
  2. Morales-Garcia, A.; Escatllar, A.M.; Illas, F.; Bromley, S.T. Understanding the interplay between size, morphology and energy gap in photoactive TiO2 nanoparticles. Nanoscale 2019, 11, 9032–9041. [Google Scholar] [CrossRef]
  3. Adan, C.; Marugan, J.; Sanchez, E.; Pablos, C.; Van Grieken, R. Understanding the effect of morphology on the photocatalytic activity of TiO2 nanotube array electrodes. Electrochim. Acta 2016, 191, 521–529. [Google Scholar] [CrossRef] [Green Version]
  4. Li, Y.F.; Liu, Z.P. Particle size, shape and activity for photocatalysis on titania anatase nanoparticles in aqueous surroundings. J. Am. Chem. Soc. 2011, 133, 15743–15752. [Google Scholar] [CrossRef] [PubMed]
  5. Wang, Y.; Liu, L.; Xu, L.; Meng, C.; Zhu, W. Ag/TiO2 nanofiber heterostructures: Highly enhanced photocatalysts under visible light. J. Appl. Phys. 2013, 113, 174311. [Google Scholar] [CrossRef]
  6. Kudhier, M.A.; Sabry, R.S.; Al-Haidarie, Y.K.; AL-Marjani, M.F. Significantly enhanced antibacterial activity of Ag-doped TiO2 nanofibers synthesized by electrospinning. Mater. Technol. 2018, 33, 220–226. [Google Scholar] [CrossRef]
  7. Wang, S.; Bai, J.; Liang, H.; Xu, T.; Li, C.; Sun, W.; Liu, H. Synthesis, characterization, and photocatalytic properties of Ag/TiO2 composite nanofibers prepared by electrospinning. J. Dispers. Sci. Technol. 2014, 35, 777–782. [Google Scholar] [CrossRef]
  8. Norouzi, M.; Fazeli, A.; Tavakoli, O. Phenol contaminated water treatment by photocatalytic degradation on electrospun Ag/TiO2 nanofibers: Optimization by the response surface method. J. Water Process. Eng. 2020, 37, 101489. [Google Scholar] [CrossRef]
  9. Ge, M.; Cao, C.; Huang, J.; Li, S.; Chen, Z.; Zhang, K.Q.; Al-Deyab, S.S.; Lai, Y. A review of one-dimensional TiO2 nanostructured materials for environmental and energy applications. J. Mater. Chem. A 2016, 4, 6772–6801. [Google Scholar] [CrossRef]
  10. Verma, R.; Gangwar, J.; Srivastava, A.K. Multiphase TiO2 nanostructures: A review of efficient synthesis, growth mechanism, probing capabilities, and applications in bio-safety and health. RSC Adv. 2017, 7, 44199–44224. [Google Scholar] [CrossRef] [Green Version]
  11. Baranowska-Wojcik, E.; Szwajgier, D.; Oleszczuk, P.; Winiarska-Mieczan, A. Effects of titanium dioxide nanoparticles exposure on human health—A Review. Biol. Trace. Elem. Res. 2020, 193, 118–129. [Google Scholar] [CrossRef] [Green Version]
  12. Jafari, S.; Mahyad, B.; Hashemzadeh, H.; Janfaza, S.; Gholikhani, T.; Tayebi, L. Biomedical applications of TiO2 nanostructures: Recent advances. Int. J. Nanomed. 2020, 15, 3447–3470. [Google Scholar] [CrossRef]
  13. Boxi, S.S.; Paria, S. Visible light induced enhanced photocatalytic degradation of organic pollutants in aqueous media using Ag doped hollow TiO2 nanospheres. RSC Adv. 2015, 5, 37657–37668. [Google Scholar]
  14. Pascariu Dorneanu, P.; Cojocaru, C.; Samoila, P.; Olaru, N.; Airinei, A.; Rotaru, A. Novel fibrous composites based on electrospun PSF and PVDF ultrathin fibers reinforced with inorganic nanoparticles: Evaluation as oil spill sorbents. Polym. Adv. Technol. 2018, 29, 1435–1446. [Google Scholar] [CrossRef]
  15. Zhang, F.; Wang, X.; Liu, H.; Liu, C.; Wan, Y.; Long, Y.; Cai, Z. Recent advances and applications of semiconductor photocatalytic technology. Appl. Sci. 2019, 9, 2489. [Google Scholar] [CrossRef] [Green Version]
  16. Nalbandian, M.J.; Zhang, M.; Sanchez, J.; Kim, S.; Choa, Y.H.; Cwiertny, D.M.; Myung, N.V. Synthesis and optimization of Ag–TiO2 composite nanofibers for photocatalytic treatment of impaired water sources. J. Hazard. Mater. 2015, 299, 141–148. [Google Scholar] [CrossRef]
  17. Zhang, F.; Cheng, Z.; Kang, L.; Cui, L.; Liu, W.; Xu, X.; Hou, G.; Yang, H. A novel preparation of Ag-doped TiO2 nanofibers with enhanced stability of photocatalytic activity. RSC Adv. 2015, 5, 32088–32091. [Google Scholar] [CrossRef]
  18. Roongraung, K.; Chuangchote, S.; Laosiripojana, N.; Sagawa, T. Electrospun Ag-TiO2 nanofibers for photocatalytic glucose conversion to high-value chemicals. ACS Omega 2020, 5, 5862–5872. [Google Scholar] [CrossRef] [Green Version]
  19. Suwanchawalit, C.; Wongnawa, S.; Sriprang, P.; Meanha, P. Enhancement of the photocatalytic performance of Ag-modified TiO2 photocatalyst under visible light. Ceram. Int. 2012, 38, 5201–5207. [Google Scholar] [CrossRef]
  20. Suwarnkar, M.B.; Dhabbe, R.S.; Kadam, A.N.; Garadkarn, K.M. Enhanced photocatalytic activity of Ag doped TiO2 nanoparticles synthesized by a microwave assisted method. Ceram. Int. 2014, 40, 5489–5496. [Google Scholar] [CrossRef]
  21. Ahamed, M.; Majeed Khan, M.A.; Akhtar, M.J.; Alhadlaq, H.A.; Alshamsan, A. Ag-doping regulates the cytotoxicity of TiO2 nanoparticles via oxidative stress in human cancer cells. Sci. Rep. 2017, 7, 17662. [Google Scholar] [CrossRef] [PubMed]
  22. Ali, T.; Ahmed, A.; Alam, U.; Uddin, I.; Tripathi, P.; Muneer, M. Enhanced photocatalytic and antibacterial activities of Ag-doped TiO2 nanoparticles under visible light. Mater. Chem. Phys. 2018, 212, 325–335. [Google Scholar] [CrossRef]
  23. Jesline, A.; John, N.P.; Narayanan, P.M.; Vani, C.; Murugan, S. Antimicrobial activity of zinc and titanium dioxide nanoparticles against biofilm-producing methicillin-resistant Staphylococcus aureus. Appl. Nanosci. 2014, 5, 157–162. [Google Scholar] [CrossRef] [Green Version]
  24. Verdier, T.; Countand, M.; Bertron, A.; Roques, C. Antibacterial activity of TiO2 photocatalyst alone or in coatings on E. coli: The influence of methodological aspects. Coatings 2014, 4, 670–686. [Google Scholar] [CrossRef]
  25. Srisitthiratkul, C.; Pongsorrarith, V.; Intasanta, N. The potential use of nanosilver decorated titanium dioxide nanofibers for toxin decomposition with antimicrobial and self-cleaning properties. Appl. Surf. Sci. 2011, 257, 8850–8856. [Google Scholar] [CrossRef]
  26. Md Saad, S.K.; Umar, A.A.; Umar, M.I.A.; Tomitori, M.; Rahman, M.Y.A.; Salleh, M.M.; Oyama, M. Two-dimensional, hierarchical Ag-doped TiO2 nanocatalysts: Effect of the metal oxidation state on the photocatalytic properties. ACS Omega 2018, 3, 2579–2587. [Google Scholar] [CrossRef] [Green Version]
  27. Aguilar, T.; Navas, J.; Alcantara, R.; Fernández-Lorenzo, C.; Gallardo, J.J.; Blanco, G.; Martín-Calleja, J. A route for the synthesis of Cu-doped TiO2 nanoparticles with a very low band gap. Chem. Phys. Lett. 2013, 571, 49–53. [Google Scholar] [CrossRef]
  28. Liaqat, M.A.; Hussain, Z.; Khan, Z.; Akram, M.A.; Shuj, A. Efects of Ag doping on compact TiO2 thin flms synthesized via one-step sol–gel route and deposited by spin coating technique. J. Mater. Sci. Mater. Electron. 2020, 31, 7172–7181. [Google Scholar] [CrossRef]
  29. Pham, T.D.; Lee, B.K. Effects of Ag doping on the photocatalytic disinfection of E. coli in bioaerosol by Ag–TiO2/GF under visible light. J. Colloid Interface Sci. 2014, 428, 24–31. [Google Scholar] [CrossRef] [PubMed]
  30. Pedroza-Herrera, G.; Medina-Ramírez, I.E.; Lozano-Álvarez, J.A.; Rodil, S.E. Evaluation of the photocatalytic activity of copper doped TiO2 nanoparticles for the purification and/or disinfection of industrial effluents. Catal. Today 2020, 341, 37–48. [Google Scholar] [CrossRef]
  31. Shi, Q.; Ping, G.; Wang, X.; Xu, H.; Li, J.; Cui, J.; Abroshan, H.; Ding, H.; Li, G. CuO/TiO2 heterojunction composites: An efficient photocatalyst for selective oxidation of methanol to methyl formate. J. Mater. Chem. A 2019, 7, 2253–2260. [Google Scholar] [CrossRef]
  32. Popović, Z.V.; Dohčević-Mitrović, Z.; Šćepanović, M.; Grujić-Brojčin, M.; Aškrabić, S. Raman scattering on nanomaterials and nanostructures. Ann. Phys. 2011, 523, 62–74. [Google Scholar] [CrossRef]
  33. Lettieri, S.; Pavone, M.; Fioravanti, A.; Amato, L.S.; Maddalena, P. Charge Carrier Processes and Optical Properties in TiO2 and TiO2-Based Heterojunction Photocatalysts: A Review. Materials 2021, 14, 1645. [Google Scholar] [CrossRef]
  34. Pascariu, P.; Cojocaru, C.; Samoila, P.; Airinei, A.; Olaru, N.; Rusu, D.; Rosca, I.; Suchea, M. Photocatalytic and antimicrobial activity of electrospun ZnO:Ag nanostructures. J. Alloys Compd. 2020, 834, 155144. [Google Scholar] [CrossRef]
  35. Mathpal, M.C.; Tripathi, A.K.; Singh, M.K.; Gairola, S.P.; Pandey, S.N.; Agarwal, A. Effect of annealing temperature on Raman spectra of TiO2 nanoparticles. Chem. Phys. Lett. 2013, 555, 182–186. [Google Scholar] [CrossRef]
  36. Munguti, B.L.; Dejene, F. Influence of annealing temperature on structural, optical and photocatalytic properties of ZnO–TiO2 composites for application in dye removal in water. Nano-Struct. Nano-Objects 2020, 24, 100594. [Google Scholar] [CrossRef]
  37. Chen, R.; Han, J.; Yan, X.; Zou, C.; Bian, J.; Alyamani, A.; Gao, W. Photocatalytic activities of wet oxidation synthesized ZnO and ZnO–TiO2 thick porous films. Appl. Nanosci. 2011, 1, 37–44. [Google Scholar] [CrossRef] [Green Version]
  38. Ahmed, S.A. Structural, optical and magnetic properties of Cu-doped TiO2 samples. Crys. Res. Technol. 2017, 52, 1600335. [Google Scholar] [CrossRef]
  39. Makula, P.; Pacia, M.; Macyk, W. How to correctly determine the band gap energy of modified semiconductor photocatalysts based on UV–Vis spectra. J. Phys. Chem. Lett. 2018, 9, 6814–6817. [Google Scholar] [CrossRef] [Green Version]
  40. Reda, S.M.; Khairy, M.A.; Mousa, M.A. Photocatalytic activity of nitrogen and copper doped TiO2 nanoparticles prepared by microwave-assisted sol-gel process. Arabian J. Chem. 2020, 13, 86–95. [Google Scholar] [CrossRef]
  41. Jaiswal, R.; Bharambe, J.; Patel, N.; Dashora, A.; Kothari, D.C.; Miotello, A. Copper and nitrogen co-doped TiO2 photocatalyst with enhanced optical absorption and catalytic activity. Appl. Catal. B Environ. 2015, 128/129, 333–341. [Google Scholar] [CrossRef]
  42. Yu, P.Y.; Cardona, M. Fundamentals of Semiconductors; Graduate Texts in Physics; Springer: Berlin/Heidelberg, Germany, 2010; ISBN 978-3-642-00709-5. [Google Scholar]
  43. Harikishore, M.; Sandhyarani, M.; Venkateswarlu, K.; Nellaippan, T.A.; Rameshbabu, N. Effect of Ag doping on antibacterial and photocatalytic activity of nanocrystalline TiO2. Procedia Mater. Sci. 2014, 6, 557–566. [Google Scholar] [CrossRef] [Green Version]
  44. Hufnagel, D.A.; DePas, W.H.; Chapman, M.R. The biology of the escherichia coli extracellular matrix. Microbiol. Spectr. 2015, 3, 1–24. [Google Scholar] [CrossRef] [Green Version]
  45. Hu, C.; Guo, J.; Qu, J.; Hu, X. Photocatalytic degradation of pathogenic bacteria with AgI/TiO2 under visible light irradiation. Langmuir 2007, 23, 4982–4987. [Google Scholar] [CrossRef]
  46. Gomathi Devi, L.; Nagaraj, B. Disinfection of Escherichia coli Gram negative bacteria using surface modified TiO2: Optimization of Ag metallization and depiction of charge transfer mechanism. Photochem. Photobiol. 2014, 90, 1089–1098. [Google Scholar] [PubMed] [Green Version]
  47. Pascariu, P.; Olaru, L.; Matricala, A.L.; Olaru, N. Photocatalytic activity of ZnO nanostructures grown on electrospun CAB ultrafine fibers. Appl. Surf. Sci. 2018, 455, 61–69. [Google Scholar] [CrossRef]
  48. Cojocaru, C.; Pascariu Dorneanu, P.; Airinei, A.; Olaru, N.; Samoila, P.; Rotaru, A. Design and evaluation of electrospun polysulfone fibers and polysulfone/NiFe2O4 nanostructured composite as sorbents for oil spill cleanup. J. Taiwan Inst. Chem. Eng. 2017, 70, 267–281. [Google Scholar] [CrossRef]
  49. XLSTAT Statistical and Data Analysis Solution. New York: Addinsoft. 2020. Available online: https://www.xlstat.com (accessed on 15 September 2020).
  50. Riss, T.L.; Moravec, R.A.; Niles, A.L.; Duellmanet, S.; Benink, H.A.; Worzella, T.J.; Minor, L. Cell Viability Assays. In Assay Guidance Manual; Markossian, S., Sittampalam, G.S., Grossman, A., Eds.; Eli Lilly & Company and the National Center for Advancing Translational Sciences, Bethesda: Rockville, MD, USA, 2004. [Google Scholar]
Figure 1. X-ray diffraction patterns of pure TiO2 and Ag–TiO2 nanostructured nanofibers materials with different Ag content.
Catalysts 11 01234 g001
Figure 2. Small and larger magnification SEM images of Ag–TiO2 nanostructured nanofibers: pure TiO2 × 10,000 (a), 0.1% Ag–TiO2 × 50,000 (b), 5.0% Ag–TiO2 × 50,000 (c), TiO2 × 50,000 (d), 0.1% Ag–TiO2 × 150,000 (e), and 5.0% Ag–TiO2 × 150,000 (f).
Catalysts 11 01234 g002
Figure 3. EDX spectra of 0.1% Ag–TiO2 (a), 1.0% Ag–TiO2 (b) and 5.0% Ag–TiO2 (c).
Catalysts 11 01234 g003
Figure 4. Smaller (scale 100 nm) and larger magnification (scale 50 nm) TEM images of Ag–TiO2 nanostructured nanofibers: pure TiO2 (a), 0.1% Ag–TiO2 (b), 5.0% Ag–TiO2 (c), TiO2 (d), 0.1% Ag–TiO2 (e), and 5.0% Ag–TiO2 (f).
Catalysts 11 01234 g004
Figure 5. Raman spectra of pure TiO2 and Ag–TiO2 nanostructured nanofibers materials.
Catalysts 11 01234 g005
Figure 6. Optical properties: (a) reflectance spectra and (b) Tauc plots of Ag–TiO2 nanostructured nanofibers materials.
Catalysts 11 01234 g006
Figure 7. Emission spectra of pure TiO2 and Ag–TiO2 nanostructured nanofibers at different excitation wavelengths λex = 280 nm (a), 300 nm (b), 320 nm (c) and 340 nm (d).
Catalysts 11 01234 g007
Figure 8. UV-VIS absorption spectra for the degradation of MB dye (10 mg/L) at various irradiation times in the presence of pure TiO2 (a), 0.1% Ag–TiO2 nanostructured nanofibers (b), and (c) color removal efficiency obtained for all materials after the end of the photodegradation.
Catalysts 11 01234 g008
Figure 9. Kinetics plots of MB dye decay against irradiation time during the photodegradation process under halogen lamp in the presence of Ag–TiO2 nanostructured nanofibers catalysts. Solid and dash lines represent predictions given by PFO kinetic model. Experimental conditions: catalyst dosage = 0.4 g/L; T = 23 ± 2 °C; pH 7.0 ± 0.2.
Catalysts 11 01234 g009
Figure 10. Comparative study showing the kinetics curves for degradation of various dyes under visible light in the presence of sample TAg1. Solid and dash lines represent predictions given by PFO kinetic model. The experimental conditions are: catalyst dosage = 0.4 g/L, T = 23 ± 2 °C, pH 7.0 ± 0.2.
Catalysts 11 01234 g010
Figure 11. SEM image and XRD pattern of TAg1 reused material after five cycles (a,b); color removal efficiency after 60 min in the presence of both materials (TAg1 reused and pristine) (c).
Catalysts 11 01234 g011
Figure 12. Image of a culture plate for evaluation of antimicrobial activity against S. aureus and E. coli.
Catalysts 11 01234 g012
Table 1. Structural parameters of pure TiO2, and Ag–TiO2 nanostructured nanofibers.
Sample2θ (°)dhkl (Å)a (Å)c (Å)D (nm) ScherrerD (nm) Rietveldε (%)Eg (eV)
T40025.283.523.7909.4597.417.40.133.01
TAg125.133.543.8039.4847.327.30.522.70
TAg225.253.523.8059.4866.416.40.572.69
TAg325.223.533.7999.4817.547.50.372.69
TAg425.193.533.7969.4646.337.20.652.70
TAg525.243.523.8009.4778.906.30.532.68
Spacing distance between crystallographic planes (dhkl), the lattice parameters a and c, the crystallite size (D), microstrain (ε) and band gap energy (Eg).
Table 2. BET data of pure TiO2 and Ag doped TiO2 nanostructured materials.
SampleSorption Capacity (%)Average Pore Size(nm)BET Data
Area (m2g−1)Monolayer (g/g−1)
T4006.432.3854.250.0154
TAg17.992.8656.070.0159
TAg313.173.8868.010.1937
TAg57.052.9448.090.0136
Table 3. Kinetic parameters for MB dye photodegradation under visible light in the presence of Ag–TiO2 nanostructured nanofibers catalysts.
Codek (min−1)χ2-Test Value
T4007.47 × 10−30.52
TAg11.90 × 10−20.10
TAg27.99 × 10−30.39
TAg31.26 × 10−20.81
TAg41.14 × 10−23.65
TAg58.13 × 10−31.59
Table 4. Kinetic parameters for photodegradation of different dyes under the fluorescent bulb light in the presence of 0.1% Ag–TiO2 nanostructured nanofibers photocatalyst (TAg1).
Dye Subjected to Degradation.k (min−1)χ2-Test Value
Methylene Blue1.29 × 10−21.04 × 10⁻¹
Congo Red7.28 × 10−28.80 × 10⁶
Amaranth8.63 × 10−33.01 × 10⁻¹
Orange II4.57 × 10−31.58 × 10⁻²
Table 5. Antimicrobial activity of the tested compounds against the reference strains.
StrainInhibition Zwone (mm)
T400TAg1TAg2TAg3TAg4TAg5
S. aureus---13.20 ± 0.9912.19 ± 0.2716.58 ± 0.18
E. coli--14.74 ± 1.7114.05 ± 0.0415.01 ± 0.0819.02 ± 0.69
Table 6. Antimicrobial activities of the samples against S. aureus and E. coli. MIC: minimum inhibitory concentration.
SamplesMinimum Inhibitory Concentration (MIC) (mg/mL)
S. aureusE. coli
T400Not testedNot tested
TAg1Not tested10
TAg2Not tested10
TAg31010
TAg4105
TAg552.5
Publisher’s Note: MDPI stays neutral with regard to jurisdictional claims in published maps and institutional affiliations.

