Article

One-Step Preparation of Nitrogen-Doped Platinum-Based Catalysts for Electrocatalytic Oxidation of Ethanol

1
Inner Mongolia Key Laboratory of Advanced Ceramics and Device, School of Materials and Metallurgy, Inner Mongolia University of Science and Technology, Baotou 014010, China
2
College of Materials Science and Engineering, Shanghai University, Shanghai 200072, China
3
School of Physics and Electronic Information, Inner Mongolia Normal University, Hohhot 010022, China
*
Author to whom correspondence should be addressed.
Submission received: 20 September 2021 / Revised: 13 October 2021 / Accepted: 15 October 2021 / Published: 21 October 2021
(This article belongs to the Topic Nanomaterials for Sustainable Energy Applications)

Abstract

:
Pt/nitrogen-doped reduced graphene oxide (N-GO) catalysts were prepared by one-step microwave-assisted ethylene glycol reduction using N-methyl-2-pyrrolidone (NMP) as the nitrogen source. Nitrogen doping in GO and the deposition of highly dispersed platinum nanoparticles were completed at the same time. The effect of adding NMP on the microstructure and the electrocatalytic performance of Pt/N-GO catalysts were studied. The results show that Pt/N-GO catalysts have better particle size distribution and electrocatalytic performance than undoped catalysts. When the ratio of GO to NMP reaches 1:200, the peak current density of the catalyst is about 3 times that of the non-nitrogen-doped Pt/GO and Pt/C(JM) catalysts, indicating that the electrocatalytic performance of this catalyst is the best. Therefore, the development of a one-step synthesis of Pt/N-GO catalysts has a broad application prospects in direct ethanol fuel cells (DEFCs).

1. Introduction

Fuel cells (FCs), a new type of power generation equipment, are able to convert the chemical energy of fuels and oxidants into electrical energy, and have the advantages of high efficiency, environmental friendliness, and low noise [1,2]. Many researchers are greatly attracted by DEFCs owing to their high energy density, easy access to fuel, low pollution emission, low operating temperature and simple structure. However, there are still some shortcomings to DEFCs that hinder their industrialization. It is widely known that Pt, widely used in DEFCs catalysts, is precious and scarce, and the toxicity of CO and CO-like intermediates generated by the ethanol oxidation reaction (EOR) usually inactivates Pt quickly [3]. Moreover, ethanol is relatively slow with respect to the kinetics of catalytic oxidation. All of these problems seriously restrict the application of DEFCs [4,5,6]. Therefore, the key to the commercialization of DEFCs is to develop a new type of electrocatalytic material that has good activity, a low price, and high stability [7]. To improve the stability, activity, dispersion and use of precious metal components in the catalysts, carbon-based carriers with large specific surface area, excellent conductivity and adjustable surface chemical properties are usually used as the carrier of precious metal electrocatalysts. Carrier materials that are commonly used for electrocatalysts include carbon black [8,9], mesoporous carbon [10,11], carbon nanotubes [12,13], and carbon nanospheres [14]. However, according to previous research [15], catalytic stability and activity are slightly improved when noble metal particles are loaded on these carbon-based carriers.
Graphene is a kind of six-membered two-dimensional ring honeycomb material stacked with carbon atoms, each of which is bonded to the surrounding carbon atoms through sp2 hybridization [16]. In comparison with conventional catalyst support materials, graphene has a unique structure and special properties like large surface area, high chemical stability, and excellent electronic conductivity [17,18], leading to its widespread use as a support material for various catalysts. Researchers have found that the dispersion of noble metal nanocatalysts can be improved to some extent by using graphene as a carbon-based support material [19]. Although graphene is an excellent potential carrier material for electrocatalysts, graphene-supported noble metal catalysts still face the problem that the noble metal particles agglomerate easily during the process of electrocatalysis. It has been reported that doping heteroatoms like nitrogen or boron into the graphene lattice can improve electrocatalytic performance [20,21]. The research on nitrogen-doped graphene is more extensive. The N atom is very close to the C atom in the periodic table, so it has an atomic radius and electronegativity that are similar to the C atom. Therefore, doping N atoms into the graphene lattice will not cause large changes in the graphene lattice, making doping easier to achieve. Recently, N-doped carbon structures have attracted a great deal of interest in the field of electrochemical energy conversion and storage due to its greater electron mobility, like n-type or metallic behavior, than un-doped carbon nanostructures [22]. Moreover, compared with C atoms, N atoms with an extra electron can act as an electron donor, thus increasing the carrier concentration and the electrical conductivity of graphene. N doping can also open the band gap by shifting the Fermi surface of graphene. In addition, N-doped graphene may have some specific pore structures that can increase the active adsorption site density on the graphene surface, so that the adsorption of metal particles or gas on the graphene surface is enhanced. This feature causes N-doped graphene to possess superior electrochemical properties, and it can be developed into a high-performance electrode material, which is expected to be increasingly widely used in energy devices. Xiong et al. [23] applied nitrogen-doped graphene prepared under different thermal annealing conditions to Pt/graphene catalysts, finding that Pt nanoparticles had smaller particle sizes and better dispersion. Compared with the undoped Pt/graphene catalyst in methanol oxidation, Pt/nitrogen-doped graphene catalysts showed better electrochemical catalytic activity. Sun et al. [24] synthesized a series of PtxFe100−x/nitrogen-doped graphene catalysts for the electrocatalytic oxidation of formic acid by a two-step method. In comparison with the undoped PtxFe100−x/graphene catalyst, PtxFe100−x nanoparticles supported on nitrogen-doped graphene showed smaller particle size and the catalytic oxidation performance is significantly improved. Although electrocatalysts based on nitrogen-doped graphene have potential application prospects, the research and application of nitrogen-doped graphene-supported noble metal catalysts in DEFCs are still comparatively scarce, moreover, the mechanism of action of the catalysts is still not clear, and the synthesis and preparation processes are complex, hindering their application.
Traditional nitrogen-doped graphene-supported Pt-based catalysts usually require two steps to prepare, that is, nitrogen doping first, and then catalyst preparation. Currently, there are several main ways to prepare nitrogen-doped graphene, including chemical vapor deposition (CVD) using methane and ammonia [25], simultaneous annealing of nitrogenous compounds and GO in the ammonia gas [26], and nitrogen plasma treatment of graphene [27]. However, the above preparation methods have relatively complicated processes, requiring long reaction time, high reaction temperature, and strict requirements with respect to substrate materials and experimental equipment. The synthesis of functionalized nitrogen-doped graphene by solvothermal reduction of GO suspension in NMP is a simple and effective method [28]. Therefore, in this paper, a one-step method was used to prepare nitrogen-doped graphene-supported Pt-based catalysts using a simple process with high efficiency suitable for industrial production. By characterizing the morphology, size, composition and distribution of the synthesized samples, and testing the electrochemical activity and durability of the catalysts, it was found that the stability and catalytic activity of the Pt/N-GO electrocatalysts in the catalytic oxidation of ethanol were significantly improved after proper nitrogen doping, which is highly significant for the development of new, efficient and cheap Pt-based catalysts for FCs.

2. Results and Discussion

2.1. Preparation of Pt/Nx-GO Catalysts

First, 50 mL ethylene glycol and GO was added to the beaker, and then NMP was added according to the mass ratios of GO and NMP as 1:0, 1:25, 1:50, 1:100, 1:150, 1:200, 1:250. The GO mass is 30 mg, and the seven groups of catalysts were marked as 1#, 2#, 3#, 4#, 5#, 6# and 7#, in turn, using Pt/C(JM) as commercial catalyst. Then about 2 mL H2PtCl6 solution was added dropwise, following which the concentration was 0.05 mol·L−1, and the solution was ultrasonicated for 0.5 h. The solution was microwave-heated for 20 s, then removed from the oven and cooled for 5 s, which was performed to prevent NMP and ethylene glycol from evaporating. This heating process was repeated five times. After being magnetically stirred for 12 h to be evenly dispersed, the solution was suction-filtered and dried for 20 h.

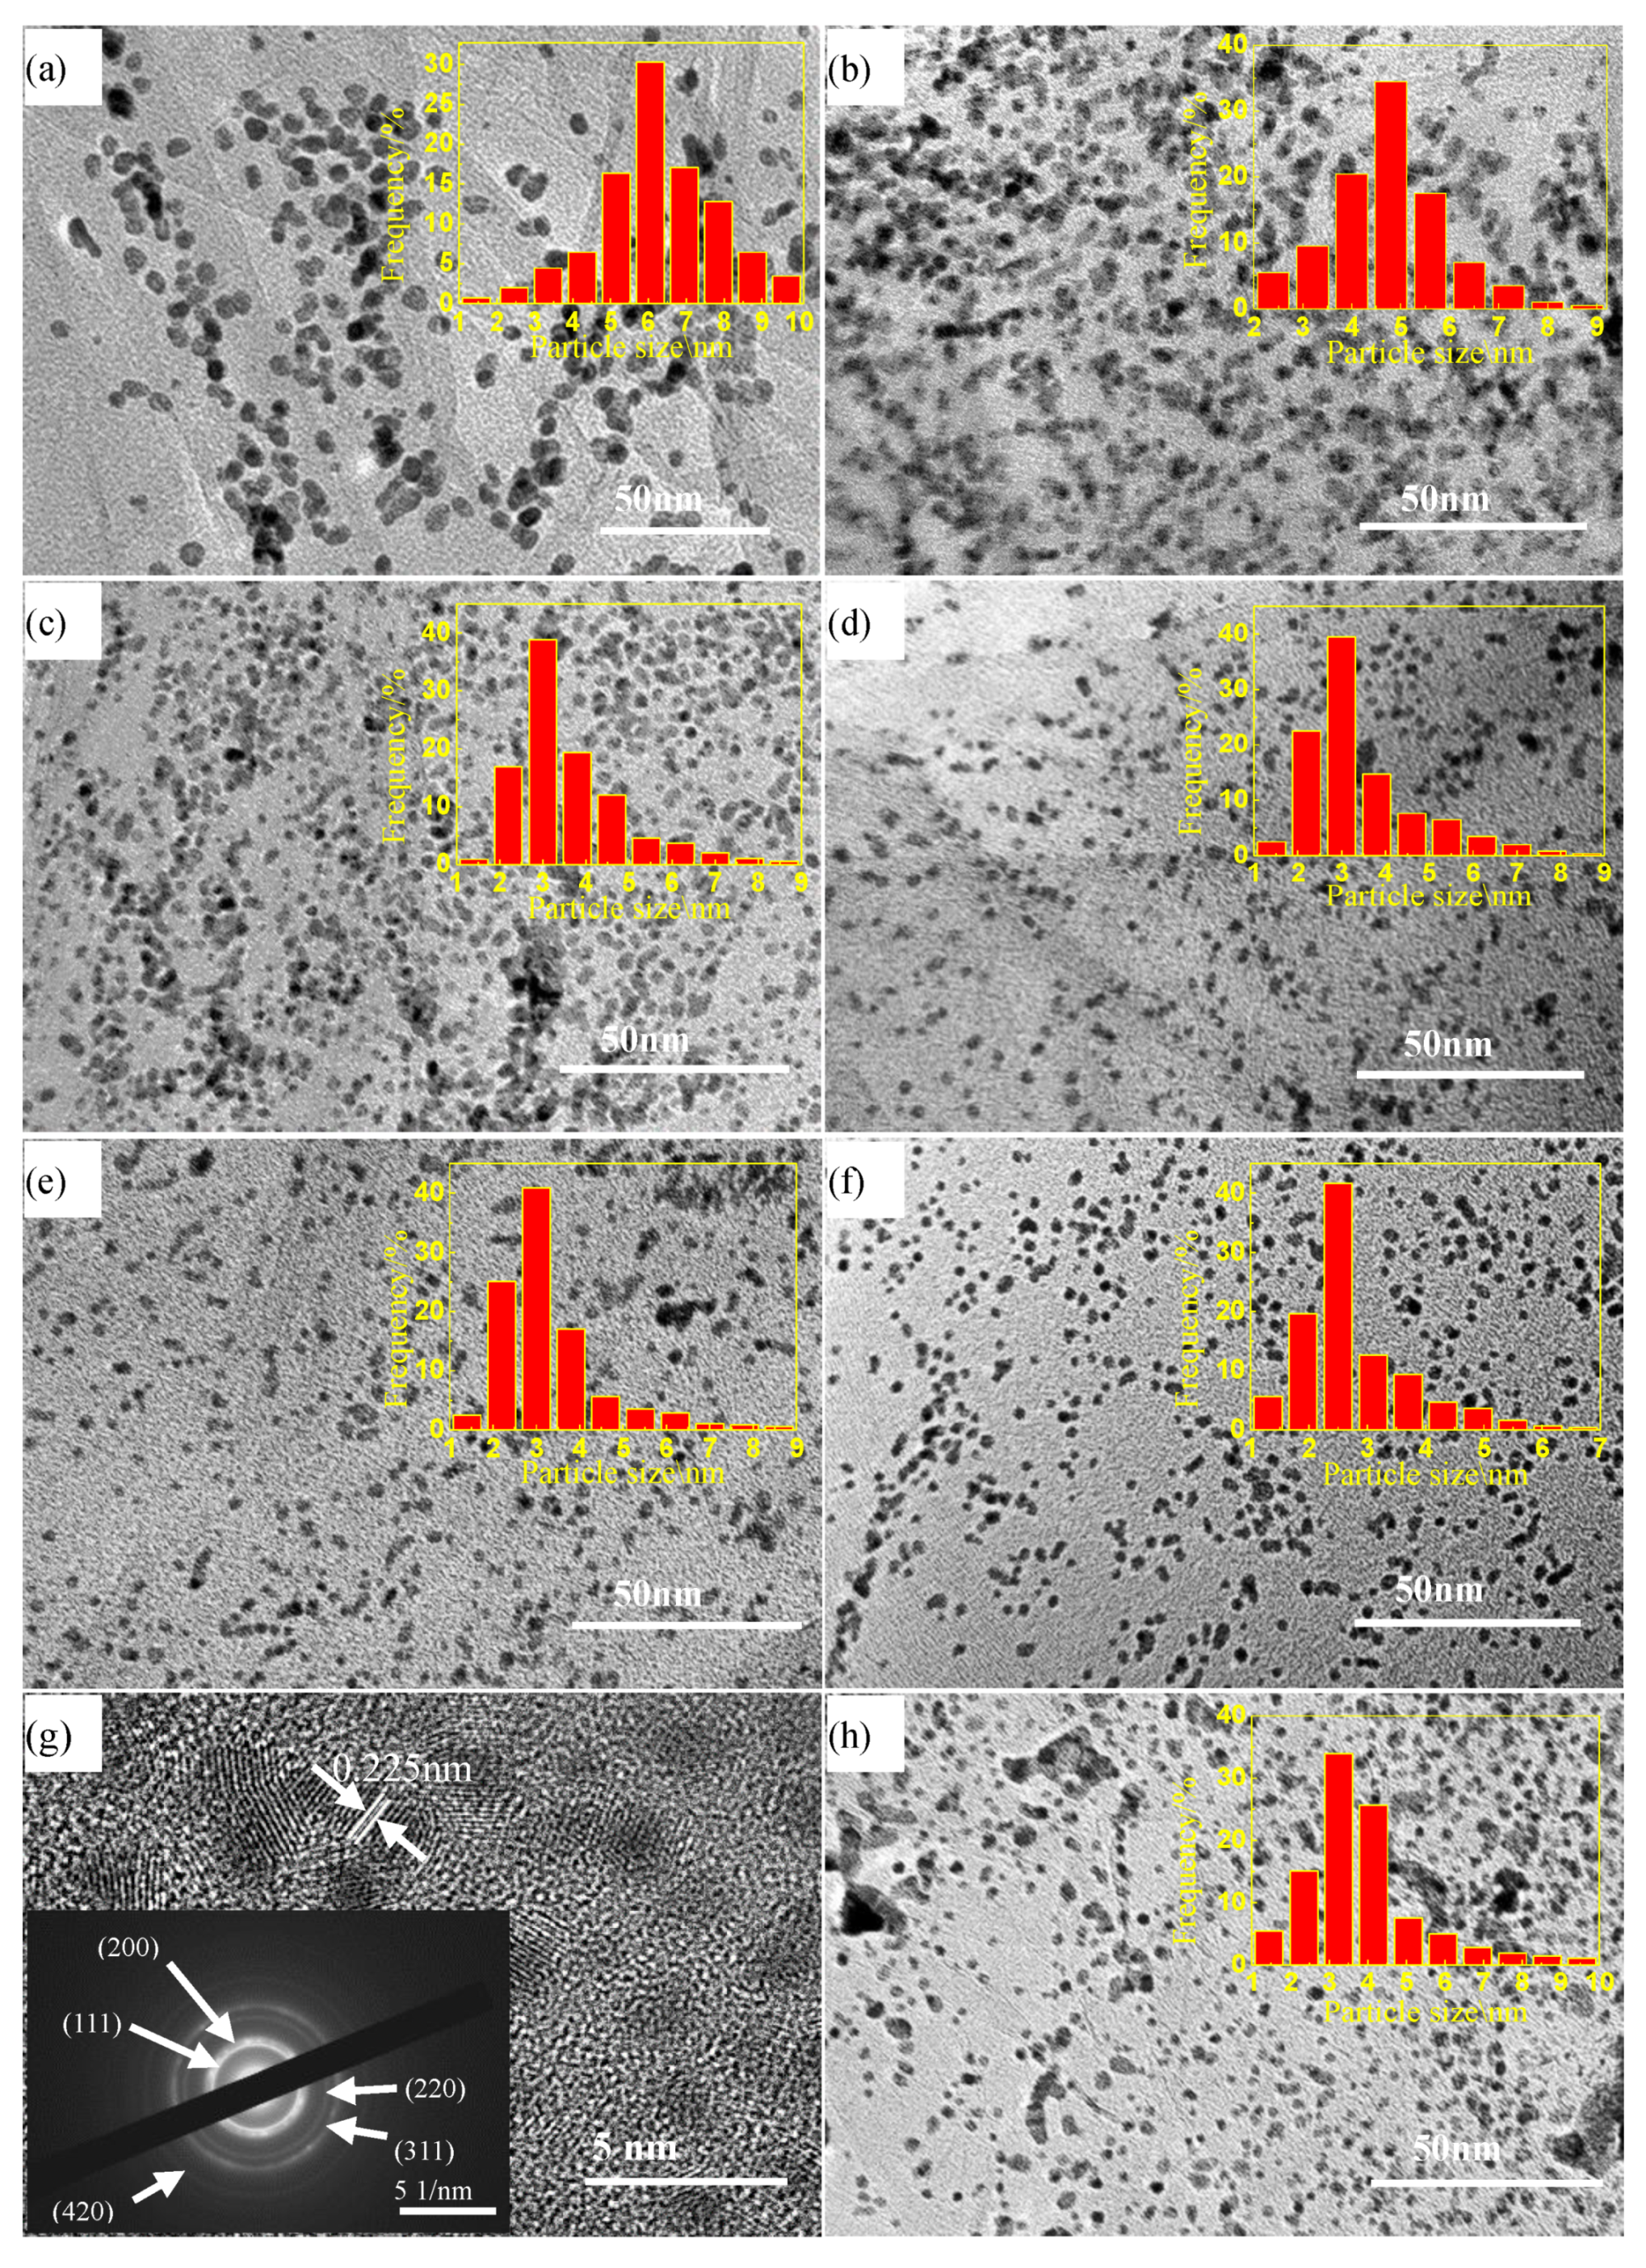
2.2. Transmission Electron Microscopy (TEM) Characterization of the Catalysts

Figure 1 shows TEM images of the seven groups of catalysts and their corresponding particle size distribution histograms. More than 200 randomly selected nanoparticles were measured by nano measurer software to obtain the particle size of each sample and finally the average value was calculated.
As can be clearly seen in Figure 1, the Pt nanoparticles in each group of catalysts were successfully loaded onto the graphene supports and exhibited distinct spherical morphologies. It can be seen from Figure 1a that 1# agglomerates more in undoped Pt nanoparticles. It can be clearly seen from the particle size distribution histogram that the particle size distribution range was from 1 nm to 10 nm, and the average particle size was 6.43 nm. As can be seen in Figure 1b, the Pt nanoparticles in catalyst 2# were clearly more refined, but the degree of agglomeration was still relatively high. The particle size distribution ranged from 2 nm to 9 nm, and the average particle size was 5.14 nm, which is 20.1% lower than that of catalyst 1#. It can be clearly seen from Figure 1c that the Pt nanoparticles in catalyst 3# were further refined compared to those in catalyst 2#, and the agglomeration degree was decreased. The particle size distribution ranged from 1 nm to 9 nm, and the average value was 3.48 nm, which is 32.3% lower than that of catalyst 2#. It can be clearly seen from Figure 1d that the dispersion of Pt nanoparticles in catalyst 4# was greatly improved compared to that in catalyst 3#. The particle size distribution ranged from 1 nm to 9 nm, and the average particle size was 3.28 nm, representing a reduction of 5.7% with respect to catalyst 3#. As can be seen from Figure 1e, only a few Pt nanoparticles in catalyst 5# were agglomerated with high dispersion. The particle size distribution ranged from 1 nm to 9 nm, and the average value was 3.12 nm, which is 4.9% lower than that of catalyst 4#. As can be seen from Figure 1f, there was almost no agglomeration of Pt nanoparticles in catalyst 6#, and the degree of dispersion was the highest. The range of particle size distribution was narrower, ranging from 1 nm to 7 nm, and the average value was 2.95 nm, which is 5.4% lower than that of catalyst 5#. As can be seen from Figure 1h, catalyst 7# exhibited more extensive agglomeration, with a particle size distribution ranging from 1 nm to 10 nm, and an average value of 3.91 nm. The typical high-resolution TEM image of catalyst 6# is presented in Figure 1g, in which the lattice fringes of Pt can be cleary identified, and the interplanar spacing was 0.225 nm, corresponding to the (111) crystal plane of Pt [29]. The selected area electron diffraction pattern of catalyst 6# is shown in the inset illustration of Figure 1g. It can be deduced that the several diffraction rings in the figure correspond to the (111), (200), (220), (311) and (420) planes of Pt, respectively.

2.3. X-ray Diffraction (XRD) Characterization of the Catalysts

Figure 2 presents the XRD patterns of the seven groups of catalysts. It can be seen that all of the catalysts exhibit a broad diffraction peak at 2θ = 23.7° corresponding to the (002) crystal planes of graphene or nitrogen-doped graphene, which indicates that GO was successfully reduced to either graphene or nitrogen-doped graphene. In addition, each group of catalysts exhibited a strong diffraction peak at around 39.1° corresponding to the (111) crystal planes of Pt; the shoulder peak at 46.2° corresponds to the (200) plane, the weak peak at 67.5° corresponds to the (220) plane, and the other weak peak at 81.1° corresponds to the (311) crystal plane of Pt. It can also be seen from the figure that, compared with catalyst 1#, the diffraction peaks of all crystal planes of Pt in catalysts 2#–7# were significantly broadened, indicating a reduction in the grain size and an improvement in the dispersion of Pt by doping nitrogen into a graphene lattice. Meanwhile, in the case of catalysts 2#–6#, as NMP was added, the diffraction peaks of each crystal plane of Pt gradually broadened, but the width of diffraction peaks on each crystal surface of Pt in catalyst 7# (GO: NMP = 1:250) became narrower, indicating that the grain size of Pt had increased, which is in keeping with the analysis in Figure 1.

2.4. Raman Spectroscopy Characterization of the Catalysts

Raman spectroscopy is a quite effective tool for characterizing structural defects and doping levels in graphene [30,31,32]. The Raman spectra of catalysts 1# and 6# are shown in Figure 3. It can be seen that the Raman spectrum of catalyst 1# contains two obvious peaks, the D Peak at 1335 cm−1 corresponds to the stepped structure and defect characteristics of graphite, while the G peak at 1596 cm−1 is related to the E2g vibration mode of sp2-hybridized carbon atoms in the hexagonal framework of graphene. In comparison with the bands of the undoped catalyst 1#, the D band and the G band of catalyst 6# were redshifted to 1331 cm−1 and 1590 cm−1, respectively. This may be due to the formation of nitrogen-containing functional groups following doping the graphene with nitrogen, which may be present in the form of amino N, pyridine N or graphene N [23]. During the microwave heating reduction process, peroxy radicals generated by the decomposition of NMP can react with O-containing functional groups on the surface of GO to generate amino N, which can be further converted into pyridinic N and graphitic N groups, thereby changing the structure and energy level of the graphene, causing the D and G peaks occur redshift [28]. In addition, the intensity ratio of the D band and the G band (ID/IG) is directly proportional to the number of defects in the graphene, on the basis of which the degree of nitrogen doping in graphene can be characterized. In comparison with that for the undoped catalyst 1#, the ID/IG ratio for catalyst 6# increased from 1.73 to 1.81, indicating that the mean size of sp2-hybridized carbon domains had decreased and edge plane exposure had increased, which might have been due to the uneven doping of nitrogen atoms into the graphene lattice [33].

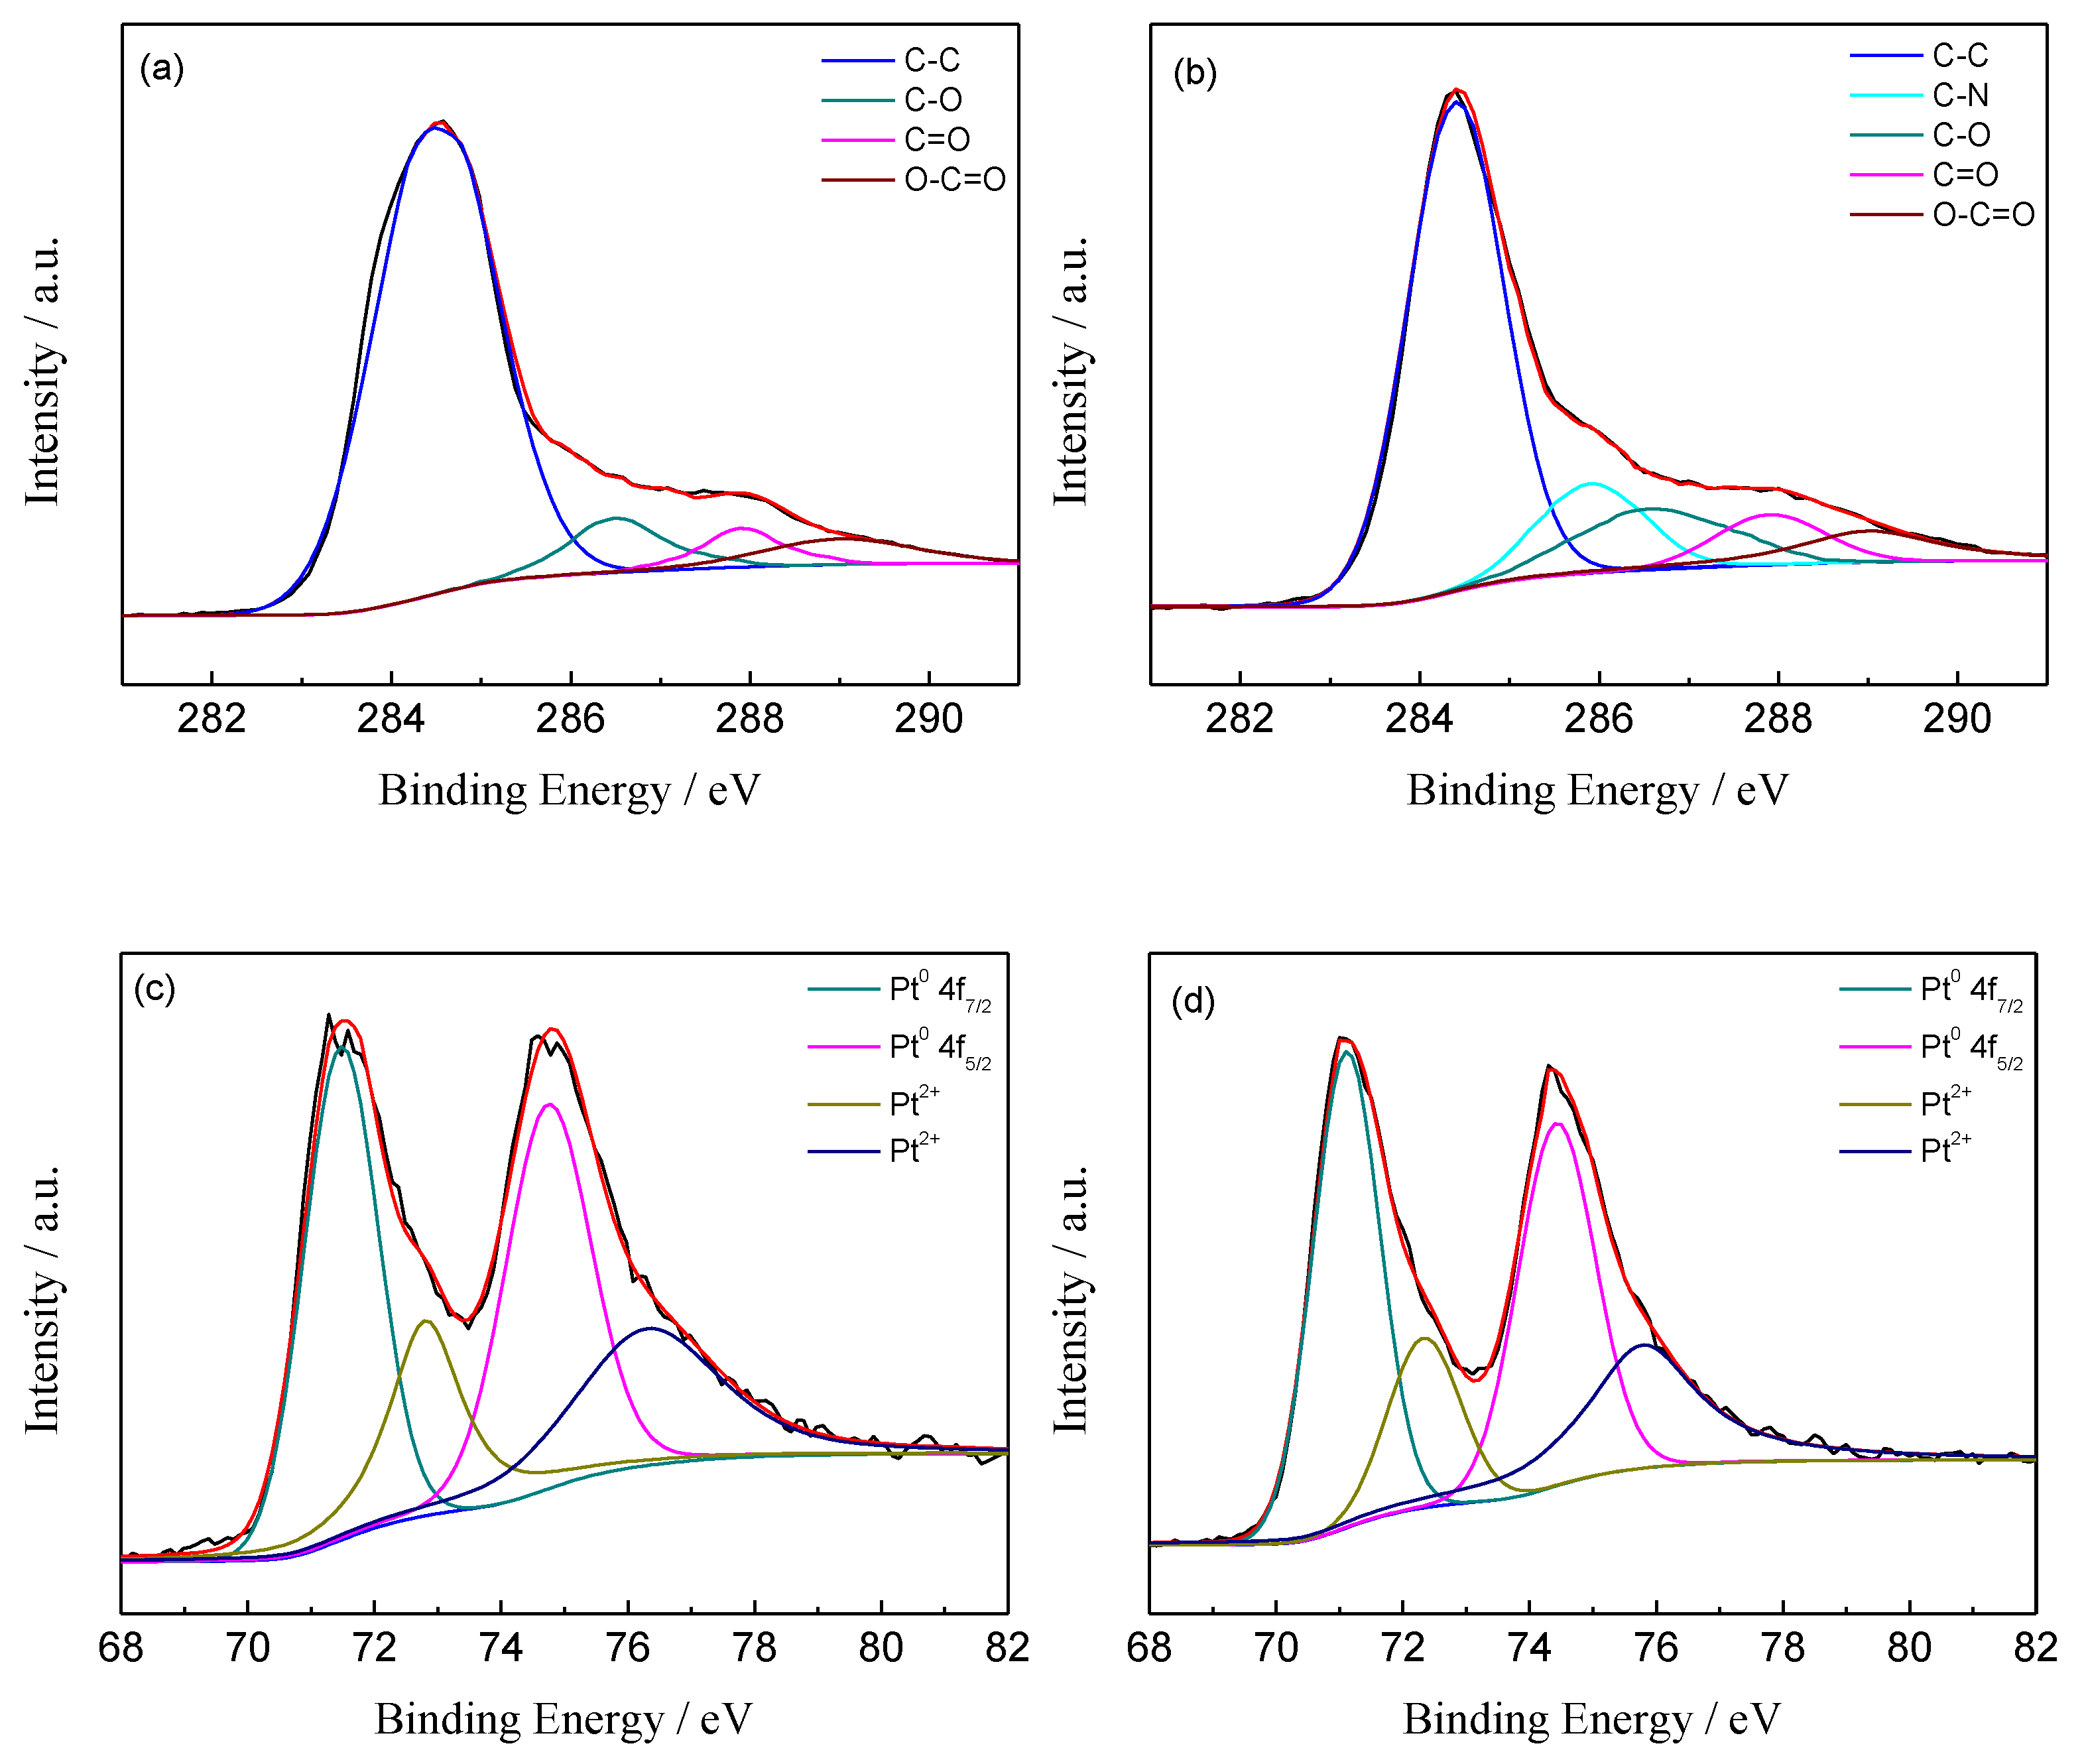
2.5. X-ray Photoelectron Spectroscopy (XPS) Characterization of the Catalysts

The electronic structures of the seven groups of catalysts were analyzed. The typical XPS spectra of catalysts 1# and 6# are shown in Figure 4a–e. In addition, the content of N element, the position and attribution of peaks, and the proportion of the corresponding functional groups of the seven groups of catalysts are shown in Table 1. As shown in Figure 4a, the C1s spectrum of catalyst 1# can be fitted to four peaks; the strongest one at 284.6 eV corresponds to the C–C bonds in the graphene, and the peaks at 286.5 eV, 287.9 eV, and 289 V correspond to C–O, C=O, and O–C=O bonds, respectively. According to Figure 4b, the C–C, C–O, C=O, and O–C=O linkages can also be well fitted in the C1s spectrum of catalyst 6#, with the peak at 285.9 eV corresponding to C–N bonds. This result confirms that nitrogen was successfully doped into the graphene lattice during the reduction of GO [23]. As can be seen from Table 1, the contents of nitrogen element doped into catalysts 2#–7# were 0.56%, 0.73%, 0.98%, 1.62%, 2.27% and 3.25% (atomic percentages), respectively. It can also be seen that a few O-containing functional groups remain on the surface after the reduction of GO. The spectrum of Pt 4f in catalyst 1# can be fitted into two components: the strong peaks at 71.4 eV and 74.6 eV of BE (Binding Energy) correspond to Pt0 4f7/2 and Pt0 4f5/2, while those at 72.8 eV and 76.3 eV correspond to Pt2+ [23,24]. Furthermore, the positions of the peaks of Pt0 4f5/2 and Pt0 4f7/2 are not shifted in the spectrum of catalyst 6# with the addition of NMP, as shown in Figure 4d, indicating that the electronic state of Pt does not change following nitrogen doping of graphene. As shown in Figure 4e, the spectrum of N1s in catalyst 6# can be fitted into three components: the peak at 398.3 eV corresponds to pyridinic N with 34.45% content, the peak at 399.4 eV corresponds to amino N with 48.98% content, and the peak at 401 eV corresponds to graphitic N with 16.57% content, indicating that amino N plays a dominant role in the formation of N-containing functional groups. This is because amino N only needs to break one C–O bond and form one C–N bond during the formation process, while pyridinic N and graphitic N need to break two or three C–C bonds, which requires more energy [34]. As can be seen from Table 1, the total contents of pyridinic N and amino N in catalysts 2#–7# increase with the addition of NMP, which is because pyridinic N and amino N predominate in N-containing functional groups when the reaction temperature is lower than 300 °C [34]. For the Pt4f component, the contents of Pt metal in catalysts 2#–7# are all higher than that in catalyst 1# without N, which is because amino N and pyridinic N are normally thought to be active sites that can attract Pt nanoparticles from the catalyst solution, inhibiting their aggregation, and thus increasing the content of Pt metal. In addition, it is obvious to see that with increasing addition of NMP, the content of Pt metal in the catalysts gradually increases. When the ratio of GO to NMP was 1:200 (catalyst 6#), the content of Pt metal reached a maximum of 73.63%. Therefore, adding a certain amount of NMP can increase the content of Pt metal in the catalyst.

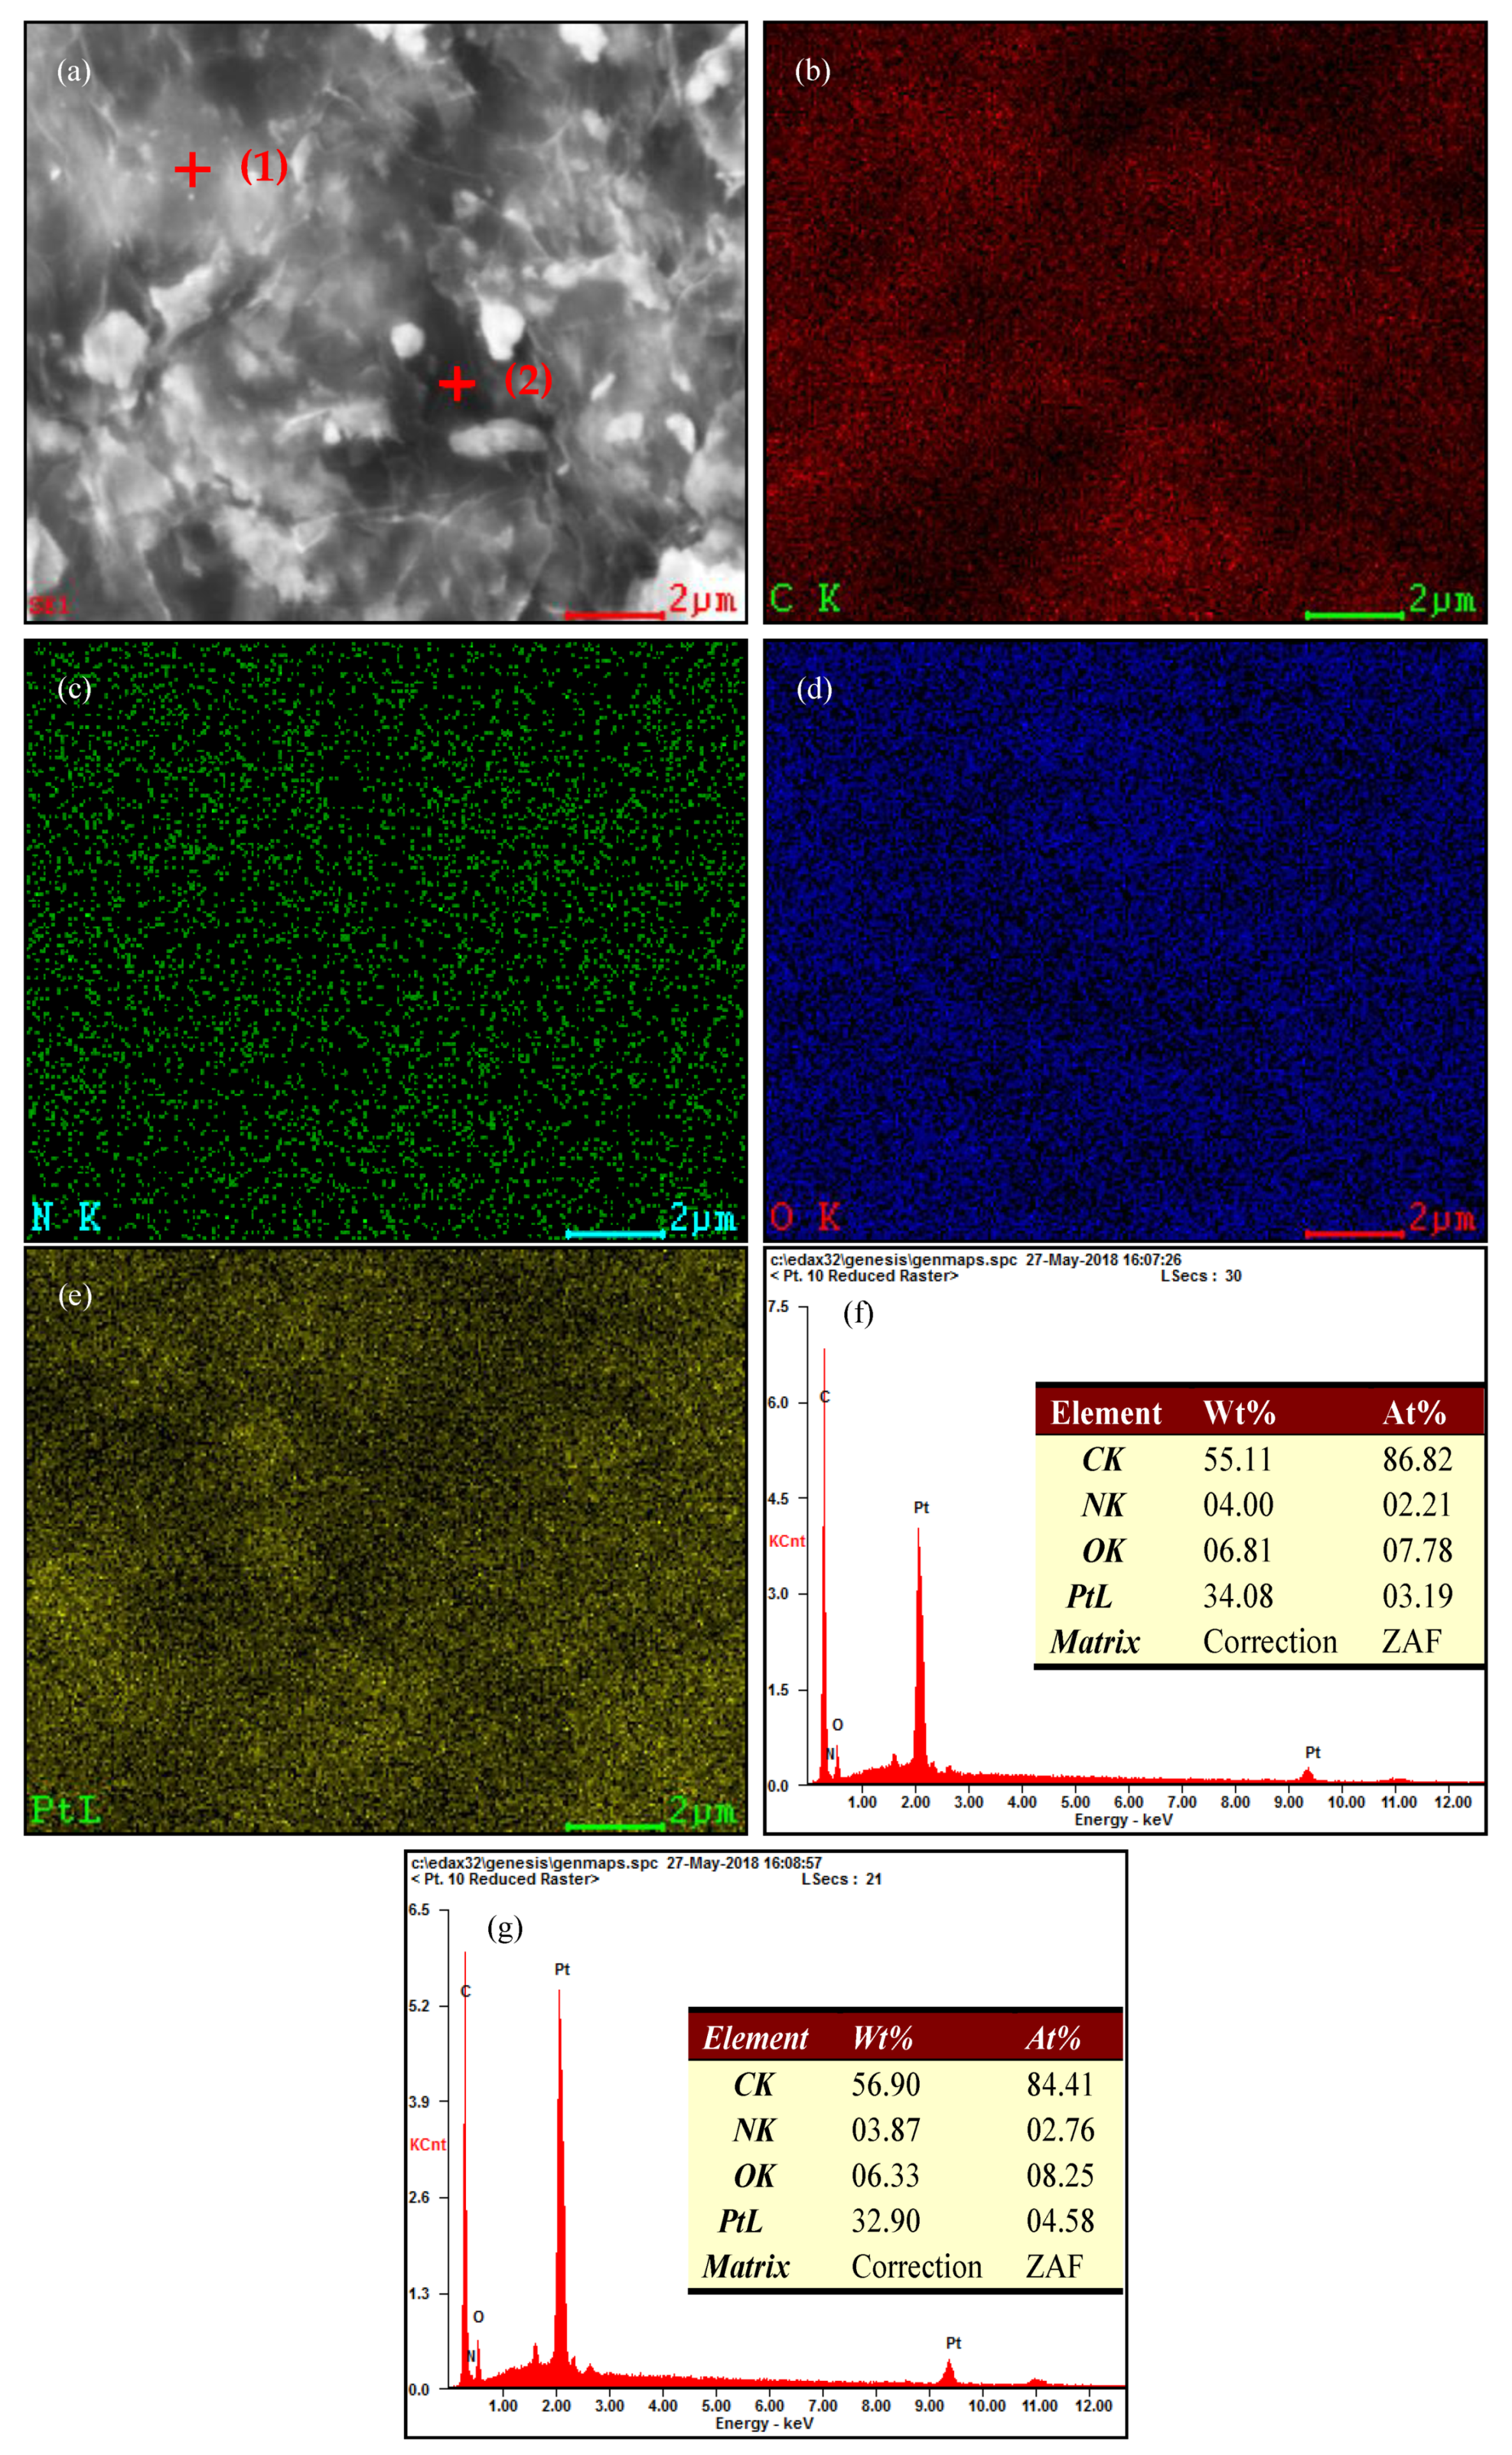
2.6. SEM and EDS Characterization of the Catalysts

Figure 5 presents the SEM image of catalyst 6# and the results of the surface scanning and point scanning analyses. It can be seen that there are many folds on the surface of the graphene. Surface scanning analysis was performed on Figure 5a, as shown in Figure 5b–e, from which it can be seen that C, N and Pt were uniformly distributed in the catalysts. To further study the content of each element, two random points in Figure 5a were analyzed using point scanning, and the results are shown in Figure 5f,g. As can be seen from the results, N element has been successfully doped into graphene with a mass fraction of about 3.9%, and the mass fraction of Pt on the graphene surface is about 33.5%.
The above morphological and structural characterizations show that the reduction of GO and the deposition of platinum nanoparticles proceed simultaneously during the reaction. With the addition of NMP, the nitrogen functionalization of graphene was achieved through the generation of free radicals [28]. Chloroplatinic acid is not only a source of platinum, it also promotes the reduction of GO and the introduction of nitrogen functional groups [30]. In addition, the potential surfactant and dispersant properties of ethylene glycol and NMP synergically regulate the nucleation, growth, and dispersion of metal nanoparticles deposited on graphene carriers [23].

2.7. Catalytic Performance Analysis

2.7.1. Electrochemical H Adsorption–Desorption Reaction of the Catalysts

Electrochemical active surface area (ESA) is an important factor in the electrocatalytic activity of Pt-based catalysts [35]. It can be calculated from the desorption amount of surface H of a Pt-based catalyst in acid solution. The specific formula is as follows:
ESA = Q/(0.21 × [Pt])
Q = S / v
In the formula, Q represents the amount of electricity when H is desorbed, [Pt] represents the loading of Pt, S represents the H adsorption–desorption peak area, and v represents the scanning speed.
Figure 6 shows the H adsorption–desorption curve of the catalyst in 0.5 mol/L H2SO4. The adsorption desorption peak of H appears between −0.30 V and −0.20 V. We calculated the ESA of the catalyst by integral calculation. In Table 2, Pt/C(JM) is the commercial catalyst. It can be seen from the table that the electrochemical active surface areas of the eight groups of electrocatalysts decreases in the following order: Pt/N200-GO > Pt/N150-GO > Pt/N100-GO > Pt/N50-GO > Pt/N250-GO > Pt/N25-GO > Pt/GO > Pt/C(JM). The electrochemical active surface areas of the catalysts prepared in this paper are greater than that of the commercial Pt/C(JM) catalyst. At the same time, the electrochemical active surface areas of the N-doped Pt/Nx-GO (x = 25, 50, 100, 150, 200, 250) catalysts were greater than that of the Pt/GO catalyst without N doping. This is because when the N element is doped into the graphene lattice, it provides active sites for the deposition and nucleation of Pt nanoparticles, inhibiting the aggregation of Pt nanoparticles and improving their dispersion. Furthermore, the incorporation of N functional groups can also improve the conductivity of graphene carriers, so the electrochemical active surface area of the catalysts increases. Furthermore, it can be seen that the electrochemical active surface area of the Pt/N200-GO catalyst (GO:NMP = 1:200) was the largest, about twice that of the Pt/GO catalyst. Under the same Pt loading, the ESA of the catalysts were different due to the influence of the different nitrogen doping amounts on the dispersion of Pt particles. When the GO:NMP ratio was increased to 1:200, the contents of amino N and pyridine N were appropriate as the deposition and nucleation sites of Pt nanoparticles in the catalyst, the dispersion of Pt particles was the best, and the size of catalyst particles was moderate. However, when the GO:NMP ratio was 1:250, the excess oxygen free radicals generated by NMP occupied too many active sites on the surface of graphene, causing the Pt nanoparticles to aggregate and grow during deposition and nucleation, resulting in a decrease in ESA. In summary, when GO:NMP = 1:200, the electrochemical active surface area of the catalyst is the largest.

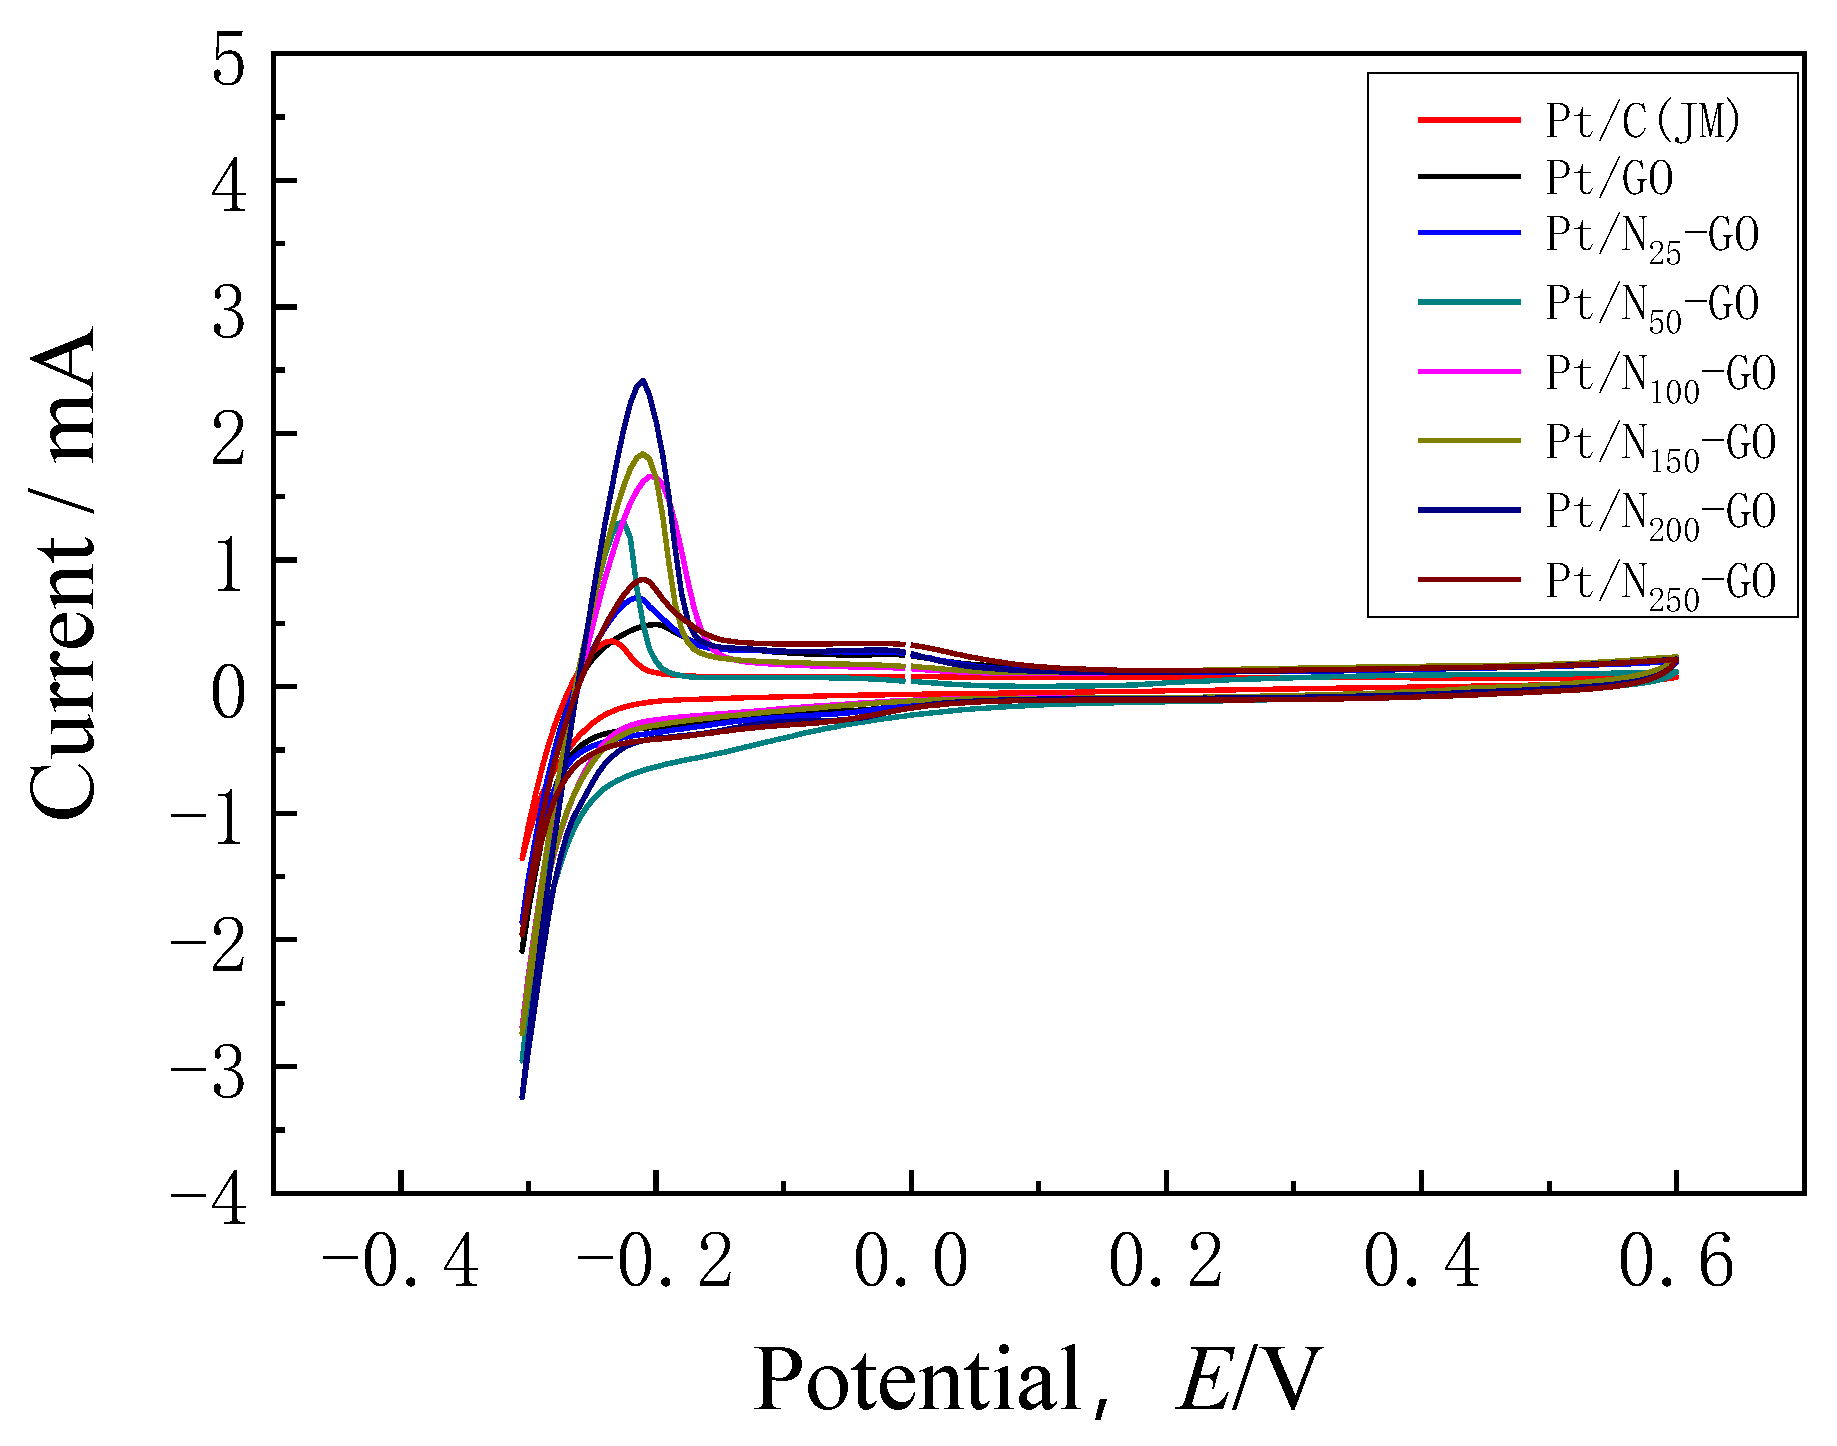
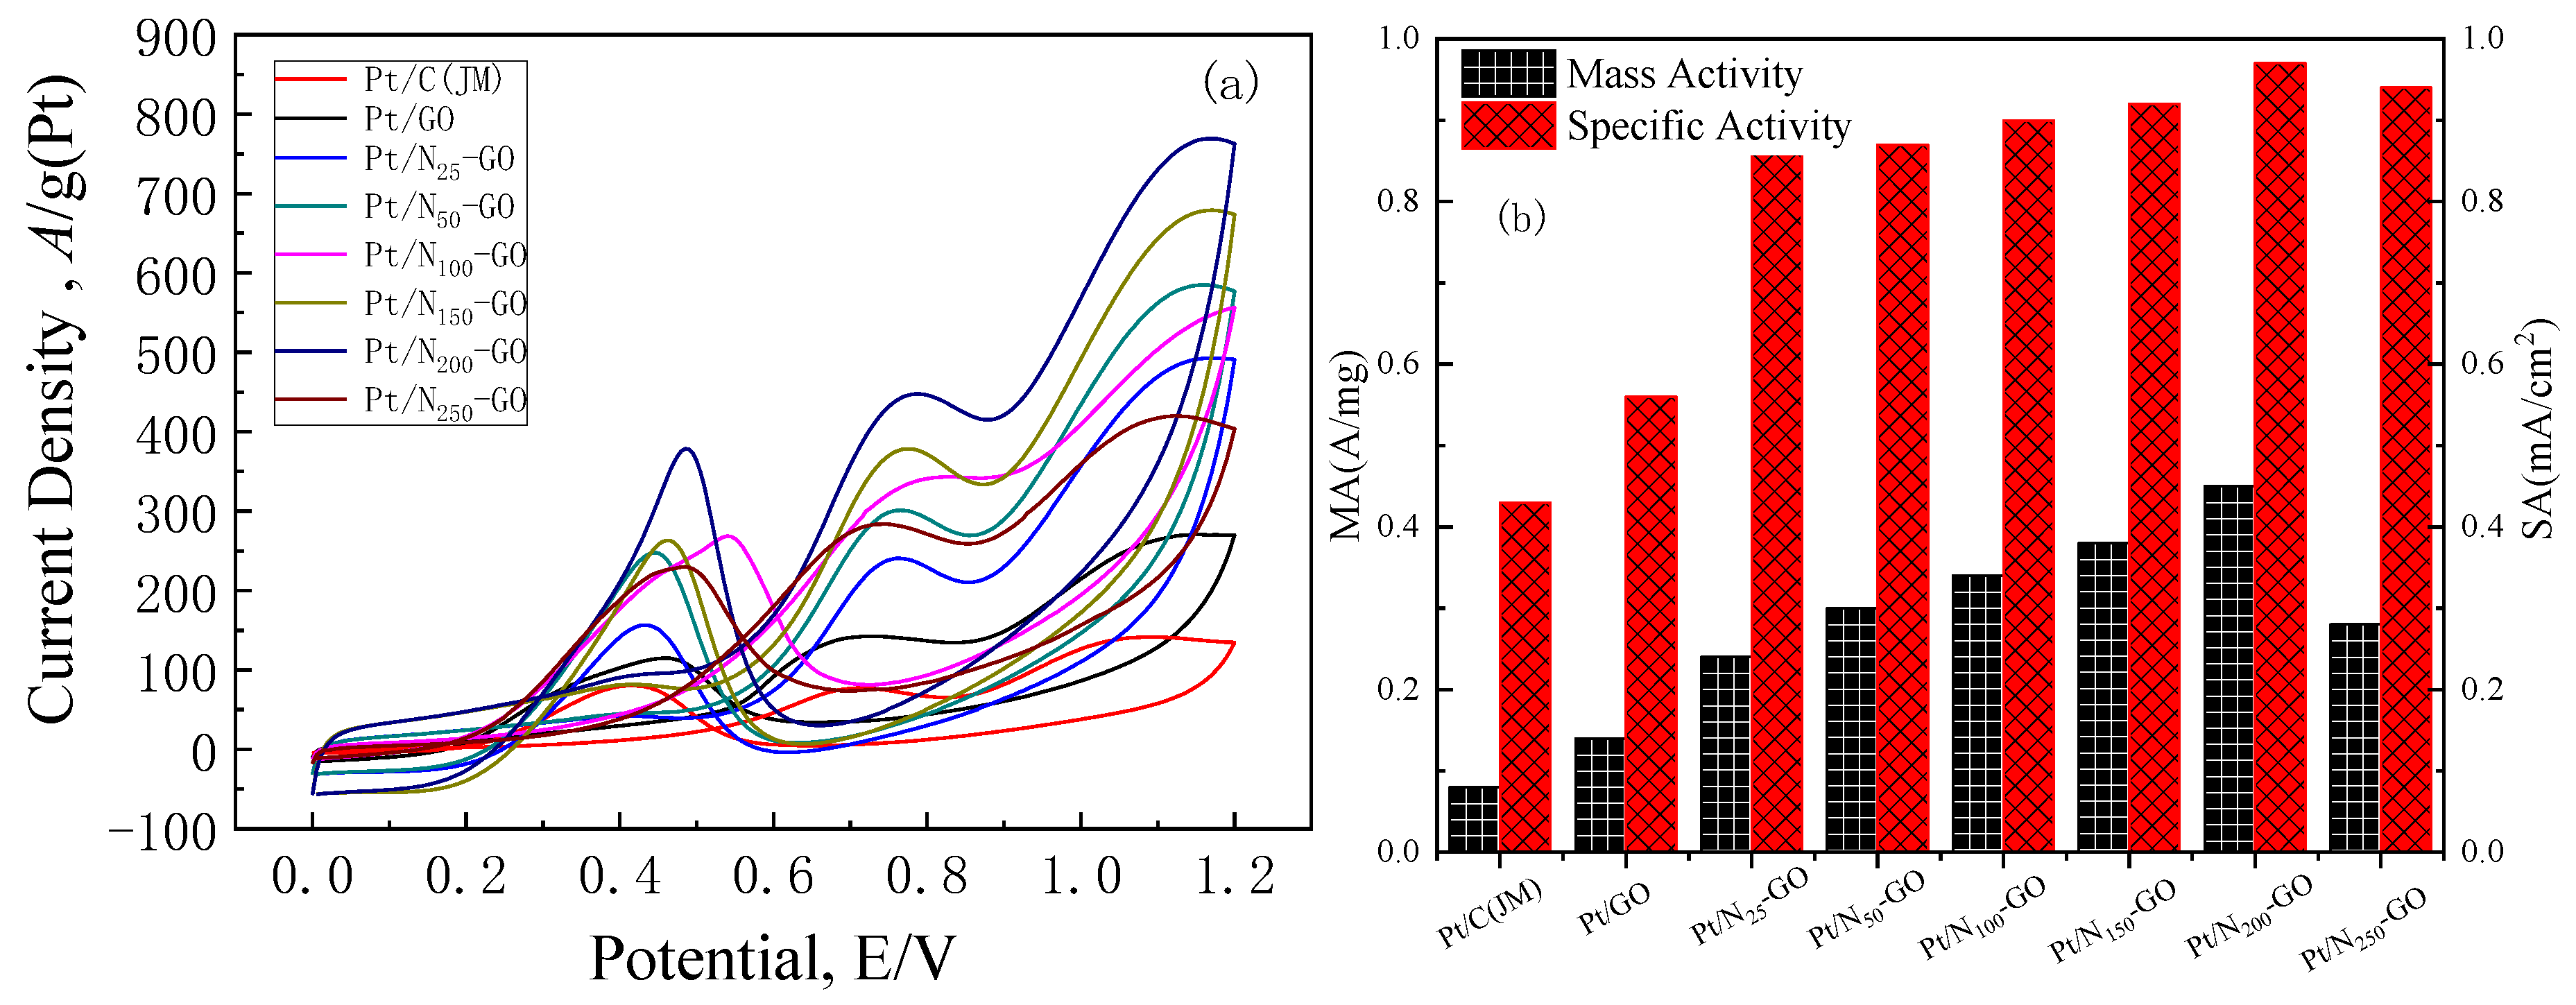
2.7.2. Cyclic Voltammetry Characterization of the Catalysts in Ethanol Oxidation

Figure 7a shows the cyclic voltammograms of the catalysts in the electrochemical oxidation of ethanol. As can be seen, the current density in the interval of 0.0–0.4 V increases slightly, with a peak appearing in the interval of 0.4–0.8 V during the positive sweep, which mainly corresponds to the complete oxidation of ethanol to CO2 [36].
C 2 H 5 OH + 3 H 2 O 2 CO 2 + 12 H + + 12 e
However, the current density decreases in the interval of 0.8–0.9 V, and until the potential increases to the interval of 1.0–1.1 V, the current density peak of ethanol oxidation reappears, mainly corresponding to the following reactions [37]:
C 2 H 5 OH + H 2 O CH 3 CHO + 2 H + + 2 e
C 2 H 5 OH + H 2 O CH 3 COOH + 4 H + + 4 e
During the negative sweep, the oxide (Pt–O) formed previously is reduced, which releases surface active sites and restores the catalytic oxidation capacity of ethanol. Since the first peak in the positive scan corresponds to the complete oxidation of ethanol to produce CO2, the current density of the oxidation peak is usually used as an index to evaluate the electrochemical oxidation of ethanol [38]. The peak current densities of catalysts for ethanol oxidation are listed in Table 2. As shown below, the peak current density for each group of catalysts decreased in the following order: Pt/N200-GO > Pt/N150-GO > Pt/N100-GO > Pt/N50-GO > Pt/N25-GO > Pt/N25-GO > Pt/GO > Pt/C(JM). It is obvious to see that the peak current densities for the doped catalysts were all higher than that for the undoped catalyst, which is because the doping with N increases the dispersion of Pt nanoparticles and also changes the electronic structure of the graphene substrate, improving its chemical reactivity and electronic conductivity, and increasing the electrochemical active surface area of the catalysts [39].
The differences in the peak current densities of the catalysts und the same Pt load were due to the effect of various amounts of NMP addition on the dispersion of Pt particles. When the GO:NMP ratio was increased to 1:200, the content of amino N and pyridine N in the catalyst was the most suitable for the deposition and nucleation of Pt nanoparticles, and the dispersion and sizes of the Pt nanoparticles were optimal; hence, there was an increase in peak current density. However, when the ratio of GO to NMP was 1:250, the excessive peroxy radicals generated by NMP might occupy too many active sites on the surface of the graphene, leading to the accumulation and growth of Pt nanoparticles in the process of deposition and nucleation, thus causing a reduction in peak current density. Therefore, when the GO:NMP ratio is 1:200, the catalyst exhibits the best catalytic activity in the electrocatalytic oxidation of ethanol.
The histograms of specific activity and mass activity of each group of catalyst samples are shown in Figure 7b. It can be seen from Figure 7b that the surface specific activity and the mass specific activity of each group of catalysts prepared in the experiment first exhibited an increasing trend, and then a decreasing trend with the prolongation of acid etching time, and when the GO:NMP ratio was 1:200, the catalyst had higher surface specific activity and mass specific activity, respectively 0.97 mA/cm2 and 0.45 A/mg, when compared with other samples, showing that its catalytic performance is the best.

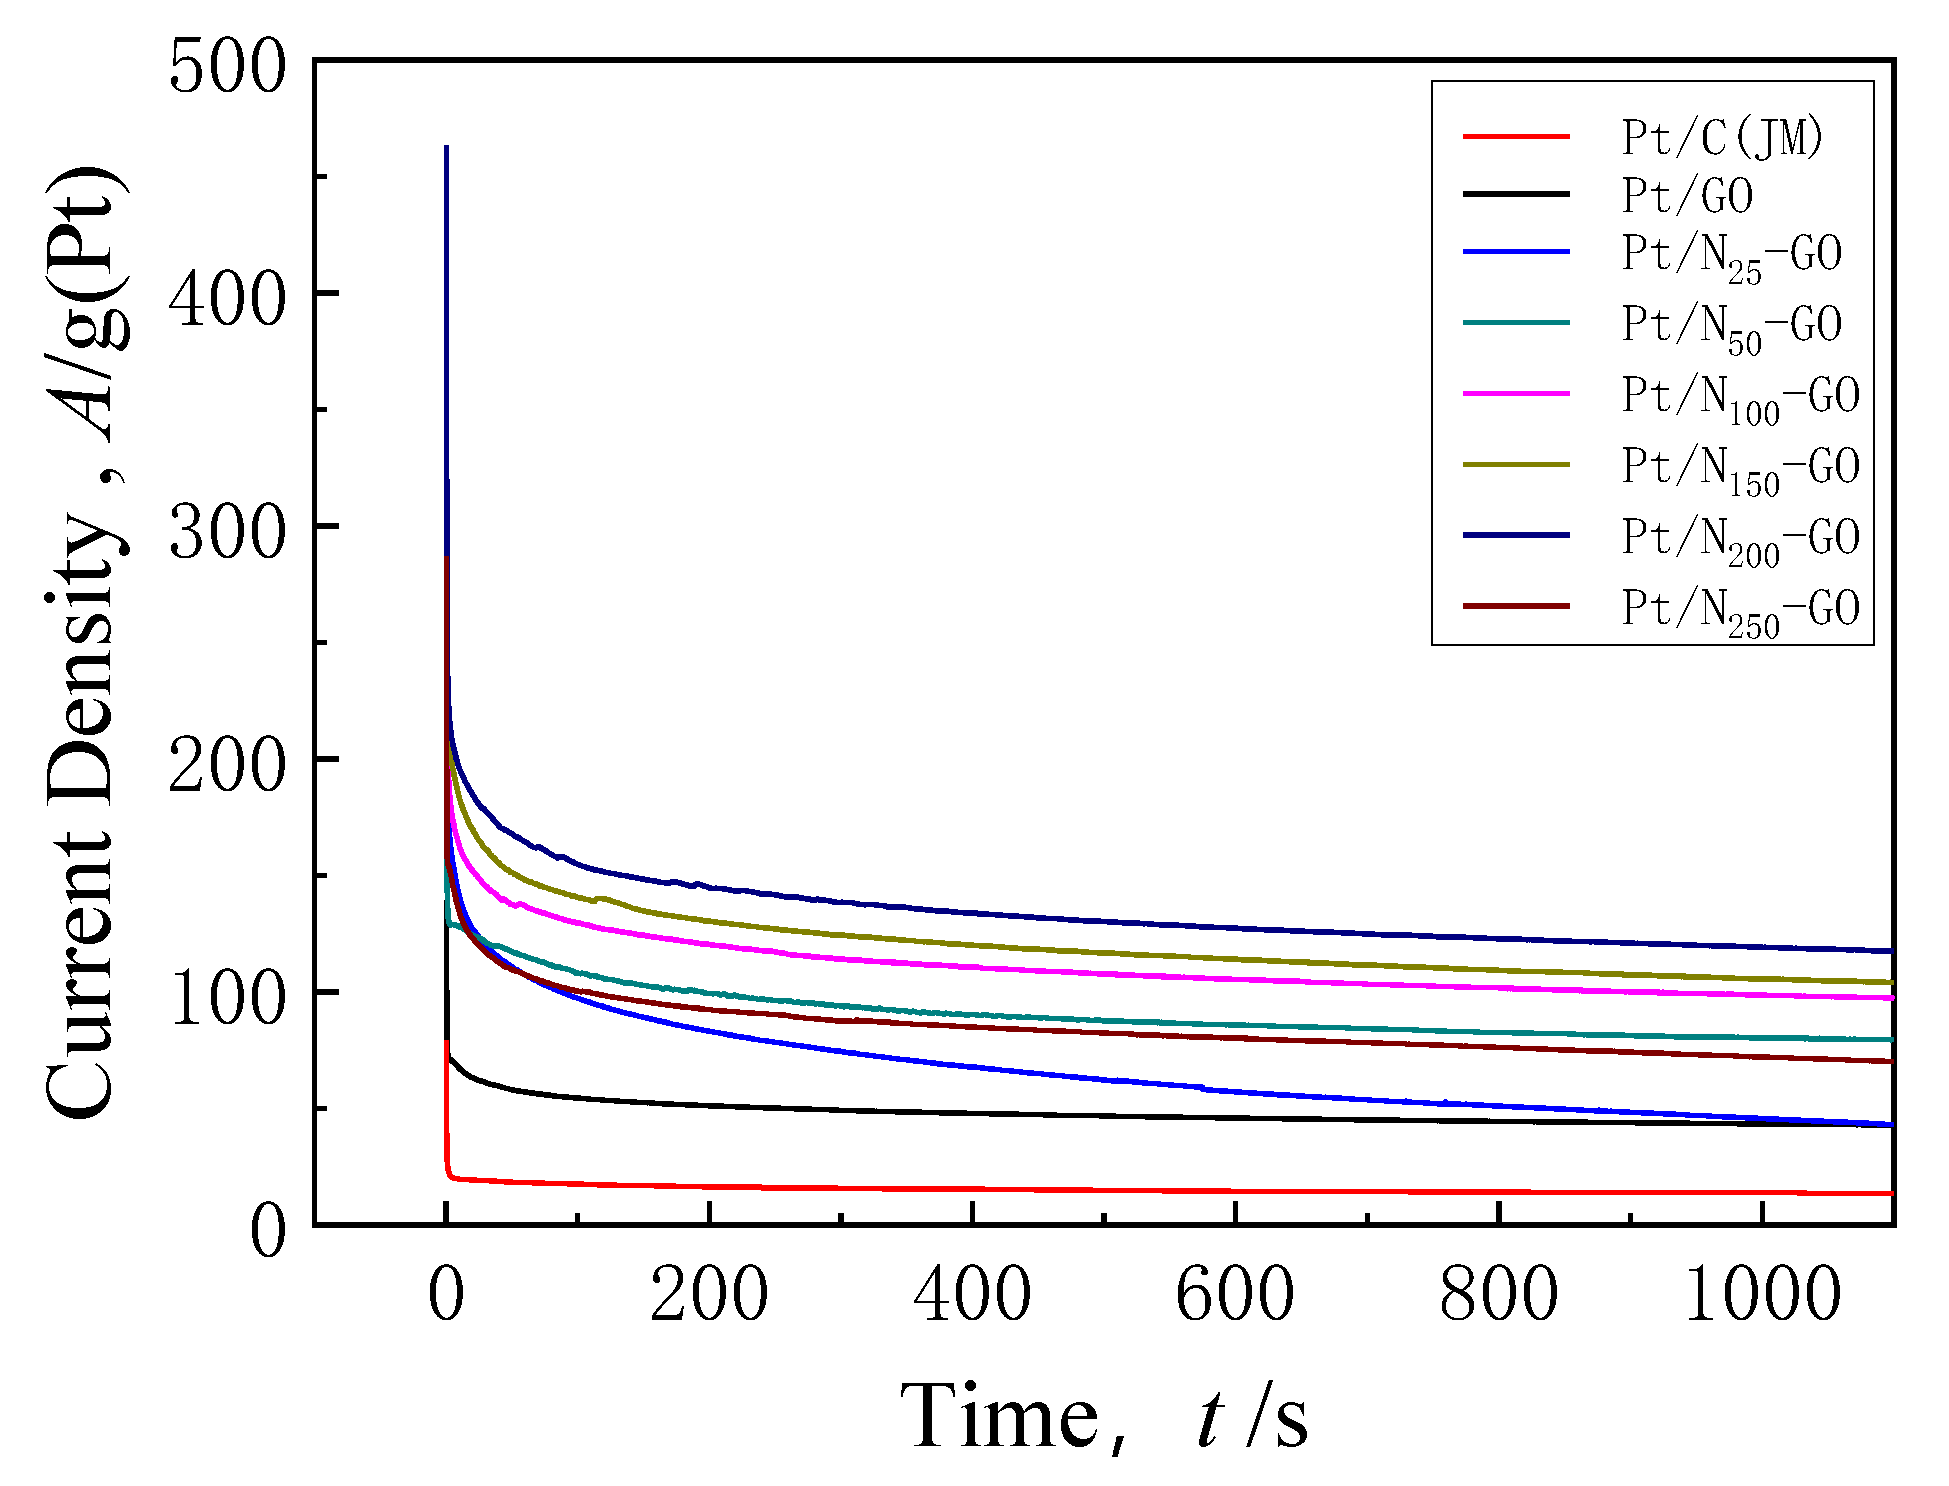
2.7.3. Characterization of the Catalysts via I–t Curves

Chronoamperometry tests were performed to further research the catalytic activity and durability of the catalysts under continuous working conditions. The chronoamperometry curves of the catalysts are shown in Figure 8. The current densities of the catalysts decreased rapidly during the polarization time from 0 s to 100 s, as shown in the figure, as a result of the fact that the catalysts were contaminated by intermediate substances formed during the oxidation of ethanol, such as adsorbed CO. With increasing polarization time, the oxidative desorption and adsorption of intermediate species adsorbed on the surface of Pt tended to reach equilibrium, and the current density tended to be stable. The steady-state current densities of the catalysts at a reaction time of 1000 s are shown in Table 2.
As can be seen, the current densities of the steady state decrease in the following order: Pt/N200-GO > Pt/N150-GO > Pt/N100-GO > Pt/N50-GO > Pt/N250-GO > Pt/N25-GO > Pt/GO > Pt/C(JM), with the steady-state current density of the (GO:NMP = 1:200) catalyst being the highest. The results show that the stability of the nitrogen-doped Pt/GO catalysts is enhanced, probably as a result of the enhanced interactions between the metal and the support material due to nitrogen doping [40]. On the basis of the comprehensive analysis provided in Figure 8, the (GO:NMP = 1:200) catalyst presented the optimal stability and the best performance in the catalytic oxidation of ethanol, which is in agreement with the results of the cyclic voltammetric analysis illustrated in Figure 7.

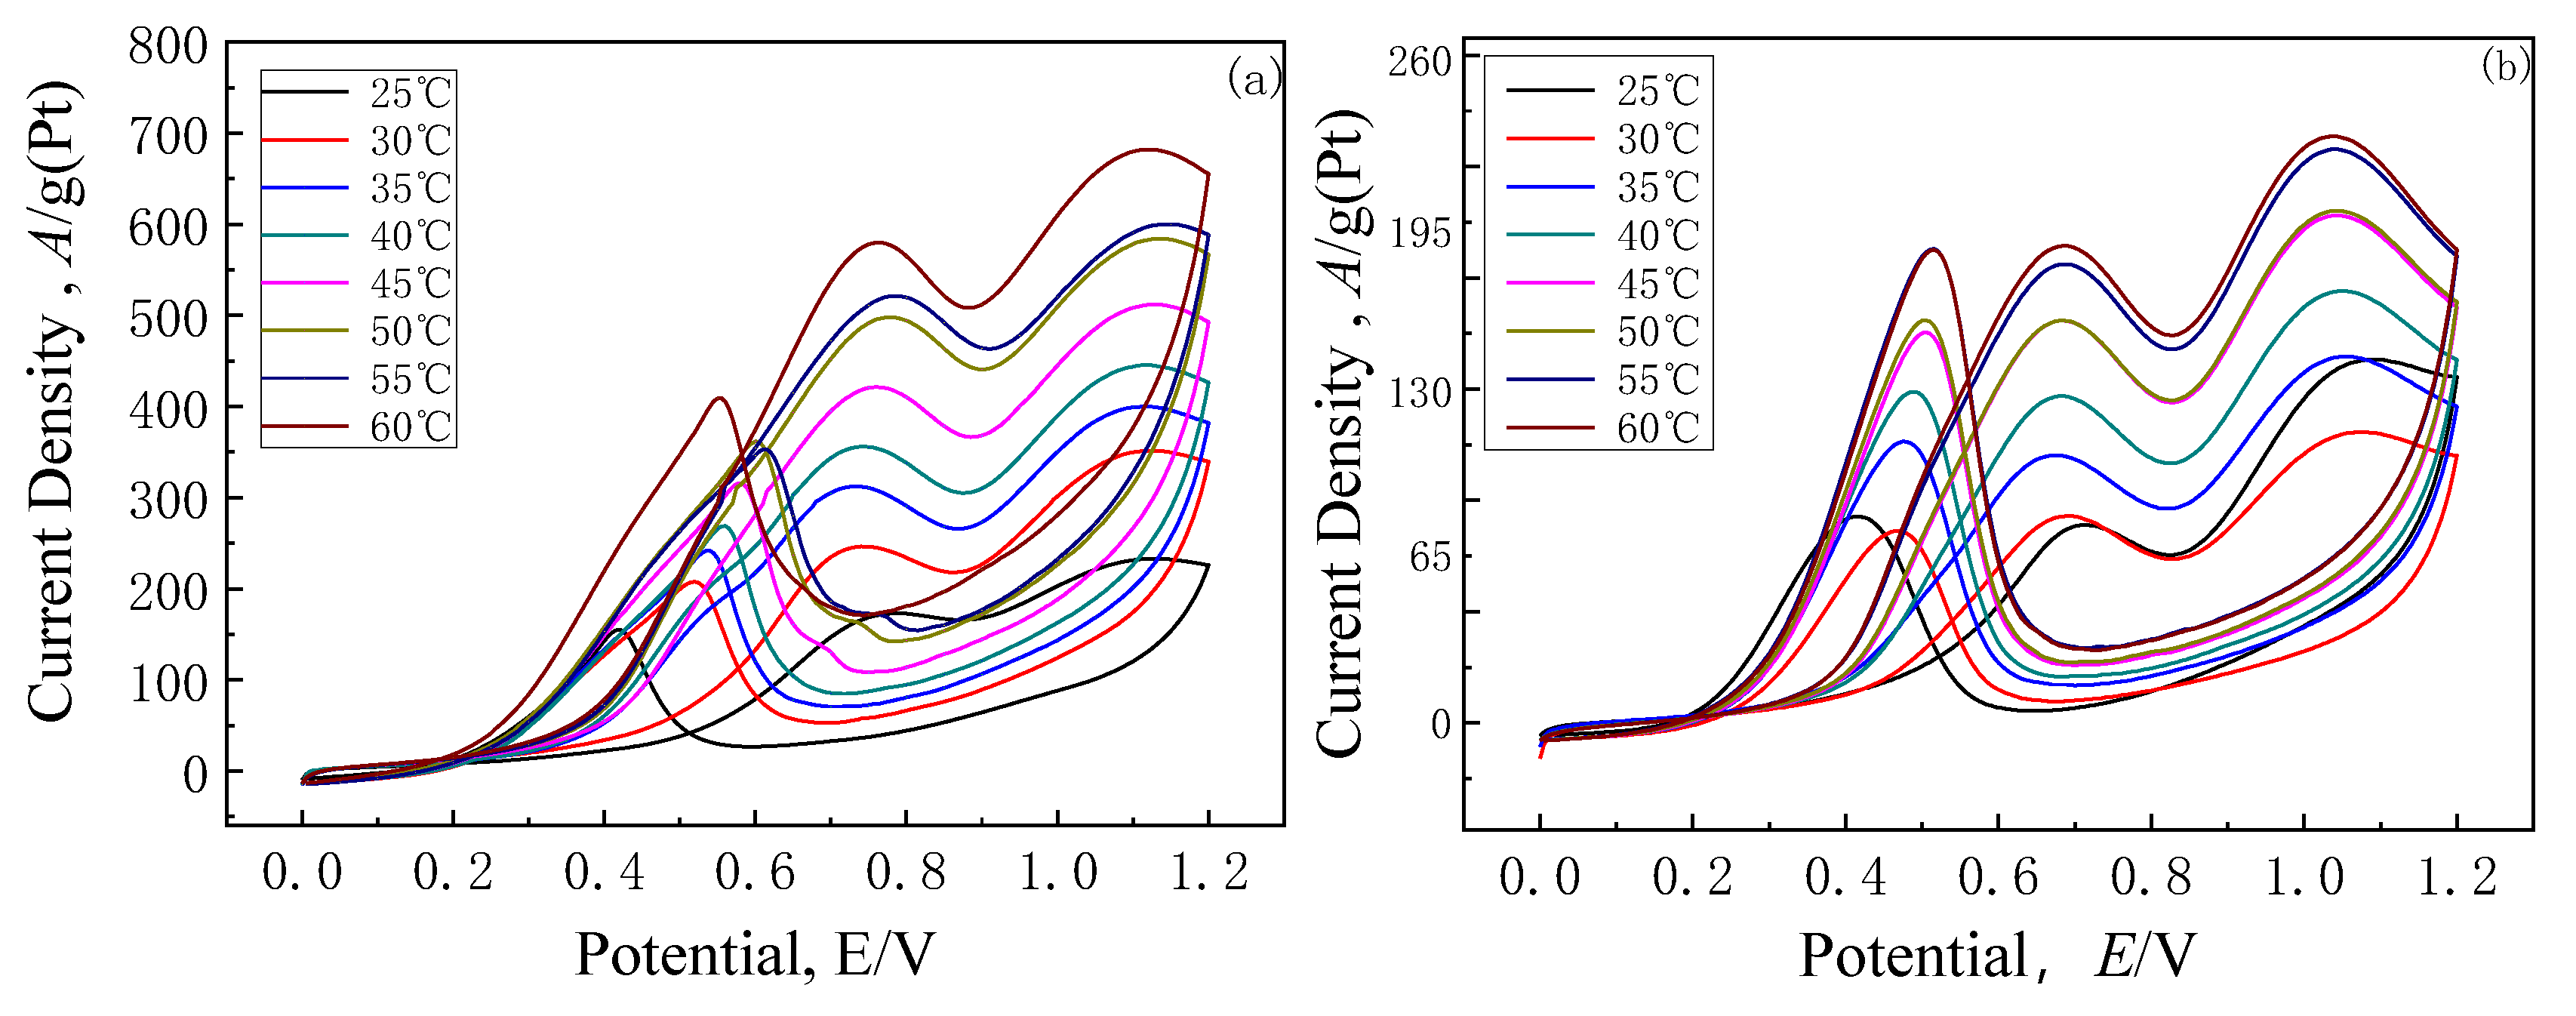
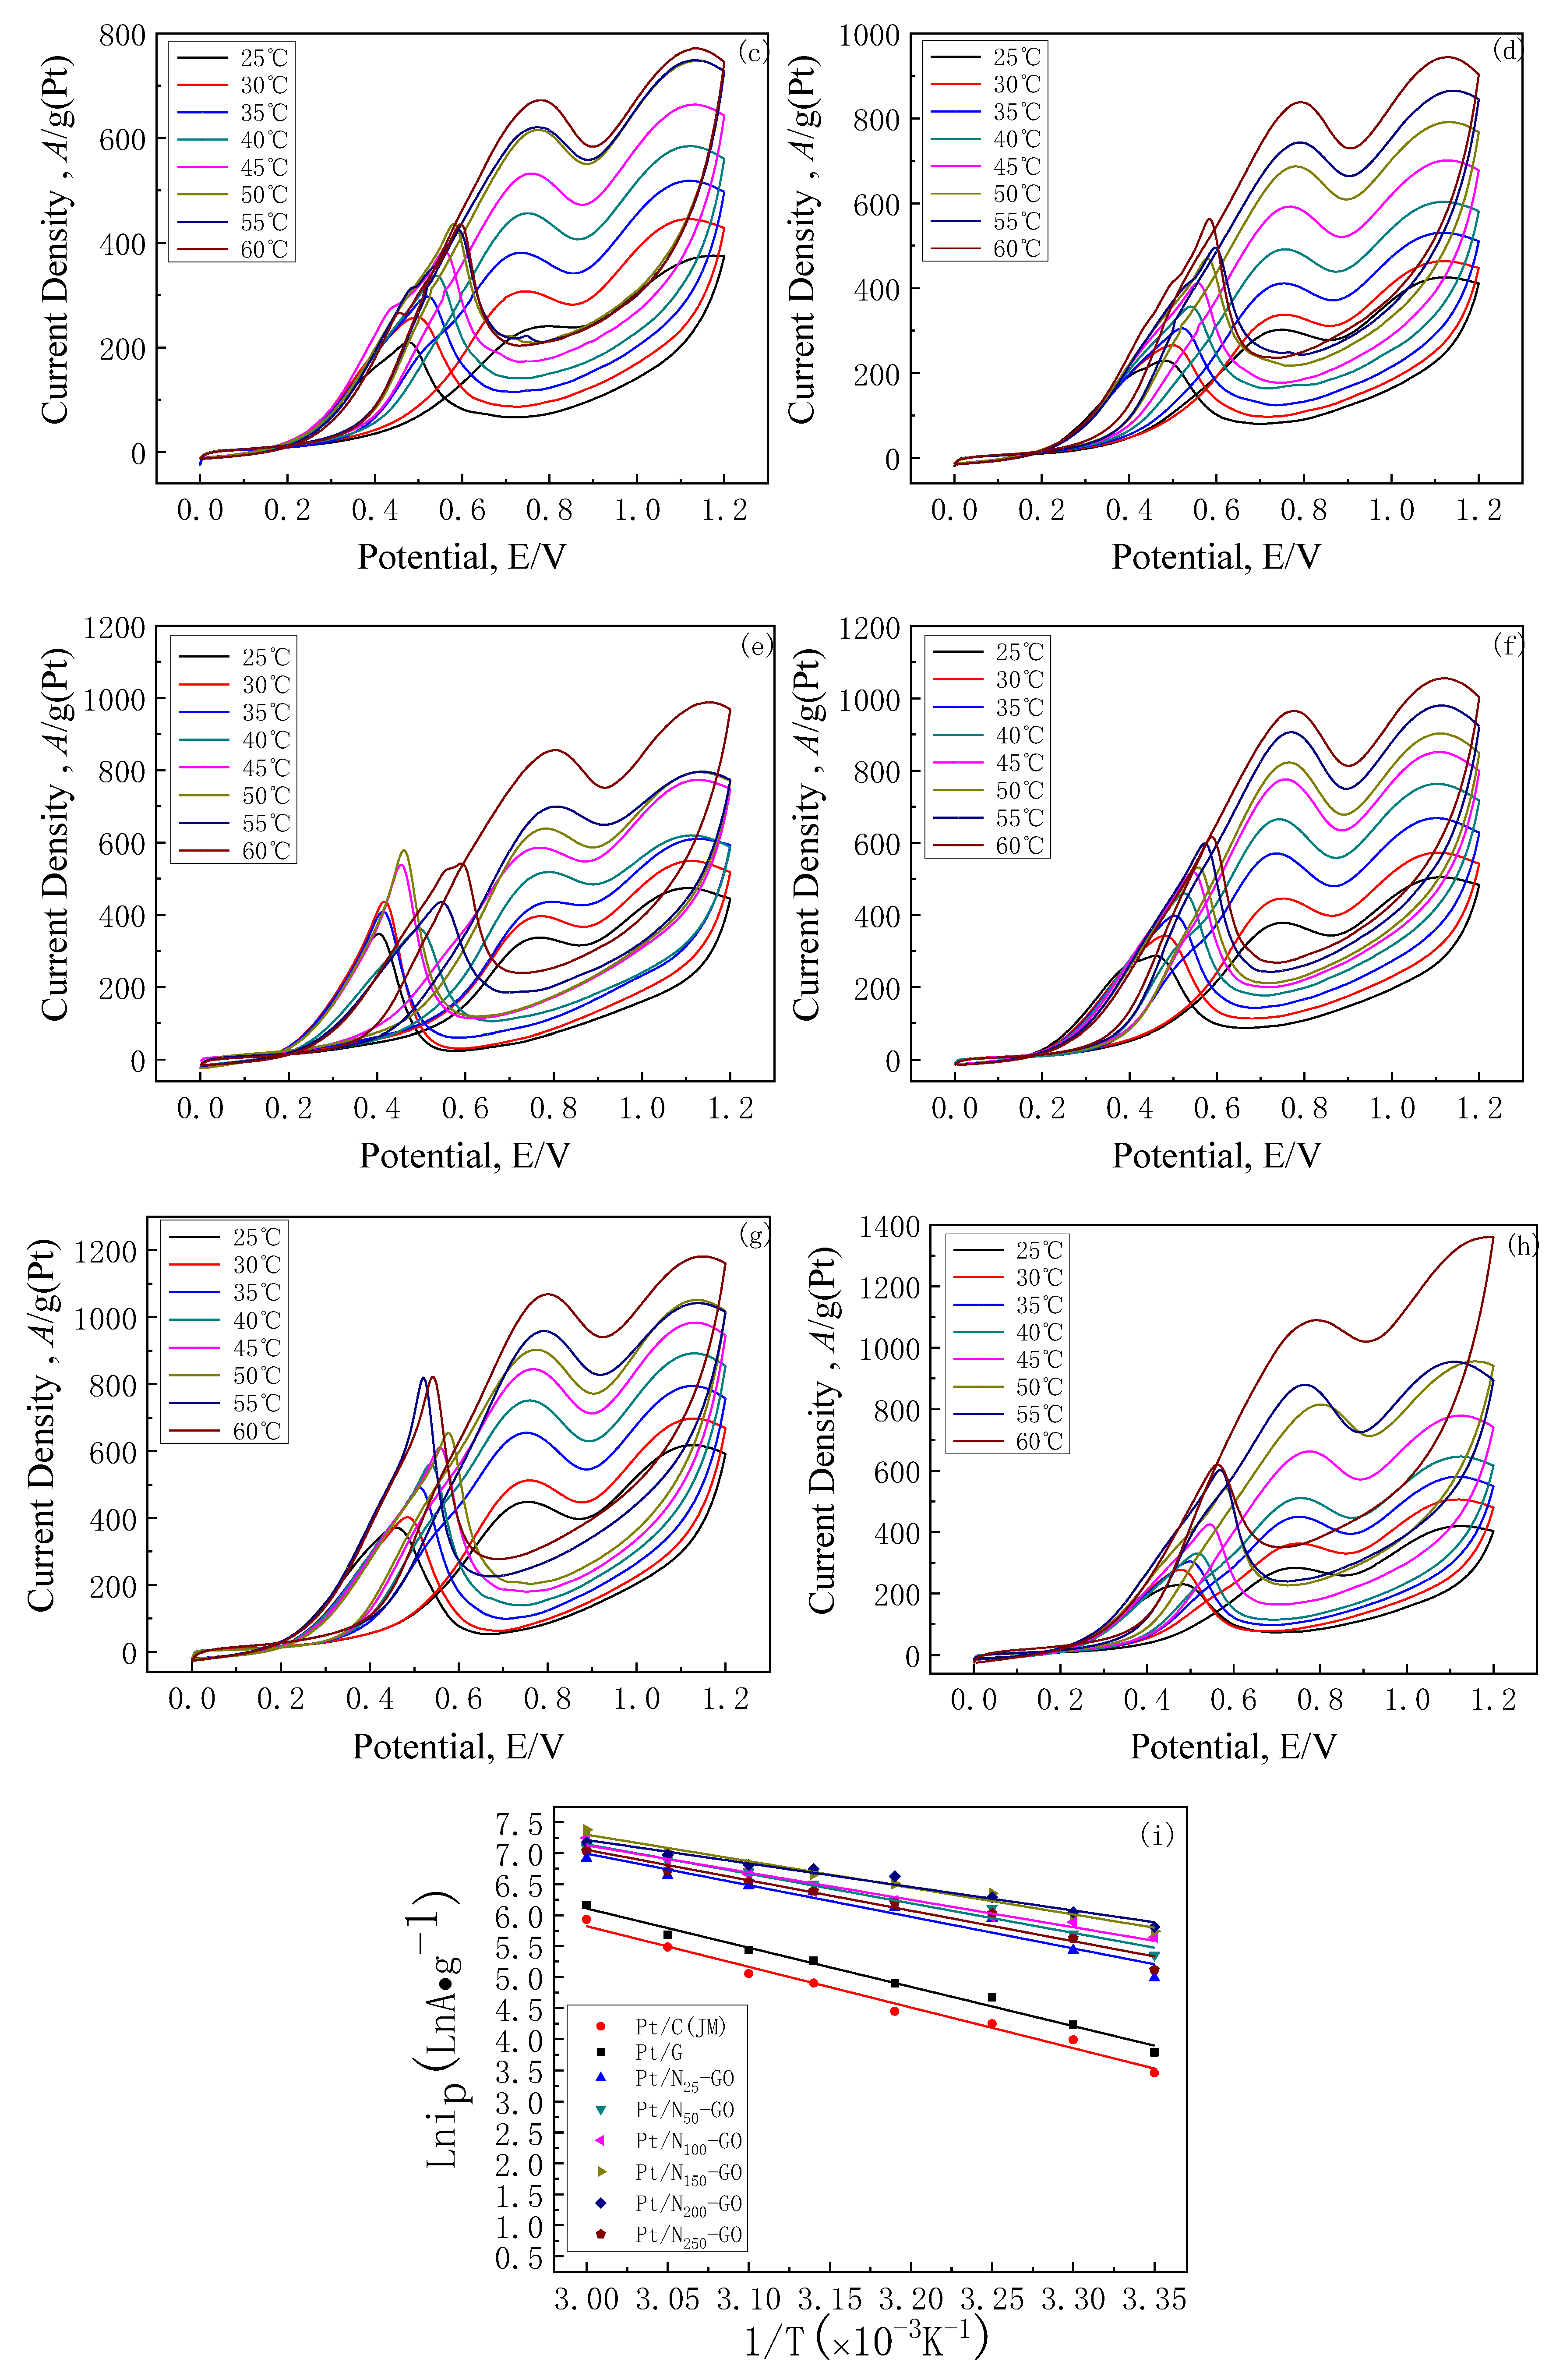
2.7.4. Variable-Temperature Cyclic Voltammetry Testing of the Catalysts and the Arrhenius Equation

To further research the influence of different working temperatures on the catalytic performance of the catalysts, cyclic voltammetry tests were carried out on the catalysts at operating temperatures of 25 °C, 30 °C, 35 °C, 40 °C, 45 °C, 50 °C, 55 °C and 60 °C, respectively. Variable-temperature cyclic voltammograms of the catalysts were obtained, as shown in Figure 9a–h.
According to the Arrhenius equation:
i p = k e x p [ ( W / R ) × ( 1 / T ) ]
Taking the logarithm of both sides of the formula above,
ln ( i p ) = [ ( W / R ) × ( 1 / T ) ] + l n k
After fitting, the slopes of ln(ip) versus 1/T were obtained, and the activation energy W of the catalytic oxidation of ethanol was calculated using the formula k = −W/R, as shown in Figure 9i. The slopes of each sample after fitting were −6.57, −6.33, −5.10, −4.77, −4.41, −4.29, −3.99, and −4.92, respectively, and the activation energies were 54.62 kJ·mol−1, 52.60 kJ·mol−1, 42.42 kJ·mol−1, 39.69 kJ·mol−1, 36.63 kJ·mol−1, 35.71 kJ·mol−1, 31.54 kJ·mol−1, 40.88 kJ·mol−1, respectively. The activation energy of the (GO:NMP = 1:200) catalyst was lower than the value of 33 kJ·mol−1 for the Pt/C catalyst reported previously [41]. In addition, the activation energy of the nitrogen-doped catalysts was clearly lower, and the reaction is more likely to occur in comparison with that of catalyst Pt/C(JM) catalyst. The results show that the activation energy of the (GO:NMP = 1:200) catalyst was the lowest, which is in keeping with the results of the electrochemical measurements described above.

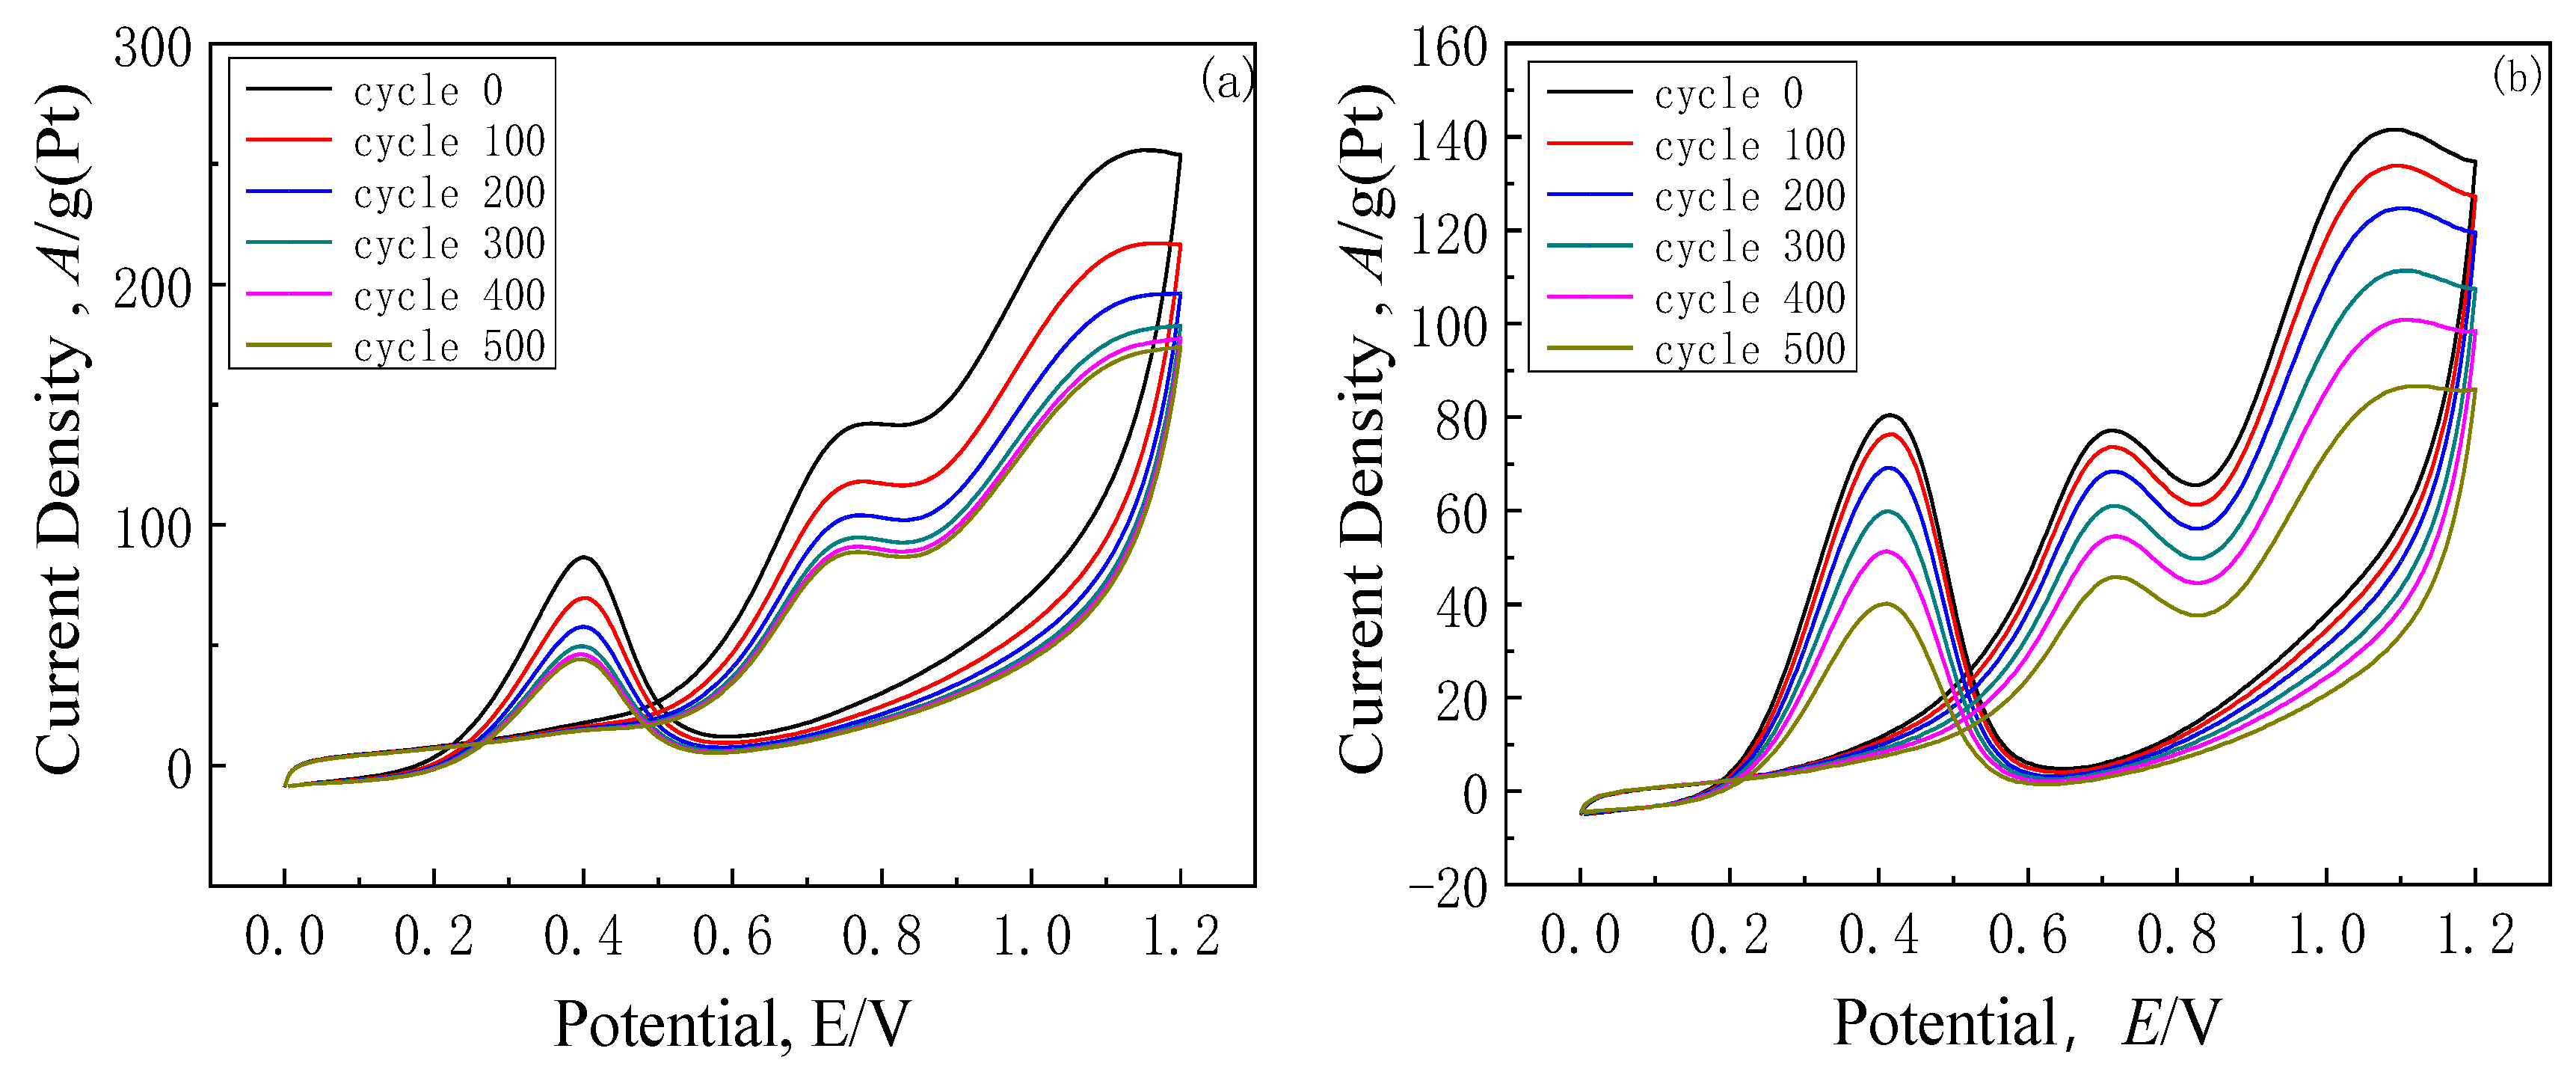
2.7.5. Cyclic Voltammetry Analysis of Degradation of the Catalysts

The stability of a catalyst is also a decisive factor in the practical application of DEFCs. Cyclic voltammograms were used to record the depletion of the catalysts, and these are shown in Figure 10a–h. We studied the stability of the catalysts on the basis of the changes in the peak current density of ethanol oxidation with the number of cycles, as shown in Figure 10i. After 500 cycles, the retention rates of peak current density of ethanol oxidation of catalysts were 59.39%, 62.28%, 66.84%, 69.76%, 71.99%, 77.89%, 82.91% and 68.16%, respectively. These results indicate that the stability of catalysts doped with nitrogen is obviously better than that of Pt/GO and Pt/C(JM) catalysts. This is because the N-containing functional groups on the surface of the graphene supports are able to anchor Pt nanoparticles, inhibiting the migration and aggregation of Pt nanoparticles during multiple cyclic tests, and improving the stability of the catalysts. Meanwhile, it can be seen that catalyst 6# (GO:NMP = 1:200) had the highest retention rate for the peak current density of ethanol oxidation, indicating that it has the best stability.

3. Materials and Methods

3.1. Chemicals

Chloroplatinic acid (H2PtCl6·6H2O, 37.00%), and N-methylpyrrolidone (C5H9NO, 99.70%) were obtained from Sinopharm Chemical Reagent Co., Ltd. (Shanghai, China). Concentrated sulfuric acid (H2SO4, 98.00%) and ethylene glycol (C2H6O2, 99.90%) were obtained from Tianjin Fengchuan Chemical Reagent Co., Ltd. (Tianjin, China). Graphene oxide (C, 99.70%) was obtained from Nanjing Jicang Nano Technology Co., Ltd. (Nanjing, China). Ethanol (CH3CH2OH, 99.70%) was obtained from Beijing Century Tuoxin Fine Chemical Co., Ltd. (Beijing, China). Nafion macromolecule((C7HF13O5S·C2F4)x, 99.70%) was obtained from Alfa Aesar (Shanghai, China). Nitrogen (N2, 99.99%) was obtained from Inner Mongolia Jinghui Gas Chemical Technology Co., Ltd. (Baotou, China), and all the chemicals were of analytical grade. The water used in the experiments was ultrapure water.

3.2. Preparation of Working Electrode

The preparation of the working electrode was performed as follows: the glassy carbon electrode was sequentially ground on a suede polishing cloth with 1.0 μm and 3.0 μm Al2O3 powder until the surface of the electrode was a smooth mirror surface, and then ultrasonically treated successively in water and ethanol. A mixed solution was prepared containing ethanol, water and Nafion with volume fractions of 20.00%, 73.75% and 6.25%, respectively. The slurry was then prepared by mixing 4 mg of catalyst powder into the solution, and the slurry was ultrasonicated for 0.5 h until sufficiently dispersed. Finally, 5 μL of the suspended droplets was dripped onto the working electrode surface using a microsampler, and following drying at 40 °C for 3 h, the preparation was complete.

3.3. Physical Characterization

The transmission electron microscopy (TEM) images were acquired using a JEM-2100 from JEOL (Tokyo, Japan) at an accelerating voltage of 200 KV. The crystalline phase of the catalysts was analyzed by recording their X-ray diffraction (XRD) patterns on a Miniflex600 diffractometer equipped with a Cu-Kαradiation source from Rigaku Corporation (Tokyo, Japan). Raman spectroscopy from Bruker (Karlsruhe, Germany) was used to characterize the structural defects and doping levels in the graphene. The X-ray photoelectron spectroscopy (XPS) data were recorded using an ESCALAB-250 XI with an Al Kα radiator at 5 kV from Thermo Scientific (Massachusetts, United States). Field emission scanning electron microscopy images were acquired using a Sigma-300 at an accelerating voltage of 20 KV from Carl Zeiss (Oberkochen, Germany).

3.4. Electrochemical Measurement Scheme

The electrochemical tests of the catalysts prepared in this paper were carried out using a standard three-electrode system with a platinum wire electrode as a counter electrode, a saturated calomel electrode (3.5 M KCl) as a reference electrode, and an Ivium A1107 electrochemical workstation from IVIUMSTAT (Eindhoven, The Netherlands). The electrochemical tests of the prepared working electrodes were carried out in 0.5 mol/L H2SO4 and 1 mol/L CH3CH2OH + 0.5 mol/L H2SO4 solution. The electrolyte was purified with nitrogen for about 20 min before the test. The electrochemical test method was as follows:
Electrochemical active surface area (ESA): The test electrolyte was 0.5 mol/L H2SO4, the test potential range was −0.3–0.6 V, the test rate was 50 mV/s, and the number of test cycles was 10. After the test, the desorption peak of H in the cyclic voltammetry curve was integrally calculated to obtain the electrochemical active surface area of the catalyst.
Cyclic voltammetry (CV): The test electrolyte was 1 mol/L CH3CH2OH + 0.5 mol/L H2SO4 solution, the test potential range was 0.0–1.2 V, the test rate was 50 mV/s, and the number of test cycles was 10. The catalytic performance of the catalysts for ethanol was evaluated by the current density of the first peak of the cyclic voltammetry curve.
Timed Amperometric Test (I-T): The test electrolyte was 1 mol/L CH3CH2OH + 0.5 mol/L H2SO4 solution, the polarization potential was 0.6 V, and the polarization time was 1100 s. The stability of the catalysts was achieved using a stabilized current.
Variable-temperature cyclic voltammetry test: The test electrolyte was 1 mol/L CH3CH2OH + 0.5 mol/L H2SO4 solution, the test potential range was 0.0–1.2 V, the test rate is 50 mV/s, and the test temperatures were 25 °C, 30 °C, 35 °C, 40 °C, 45 °C, 50 °C, 55 °C and 60 °C. According to the slope obtained from the fitting curve, the activation energy of the catalysts for ethanol catalysis were obtained using the Arrhenius equation, and then the difficulty of the catalysts for ethanol catalytic reaction was investigated.
Degradation cyclic voltammetry: The test electrolyte was 1 mol/L CH3CH2OH + 0.5 mol/L H2SO4 solution, the test potential range was 0.0–1.2 V, the test rate was 50 mV/s, and the number of scan cycles was 500 cycles. At the end of the test, the peak current densities of 100, 200, 300, 400 and 500 cycles and the original oxidation peak current densities of each group of catalysts were collected and plotted, and the peak current density of the catalysts decreased with increasing numbers of scanning cycles, makin it possible to explore the stability of the catalyst in the ethanol reaction process.

4. Conclusions

Taking a modified catalyst carrier as a starting point, nitrogen-doped graphene-supported Pt catalysts were successfully synthesized by microwave-assisted ethylene glycol reduction. The preparation process was simple, efficient, and suitable for production at industrial scale. The characterization of the catalysts revealed that the addition of NMP greatly affected the structure, morphology and electrocatalytic activity of the catalysts. In comparison with the undoped Pt/GO catalysts, the Pt nanoparticles deposited on the surface of the nitrogen-doped graphene exhibited higher dispersion, smaller average particle size, higher electrochemical catalytic activity, lower reaction activation energy, and better durability. The optimal the electrocatalytic activity of the Pt/N-GO catalyst was obtained at a ratio of GO to NMP of 1:200, which was about three times that of the Pt/GO catalyst without nitrogen doping and five times that of the Pt/C(JM) catalyst, indicating that it can be used as an inexpensive, efficient and promising anode catalyst in DEFCs.

Author Contributions

Conceptualization, R.G. and S.A.; methodology, R.G. and N.A.; software, N.A. and J.Z.; validation, N.A. and X.T.; formal analysis, K.C. and L.G.; resources, R.G.; writing-review and editing, R.G. and N.A.; supervision, S.A.; project administration, R.G.; funding acquisition, R.G. All authors have read and agreed to the published version of the manuscript.

Funding

This research was funded by the National Natural Science Foundation of China (51864040, 51974167, 52162010), the Inner Mongolia Autonomous Region Science and Technology Plan Project (2021GG0042, 2019GG264), and the Natural Science Foundation of Inner Mongolia Autonomous Region (2020MS05039).

Data Availability Statement

Not applicable.

Conflicts of Interest

The authors declare no conflict of interest.

References

  1. Xu, G. A comparative study on electrocatalytic performance of PtAu/C and PtRu/C nanoparticles for methanol oxidation reaction. Ionics 2018, 24, 3915–3921. [Google Scholar] [CrossRef]
  2. Lu, Q.; Sun, L.; Zhao, X.; Huang, J.; Han, C.; Yang, X. One-pot synthesis of interconnected Pt95Co5 nanowires with enhanced electrocatalytic performance for methanol oxidation reaction. Nano Res. 2018, 11, 2562–2572. [Google Scholar] [CrossRef]
  3. Wu, T.; Wang, X.; Emre, A.E.; Fan, J.; Min, Y.; Xu, Q.; Sun, S. Graphene-nickel nitride hybrids supporting palladium nanoparticles for enhanced ethanol electrooxidation. J. Energy Chem. 2020, 55, 48–54. [Google Scholar] [CrossRef]
  4. Yang, D.; Gu, J.; Liu, X.; He, H.; Wang, M.; Wang, P.; Zhu, Y.; Fan, Q.; Huang, R. Monodispersed Pt3Ni Nanoparticles as a Highly Efficient Electrocatalyst for PEMFCs. Catalysts 2019, 9, 588. [Google Scholar] [CrossRef] [Green Version]
  5. Ma, T.; Zhang, M.; Liu, H.; Wang, Y.; Pan, D. Synthesis of novel three-dimensional mesoporous nitrogen doped graphene supported Pt nanoparticles as superior catalyst for hydrogen generation. Int. J. Hydrogen Energy 2018, 43, 19327–19335. [Google Scholar] [CrossRef]
  6. Hu, J.; Kuttiyiel, K.; Sasaki, K.; Su, D.; Yang, T.; Park, G.; Zhang, C.; Chen, G.; Adzic, R. Pt Monolayer Shell on Nitrided Alloy Core—A Path to Highly Stable Oxygen Reduction Catalyst. Catalysts 2015, 5, 1321–1332. [Google Scholar] [CrossRef]
  7. Peng, Y.; Li, L.; Tao, R.; Tan, L.; Qiu, M.; Guo, L. One-pot synthesis of Au@Pt star-like nanocrystals and their enhanced electrocatalytic performance for formic acid and ethanol oxidation. Nano Res. 2018, 11, 3222–3232. [Google Scholar] [CrossRef]
  8. Auer, E.; Freund, P.A.; Pietsch, J.; Tacke, T. Carbons as supports for industrial precious metal catalysts. Appl. Catal. A Gen. 2010, 30, 259–271. [Google Scholar] [CrossRef]
  9. Zhou, Z.; Huang, Z.; Chen, D.; Wang, Q.; Tian, N.; Sun, S. High-Index Faceted Platinum Nanocrystals Supported on Carbon Black as Highly Efficient Catalysts for Ethanol Electrooxidation. Angew. Chem. Int. Ed. 2010, 49, 411–414. [Google Scholar] [CrossRef] [Green Version]
  10. Bruno, M.M.; Petruccelli, M.A.; Viva, F.A.; Corti, H.R. Mesoporous carbon supported PtRu as anode catalyst for direct methanol fuel cell: Polarization measurements and electrochemical impedance analysis of mass transport. Int. J. Hydrogen Energy 2013, 38, 4116–4123. [Google Scholar] [CrossRef]
  11. Qiao, M.; Wang, Y.; Li, L.; Hu, G.; Zou, G.; Mamat, X.; Dong, M.; Hu, X. Self-templated nitrogen-doped mesoporous carbon decorated with double transition-metal active sites for enhanced oxygen electrode catalysis. Rare Met. 2019, 39, 824–833. [Google Scholar] [CrossRef]
  12. Chu, D.; Wang, J.; Wang, S.; Zha, L.; He, J.; Hou, Y.; Yan, Y.; Lin, H.; Tian, Z. High activity of Pd-In2O3/CNTs electrocatalyst for electro-oxidation of ethanol. Catal. Commun. 2009, 10, 955–958. [Google Scholar] [CrossRef]
  13. Yi, Q.; Sun, L. In situ synthesis of palladium nanoparticles on multi-walled carbon nanotubes and their electroactivity for ethanol oxidation. Rare Met. 2013, 32, 586–591. [Google Scholar] [CrossRef]
  14. Guo, R.; Zhang, J.; Zhou, G.; An, S.; Mo, Y. Preparation and Characterization of Pt-CeO2/C as Catalyst for Direct Ethanol Fuel Cell. Rare Metal. Mater. Eng. 2018, 47, 383–388. [Google Scholar]
  15. Xin, Y.; Liu, J.; Zhou, Y.; Liu, W.; Gao, J.; Xie, Y.; Yin, Y.; Zou, Z. Preparation and characterization of Pt supported on graphene with enhanced electrocatalytic activity in fuel cell. J. Power Sources 2011, 196, 1012–1018. [Google Scholar] [CrossRef]
  16. Dresselhaus, M.S.; Araujo, P.T. Perspectives on the 2010 Nobel Prize in Physics for Graphene. J. ACS Nano 2010, 4, 6297–6302. [Google Scholar] [CrossRef] [PubMed]
  17. Geim, A.K.; Novoselov, K.S. The rise of graphene. Nat. Mater. 2007, 6, 183–190. [Google Scholar] [CrossRef]
  18. Stankovich, S.; Dikin, D.A.; Dommett, G.H.B.; Kohlhaas, K.M.; Zimney, E.J.; Stach, E.A.; Piner, R.D.; Ruoff, R.S. Graphene-Based Composite Materials. Nature 2006, 442, 282–286. [Google Scholar] [CrossRef]
  19. Liu, S.; Wang, J.; Zeng, J.; Ou, J.; Li, Z.; Liu, X.; Yang, S. “Green” electrochemical synthesis of Pt/graphene sheet nanocomposite film and its electrocatalytic property. J. Power Sources 2010, 195, 4628–4633. [Google Scholar] [CrossRef]
  20. Pylypenko, S.; Queen, A.; Olson, T.S.; Dameron, A.; O’Neill, K.; Neyerlin, K.C.; Pivovar, B.; Dinh, H.N.; Ginley, D.S.; Gennett, T.; et al. Tuning Carbon-Based Fuel Cell Catalyst Support Structures via Nitrogen Functionalization. I. Investigation of Structural and Compositional Modification of Highly Oriented Pyrolytic Graphite Model Catalyst Supports as a Function of Nitrogen Implantation Dose. J. Phys. Chem. C 2011, 115, 13667–13675. [Google Scholar]
  21. Jiao, C.; Sun, H.B.; Zhang, L.; Zhao, S.; Pang, G.; Lu, S. A high-performance lithium anode based on N-doped composite graphene. Rare Met. 2019, 1–7. [Google Scholar] [CrossRef]
  22. Jung, W.S. Enhanced Performance of Pt Nanoparticles on Ni-N Co-Doped Graphitized Carbon for Oxygen Reduction Reaction in Polymer Electrolyte Membrane Fuel Cells. Catalysts 2021, 11, 909. [Google Scholar] [CrossRef]
  23. Xiong, B.; Zhou, Y.; Zhao, Y.; Wang, J.; Chen, X.; O’Hayre, R.; Shao, Z. The use of nitrogen-doped graphene supporting Pt nanoparticles as a catalyst for methanol electrocatalytic oxidation. Carbon 2013, 52, 181–192. [Google Scholar] [CrossRef]
  24. Sun, Y.; Zhou, T.; Pan, Q.; Zhang, X.; Guo, J. PtFe/nitrogen-doped graphene for high-performance electrooxidation of formic acid with composition sensitive electrocatalytic activity. J. Rsc. Adv. 2015, 5, 60237–60245. [Google Scholar] [CrossRef]
  25. Shao, Y.; Zhang, S.; Engelhard, M.H.; Li, G.; Shao, G.; Wang, Y.; Liu, J.; Aksay, I.A.; Lin, Y. Nitrogen-doped graphene and its electrochemical applications. J. Mater. Chem. 2010, 20, 7491–7496. [Google Scholar] [CrossRef]
  26. Li, X.; Wang, H.; Robinson, J.; Sanchez, H.; Diankov, G.; Dai, H. Simultaneous nitrogen doping and reduction of graphene oxide. J. Am. Chem. Soc. 2009, 131, 15939–15944. [Google Scholar] [CrossRef] [PubMed] [Green Version]
  27. Panchokarla, L.S.; Subrahmanyam, K.S.; Saha, S.K.; Govindaraj, A.; Krishnamurthy, H.R.; Waghmare, U.V.; Rao, C.N.R. Synthesis, Structure, and Properties of Boron- and Nitrogen-Doped Graphene. Adv. Mater. 2009, 21, 4726–4730. [Google Scholar] [CrossRef]
  28. Viet, H.P.; Tran, V.C.; Hur, S.H.; Oh, E.; Kim, E.J.; Shin, E.W.; Chung, J.S. Chemical functionalization of graphene sheets by solvothermal reduction of a graphene oxide suspension in N-methyl-2-pyrrolidone. J. Mater. Chem. 2011, 21, 3371–3377. [Google Scholar]
  29. Zhu, J.; Xiao, M.; Zhao, X.; Li, K.; Liu, C.; Xing, W. Nitrogen-doped carbon-graphene composites enhance the electrocatalytic performance of the supported Pt catalysts for methanol oxidation. Chem. Commun. 2014, 50, 12201–12203. [Google Scholar] [CrossRef]
  30. Xu, X.; Zhou, Y.; Lu, J.; Tian, X.; Zhu, H.; Liu, J. Single-step synthesis of PtRu/N-doped graphene for methanol electrocatalytic oxidation. Electrochim. Acta 2014, 120, 439–451. [Google Scholar] [CrossRef]
  31. Wang, H.; Maiyalagan, T.; Wang, X. Review on Recent Progress in Nitrogen-Doped Graphene: Synthesis, Characterization, and Its Potential Applications. ACS Catal. 2012, 2, 781–794. [Google Scholar] [CrossRef]
  32. Yang, G.; Li, Y.; Rana, R.K.; Zhu, J. Pt-Au/nitrogen-doped graphene nanocomposites for enhanced electrochemical activities. J. Mater. Chem. A 2013, 1, 1754–1762. [Google Scholar] [CrossRef]
  33. Zhou, D.; Han, B.H. Graphene-Based Nanoporous Materials Assembled by Mediation of Polyoxometalate Nanoparticles. Adv. Funct. Mater. 2010, 20, 2717–2722. [Google Scholar] [CrossRef]
  34. Zhang, L.; Liang, X.; Song, W.; Wu, Z. Identification of the nitrogen species on N-doped graphene layers and Pt/NG composite catalyst for direct methanol fuel cell. Phys. Chem. Chem. Phys. 2010, 12, 12055–12059. [Google Scholar] [CrossRef] [PubMed]
  35. Lu, L.; Nie, Y.; Wang, Y.; Wu, G.; Li, L.; Li, J.; Qi, X.; Wei, Z. Preparation of highly dispersed carbon supported AuPt nanoparticles via a capping agent-free route for efficient methanol oxidation. J. Mater. Chem. A. Mater. Energy Sustain. 2018, 6, 104–109. [Google Scholar] [CrossRef]
  36. Hitmi, H.; Belgsir, E.M.; Leger, J.; Lamy, C.; Lezna, R. A kinetic analysis of the electro-oxidation of ethanol at a platinum electrode in acid medium. Electrochim. Acta 1994, 39, 407–415. [Google Scholar] [CrossRef]
  37. Iwasita, T.; Pastor, E.J.E.A. A dems and FTir spectroscopic investigation of adsorbed ethanol on polycrystalline platinum. Electrochim. Acta 1994, 39, 531–537. [Google Scholar] [CrossRef]
  38. Yu, S.; Liu, Q.; Yang, W.; Han, K.; Wang, Z.; Zhu, H. Graphene-CeO2 hybrid support for Pt nanoparticles as potential electrocatalyst for direct methanol fuel cells. Electrochim. Acta 2013, 94, 245–251. [Google Scholar] [CrossRef]
  39. Zhou, Y.; Pasquarelli, R.; Holme, T.; Berry, J.; Ginley, D.; O’Hayre, R. Improving PEM fuel cell catalyst activity and durability using nitrogen-doped carbon supports: Observations from model Pt/HOPG systems. J. Mater. Chem. 2009, 19, 7830–7838. [Google Scholar] [CrossRef]
  40. Zhou, Y.; Holme, T.; Berry, J.; Ohno, T.R.; Ginley, D.; O’Hayre, R. Dopant-Induced Electronic Structure Modification of HOPG Surfaces: Implications for High Activity Fuel Cell Catalysts. J. Phys. Chem. C 2010, 114, 506–515. [Google Scholar] [CrossRef]
  41. Lee, C.G.; Itoh, T.; Mohamedi, M.; Umeda, M.; Uchida, I.; Lima, H.C. Temperature effect on methanol and ethanol electrooxidation at Pt/C and Pt-Ru/C microporous electrodes. Electrochemistry 2003, 71, 549–554. [Google Scholar] [CrossRef] [Green Version]
Figure 1. TEM images of catalyst samples with insets showing the particle size distribution histograms: (a) 1#; (b) 2#; (c) 3#; (d) 4#; (e) 5#; (f) 6#; (h) 7#; (g) high-resolution TEM image of 6# with inset showing the electron diffraction pattern of the selected area.
Catalysts 11 01264 g001
Figure 2. XRD patterns of the seven groups of catalysts.
Catalysts 11 01264 g002
Figure 3. Raman spectra of catalysts 1# and 6#.
Catalysts 11 01264 g003
Figure 4. XPS spectra of catalyst 1#: (a) C 1s; (c) Pt 4f; XPS spectra of catalyst 6#: (b) C 1s; (d) Pt 4f; (e) N 1s.
Catalysts 11 01264 g004aCatalysts 11 01264 g004b
Figure 5. (a) SEM image; (be) plane scan analysis; (f,g) EDS analysis from (a) of catalyst 6#.
Catalysts 11 01264 g005
Figure 6. Cyclic voltammetric curves of catalysts in 0.5 mol/L H2SO4 solution.
Catalysts 11 01264 g006
Figure 7. (a) Cyclic voltammograms recorded for the catalysts in a solution of 1 mol/L CH3CH2OH and 0.5 mol/L H2SO4. (b) Histogram of mass activity and specific activity of each group of catalysts.
Catalysts 11 01264 g007
Figure 8. It curves recorded for the catalysts in a solution of 1 mol/L CH3CH2OH and 0.5 mol/L H2SO4.
Catalysts 11 01264 g008
Figure 9. Variable-temperature cyclic voltammograms recorded for the catalysts: (a) Pt/C(JM), (b) Pt/GO, (c) Pt/N25-GO, (d) Pt/N50-GO, (e) Pt/N100-GO, (f) Pt/N150-GO, (g) Pt/N200-GO, (h) Pt/N250-GO; (i) Arrhenius curves of catalysts.
Catalysts 11 01264 g009aCatalysts 11 01264 g009b
Figure 10. Cyclic voltammograms recorded during depletion of the catalysts: (a) Pt/C(JM), (b) Pt/GO, (c) Pt/N25-GO, (d) Pt/N50-GO, (e) Pt/N100-GO, (f) Pt/N150-GO, (g) Pt/N200-GO, (h) Pt/N250-GO; (i) changes in the peak current density during ethanol oxidation as a function of the number of cycles.
Catalysts 11 01264 g010aCatalysts 11 01264 g010bCatalysts 11 01264 g010c
Table 1. XPS data and possible chemical compositions and states of N and Pt in the seven catalysts.
SampleElemental Content (at%)N-Containing Functional Groups (BE, eV)
CNOPtPyridinic N (%)
398.3
Amino N (%)
399.4
Graphitic N (%)
401.1
1#: Pt/GO83.44-14.881.67---
2#: Pt/N25-O82.980.5615.141.3232.2136.9230.87
3#: Pt/N50-GO82.710.7315.111.4532.9740.4326.60
4#: Pt/N100-GO81.010.9816.121.8928.6646.6124.73
5#: Pt/N150-GO80.581.6215.622.1831.1545.2723.58
6#: Pt/N200-GO80.232.2715.062.4434.4548.9816.57
7#: Pt/N250-GO78.833.2515.951.9729.6756.2714.06
Pt species/(BE, eV)
Pt0 4f7/2 (%)
71.4
Pt0 4f5/2 (%)
74.6
Pt2+ (%)
72.8
Pt2+ (%)
76.3
1#: Pt/GO30.7928.9819.5520.68
2#: Pt/N25-GO34.2728.5521.5615.62
3#: Pt/N50-GO33.0732.1419.8714.92
4#: Pt/N100-GO35.5134.9915.9013.60
5#: Pt/N150-GO37.4734.7412.7115.08
6#: Pt/N200-GO39.7933.8416.0210.35
7#: Pt/N250-GO35.5827.9620.8815.58
Table 2. Electrochemical activity of Surface area, peak current densities and steady-state current densities recorded for the catalysts.
SampleSEA
(m2/g)
Peak Current Density
(A g‒1)
Steady-State Current Density
(A g‒1)
Pt/C(JM)17.677.213.8
1#: Pt/GO25.2142.243.3
2#: Pt/N25-GO27.69240.545.7
3#: Pt/N50-GO34.91302.380.2
4#: Pt/N100-GO37.81343.198.8
5#: Pt/N150-GO40.91378.3105.7
6#: Pt/N200-GO45.97445.1119.1
7#: Pt/N250-GO30.12283.772.1
Publisher’s Note: MDPI stays neutral with regard to jurisdictional claims in published maps and institutional affiliations.

