Article

Figures of Merit for Photocatalysis: Comparison of NiO/La-NaTaO3 and Synechocystis sp. PCC 6803 as a Semiconductor and a Bio-Photocatalyst for Water Splitting

1
Institute of Chemical Technology, Universität Leipzig, 04103 Leipzig, Germany
2
Department Solar Materials, Helmholtz Centre for Environmental Research—UFZ, 04318 Leipzig, Germany
*
Author to whom correspondence should be addressed.
Submission received: 30 October 2021 / Revised: 13 November 2021 / Accepted: 17 November 2021 / Published: 22 November 2021
(This article belongs to the Special Issue 10th Anniversary of Catalysts—Feature Papers in Photocatalysis)

Abstract

:
While photocatalysis is considered a promising sustainable technology in the field of heterogeneous catalysis as well as biocatalysis, figures of merit (FOM) for comparing catalytic performance, especially between disciplines, are not well established. Here, photocatalytic water splitting was conducted using a semiconductor (NiO/La-NaTaO3) and a bio-photocatalyst (Synechocystis sp. PCC 6803) in the same setup under similar reaction conditions, eliminating the often ill-defined influence of the setup on the FOMs obtained. Comparing the results enables the critical evaluation of existing FOMs and a quantitative comparison of both photocatalytic systems. A single FOM is insufficient to compare the photocatalysts, instead a combination of multiple FOMs (reaction rate, photocatalytic space time yield and a redefined apparent quantum yield) is superior for assessing a variety of photocatalytic systems.

1. Introduction

The ever-growing energy demand, in combination with the use of fossil resources, is one of the major driving forces for climate change [1,2,3]. Solar energy is an ideal replacement for fossil fuels [4,5,6], and several technologies have been developed so far [7,8,9]. Among these, photocatalysis is one of the simplest and most straightforward approaches. Using water as a reactant, H2 can be obtained from the photocatalytic water splitting reaction [10]. Besides, photocatalysts can be used in a wide range of applications to tackle problems important to society and environment, e.g., air [11,12] and water purification [13,14], organic pollutant degradation [15,16], or bacterial disinfection [17,18].
Both bio-based photocatalysts [19,20,21] and semiconductor photocatalysts [22,23,24] can be applied in photocatalytic water splitting. In this respect, cyanobacteria possess superior photosynthetic capabilities and can convert up to 10% of the sun’s energy into biomass as compared to 1% for conventional crops [25]. Therefore, this results in an estimated 5–12% of the global net primary production of the earth [26]. The unicellular, freshwater cyanobacterium Synechocystis sp. PCC 6803 (hereafter called Synechocystis) has become one of the most popular model organisms among cyanobacteria and is as such used as a representative bio-photocatalyst studied in this work [27,28,29].
Amongst the semiconductor photocatalysts capable of photocatalytic water splitting NaTaO3 is one of the most active. However, without any modifications, only a low activity (H2 evolution rate ~4 μmol h−1) is observed [30]. By doping with lanthanum [31,32,33], in combination with NiO as an additional cocatalyst [31,34], one of the most active photocatalysts for overall water splitting with a H2 evolution rate, however related to mass, of 19.8 mmol h−1 g−1 [32] and a quantum efficiency (QE) of up to 50% [31] has been obtained.
To objectively and unambiguously compare processes with biological and semiconductor photocatalysts, figures of merit (FOM) are needed as well as a standardized way to conduct experiments and to report experimental data (e.g., light intensities and light qualities). In this respect, the field of photocatalysis still shows some weakness, as photocatalytic data are often not reported in a standardized way [35,36,37,38]. In addition, the experimental setups used are often rather different, as these are usually custom designs, built by the respective research groups [37]. Also, the commercial availability of widely accepted reference catalysts, that can be used to evaluate these setups, are mainly limited to TiO2 in form of P25 [39,40], even though efforts to establish other reference catalysts have been made in the past [41,42].
An overview of the relevant FOMs reported in the literature, with the respective advantages, drawbacks, and applicability to bio-photocatalysts, is shown in Table 1, divided into material- and light-based quantities according to the work of Habisreutinger et al. [37]. The displayed FOMs have recently been reviewed by Muhammad and Takanabe [43], Melchionna and Fornasiero [39] as well as Sundar and Kanmani [44].
In photocatalysis, particularly involving heterogeneous reaction systems or solid catalysts, there are also other experimental factors (illuminated area, intensity, spectrum, light path) and material properties (absorption coefficient, catalyst concentration) which have to be considered and make the discussion about the suitability and applicability of FOMs more complex [50,53]. This was discussed in detail by Kisch and Bahnemann [50], who showed that the rate constant, in contrast to conventional “thermal” catalysis, cannot be considered as constant. Therefore, they concluded that the quantum yield (QY) must be included in comparison of photocatalysts, as only this could account for changing conditions of light absorption and scattering in a given photocatalyst suspension. However, as several publications [39,43,46] have already pointed out, the main problem within heterogeneous photocatalysis is the reliable measurement of the amount of absorbed photons due to scattering and reflection by the solid photocatalyst, especially when present as particles. This also applies to the quantum efficiency (QE).
Therefore, the apparent quantum yield (AQY) and photonic efficiency (PE) were introduced. However, both AQY and PE again do not take reflection and light scattering by the setup and the reaction solution into account [50]. One possibility to mitigate this problem is the use of well-defined reaction conditions, including the use of a commercially available and uniform light source like a solar simulator equipped with an AM 1.5 G light filter, to allow for comparability despite the aforementioned problems [43,46,54,55]. Melchionna and Fornasiero [39] added that reporting of AQY for single wavelengths might be misleading, as photocatalysts often absorb light of different wavelengths. Further, Roberts et al. [46] point out, that FOMs like the PE do not provide any fundamental insights about the photocatalyst, as no differentiation between the contributions of bulk and photoactive surface can be made.
In order to consider turnover number (TON) and turnover frequency (TOF) in photocatalytic reactions, knowledge of the number of photocatalytically active sites is required, which may be obscured due to shading effects [39]. Therefore, TON and TOF do not take the utilization of light into account, and in this context also do not reflect the contribution of the bulk phase in photocatalytic reaction systems [46]. In addition, as Muhammad and Takanabe [43] extensively discussed in their review, the activity of cocatalysts (especially metal cocatalysts) is highly dependent on the potential shift induced by the charge transfer between photocatalyst and cocatalyst, resulting in a charge separation. The potential shift is consequently influenced by the illumination condition, and not constant throughout the course of the reaction. A TOF based on cocatalyst active sites could in this case only reflect an average of the catalyst and would only provide limited information.
Another widely used approach is the relation of the reaction rate to the catalyst mass used in the photocatalytic reaction. As Kisch [56], Maschmeyer, and Che [54,55] pointed out already in 2010, photocatalytic reactions are dependent on the catalyst mass due to mass transfer limitations and absorption limitations. Therefore, many authors [35,39,43,46,50,54,55] recommend refraining from using relation to catalyst mass in photocatalytic reactions. Instead, a range of different photocatalyst concentrations should be tested to ensure working in the “optimal range” for comparison of different photocatalysts at their highest activity [35,39,57]. Additionally, other authors [58,59] pointed out that mass transfer has so far not been investigated in detail for photocatalytic reactions, and even less for the specific reaction of photocatalytic water splitting. In this context, Ballari et al. [60] investigated mass transfer limitations in photocatalytic slurry reactions proving their existence. Though they stated that photocatalytic reactions using semiconductors in general can be considered not to be mass transfer limited at low catalyst loadings (<1 g dm−3), low irradiation rates (<1 × 10⁻⁶ mol cm−2 s−1), appropriate mixing conditions or for slow photocatalytic reactions. As the conditions for light intensity are matched in this study (cf. Section 2.3.2), thorough mixing of gas and liquid phase is ensured by the experimental setup (cf. Section 3.3) and the investigated reaction takes place in a timespan of hours, mass-transfer limitations are not considered to be relevant for the discussion of the presented results.
A further aspect to be considered in semiconductor photocatalysis is the catalyst particle size. Many studies have investigated particle size effects for different photocatalysts and found that the interplay of factors such as specific surface area [61,62], charge-carrier dynamics [63,64] and light absorption [63,65] is crucial. Especially, if photocatalysts of similar composition are compared, the explanation of observed differences in catalytic activity needs to consider particle size effects, which are hardly covered by existing FOMs [66]. However, particle size effects are not considered in this study, because the cell size of the bio-photocatalyst cannot be controlled and is subject to changes due to growth and decay processes. In view of this background, the aim of the current study is to directly compare a semiconductor and a bio-photocatalyst to enable, to the best of our knowledge for the first time, an interdisciplinary comparison in the same catalytic conversion, i.e., photocatalytic water splitting. To facilitate the comparison, in a unique approach the photocatalytic experiments are carried out in the same setup under conditions as similar as possible to eliminate influencing factors such as reactor geometry, reactor size, light source and illuminated area. Here, La-doped NaTaO3 loaded with 0.16 wt.–% NiO as a cocatalyst (NiO/La-NTO) as a semiconductor and Synechocystis—as a bio-photocatalyst are studied. First, suitable FOMs are selected from those shown in Table 1 to enable an interdisciplinary comparison of the semiconductor photocatalyst and the bio-photocatalyst. This is followed by an investigation of the influence of catalyst concentration, incident light intensity and spectrum on the photocatalytic activity to identify reaction conditions suitable for a comparison. Using the initially identified FOMs (rini and rave with and without mass relation, STY, AQY, EQE, PSTY) and reaction conditions (photocatalyst concentration, light spectrum, and intensity), two sets of experimental conditions are identified to directly compare both systems at their respective peak activity and with similar reaction conditions with respect to light intensity and light spectrum.
Based on the direct comparison of the two photocatalytic systems, the information content of the different experimental conditions is assessed with respect to the applied photocatalysts. Further, the different FOMs are compared and evaluated, allowing to identify quantities suitable for an interdisciplinary comparison of photocatalytic reaction systems and photocatalysts in order to improve the overall comparability within the field of photocatalysis. This will also provide further insight into the functions and operation principles of different photocatalyst types allowing to connect especially the fields of heterogeneous, semiconductor photocatalysis and bio-photocatalysis.

2. Results and Discussion

2.1. Selection of Figures of Merit

The comparison of semiconductor and bio-photocatalyst system is based on parts of the FOMs listed in Table 1. This includes the reaction rate, both as the average (rave) and initial (rini) reaction rate. Additionally, the reaction rate was in either case related to the photocatalyst mass or the cell dry weight in case of the bio-photocatalyst. Further, the space-time-yield (STY) and the photocatalytic space time yield (PSTY), the external quantum efficiency (EQE) and the apparent quantum yield (AQY) were used as FOMs. As the use of monochromatic light is of limited interest from an application-oriented point of view and might even be misleading [39], we used polychromatic light with a given wavelength range (250–1400 nm) for the determination of the AQY instead of monochromatic light.
The other FOMs were not considered for different reasons. For example, both the QY and QE require the number of absorbed photons, which is difficult to assess for semiconductors and thus often not available. The power conversion efficiency, on the other hand, takes the enthalpy of combustion into account, which by definition is zero for O2, which in our case is the observed reaction product of the bio-photocatalyst system. The solar to chemical conversion efficiency (and thus the solar to hydrogen conversion efficiency as a special case) requires in its current definition light with an AM 1.5 G spectrum, which is not suitable for systems that rely heavily on UV-light like the semiconductor used in this study.
For a meaningful discussion of the applicability and usefulness of the FOMs the influence of key experimental parameters like catalyst concentration and light source on catalytic activity needs to be investigated. This will be done in Section 2.2. (influence of catalyst concentration) and Section 2.3. (influence of light spectrum and intensity), before the FOMs are discussed in Section 2.4.

2.2. Influence of Photocatalyst Concentration

Typically, the use of a higher catalyst concentration results in overall higher catalytic activity. However, the photocatalyst concentration can affect the photocatalytic activity due to self-shading effects [67], and protection from photodamage by excessive light in case of bio-photocatalyst. Therefore, this section shall provide insight into the dependence of the catalyst concentration of the semiconductor photocatalyst and the bio-photocatalyst on the photocatalytic activity. The discussion of the photocatalytic activity is based on the initial reaction rate, which is displayed in Figure 1 as a function of the catalyst concentration of Synechocystis and NiO/La-NTO. The product evolution over time, and additional FOMs that can be calculated will not be discussed here but are displayed in the ESI (Figures S1–S5) for the sake of completeness.
The time dependent O2 evolution (ESI S1) of the bio-photocatalyst shows that varying the cell concentration of 0.163 to 0.489 g dm−3 results in the highest activity for 0.326 g dm−3 (OD750 = 2) (rini = 0.852 mmol h−1). This is likely the result of light utilization and photoinhibition of the cells. While at 0.163 g dm−3 (OD750 = 1) the cells absorb by definition 90% of the incident light at 750 nm and thus do not fully utilize the light due to a lack of absorption capacity. At 0.489 g dm−3 (OD750 = 3) the cells by definition absorb 99.9% of the light and are likely mutually shading each other from the light, thus lowering the average light utilization. In addition, the photocatalytic activity of the bacteria cells is likely inhibited at 0.163 g dm−3 (OD750 = 1), with respect to the O2 evolution processes due to a higher ratio of introduced photons to the present bacterial cells. This might result in excessive stress for the photosystem and cell damage, especially since no UV light filter was used in these experiments.
Moreover, it should be noted that, even though, the concentration of 0.326 g dm−3 (OD750 = 2) lead to the highest activity the investigations on the light spectrum and intensity (Section 2.3) were conducted using a bio-photocatalyst concentration of 0.163 g dm−3 (OD750 = 1) due to limitations in the used setup.
The trend of H2 evolution shown in dependence of the catalyst concentration for NiO/La-NTO in Figure 1 is similar to the trend observed for O2 evolution in the bio-photocatalyst. The highest activity based on the initial reaction rate was observed between 0.5 and 3 g dm−3 photocatalyst (1 g dm−3 rini = 0.226 mmol h−1), at higher catalyst concentration the activity decreases (5 g dm−3 rini = 0.120 mmol h−1). The drop in activity at higher catalyst concentrations can be explained, similar to the bacteria, with self-shading effects [68]. At lower photocatalyst concentrations the activity appears to be stable. However, this is probably only due to the investigated catalyst concentration range not visible, as it has to be expected that the limited number of available active sites or light absorbed will reduce the activity [50]. It can thus be assumed, that for NiO/La-NTO the photocatalytic activity is, with regard to the photocatalyst concentration, in the optimal range between 1 g dm−3 and 3 g dm−3. In addition, the observed dependence of the photocatalytic activity from the catalyst concentration again shows, that, as reported in literature [36,39,51], the relation to catalyst mass should not be used for comparison of photocatalysts.

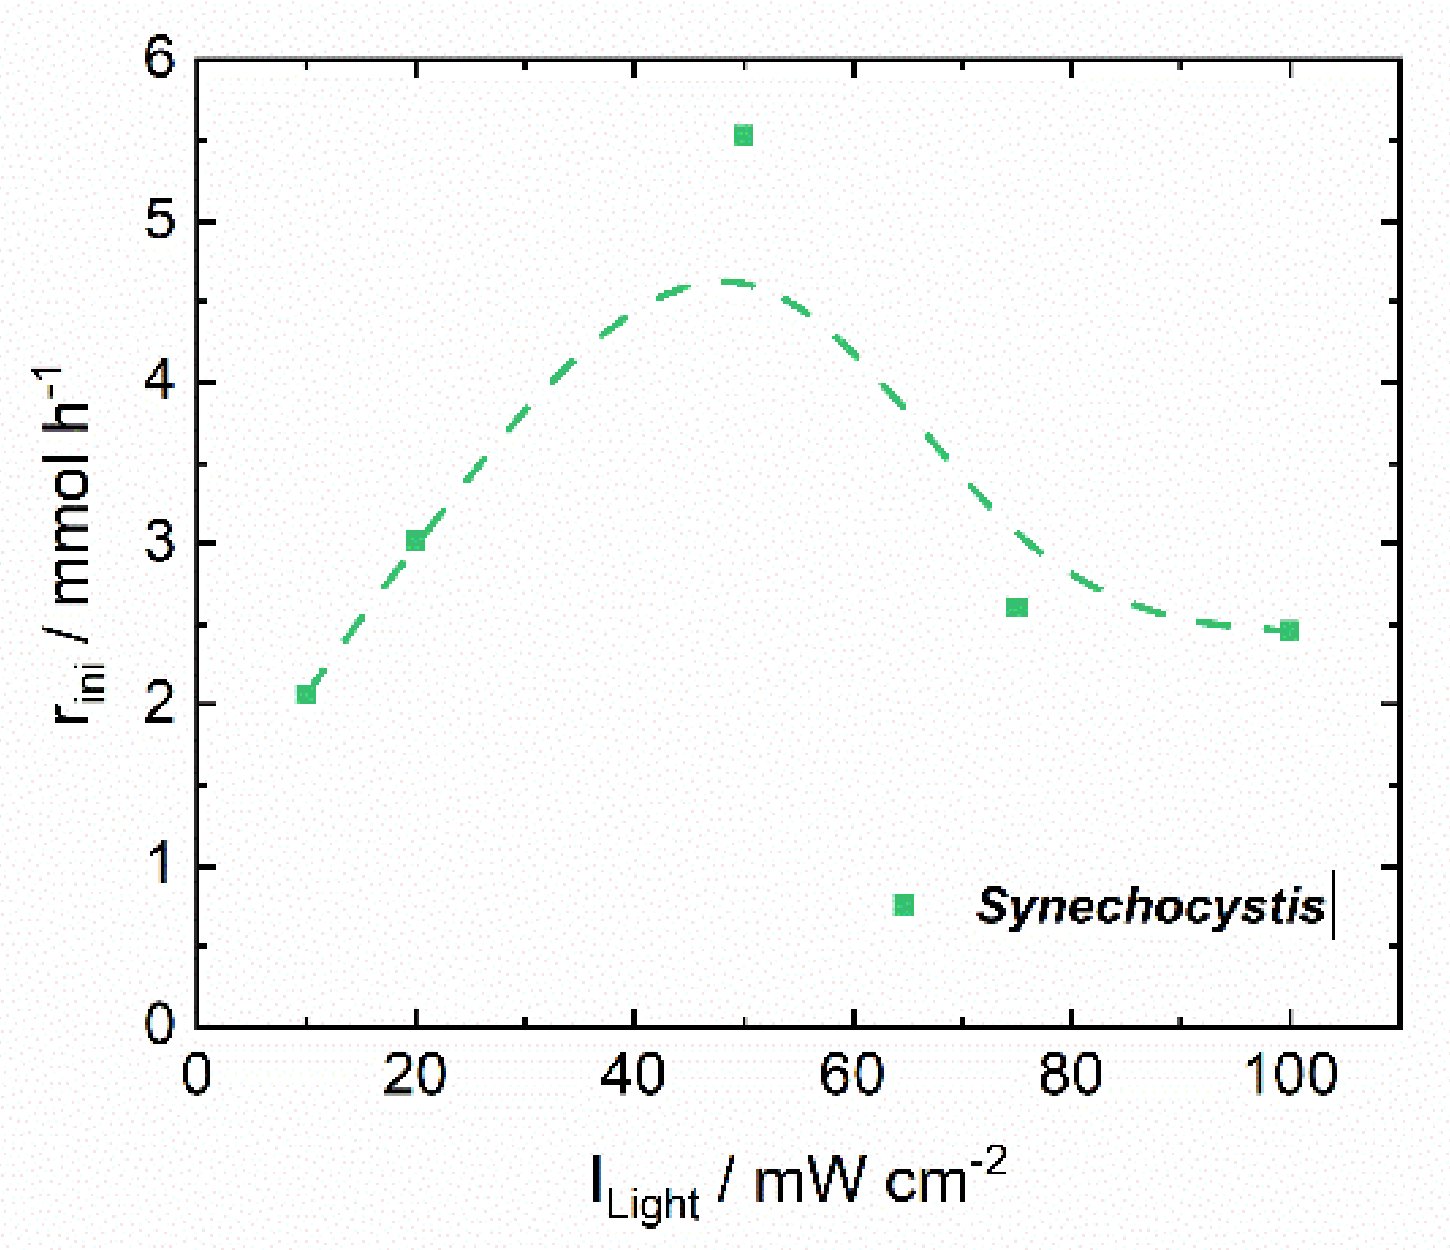
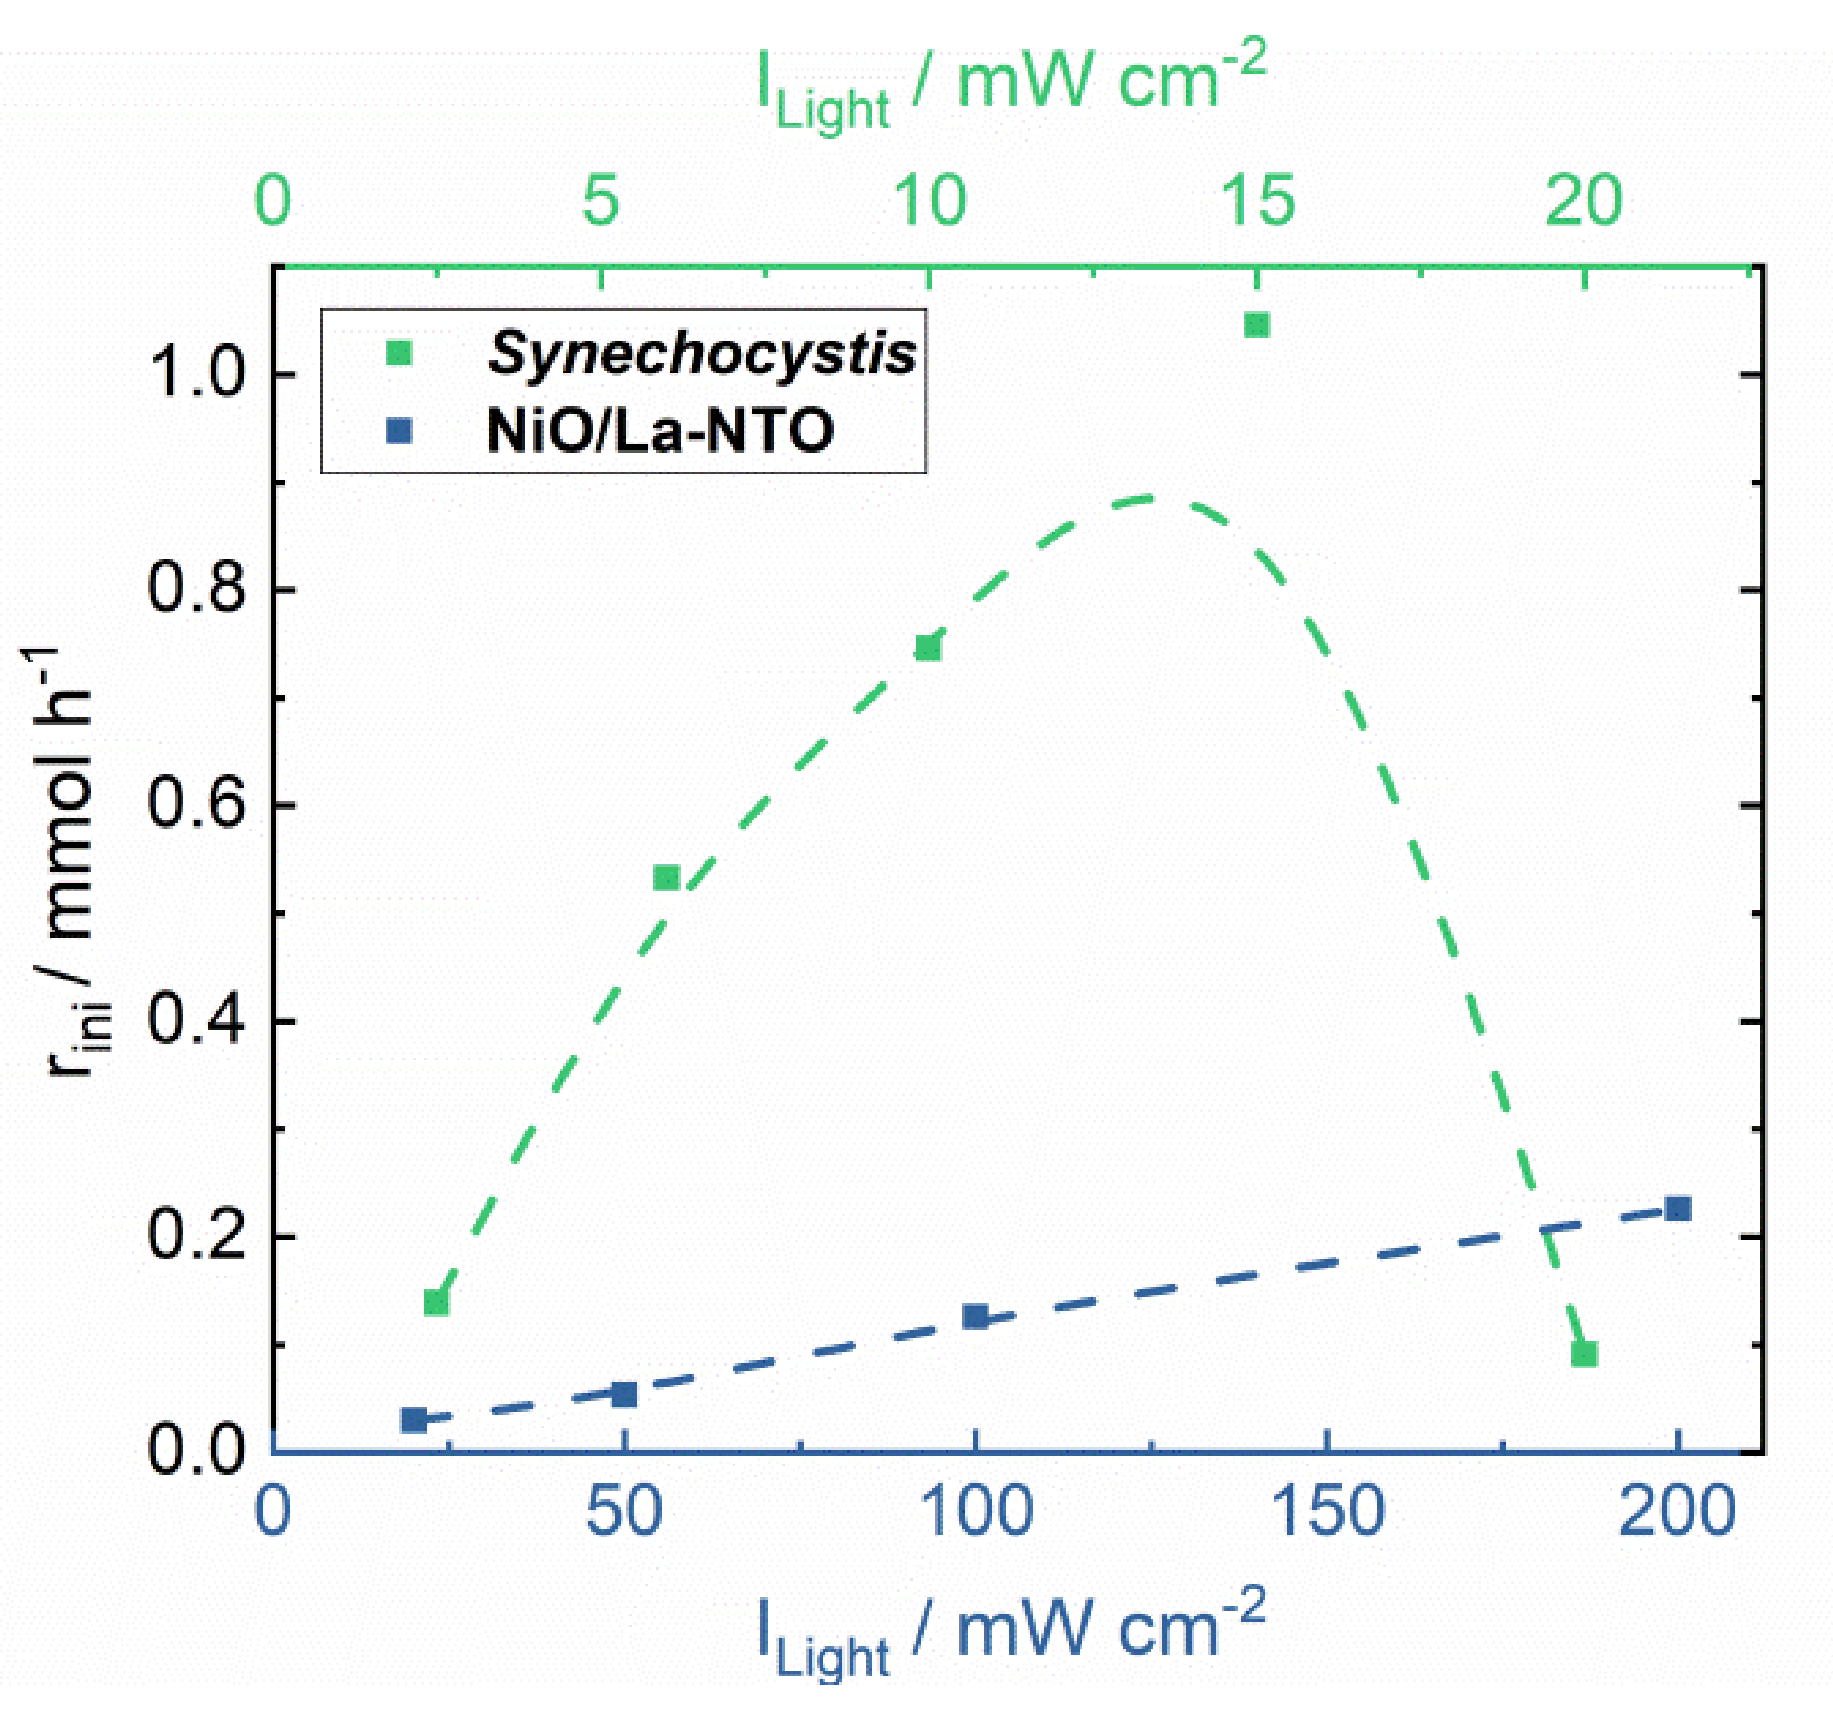
2.3. Influence of Light Spectrum and Intensity

As one of the suggestions from literature is to compare systems at their peak activity with respect to photocatalyst mass [32,35,46], this approach can also be applied with respect to other experimental conditions like light spectrum, which is especially important for bio-photocatalysts and semiconductors with a small absorption spectrum, or intensity. Therefore, we investigated Synechocystis under both the full spectrum of the Xe-lamp (for comparison with NiO/La-NTO) and with the AM 1.5 G limited spectrum (for comparison at peak activity).

2.3.1. Sunlight Spectrum

The semiconductor photocatalyst is not active when irradiated utilizing an AM 1.5 G filter to simulate the sunlight spectrum. This is due to the mismatch of the sunlight spectrum with the band gap of NiO/La-NTO (see ESI Figures S20 and S24). However, the bio-photocatalyst Synechocystis is clearly active with the initial reaction rate depending on the intensity of light from the AM 1.5 G limited spectrum as displayed in Figure 2. The time resolved O2 evolution and additional FOMs resulting from this can be found for the sake of completeness in the ESI (Figures S6–S8).
It is evident that in terms of evolved O2 the photocatalytic activity shows a volcano shaped dependence of the light intensity, with a maximum photocatalytic activity of rini = 5.382 mmol h−1 at 50 mW cm−2. At lower light intensity, it is likely that the photosystem of the bio-photocatalyst is not fully saturated, resulting in a lower photocatalytic activity. The lower activity at higher light intensity may be caused by cell damage. This may be due to the small fraction of UV-light in the utilized light spectrum, since it is known that phototrophic organisms are typically damaged by excess UV irradiation, which can lead to a decrease in photosynthetic activity [69]. Also, it is likely that the photosynthetic reaction chain in the bacteria cells might be damaged due to an excess of excited electrons by the high number of incoming photons. This would lead to damage and repair of proteins, e.g., the D1 protein of photosystem II, resulting in the formation of reactive oxygen species (ROS) instead of molecular oxygen [70] at higher light intensities.

2.3.2. Full Lamp Light Spectrum

Since the semiconductor catalyst NiO/La-NTO shows no activity under simulated sunlight for the comparison of both systems under the same conditions the full lamp light spectrum was utilized. Therefore, a range of possible light intensities for both photocatalyst systems using no light filter was investigated. The results are displayed in Figure 3 and will be discussed based on the initial reaction rate below, the product evolution as a function of time and additional FOMs not discussed here are displayed in the ESI (Figures S9–S13).
In comparison to the use of the sunlight spectrum, the bio-photocatalyst produced less O2 at the same light intensity compared to when the filter is removed (10 mW cm−2: rini,AM 1.5 G = 2.066 mmol h−1, Figure 2; rini, no filter = 0.746 mmol h−1, Figure 3). This is likely caused by a different distribution of the light intensity to the respective wavelengths when omitting the AM 1.5 G light filter (see ESI Figure S24). In this context, a higher fraction of UV-light and a lower fraction of light in the suitable wavelength range without the use of the filter reduces the available light for the reaction and likely causes cell damage further reducing the photocatalytic activity. The suitable wavelength range is typically defined as photosynthetically active radiation (PAR) and ranges from 400 to 700 nm [71].
Again, the photocatalytic activity of the bio-photocatalyst expressed by the initial reaction rate shows the highest observed activity a light intensity of 15 mW cm−2 (rini = 1.046 mmol h−1). The drop in activity at a light intensity of 20 mW cm−2 without filter (rini = 0.091 mmol h−1) strongly indicates cell damage due to the UV-light. This is further supported by the fact that the bio-photocatalyst changed its color from an intense green to a mixed green brown as can be seen in Figure 4, indicating cell damage of the bacteria. At lower light intensities it is likely that the bio-photocatalyst, does not absorb enough light to drive the photocatalytic reaction. This lower light absorption is caused by the fact, that the removal of the filter decreased the total amount of photons provided for the same total energy, i.e., 15 mW cm−2, due to a change of the lamp light spectrum (ESI Figure S24).
NiO/La-NTO on the other hand shows a clear trend for the influence of the light intensity (Figure 3). In the investigated intensity range of 20 to 200 mW cm−2 the initial rate of evolved H2 steadily increases with increasing light intensity reaching rini = 0.226 mmol h−1 for 200 mW cm−2. Possibly, an even higher initial reaction rate can be achieved at higher intensity (limited here by the experimental setup). However, it is likely that the observed dependence will change at even higher light intensities towards a response equal to the square root of the light intensity, as shown for example by Tabata et al. [72] for photocatalytic water splitting over K4Nb6O17. Further, according to Bloh [73] this implies that the reaction over NiO/La-NTO is purely governed by the photon flux and effects like mass-transfer limitations can be neglected. This is likely caused by the wide band gap of NiO/La-NTO, i.e., 4.08 eV based on the UV/Vis diffuse reflectance determination (see ESI Figure S20), which restricts the utilizable spectral range.
Altogether the investigations show that semiconductor and bio-photocatalysts have individual strengths. While Synechocystis is photocatalytically more active, it is prone to damage due to UV-light and high light intensities. On the other hand, NiO/La-NTO shows high photocatalytic activity only with UV-light and benefits from high light intensities.

2.4. Figures of Merit for the Comparison of NiO/La-NTO and Synechocystis

The experimental conditions, i.e., illumination conditions including light spectrum and intensity, are highly important both for the activity of a photocatalytic system, but also for the information content when used for comparison. Therefore, the selection of suitable experimental conditions is not trivial.
In our study, the comparison of bio-photocatalysts (Synechocystis) with semiconductors (NiO/La-NTO) will be discussed below using two different sets of conditions. These are the local optimum of photocatalytic activity (peak activity) under the conditions investigated and at the same experimental illumination conditions. The comparison at peak activity provides information on the highest activity of a photocatalyst. The comparison using similar illumination conditions is closer to potential applications, since any application usually comes with a limited range of possible reaction conditions such as light power, light spectrum, temperature, and concentration of catalyst to be used typically with regard to cost or available resources.

2.4.1. Maximum Product Evolution Rate

The experimental point of peak activity was chosen according to the highest product evolution rate (NTO = 0.226 mmol h−1/ccat = 1 g dm−3/Ilight = 200 mW cm−2/no filter; Synechocystis = 5.529 mmol h−1/ccell = 0.163 g dm−3 (OD750 = 1)/Ilight = 50 mW cm−2/AM 1.5 G filter) observed in this study. The comparison of the two systems on the basis of different FOMs is shown in Table 2 and in graphical form (material-based Figure S14, light-based Figure S15) in the ESI.
As can be seen from Table 2 the bio-photocatalyst is at least one order of magnitude more active in terms of initial product formation rate, which is consistent in all the FOMs considered. Although the difference is much higher if the reaction rate is related to catalyst mass. This is due to the fact that the cell dry mass of the bacteria used in the experiments is significantly lower with 16.3 mg compared to 100 mg for NiO/La-NTO. However, it must be taken into account that the actual mass under reaction conditions is significantly higher due to the absorption of water, which gives the cells their volume. Since the determination of the mass of the living cells is difficult and prone to errors, the use of the cell dry mass is established in the biotechnological community [74,75,76] and hence was used for the mass relation. This contributes to the fact that the relation of the photocatalytic reaction rate to catalyst mass is not well suited for interdisciplinary comparison of photocatalysts. Nevertheless, in this specific case assuming a water content of approximately 70 wt.–% the cell weight would be around 54 mg which would still result in a mass related reaction rate of factor 50 higher at peak activity than the semiconductor photocatalyst. In addition, the relation to catalyst mass, although one of the most frequently used comparative quantities in semiconductor-based photocatalysis, often conceals the highest possible activity of a photocatalyst and makes the comparison of activities more difficult. One reason for this is that trends in activity resulting from the variation of photocatalyst concentration are disguised by the relation to catalyst mass. This is because photocatalyst concentration and activity are not necessarily proportional, which often results in large activities for small catalyst concentrations in case of relation to mass. This can be used to deliberately make a photocatalyst look more active [57]. Furthermore, the relation to catalyst mass neglects catalyst concentration dependent processes like light absorption, scattering or mutual shading of photocatalyst particles [35].
When looking at the light-based FOMs displayed in Table 2 the trend is reversed, with the exception of the PSTY. The FOMs shown here suggest that NiO/La-NTO uses the introduced light one to two orders of magnitude more efficiently than Synechocystis. But this difference is primarily caused by the selected conditions, as shown in the comparison discussed below using the same illumination conditions (Section 2.4.2). Here, no light filter was used for the semiconductor photocatalyst resulting in a larger fraction of UV-light in the overall light intensity. Simultaneously, the higher fraction of short-wavelength photons with a higher energy means that overall fewer photons are introduced during the reaction of the semiconductor, resulting in a higher calculated efficiency when related to the number of photons. This also explains why the PSTY does not show this behavior, since only the power of the lamp (which is the same for both catalysts) used regardless of the photons generated is included here.
This observation raises the question which light spectrum should be chosen for comparison. As we have shown in this study in an interdisciplinary comparison, the possibility to use the same light spectrum does not necessarily exist due to the different requirements of the applied photocatalytic systems. Therefore, from our point of view, it makes sense to use a light source with a polychromatic spectrum instead of monochromatic light, as was done for the present work, since this allows for a much broader comparison. Since it is difficult to standardize light sources, the establishment of standard spectra, which can be generated by choosing a suitable filter, is preferable in this context. In some areas this has already been achieved by using AM 1.5 G as the sunlight spectrum, since it has been recognized that from the perspective of sustainability and economics most phototrophic or photocatalytic reactions are most sustainable when using sunlight. However, semiconductor and bio-photocatalysts have different requirements regarding the light spectrum and intensity. While semiconductors in particular often require a higher spectral fraction of UV light, bio-photocatalysts often do not tolerate high light intensities. For example, the microalgae Chlorella vulgaris has their light saturation intensity, above which photoinhibition occurs, at around 250 μE m−2 s−1 corresponding to about 10% of the light intensity on an average summer day [77]. Thus, it is recommended that additional standard spectra and light intensities are established that take this fact into account. From a more application-oriented point of view the use of the PSTY also makes sense as this allows to include information on the energy utilization independent of the actual lamp spectra and number of photons supplied. However, to achieve truly comparable results catalysts have to be tested in identical setups (like in this study) or a multitude of additional experimental parameters (some of which specific to photocatalytic reactions) known to affect photocatalytic activity (e.g., reactor type and geometry, position and distance of light source, modus and power of agitation) have to be reported and/or kept strictly constant.

2.4.2. Similar Illumination Conditions

The resulting values for the FOMs for the comparison of Synechocystis and NiO/La-NTO under similar illumination conditions are displayed in Table 3 and in graphical form in the ESI (material-based Figure S16, light-based Figure S17). For bio-photocatalyst and semiconductor photocatalyst only one common set of illumination conditions was found at which product formation could be observed for both. Therefore, this point (Ilight = 20 mW cm−2, no filter) was chosen for the comparison.
Except for changes of the absolute values of the FOMs no differences between the experimental point for the highest observed product evolution rate and the point of similar reaction conditions in the trends of the material-based quantities for Synechocystis and NiO/La-NTO can be observed. However, a significant difference between these two points becomes evident in the light-based FOMs. Firstly, both photocatalytic systems utilize the light more efficiently, if similar reaction conditions are considered, which is reflected by higher values of EQE and AQY. Secondly, in contrast to the point of maximum activity, the bio-photocatalysts use the introduced light more efficiently (~45%), independent of the spectral range used for the evaluation.
Similar for the previous discussion at peak activity (Section 2.4.1), the PSTY again indicates that the bio-photocatalyst utilizes the light more efficiently. However, the absolute values are two orders of magnitude lower. Considering that the PSTY in general is considered most suitable for the evaluation of photocatalytic setups, this observation shows that such a comparison, in addition to the above-mentioned facts, requires standardized reaction conditions, especially illumination conditions and catalyst concentrations.
Taking all this together, the questions remain, which Figure(S)-of-Merit are suitable for the evaluation of the photocatalytic properties of a given photocatalyst, whether it is organic, inorganic or a living organism, and which conditions are appropriate for the evaluation. As this study has shown, for the later question it strongly depends, which kind of information one likes to obtain. Practical applications will always require a given set or a range of conditions in which they can perform. Thus, for a given application, investigations with these conditions in mind need to be carried out. On the other hand, when catalysts shall be compared amongst each other in terms of activity or light utilization, unifications of the reaction conditions, e.g., light spectrum and intensity, temperature, pressure, additives, as well as the reactor setup and geometry need to be taken into account. As the later point is usually neglected, we would recommend establishing a simple reaction with fixed reaction conditions and a commercially available reference photocatalyst like P25 to evaluate a given photocatalytic setup. This would facilitate the comparability issue that currently exists due to the use of a wide range of self-made reaction setups. Based on the work of Leblebici et al. [52], we propose the use of the PSTY to evaluate reaction setups.
With respect to the question, which FOMs to use, we associate ourselves with the work of Habisreutinger et al. [37] on semiconductor photocatalysts for CO2 reduction, who suggested the use of at least one FOM from each class (material-based and light-based). For an easy, cost and time efficient comparison of photocatalysts the following FOMs are suitable. From the side of the material-based FOMs the well-established reaction rate should be used. With regard to the light-based quantities, all FOMs that are suitable have more or less strict requirements from the determination of absorbed photons over the use of monochromatic light. In the interest of an easily accessible and interdisciplinary comparison we therefore propose to modify the apparent quantum yield or the external quantum efficiency to allow the use of polychromatic light instead of mono-chromatic light. This could be done similar to the solar to chemical conversion efficiency, which is based on the AM 1.5 G spectrum, with a set of defined light spectra to accommodate the requirements of different photocatalytic systems.
The use of the mass related reaction rate is discouraged, as this does not necessarily reflect the capabilities of a given photocatalyst. Furthermore, trends observed using this quantity, when the photocatalyst mass is varied might be misleading due to shading and similar effects.

3. Materials and Methods

3.1. Synthesis of La-Doped NaTaO3 Loaded with NiO

The preparation of La-doped NaTaO3 (denoted as La-NTO) using solid state synthesis was done according to the procedure of Kudo et al. [78]. For a typical synthesis Ta2O5 (99.993%, Alfa Aesar, Haverhill, MA, USA), Na2CO3 (99.999%, Merck, Burlington, MA, USA) and La2O3 (99.99%, Sigma-Aldrich, St. Louis, MO, USA) were mixed in a molar ratio of 1.00:1.03:0.02 and finely ground in an agate mortar. The mixture was first calcined at 1173 K (20 K min−1, 1 h) and then immediately ground while still hot and placed back in the oven. After further 30 min at 1173 K the oven was heated to 1423 K (10 K min−1) and kept for 10 h. The resulting powder was washed with demineralized H2O (10 cm3 g−1) to remove excess Na2CO3, centrifuged and dried (333 K, vacuum). The resulting La-NTO was loaded with 0.16 wt.–% NiO, as confirmed via elemental analysis, using a wet impregnation method. For this, an aqueous solution (26.8 mm) of NiNO3·6H2O (99.9985%, Alfa Aesar, Haverhill, MA, USA) was mixed with the La-NTO powder using 10 cm3 solution per gram La-NTO. The water was completely evaporated using a heating lamp while continuously stirring with a glass rod and then pre-dried at 373 K (vacuum). The resulting solid was calcined in air (523 K, 5 K min−1, 2 h). Finally, the powder was again washed with demineralized water and dried at 363 K. The resulting material was characterized using elemental analysis (ESI), X-ray powder diffraction (ESI Figure S19), UV/Vis diffuse reflectance spectroscopy (ESI Figure S20), and transmission electron microscopy (ESI Figures S21 and S22).

3.2. Preparation of Synechocystis sp. PCC 6803

Synechocystis sp. PCC 6803 was obtained from the Pasteur Culture Collection of Cyanobacteria (Paris, France). Axenic cultures were cultivated in BG11 medium first described by Rippka et al. [79] with 10 mm 2–[[1,3–dihydroxy–2–(hydroxymethyl)propan–2–yl]amino]ethanesulfonic acid (TES) adjusted to pH 8. Cells were grown in baffled flasks at 303 K, 150 rpm (25 mm orbital shaking), 75% relative humidity in the incubator (to minimize evaporation losses) and 50 µmolphotons m−2 s−1 constant illumination with white light LEDs. Cultures of cells were kept in mid log phase (OD750 1–4) by dilution and were also diluted right before the experiment, as stated in the respective description of results. The optical density at a wavelength of 750 nm (OD750) was determined using a standard tabletop photometer (LibraS11, Biochrom, Cambridge, UK) with pure BG11 medium as a blank.
The mass of the bacterial cell cultures was determined by centrifugation of a sample and subsequent drying (at 60 °C) for several days. As the cells contribute only a small mass fraction even of a dense aqueous cell culture, this method requires significant sample volumes. Therefore, the mass of bio-photocatalyst is usually given in form of an optical density at a specified wavelength that can be converted to the respective cell dry mass of the bacteria using a conversion factor, which has to be determined experimentally for every strain and culture condition. In our case, the optical density OD750 = 1 is equal to 16.3 mg cell dry mass per liter of culture of Synechocystis (see ESI Figure S23 for correlation of cell concentration and OD750).

3.3. Photocatalytic Experiments

Photocatalytic experiments were performed using a quartz glass top irradiation cell connected to a closed gas circulation system (Vtotal = 270 cm3) with a gas chromatograph (mod. 2010, Shimadzu, Kyoto, Japan, equipped with flame ionization detector and thermal conductivity detector, ShinCarbon ST column, N2 carrier gas for H2 detection, He for O2 detection) for product gas analysis. As a light source an Oriel Sol3A solar simulator (450 W, with and without AM 1.5 G filter, Newport, Irvine, CA, USA) was used. A flow scheme and image of the catalytic setup and reactor and the lamp spectra can also be found in the ESI (ESI Figures S25–S27). For a typical experiment 0.1 g of the photocatalyst was placed inside of the reactor with 100 cm3 of ultrapure H2O (0.055 μS, Elga, Celle, Germany) and placed inside an ultrasonication bath (USC-TH, VWR, Darmstadt, Germany) for one minute to obtain a uniform particle dispersion in the solution. The bacterial cell cultures were diluted to the respective cell concentration, i.e., 0.163 to 0.489 g dm−3, right before the experiment using the same BG11 medium the culture was growing in before the experiment. Prior to catalytic conversion, the setup was purged with Ar (for experiments using a semiconductor photocatalyst) or 1 vol.–% CO2 in He (for experiments using bio-photocatalysts) for 30 min in the dark and kept at 303 K (water cooling jacket) for the reaction duration of 5 h. After the purging the light was turned on, marking the start of the reaction. During the reaction samples were taken every 30 min with the equipped gas chromatograph. For the bio-photocatalyst O2 was detected as a product gas as the electrons are utilized for the CO2 fixation and thus no H2 can be detected, while for the semiconductor photocatalyst H2 was detected as a product gas, as the concentrations of O2 were too little to be detected due to the sensitivity of the TCD. Additionally, the NiO/La-NTO was testes for a reaction duration of 20 h (see ESI Figure S18 to ensure photocatalyst stability.
The calculation of the FOMs was done according to the equations displayed in Table 1. The initial reaction rate (rini) was determined based on the first 3 h of observed product evolution. This period was chosen to ensure that enough product was present in the gas phase to enable detection via GC-TCD, while the average reaction rate (rave) was determined after the full reaction duration. The photon number for the calculation of the external quantum efficiency (EQE) and apparent quantum yield (AQY) was determined as the integral sum in the respective wavelength range of the lamp spectrum supplied by the manufacturer (given in ESI Figure S24). The discussion of catalyst concentration, light spectrum and light intensity dependence will be based on the initial reaction rate, the other FOMs together with the product evolution curves are given for the sake of completeness in the ESI (catalyst concentration—Figures S2–S5, light spectrum—Figures S7 and S8, light intensity—Figures S10–S13).

4. Conclusions

Comparability of different photocatalysts is an important foundation for a deeper scientific understanding and for successful future developments in the field. For this purpose, many different figures of merit (FOMs) can be used. However, the information content, applicability and use in the literature of the available quantities and measures differ strongly. Furthermore, no consensus within the scientific community has been achieved regarding which FOMs to use and on what basis to compare different photocatalytic systems. This is even more relevant for an interdisciplinary comparison which has so far received less attention. Towards this goal, bacteria cells of Synechocystis and the solid semiconductor NiO/La-NTO were, in this study, investigated as photocatalysts in the same experimental setup under similar reaction conditions for photocatalytic water splitting. This allowed to eliminate the often ill-defined factor of the photocatalytic setup and provides an insight into the usefulness and applicability of the various FOMs.
The results of the present study indicate that a single FOM is unable to fully and correctly display the complexity of photocatalytic reactions. Therefore, we propose the use of multiple FOMs that take different aspects of both the photocatalyst and the experimental setup into account. In addition, the FOMs should be easy to use, i.e., the required physical measures should be easily accessible and not have major requirements regarding equipment to appeal to the widest possible scientific community. In this context the reaction rate combined with the photocatalytic space time yield and a redefined apparent quantum yield can cover a wide range of information and thus allow for a proper comparison among different works, laboratories, setups and photocatalysts. However, if in the future more insight into the activity of semiconductor photocatalysts is gained, comparisons should be made based on the number of (photo)catalytically active sites like in catalysis on surfaces, molecular and biological catalysis. However, this is hardly possible so far.
Additionally, the present work shows the different requirements of typical bio-photocatalysts and semiconductor-based photocatalysts with respect to light intensity and spectrum. It also confirms the gap in activity between the two photocatalyst classes, clearly indicating that more research is needed in the field of semiconductor photocatalysis to close the activity gap to bio-photocatalysts. However, while the bio-photocatalyst is more active it does not tolerate high light intensities (>200–250 μE m−2 s−1) or UV-light. The semiconductor photocatalyst of this study, on the other hand, requires UV-light with a high light intensity. Therefore, using a combination of reactor and photocatalyst design both semiconductor and bio-photocatalyst might benefit from each other if utilized as hybrid systems allowing to maximize photocatalytic activity and stability also from high energy light sources.

Supplementary Materials

Author Contributions

Conceptualization, R.G., A.S., M.G.; methodology, E.S.W., M.G.; software, E.S.W.; formal analysis, E.S.W., S.K., M.G.; investigation, E.S.W., S.K., F.B.; writing—original draft preparation, E.S.W., S.K., F.B.; writing—review and editing, M.G., J.K., R.G., A.S.; visualization, E.S.W.; supervision, M.G., J.K.; project administration, J.K., M.G., A.S., R.G.; funding acquisition, R.G., A.S. All authors have read and agreed to the published version of the manuscript.

Funding

This research was funded by the European Social Fund (ESF), grant number 100316552 and 100316517 and is co-financed by means of taxation based on the budget adopted by the representatives of the Landtag of Saxony.

Data Availability Statement

The datasets generated and/or analyzed during the current study are available from the corresponding author on reasonable request.

Acknowledgments

We acknowledge support from Leipzig University for Open Access Publishing.

Conflicts of Interest

The authors declare no conflict of interest. The funders had no role in the design of the study; in the collection, analyses, or interpretation of data; in the writing of the manuscript, or in the decision to publish the results.

References

  1. Kan, S.; Chen, B.; Chen, G. Worldwide energy use across global supply chains: Decoupled from economic growth? Appl. Energy 2019, 250, 1235–1245. [Google Scholar] [CrossRef]
  2. Benveniste, H.; Boucher, O.; Guivarch, C.; Le Treut, H.; Criqui, P. Impacts of nationally determined contributions on 2030 global greenhouse gas emissions: Uncertainty analysis and distribution of emissions. Environ. Res. Lett. 2018, 13, 14022. [Google Scholar] [CrossRef]
  3. Malik, A.; Lan, J.; Lenzen, M. Trends in Global Greenhouse Gas Emissions from 1990 to 2010. Environ. Sci. Technol. 2016, 50, 4722–4730. [Google Scholar] [CrossRef] [PubMed]
  4. Kabir, E.; Kumar, P.; Kumar, S.; Adelodun, A.A.; Kim, K.-H. Solar energy: Potential and future prospects. Renew. Sustain. Energy Rev. 2018, 82, 894–900. [Google Scholar] [CrossRef]
  5. Elavarasan, R.M. The Motivation for Renewable Energy and its Comparison with Other Energy Sources: A Review. Eur. J. Sustain. Dev. Res. 2019, 3, em0076. [Google Scholar] [CrossRef]
  6. Shen, R.; Lu, X.; Zheng, Q.; Chen, Q.; Ng, Y.H.; Zhang, P.; Li, X. Tracking S-Scheme Charge Transfer Pathways in Mo2C/CdSH2-Evolution Photocatalysts. Sol. RRL 2021, 5, 2100177. [Google Scholar] [CrossRef]
  7. Ahmadi, M.H.; Ghazvini, M.; Sadeghzadeh, M.; Alhuyi Nazari, M.; Kumar, R.; Naeimi, A.; Ming, T. Solar power technology for electricity generation: A critical review. Energy. Sci. Eng. 2018, 6, 340–361. [Google Scholar] [CrossRef] [Green Version]
  8. Tuller, H.L. Solar to fuels conversion technologies: A perspective. Mater. Renew. Sustain. Energy 2017, 6, 3. [Google Scholar] [CrossRef] [PubMed] [Green Version]
  9. Rafique, M.; Mubashar, R.; Irshad, M.; Gillani, S.S.A.; Tahir, M.B.; Khalid, N.R.; Yasmin, A.; Shehzad, M.A. A Comprehensive Study on Methods and Materials for Photocatalytic Water Splitting and Hydrogen Production as a Renewable Energy Resource. J. Inorg. Organomet. Polym. Mater. 2020, 30, 3837–3861. [Google Scholar] [CrossRef]
  10. Abe, J.O.; Popoola, A.; Ajenifuja, E.; Popoola, O.M. Hydrogen energy, economy and storage: Review and recommendation. Int. J. Hydrogen Energ. 2019, 44, 15072–15086. [Google Scholar] [CrossRef]
  11. He, F.; Jeon, W.; Choi, W. Photocatalytic air purification mimicking the self-cleaning process of the atmosphere. Nat. Commun. 2021, 12, 2528. [Google Scholar] [CrossRef]
  12. Bui, V.K.H.; Nguyen, T.N.; van Tran, V.; Hur, J.; Kim, I.T.; Park, D.; Lee, Y.-C. Photocatalytic materials for indoor air purification systems: An updated mini-review. Environ. Technol. Innov. 2021, 22, 101471. [Google Scholar] [CrossRef]
  13. Wang, C.; Cai, M.; Liu, Y.; Yang, F.; Zhang, H.; Liu, J.; Li, S. Facile construction of novel organic-inorganic tetra (4-carboxyphenyl) porphyrin/Bi2MoO6 heterojunction for tetracycline degradation: Performance, degradation pathways, intermediate toxicity analysis and mechanism insight. J. Colloid Interface Sci. 2022, 605, 727–740. [Google Scholar] [CrossRef]
  14. Brisbin, R.; Zhou, J.; Bond, T.; Voss, L.; Simon, A.J.; Baxter, R.; Chang, A.S. Plasmonics-Enhanced UV Photocatalytic Water Purification. J. Phys. Chem. C 2021, 125, 9730–9735. [Google Scholar] [CrossRef]
  15. Berkani, M.; Smaali, A.; Kadmi, Y.; Almomani, F.; Vasseghian, Y.; Lakhdari, N.; Alyane, M. Photocatalytic degradation of Penicillin G in aqueous solutions: Kinetic, degradation pathway, and microbioassays assessment. J. Hazard. Mater. 2022, 421, 126719. [Google Scholar] [CrossRef]
  16. Li, S.; Wang, C.; Liu, Y.; Xue, B.; Chen, J.; Wang, H.; Liu, Y. Facile Preparation of a Novel Bi2WO6/Calcined Mussel Shell Composite Photocatalyst with Enhanced Photocatalytic Performance. Catalysts 2020, 10, 1166. [Google Scholar] [CrossRef]
  17. He, D.; Zhang, Z.; Xing, Y.; Zhou, Y.; Yang, H.; Liu, H.; Qu, J.; Yuan, X.; Guan, J.; Zhang, Y. Black phosphorus/graphitic carbon nitride: A metal-free photocatalyst for “green” photocatalytic bacterial inactivation under visible light. Chem. Eng. J. 2020, 384, 123258. [Google Scholar] [CrossRef]
  18. Liu, N.; Ming, J.; Sharma, A.; Sun, X.; Kawazoe, N.; Chen, G.; Yang, Y. Sustainable photocatalytic disinfection of four representative pathogenic bacteria isolated from real water environment by immobilized TiO2-based composite and its mechanism. Chem. Eng. J. 2021, 426, 131217. [Google Scholar] [CrossRef]
  19. Ainas, M.; Hasnaoui, S.; Bouarab, R.; Abdi, N.; Drouiche, N.; Mameri, N. Hydrogen production with the cyanobacterium Spirulina platensis. Int. J. Hydrogen Energ. 2017, 42, 4902–4907. [Google Scholar] [CrossRef]
  20. Sadvakasova, A.K.; Kossalbayev, B.D.; Zayadan, B.K.; Bolatkhan, K.; Alwasel, S.; Najafpour, M.M.; Tomo, T.; Allakhverdiev, S.I. Bioprocesses of hydrogen production by cyanobacteria cells and possible ways to increase their productivity. Renew. Sustain. Energy Rev. 2020, 133, 110054. [Google Scholar] [CrossRef]
  21. Touloupakis, E.; Rontogiannis, G.; Silva Benavides, A.M.; Cicchi, B.; Ghanotakis, D.F.; Torzillo, G. Hydrogen production by immobilized Synechocystis sp. PCC 6803. Int. J. Hydrogen Energ. 2016, 41, 15181–15186. [Google Scholar] [CrossRef]
  22. Jafari, T.; Moharreri, E.; Amin, A.S.; Miao, R.; Song, W.; Suib, S.L. Photocatalytic Water Splitting-The Untamed Dream: A Review of Recent Advances. Molecules 2016, 21, 900. [Google Scholar] [CrossRef] [PubMed]
  23. Zhang, P.; Zhang, J.; Gong, J. Tantalum-based semiconductors for solar water splitting. Chem. Soc. Rev. 2014, 43, 4395–4422. [Google Scholar] [CrossRef] [PubMed]
  24. Maeda, K. Photocatalytic water splitting using semiconductor particles: History and recent developments. J. Photochem. Photobiol. C Photochem. Rev. 2011, 12, 237–268. [Google Scholar] [CrossRef]
  25. Parmar, A.; Singh, N.K.; Pandey, A.; Gnansounou, E.; Madamwar, D. Cyanobacteria and microalgae: A positive prospect for biofuels. Bioresour. Technol. 2011, 102, 10163–10172. [Google Scholar] [CrossRef]
  26. Mangan, N.M.; Flamholz, A.; Hood, R.D.; Milo, R.; Savage, D.F. pH determines the energetic efficiency of the cyanobacterial CO2 concentrating mechanism. Proc. Natl. Acad. Sci. USA 2016, 113, E5354–E5362. [Google Scholar] [CrossRef] [Green Version]
  27. Kaneko, T.; Sato, S.; Kotani, H.; Tanaka, A.; Asamizu, E.; Nakamura, Y.; Miyajima, N.; Hirosawa, M.; Sugiura, M.; Sasamoto, S.; et al. Sequence analysis of the genome of the unicellular cyanobacterium Synechocystis sp. strain PCC6803. II. Sequence determination of the entire genome and assignment of potential protein-coding regions. DNA Res. 1996, 3, 109–136. [Google Scholar] [CrossRef] [Green Version]
  28. Kaneko, T.; Tabata, S. Complete genome structure of the unicellular cyanobacterium Synechocystis sp. PCC6803. Plant. Cell Physiol. 1997, 38, 1171–1176. [Google Scholar] [CrossRef] [Green Version]
  29. Kaneko, T.; Nakamura, Y.; Sasamoto, S.; Watanabe, A.; Kohara, M.; Matsumoto, M.; Shimpo, S.; Yamada, M.; Tabata, S. Structural analysis of four large plasmids harboring in a unicellular cyanobacterium, Synechocystis sp. PCC 6803. DNA Res. 2003, 10, 221–228. [Google Scholar] [CrossRef]
  30. Kato, H.; Kudo, A. New tantalate photocatalysts for water decomposition into H2 and O2. Chem. Phys. Lett. 1998, 295, 487–492. [Google Scholar] [CrossRef]
  31. Kato, H.; Asakura, K.; Kudo, A. Highly Efficient Water Splitting into H2 and O2 over Lanthanum-Doped NaTaO3 Photocatalysts with High Crystallinity and Surface Nanostructure. J. Am. Chem. Soc. 2003, 125, 3082–3089. [Google Scholar] [CrossRef]
  32. Kudo, A.; Kato, H. Effect of lanthanide-doping into NaTaO3 photocatalysts for efficient water splitting. Chem. Phys. Lett. 2000, 331, 373–377. [Google Scholar] [CrossRef]
  33. Kato, H.; Kudo, A. Photocatalytic water splitting into H2 and O2 over various tantalate photocatalysts. Catal. Today 2003, 78, 561–569. [Google Scholar] [CrossRef]
  34. Kato, H.; Kudo, A. Highly efficient decomposition of pure water into H2 and O2 over NaTaO3 photocatalysts. Catal. Lett. 1999, 58, 153–155. [Google Scholar] [CrossRef]
  35. Kramm, U.I.; Marschall, R.; Rose, M. Pitfalls in Heterogeneous Thermal, Electro- and Photocatalysis. ChemCatChem 2019, 11, 2563–2574. [Google Scholar] [CrossRef]
  36. Moustakas, N.G.; Strunk, J. Photocatalytic CO2 Reduction on TiO2 -Based Materials under Controlled Reaction Conditions: Systematic Insights from a Literature Study. Chemistry 2018, 24, 12739–12746. [Google Scholar] [CrossRef]
  37. Habisreutinger, S.N.; Schmidt-Mende, L.; Stolarczyk, J.K. Photokatalytische Reduktion von CO2 an TiO2 und anderen Halbleitern. Angew. Chem. 2013, 125, 7516–7557. [Google Scholar] [CrossRef]
  38. Loh, J.Y.Y.; Sharma, G.; Kherani, N.P.; Ozin, G.A. Post-Illumination Photoconductivity Enables Extension of Photo-Catalysis after Sunset. Adv. Energy Mater. 2021, 11, 2101566. [Google Scholar] [CrossRef]
  39. Melchionna, M.; Fornasiero, P. Updates on the Roadmap for Photocatalysis. ACS Catal. 2020, 10, 5493–5501. [Google Scholar] [CrossRef] [Green Version]
  40. Ohtani, B. Preparing Articles on Photocatalysis—Beyond the Illusions, Misconceptions, and Speculation. Chem. Lett. 2008, 37, 216–229. [Google Scholar] [CrossRef] [Green Version]
  41. Ohtani, B. Design and Development of Active Titania and Related Photocatalysts. In Photocatalysis and Water Purification: From Fundamentals to Recent Applications; Pichat, P., Ed.; Wiley-VCH: Weinheim, Bergstr, 2013; pp. 73–102. ISBN 9783527645404. [Google Scholar]
  42. Vignolo-González, H.A.; Laha, S.; Jiménez-Solano, A.; Oshima, T.; Duppel, V.; Schützendübe, P.; Lotsch, B.V. Toward Standardized Photocatalytic Oxygen Evolution Rates Using RuO2@TiO2 as a Benchmark. Matter 2020, 3, 464–486. [Google Scholar] [CrossRef] [PubMed]
  43. Qureshi, M.; Takanabe, K. Insights on Measuring and Reporting Heterogeneous Photocatalysis: Efficiency Definitions and Setup Examples. Chem. Mater. 2017, 29, 158–167. [Google Scholar] [CrossRef]
  44. Sundar, K.P.; Kanmani, S. Progression of Photocatalytic reactors and it’s comparison: A Review. Chem. Eng. Res. Des. 2020, 154, 135–150. [Google Scholar] [CrossRef]
  45. McDaniel, N.D.; Bernhard, S. Solar fuels: Thermodynamics, candidates, tactics, and figures of merit. Dalton Trans. 2010, 39, 10021–10030. [Google Scholar] [CrossRef] [PubMed]
  46. Wachs, I.E.; Phivilay, S.P.; Roberts, C.A. Reporting of Reactivity for Heterogeneous Photocatalysis. ACS Catal. 2013, 3, 2606–2611. [Google Scholar] [CrossRef]
  47. Kudo, A.; Miseki, Y. Heterogeneous photocatalyst materials for water splitting. Chem. Soc. Rev. 2009, 38, 253–278. [Google Scholar] [CrossRef]
  48. Serpone, N.; Terzian, R.; Lawless, D.; Kennepohl, P.; Sauvé, G. On the usage of turnover numbers and quantum yields in heterogeneous photocatalysis. J. Photochem. Photobiol. A: Chem. 1993, 73, 11–16. [Google Scholar] [CrossRef]
  49. Gritzner, G.; Kreysa, G. Nomenclature, symbols and definitions in electrochemical engineering (IUPAC Recommendations 1993). Pure Appl. Chem. 1993, 65, 1009–1020. [Google Scholar] [CrossRef]
  50. Kisch, H.; Bahnemann, D. Best Practice in Photocatalysis: Comparing Rates or Apparent Quantum Yields? J. Phys. Chem. Lett. 2015, 6, 1907–1910. [Google Scholar] [CrossRef]
  51. Hisatomi, T.; Domen, K. Introductory lecture: Sunlight-driven water splitting and carbon dioxide reduction by heterogeneous semiconductor systems as key processes in artificial photosynthesis. Faraday Discuss. 2017, 198, 11–35. [Google Scholar] [CrossRef]
  52. Leblebici, M.E.; Stefanidis, G.D.; van Gerven, T. Comparison of photocatalytic space-time yields of 12 reactor designs for wastewater treatment. Chem. Eng. Process. 2015, 97, 106–111. [Google Scholar] [CrossRef]
  53. Buriak, J.M.; Kamat, P.V.; Schanze, K.S. Best practices for reporting on heterogeneous photocatalysis. ACS Appl. Mater. Interfaces 2014, 6, 11815–11816. [Google Scholar] [CrossRef]
  54. Maschmeyer, T.; Che, M. Catalytic aspects of light-induced hydrogen generation in water with TiO2 and other photocatalysts: A simple and practical way towards a normalization? Angew. Chem. Int. Ed. 2010, 49, 1536–1539. [Google Scholar] [CrossRef]
  55. Maschmeyer, T.; Che, M. Intrinsic Catalytic Activity versus Effective Light Usage-A Reply to Professor Kisch’s Comments. Angew. Chem. Int. Ed. 2010, 49, 9590–9591. [Google Scholar] [CrossRef]
  56. Kisch, H. On the problem of comparing rates or apparent quantum yields in heterogeneous photocatalysis. Angew. Chem. Int. Ed. 2010, 49, 9588–9589. [Google Scholar] [CrossRef]
  57. Kunz, L.Y.; Diroll, B.T.; Wrasman, C.J.; Riscoe, A.R.; Majumdar, A.; Cargnello, M. Artificial inflation of apparent photocatalytic activity induced by catalyst-mass-normalization and a method to fairly compare heterojunction systems. Energy Environ. Sci. 2019, 12, 1657–1667. [Google Scholar] [CrossRef]
  58. Takanabe, K. Photocatalytic Water Splitting: Quantitative Approaches toward Photocatalyst by Design. ACS Catal. 2017, 7, 8006–8022. [Google Scholar] [CrossRef]
  59. Nadeem, M.A.; Khan, M.A.; Ziani, A.A.; Idriss, H. An Overview of the Photocatalytic Water Splitting over Suspended Particles. Catalysts 2021, 11, 60. [Google Scholar] [CrossRef]
  60. Ballari, M.d.l.M.; Alfano, O.M.; Cassano, A.E. Mass transfer limitations in slurry photocatalytic reactors: Experimental validation. Chem. Eng. Sci. 2010, 65, 4931–4942. [Google Scholar] [CrossRef]
  61. Amaechi, I.C.; Katoch, R.; Kolhatkar, G.; Sun, S.; Ruediger, A. Particle size effect on the photocatalytic kinetics of barium titanate powders. Catal. Sci. Technol. 2020, 10, 6274–6284. [Google Scholar] [CrossRef]
  62. Li, D.; Song, H.; Meng, X.; Shen, T.; Sun, J.; Han, W.; Wang, X. Effects of Particle Size on the Structure and Photocatalytic Performance by Alkali-Treated TiO2. Nanomaterials 2020, 10, 546. [Google Scholar] [CrossRef] [PubMed] [Green Version]
  63. Kröger, J.; Jiménez-Solano, A.; Savasci, G.; Lau, V.W.h.; Duppel, V.; Moudrakovski, I.; Küster, K.; Scholz, T.; Gouder, A.; Schreiber, M.-L.; et al. Morphology Control in 2D Carbon Nitrides: Impact of Particle Size on Optoelectronic Properties and Photocatalysis. Adv. Funct. Mater. 2021, 31, 2102468. [Google Scholar] [CrossRef]
  64. Amano, F.; Ishinaga, E.; Yamakata, A. Effect of Particle Size on the Photocatalytic Activity of WO3 Particles for Water Oxidation. J. Phys. Chem. C 2013, 117, 22584–22590. [Google Scholar] [CrossRef]
  65. Carbajo, J.; Tolosana-Moranchel, A.; Casas, J.A.; Faraldos, M.; Bahamonde, A. Analysis of photoefficiency in TiO2 aqueous suspensions: Effect of titania hydrodynamic particle size and catalyst loading on their optical properties. Appl. Catal. B 2018, 221, 1–8. [Google Scholar] [CrossRef]
  66. Gerischer, H. Photocatalysis in aqueous solution with small TiO2 particles and the dependence of the quantum yield on particle size and light intensity. Electrochim. Acta 1995, 40, 1277–1281. [Google Scholar] [CrossRef]
  67. Broddrick, J.T.; Rubin, B.E.; Welkie, D.G.; Du, N.; Mih, N.; Diamond, S.; Lee, J.J.; Golden, S.S.; Palsson, B.O. Unique attributes of cyanobacterial metabolism revealed by improved genome-scale metabolic modeling and essential gene analysis. Proc. Natl. Acad. Sci. USA 2016, 113, E8344–E8353. [Google Scholar] [CrossRef] [Green Version]
  68. Hoque, M.A.; Guzman, M.I. Photocatalytic Activity: Experimental Features to Report in Heterogeneous Photocatalysis. Materials 2018, 11, 1990. [Google Scholar] [CrossRef] [Green Version]
  69. Long, S.P.; Humphries, S.; Falkowski, P.G. Photoinhibition of Photosynthesis in Nature. Annu. Rev. Plant. Physiol. Plant. Mol. Biol. 1994, 45, 633–662. [Google Scholar] [CrossRef]
  70. Liang, F.; Lindblad, P. Synechocystis PCC 6803 overexpressing RuBisCO grow faster with increased photosynthesis. Metab. Eng. Commun. 2017, 4, 29–36. [Google Scholar] [CrossRef]
  71. McCree, K.J. The action spectrum, absorptance and quantum yield of photosynthesis in crop plants. Agric. Meteorol. 1971, 9, 191–216. [Google Scholar] [CrossRef]
  72. Tabata, S.; Ohnishi, H.; Yagasaki, E.; Ippommatsu, M.; Domen, K. Light-intensity dependence in photocatalytic decomposition of water over K4Nb6O17 catalyst. Catal. Lett. 1994, 28, 417–422. [Google Scholar] [CrossRef]
  73. Bloh, J.Z. A Holistic Approach to Model the Kinetics of Photocatalytic Reactions. Front. Chem. 2019, 7, 128. [Google Scholar] [CrossRef]
  74. Touloupakis, E.; Cicchi, B.; Torzillo, G. A bioenergetic assessment of photosynthetic growth of Synechocystis sp. PCC 6803 in continuous cultures. Biotechnol Biofuels 2015, 8, 133. [Google Scholar] [CrossRef] [Green Version]
  75. Cui, M.; Liu, Y.; Zhang, J. The Variation of Growth Rate, Photosynthetic Activity, and Biodiesel Productivity in Synechocystis sp. PCC 6803 under Antibiotic Exposure. Bioenerg. Res. 2020, 13, 955–962. [Google Scholar] [CrossRef]
  76. Lai, B.; Schneider, H.; Tschörtner, J.; Schmid, A.; Krömer, J.O. Technical-scale biophotovoltaics for long-term photo-current generation from Synechocystis sp. PCC6803. Biotechnol. Bioeng. 2021, 118, 2637–2648. [Google Scholar] [CrossRef]
  77. Huang, Q.; Jiang, F.; Wang, L.; Yang, C. Design of Photobioreactors for Mass Cultivation of Photosynthetic Organisms. Engineering 2017, 3, 318–329. [Google Scholar] [CrossRef]
  78. Iwase, A.; Kato, H.; Okutomi, H.; Kudo, A. Formation of Surface Nano-step Structures and Improvement of Photocatalytic Activities of NaTaO3 by Doping of Alkaline Earth Metal Ions. Chem. Lett. 2004, 33, 1260–1261. [Google Scholar] [CrossRef]
  79. Stanier, R.Y.; Deruelles, J.; Rippka, R.; Herdman, M.; Waterbury, J.B. Generic Assignments, Strain Histories and Properties of Pure Cultures of Cyanobacteria. Microbiology 1979, 111, 1–61. [Google Scholar] [CrossRef] [Green Version]
Figure 1. Initial O2 evolution rate of Synechocystis (green) and initial H2 evolution rate (blue) of NiO/La-NTO under full light spectrum (without a light filter) at their respective light intensity for maximum photocatalytic activity, i.e., 10 mW cm−2 for Synechocystis and 200 mW cm−2 for NiO/La-NTO.
Catalysts 11 01415 g001
Figure 2. Initial O2 evolution rate of Synechocystis using simulated sunlight (AM 1.5 G filter) at a cell concentration of 0.163 g dm−3 (OD750 = 1).
Catalysts 11 01415 g002
Figure 3. Initial O2 evolution rate of Synechocystis (green) and initial H2 evolution rate of NiO/La-NTO (blue) under full light spectrum (without a light filter) using a cell concentration of 0.163 g dm−3 (OD750 = 1) for the bacteria cells and a photocatalyst concentration of 1 g dm−3 for the semiconductor.
Catalysts 11 01415 g003
Figure 4. Bacteria dispersion in the buffer solution before (a) and after 5 h of irradiation with 20 mW cm−2 UV-light (b). The brownish color tone indicates the photodegradation of the bacteria.
Catalysts 11 01415 g004
Table 1. Overview of catalytic and photocatalytic figures of merit divided into material based and light based quantities and their transferability towards bio-photocatalytic systems.
Figure of MeritEquationAdvantages/DisadvantagesTransferableCitation
material-based
Reaction Rate r = d n p r o d u c t d t + Widely used
+ Can include information about catalyst
+ Easily accessible (Reaction Rate)
+ Suitable to evaluate, if the reaction is a catalytic phenomenon (TON)
− Completely neglects influence of light
− Can depend on the measurement time
− Can be limited by other factors (Co-catalyst concentration, catalyst concentration)
− Requires knowledge about the active sites (TOF/TON)
Yes[37,45]
Reaction Rate Related to Catalyst Mass r = d n p r o d u c t d t · 1 m c a t a l y s t Yes (based on cell dry weight)
Turnover Frequency (TOF) T O F = 1 N a c t i v e   s i t e · d N p r o d u c t d t Yes[37,45,46]
Turnover Number (TON) T O N = N p r o d u c t N a c t i v e   s i t e T O N = N r e a c t e d   e l e c t r o n s N a t o m s   i n   p h o t o c a t a l y s t
T O N = N r e a c t e d   e l e c t r o n s N a t o m s   a t   c a t a l y s t   s u r f a c e
Yes[37,46,47,48]
Space-Time-Yield (STY) S T Y = n p r o d u c t V R · t Yes[49]
light-based
Quantum Yield (QY) ϕ = N ˙ p h o t o c a t a l y t i c   e v e n t s N ˙ a b s o r b e d   p h o t o n s , λ + Takes the light source into account
+ Takes information about reactor geometry into account (STC/STH)
+/− Does not take losses of light due to catalytic setup into account and allows comparison of catalytic setups (AQY, AQE, η , STC/STH, PSTY)
+/− Takes losses of light due to catalytic setup into account and gives information about the intrinsic catalytic activity (QY, QE, ξ )
− Completely neglects the catalyst (concentration/amount, active sites)
− Requires knowledge about the absorbed photons (QY, QE)
− Requires monochromatic light (QY, PY, AQY)
− Only applicable to AM 1.5G light (STC/STH)
− Only applicable to H2 (STH)
Yes[37,39,43,50]
Apparent Quantum Yield (AQY) A Q Y % = N r e a c t e d   e l e c t r o n s N i n c i d e n t   p h o t o n s · 100 Yes[43,47]
Quantum Efficiency (QE)/Internal Quantum Efficiency (IQE) Q E = d N a b s o r b e d   p h o t o n s d t · r Yes (based on cell number)[43]
Photonic Efficiency (PE)/External Quantum Efficiency (EQE) ξ = r I 0 , λ i n t e r v a l l Yes[37,43,50]
Photonic Yield (PY) ξ = r q p , λ m o n o 0 Yes[43]
Power Conversion Efficiency η = i · H c , i 0 · r i P l a m p Yes[37]
Solar to Chemical Conversion Effiency (STC)/Solar to Hydrogen Efficiency (STH) S T C = r · Δ G r P s u n · S r e a c t o r A M 1.5 G S T H = r H 2 · Δ G r P s u n · S r e a c t o r A M 1.5 G Yes[43,51]
Photocatalytic Space-Time-Yield (PTSY) P S T Y = S T Y · P l a m p · 1 m 3 V R Yes[52]
Table 2. Material-based and light-based figures of merit for Synechocystis and NiO/La-NTO at maximum product evolution rate in this study (Synechocystis: ccell = 0.163 g dm−3, Ilight = 50 mW cm−2, AM 1.5 G filter; NiO/La-NTO: ccat = 1 g dm−3, Ilight = 200 mW cm−2, no filter).
Figure of MeritSynechocystisNiO/La-NTO
material-based
Initial reaction raterini/mmol h−15.5290.226
Mass-related initial reaction raterini,m/mmol h−1 g−1339.2022.194
Average reaction raterave/mmol h−14.8150.215
Mass related average reaction raterave,m/mmol h−1 g−1295.3952.092
Space time yieldSTY/mmol h−1 dm−319.4310.870
light-based
External quantum efficiencyEQE3.5 × 10−6250–800)3.2 × 10−3250–800)
External quantum efficiencyEQE3.5 × 10−6305–780)6.6 × 10−3250–305)
Apparent quantum yieldAQY/%1.4 × 10−3250–800)1.3 × (λ250–800)
Apparent quantum yieldAQY/%1.4 × 10−4305–780)2.7 × (λ250–305)
Photocatalytic space time yieldPSTY/mmol h−1 dm−3 kW−11.1 × 10−54.8 × 10−7
Table 3. Material-based and light-based figures of merit for Synechocystis and NiO/La-NTO at comparable reaction conditions Synechocystis: ccell = 0.163 g dm−3, Ilight = 20 mW cm−2, no filter; NiO/La-NTO: ccat = 1 g dm−3, Ilight = 20 mW cm−2, no filter).
Figure of MeritSynechocystisNiO/La-NTO
material-based
Initial reaction raterini/mmol h−10.0910.030
Mass related initial reaction raterini,m/mmol h−1 g−15.5580.300
Average reaction raterave/mmol h−10.2060.004
Mass related average reaction raterave,m/mmol h−1 g−112.6230.045
Space time yieldSTY/mmol h−1 dm−30.8300.018
Light-based Figures of Meritlight-based
External quantum efficiencyEQE1.3 × 10−2250–800)8.7 × 10−3250–800)
External quantum efficiencyEQE1.3 × 10−2305–780)8.8 × 10−3250–305)
Apparent quantum yieldAQY/%5.2 × (λ250–800)3.5 × (λ250–800)
Apparent quantum yieldAQY/%5.3 × (λ305–780)3.5 × (λ250–305)
Photocatalytic space time yieldPSTY/mmol h−1 dm−3 kW−14.6 × 10−79.9 × 10−9
Publisher’s Note: MDPI stays neutral with regard to jurisdictional claims in published maps and institutional affiliations.

