
A Thermally Conductive Pt/AAO Catalyst for Hydrogen Passive Autocatalytic Recombination


Hydrogen South Africa (HySA) Infrastructure, Faculty of Engineering, North-West University (NWU), Potchefstroom Campus, Private Bag X6001, Potchefstroom 2520, South Africa
*
Authors to whom correspondence should be addressed.
Catalysts 2021, 11(4), 491; https://0-doi-org.brum.beds.ac.uk/10.3390/catal11040491
Submission received: 8 March 2021
/
Revised: 17 March 2021
/
Accepted: 24 March 2021
/
Published: 12 April 2021
(This article belongs to the Section Catalytic Materials)
Abstract
:In this study, a Pt/anodized aluminum oxide (AAO) catalyst was prepared by the anodization of an Al alloy (Al6082, 97.5% Al), followed by the incorporation of Pt via an incipient wet impregnation method. Then, the Pt/AAO catalyst was evaluated for autocatalytic hydrogen recombination. The Pt/AAO catalyst’s morphological characteristics were determined by scanning electron microscopy (SEM) and transmission electron microscopy (TEM). The average Pt particle size was determined to be 3.0 ± 0.6 nm. This Pt/AAO catalyst was tested for the combustion of lean hydrogen (0.5–4 vol% H2 in the air) in a recombiner section testing station. The thermal distribution throughout the catalytic surface was investigated at 3 vol% hydrogen (H2) using an infrared camera. The Al/AAO system had a high thermal conductivity, which prevents the formation of hotspots (areas where localized surface temperature is higher than an average temperature across the entire catalyst surface). In turn, the Pt stability was enhanced during catalytic hydrogen combustion (CHC). A temperature gradient over 70 mm of the Pt/AAO catalyst was 23 °C and 42 °C for catalysts with uniform and nonuniform (worst-case scenario) Pt distributions. The commercial computational fluid dynamics (CFD) code STAR-CCM+ was used to compare the experimentally observed and numerically simulated thermal distribution of the Pt/AAO catalyst. The effect of the initial H2 volume fraction on the combustion temperature and conversion of H2 was investigated. The activation energy for CHC on the Pt/AAO catalyst was 19.2 kJ/mol. Prolonged CHC was performed to assess the durability (reactive metal stability and catalytic activity) of the Pt/AAO catalyst. A stable combustion temperature of 162.8 ± 8.0 °C was maintained over 530 h of CHC. To confirm that Pt aggregation was avoided, the Pt particle size and distribution were determined by TEM before and after prolonged CHC.
1. Introduction
In nuclear power plants (NPPs) and the mining industry, passive autocatalytic recombiners (PARs) are considered hydrogen (H2) control systems for emergency gas removal based on their recombination with ambient oxygen. It is widely recognized that, in underground mines, the replacement of diesel-powered vehicles with H2-fueled trucks will result in a cleaner environment for underground mineworkers. Water is the only byproduct of H2 combustion/oxidation, instead of the otherwise harmful greenhouse gases (e.g., COx, CH4) and NOx generated during the combustion of hydrocarbon-based fuels. Furthermore, besides the gaseous exhausts, harmful pollutants and particulate matter form during incomplete combustion of diesel fuel hydrocarbons, which presents underground workers with further harmful exposure.
However, the utilization of H2 in confined spaces is accompanied by the risk of accidental gas release and its accumulation. In NPPs, H2 may be generated unintentionally as a result of the reactor fuel overheating and the chemical reaction of fuel rods’ zirconium cladding with steam [1]. When the flammable concentration of H2 (4–75 vol% in the air) accumulates, damage to/loss of structures and equipment and loss of life in mines and NPPs may occur during accidental combustion. Therefore, the issue of safety must be taken into account in the event of accidental H2 release. PARs are considered to play a key role in accident mitigation in mines and NPPs.
A PAR is a safety device based on the idea of catalytic recombination of H2 and O2 according to the reaction:
PARs function without the requirement for an external power source. H2 mitigation occurs spontaneously when the gas mixture reaches the catalyst surface. The air that contains H2 enters at the lower end of a PAR, and exothermic reaction heat is formed as the H2 is recombined. Natural convection forces airflow through the PAR. H2 removal in PARs commences at nonflammable H2 concentrations (1–2 vol%), thereby preventing the formation of explosive mixtures with the air. However, when a large amount of H2 is released, as in the event of a severe accident, the recombiner can overheat due to the large exothermic effect. Therefore, the PAR itself may then become the H2 ignition source.
The effect of thermal distribution throughout the PAR catalyst section on H2 risk mitigation has been studied mainly by using numerical simulations, specifically, computational fluid dynamics (CFD) [2,3]. Results of studies have shown that the thermal distribution over the catalytic surface plays an important role in risk mitigation related to the PAR autoignition. CFD modeling is widely recognized as a powerful numerical tool to analyze hydrogen safety issues. CFD simulations are generally in good agreement with experimental results and show a high level of predictability [4].
Catalytic hydrogen combustion (CHC) will likely play a key role in a hydrogen economy for safety purposes (in PARs) as well as for heating appliances (cooking and spatial heating). The reaction is relatively safe (no flashback phenomenon and NOx emission, under certain conditions) and controllable [5]. Among the platinum group metals, Pt and Pd are considered to be the most suitable catalysts for CHC [6,7,8,9,10]. They have also found diverse applications as catalytic materials, such as chemical and biosensing systems [11,12,13], proton exchange membrane fuel cells [14,15], electrochemical H2 compressors [16,17]. When addressing research on CHC, it should be emphasized that the catalyst support significantly affects the activity of the catalytic system as it improves the dispersion of a reactive metal, affects the heat distribution throughout the catalyst surface, and prevents/limits catalyst deactivation (support degradation/reactive metal aggregation). As far as we could determine, catalyst supports, such as ceramics, metal oxides ZrO2, TiO2, SiO2 [6,8,18,19,20,21], γ-Al2O3 washcoat [22], SiC foam [23,24], and stainless steel mesh (SSM) [25] have been examined for CHC.
Kramer et al. studied PdOx and Pd catalysts supported on a γ-Al2O3 washcoat for CHC. They observed < 40% H2 conversion at low inlet temperatures (<125 °C). Furthermore, there was an increase in H2 conversion with an increase in the inlet temperature (100% conversion at 200 °C). Of importance here is that the presence of water vapor caused a reduction in H2 conversion; furthermore, it was found that the lower the inlet temperature, the more significant was the effect of water vapor [22]. These results of Kramer et al. could be expected, as the presence of water accelerates catalyst aggregation, hence reducing the catalytic activity [26]. In a study by Du Preez et al., aggregation of Pt catalyst occurred on the SSM support during CHC at 420–520 °C. This occurrence was ascribed to the fact that the SSM surface allows significant Pt mobility at high temperatures. However, these authors demonstrated that calcination of the SSM support at 500–1000 °C resulted in the stabilization of Pt particles, effectively preventing their aggregation during CHC [25].
Deshpande and Madras compared the use of ZrO2 and TiO2 as supports for Pt and Pd catalysts for CHC. The activity of the Pt and Pd catalysts was found to be higher with TiO2 support than with ZrO2; complete conversions of H2 over TiO2 supported catalysts were obtained at a temperature of 100 °C [20]. Hanson and Boudart studied the reaction between H2 and O2 over Pt/SiO2 catalyst in excess H2 and excess O2. The catalyst with smaller Pt particles (higher catalyst dispersion) exhibited higher catalytic activity in excess H2; the catalytic activity was almost independent of Pt particle size in excess O2 [21]. They then proposed that the latter observation can be related to the passivation/deactivation of the catalytic surface in excess of O2, especially in the case of smaller Pt particles. It was noticed that smaller Pt particles had higher O2 adsorption capacity, which resulted in the formation of Pt oxide. In turn, the presence of Pt oxide decreased the H2 combustion reactivity.
The use of SiC as catalyst support for CHC has been reported [23,24]. In a study by Fernández et al., the SiC support was found to be an appropriate material for the design of heating devices due to its high thermal conductivity [23]. The ability of catalyst support to dissipate/distribute heat is of critical importance when a catalytic system is employed for heating purposes. For example, the formation of hotspots (areas where localized surface temperature is higher than an average temperature across the entire catalyst surface) can be avoided if the catalyst support provides a uniform temperature distribution throughout the catalytic surface. Schefer et al. found that the presence of hotspots can result in H2 ignition if its autoignition temperature is exceeded [27]. Fumey et al. employed SiC foam with Pt coating as a catalyst for a catalytic burner, suitable for domestic cooking use. They found a uniform catalytic reaction of H2 combustion with a burner surface temperature <715 °C at an H2 flow rate of 5–15 Nl/min. The burner could achieve temperatures exceeding that of the H2 ignition temperature (>585 °C) due to specialized burner design. The layered structure and alternation of SiC foam discs (diffuser and catalytic disks) allowed the controlled H2 ignition in an air atmosphere between disks, allowing burner surface temperatures >585 °C [24].
In a recent study, in their preliminary investigations, Kozhukhova et al. found the Al/AAO support to be suitable as catalyst support for CHC purposes. The Pt/AAO catalyst was found to be highly stable over a prolonged CHC reaction time of 530 h. The stabilization of Pt particles was achieved, possibly due to the high thermal conductivity of the Al/AAO system. The heat produced during CHC was displaced from the AAO to the Al core, and a mild average catalyst surface temperature was achieved, which most likely limited Pt aggregation [28].
In the present work, we now demonstrate the use of Pt/AAO as a catalyst in an in-house-developed recombiner section testing station. The design of the testing station allows for the characterization of the thermal distribution of the catalyst section under conditions similar to those in real-world PAR applications [2]. The Pt/AAO catalyst performance was determined for CHC using lean H2 mixtures (0.5–4 vol% H2). The utilization of the Pt/AAO catalyst for PAR application is a prospective solution for low thermal conductive catalysts currently used in commercial PARs. Moreover, cheap Al alloy used as a substrate material for catalyst support preparation affords significant cost savings when compared to ceramic support materials. Therefore, the catalyst cost reduction along with the increase in its performance may afford a widespread penetration of PAR technology.
The temperature distribution across the catalytic surface during CHC was determined using an infrared (IR) camera. Structural and chemical characteristics of the catalyst and catalyst support were determined using scanning electron microscopy (SEM) and transmission electron microscopy (TEM). A numerical model was created in STAR-CCM+ in combination with the chemistry tools of CHEMKIN to investigate temperature distribution throughout the Pt/AAO catalyst and to compare it with the experimental data [29].
2. Results and Discussion
2.1. Catalytic Test in the Recombiner Section Testing Station
Preliminary work by Kozhukhova et al. showed the potential of an AAO as suitable catalyst support for CHC purposes [28]. The high thermal conductivity of an Al/AAO system afforded a mild average surface temperature throughout the catalyst surface that likely prevented catalyst deactivation during CHC. Moreover, due to the AAO’s structural features (hexagonally organized array of pores) and the high dispersion of the reactive metal (Pt), catalysts with high catalytic activity are obtained. In addition, the Al6082 alloy used in the present study is inexpensive and can be machined to any shape before the anodization, affording such a catalyst with a wide variety of practical applications. Therefore, the use of AAO as catalyst support affords not only significant cost savings (compared to the expensive ceramic catalyst support currently used in commercial PARs) but provides high catalytic activity and stability that that extends the operation time of such a catalytic system.
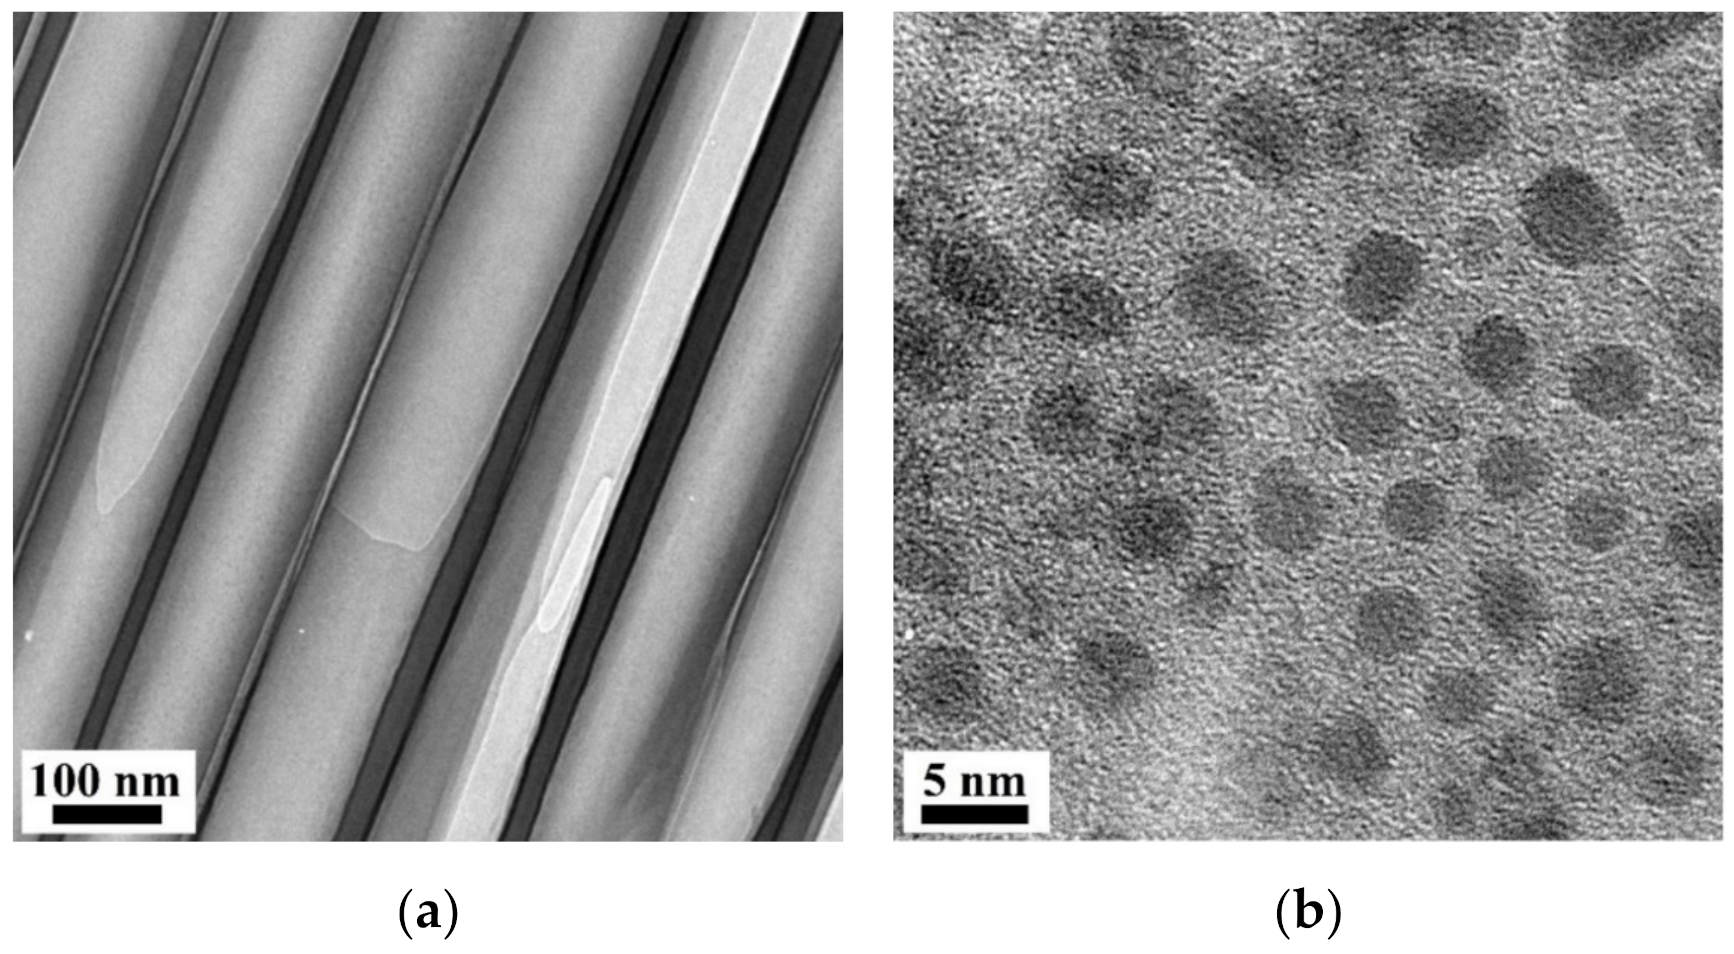
The AAO morphology, and Pt particle size and morphology, were determined before CHC procedures. Figure 1 shows representative bright-field and high-resolution TEM (HRTEM) images of the Pt/AAO catalyst.
Figure 1a shows the nanopore walls and channels of the Pt/AAO catalyst and suggests that the pores were tubular and relatively well constructed. Figure 1b shows that Pt particles are present within the AAO channels. Particle size measurements were carried out over several TEM images taken of different areas of a FIB lamella. The average diameter of Pt particles for the Pt/AAO catalyst was 3.0 ± 0.6 nm.
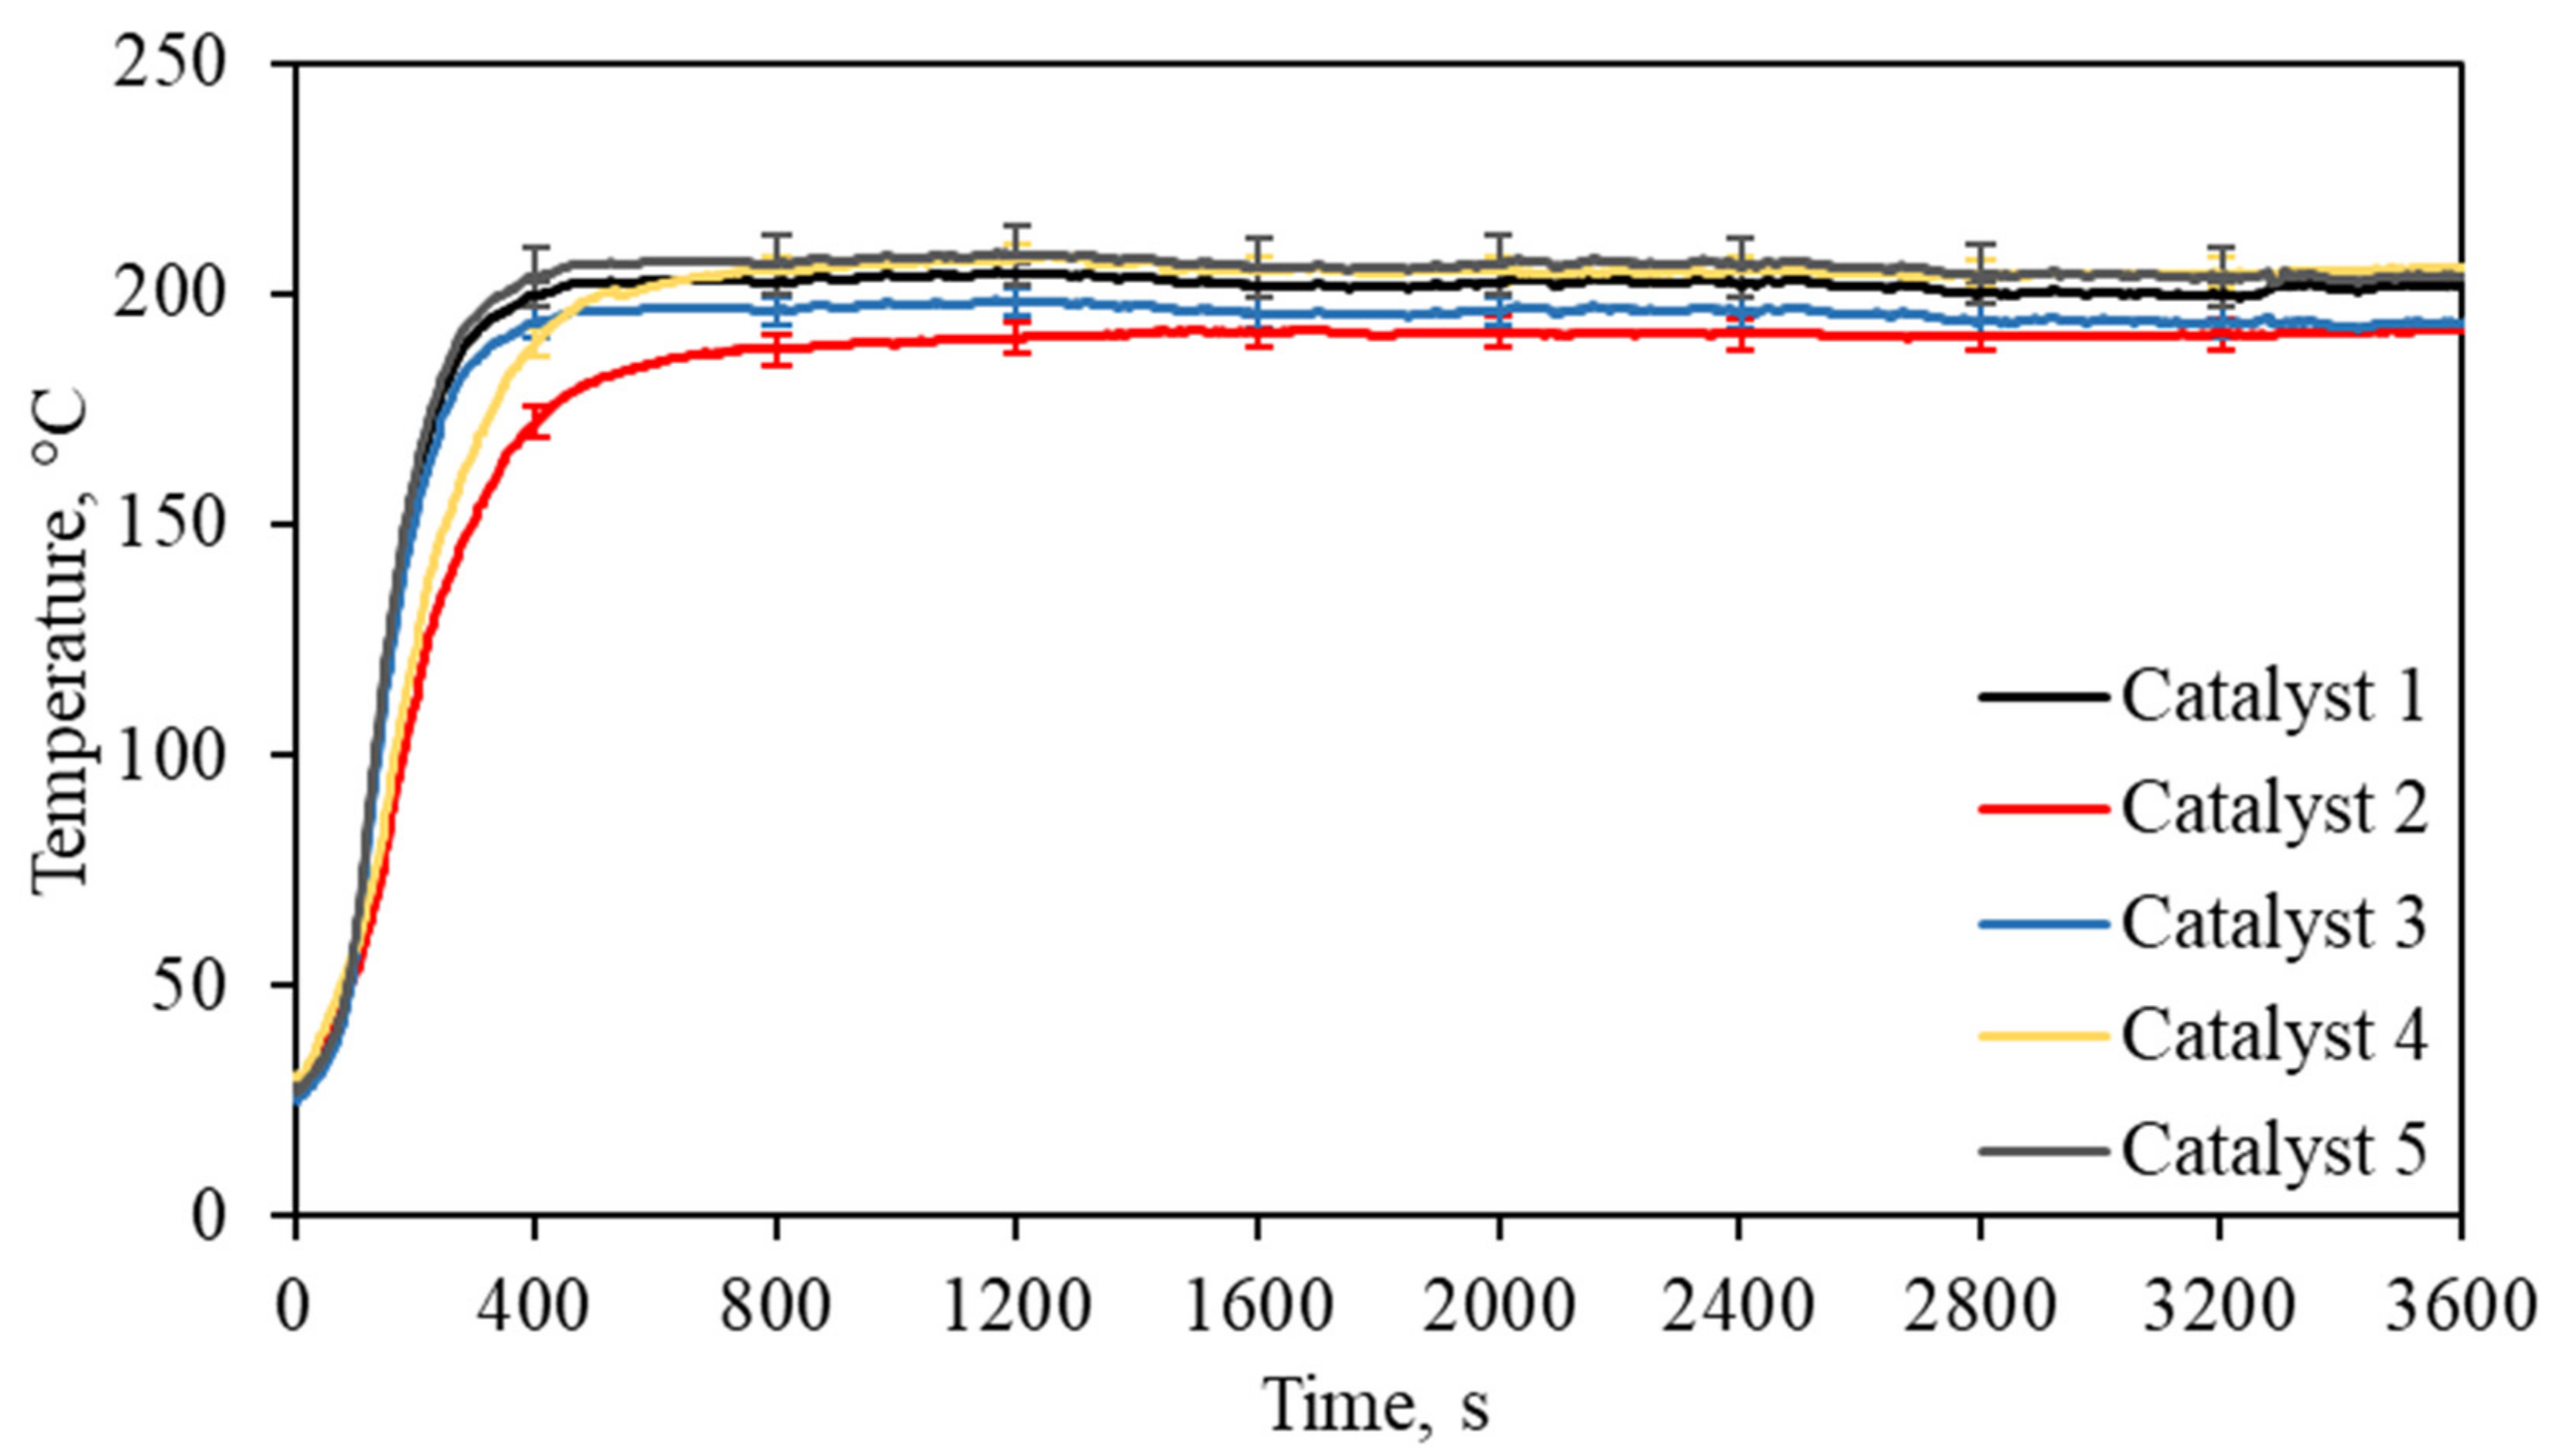
CHC over the prepared Pt/AAO catalyst was studied in the recombiner section testing station at a 3 vol% H2 concentration, at a gas mixture flow velocity of 9.5 m/s. Five Pt/AAO catalysts (prepared similarly) were placed inside the testing station constituting the catalyst section. During CHC procedures, thermal measurements of each catalyst were recorded every 1 s. The CHC tests were repeated in triplicate, and the standard deviation was calculated for each catalyst. There was a period of seven days between each repetition. During these aging periods between tests, catalysts were kept in the ambient atmosphere to investigate the behavior of the catalyst under conditions comparable to real-world PARs. The aging procedure was assumed to have a detrimental effect on the catalyst due to passivation by O2 and fouling. Poisoning by oxidants may cause changes in the oxidation state of the active catalyst and, hence, decrease the catalytic activity of the catalyst [26]. Hanson and Boudart observed that the passivation of Pt catalysts in excess O2 at low temperatures (0–100 °C) resulted in a loss in catalytic activity [21]. Ostermaier et al. reported the deactivation of a Pt/Al2O3 catalyst due to the formation of Pt oxide in an O2 atmosphere [30]. The deactivation of the catalyst was studied at temperatures of 95–200 °C. Deactivation was found to have a greater effect at low temperatures on catalysts with smaller Pt particles. Another important issue to consider is the inevitable dry deposition of fine solid material (dust) from the ambient atmosphere onto the catalysts used in PAR devices. This occurrence is referred to as fouling and prevents H2 from accessing the reactive sites of a catalyst [26]. Figure 2 shows average combustion temperature profiles for five catalysts for 1 h of CHC.
Figure 2 shows a steady increase in catalyst temperature for each catalyst during the first 400 s of CHC. Here, CHC was initiated spontaneously at room temperature (26–28 °C). The average combustion temperature was calculated for each catalyst based on three repeats. Stable combustion temperatures of 201.5 ± 2.6, 191.0 ± 3.3, 195.3 ± 3.3, 205.1 ± 3.1, and 204.9 ± 6.5 °C were reached for the catalysts 1–5, respectively. Considering that a relatively consistent average combustion temperature was achieved for each catalyst per test and that the CHC reaction initiated spontaneously suggests that the catalysts maintained their catalytic activity. The latter observations may be ascribed to the fact that the AAO support promotes the stabilization of Pt particles at the temperatures, as shown in Figure 2 [28]. Furthermore, the spontaneity of the reaction suggests that the catalyst preparation method yielded samples with relatively similar CHC reaction kinetics. It is also interesting to note the detrimental effects of catalyst exposure to ambient conditions during the periods between the tests (i.e., deactivation by ambient oxygen). An important perspective is to also determine the effect of prolonged exposure to air (several months) on the catalytic activity of Pt/AAO catalysts.
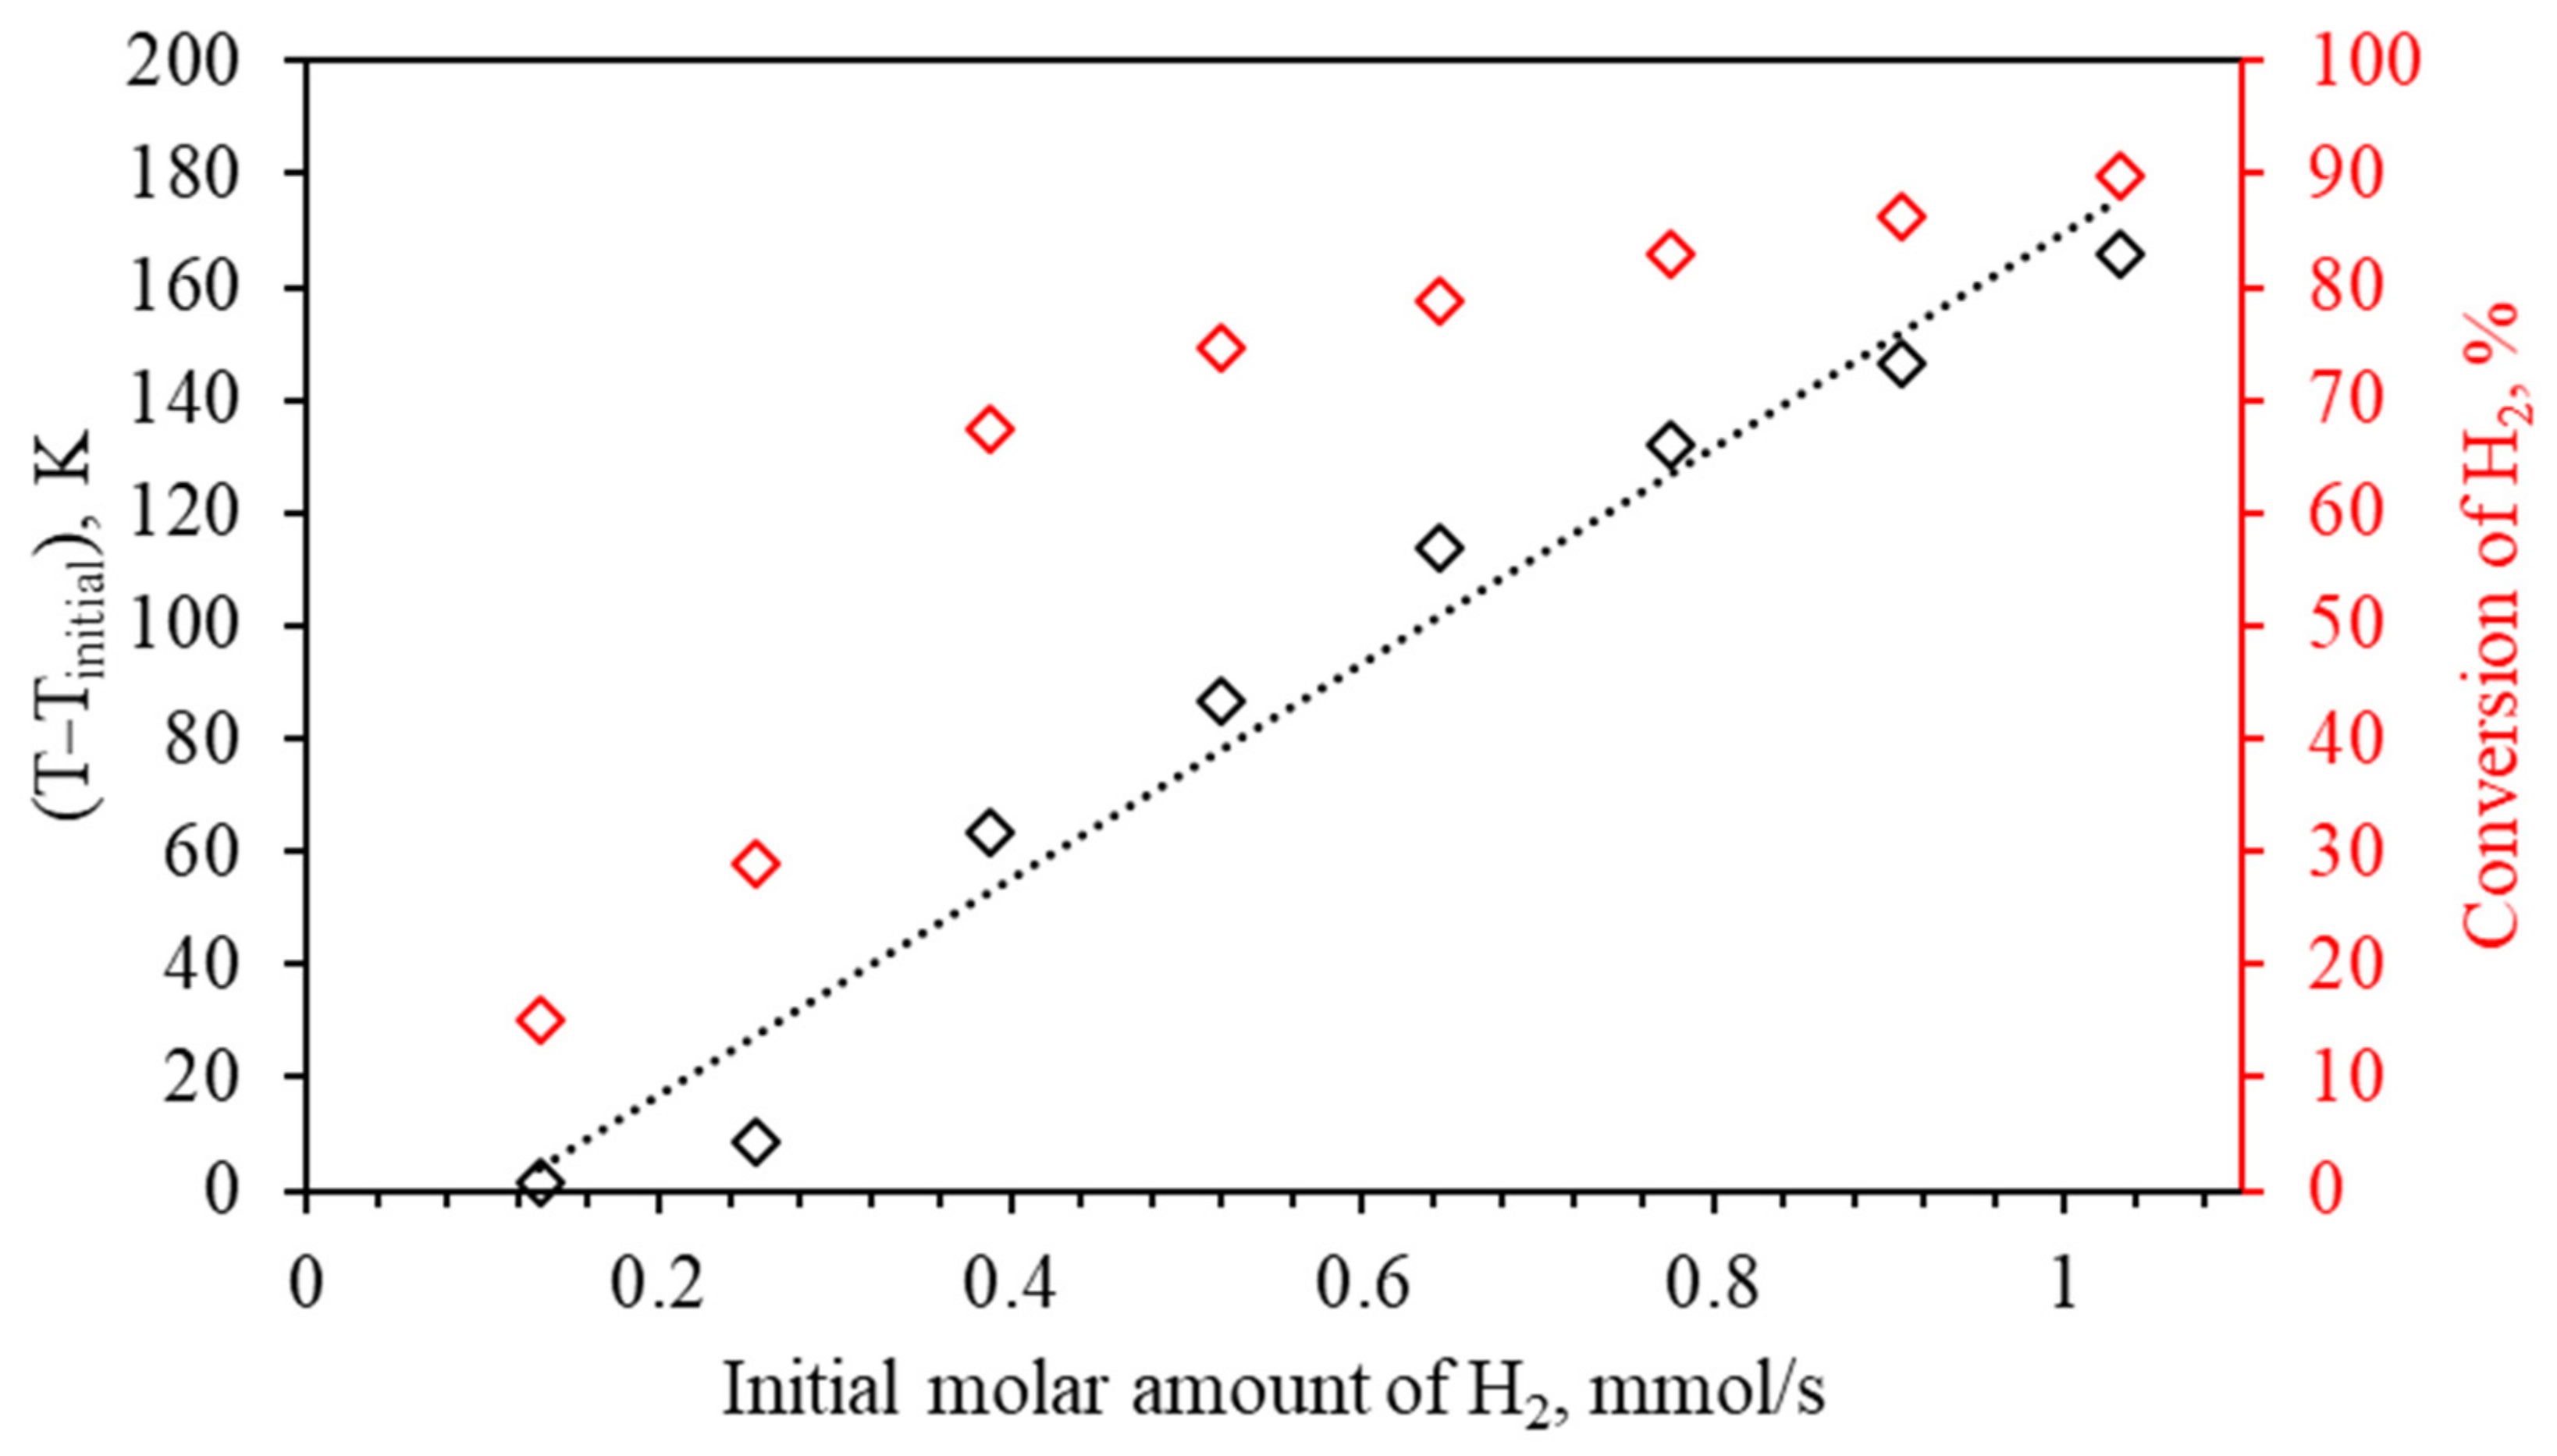
To characterize the Pt/AAO catalyst from a kinetic point of view, a series of experiments were carried out at the initial volume fraction of H2 in air ranging from 0.5 to 4.0 vol% (0.132–1.031 mmol/s, respectively). The conversion and combustion temperature were measured at an inlet flow velocity of 9.5 m/s H2/air. Close to 100% H2 conversions were observed for the initial H2 volume fractions of >4 vol%. (H2 volume fractions of >4 vol% were, therefore, not considered here.) Figure 3 shows the differences between the catalyst temperature before exposure to H2/air mixture (Tinitial) and after achieving steady-state conditions (T) (primary y-axis). The conversion of H2 at the various initial molar fractions of H2 is shown on the secondary y-axis. The initial temperatures of the catalyst were in the range 29–30 °C. For simpler comprehension of further results, the temperature and initial concentration of H2 are presented in Arrhenius equation units.
As is evident in Figure 3, the temperature of the catalyst at steady-state increased linearly with an increase in the initial molar amount of H2, which is in agreement with the results obtained by Nguyen et al. [31]. Figure 3 further shows that the conversion of H2 is dependent on the initial amount of H2. The H2 conversion increased from 15% to 90%, with an increase in the initial amount of H2. The maximum H2 conversion of 90% was obtained at the highest initial molar amount of H2 in air. The data obtained was used to determine the activation energy (Ea) of CHC on the Pt/AAO catalyst.
Due to the high exothermicity of the CHC reaction, the performance of the experiment under isothermal conditions is problematic and inconvenient. Therefore, in this work, the data obtained under adiabatic conditions were used to determine the reaction kinetics of the CHC reaction. According to Nguyen et al., the transformation of adiabatic data to isothermal is possible [31]. Figure 4a shows the change in the relative H2 fraction overtime during CHC at constant temperatures. The Arrhenius plot is shown in Figure 4b.
Figure 4a shows that the relative fraction of H2 dependence as a function of time gives an exponential function at different constant temperatures (except in the case of 311 K), thus corresponding to a first-order reaction. The latter observation corresponds with those made by Nguyen et al. [21,31] and Hanson and Boudart [21,31]. The rate constant can then be calculated as follows [31]:
where τ is the time required to reach a stable combustion temperature, χH2,0 and χH2 are the H2 compositions at τ = 0 and time required to reach steady-state conditions (τ), respectively.
ln(χH2,0) − ln(χH2) = kτ
k = (ln(χH2,0) − ln(χH2))/τ
Figure 4b shows that the temperature dependence of the reaction rate represents a linear function. The Ea calculated from the data presented in Figure 4b is 19.2 kJ/mol. A similar Ea value of 22.3 kJ/mol for CHC on a Pt/AAO catalyst has been reported by Joshi et al. [32]. However, the Ea value of various catalytic systems used for CHC can range from 7 to 46 kJ/mol. For instance, a Co3O4/Cr2O3 catalyst has an Ea of 10.3 kJ/mol [33], whereas a Pt/washcoat catalyst has an Ea of 8.7 kJ/mol [34]. For CHC using a Pt/SiO2 catalyst, Hansen and Boudart reported an Ea of 7.5 kJ/mol and 46 kJ/mol in excess of O2 and H2, respectively [21]. Meanwhile, Fernández et al. reported an Ea of 35 kJ/mol for a Pt/SiC catalyst with an excess of O2 [23]. Joshi et al. studied catalytic kinetics of the oxidation of a lean H2/air mixture on a Pt/Al2O3 washcoat monolith catalyst at low temperatures (<90 °C) and determined the effect of aging space velocity and temperature [32]. They reported an Ea of 45 kJ/mol for the freshly prepared catalyst and 22.3 kJ/mol for a catalyst aged at 800 °C for 1.5 h. In summary, the Ea of a specific catalyst for CHC is strongly dependent on the catalyst support, reactive metal loading, and experimental conditions. The Ea value reported here coincides with values reported in the literature.
2.2. Effect of the Support Structure on Catalyst Performance
It is generally accepted that the structure of the AAO support has an appreciable effect on the catalytic performance of a Pt/AAO catalyst. AAO formed on a high purity Al substrate can represent an ideal hexagonally organized structure reminiscent of a honeycomb assembly. Due to regularly organized pore distribution and parallel pore channel arrangement, the AAO support offers advantages for high catalyst dispersion, heat, and mass transfer [35,36]. When lower purity Al is used as a substrate for the catalyst support, the formation of the AAO layer with ordered pore arrangement is confounded by the presence of impurities. Impurities cause nonuniform localized electric field flow at the AAO/electrolyte boundary during anodization due to differences in resistivity [30,37,38]. As a result, pits and hillocks, branched pores, nanowires, and other imperfections are formed on and within the AAO layer. The presence of AAO layer imperfections may adversely affect the catalytic activity of an AAO supported catalyst, decreasing the active surface area and the reactive metal dispersion and particle size distribution.
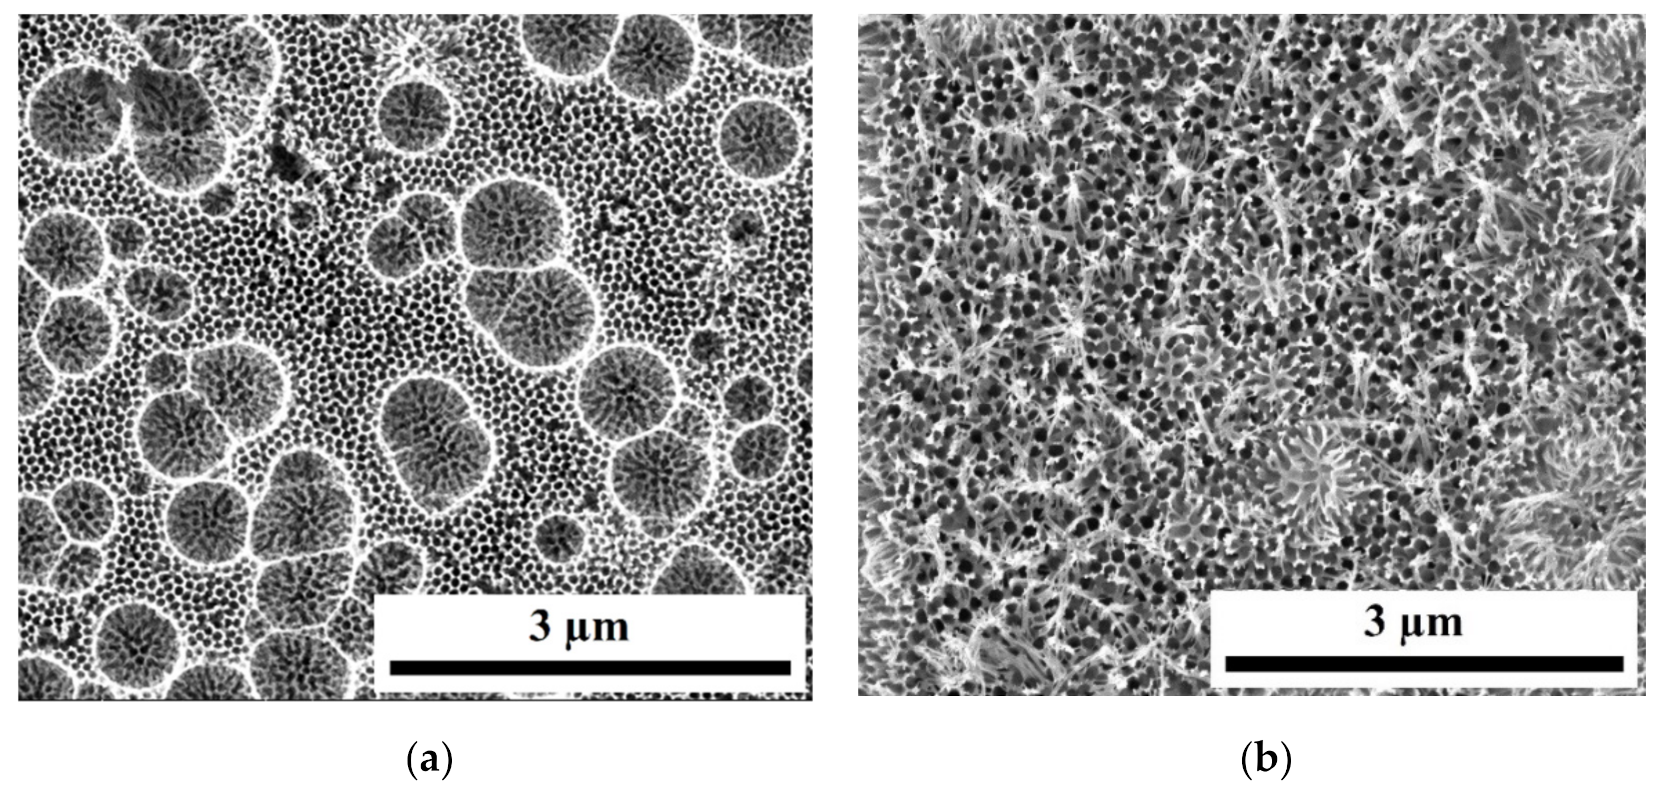
To investigate the effect of the AAO support structure on the catalytic performance in CHC, the Al substrate was exposed to a 4 h anodizing procedure. This anodization time of 4 h was chosen to intentionally form nanowires on the Al surface [30]. Figure 5 shows representative SEM micrographs of the AAO samples prepared by 1 h and 4 h anodization.
Figure 5a shows that the 1 h AAO layer had a relatively ordered pore distribution, but pits were present. The 4 h AAO layer presented in Figure 5b underwent extensive AAO dissolution during prolonged anodization, and nanowires formed throughout the AAO layer surface. Although the AAO layer presented in Figure 5b did not maintain the hexagonal structural integrity, nanowires are assumed to increase the active surface area after catalyst deposition due to the large exposed surface area. The morphological characteristics of the samples were determined over several SEM images using ImageJ software (National Institutes of Health (NIH), Bethesda, MD, USA). Results are presented in Table 1. The Dp and Dc were determined manually, and the areas where the pits (Figure 5a) and nanowires (Figure 5b) occurred were excluded from the calculations of the average values.
Table 1 shows that the 1 h AAO sample had a Dp of 55.7 nm compared to a Dp of 86.9 for the 4 h AAO sample. The Dc of samples increased from 79.5 nm to 121.0 nm with increasing anodization time from 1 h to 4 h. The increase in Dp and DC may be ascribed to AAO layer dissolution during prolonged anodization and extensive acidic exposure of the sample [28,30,31,39]. The n value decreased from 193 to 85 pores/μm2 for AAO samples prepared by 1 and 4 h anodization, respectively. The decrease in n is likely also caused by layer dissolution during anodization. The thinnest pore walls will undergo dissolution until they are completely dissolved, which causes pores to merge. The latter results in an increase in the Dp of pores and, consequently, a decrease in the number of pores. Table 1 further shows that P remained relatively unchanged. This could be expected, as P is defined as a ratio of Dp to Dc; both Dp and Dc increased, at a similar rate, with an increase in the anodization time. Generally, the morphological characteristics of the catalyst support affect the particle size distribution of the supported reactive metal, its dispersion, mass transfer rates, and, in turn, the catalytic activity [21,40]. For instance, Khodakov et al. showed a direct correlation between catalyst support pore size and Co3O4 particle size and correlation for a wide variety of mesoporous silica supports [40].
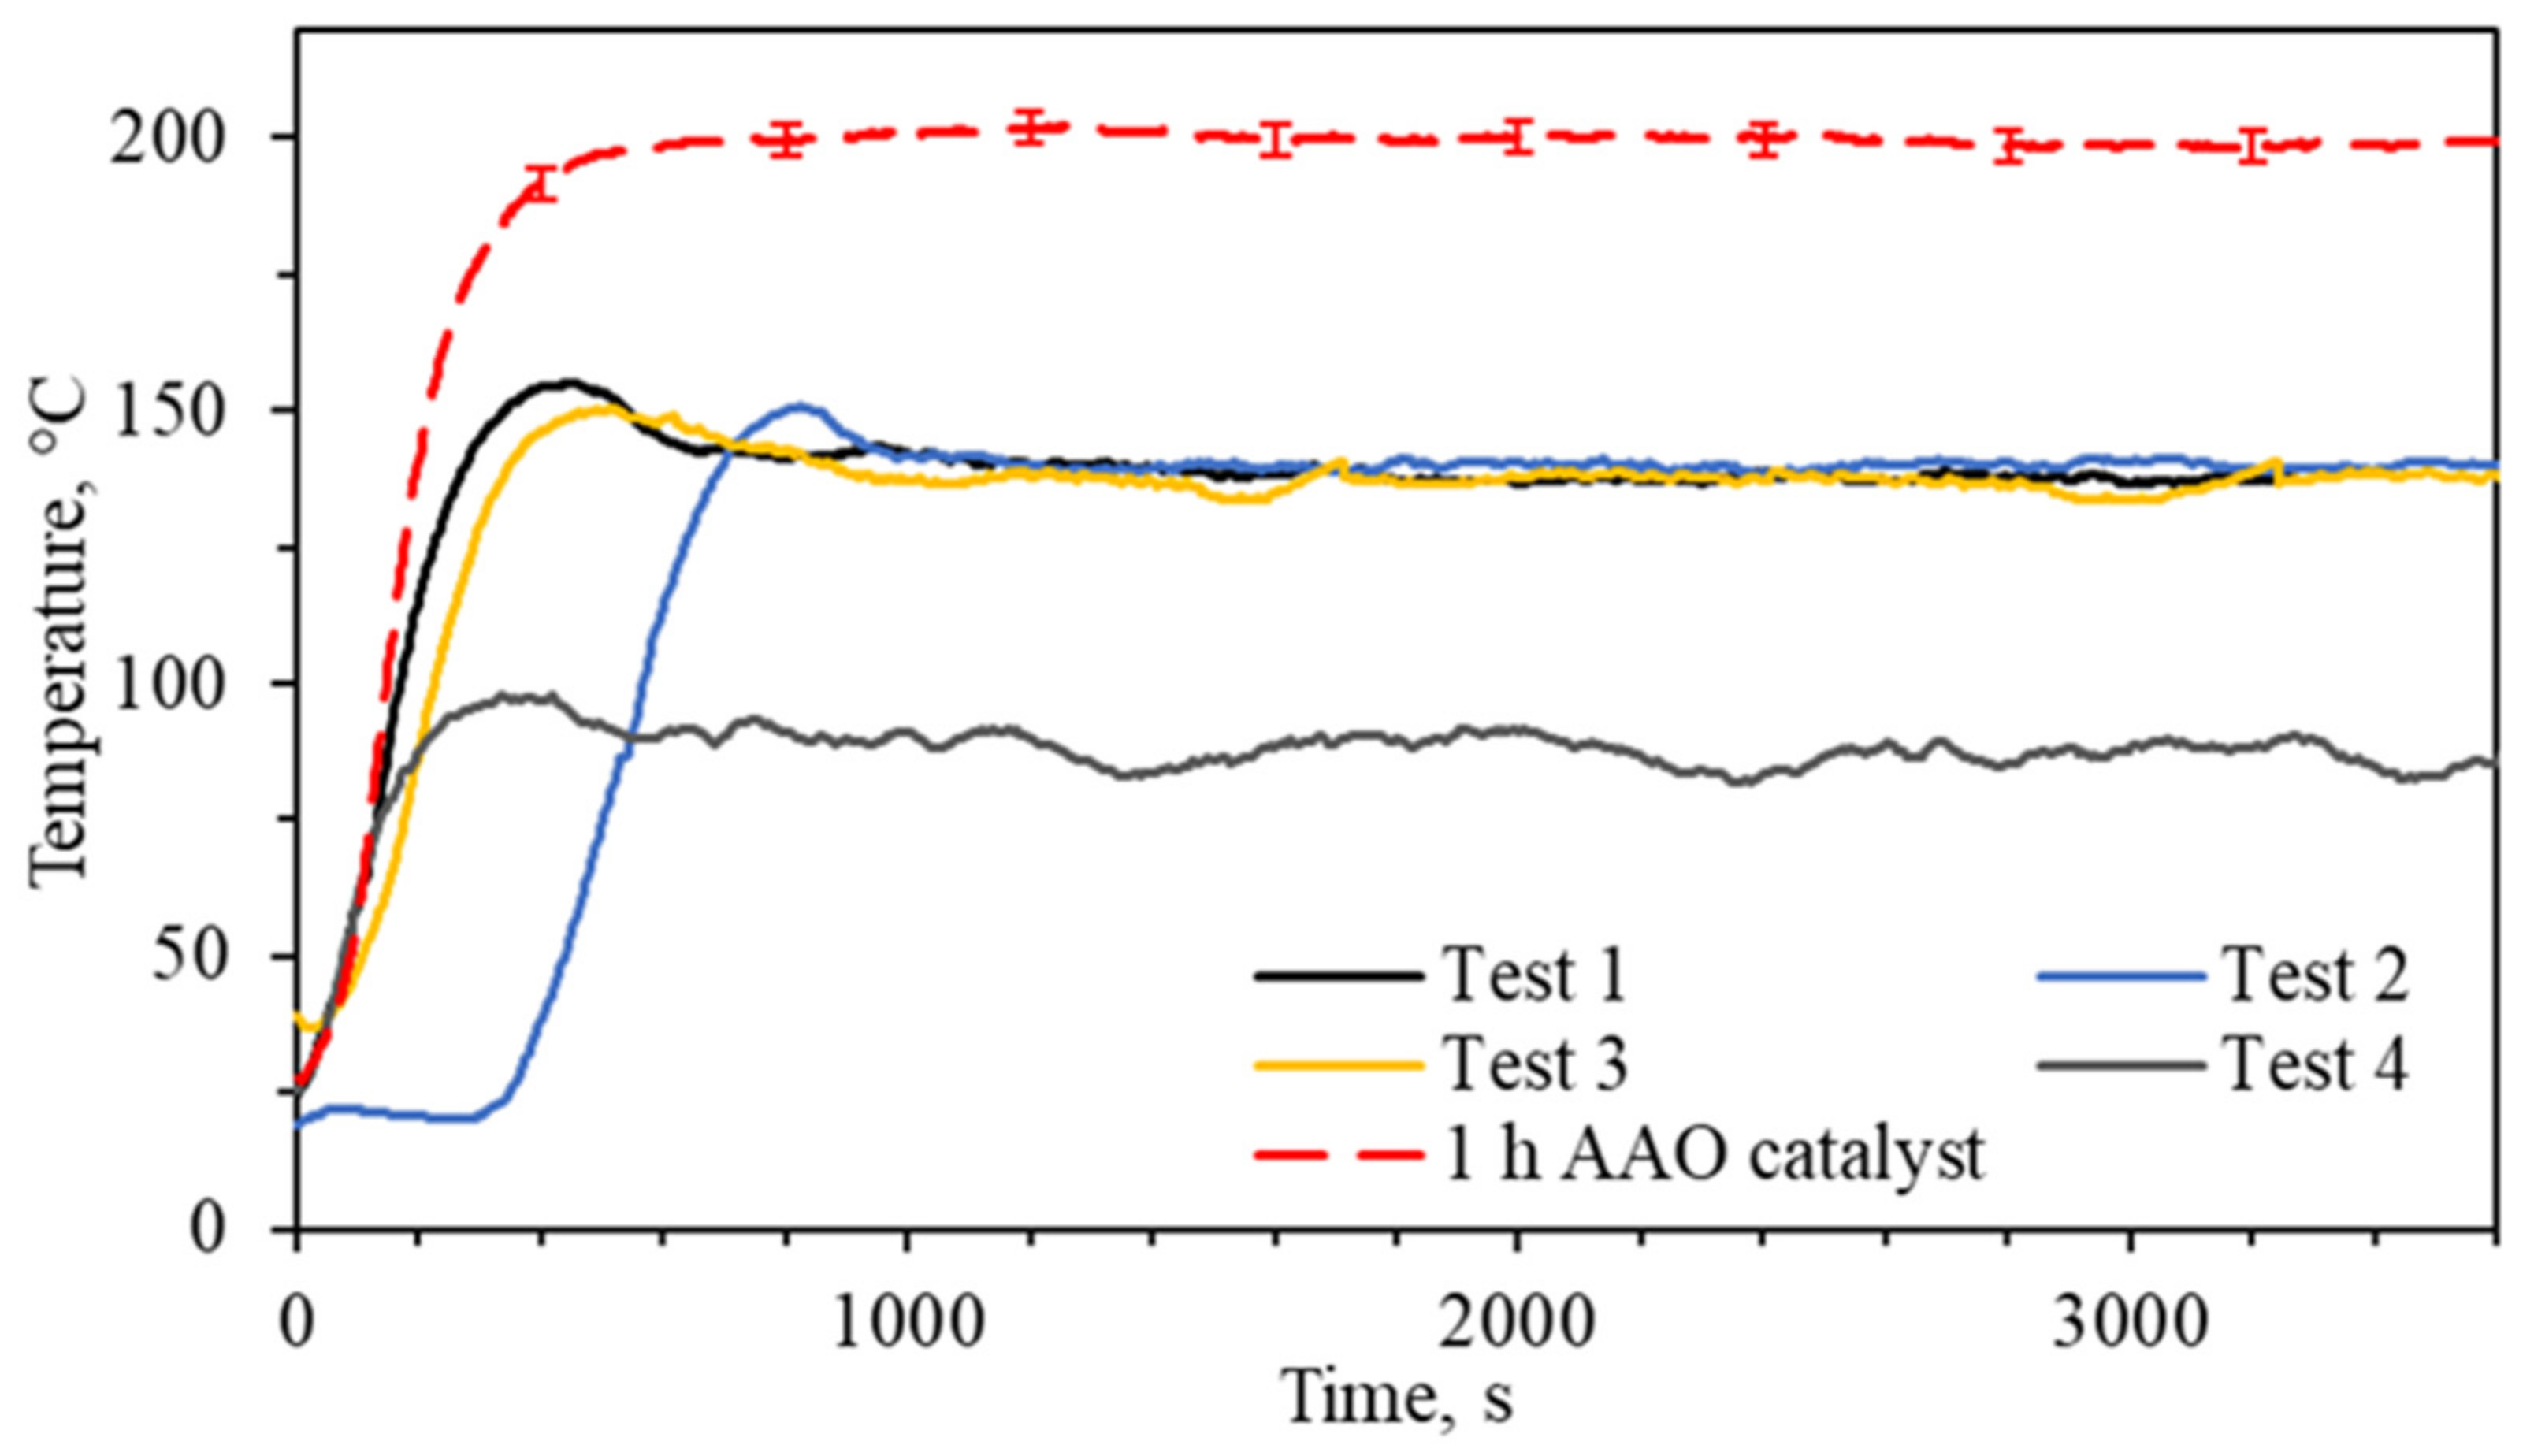
Pt/AAO samples were prepared using the 1, and 4 h anodized supports and their catalytic activities were compared. The catalytic activity tests were performed in the recombiner section testing station at a 3 vol% H2 concentration in air. The CHC tests were performed in triplicate, with seven days between each repetition. The average combustion temperature profiles for the 4 h AAO catalysts are presented in Figure 6. The average combustion temperature of the 1 h AAO catalysts presented in Figure 2 is included in Figure 6 (red dashed line) and serves as a reference value.
Figure 6 shows an average combustion temperature of 199.6 ± 2.9 °C for the 1 h AAO catalysts. A stable combustion temperature was reached after 300 s of H2 exposure. Figure 6 also shows combustion temperature profiles for the 4 h AAO catalyst. The latter catalyst exhibits very different combustion behavior to the 1 h AAO catalyst (see Figure 2). During Tests 1 and 2, stable combustion temperatures of 138.9 ± 1.9 and 140.1 ± 0.9 °C were reached after approximately 600 and 900 s of H2 exposure, respectively. The CHC was initiated at temperatures of 19–24 °C. The Pt/AAO catalyst had to be preheated to 40 °C to initiate the CHC reaction during Test 3, whereafter a stable combustion temperature of 138.9 ± 4.0 °C was reached after 700 s of H2 exposure.
Considering that the time required for the CHC reaction to being initiated increased from 600 to 900 s for Tests 1 and 2, respectively, and that the catalyst had to be preheated during Test 3, this offers a clear indication of catalyst deactivation. The latter is likely caused by Pt aggregation occurring during CHC. As shown in Figure 5b, the surface of the 4 h AAO contained numerous nanowires; therefore, it is likely that Pt was deposited onto nanowires, as well as inside the AAO pore channels. It is further likely that the deposition of Pt on the nanowires might have led to a nonuniform active site distribution, causing differences in heat and mass transfer. In turn, these differences might cause a decrease in catalytic activity. For example, the effect of heat and mass transfer on the catalytic activity of the Pt/γ-Al2O3 catalyst for CO oxidation was studied by Arnby et al. [41]. The heat evolved from the exothermic reaction is removed from the active sites to the support material and ambient air; however, heat can accumulate in catalyst particles, causing a constant temperature gradient between the catalyst and the surroundings [41]. Therefore, if the distribution of catalyst particles is nonuniform, the appearance of hotspots is likely. The latter may result in catalyst aggregation, which reduces the catalytic activity of the catalyst. Furthermore, first, the heat transfer limitation in the present study may occur due to an elongated and sophisticated pathway from the surface of the nanowire to the Al core. Heat present in nanowires may not be transferred as easily and rapidly when compared to the AAO layer directly adhering to the Al core. Furthermore second, the mass transfer limitation may cause a decline in the reaction rate due to the long diffusion path of the gas phase between the active sites and the catalyst support [41]. Mass transfer limitations locally decrease the concentration of the reactant on the active sites, resulting in a concentration gradient and a decrease in the reaction rate. Figure 6 further shows that although the CHC initiated spontaneously during Test 4, the combustion temperature of 88.4 ± 3.6 °C was reached after 200 s of H2 exposure, thus suggesting a further decrease in catalytic activity. The initiation temperature for Test 4 was 25 °C. It is noteworthy that Test 4 initiated spontaneously after the catalyst had to be preheated during Test 3. However, previous findings indicate that the catalytic activity of a catalyst can be reactivated by increasing its temperature up to 60 °C [42]. Future work should include the determination of the specific deactivation route.
To compare the efficiency of the 1 and 4 h AAO catalysts, the conversion of H2 was measured for all CHC tests. The stable average conversions of H2 during CHC for 1 h AAO catalysts were found to be 96.5%, 96.8%, and 98.2% for all three CHC tests, respectively. Similar values for percentage conversion might have been expected, as a similar observation was made for the combustion temperatures (Figure 2). The conversion of H2 for the 4 h AAO catalyst varied over a wide range, which also might have been expected from Figure 6. The stable conversions of H2 were 88.1%, 87.9%, 88.1%, and 66.9% for the four CHC tests, respectively. By plotting the values of combustion temperatures and the corresponding conversions of H2, one may find an obvious correlation between them; the higher the combustion temperature that can be achieved during CHC, the higher the conversion of H2 that may be expected.
From the results in Figure 6 and the values of H2 conversion discussed above, it may be further concluded that the 1 h AAO catalyst exhibited higher catalytic activity (higher combustion temperatures and H2 conversion) than the 4 h AAO catalyst. This is ascribed to the structural differences of the AAO layers formed during the 1 and 4 h of anodization, such as the absence/presence of nanowires (Figure 5). The 4 h AAO layer is likely susceptible to support collapse due to mechanical, thermal, and chemical stresses induced during the CHC reaction, leading to the loss in catalytic activity [26]. On the other hand, the differences in the catalytic activity of the catalysts may be caused by the different Dp values of the AAO layers. As shown in Table 1, the Dp of the 1 h and 4 h AAO catalysts were 55.7 and 86.9 nm, respectively. As mentioned above, the greater the Dp of the support, the larger the catalyst particles that are formed within the support. Therefore, we assumed here that the Pt particles within the 4 h anodized AAO layer was larger than those within the 1 h anodized AAO layer. Kozhukhova et al. have obtained Pt nanoparticles with an average diameter of 4.7 nm for a Pt/AAO catalyst with an AAO Dp of 59.9 nm, which is in some agreement with the Pt nanoparticle diameter obtained here in the present study for a similar-sized AAO Dp (Pt particles diameter of 3.0 nm within AAO with Dp of 55.7 nm) [28]. In both cases, the Pt/AAO catalysts have high activity towards CHC—the reactions initiated spontaneously at room temperature. Khodakov et al. have also investigated the deposition of cobalt (Co) onto silica supports with different Dp values [40] and found that the Co particle size increased with increasing Dp; Co particles with an average size of 57–230 Å were formed in silica supports with Dp of 20–330 Å.
Based on the results presented in this section, it is concluded that the structural and morphological characteristics of the AAO layer significantly affect the catalytic activity of the Pt/AAO catalyst. Considering that the 1 h AAO catalyst did not show any evidence of catalytic deactivation, this catalyst was selected for prolonged CHC applications.
2.3. Catalyst Fatigue Test
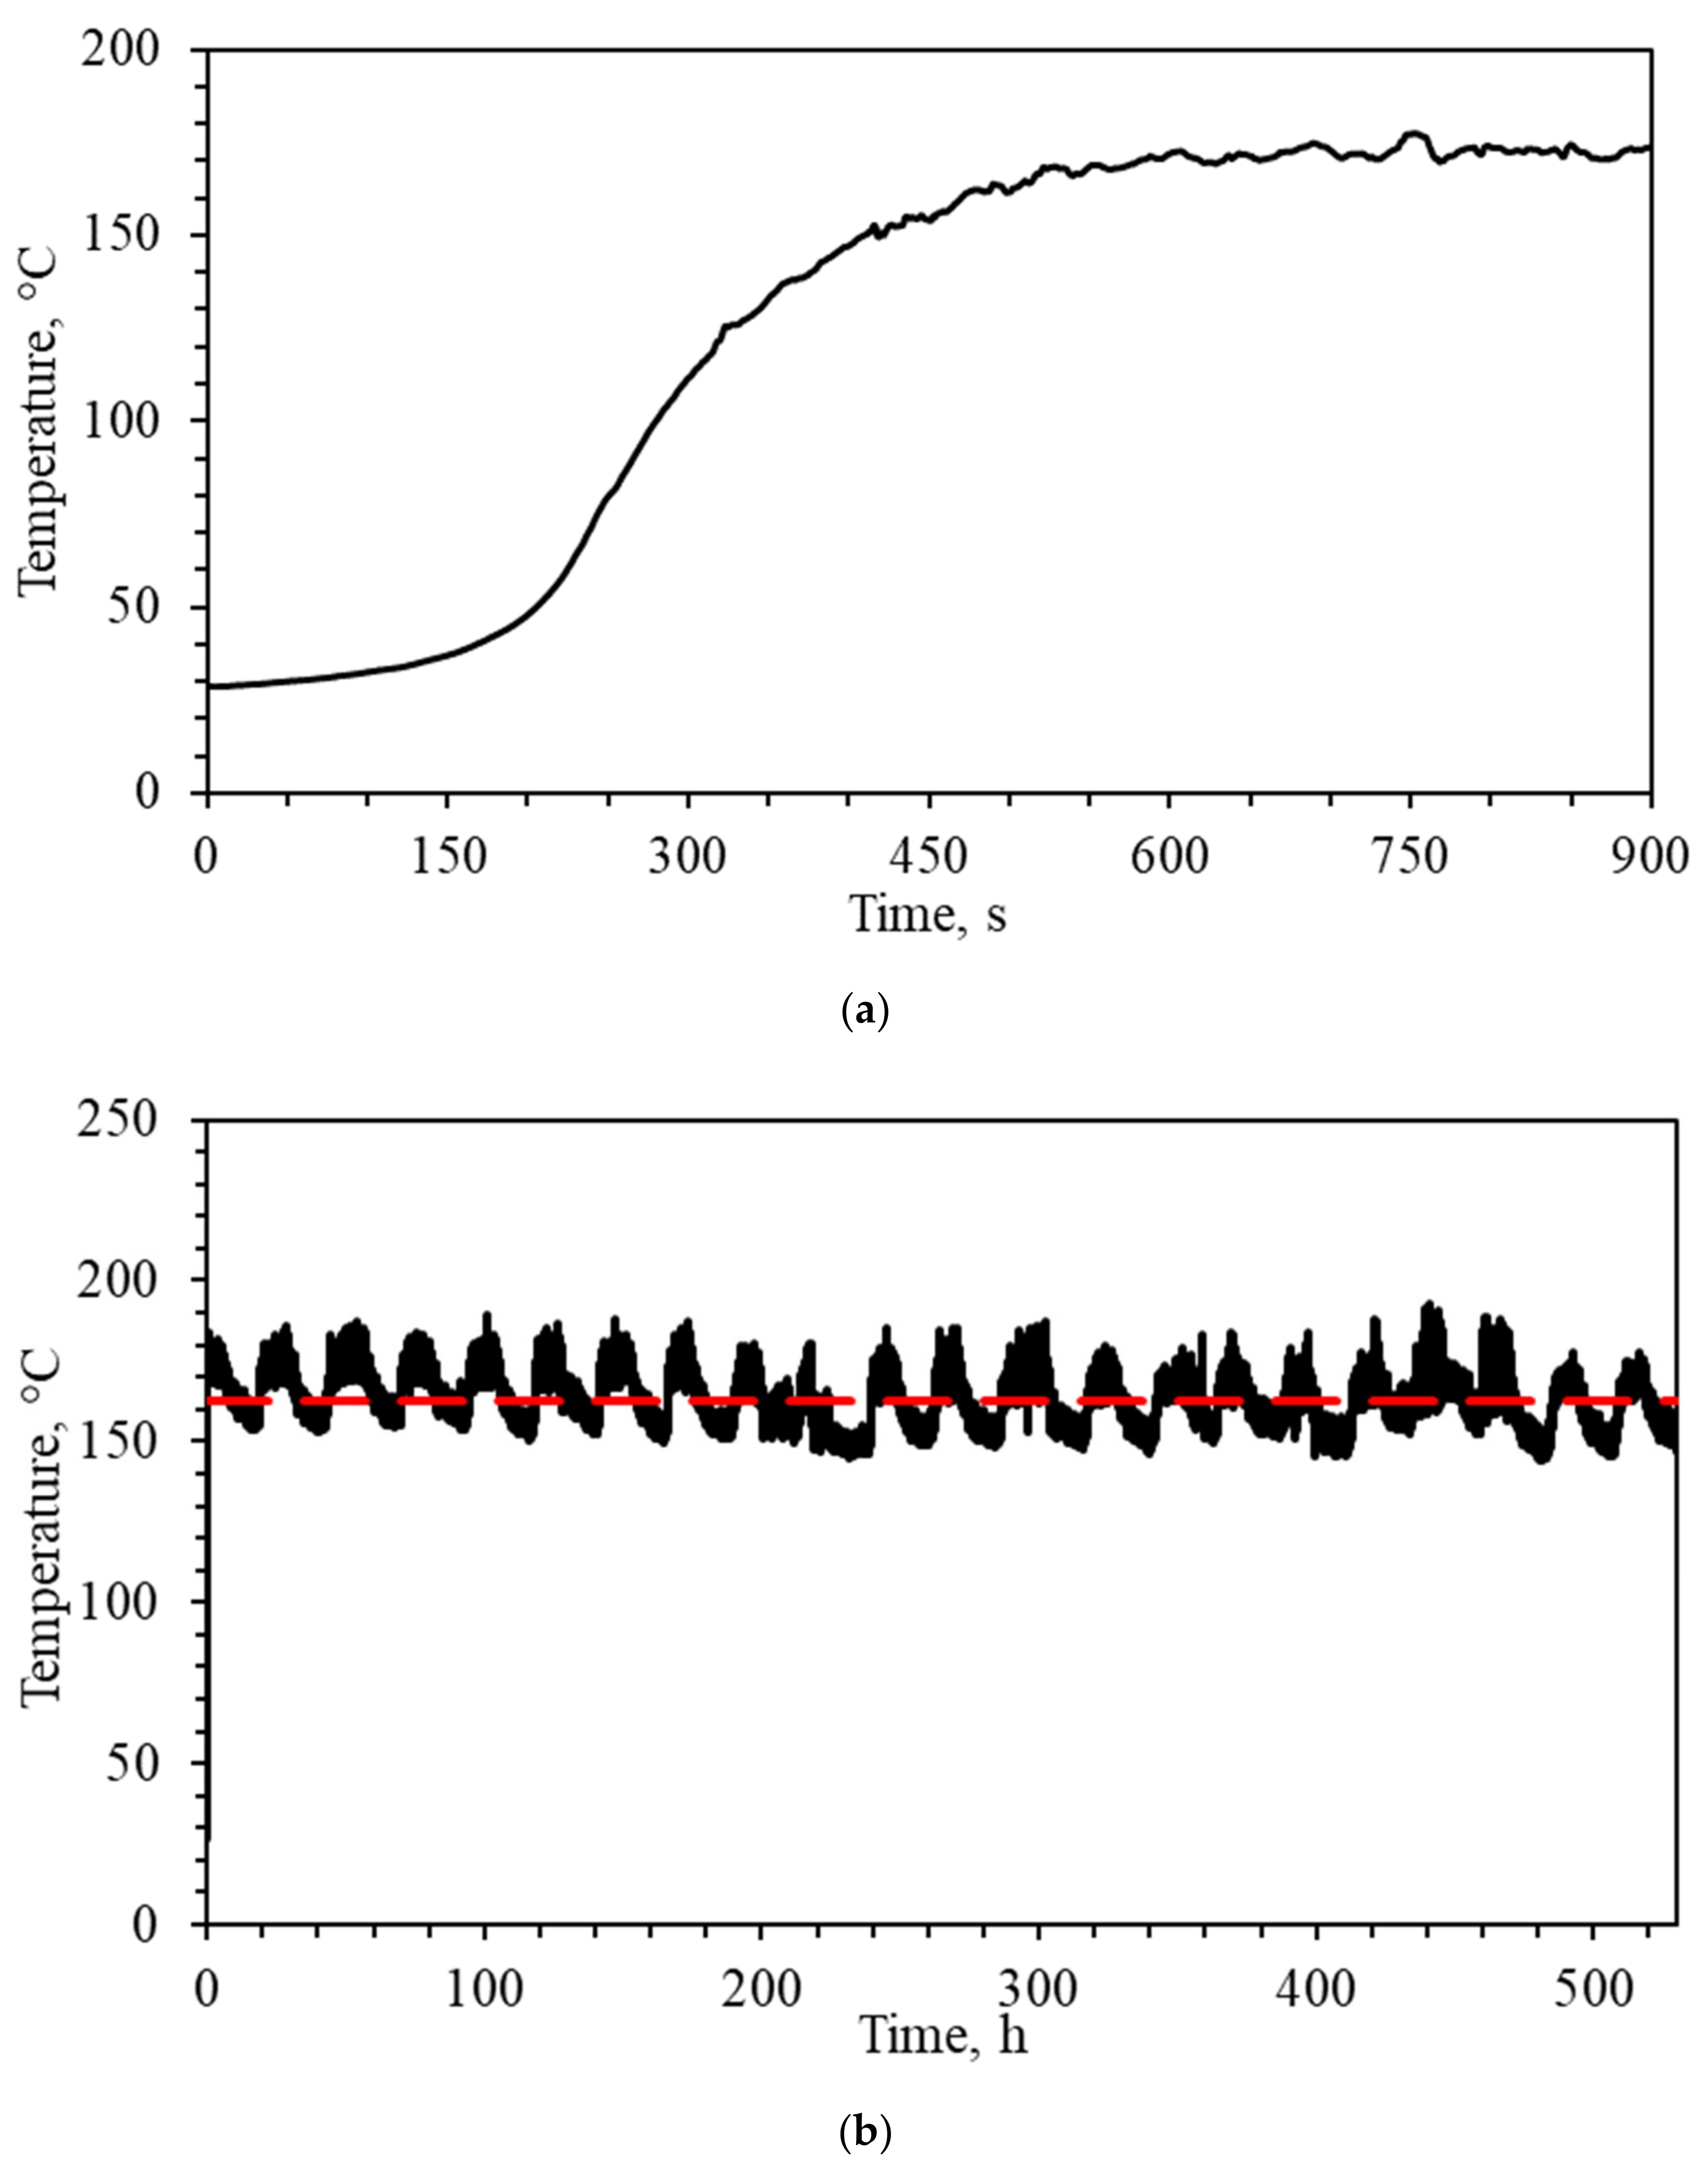
Prolonged CHC was performed to assess Pt/AAO catalyst durability. The H2 content in the exhaust stream was measured after the combustion temperature reached a steady-state value. A H2 concentration of <1 vol% was determined in the exhaust stream, suggesting near-complete CHC at the specific flow rate, Pt loading, and catalyst size and orientation. Figure 7 shows the combustion temperature profiles of Pt/AAO catalyst during the first 900 s and for the entire fatigue test (530 h).
Figure 7a shows a steady increase in combustion temperature during the first 170 s, which is indicative of the onset of the CHC reaction. Here, the initiation temperature was 27 °C. After the initial 170 s of the catalyst fatigue test, the combustion temperature rapidly increased but then stabilized after approximately 550 s of H2 exposure. The heat generated during CHC accelerated the reaction rate; therefore, a rapid increase in the combustion temperature was observed after 170 s of CHC. A temperature of 168.6 °C was achieved after 550 s of CHC reaction. In earlier studies, spontaneous CHC on Pt/SSM and Pt/Ti mesh catalysts was found at temperatures >40 and 70 °C, respectively [25,43]. The higher activity of Pt/AAO catalyst (lower initiation temperature) in the present study is related to the smaller Pt particles (3.0 vs. 119.8 nm for the Pt/AAO and Pt/SSM catalysts, respectively). Zang et al. showed that CHC proceeded spontaneously on 1 wt% Pt/MgAl2O4 and Pt/Ce0.6Zr0.4O2/MgAl2O4 catalysts at initial temperatures as low as −10 °C and H2 inlet concentrations of 4 vol%. The authors found that a lower CHC initiation temperature could be expected with higher H2 inlet concentrations and space velocities [44]. Reinecke et al. investigated CHC over a Pt/washcoat catalyst. The authors found that the CHC reaction initiated spontaneously at a temperature of 25 °C and H2 concentrations of 0.5–4 vol%. However, a temperature gradient of up to 200 °C throughout the catalyst surface was observed for inlet H2 concentrations of 4 vol% [45].
Figure 7b shows that an average combustion temperature of 162.8 ± 8.0 °C was maintained over 530 h of CHC. Because the experimental setup used for the catalytic fatigue test is open to the atmosphere, the temperature of the ambient air affects the catalyst temperature. Therefore, the temperature profile deviations observed in Figure 7b may be ascribed to day/night cycles. Kozhukhova et al. have earlier shown that the combustion temperature of a Pt/AAO catalyst is sensitive toward external airflow, which has a rather significant cooling effect on the catalytic system [30]. In the present study, the external airflow interference was significantly reduced by introducing the vertical enclosure along the full length of the catalyst. However, the enclosure did not allow adiabatic investigations, and heat transfer was inevitable.
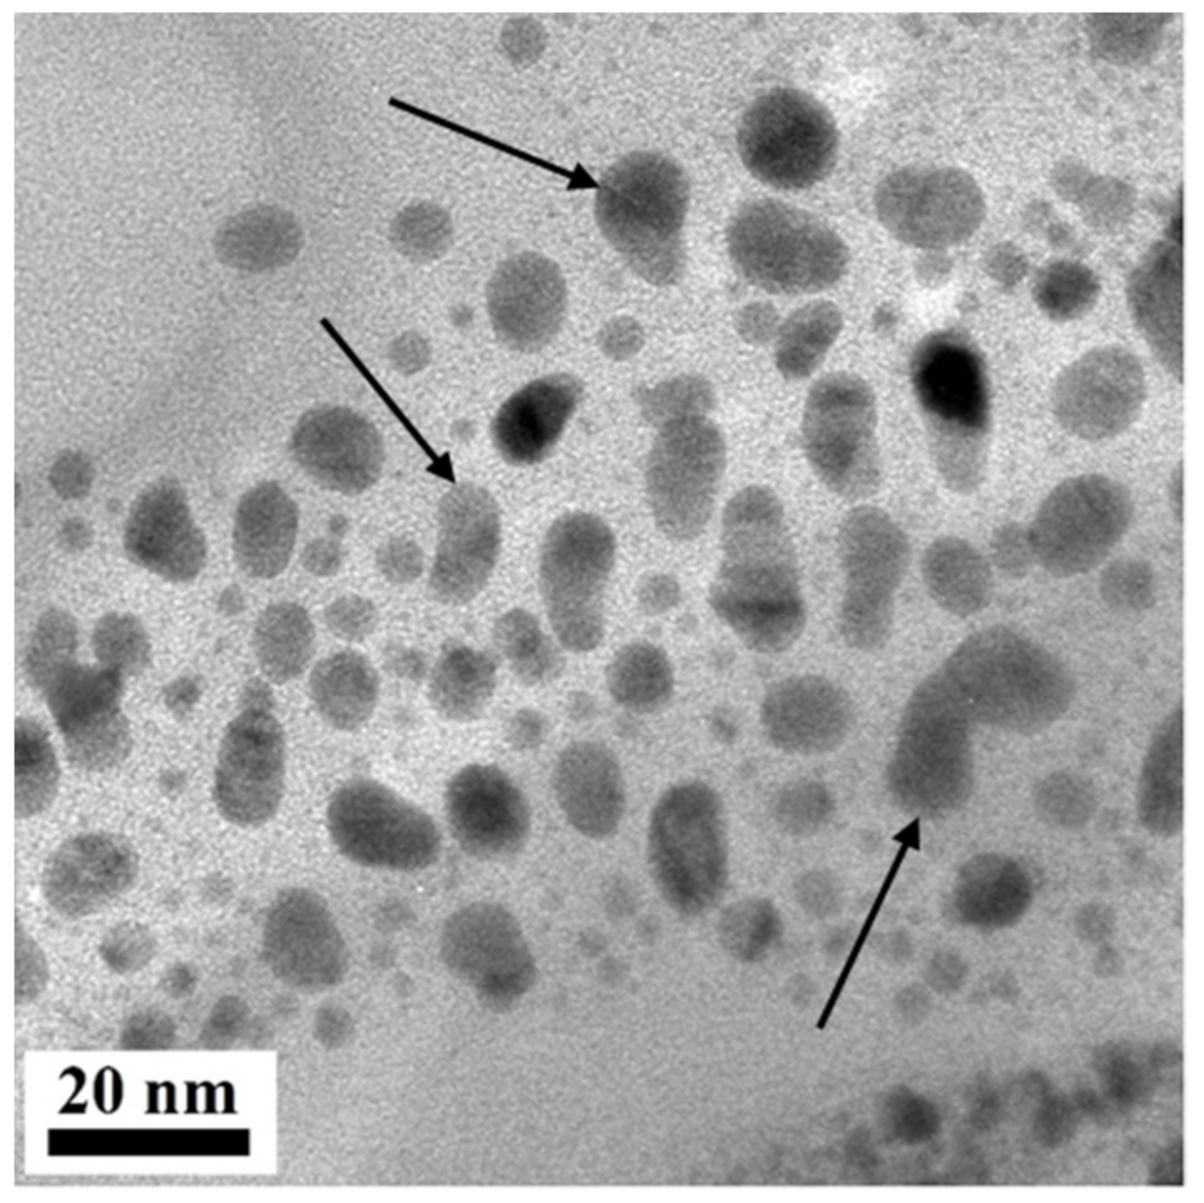
To then investigate any change in the Pt particle size and morphology, the fatigue tested Pt/AAO catalyst was cross-sectioned by FIB and examined using TEM (Figure 8). The average Pt particle size determined over several TEM images for the spent Pt/AAO catalyst was 3.9 ± 1.9 nm (based on 220 particles). Therefore, a relatively small increase in particle size occurred (compared with the particles shown in Figure 1b). This was even more evident when considering the morphology of the particles indicated in Figure 8—some evidence of particle aggregation is present, i.e., particles were not as circular as the particles presented in Figure 1b. This suggests that some Pt aggregation did occur during the prolonged CHC procedure. Furthermore, the formation of PtO2 was likely avoided in the present study. In a study by Olsson and Fridell, a Pt/Al2O3 catalyst was analyzed by X-ray photoelectron spectroscopy (XPS) to investigate the formation of Pt oxides after catalyst pretreatment in H2, O2, and NO2 atmospheres. The formation of PtO was observed for catalysts treated in O2 and NO2 at 400 and 350 °C, respectively. In addition, the NO2 treated catalysts showed significant PtO2 formation. Traces of PtO2 formation was observed for the catalysts pretreated in H2 at 500 °C and O2 at 400 °C [46]. Hwang and Yeh found PtO2 formation on Pt/Al2O3 catalyst when oxidizing in a 5 vol% O2 atmosphere at temperatures >300 °C [47]. In the present study, a CHC temperature of <200 °C was reached during the fatigue test; this suggests that the formation of Pt oxides was absent or insignificant (considering the relatively stable prolonged CHC temperature, Figure 7). It is proposed that the Pt/AAO catalyst prepared here be characterized after CHC procedures to determine the presence and/or extent of Pt oxidation.
It is known that Pt and reactive metal-based catalysts are susceptible to thermal degradation, which reduces the catalytic activity of such catalysts [25,43,48]. The effect of reactive metal aggregation can be facilitated by exposure to high temperatures (>500 °C) in the presence of oxygen and chlorine; the presence of water vapor increases the rate of aggregation of the supported metal catalyst [26]. Du Preez et al. have reported that the combustion temperature of a Pt/SSM and Pt/calcined Ti catalyst decreases significantly as Pt aggregation proceeds during the first several hours of CHC [25,43]. One also must consider the bond energy between Pt and the support material. For instance, it has been found that the aggregation rate for Ni/Al2O3 is less than for Pt/Al2O3 catalyst due to a greater Ni–Al2O3 interaction [26].
Although some Pt aggregates were observed after a CHC reaction time of 530 h (Figure 8), the effect of Pt aggregation on the average combustion temperature over this period was not evident (Figure 7). This suggests that the Pt aggregation that occurred was insignificant and did not affect the catalytic activity of the Pt/AAO catalysts. This could be ascribed to the high thermal conductivity of the Al/AAO support.
2.4. Thermal Distribution of the Pt/AAO Catalyst
The ability of the catalytic system to distribute heat generated during CHC is a key parameter when the catalyst is intended to be used in PAR applications. Of importance here is that the low thermal conductivity of the PAR catalytic system may itself cause a self-ignition. Uniform temperature distribution is achieved only when exothermic reaction heat is efficiently distributed throughout the entire catalyst. Moreover, localized reactive metal aggregation is prevented in the absence of hotspots; thus, the catalytic activity of a catalyst is preserved. Therefore, the thermal distribution of the catalyst should be investigated before the catalyst is introduced into commercial PARs.
The mechanism involved during CHC of a Pt/AAO catalyst was presented in an early study by Kozhukhova et al. [28]. They showed that the use of an Al metallic core adjacent to the AAO layer as part of the catalyst support allowed high thermal conductivity of the Pt/AAO system for 530 h of CHC. Due to the absence of hotspots, flashing (H2 ignition) would only be possible if the temperature of the entire catalyst surface exceeded the H2 autoignition temperature (585 °C), which is considered an unlikely event.
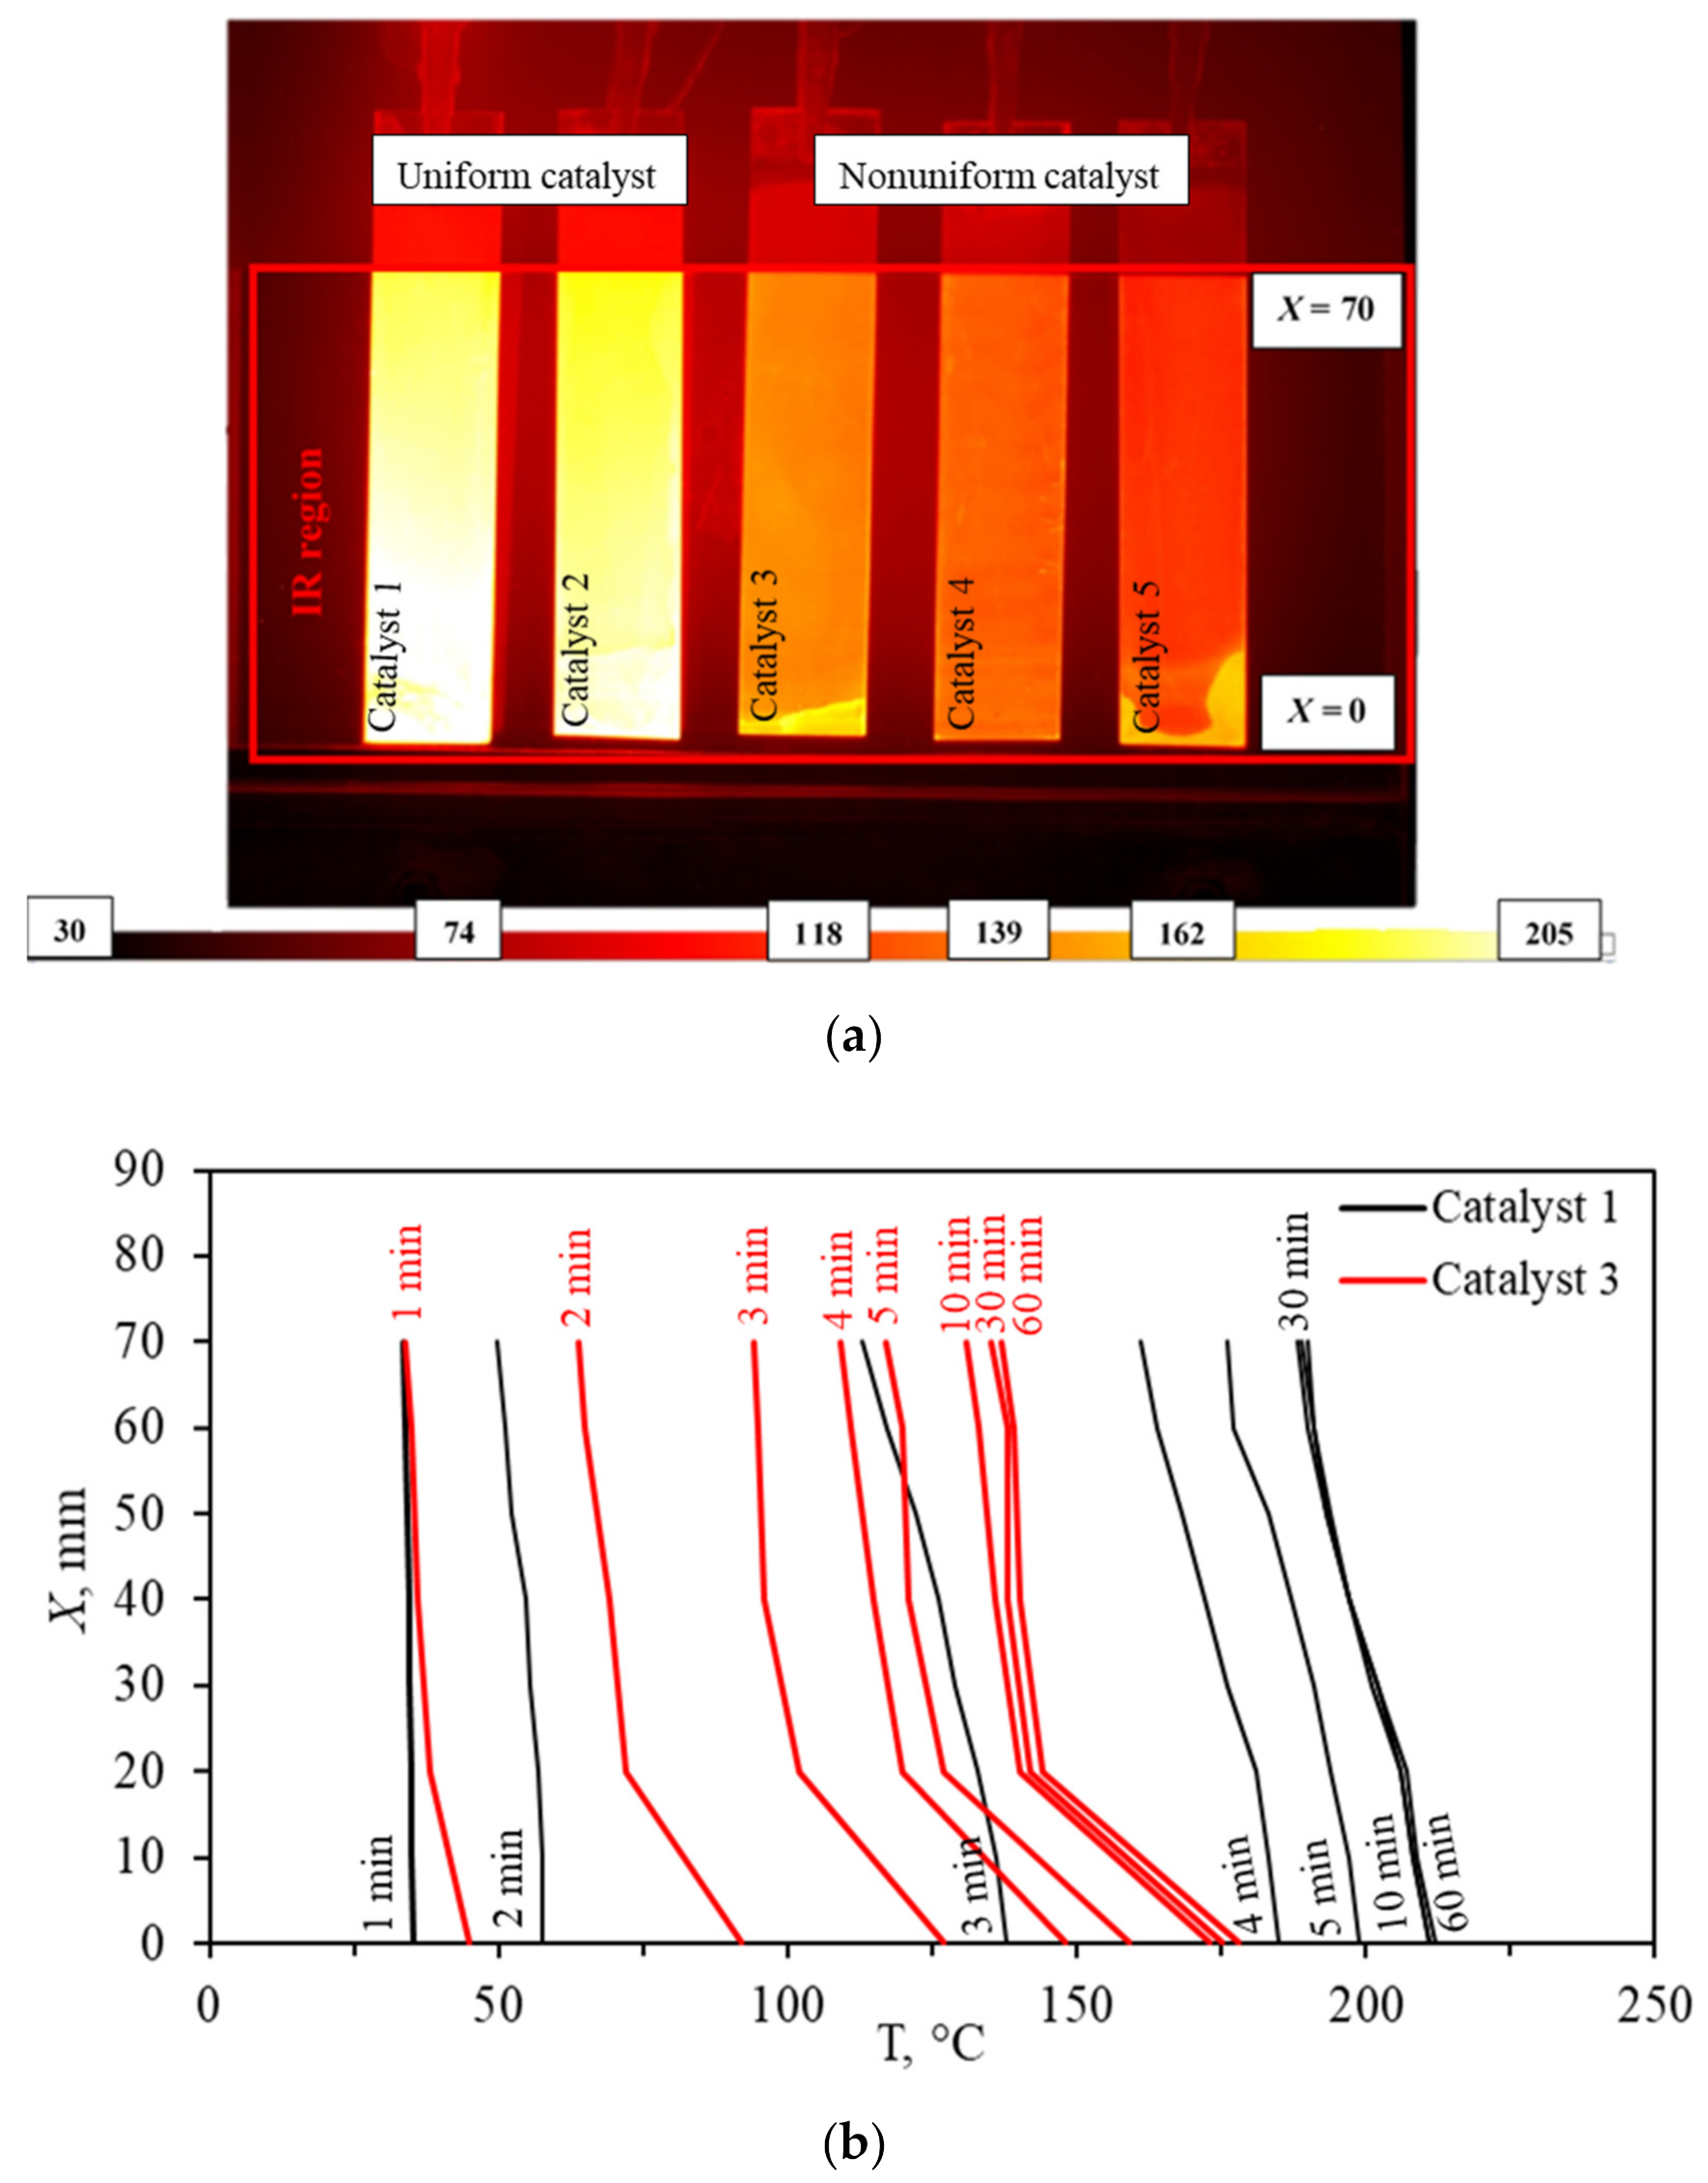
In the present study, a detailed investigation into the thermal distribution of the Pt/AAO catalyst was carried out. To investigate the significance of hotspot formation during CHC reactions, three samples with nonuniform Pt distribution were prepared. These samples are henceforth referred to as nonuniform catalysts. Catalysts with uniform Pt distribution are defined similarly. Figure 9a presents an image of the thermal distribution of the uniform and nonuniform catalysts obtained with an IR camera. Figure 9b represents the change in catalyst surface temperatures throughout 70 mm of the catalyst length as a function of H2 exposure time. The two samples on the left and three on the right represent the uniform and nonuniform catalysts, respectively.
Catalyst surface temperatures are presented on a color scale, ranging from black (low-temperature) to bright yellow (high-temperature), as indicated by the temperature scale bar. The region highlighted with a red rectangle indicates the area captured by the IR camera during the CHC test.
Figure 9a shows the thermal mappings of the catalysts during steady-state CHC conditions. The thermal mapping is relatively consistent for the uniform catalysts. This was expected, as the catalyst preparation method applied here allowed a relatively uniform distribution of Pt throughout the AAO layer. The opposite was observed for the nonuniform catalysts, where the bright yellow areas at the bottom of the images for catalysts 3 and 5 are representative of hotspots. Although catalyst 4 did not include hotspots, the catalyst was prepared with the intent to disrupt uniform Pt distribution. The hotspots presented on the surfaces of catalysts 3 and 5 correlate with higher Pt contents relative to the rest of the catalyst surface, suggesting that a larger fraction of H2 is recombined in this localized area. As mentioned earlier, these hotspots may cause the unintentional ignition of H2/air mixtures.
Figure 9b presents the quantified temperature distribution of the thermal mapping presented in Figure 9a of catalysts 1 and 3. In Figure 9b, X refers to the distance from the bottom of the catalyst, with X = 0 and X = 70 mm referring to the bottom and top of the catalyst (as indicated in Figure 9a), respectively. An appreciable temperature increase caused by the catalytic activity of the catalysts is observed after approximately 120 s of H2 exposure. The temperature of catalysts 1 and 3 was 211 and 173 °C after 10 min of CHC, respectively. Of importance is the temperature gradient (ΔT) over the length of the catalyst (from X = 0 to X = 70). Catalysts 1 and 3 had ΔT of 23 and 42 °C, respectively.
According to Reinecke et al., the exothermal CHC reaction mainly occurs in the very first surface section, resulting in a surface temperature gradient from the bottom to the top of the catalyst. A significant temperature gradient of 200 °C was found for the stainless steel Pt/washcoat catalytic material [45]. Malakhov et al. observed a temperature gradient of 341.2 °C over a tubular ceramic Pt/Al2O3 washcoat catalyst [2]. By comparison, a ΔT of 23 °C for the uniform catalyst over a distance of 70 mm is relatively insignificant. Moreover, a ΔT of 42 °C in a nonideal (“worst-case”) scenario is indicative of the highly effective thermal conductivity of the Al core present in the Pt/AAO catalysts prepared in this study. Based on the observed ∆T, and because it is significantly lower than commercially employed catalysts, it is proposed that the thermal distribution of the Pt/AAO catalyst at explosive H2 concentrations (>4 vol%) should be investigated in future research.
2.5. CFD Calculations
Detailed research on catalytic recombiners is usually required to investigate the interactions of reaction kinetics, temperature distribution, and heat and mass transfer. The application of CFD modeling in hydrogen safety applications may be very helpful, especially when the research needs to be conducted under conditions close to the accident ones (accident conditions) (e.g., the concentration of H2 > 4 vol%, high H2 flow rate). In the present study, a model was created to investigate temperature distribution throughout the Pt/AAO catalyst under the same conditions that were used during the thermal mapping shown in Figure 9a (3 vol% H2). If high predictability of the results is obtained, the model may be applied in further research—for example, determining the thermal conductivity of the Pt/AAO catalyst at H2 concentrations >3 vol%.
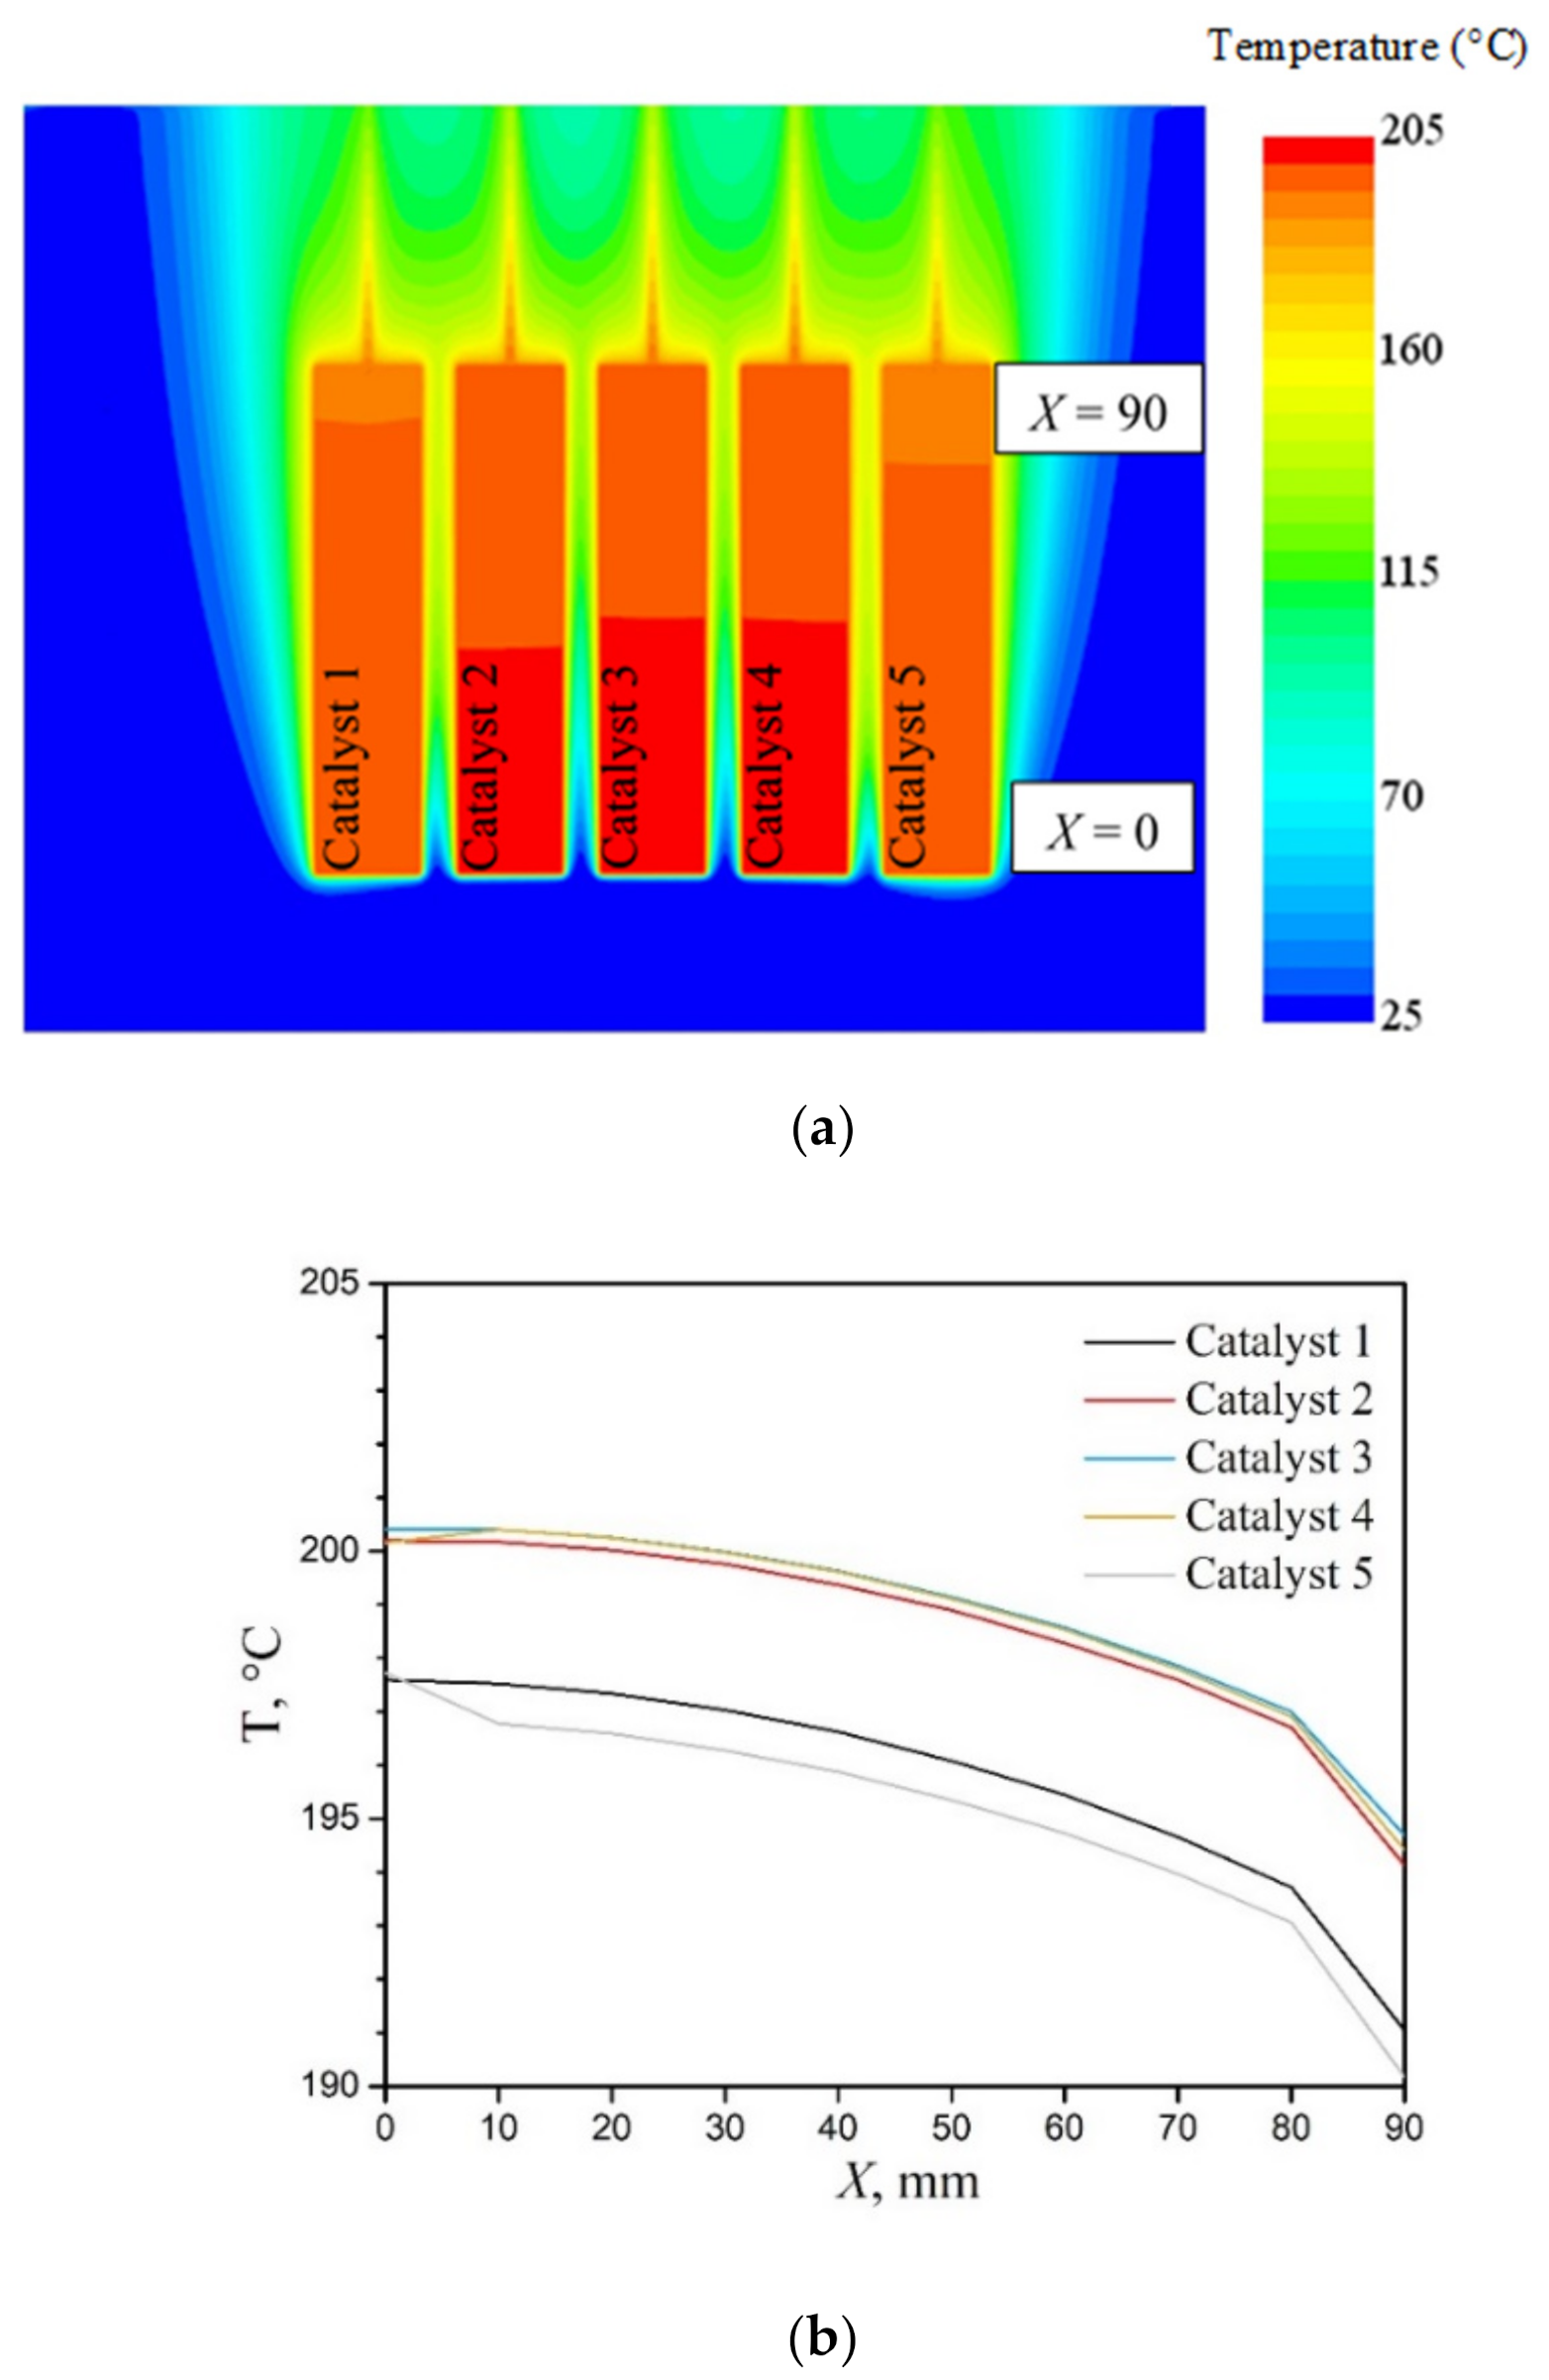
Figure 10a presents the thermal distribution of uniform Pt/AAO catalysts obtained at steady-state conditions using a CFD numerical tool. Figure 10b shows the change in Pt/AAO catalyst surface temperatures throughout 90 mm of the catalyst length at steady-state conditions.
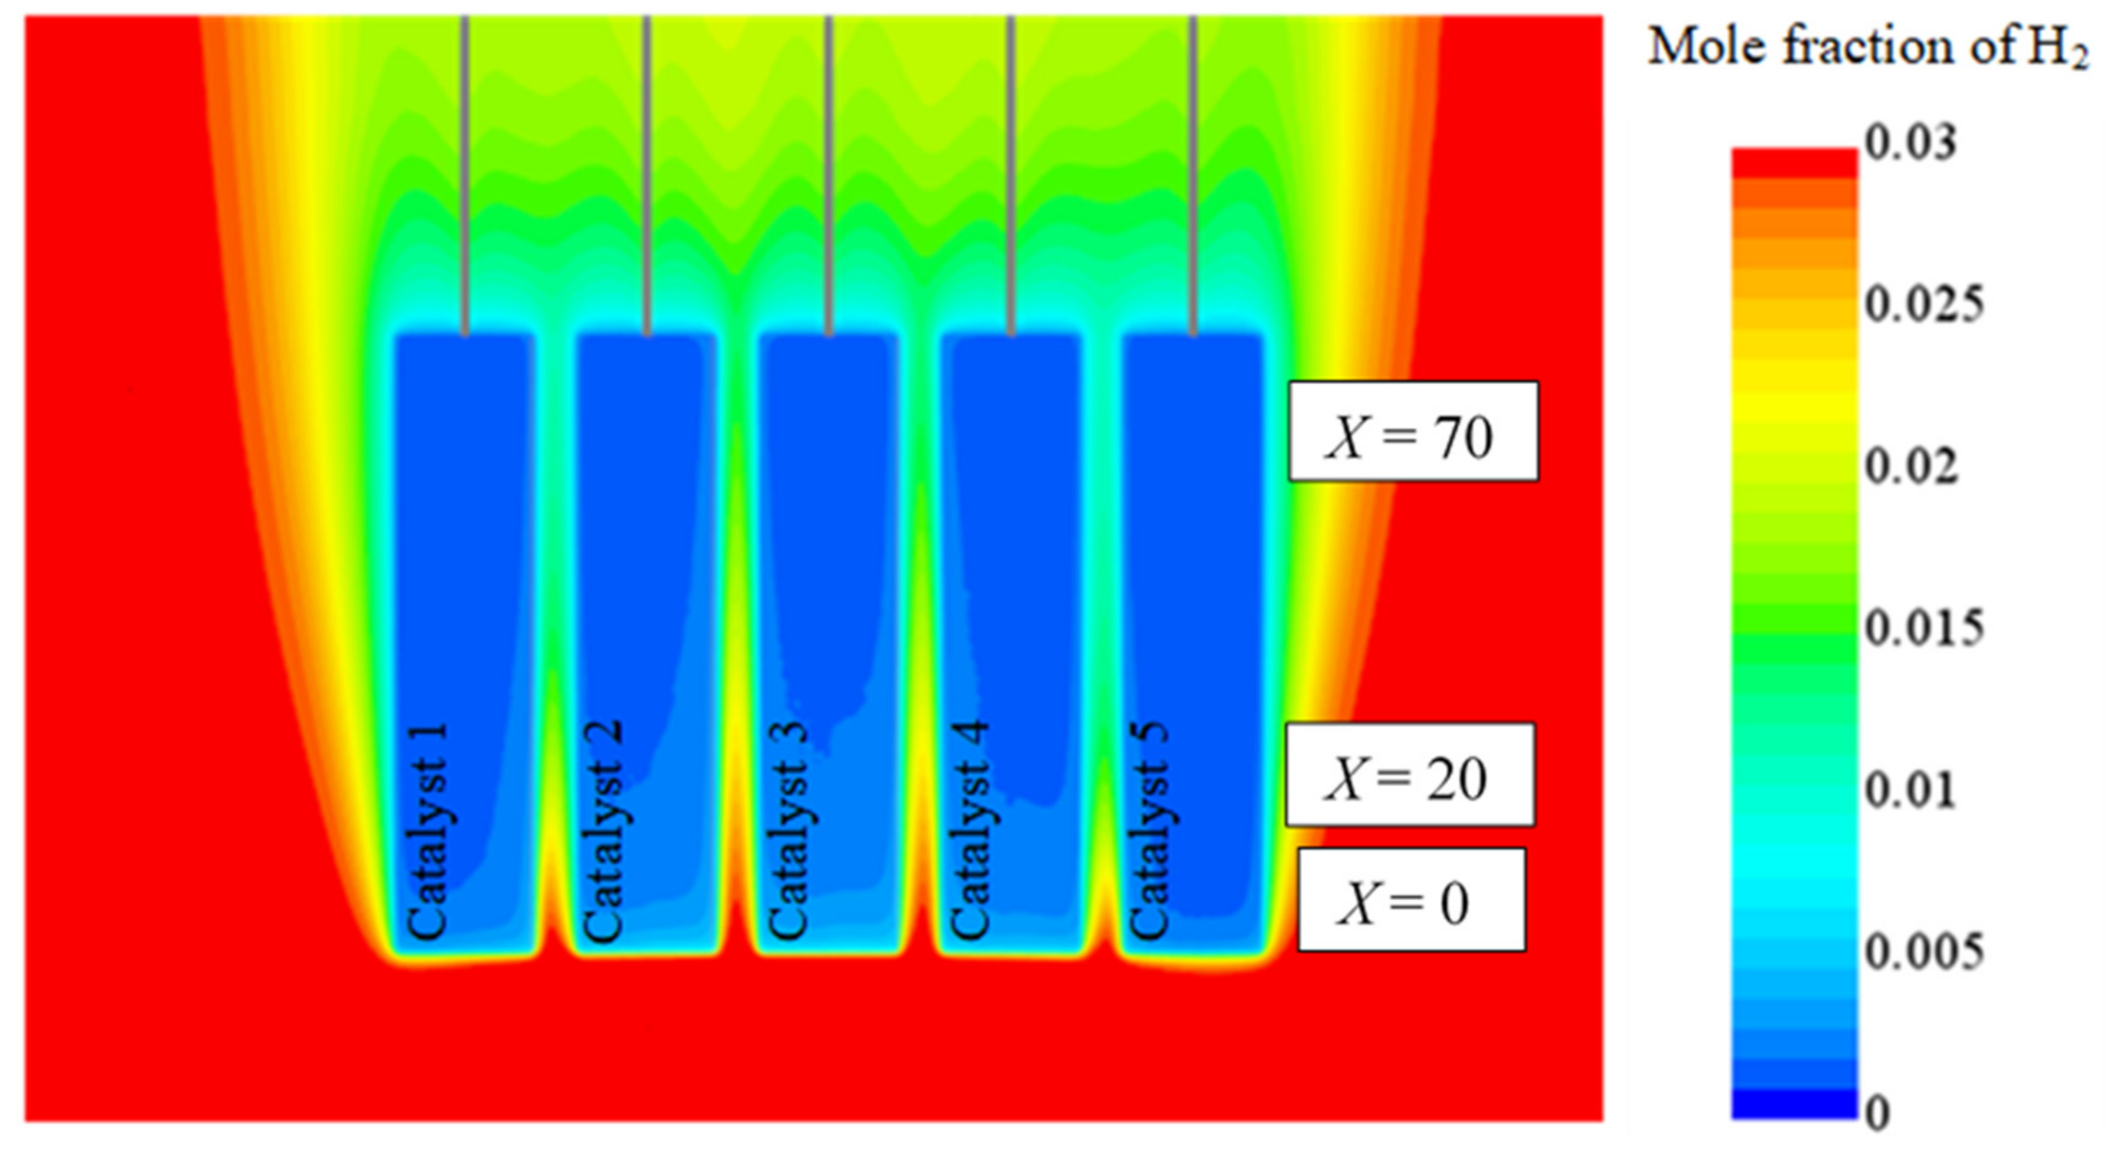
Figure 10a shows that uniform temperature distribution throughout the samples was obtained. However, a relatively small temperature decrease in catalyst surface temperature from the bottom to the top of the catalyst was observed. Figure 10b shows that the change in catalyst surface temperature decreased from 198, 200, 200, 200, and 198 °C to 191, 194, 195, 194, and 190 °C for catalysts 1–5, respectively. The average ΔT throughout 90 mm and 70 mm of the catalyst surface was 7 and 3 °C, respectively. The numerical model did not assume any disorder of Pt particle distribution on the support surface that may occur during a real catalyst preparation procedure. Therefore, the difference in ∆T determined experimentally and by simulation (23 and 3 °C, respectively) may be ascribed to the actual distribution of Pt on the AAO surface of the Pt/AAO catalysts prepared in this study. Figure 11 presents a distribution of H2 throughout the catalyst surface obtained at steady-state conditions.
Figure 11 shows that the H2 concentration over the catalyst surface was relatively low, which suggests that H2 recombination occurs rapidly on the surface of Pt/AAO catalysts. Two observations are made from Figure 11: first, the H2 concentration at the bottom of the catalyst (X = 0) is higher when compared to X > 0 and, second, the H2 concentration gradients of catalysts 2–4 were dissimilar to those of catalysts 1 and 5. Both of these observations could be ascribed to the presence of local flow fluctuations throughout the recombiner section [49]. To investigate this, the linear velocity at the local points of the gas mixture present for catalysts 1–5 at positions X = 0, 20, and 70 are shown in Table 2. The change in the linear velocity at X > 70 mm was negligible. Therefore, these values were not included for further consideration.
Table 2 shows that the local linear velocity for catalysts 2–4 decreased with increasing position X from 0 to 70 mm, while the linear velocity increased for catalysts 1 and 5. The difference between the flow rates for the catalysts may be ascribed to the design of the recombiner section. The mixing plate present in the recombiner section testing station (see Figure 12) was included to allow a uniform H2/air mixture, although it may also influence flow distribution.
The presence of flow fluctuations is common considering the differing geometry of PARs and may be ascribed to dissimilar linear velocities throughout a recombiner framework [2]. A slight decrease in H2 concentration for catalysts 1 and 5, however, may be related to the presence of natural convection when the mass transfer occurs with a flow of heat produced by CHC. In conclusion, from the data presented in Figure 11 and Table 2, the authors assume that under the explored conditions in the present study, the CHC occurs to an incomplete extent at X = 0. Figure 11 further shows that a near-zero concentration of H2 was obtained at X = 70, suggesting that, for the investigated catalyst, near-complete H2 recombination occurred throughout the catalyst surface.
3. Experimental
3.1. Preparation of Pt/AAO Catalyst and Its Characterization
The AAO support was prepared by two-step anodization of 0.2 cm-thick Al alloy plates sized 2 cm × 9 cm (Al6082 alloy, 97.5% Al, Aluminium and Metal Traders CC, Welkom, South Africa). Each plate included a 1 cm handle, which was not anodized. The anodization procedure has been described in early studies by Kozhukhova et al. [50,51]. In short, the sample surfaces were degreased by ultrasonication in acetone, rinsed with deionized water, and then subjected to electropolishing in a mixture of HClO4 (Sigma-Aldrich, Schnelldorf, Germany) and ethanol (Rochelle Chemicals and Lab Equipment, Johannesburg, South Africa) at a voltage of 20 V for 1 min. Next, two-step anodization was carried out in a 0.3 M oxalic acid (Rochelle Chemicals and Lab Equipment, Johannesburg, South Africa) solution. As described in an earlier study of Kozhukhova et al., AAO formed in oxalic acid at a temperature of 30 °C and voltage of 60 V had a relatively ordered pore distribution when the anodization time of the second step was kept to 1 h [50]. Therefore, we selected this AAO layer to use as catalyst support in the present study. Accordingly, the first anodization step was performed at a temperature of 30 °C and a voltage of 30 V for 30 min. Thereafter, the AAO layer formed during the first step was removed by submerging the sample in a mixture of 5% H3PO4 (Sigma-Aldrich, Mainland, China) and 1.8% CrO3 (Sigma-Aldrich, Modderfontein, South Africa) at 60 °C for 5 min. The second anodization step was performed at a temperature of 30 °C and a voltage of 60 V for 1 or 4 h. Isothermal conditions were maintained using a refrigerating–heating circulating system (Julabo, CORIO CD-200 F, Seelbach, Germany). An adjustable DC power supply (Elektro-Automatik, EA-PSI 5200-10A, Morfelden-Walldorf, Germany) with a voltage range of 0–200 V and a current range of 0–10 A was used to control the applied voltage.
The Pt/AAO catalyst was prepared by the incipient wet impregnation method. This method includes the immersion of samples in a 22.8 g/L ethanol-based hexachloroplatinic acid solution (H2PtCl6∙6H2O, Sigma-Aldrich, Milano, Italy) for 4 h. Ethanol was used as the solvent to prevent AAO layer dissolution [28]. Next, samples were dried in ambient air, and Pt was reduced in a hydrogen atmosphere at 350 °C for 2 h. A vertical tube furnace (CTF 12, Carbolite Gero, Derbyshire, England) was used for the reduction procedure.
The morphology of AAO samples was characterized using an FEI Quanta FEG 250 field emission gun scanning electron microscope (Thermo Fisher Scientific, Waltham, MA, USA). Before SEM analysis, the AAO samples were coated with a thin layer of carbon using a carbon coater (Emscope TB 500, UK). The morphological characteristics (diameter of pores Dp, interpore distance Dc, pore density n, and porosity P) were determined from SEM images using the ImageJ program.
The Pt/AAO catalyst was analyzed by TEM before and after being subjected to prolonged CHC. Before TEM analysis, the Pt/AAO catalysts were sectioned by a focused ion beam (FIB). FIB lamellas were prepared using an FEI Helios Nanolab 650 dual-beam scanning electron microscope (Thermo Fisher Scientific, Waltham, MA, USA). TEM analyses were then carried out using a Technai F20 FEI instrument (Thermo Fisher Scientific, Waltham, MA, USA).
3.2. Catalytic Test in the Recombiner Section Testing Station
The prepared Pt/AAO catalysts were tested as a catalyst section in an in-house-developed recombiner section testing station (Hydrogen South Africa Infrastructure, Potchefstroom, South Africa). The schematic of the experimental setup is presented in Figure 12.
The testing station represents a rectangular box allowing a vertical flow of an H2/air mixture under defined conditions (e.g., flow rate, H2/air inlet volume ratio). Digital thermal massflow controllers (EL-FLOW F-201AV, Bronkhorst, The Netherlands) were used to control the inlet concentrations of H2 and air. High-purity H2 (>99.9% H2, Hydrogen South Africa Infrastructure, Potchefstroom, South Africa) and compressed air were used as the inlet gas mixture. The H2/air mixture with a H2 concentration of 0.5–4 vol% was fed into a pipe at the bottom of the experimental setup at an inlet flow velocity of 9.5 m/s. A relatively uniform gas flow distribution was achieved by using a mixing plate placed above the inlet pipe; the mixing plate had uniformly distributed holes. Thereafter, the gas mixture reaches the catalyst section, where the recombination reaction occurs. The reaction products (water vapor) and any unreacted H2 pass through the gas outlet at the top of the experimental setup. In this study, the catalyst section consisted of five Pt/AAO catalysts (10 × 2 cm each) placed inside the recombiner testing station. Catalysts were placed vertically and spaced 1 cm from each other. The catalyst section was fixed 8 cm above the mixing plate using clamps.
Six H2 sensors (Model XEN-5320, Xensor Integration, Delfgauw, The Netherlands) were positioned inside the experimental setup to evaluate the H2 content before and after CHC. Measurements were logged every 1 s, using LabVIEW software. All combustion procedures were performed in triplicate, and the average values are presented.
The thermal distribution of the catalytic surface was recorded using a high-resolution IR camera (M100hd, Telops, Ontario, Canada). The camera was fitted with a lens designated to capture thermal data in the temperature range 0–325 °C. A synthetic sapphire glass panel was installed in the testing recombiner station to enable the camera to capture thermal data. Thermal data were recorded every 1 s, using Reveal IR software (v. 1.7.0) (Telops, ON, Canada).
3.3. Catalyst Fatigue Test
The Pt/AAO catalyst was subjected to a fatigue procedure to evaluate the stability and catalytic activity of the catalyst during prolonged high-temperature CHC. A similar fatigue procedure was applied in an earlier study by Kozhukhova et al. [28]. For the fatigue test, the vertically placed Pt/AAO catalyst was exposed to a flow of a H2/air mixture with a high H2 content (138 NmL/min; instrument maximum flow rate). H2 was supplied using an in-house-developed electrolytic hydrogen generator (Hydrogen South Africa Infrastructure, Potchefstroom, South Africa). The sample was placed 3 mm above the hydrogen nozzle, allowing premixing of H2 and air before it reached the catalyst surface. The temperature of the catalyst surface was measured at the center of the sample using a K-type thermocouple. Thermal measurements were recorded every 1 s. The fatigue test was performed for 530 h.
3.4. CFD Calculations
The computational domain was created in STAR-CCM+ (Siemens PLM Software, TX, USA) as a vertical rectangular box with the dimensions 24.2 × 4.55 × 28.0 cm (length × width × height). These dimensions matched the recombiner section testing station. The computational mesh was generated by a polyhedral cell based on a minimum cell size of 4.0 mm. The refinement by surface and volumetric mesh control was applied around the catalyst area. The total number of cells was approximately 3.3 million. Steady-state analyses were performed for all calculations. A realizable k-epsilon (k-ε) model with a two-layer approach was used for a turbulent flow simulation [52]. Reynolds-averaged Navier–Stokes equations were solved to simulate a gas flow. An initial temperature of 25 °C and pressure of 105 Pa were set. A detailed mechanism of the CHC reaction on a Pt/AAO catalyst was used in previous work [53]. The Pt/AAO catalyst plates were 90 mm in length and had Pt active sites over the entire surface. The site density for Pt was taken as 2.7 × 10⁻⁸ kmol/m2 [53].
4. Conclusions
In this study, a Pt/AAO catalyst was prepared and evaluated for passive autocatalytic recombination of hydrogen. The AAO support was prepared by anodizing a low Al purity Al alloy Al6082 in oxalic acid. The metallic Al core was preserved during the anodization procedure, and it acted as a thermal conduit during CHC reactions, affording a Pt/AAO catalyst with high thermal conductivity. The prepared Pt/AAO catalyst had an average Pt particle size of 3.0 ± 0.6 nm and an Ea of 19.2 kJ/mol for CHC. The catalyst maintained a combustion temperature of 162.8 ± 8.0 °C for 530 h at a H2 flow rate of 138 NmL/min. Although some Pt aggregation was observed after the aforementioned 530 h of CHC, the significance thereof was not evident, as a decrease in the combustion temperature during prolonged CHC was not observed. Thermal imaging revealed a temperature gradient of 23 °C over 70 mm of the catalyst surface. To simulate a nonideal (“worst-case”) scenario, Pt/AAO catalysts were prepared to contain hotspots. They were formed by nonuniform Pt distribution and had a temperature gradient of 42 °C over 70 mm of the catalyst surface. In both cases, the reported temperature gradients were well below those of catalysts used for PARs reported in the literature. CFD modeling revealed a 3 °C temperature gradient; the CFD model assumed perfect Pt distribution over the catalyst surface. Moreover, CFD calculations showed that although flow fluctuation was present within a simulated recombiner section, which is inherent for any PAR, the Pt/AAO could combust the majority of the H2 introduced to the recombiner section. However, the concentration of H2 in the case of accidents in NPPs and mines can reach values much higher than that considered in the present study (1–4 vol% of H2). Considering that, future research should be focused on the investigation of the Pt/AAO catalyst for CHC at higher inlet concentrations of H2 (>4 vol%). In conclusion, due to the high thermal conductivity of the Pt/AAO catalyst, its fast self-start characteristic, and high stability, the authors assume that the catalyst reported in this study can be used for PAR application.
Author Contributions
Conceptualization, S.P.d.P.; methodology, A.E.K.; supervision, S.P.d.P. and D.G.B.; investigation, A.E.K. and A.A.M.; formal analysis and data curation, A.E.K., A.A.M., S.P.d.P., and D.G.B.; Writing—Original draft preparation, A.E.K. and A.A.M.; Writing—Review and editing, S.P.d.P., and D.G.B.; funding acquisition, D.G.B. All authors have read and agreed to the published version of the manuscript.
Funding
This work was supported by the Department of Science and Innovation (DSI) and HySA Infrastructure in South Africa, through their financial support KP5 program and NRF grants (104687, 119004).
Acknowledgments
We would like to thank S.P. Oelofse and T. Paarlberg for designing and constructing the PAR testing station, C. Martinson for calibrating the hydrogen sensors, and N. Engelbrecht for assisting with the IR camera.
Conflicts of Interest
The authors declare no conflict of interest
References
- Park, J.-W.; Koh, B.-R.; Suh, K.Y. Demonstrative testing of honeycomb passive autocatalytic recombiner for nuclear power plant. Nucl. Eng. Des. 2011, 241, 4280–4288. [Google Scholar] [CrossRef]
- Malakhov, A.A.; du Toit, M.H.; Du Preez, S.P.; Avdeenkov, A.V.; Bessarabov, D.G. Temperature profile mapping over a catalytic unit of a hydrogen passive autocatalytic recombiner: An experimental and computational fluid dynamics study. Energy Fuels 2020, 34, 11637–11649. [Google Scholar] [CrossRef]
- Prabhudharwadkar, D.M.; Aghalayam, P.A.; Iyer, K.N. Simulation of hydrogen mitigation in catalytic recombiner: Part-I: Surface chemistry modelling. Nucl. Eng. Des. 2011, 241, 1746–1757. [Google Scholar] [CrossRef]
- Klauck, M.; Reinecke, E.-A.; Kelm, S.; Meynet, N.; Bentaïb, A.; Allelein, H.-J. Passive auto-catalytic recombiners operation in the presence of hydrogen and carbon monoxide: Experimental study and model development. Nucl. Eng. Des. 2014, 266, 137–147. [Google Scholar] [CrossRef]
- Bockris, J.O.M. The hydrogen economy: Its history. Int. J. Hydrogen Energy 2013, 38, 2579–2588. [Google Scholar] [CrossRef]
- Haruta, M.; Souma, Y.; Sano, H. Catalytic combustion of hydrogen—II. An experimental investigation of fundamental conditions for burner design. Int. J. Hydrogen Energy 1982, 7, 729–736. [Google Scholar] [CrossRef]
- Wierzba, I.; Depiak, A. Catalytic oxidation of lean homogeneous mixtures of hydrogen/hydrogen–methane in air. Int. J. Hydrogen Energy 2004, 29, 1303–1307. [Google Scholar] [CrossRef]
- Choi, W.; Kwon, S.; Shin, H.D. Combustion characteristics of hydrogen–air premixed gas in a sub-millimeter scale catalytic combustor. Int. J. Hydrogen Energy 2008, 33, 2400–2408. [Google Scholar] [CrossRef]
- Haruta, M.; Sano, H. Catalytic combustion of hydrogen—IV. Fabrication of prototype catalytic heaters and their operating properties. Int. J. Hydrogen Energy 1982, 7, 801–807. [Google Scholar] [CrossRef]
- Haruta, M.; Sano, H. Catalytic combustion of hydrogen I—Its role in hydrogen utilization system and screening of catalyst materials. Int. J. Hydrogen Energy 1981, 6, 601–608. [Google Scholar] [CrossRef]
- Zaitsev, N.K.; Dvorkin, V.I.; Melnikov, P.V.; Kozhukhova, A.E. A dissolved oxygen analyzer with an optical sensor. J. Anal. Chem. 2018, 73, 102–108. [Google Scholar] [CrossRef]
- Melnikov, P.V.; Kozhukhova, A.E.; Naumova, A.O.; Yashtulov, N.A.; Zaitsev, N.K. Optical Analyzer for Continuous Monitoring of Dissolved Oxygen in Aviation Fuel and Other Non-aqueous Media. Int. J. Eng. 2019, 32, 641–646. [Google Scholar]
- Alexandrovskaya, A.Y.; Melnikov, P.V.; Safonov, A.V.; Naumova, A.O.; Zaytsev, N.K. A comprehensive study of the resistance to biofouling of different polymers for optical oxygen sensors. The advantage of the novel fluorinated composite based on core-dye-shell structure. Mater. Today Commun. 2020, 23, 100916. [Google Scholar] [CrossRef]
- Jung, N.; Chung, D.Y.; Ryu, J.; Yoo, S.J.; Sung, Y.-E. Pt-based nanoarchitecture and catalyst design for fuel cell applications. Nano Today 2014, 9, 433–456. [Google Scholar] [CrossRef]
- Gasteiger, H.A.; Kocha, S.S.; Sompalli, B.; Wagner, F.T. Activity benchmarks and requirements for Pt, Pt-alloy, and non-Pt oxygen reduction catalysts for PEMFCs. Appl. Catal. B 2005, 56, 9–35. [Google Scholar] [CrossRef]
- Ströbel, R.; Oszcipok, M.; Fasil, M.; Rohland, B.; Jörissen, L.; Garche, J. The compression of hydrogen in an electrochemical cell based on a PE fuel cell design. J. Power Sources 2002, 105, 208–215. [Google Scholar] [CrossRef]
- Rohland, B.; Eberle, K.; Ströbel, R.; Scholta, J.; Garche, J. Electrochemical hydrogen compressor. Electrochim. Acta 1998, 43, 3841–3846. [Google Scholar] [CrossRef]
- Mercea, J.; Grecu, E.; Fodor, T.; Kreibik, S. Catalytic combustor for hydrogen. Int. J. Hydrogen Energy 1982, 7, 483–487. [Google Scholar] [CrossRef]
- Inui, T.; Miyamoto, Y.; Takegami, Y. Low temperature oxidation of hydrogen enhanced by spillover on a nickel-based composite catalyst. In Spillover of Adsorbed Species; Pajonk, G.M., Teichner, S.J., Germain, J.E., Eds.; Elsevier, Studies in Surface Science and Catalysis: Amsterdam, The Netherlands, 1983; pp. 181–190. [Google Scholar]
- Deshpande, P.; Madras, G. Noble metal ionic sites for catalytic hydrogen combustion: Spectroscopic insights. Phys. Chem. Chem. Phys. 2010, 13, 708–718. [Google Scholar] [CrossRef]
- Hanson, F.V.; Boudart, M. The reaction between H2 and O2 over supported platinum catalysts. J. Catal. 1978, 53, 56–67. [Google Scholar] [CrossRef]
- Kramer, J.F.; Reihani, S.-A.S.; Jackson, G.S. Low-temperature combustion of hydrogen on supported Pd catalysts. Proc. Combust. Inst. 2002, 29, 989–996. [Google Scholar] [CrossRef]
- Fernández, A.; Arzac, G.M.; Vogt, U.F.; Hosoglu, F.; Borgschulte, A.; de Haro, M.C.J.; Montes, O.; Züttel, A. Investigation of a Pt containing washcoat on SiC foam for hydrogen combustion applications. Appl. Catal. B Environ. 2016, 180, 336–343. [Google Scholar] [CrossRef] [Green Version]
- Fumey, B.; Buetler, T.; Vogt, U.F. Ultra-low NOx emissions from catalytic hydrogen combustion. Appl. Energy 2018, 213, 334–342. [Google Scholar] [CrossRef]
- Du Preez, S.P.; Jones, D.R.; Bessarabov, D.G.; Falch, A.; das Neves Quaresma, C.M.; Dunnill, C.W. Development of a Pt/stainless steel mesh catalyst and its application in catalytic hydrogen combustion. Int. J. Hydrogen Energy 2019, 44, 27094–27106. [Google Scholar] [CrossRef]
- Bartholomew, C.H. Mechanisms of catalyst deactivation. Appl. Catal. A 2001, 212, 17–60. [Google Scholar] [CrossRef]
- Schefer, R.W.; Robben, F.; Cheng, R.K. Catalyzed combustion of H2/air mixtures in a flat-plate boundary layer: I. Experimental results. Combust. Flame 1980, 38, 51–63. [Google Scholar] [CrossRef] [Green Version]
- Kozhukhova, A.E.; Du Preez, S.P.; Shuro, I.; Bessarabov, D.G. Development of a low purity aluminum alloy (Al6082) anodization process and its application as a platinum-based catalyst in catalytic hydrogen combustion. Surf. Coat. Tech. 2020, 404, 126483. [Google Scholar] [CrossRef]
- Siemens. STAR CCM+ User Guide Version 12.04; CD-Adapco: New York, NY, USA, 2017. [Google Scholar]
- Ostermaier, J.J.; Katzer, J.R.; Manogue, W.H. Platinum catalyst deactivation in low-temperature ammonia oxidation reactions: I. Oxidation of ammonia by molecular oxygen. J. Catal. 1976, 41, 277–292. [Google Scholar] [CrossRef]
- Nguyen, V.N.; Deja, R.; Peters, R.; Blum, L.; Stolten, D. Study of the catalytic combustion of lean hydrogen-air mixtures in a monolith reactor. Int. J. Hydrogen Energy 2018, 43, 17520–17530. [Google Scholar] [CrossRef]
- Joshi, S.Y.; Ren, Y.; Harold, M.P.; Balakotaiah, V. Determination of kinetics and controlling regimes for H2 oxidation on Pt/Al2O3 monolithic catalyst using high space velocity experiments. Appl. Catal. B Environ 2011, 102, 484–495. [Google Scholar] [CrossRef]
- Younis, L.B. Modelling of hydrogen oxidation within catalytic packed bed reactor. J. Energy Inst. 2006, 79, 222–227. [Google Scholar] [CrossRef]
- Bhatia, D.; Harold, M.P.; Balakotaiah, V. Kinetic and bifurcation analysis of the cooxidation of CO and H2 in catalytic monolith reactors. Chem. Eng. Sci. 2009, 64, 1544–1558. [Google Scholar] [CrossRef]
- Rui, Z.; Chen, C.; Lu, Y.; Ji, H. Anodic alumina supported Pt catalyst for total oxidation of trace toluene. Chin. J. Chem. Eng. 2014, 22, 882–887. [Google Scholar] [CrossRef]
- Rui, Z.; Lu, Y.; Ji, H. Simulation of VOCs oxidation in a catalytic nanolith. RSC Adv. 2012, 3, 1103–1111. [Google Scholar] [CrossRef]
- Chung, C.K.; Tsai, C.H.; Hsu, C.R.; Kuo, E.H.; Chen, Y.; Chung, I.C. Impurity and temperature enhanced growth behaviour of anodic aluminium oxide from AA5052 Al-Mg alloy using hybrid pulse anodization at room temperature. Corros. Sci. 2017, 125, 40–47. [Google Scholar] [CrossRef]
- Chung, C.-K.; Liao, M.-W.; Lee, C.-T.; Chang, H.-C. Anodization of nanoporous alumina on impurity-induced hemisphere curved surface of aluminum at room temperature. Nanoscale Res. Lett. 2011, 6, 596. [Google Scholar] [CrossRef] [PubMed] [Green Version]
- Zaraska, L.; Sulka, G.D.; Jaskuła, M. Anodic alumina membranes with defined pore diameters and thicknesses obtained by adjusting the anodizing duration and pore opening/widening time. J. Solid State Electrochem. 2011, 15, 2427–2436. [Google Scholar] [CrossRef] [Green Version]
- Khodakov, A.Y.; Griboval-Constant, A.; Bechara, R.; Zholobenko, V.L. Pore size effects in Fischer Tropsch synthesis over cobalt-supported mesoporous silicas. J. Catal. 2002, 206, 230–241. [Google Scholar] [CrossRef]
- Arnby, K.; Törncrona, A.; Andersson, B.; Skoglundh, M. Investigation of Pt/γ-Al2O3 catalysts with locally high Pt concentrations for oxidation of CO at low temperatures. J. Catal. 2004, 221, 252–261. [Google Scholar] [CrossRef]
- Rożeń, A. Simulation of start-up behaviour of a passive autocatalytic hydrogen recombiner. Nukleonika 2018, 63, 27–41. [Google Scholar] [CrossRef] [Green Version]
- Du Preez, S.P.; Jones, D.R.; Warwick, M.E.A.; Falch, A.; Sekoai, P.T.; das Neves Quaresma, C.M.; Bessarabov, D.G.; Dunnill, C.W. Thermally stable Pt/Ti mesh catalyst for catalytic hydrogen combustion. Int. J. Hydrogen Energy 2020. [Google Scholar] [CrossRef]
- Zhang, C.; Zhang, J.; Ma, J. Hydrogen catalytic combustion over a Pt/Ce0.6Zr0.4O2/MgAl2O4 mesoporous coating monolithic catalyst. Int. J. Hydrogen Energy 2012, 37, 12941–12946. [Google Scholar] [CrossRef]
- Reinecke, E.-A.; Tragsdorf, I.M.; Gierling, K. Studies on innovative hydrogen recombiners as safety devices in the containments of light water reactors. Nucl. Eng. Des. 2004, 230, 49–59. [Google Scholar] [CrossRef]
- Olsson, L.; Fridell, E. The Influence of Pt Oxide Formation and Pt Dispersion on the Reactions NO2⇔NO+1/2 O2 over Pt/Al2O3 and Pt/BaO/Al2O3. J. Catal. 2002, 210, 340–353. [Google Scholar] [CrossRef]
- Hwang, C.-P.; Yeh, C.-T. Platinum-oxide species formed by oxidation of platinum crystallites supported on alumina. J. Mol. Catal. A Chem. 1996, 112, 295–302. [Google Scholar] [CrossRef]
- Nagai, Y.; Hirabayashi, T.; Dohmae, K.; Takagi, N.; Minami, T.; Shinjoh, H.; Matsumoto, S. Sintering inhibition mechanism of platinum supported on ceria-based oxide and Pt-oxide–support interaction. J. Catal. 2006, 242, 103–109. [Google Scholar] [CrossRef]
- Frank-Kamenetskii, D.A. Diffusion and Heat Exchange in Chemical Kinetics; Princeton University Press: Princeton, NJ, USA, 2015. [Google Scholar]
- Kozhukhova, A.E.; Du Preez, S.P.; Bessarabov, D.G. Preparation of anodized aluminium oxide at high temperatures using low purity aluminium (Al6082). Surf. Coat. Tech. 2019, 378, 124970. [Google Scholar] [CrossRef]
- Kozhukhova, A.E.; Du Preez, S.P.; Bessarabov, D.G. The effects of pore widening and calcination on anodized aluminum oxide prepared from Al6082. Surf. Coat. Tech. 2020, 383, 125234. [Google Scholar] [CrossRef]
- Rodi, W. Experience with two-layer models combining the k-epsilon model with a one-equation model near the wall. In 29th Aerospace Sciences Meeting; American Institute of Aeronautics and Astronautics: Reno, NV, USA, 1991. [Google Scholar]
- Rinnemo, M.; Deutschmann, O.; Behrendt, F.; Kasemo, B. Experimental and numerical investigation of the catalytic ignition of mixtures of hydrogen and oxygen on platinum. Combust. Flame 1997, 111, 312–326. [Google Scholar] [CrossRef]
Figure 1.
Pt/AAO catalyst before catalytic hydrogen combustion (CHC): (a) TEM bright-field image of cross-sectioned AAO pore channels; (b) HRTEM image of interpore-channel Pt particles.
Figure 1.
Pt/AAO catalyst before catalytic hydrogen combustion (CHC): (a) TEM bright-field image of cross-sectioned AAO pore channels; (b) HRTEM image of interpore-channel Pt particles.

Figure 2.
Combustion temperature profiles of Pt/AAO catalysts for 1 h of combustion at 3% H2 volume fraction in air.
Figure 2.
Combustion temperature profiles of Pt/AAO catalysts for 1 h of combustion at 3% H2 volume fraction in air.

Figure 3.
Catalyst surface temperature differences between initial temperature and temperature at steady-state conditions (T–Tinitial, primary y-axis) and conversion of H2 (secondary y-axis) as a function of the initial molar amount of H2 in air.
Figure 3.
Catalyst surface temperature differences between initial temperature and temperature at steady-state conditions (T–Tinitial, primary y-axis) and conversion of H2 (secondary y-axis) as a function of the initial molar amount of H2 in air.

Figure 4.
(a) Relative molar fractions of H2 as a function of time at constant temperatures under steady-state conditions; (b) Arrhenius plot for CHC on the Pt/AAO catalyst.
Figure 4.
(a) Relative molar fractions of H2 as a function of time at constant temperatures under steady-state conditions; (b) Arrhenius plot for CHC on the Pt/AAO catalyst.

Figure 5.
SEM micrographs of AAO samples prepared by 1 h (a) and 4 h (b) anodization.

Figure 6.
Combustion temperature profiles of Pt/AAO catalysts prepared using AAO supports anodized for 1 h and 4 h for 1 h of CHC.
Figure 6.
Combustion temperature profiles of Pt/AAO catalysts prepared using AAO supports anodized for 1 h and 4 h for 1 h of CHC.

Figure 7.
Combustion temperature profiles of Pt/AAO catalyst: (a) during the first 900 s; (b) 530 h of CHC at a H2 flow rate of 138 NmL/min.
Figure 7.
Combustion temperature profiles of Pt/AAO catalyst: (a) during the first 900 s; (b) 530 h of CHC at a H2 flow rate of 138 NmL/min.

Figure 8.
TEM bright-field image of a cross-sectioned Pt/AAO catalyst after 530 h of H2 exposure.

Figure 9.
Infrared (IR) camera temperature map of Pt/AAO catalyst at steady-state conditions (a) and the change in catalyst surface temperature as a function of catalyst position (b) in a 3 vol% H2/air mixture after 3600 s of CHC.
Figure 9.
Infrared (IR) camera temperature map of Pt/AAO catalyst at steady-state conditions (a) and the change in catalyst surface temperature as a function of catalyst position (b) in a 3 vol% H2/air mixture after 3600 s of CHC.

Figure 10.
IR camera temperature map of Pt/AAO catalyst obtained at steady-state conditions (a) and the change in Pt/AAO catalyst surface temperature as a function of catalyst “position” X (b), determined by computational fluid dynamics (CFD) simulation.
Figure 10.
IR camera temperature map of Pt/AAO catalyst obtained at steady-state conditions (a) and the change in Pt/AAO catalyst surface temperature as a function of catalyst “position” X (b), determined by computational fluid dynamics (CFD) simulation.

Figure 11.
H2 distribution map of Pt/AAO catalyst obtained at steady-state conditions, determined by CFD simulation.
Figure 11.
H2 distribution map of Pt/AAO catalyst obtained at steady-state conditions, determined by CFD simulation.

Figure 12.
Schematic of the experimental setup used to determine the Pt/anodized aluminum oxide (AAO) catalytic activity and thermal distribution of the catalyst section.
Figure 12.
Schematic of the experimental setup used to determine the Pt/anodized aluminum oxide (AAO) catalytic activity and thermal distribution of the catalyst section.


Table 1.
Morphological characteristics (Dp, Dc, n, and P) of AAO samples.
| Time of Second Anodization Step (h) | Dp (nm) | Dc (nm) | n (pores/μm2) | P |
|---|---|---|---|---|
| 1 | 55.7 ± 5.7 | 79.5 ± 11.0 | 193 | 48 |
| 4 | 86.9 ± 9.5 | 121.0 ± 18.8 | 85 | 52 |
Dp—diameter of pores. Dc—interpore distance. n—pore density. P—porosity.
Table 2.
Local linear velocity of a H2/air mixture, determined by CFD simulation.
| X, mm | H2/Air Mixture Local Linear Velocity, m/s | ||||
|---|---|---|---|---|---|
| Catalyst 1 | Catalyst 2 | Catalyst 3 | Catalyst 4 | Catalyst 5 | |
| 0 | 0.037 | 0.147 | 0.219 | 0.182 | 0.053 |
| 20 | 0.049 | 0.141 | 0.199 | 0.172 | 0.062 |
| 70 | 0.075 | 0.131 | 0.153 | 0.142 | 0.085 |
Publisher’s Note: MDPI stays neutral with regard to jurisdictional claims in published maps and institutional affiliations. |
© 2021 by the authors. Licensee MDPI, Basel, Switzerland. This article is an open access article distributed under the terms and conditions of the Creative Commons Attribution (CC BY) license (https://creativecommons.org/licenses/by/4.0/).
Share and Cite
MDPI and ACS Style
Kozhukhova, A.E.; du Preez, S.P.; Malakhov, A.A.; Bessarabov, D.G. A Thermally Conductive Pt/AAO Catalyst for Hydrogen Passive Autocatalytic Recombination. Catalysts 2021, 11, 491. https://0-doi-org.brum.beds.ac.uk/10.3390/catal11040491
AMA Style
Kozhukhova AE, du Preez SP, Malakhov AA, Bessarabov DG. A Thermally Conductive Pt/AAO Catalyst for Hydrogen Passive Autocatalytic Recombination. Catalysts. 2021; 11(4):491. https://0-doi-org.brum.beds.ac.uk/10.3390/catal11040491
Chicago/Turabian StyleKozhukhova, Alina E., Stephanus P. du Preez, Aleksander A. Malakhov, and Dmitri G. Bessarabov. 2021. "A Thermally Conductive Pt/AAO Catalyst for Hydrogen Passive Autocatalytic Recombination" Catalysts 11, no. 4: 491. https://0-doi-org.brum.beds.ac.uk/10.3390/catal11040491
Note that from the first issue of 2016, this journal uses article numbers instead of page numbers. See further details here.