Article

Magnetite-Based Catalyst in the Catalytic Wet Peroxide Oxidation for Different Aqueous Matrices Spiked with Naproxen–Diclofenac Mixture

by
Ysabel Huaccallo-Aguilar
1,
Silvia Álvarez-Torrellas
1,*,
Johanny Martínez-Nieves
1,
Jonathan Delgado-Adámez
2,
María Victoria Gil
3,
Gabriel Ovejero
1 and
Juan García
1,*
1
Catalysis and Separation Processes Group, Chemical Engineering and Materials Department, Faculty of Chemistry, Complutense University, Avda. Complutense s/n, 28040 Madrid, Spain
2
Chemical Tecnological Institute of Food and Agriculture (INTAEX), Centro de Investigaciones Científicas y Tecnológicas de Extremadura (CICYTEX), Avda. Adolfo Suárez s/n, 06007 Badajoz, Spain
3
IACYS-Unidad de Química Verde y Desarrollo Sostenible, Departamento de Química Orgánica e Inorgánica, Facultad de Ciencias, Universidad de Extremadura, 06006 Badajoz, Spain
*
Authors to whom correspondence should be addressed.
Submission received: 24 March 2021 / Revised: 16 April 2021 / Accepted: 17 April 2021 / Published: 19 April 2021
(This article belongs to the Special Issue Environmental Catalysis for Water Remediation)

Abstract

:
Magnetite supported on multiwalled carbon nanotubes catalysts were synthesized by co-precipitation and hydrothermal treatment. The magnetic catalysts were characterized by X-ray diffraction, Fourier-transform infrared spectrometry, thermogravimetric analysis and N2 physisorption. The catalysts were then tested for their ability to remove diclofenac (DCF) and naproxen (NAP) from an aqueous solution at different conditions (pH, temperature, and hydrogen peroxide) to determine the optimum conditions for chemical oxidation. The optimization of the process parameters was conducted using response surface methodology (RSM) coupled with Box–Behnken design (BBD). By RSM–BBD methodology, the optimal parameters (1.75 mM H2O2 dosage, 70 °C and pH 6.5) were determined, and the removal percentages of NAP and DCF were 19 and 54%, respectively. The NAP–DCF degradation by catalytic wet peroxide oxidation (CWPO) was caused by •OH radicals. In CWPO of mixed drug solutions, DCF and NAP showed competitive oxidation. Hydrophobic interactions played an important role during the CWPO process. On the other hand, the magnetic catalyst reduced its activity after the second cycle of reuse. In addition, proof of concept and disinfection tests performed at the operating conditions showed results following the complexity of the water matrices. In this sense, the magnetic catalyst in CWPO has adequate potential to treat water contaminated with NAP–DCF mixtures.

1. Introduction

Many contaminants are present in several water environments, especially in urban wastewaters. Most of those contaminants are toxic, endocrine disruptors and potentially carcinogenic to human life, terrestrial and aquatic animals in general, even at low concentrations.
Lately, pharmaceutical compounds have been specially reported to cause negative effects on the aquatic life of several countries [1]. Naproxen (NAP) and diclofenac (DCF) are the two nonsteroidal anti-inflammatory drugs (NSAIDs) most detected in wastewater treatment plants (WWTPs), surface water (SW), and hospital wastewater effluent (HW), and they are tending to increase their concentrations in water. Nowadays, their significant range of concentrations is between 0.1 ng/L to 0.220 mg/L [2,3,4]. NAP (84 against fish) and DCF (9300 against Oncorhynchus mykiss) [5] are high values of risk quotient (RQ), and they and their degradation byproducts have exhibited adverse effects on aquatic organisms. Their toxicity is measured as EC50 (median effective concentration), and NAP was reported in 0.33 mg/L on C. dubia and DCF in 14.5 mg/L on phytoplankton [6].
Conventional wastewater treatment showed low efficiency in removing pharmaceuticals since they are nonbiodegradable compounds, which means exploring alternative technologies for the efficient treatment of wastewater [7]. One of the most efficient technologies explored to date is the advanced chemical processes (AOPs) [8]. In the past, AOPs have been applied for reducing the concentrations of residual organic compounds and for disinfection purposes. Nowadays, they are being used to improve the biological treatability of recalcitrant and toxic micropollutants, such as pharmaceuticals, herbicides and endocrine-disrupting compounds (EDCs), reducing the inhibitory effects of those specific substances towards microbial growth [9].
From AOPs, the catalytic wet peroxide oxidation (CWPO) process has been demonstrated to be highly effective in the removal of aromatic compounds, herbicides, pesticides, azo dyes, and pharmaceutical compounds at mild conditions [10]. CWPO is mostly applied due to its simplicity in terms of equipment and management operation compared to homogeneous Fenton [11,12,13]. The degradation mechanism is based on the oxidation of the organic compound by the action of hydroxyl radicals (•OH). In CWPO, the generation of •OH mainly depends on a solid catalyst, usually an iron-based catalyst, and the presence of H2O2 in the aqueous medium (Equations (1) and (2)) [14]. Consequently to these Fenton-reaction, hydroxide ions ( ˉ OH ) and hydroperoxyl radicals (•OH2) are produced. On the other hand, some researchers have reported that pH, temperature, and the chemical properties of the contaminants have an important effect on the CWPO efficiency.
Fe 2 + + H 2 O 2 Fe 3 + + OH + ˉ OH
Fe 3 + + H 2 O 2 Fe 2 + + OH 2 + H +
The catalytic activity of the catalyst is crucial to the effective removal of recalcitrant and toxic compounds [15,16,17]. In this sense, many researchers have studied several catalysts. From the catalysts studied, Fe3O4 supported on multiwalled carbon nanotubes (Fe3O4/MWCNTs) has shown as an effective material in a wider range of pH (8–10) in CWPO with the additional advantage of its easy recovery due to its magnetic properties. In the catalyst, it is noteworthy the function of MWCNTs as stable support even at drastic acidic and temperature conditions, and the role for the dispersion of magnetite onto its surface, obtaining a magnetic catalyst with minimum leaching of iron and so the minimum reduced toxicity towards the reaction medium [18].
Notwithstanding the huge scientific literature reported, the efficient removal of pharmaceuticals, i.e., drug mixture, from different water matrices need to be explored since their degradation mechanism depends on several factors (hydrogen peroxide dosage, temperature, pH, catalyst dosage, etc.) [19,20]. Furthermore, it is well-known that the composition of the wastewater represents a crucial factor; hence, the real wastewaters should be used at this scope because it is more appropriate for theoretical investigations [21,22]. The normal methodology used to evaluate the parameter effects is response surface methodology (RSM) coupled with Box–Behnken design (BBD) [23,24].
The aim of this work was to model, optimize, and compare NAP–DCF mixture removal by magnetic catalyst using the RSM–BBD methodology. The effect of different operational parameters like pH, temperature and H2O2 dose was evaluated to forecast the output. Meanwhile, the removal competition of the drugs was seen through the CWPO experiments. In addition, drug degradation was observed through the intermediate compounds. Finally, as a proof of concept, CWPO treatment of real and relevant water matrices was performed to demonstrate the effectiveness of the CWPO process. With those results, we will give the first insight into the NAP–DCF mixture removal and demonstrate applying CWPO technology for the treatment of real matrices with that mixture.

2. Results and Discussion

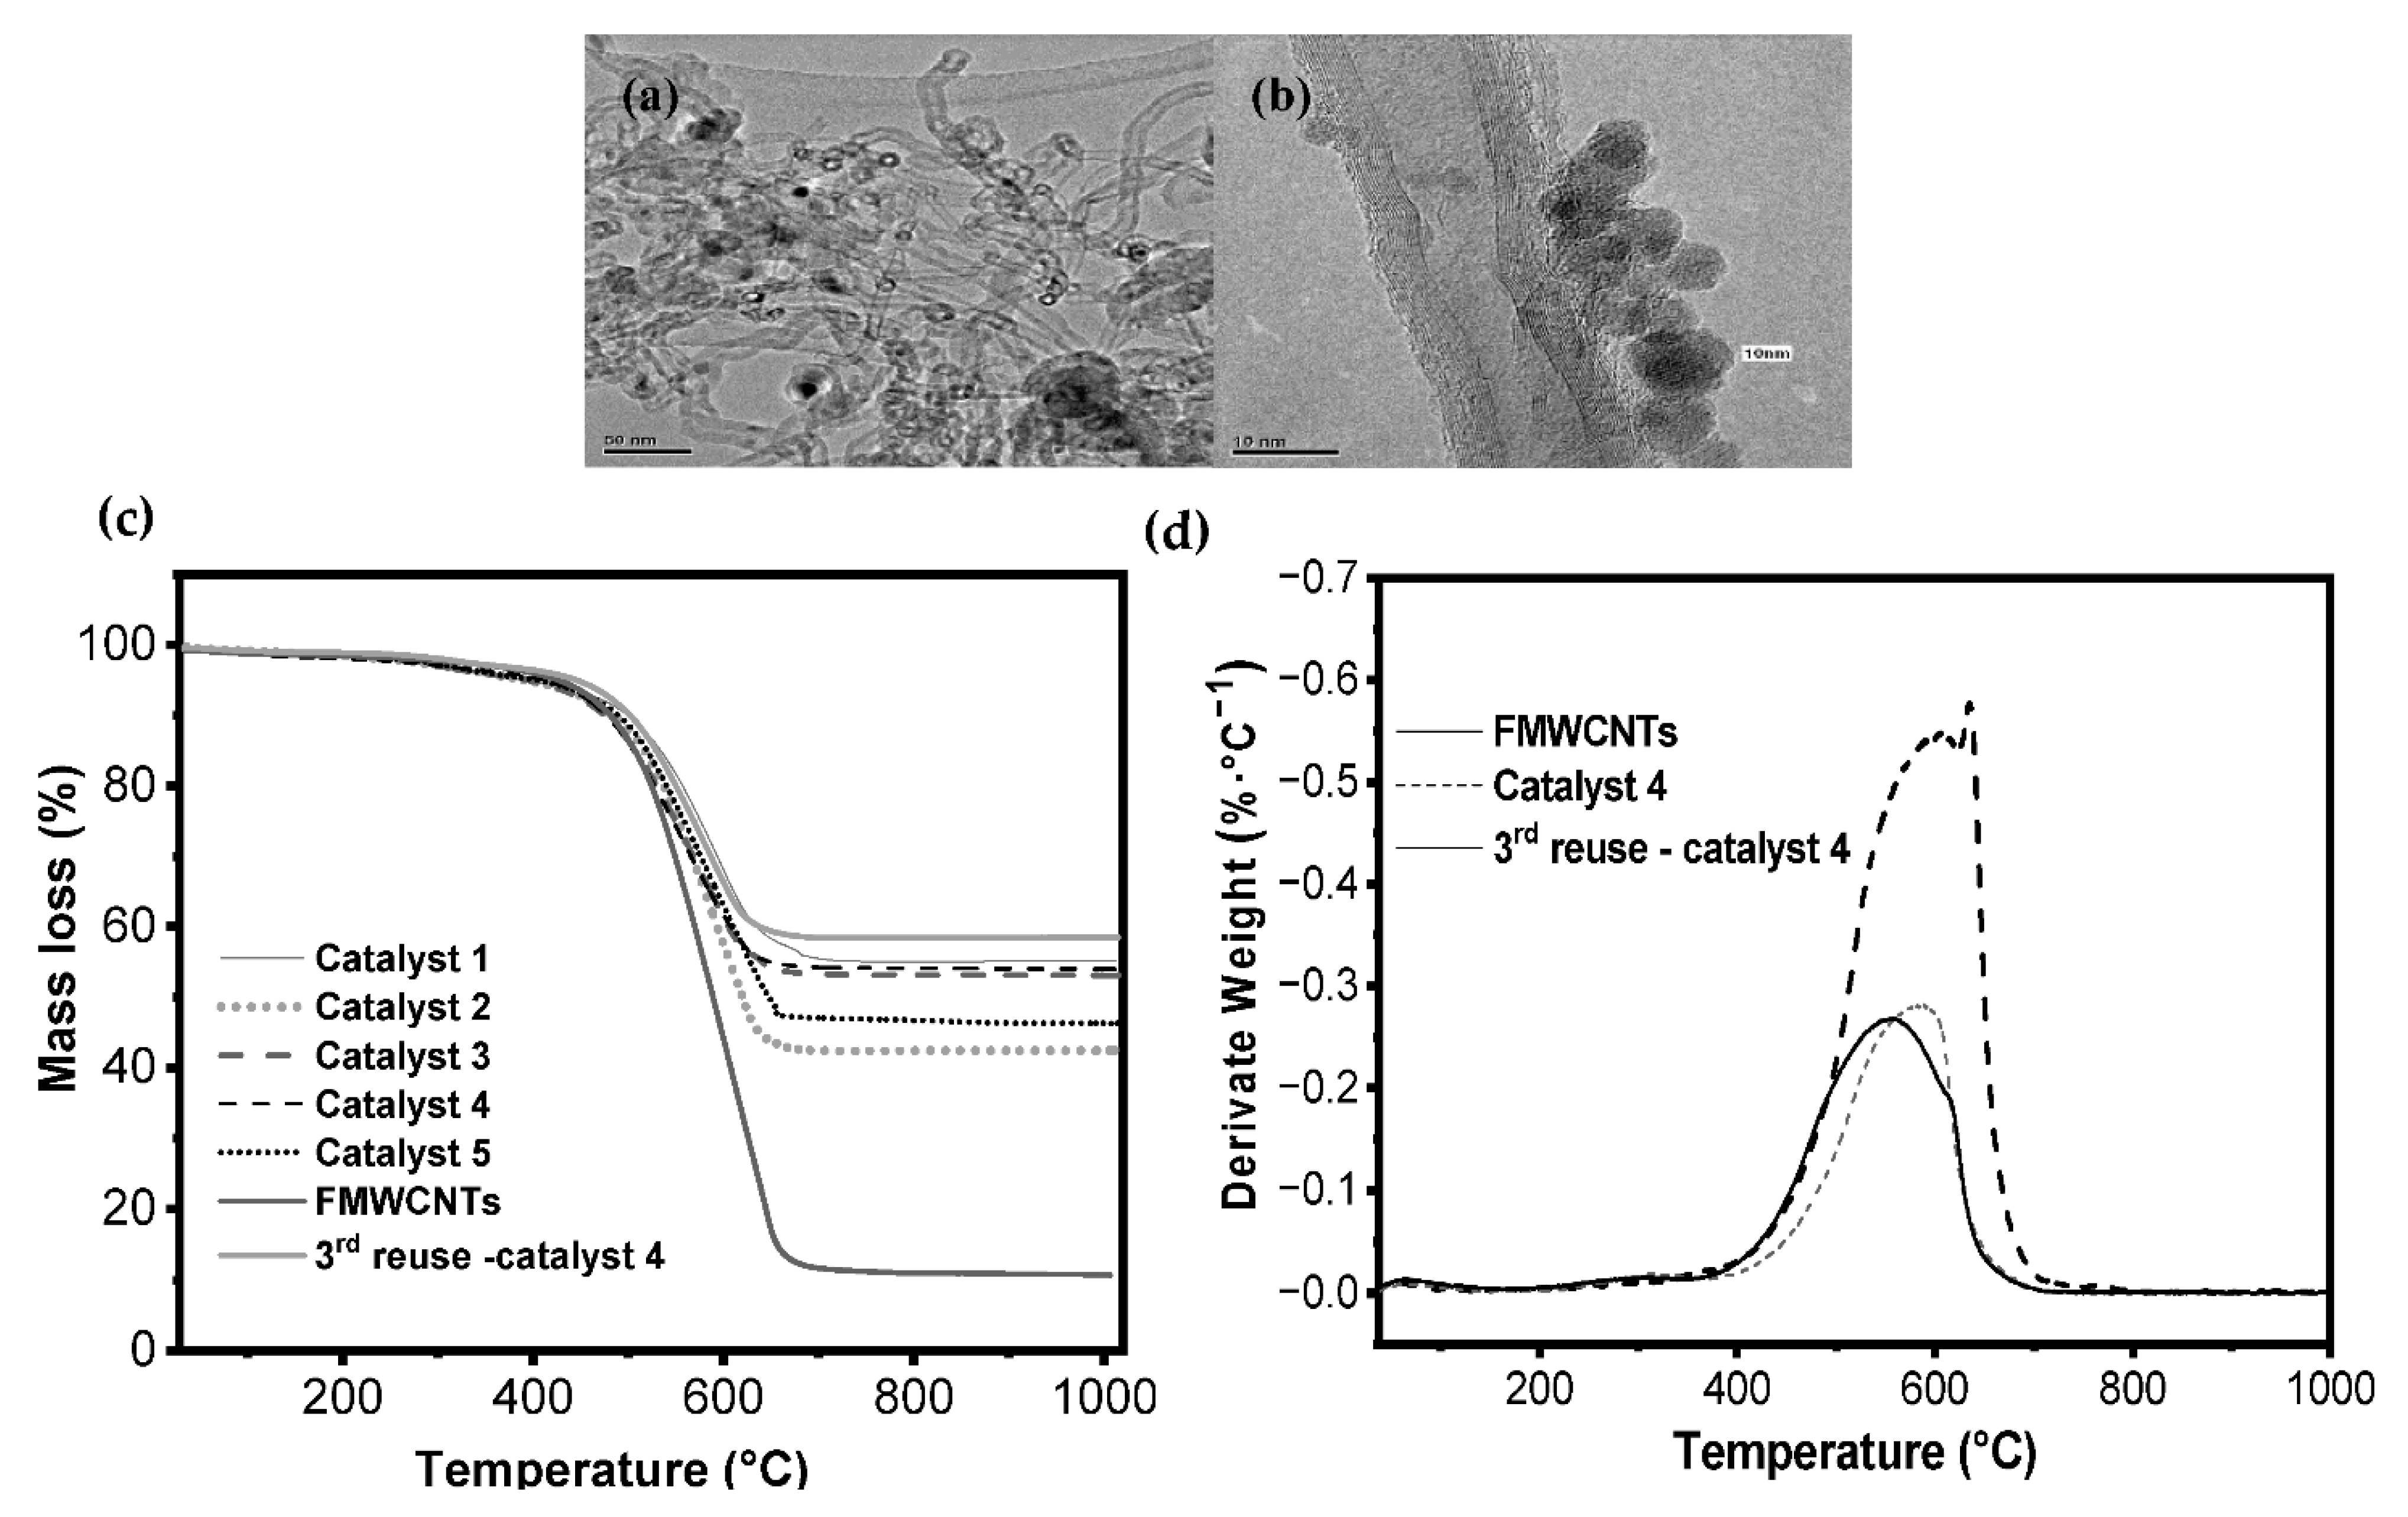
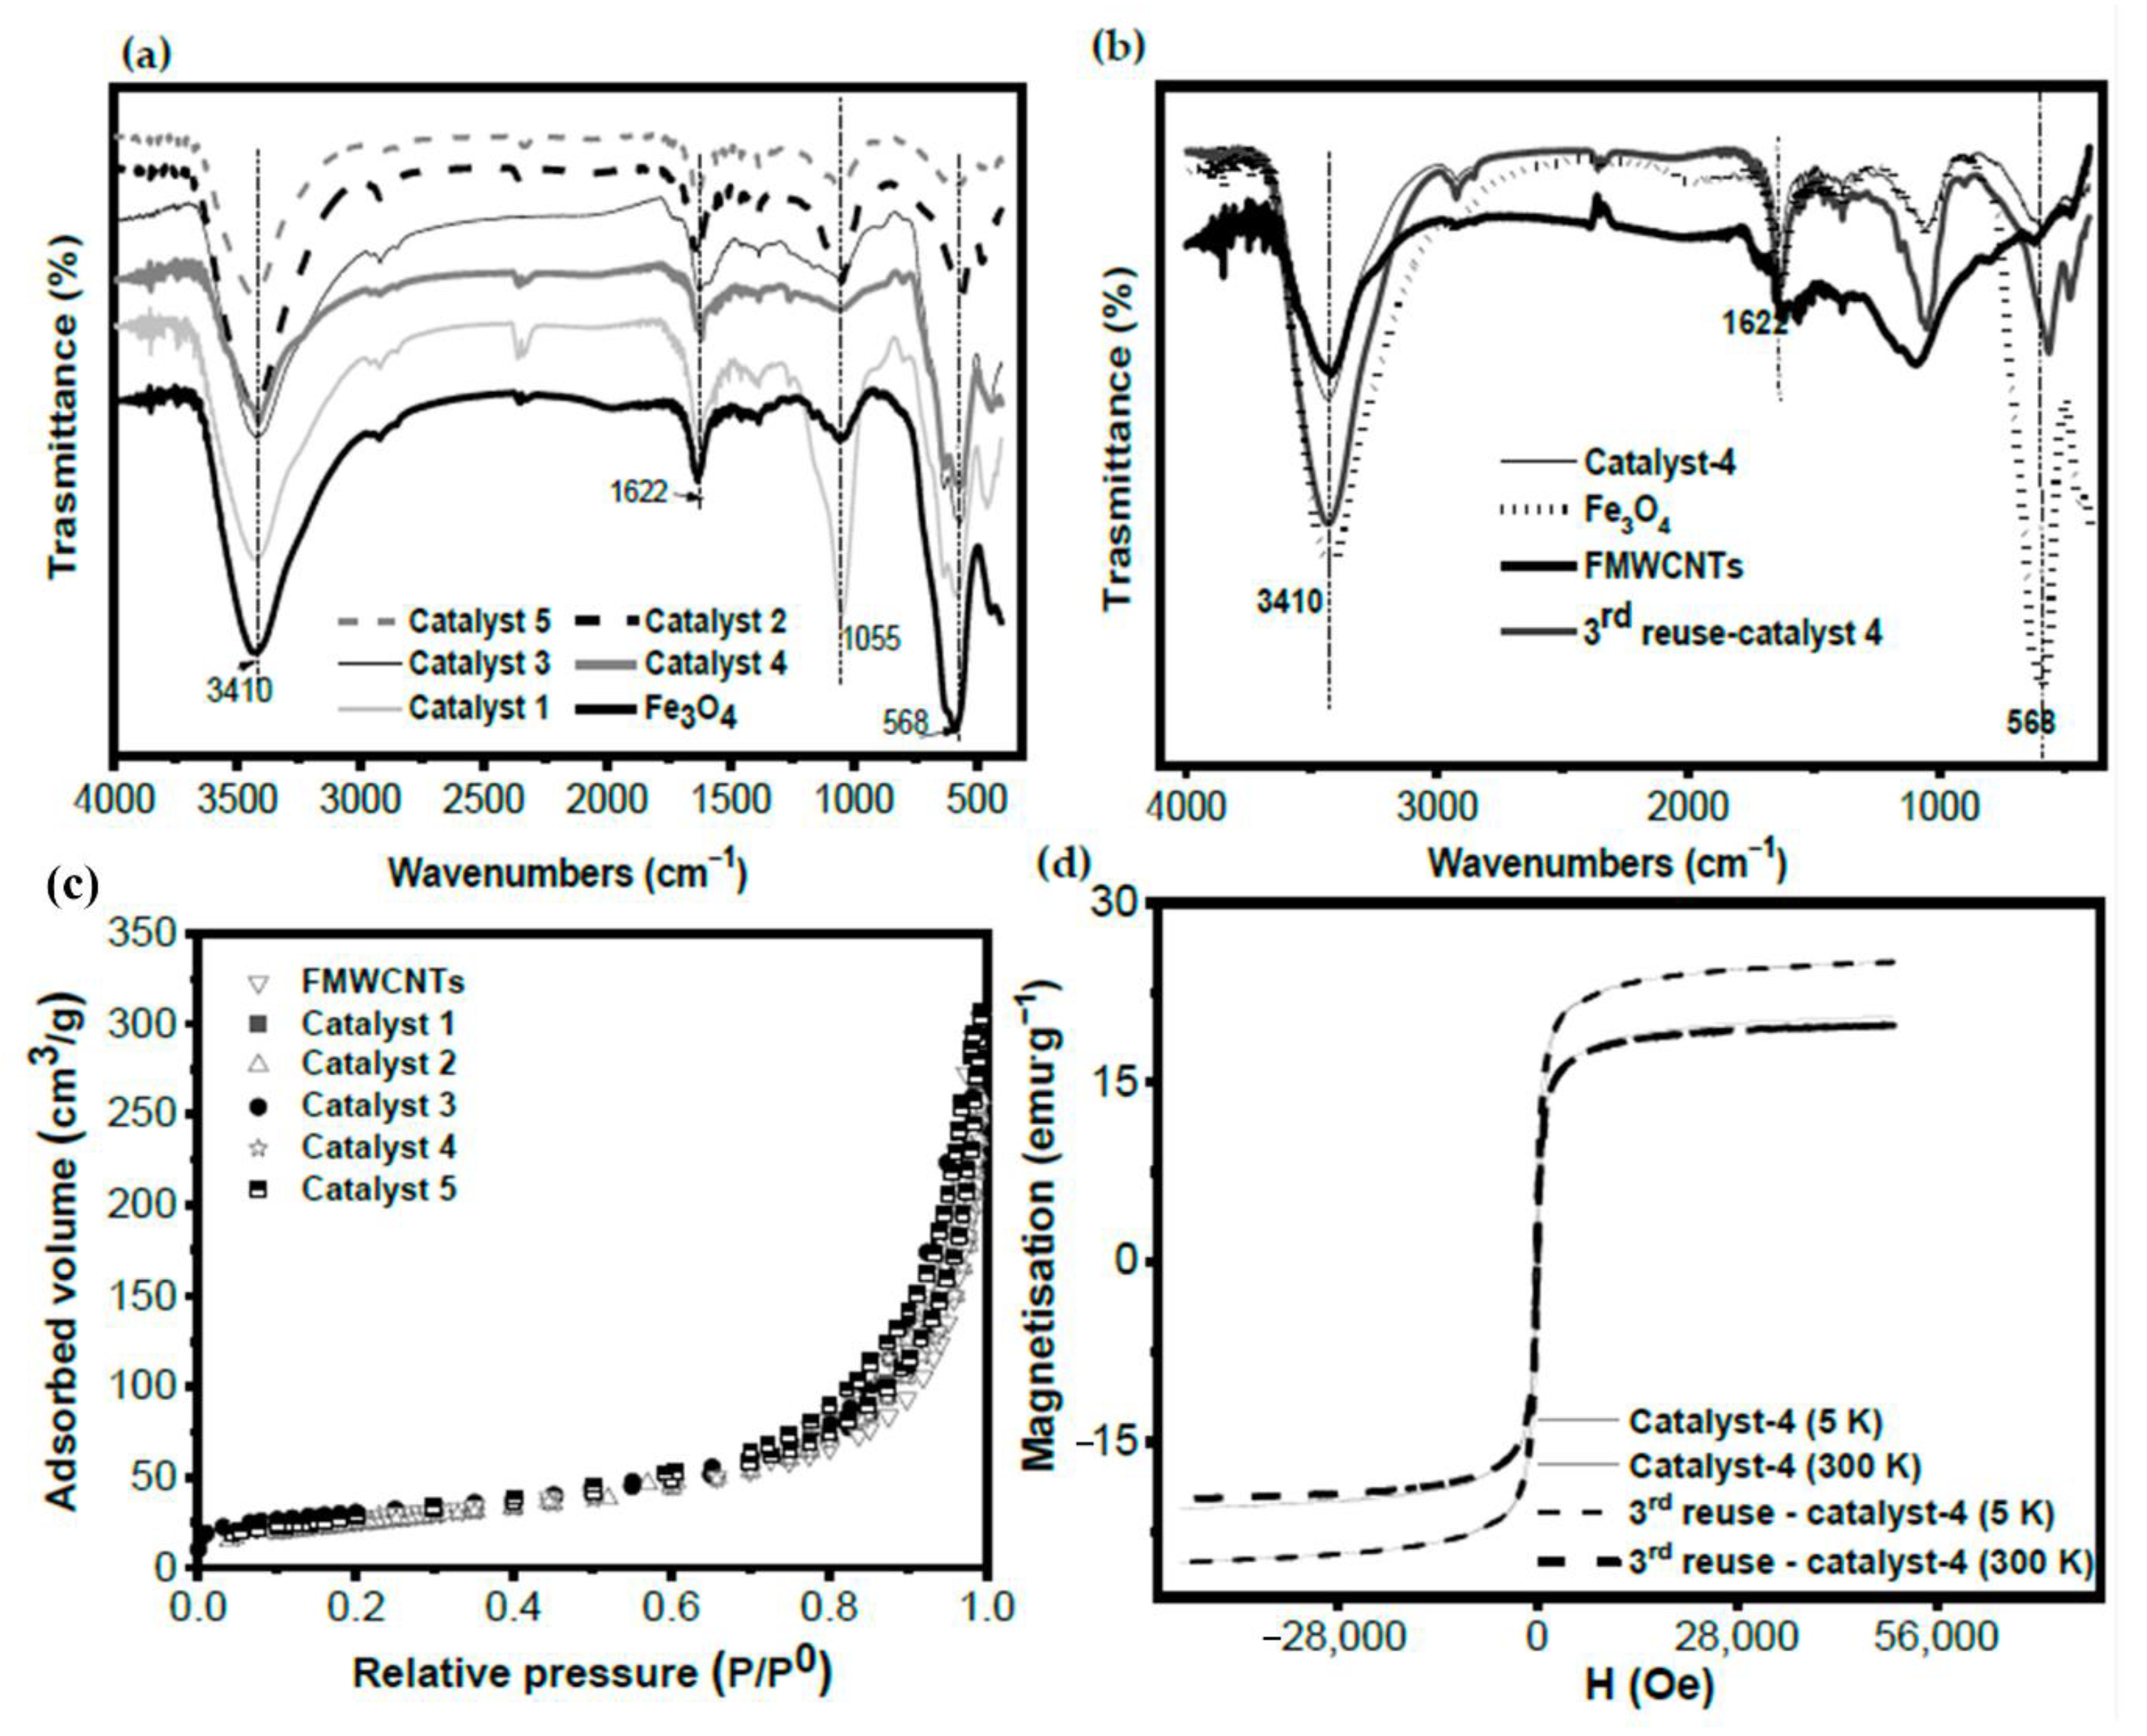
2.1. Catalyst Characterization

TEM images (Figure 1a) show that the FMWCNTs had a medium size of less than 50 nm. The sphere-like shape with a diameter range of 10–20 nm belongs to Fe3O4 particles in the prepared Fe3O4–MWCNTs catalyst (Figure 1b) [25]. Furthermore, TEM images revealed the formation of clusters, which is attributed to the magnetic properties of the magnetite [13]. Those facts confirm that the magnetite nanoparticles were successfully deposited on the surface of MWCNTs and the high reliability of the applied synthesis method.
Thermal gravimetric analysis (TGA) of FMWCNTs (pretreated MWCNTs), fresh catalyst and the third reuse of catalyst 4 were performed (Figure 1c). In addition, derivate weight loss was analyzed for FMWCNTs, the catalyst 4 and its third reuse (Figure 1d). As can be seen in Figure 1c, all the solid samples are thermally stable up to 400 °C under air atmosphere. Afterward, a fast mass loss between 40 to 68% for the catalyst and 90% for the support occurred from 400 to 700 °C [26]. The maximum temperature of oxidation for the catalyst 4, its third reuse and support were 600, 550 and 650 °C, respectively (Figure 1d). The oxidation of MWCNTs and carboxyl groups by the temperature between the range of 400 to 700 °C reduced the mass of the catalyst and support [20]. On the other hand, comparing the mass loss among the catalysts, it can be highlighted that the catalysts 4, 3 and 1 showed more magnetite than catalysts 2 and 5 since the mass loss in the two first was low compared to the last three after 700 °C. This last statement agrees with the initial iron compositions used to prepare them (see Section 3.2). Finally, the residual of mass left after 700 °C until 1000 °C confirmed the deposition of magnetite on the FMWCNTs, and we hypothesize that H2O2 treatment could be a practical method for the surface functionalization of MWCNTs [20].
For better comprehension of the structure and composition of the material, FT-IR spectra were obtained (Figure 2a,b). As shown in Figure 2a,b, the broad adsorption peak found at 3410 cm−1 corresponds to the stretching mode of O-H on the surface of FMWCNTs and some adsorbed atmospheric water. The peaks appearing at 1622 cm−1 and 1055 cm−1 are assigned to the stretching vibration of C=C (double bonds) as well as C-O and C-O-C. Compared to the FMWCNTs, the catalysts (fresh and reused) presented an additional peak at 568 cm−1 resulting from the Fe-O stretching vibration of the Fe3O4, suggesting the formation of the Fe3O4/MWCNTs, and thus the interaction between Fe3O4 and functionalized MWCNTs [27]. Additionally, from Figure 2b, it can be confirmed that a load of magnetite remains after the third reuse of the catalyst since the peak at 568 cm−1 can be observed in the reused catalyst [13].
Textural properties (specific surface area, SBET, micropore volume, VMic, and total pore volume, VTotal) and N2 adsorption–desorption isotherms at 77 K of FMWCNTs, catalyst 4 and 5 are displayed in Table 1 and Figure 2c. From SBET values estimated by applying the Brunauer–Emmett–Teller equation, the support and the magnetic catalysts 4 and 5 had very similar values (97 and 96, 90 m2 g−1, respectively), indicating that the deposition of magnetite on the support did not interfere in the textural properties of FMWCNTs. This last statement agrees with the obtained similar N2 adsorption–desorption isotherms of FMWCNTs and catalysts 4 and 5 (Figure 2c). From the very low micropore volume values (0.05–0.06 cm3 g−1) and the average pore widths of 15.9 nm (17.1 and 14.7 nm) of the materials (Table 1), it can be confirmed that the prepared catalysts are essentially mesoporous (type IV-a isotherms) [28].
To study the potential magnetization of the catalyst, the magnetization hysteresis curves of the catalyst 4 and third reuse were obtained. The M−H hysteresis loop of the solids measured at the maximum external field (H) of 60 kOe at 5 K and 300 K are plotted in Figure 2d. The typical S-type was observed in the two magnetization curves, illustrating the superparamagnetic behavior of the catalyst. The saturation magnetization (Ms) of the fresh catalyst 4 and its third reuse both were found of 20.0 emu g−1 at 300 K and 25.0 emu g−1 at 5 K [29], confirming this values the good magnetic separation of the catalyst from the aqueous solution by applying an external magnetic field.
Finally, elemental analysis of the FMWCNTs, fresh catalysts, and the third reuse of catalyst 4 was analyzed, and the results are collected in Table 2. The CHNS measurements found that the %C in MWCNTs, fresh catalyst 4, and its third reuse were 84.47, 40.72, and 41.65%, respectively [24]. Thereafter, it can be confirmed that carbon deposition on the catalyst surface was not significant.

2.2. Screening of the Magnetic Catalyst by CWPO

Five catalysts were prepared for determining which of them possess high catalytic activity. Figure 3a,b display the evolution of the degradation of NAP and DCF by CWPO. The reaction conditions were established as follows: DCF concentration of 5 mg L−1, NAP concentration of 5 mg L−1, catalyst mass of 1.0 g L−1, 1.5 mM of H2O2 concentration, pH of 6 and 3 h of reaction time.
As expected, the highest removal of DCF (66%) and NAP (40%) from aqueous solution was obtained by using catalyst 4 by CWPO. That high removal could be related to the high Fe percentage (35%) of this catalyst. On the other hand, the lowest DCF (39%) and NAP (19%) removal were obtained by using catalyst 5 with an iron percentage of 10.6%, which was the lowest among the prepared catalysts. On the other hand, with catalysts 1, 2 and 3, low NAP removal values (range of 15 to 23%) were obtained. However, among those catalysts, catalyst 2 could be determined the highest DCF removal. The composition of catalyst 2, with the highest percentage of MWCNTs, could have positively affected the DCF and NAP removal. Thus, in other research, it has been reported that MWCNTs can play a main role in the CWPO process since they can remove NAP or DCF at pH values above 6.5 [11,30].
Regarding the drug competition in the process, it is important to mention that DCF was most susceptible to be removed than NAP at pH 6. That similar preference has been reported for the treatment by CWPO of IBU-DCF mixture at pH 6.18. In that research, it was found that DCF is less dependent on the initial pH since pKa of DCF (4.15) is lower than pKa of IBU (4.9), and therefore, DCF is the dominant species in solution between pH values of 4.15 and 6.19 [11]. However, the NAP molecule is more stable than DCF since NAP is a methoxynaphthalene and DCF is a monocarboxylic acid consisting of phenylacetic acid having a (2,6-dichlorophenyl) amino group at the 2-position. Furthermore, in some research about CWPO treatment of a mixture of pharmaceutical compounds has been reported that both pollutants containing several aromatic rings are more susceptible to be removed by this technology [31]. In all experiments developed in this study, DCF was preferable removed than NAP, and this could be related to the alkaline pH that may favor the removal of DCF over NAP since the first has two opposite rings in the molecule and the second two benzene rings joined together.
In the same way, the H2O2 removal efficiencies were analyzed. Figure S1 in the Supplementary Material depicts the evolution of this parameter for each catalyst by CWPO. As it can be observed, the highest efficiency was obtained for NAP using the catalyst 4. Thus, catalyst 2 showed the second-highest H2O2 removal efficiency for NAP and the first for DCF. Meanwhile, the other catalysts showed lower H2O2 efficiencies. In this sense, according to the obtained H2O2 efficiencies and drug removal values, catalyst 4 was selected as the catalyst to be used in the CWPO process optimization.

2.3. Optimization of NAP–DCF Removal by CWPO with a Magnetic Catalyst

The evaluation of the effect of the operating conditions on the CWPO process was carried out using RSM–BBD methodology. For this purpose, 15 CWPO experiments were accomplished. The catalyst used in the experiments was catalyst 4. The operating conditions that were maintained constant were catalyst dosage at 1.0 g L−1, atmospheric pressure and NAP and DCF concentration at 5 mg L−1 each. The varied operation conditions were pH, temperature and H2O2 dosage. The variables in each experiment and their response calculated as removal efficiency (η) (Equation (3)) are summarized in Table 3.
η = ( C 0 C ) C 0
where C0 and C are the concentrations of NAP or DCF (mg L−1) at the initial time and any time t, respectively.
Hence, the values obtained for NAP and DCF removal from their corresponding predicted model are collected in Table 3. Thus, it was not found a significant difference between the observed and predicted values since their determination coefficients were up to 0.99 (R2 of NAP = 0.993 and R2 of DCF = 0.995) (see Figure S2 in the Supplementary Material) [32]. In addition, the regression model was analyzed by analysis of variance (ANOVA) test. The results are collected in Table 4.
As can be seen in Table 4, the found F-values for NAP and DCF were 85.03 and 114.08, respectively. These values indicated that the predicted equations were significant and able to describe the correlation between response and independent variables [33]. In the same way, the determined p-values were significant since they were below 0.05, meaning that the coefficients are significant. Otherwise, p-values up to 0.05 indicate that the coefficient is not significant [33]. Thus, the significant terms of the NAP and DCF quadratic polynomial model were A–C, A2, B2, C2, AB, AC and BC (see Tables S1 and S2 in the Supplementary Material) excepting A2 and C2 for the NAP model. However, they were included in the model response predictions since those terms in the model equation were found so close to the experimental yield [33]. The quadratic polynomial response surface models for NAP and DCF removal by CWPO were obtained as Equations (4) and (5), respectively.
YNAP = 10.57 + 1.55A + 2.40B − 5.79C + 0.27A2 + 0.75AB + 1.91B2 + 1.31BC − 1.56AC − 0.67C2
YDCF = 31.37 + 4.64A + 5.28B − 17.55C + 2.09A2 + 2.43AB + 5.12B2 + 2.89BC − 5.08CA − 2.54C2
where YNAP and YDCF represent the removal percentage of NAP and DCF, respectively. A, B and C are H2O2 dosages, temperature and pH, respectively.
The reported model showed optimum NAP and DCF removal efficiencies of 18.82 and 53.89%, respectively, whereas the experimental NAP and DCF removal percentages were found to be 19.0 and 54.0% (Table 3). Hence the predictions of the regression model using the RSM tool showed a value of deviation lower than 2% with the experimental results. Due to the very small value of deviation, it could be concluded that the prediction of the developed model showed high accuracy.
From the effect of the parameters studied, pH resulted in having a great effect on removing the drug mixture, whereas the temperature also performed its own effect to a certain extent. Up to 70 °C, the temperature can have a negative effect on the drug removal [34]. On the other side, the p-values obtained for lack of fit (LOF) for NAP and DCF were not significant, confirming that the response and independent variables showed a high correlation.

2.4. Influence of the Operating Parameters: Response Surface Methodology

The influence of the operating parameters on CWPO reaction for removing NAP–DCF mixture was analyzed by RSM–BBD methodology [30]. The combined effect of the operating parameters (pH, temperature and H2O2) in their range studied is shown in Figure 4a,b, Figure 5a,b, and Figure S4 (in the Supplementary Material). It is noteworthy to say that the predicting response outside of the range of the independent variables may not give accurate results since the change of the independent variable range led to a change in the intercept and coefficients of the developed model.

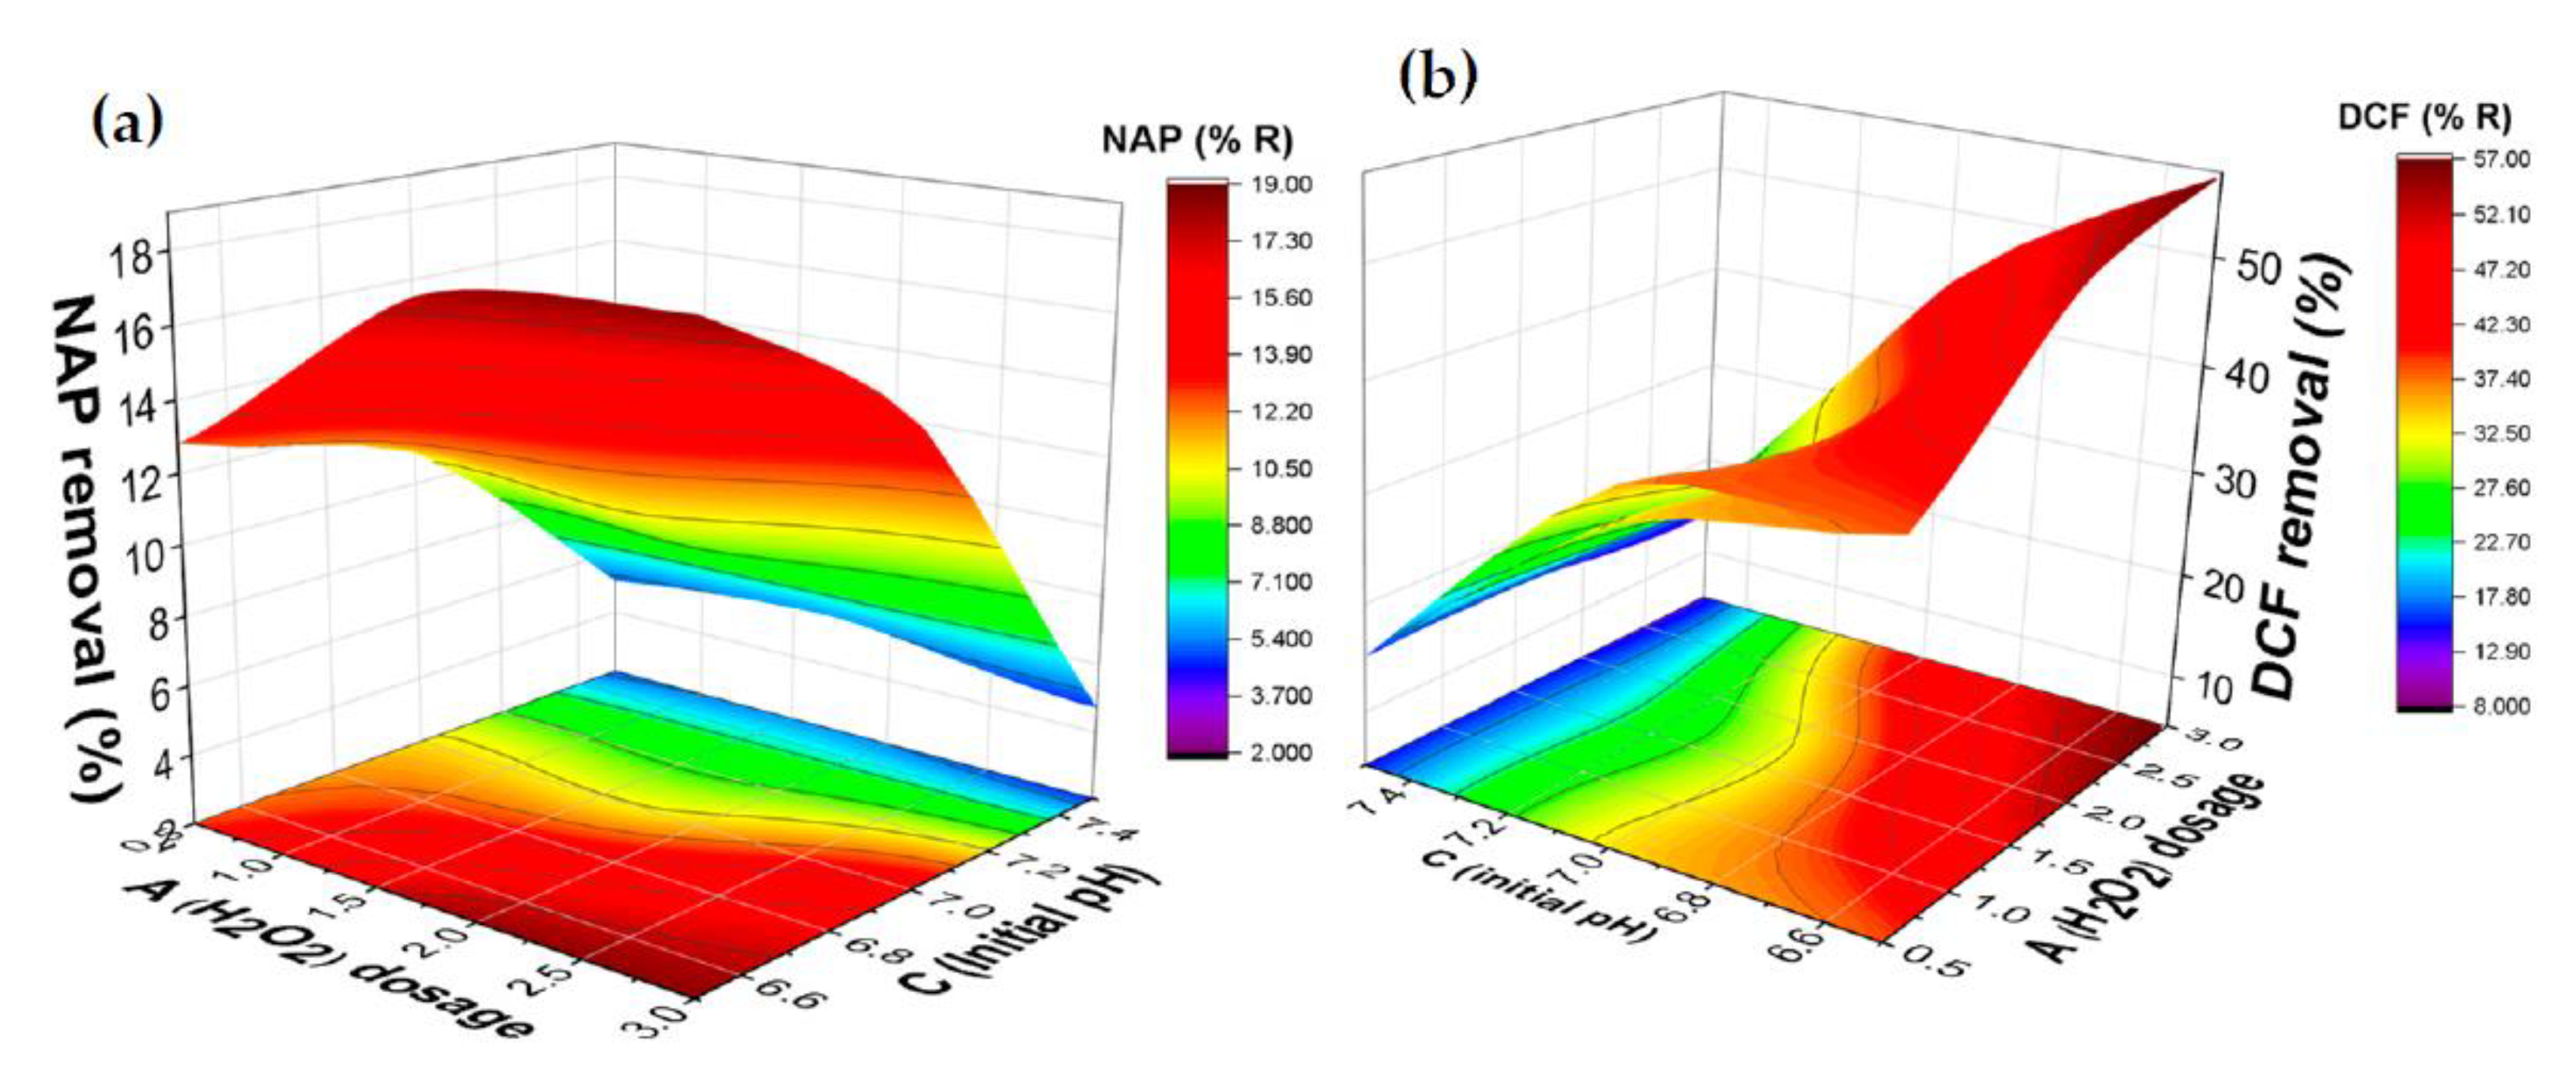
2.4.1. The Combined Effect of Hydrogen Peroxide Dose and pH on the Removal of DCF and NAP

Figure 4a,b show the interaction of pH (6.5–7.5) and H2O2 dose (ranging from 0.5 to 3 mM) in the CWPO of NAP (5.0 mg L−1) and DCF (5.0 mg L−1) in an aqueous solution. As shown, the removal of both pollutants trends to increase when the pH decrease and H2O2 increase until a certain extent. The maximum removal of NAP and DCF was obtained at pH 6.5 and 1.75 mM of H2O2 dosage using 1.0 g L−1 of catalyst. Thus, pH has a significant effect on the generation of hydroxyl radicals in the CWPO process, so when pH increases, the scavenging of the HO is favored. Those results are following those found in some research about the removal of atrazine [20], NAP and DCF [30] by CWPO.
In the same way, bicarbonate ions appear at pH solution up to 6.35 (Equation (6)). The mechanism of scavenging consists of the reaction of bicarbonate ions with the hydroxyl radicals (Equation (7)) to produce carbonate radicals ( CO 3 ) (E0 = 1.78 V, pH 7), which have lower redox potential compared to the potential of the hydroxyl radicals (E0 = 2.8 V) [35]. Furthermore, bicarbonate ions decompose the H2O2 (Equation (8)) [34].
H 2 CO 3 ( aq )     HCO 3   ( aq ) +   H + ( aq )           pKa 1 = 6.35
HCO 3 + OH     CO 3 +   H 2 O
HCO 3 +   H 2 O 2     HCO 4   ( aq ) +   H 2 O ( aq )

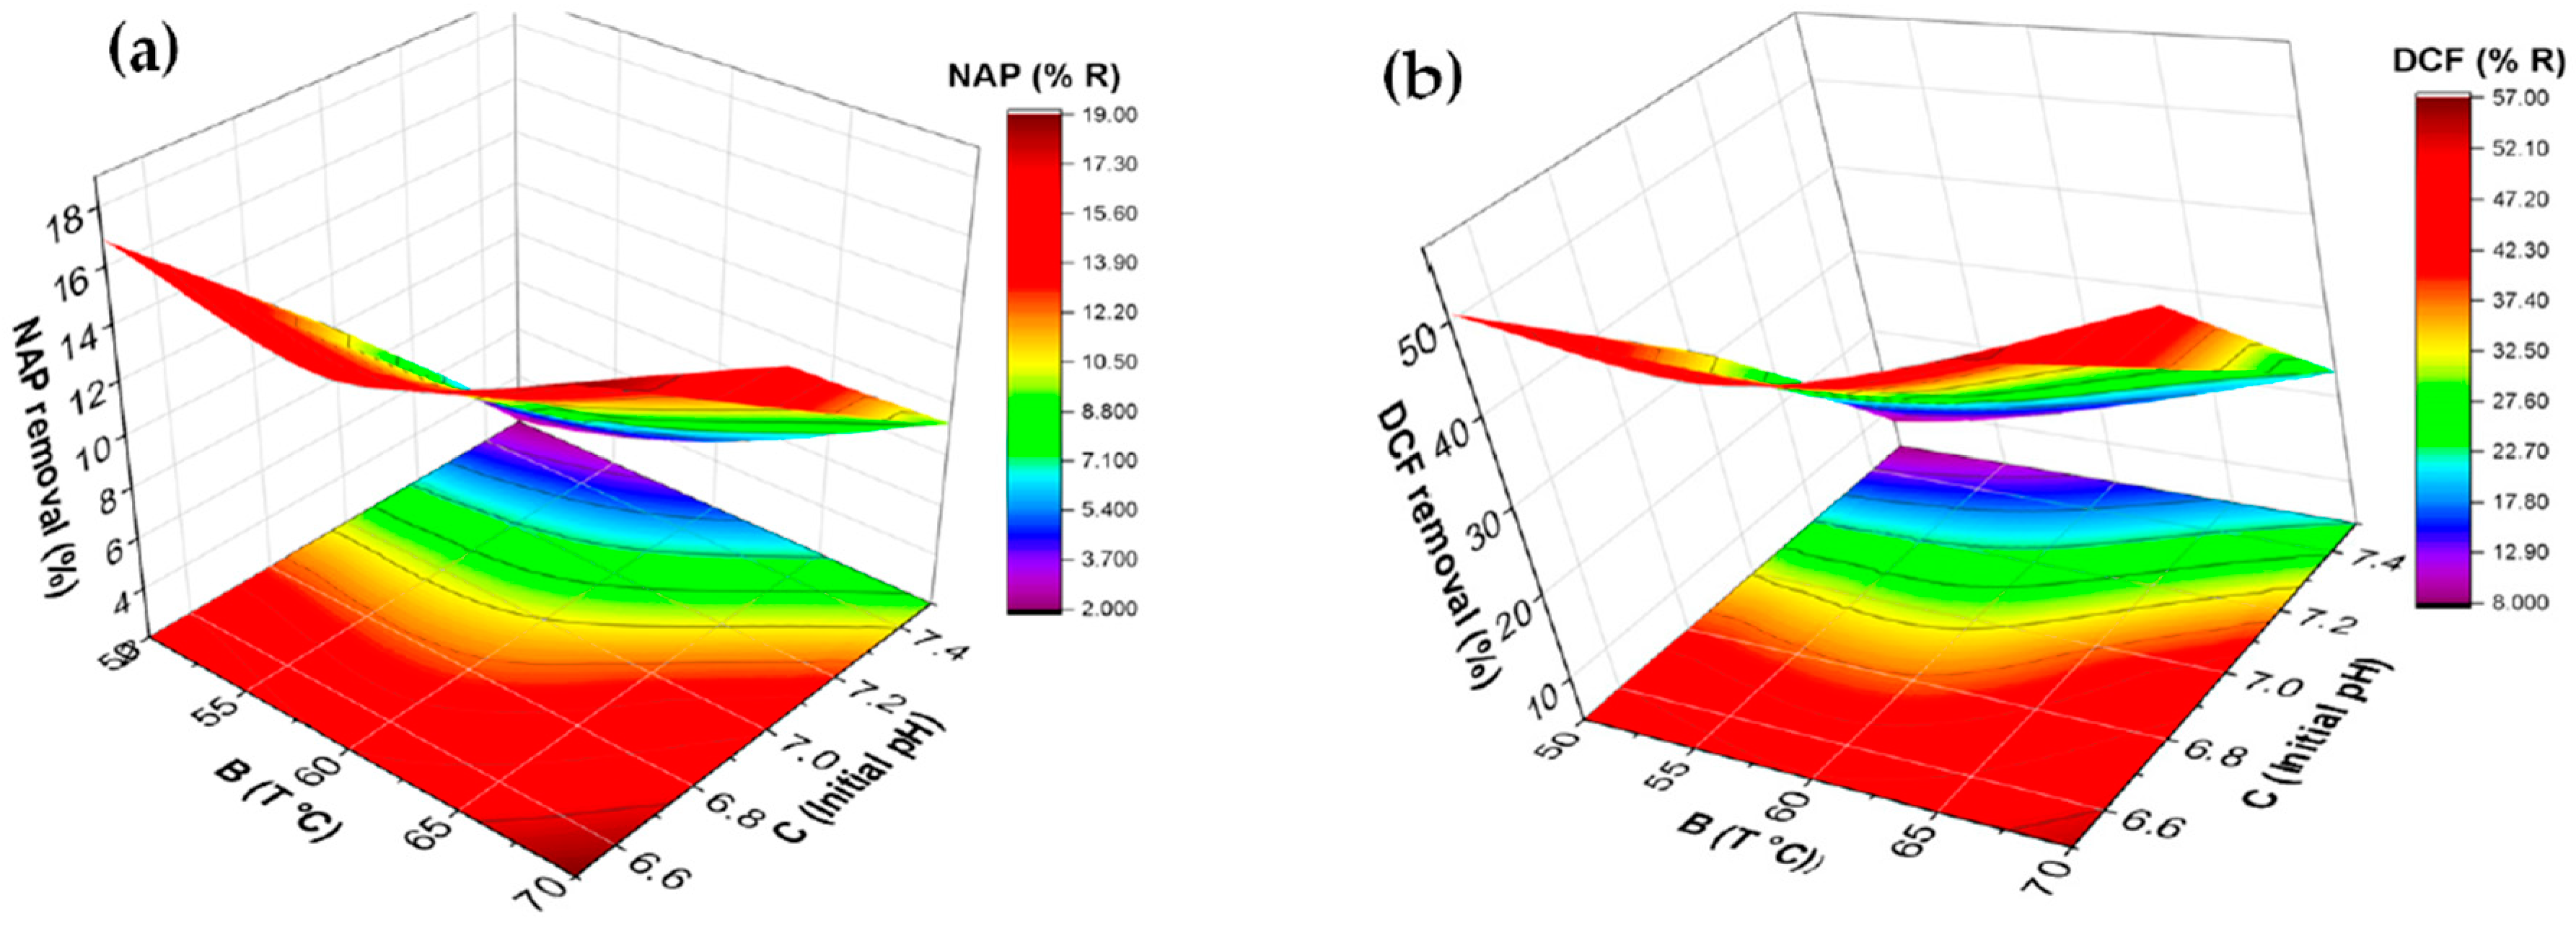
2.4.2. Effect of Temperature on pH and Synergistic Effect of NAP and DCF

The effect of the interaction between the reaction temperature (50–70 °C) and pH (6.5–7.5) on NAP–DCF removal is shown in Figure 5a,b.
As expected, the worst removal was obtained at the highest tested pH (7.5) along with the studied temperatures. However, when the pH started to decrease from 7.4 to 6.5, while the temperature was increasing, the removal of the mixture increased. The increase in the reaction temperature, to a certain extent, improved the degradation of contaminants [31]. In this particular case, temperature up to 70 °C improved the mixture removal; further, this value would lead to the decomposition of H2O2 in CWPO reaction.
On the other hand, the increase of H2O2 dose with the increase of temperature increased the NAP–DCF mixture removal (see Figure S3 in the Supplementary Material). This fact confirms that the concentration of H2O2 at non-stoichiometric concentration did not generate its own decomposition [14].
From the evaluation of these effects, the highest removal efficiencies of NAP (19.0%) and DCF (54.0%) could be determined at the optimal conditions: 1.75 mM H2O2 dosage, pH 6.5 and 70 °C.

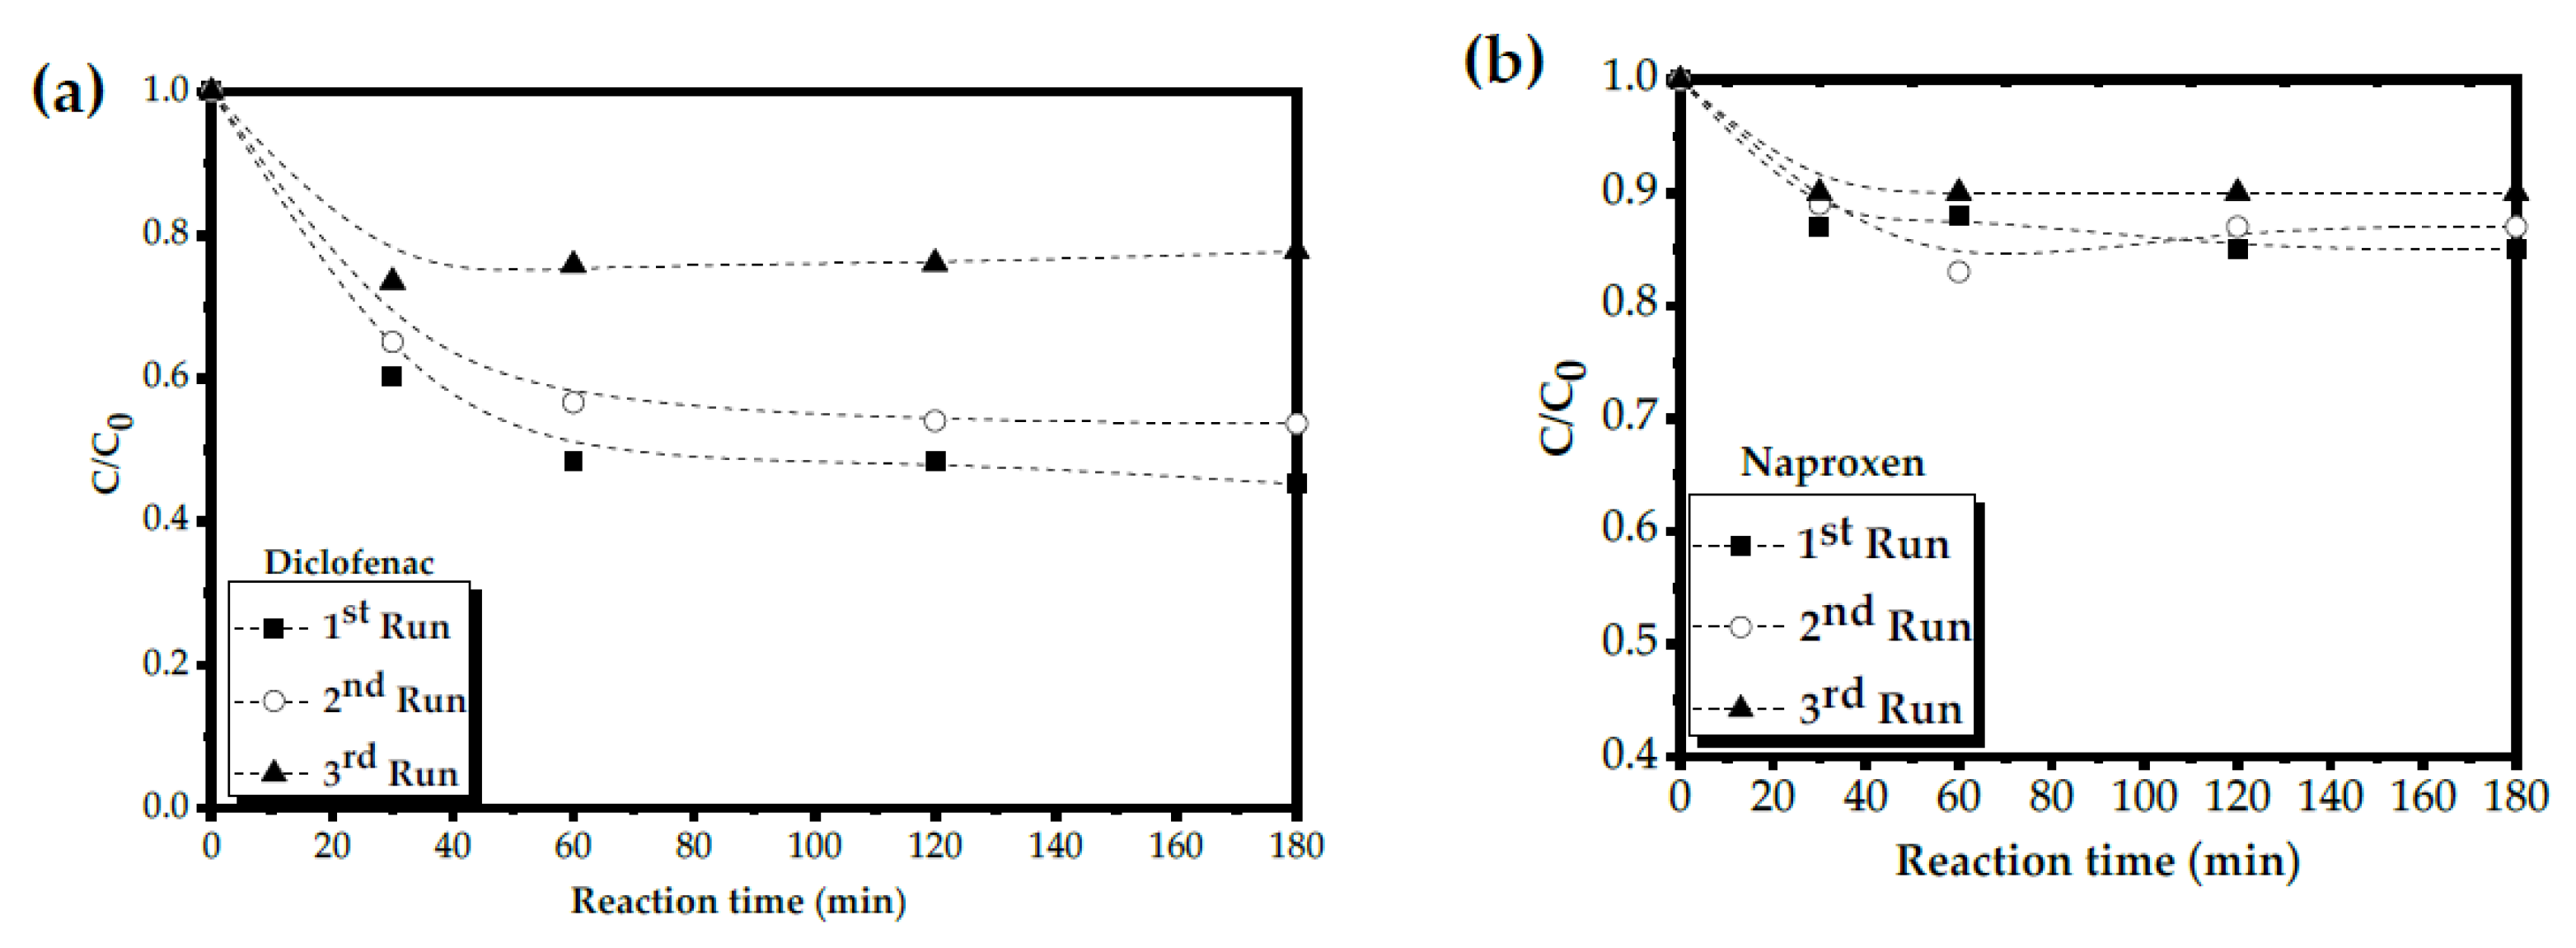
2.5. Catalyst Stability

For the heterogeneous CWPO process, evaluating the reusability and stability of the catalyst is significant for the purpose of industrial implementation because it is directly related to the treatment costs. Moreover, under real conditions, increasing the temperature to 70 °C would be more costly than increasing it to 50 °C. On the other hand, real water matrices contain different and several organic contaminants that can require additional amounts of hydrogen peroxide. In this regard, the recycling tests of the catalyst were performed at a higher H2O2 dosage (3 mM), the temperature of 50 °C, pH solution of 6.5, 1.0 g L−1 of catalyst (catalyst 4), NAP and DCF concentration of 5 mg L−1 each one, for 3 h of reaction time. The results are depicted in Figure 6a,b.
Figure 6a,b shows the evolution of NAP and DCF concentration, and Figure S4 (Supplementary Material) shows the H2O2 removal efficiencies for the degradation of the mixture along the 3 h of reaction time during 3 consecutive CWPO runs.
As can be expected, the catalyst showed different removal rates for DCF and NAP after 3 consecutive reaction cycles. In the first case, DCF showed similar removal values in the two first cycles. However, in the third cycle, DCF removal was reduced. A similar trend was observed in the CWPO cycles for NAP, although, in this case, the reduction in the removal during the third cycle was lower. Furthermore, the measured pH in the effluent of the third cycle was 7, whereas in the first and second cycles was 6.5. From these observations, it could be said that the decrease in the removal of the drugs along the cycles can be related to the pH since at pH 7, the H2O2 is decomposed, and the scavengers eliminate the •OH radicals [34]. Hence, the increase of the pH is related to the generation of bicarbonate ions, which are formed from the excess of CO2 at alkaline pH in the medium reaction [35].
To rule out leaching of iron from the catalyst, several experimental tests were carried out. Thus, the dissolved iron in the effluent of the third cycle was negligible. Other research has been reported that the possible iron leaching from the catalyst could be discarded at near alkaline pH [36].
In addition, the determination of H2O2 removal efficiencies was also performed (Figure S4 of the Supplementary Material). As shown in figure, the trends were also decreasing, indicating that the H2O2 was highly decomposed at alkaline pH [34].
In addition, H2O2 blank (3 mM H2O2), adsorption blank ([catalyst] = 1.0 g L−1), and quenching tests (using 2-propanol) were performed to quantify their contribution to the CWPO reaction of the NAP–DCF mixture. The results are depicted in Figure S5 of the Supplementary Material. The tested operating conditions were the same of the previous CWPO tests ([NAP]0 = [DCF]0 = 5.0 mg L−1, pH = 6.5 and 50 °C). In the case of quenching tests, 3 mM H2O2 and 1.0 g L−1 of catalysts were used. The results of these tests confirmed that adsorption (DCF removal of 10%) and H2O2 test had low contribution in the removal of the drugs, whereas in quenching test was observed a 40% of removal of DCF. Therefore, CWPO was the main process involved in the removal of the drugs.

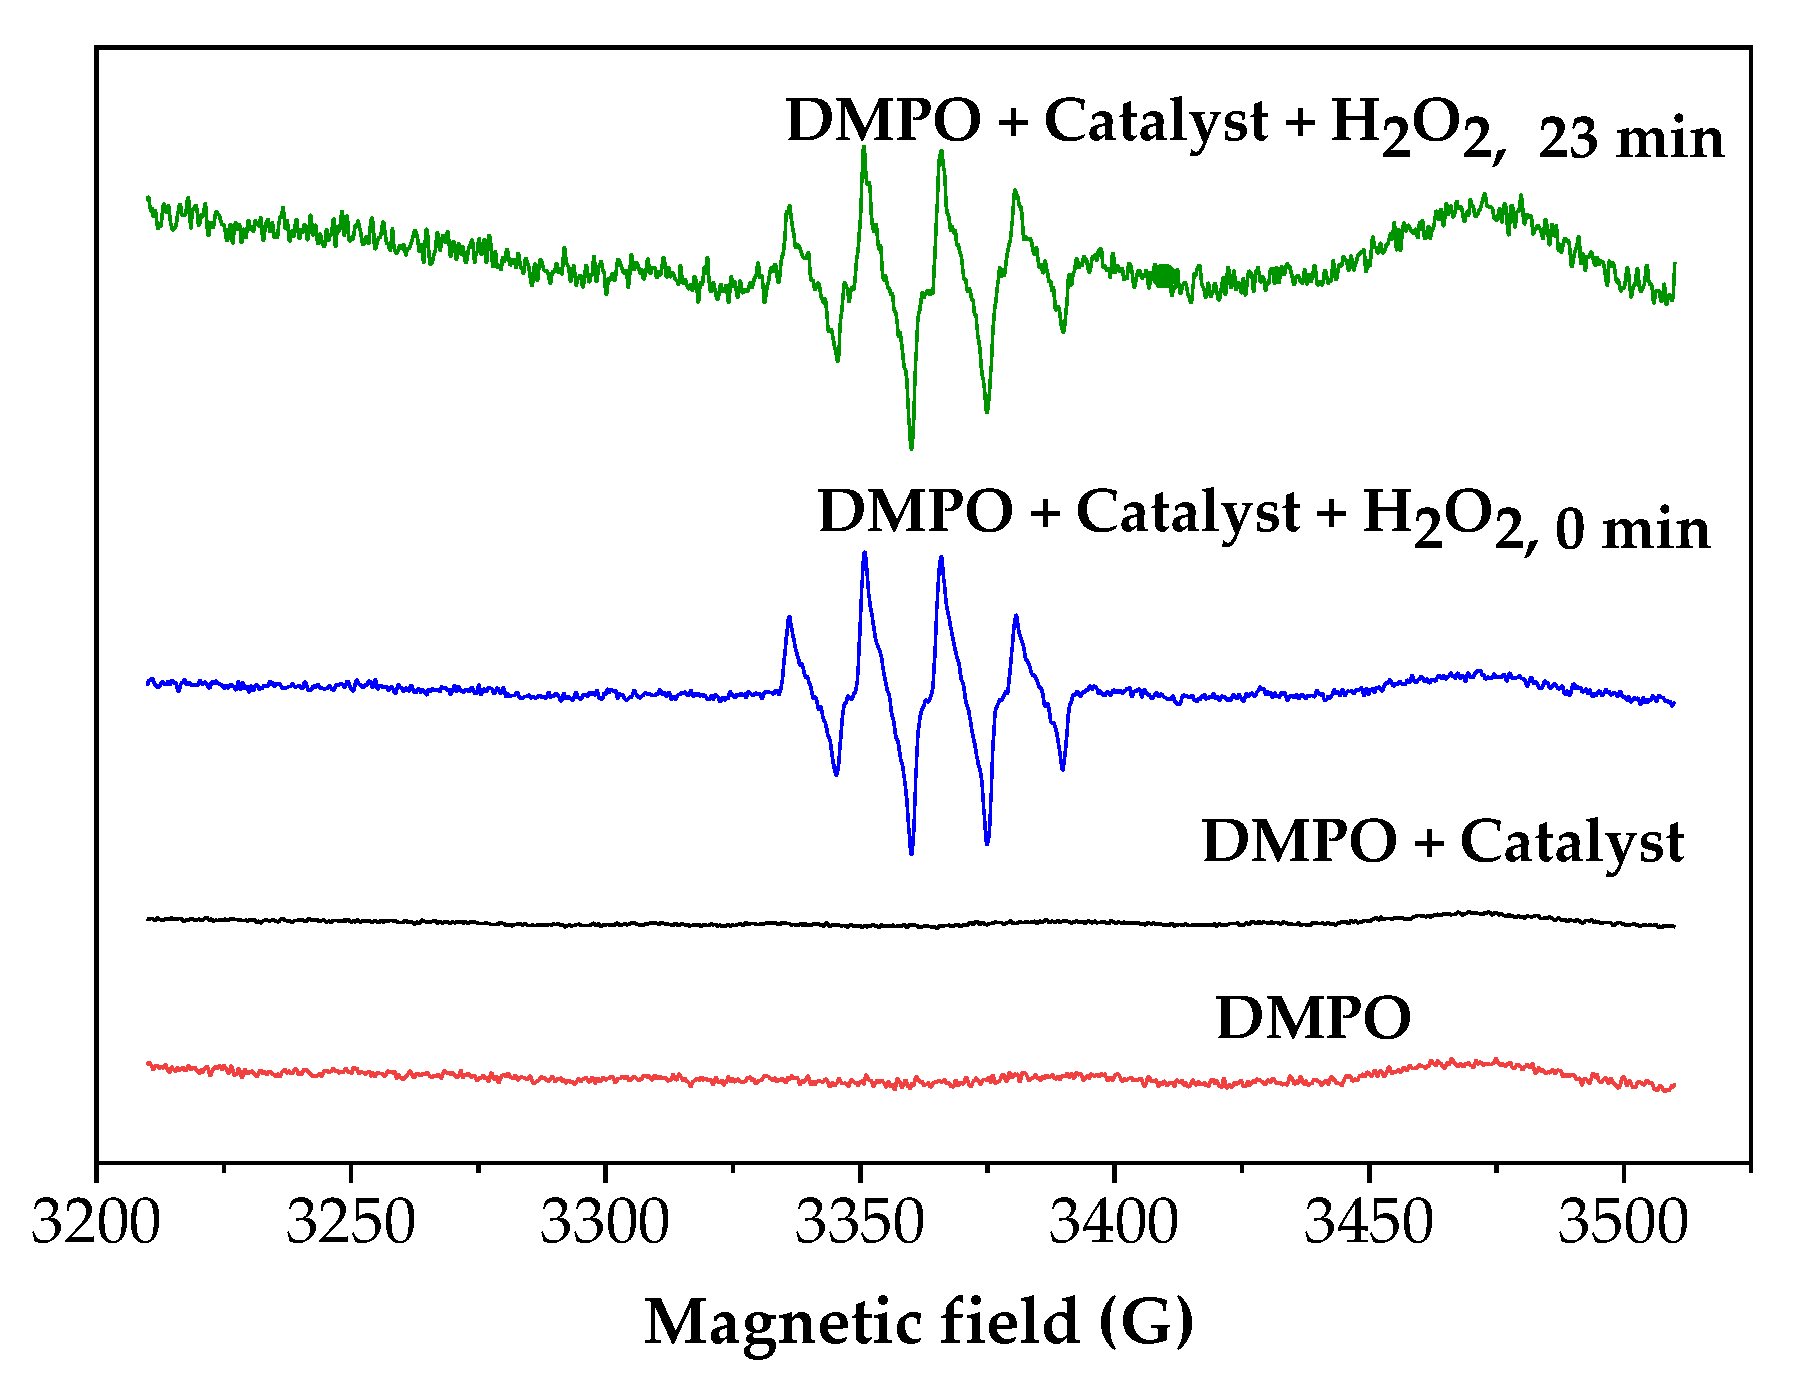
2.6. H2O2 Activation on Fe3O4/MWCNTs

EPR measurements were used to identify •OH radicals generated by Fe3O4/MWCNTs-H2O2. 5, 5-dimethyl-1pyrroline N-oxide (DMPO) was used as a spin trapping agent, to form the DMPO adduct in the Fe3O4/MWCNTs-H2O2 system and so identify the •OH radicals [37] (Figure 7). As illustrated in Figure, compared to signal intensity of DMPO only and DMPO plus catalyst, the formation of DMPO- HO signal in Fe3O4/MWCNTs-H2O2 system was observed at 0 min and 23 min, indicating that H2O2 in the presence of the catalyst was decomposed into •OH radicals. Furthermore, no other radical signals were observed, suggesting that •OH radicals were the main active species involved in the removal of NAP and DCF [38].

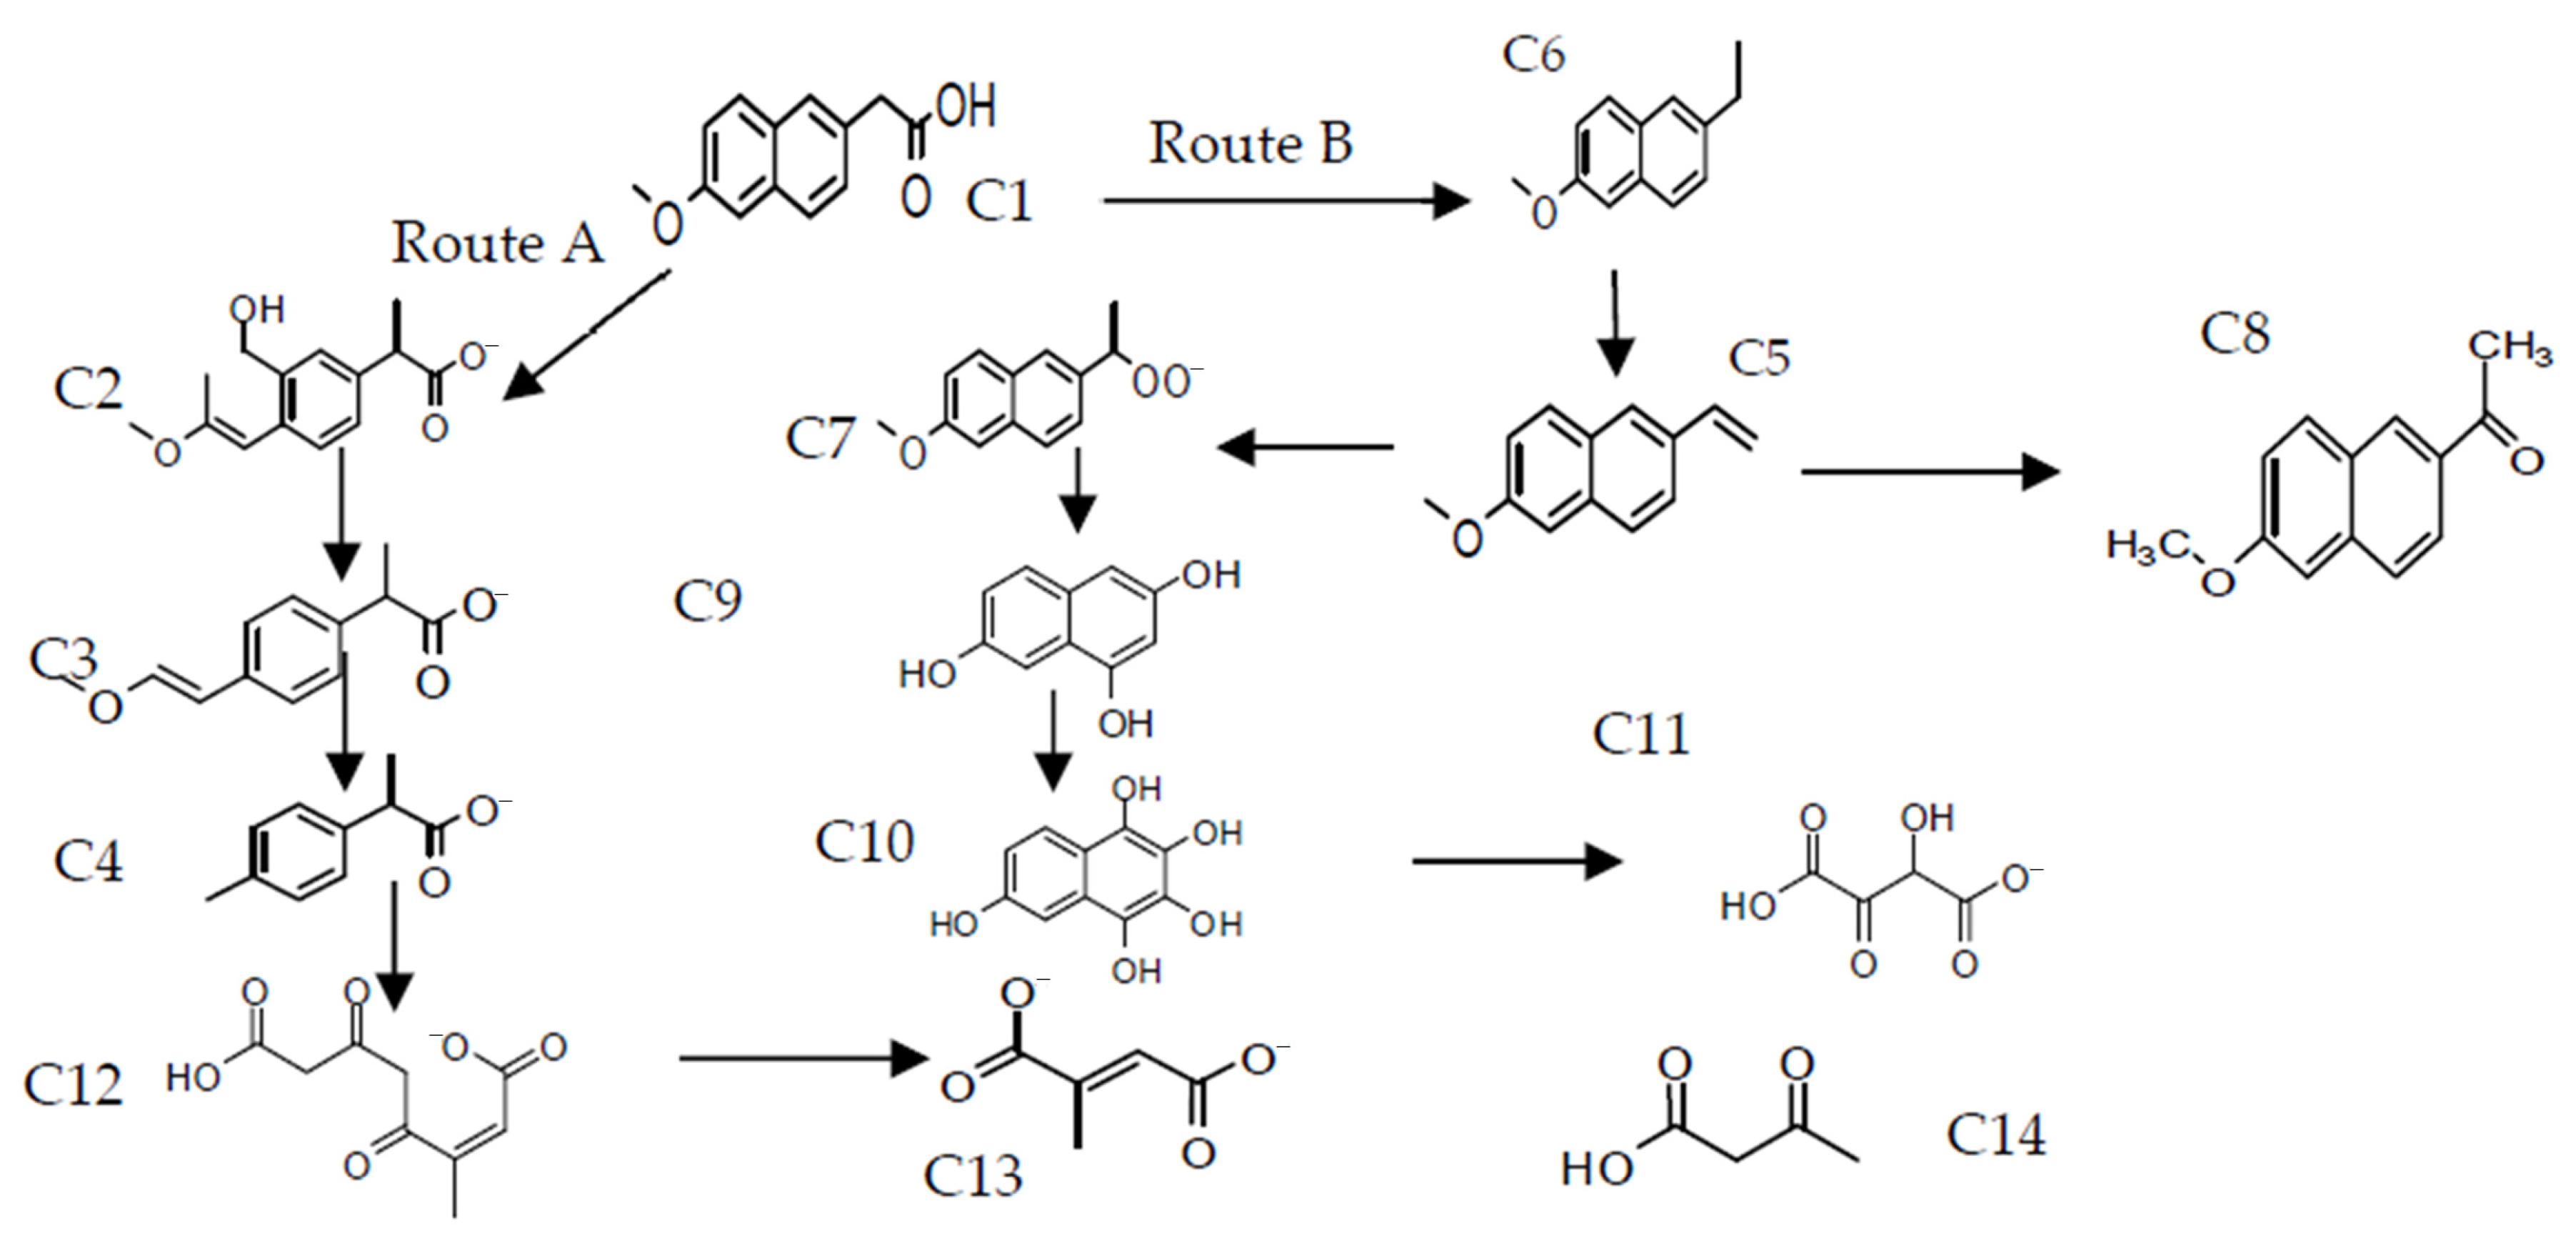
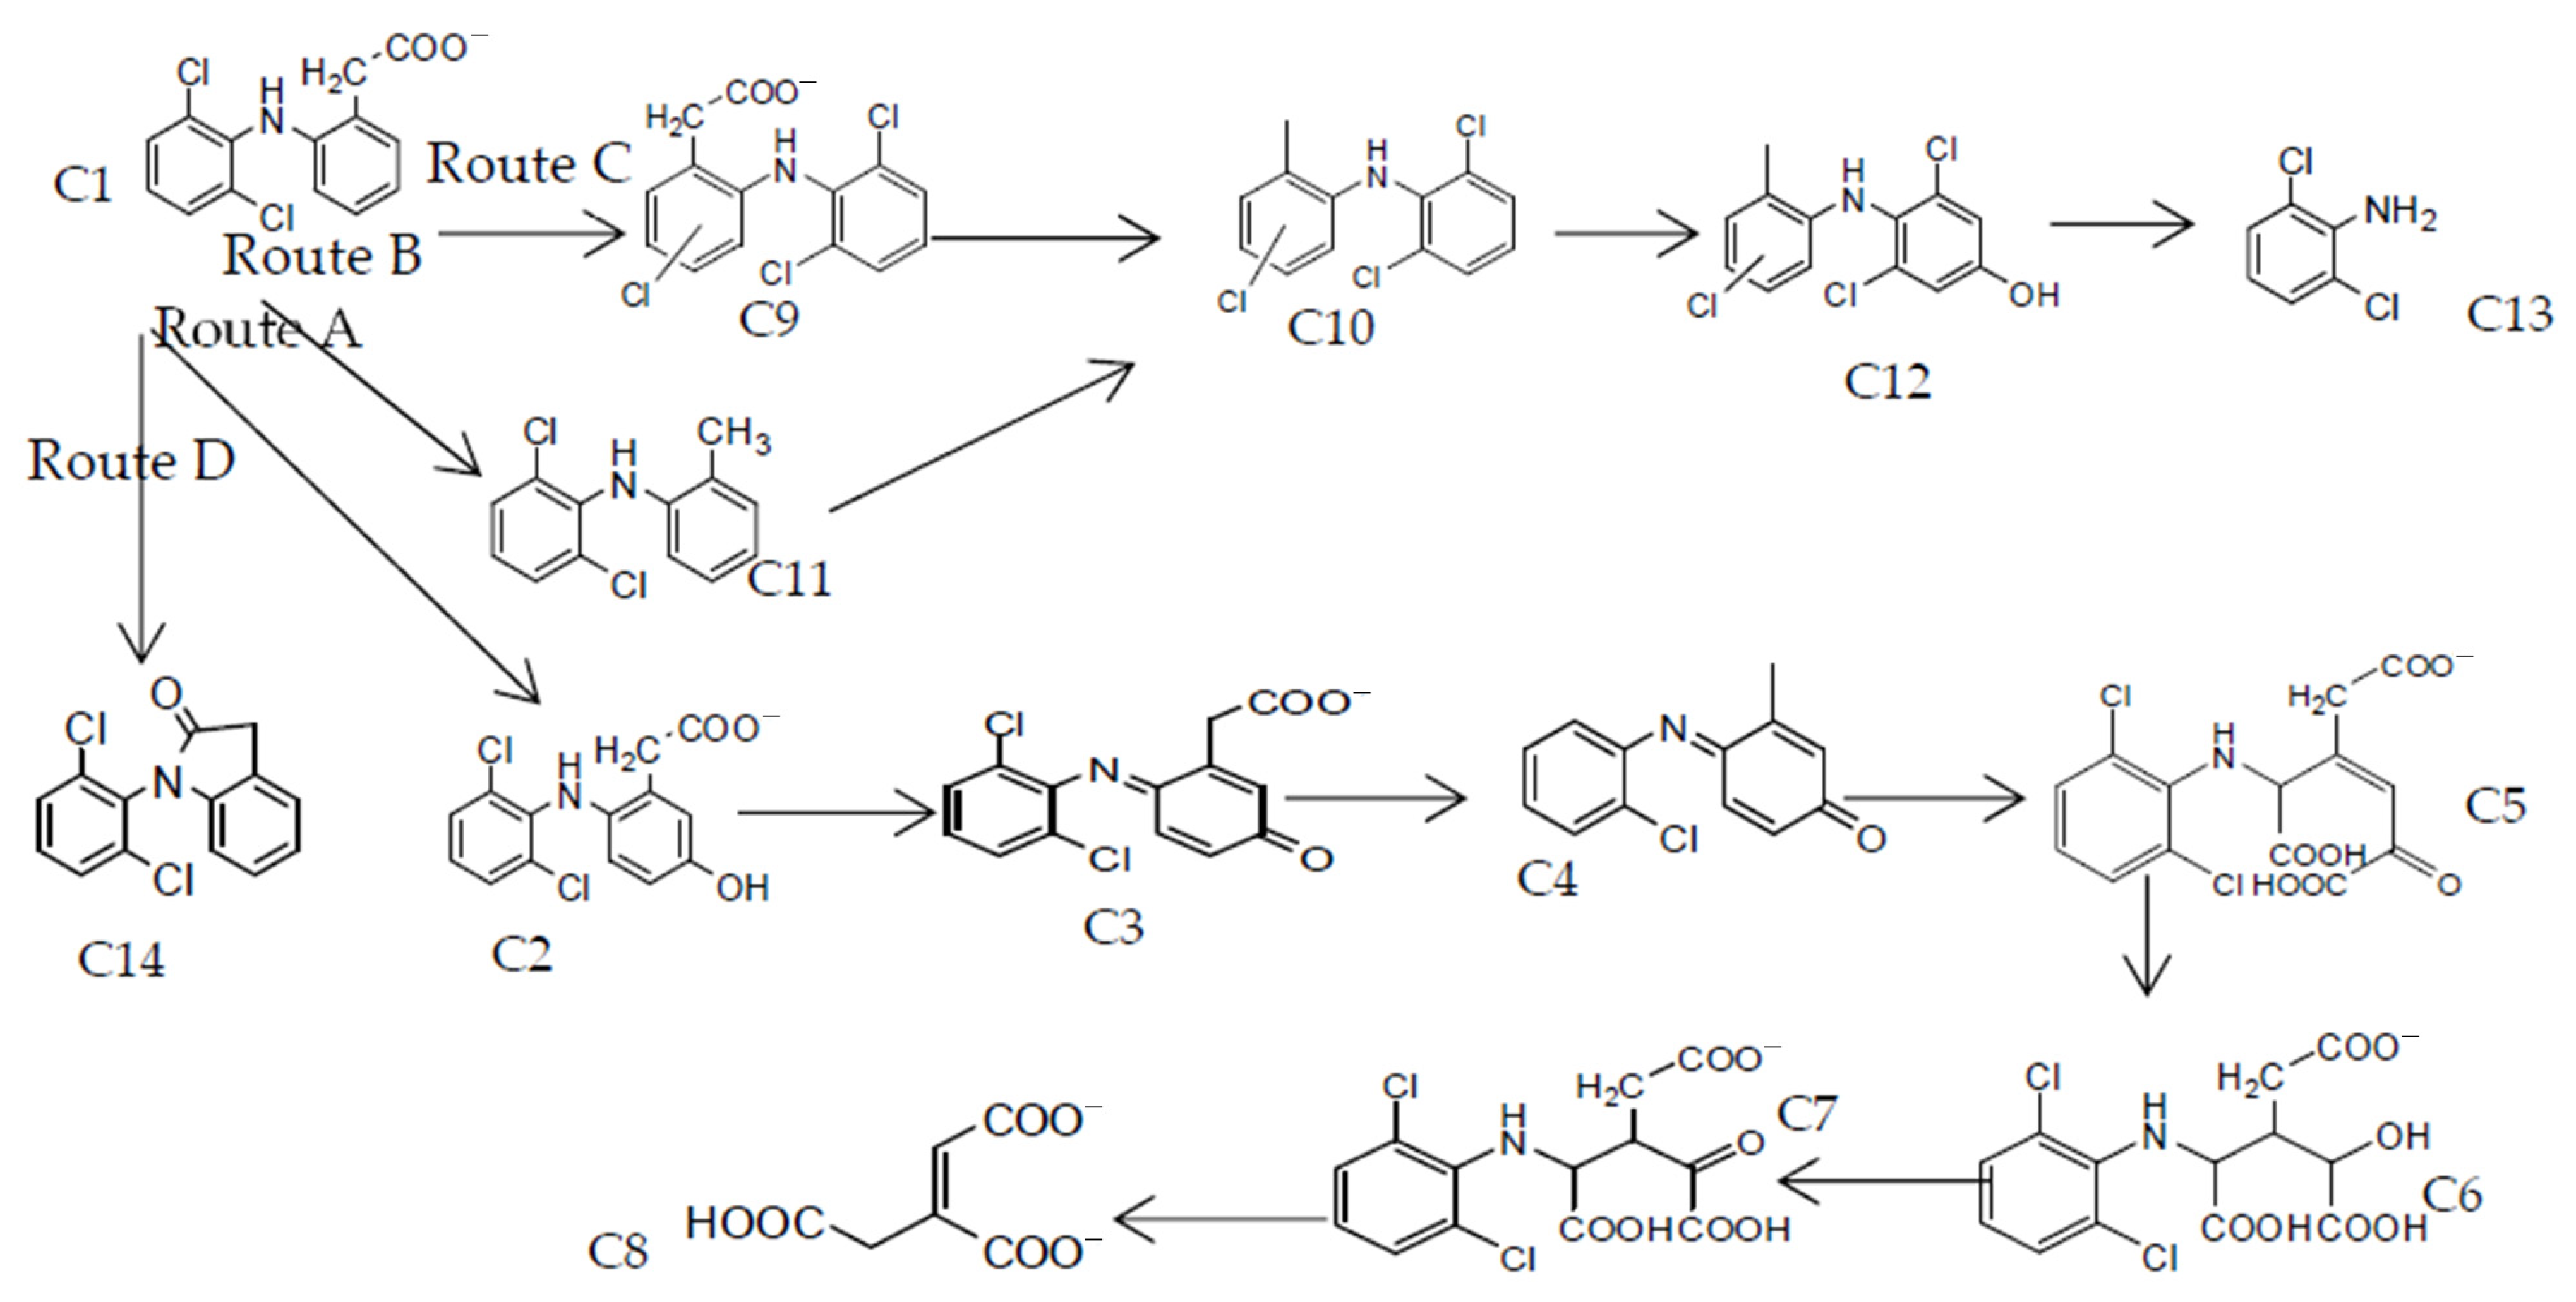
2.7. Proposed Reaction Mechanisms for the Degradation of DCF and NAP by CWPO

A sample from CWPO effluent was submitted for the extraction of the organic compounds. The sample comes from a CWPO reaction carried out at 5 mg L−1 of NAP, 5 mg L−1 of DCF, 1.0 g L−1 of catalyst 4, 3 mM of H2O2 and 50 °C. The extraction method has been previously described by Zgoła-Grześkowiak [39]. The organic compounds extracted were analyzed by (−/+)-ESI–LC–MS technique. NAP and DCF standards were also analyzed by LC–MS to contrast with the sample injected. A total of thirty peaks between NAP (14) and DCF (16) that can be attributed to intermediate compounds were identified in the treated CWPO sample after 3 h reaction time (Figure S6 and Tables S3 and S4 in the Supplementary Material). In the case of the standards, the characteristic peak of NAP (naproxen M = (C14H13O3)-; molecular weight = 230 g mol−1; tR = 19.9 min) and DCF (DCF M = (C14H10NCl2O2)-; molecular weight = 295 gmol−1; tR = 22.7 min) were identified (Figure S7a,b of the Supplementary Material).
Figure 8 depicts the possible simplified reaction mechanism of NAP degradation based on the byproducts identified by the ESI–LC–MS technique. The detected ions (−)-ESI m/z was 228.8, 204.6, 149.8, 249.8, 187, 216.7, 185, 201, 175, 207, 147 and 128.9, and they were labeled with a letter C and consecutive numbers (Table S3 of the Supplementary Material). The formation of the Cs (C1, C2, C3, C4, C8, C9, C10, C11, C12 and C13) may be due to the rapid attack of •OH radicals via hydroxylation process, which is a common reaction pathway in •OH reaction with aromatic molecules [40,41,42], with the subsequent demethoxylation (C1 and C3) [42] or decarboxylation (C5, C6, C7). In this pathway, two intermediates (C6 (m/z 184.9) and C7 (m/z 216.7)) had higher intensity.
In route A, occurred the •OH attack in only one aromatic ring, opening it in the left and forming C2 (m/z 249.8). Consequently, the broken ring, C2, experiments the •OH attack with the subsequent decarboxylation, leading to the formation of C3 (m/z 204.6) [42]. Sequentially, demethoxylation of C3 by •OH attack and later decarboxylation leads to the production of C4 (m/z 149.8). The generation of C12 (m/z 213) comes from the first decarboxylation of C4, and then this reacts with •OH, causing the opening ring [42]. The cleavage of m/z 213 by •OH attack leads to the formation of C13 (m/z 128.9) and C14 (m/z 101) byproducts.
In route B, NAP is converted to the corresponding carboxyl radical by •OH and the subsequent decarboxylation yields C5 (m/z 186.8). Thus, the presence of C5 has been reported by Kanakaraju et al. (2015). The abstraction of hydrogen of C5 yields C6 (m/z 184.9), and the •OH attack on the vinyl group of C6 resulted in the formation of C7 (m/z 217) and C8 (m/z 200.9) (2-acetyl-6-methoxynaphthalene) [41,43]. Sequentially, the demethoxylation of C7 (1-(6-methoxynaphthalen-2-yl) ethylhydroperoxide) by the attack of •OH and subsequent decarboxylation yields C9 (m/z 175) (naphthalene-1, 3, 7-triol), C10 (m/z 207) (naphthalene-1,2,3,4,6-pentaol) [17] and C11 (m/z 147) (2-oxo-3-hydroxyldicarboxyl-dioic acid). These intermediates were also reported in the literature as the most common NAP degradation byproducts by •OH -based oxidation processes [17,40,41].
Regarding the DCF byproducts from the treated CWPO sample, the proposed structures of intermediates after 3 h reaction time at the specified operating conditions are listed in Table S4 (Supplementary Material). In contrast to other advanced oxidation technologies, the number of found intermediate compounds was considerably lower [44]. Based on the intermediates identified by ESI–LC–MS, a reaction pathway for the degradation of DCF by CWPO was proposed (Figure 9).
Route A, C2 (5-hydroxy-diclofenac) indicates hydroxylation as one of the first steps [45]. Then, C3 (diclofenac-2, 5-iminoquinone) is formed from C2 (5-hydroxy-diclofenac) by •OH attack and abstraction of H• [46]. Subsequent decarboxylation on C3 (diclofenac-2, 5-iminoquinone) produces C4 (m/z 229.8) by •OH attack. The cleavage of C4 caused by •OH leads to form C5 (m/z 375), and then the decarboxylation of C5 generates C6 (m/z 364). Subsequently, the hydrogen abstraction from C6 leads to the formation of C7 (m/z 362). After several •OH attacks of C7, C8 (m/z 175) is generated.
Degradation route B is started with the decarboxylation by the attack of •OH at the aromatic ring. Degradation route C is beginning with the chlorination of C1 on one aromatic ring leading to the formation of C9 (m/z 329.1). Subsequently, decarboxylation on C9 forms C10 (m/z 284). Then hydroxylation occurs on C10 leading to the formation of C12 (m/z 299.1). Next, C12 (m/z 299.1) is attacked for •OH in the NH bridge. In this reaction C16 (2-oxo-3-(1-carboxymethyl) pentanedioic acid (m/z 201)) is formed primarily and C13 (2, 6-dichloroaniline (m/z 160.8)). Pathway D showed the dehydration of DCF leading to the formation of C14 (m/z 277).

2.8. Catalytic Wet Peroxide Oxidation Treatment of Different Real Water Matrices

To test the feasibility of CWPO for wastewater treatment, three CWPO experiments were carried out to treat three real environmentally relevant aqueous matrices. Specifically, surface water (SW), wastewater treatment plant (WWTP) effluent and hospital wastewater (HW) spiked with the NAP–DCF mixture were treated by CWPO. Before the treatment, the aqueous matrices were characterized, and the results are summarized in Table S5 (Supplementary Material). The initial reaction conditions were 3 mM H2O2 dosage, 1 g L−1 of catalyst 4, and 50 °C. The results of the treatments are depicted in Figure 10a.
As can be expected, CWPO treatment was able to remove total organic carbon (TOC) from real aqueous matrices (i.e., 50 and 40% of TOC removal for SW and WWTP effluent, respectively) (Figure 10a). However, TOC removal found for HW spiked with NAP–DCF was the lowest (11%). These results agree with the obtained H2O2 removal efficiencies, which are shown in Figure 10b. The highest consumption values of H2O2 in the CWPO were found for SW and WWTP effluent, directly related to the efficient TOC removal from these aqueous matrices.

Effluent Disinfection by CWPO

All real water matrices were tested for the presence and enumeration of total aerobic mesophilic, total coliforms, Escherichia coli, Enterococcus spp., Pseudomonas aeruginosa, Clostridium perfringens, and molds and yeasts according to International Standards Organization (ISO) techniques. The results are summarized in Table S6 of the Supplementary Material.
At first, the three raw aqueous matrices (entries 1, 2 and 3) presented Clostridium perfringens and aerobic mesophilic bacteria. Since the real matrices are heterogeneous, distinct microorganisms can be found in each matrix [47]. Therefore, the matrices spiked with NAP–DCF mixture (entries 5, 6 and 7) presented those microorganisms as well. The matrices were treated by CWPO for a 3 h reaction time, but the microorganisms persisted (entries 8, 9 and 10). However, after 8 h of CWPO treatment, they were removed from the real aqueous matrices (entries 12 and 13), excepting the SW–NAP–DCF effluent (entry 11). It is important to highlight that the increase of molds and yeasts in CWPO effluent of SW could be due to the generation of derived reactions, which could be the necessary nutrients for this bacteria growth [48]. In this sense, the organic compounds generated in CWPO processes could be used as nutrients for microorganisms. In the same way, the appearance of the microorganisms in CWPO effluent of SW–NAP–DCF after 8 h could also be due to the derived compounds generated in the CWPO reaction.
On the other hand, CWPO treatment was also able to remove Enterococcus spp. from HW (entry 10), and Enterococcus spp. and total coliforms from HW–NAP–DCF (entry 13). In previous research has been reported that CWPO was able to remove those kinds of bacteria [49]. Therefore, CWPO is an alternative technology to eliminate pathogenic bacteria that could be resistant to antibiotics from some water matrices, such as HW and WWTP effluent [47]. Furthermore, CWPO was able to eliminate the toxicity since the growth of some microorganisms in the SW matrix was promoted.

3. Materials and Methods

3.1. Materials

MWCNTs (diameter of 30–50 nm; length of 20 mm) were supplied by Sun Nanotech Co. Ltd. in Beijing, China. FeCl3·6H2O, FeCl2·4H2O, ammonia solution 25%, TiOSO4 and H2O2 30% (w/w) were purchased from Sigma-Aldrich (Overijse, Belgium). NAP and DCF as sodium salts with a purity of more than 98% were purchased from Sigma-Aldrich. All the solutions used in the experiments were prepared in ultrapure water (ELGA, Veolia Water, UK). Furthermore, a mini magnetic stirrer with a plastic cover for magnetic stirring and an Aitsite magnet NFD 60 for separation of the solid from the reaction medium was required.

3.2. Synthesis of the Catalyst

3.2.1. Functionalization of MWCNTs and Preparation of the Catalyst (Fe3O4/MWCNTs)

The oxidative treatment of MWCNTs and preparation of the catalysts were carried out following the procedures reported by Yu et al. [20], with some modifications. Briefly, the commercial MWCNTs were oxidized with H2O2 solution (18% w/w) at 80 °C for 4 h. Afterward, they were washed until neutral pH and then dried in an oven at 100 °C for 10 h. The pretreated MWCNTs obtained were labeled as functionalized MWCNTs (FMWCNTs). Then, the magnetic catalyst was prepared using different amounts of iron and FMWCNTs. Table 5 shows the amounts used in the preparation of the different catalysts. Thus, the FMWCNTs were dissolved in 120 mL of ultrapure water by vigorously stirring under the purge of nitrogen gas at 60 °C. Then, FeCl3·6H2O and FeCl2·4H2O were added, and immediately after, 0.5 mL of NH4OH was added. The suspension was stirring for 30 min under nitrogen gas, and the Fe3O4/MWCNTs colloidal solution was formed. The obtained colloidal solution was transferred and sealed into a Teflon-lined autoclave reactor and then kept at 120 °C for 15 h. After, the precipitate was separated from the aqueous medium by a magnet and then washed with ultrapure water until the washing water reached a pH value of 6.5. Subsequently, they were dried in a vacuum oven at 60 °C for 24 h. Finally, the solid materials were labeled with their corresponding number (Table 5).

3.2.2. Support and Catalyst Characterization

A transmission electron microscope (TEM, JEOL 3000F) was used for studying the morphology of the catalyst and the distribution of the magnetic nanoparticles on the MWCNTs. The thermogravimetric analyses (TGA) were carried out in a thermal analyzer TGA Q500 (STA 6000, PerkinElmer, Inc., Waltham, MA, USA) under airflow, following a heating rate of 10 °C min−1 from 30 to 1000 °C. Thermo Nicolet F-TIR spectrophotometer, in a wavelength range from 400 to 4000 cm−1, was used to record the Fourier-transform infrared spectra of the samples. The textural properties of the materials were studied by N2 adsorption–desorption isotherms at 77 K obtained in an ASAP 2020 apparatus, with the samples outgassed for 3 h at 250 °C before the measurement. The specific surface area of the solids (SBET) was calculated using the Brunauer–Emmett–Teller (BET) equation, and the micropore volume (VMic) was estimated by using Dubinin–Radushkevich equation. The elemental microanalysis was accomplished in a LECO CHNS-932 analyzer, where 0.6–1.6 mg of sample was held in a combustion furnace at 1000 °C. An MPMS-5S superconducting quantum interference device (SQUID, San Diego, CA, USA) was used for determining the magnetic properties of the catalyst. Thus, the total iron content of the samples was measured using wavelength dispersive X-ray fluorescence analysis (WDXRF). The measurements with the WDXRF technique were performed using an Aχios spectrometer (PANalytical) equipped with an Rh anode X-ray tube with a maximum power of 4 kW. For the identification of the •OH radicals, continuous-wave (CW) electron paramagnetic resonance (EPR) spectra of the samples were recorded at 333 K with an X-band EMX spectrometer (Bruker, Germany). The spectrometer settings for all spectra were as follows: center field, 3360 G; microwave power, 1 mW; microwave frequency, 9.46 GHz; sweep width, 300 G; modulation amplitude, 10.25 G; time constant, 10.24 ms; sweep time, 41.943 s; accumulation, 2 scans.

3.3. Catalytic Wet Peroxide Oxidation Tests

A typical batch CWPO experiment was carried out in a three-neck round-bottomed flask using magnetic stirring, where 130 mL of NAP–DCF mixture solution (5 mg L−1 each one) was added. The reactor had a reflux condenser and was maintained at a constant temperature using a thermostatic bath. pH was adjusted to the desired value (using 1 M sulfuric acid solution) after the solution reached the required temperature; then 0.13 g of catalyst and immediately after the desired hydrogen peroxide dose were added, being this time considered as zero for the catalytic reaction. Samples were collected at regular time intervals and immediately filtered through a 0.45 µm PTFE filter.
Reuse tests were performed in the same way after the recovery of the catalyst at a 3 h reaction time. The catalyst was separated from the reaction medium by the action of a magnet, and the treated effluent was filtered. The catalyst was washed several times with ultrapure water and dried before being used in the next reaction cycle.

3.4. Statistical Analysis through Response Surface Methodology: Box–Behnken Design

In this work, the effect of the operating parameters on the catalytic degradation of the NAP–DCF mixture was investigated. The statistical design was carried out testing three factors: temperature, initial pH and H2O2 dose, as operation parameters to determine the optimum removal of the mixture. In sequence to give a new response surface, the catalyst concentration in a NAP–DCF mixture solution (C0 = 5 mg L−1 each one) was maintained constant at 1.0 g L−1. This concentration was taken as a reference from some previous research on CWPO [10].
For this evaluation, Box–Behnken design (BBD), a response surface methodology (RSM), was applied [32]. They used coded levels of BBD are shown in Table 6. In this study, only 15 experiments were needed, including four replicates (see Table 3).
The data were analyzed by RSM, and the commercial software used was Minitab [50]. Multiple linear regression analysis for the experimental data followed by F-test lack of fit and other tests were performed to select the best correlation.
The analysis of the RSM by Minitab provided a quadratic polynomial, Equation (9), which fitted the experimental data [50]:
γ = β 0 + i = 1 j β i x i + i = 2 k β i i x i 2 + i i < j j β i j x i x j
where γ is the removal of NAP or DCF (%), β0 is a fixed coefficient, βi, βii and βij are the coefficients for the linear, quadratic and interaction effects, and Xi and Xj are the coded values of the independent input variables.

3.5. Analytical Methods

NAP and DCF concentration was analyzed by high-performance liquid chromatography, HPLC-UV (Varian ProStar, Bruker, Billerica, MA, USA), using a PerkinElmer column (250 × 4.6 mm2 i.d., 5 µm) as stationary phase. The analyses were performed at 274 nm, using a 50/50% (v/v) ratio of acetonitrile/acidified water solution (0.1% H3PO4) as mobile phase (0.5 mL min−1) and a loop volume of 20 µL.
H2O2 concentration was measured at a wavelength of 410 nm using a UV-vis spectrophotometer (Lambda 35, PerkinElmer, Inc., Waltham, MA, USA) after adding titanium (IV) oxysulfate solution to the sample.
The real water aqueous matrices were characterized by the measurement of the total organic carbon (TOC) and the total nitrogen (TN) concentrations using a TOC analyzer (Shimadzu TOC VSCH, Kyoto, Japan), and the chemical oxygen demand (COD), conductivity, suspended solids concentration, aromaticity, phenolic compounds and nitrate (NO3−) ions concentration were measured according to standard methods for the examination of wastewater [51].
Intermediate byproducts generated in the CWPO process were identified by liquid chromatography (LC) after being extracted by a dispersive liquid–liquid microextraction procedure [39]. The LC (1100, Agilent Technologies, Palo Alto, CA, USA) was coupled to a Bruker HCT-Ultra PTM 14 Discovery ion trap mass spectrometer (Bruker Daltonik, Bremen, Germany). The ESI ion source was operated in negative ion mode for all the analyses. The DCF and NAP standards were also injected in LC chromatograph.

3.6. Microbiological Analysis

All water samples were tested for the presence and enumeration of total aerobic mesophilic, total coliforms, Escherichia coli, Enterococcus spp., Pseudomonas aeruginosa, Clostridium perfringens, and molds and yeasts according to International Standards Organization (ISO) techniques.
To determine total coliforms, E. coli, C. perfringens, Enterococcus spp. and P. aeruginosa, effluents were filtered through nitrocellulose membranes (0.45 µm pore size, 47 mm diameter, Merck, Darmstadt, Germany) followed by plating on selective media. A volume of 10 mL of each sample was filtered through the membrane filter for the determination and enumeration of E. coli, total coliforms, Enterococcus spp., C. perfringens and P. aeruginosa.
Regarding the total coliforms and E. coli, membranes were plated on Chromocult® (Merck, Germany), followed by incubation at 37 °C for 48 h. Enterococcus spp. were isolated by plating the membranes on Slanetz and Bartley medium (OXOID, Altrincham, UK) and subsequently incubated at 37 °C for 48 h. For C. perfringens, membranes were transferred on tryptose–sulfite–cycloserine agar (Merck, Germany), and plates were incubated at 37 °C for 24 h. To detect P. aeruginosa, membranes were plated onto Pseudomonas agar base (OXOID, UK) with cetrimide and were incubated at 37 °C for 48 h.
For the enumeration of total mesophilic aerobic respiration, the pour plate count method was selected, using 10 mL of each water sample taken aseptically and homogenized with 90 mL of peptone water (Merck, Germany). Afterward, 1 mL of a sample of appropriate dilutions were poured or spread onto plate count agar (OXOID, UK) plates, which were incubated at 30 °C for 72 h. Yeast and molds were determined by count in YGC agar (Merck, Germany), which were incubated at 25 °C for 6 days. All colonies were counted as colony forming units (CFU) per milliliter of the water sample. Three sets of plates were prepared for all samples.

4. Conclusions

NAP–DCF mixture in aqueous solution was efficiently treated by catalytic wet peroxide oxidation (CWPO) in a batch reactor using synthesized magnetite supported on multiwalled carbon nanotubes (Fe3O4/MWCNTs) catalyst. RSM–BBD methodology was successfully applied to evaluate the effect of operating parameters on CWPO of NAP–DCF mixture. The main effect on CWPO came from the initial pH solution; thus, low pH values (6.5) favored the NAP–DCF removal, whereas high values led to an extremely decreasing mixture removal. Furthermore, high temperature also contributed to the increase of the removal of the drugs. The highest removal of NAP (19%) and DCF (54%) were obtained at 1.75 mM H2O2 dosage, pH 6.5 and 70 °C. Higher removal of the drugs was not observed since pH up to 6.3, since at these conditions, the scavenging of the hydroxyl radicals was favored. On the other side, the alkaline pH may favor the removal of DCF over the removal of NAP since the first has two opposite rings in the molecule and the second two benzene rings joined together. Regarding the stability of the catalyst, it showed good drug removal results during the two first cycles (>45% for NAP and 20% for DCF). Therefore, the CWPO efficiency in the third cycle decreased due to the increase in the pH solution (7.5). Finally, pathogenic bacteria were efficiently removed from three environmentally relevant aqueous matrices spiked with a NAP–DCF mixture treated by CWPO. This work shows the successful application of the CWPO process using Fe3O4/MWCNTs for the removal of the drug mixture in synthetic and real wastewater effluents.

Supplementary Materials

The following are available online at https://0-www-mdpi-com.brum.beds.ac.uk/article/10.3390/catal11040514/s1, Figure S1: Hydrogen peroxide efficiencies on (a) NAP and (b) DCF degradation using the different catalyst; Figure S2: Linear correlation between the experimental and the predicted values of (a) NAP and (b) DCF removal efficiency; Figure S3: Combined effect of temperature and H2O2 on the removal of (a) NAP and (b) DCF.; Figure S4: Hydrogen peroxide efficiencies on NAP and DCF degradation at optimal conditions, Figure S5: Adsorption blank with the catalyst 4, H2O2 blank and quenching test of CWPO for (a) NAP and (b) DCF, Figure S6: Intermediaries’ peaks between NAP (12) and DCF (16) identified in the treated CWPO sample, Figure S7: Characteristic peaks of the (a) NAP and (b) DCF Standards, Table S1: p-test significance of model terms in the NAP quadratic polynomial model, Table S2: p-test significance of model terms in DCF quadratic polynomial model, Table S3: Possible intermediates of NAP decomposition in catalytic wet peroxide oxidation with Fe3O4/MWCNTs, Table S4: Possible intermediates of DCF degradation in catalytic wet peroxide oxidation with Fe3O4/MWCNTs, Table S5: Representative analysis of the three real aqueous matrices, Table S6: Microbiological counts of the three real aqueous matrices and their CWPO effluents.

Author Contributions

Conceptualization, S.Á.-T., Y.H.-A.; methodology, S.Á.-T., Y.H.-A.; formal analysis, Y.H.-A., S.Á.-T., J.D.-A., J.M.-N.; writing—original draft preparation, Y.H.-A., S.Á.-T.; writing—review and editing, Y.H.-A., S.Á.-T., J.D.-A., M.V.G., G.O., J.G.; supervision, S.Á.-T., G.O., J.G.; funding acquisition, J.G. All authors have read and agreed to the published version of the manuscript.

Funding

This research was funded by Madrid Comunity, grant number P2018/EMT-4341.

Acknowledgments

This research was funded by the Regional Government of Madrid provided through REMTAVARES Network P2018/EMT-4341 and the European Social Fund. Ysabel Huaccallo thanks to the National Program of Scholarship (PRONABEC) in Peru.

Conflicts of Interest

The authors declare no conflict of interest.

References

  1. Ebele, A.J.; Abdallah, M.A.-E.; Harrad, S. Pharmaceuticals and personal care products (PPCPs) in the freshwater aquatic environment. Emerg. Contam. 2017, 3, 1–16. [Google Scholar] [CrossRef]
  2. Serna-Galvis, E.A.; Silva-Agredo, J.; Botero-Coy, A.M.; Moncayo-Lasso, A.; Hernández, F.; Torres-Palma, R.A. Effective elimination of fifteen relevant pharmaceuticals in hospital wastewater from Colombia by combination of a biological system with a sonochemical process. Sci. Total Environ. 2019, 670, 623–632. [Google Scholar] [CrossRef] [PubMed]
  3. White, D.; Lapworth, D.J.; Civil, W.; Williams, P. Tracking changes in the occurrence and source of pharmaceuticals within the River Thames, UK; from source to sea. Environ. Pollut. 2019, 249, 257–266. [Google Scholar] [CrossRef]
  4. Poirier-Larabie, S.; Segura, P.; Gagnon, C. Degradation of the pharmaceuticals diclofenac and sulfamethoxazole and their transformation products under controlled environmental conditions. Sci. Total Environ. 2016, 557–558, 257–267. [Google Scholar] [CrossRef] [PubMed]
  5. Ashfaq, M.; Noor, N.; Saif-Ur-Rehman, M.; Sun, Q.; Mustafa, G.; Nazar, M.F.; Yu, C.-P. Determination of commonly used pharmaceuticals in hospital waste of pakistan and evaluation of their ecological risk assessment. CLEAN Soil Air Water 2017, 45, 1500392. [Google Scholar] [CrossRef]
  6. Cleuvers, M. Mixture toxicity of the anti-inflammatory drugs diclofenac, ibuprofen, naproxen, and acetylsalicylic acid. Ecotoxicol. Environ. Saf. 2004, 59, 309–315. [Google Scholar] [CrossRef]
  7. Yu, H.; Nie, E.; Xu, J.; Yan, S.; Cooper, W.J.; Song, W. Degradation of diclofenac by advanced oxidation and reduction processes: Kinetic studies, degradation pathways and toxicity assessments. Water Res. 2013, 47, 1909–1918. [Google Scholar] [CrossRef] [PubMed]
  8. Babuponnusami, A.; Muthukumar, K. A review on Fenton and improvements to the Fenton process for wastewater treatment. J. Environ. Chem. Eng. 2014, 2, 557–572. [Google Scholar] [CrossRef]
  9. Amor, C.; Marchão, L.; Lucas, M.S.; Peres, J.A. Application of advanced oxidation processes for the treatment of recalcitrant agro-industrial wastewater: A review. Water 2019, 11, 205. [Google Scholar] [CrossRef] [Green Version]
  10. Huaccallo-Aguilar, Y.; Álvarez-Torrellas, S.; Larriba, M.; Águeda, V.; Delgado, J.; Ovejero, G.; Peres, J.; García, J. Naproxen removal by CWPO with Fe3O4/multi-walled carbon nanotubes in a fixed-bed reactor. J. Environ. Chem. Eng. 2021, 9, 105110. [Google Scholar] [CrossRef]
  11. Huaccallo-Aguilar, Y.; de Tuesta, J.D.; Álvarez-Torrellas, S.; Gomes, H.; Larriba, M.; Ovejero, G.; García, J. New insights on the removal of diclofenac and ibuprofen by CWPO using a magnetite-based catalyst in an up-flow fixed-bed reactor. J. Environ. Manag. 2021, 281, 111913. [Google Scholar] [CrossRef]
  12. Li, X.; Cui, K.; Guo, Z.; Yang, T.; Cao, Y.; Xiang, Y.; Chen, H.; Xi, M. Heterogeneous Fenton-like degradation of tetracyclines using porous magnetic chitosan microspheres as an efficient catalyst compared with two preparation methods. Chem. Eng. J. 2020, 379, 122324. [Google Scholar] [CrossRef]
  13. Mirzaee, S.A.; Jaafarzadeh, N.; Gomes, H.T.; Jorfi, S.; Ahmadi, M. Magnetic titanium/carbon nanotube nanocomposite catalyst for oxidative degradation of Bisphenol A from high saline polycarbonate plant effluent using catalytic wet peroxide oxidation. Chem. Eng. J. 2019, 370, 372–386. [Google Scholar] [CrossRef]
  14. Pignatello, J.J.; Oliveros, E.; Mackay, A. Advanced oxidation processes for organic contaminant destruction based on the fenton reaction and related chemistry. Crit. Rev. Environ. Sci. Technol. 2006, 36, 1–84. [Google Scholar] [CrossRef]
  15. Dulova, N.; Trapido, M.; Dulov, A. Catalytic degradation of picric acid by heterogeneous Fenton-based processes. Environ. Technol. 2011, 32, 439–446. [Google Scholar] [CrossRef] [PubMed]
  16. Tomul, F.; Arslan, Y.; Başoğlu, F.T.; Babuçcuoğlu, Y.; Tran, H.N. Efficient removal of anti-inflammatory from solution by Fe-containing activated carbon: Adsorption kinetics, isotherms, and thermodynamics. J. Environ. Manag. 2019, 238, 296–306. [Google Scholar] [CrossRef]
  17. Ray, S.K.; Dhakal, D.; Lee, S.W. Rapid degradation of naproxen by AgBr-α-NiMoO4 composite photocatalyst in visible light: Mechanism and pathways. Chem. Eng. J. 2018, 347, 836–848. [Google Scholar] [CrossRef]
  18. Moazzen, M.; Khaneghah, A.M.; Shariatifar, N.; Ahmadloo, M.; Eş, I.; Baghani, A.N.; Yousefinejad, S.; Alimohammadi, M.; Azari, A.; Dobaradaran, S.; et al. Multi-walled carbon nanotubes modified with iron oxide and silver nanoparticles (MWCNT-Fe3O4/Ag) as a novel adsorbent for determining PAEs in carbonated soft drinks using magnetic SPE-GC/MS method. Arab. J. Chem. 2019, 12, 476–488. [Google Scholar] [CrossRef]
  19. Wang, Y.; Wei, H.; Zhao, Y.; Sun, W.; Sun, C. The optimization, kinetics and mechanism of m-cresol degradation via catalytic wet peroxide oxidation with sludge-derived carbon catalyst. J. Hazard. Mater. 2017, 326, 36–46. [Google Scholar] [CrossRef]
  20. Yu, L.; Yang, X.; Ye, Y.; Wang, D. Efficient removal of atrazine in water with a Fe3O4/MWCNTs nanocomposite as a heterogeneous Fenton-like catalyst. RSC Adv. 2015, 5, 46059–46066. [Google Scholar] [CrossRef]
  21. Chen, S.; Cai, M.; Liu, Y.; Zhang, L.; Feng, L. Effects of water matrices on the degradation of naproxen by reactive radicals in the UV/peracetic acid process. Water Res. 2019, 150, 153–161. [Google Scholar] [CrossRef] [PubMed]
  22. Munoz, M.; Conde, J.; de Pedro, Z.M.; Casas, J.A. Antibiotics abatement in synthetic and real aqueous matrices by H2O2/natural magnetite. Catal. Today 2018, 313, 142–147. [Google Scholar] [CrossRef]
  23. Grassi, P.; Drumm, F.C.; Georgin, J.; Franco, D.S.P.; Foletto, E.L.; Dotto, G.L.; Jahn, S.L. Water treatment plant sludge as iron source to catalyze a heterogeneous photo-Fenton reaction. Environ. Technol. Innov. 2020, 17, 100544. [Google Scholar] [CrossRef]
  24. Huaccallo, Y.; Álvarez-Torrellas, S.; Marín, M.P.; Gil, M.V.; Larriba, M.; Águeda, V.I.; Ovejero, G.; García, J. Magnetic Fe3O4/multi-walled carbon nanotubes materials for a highly efficient depletion of diclofenac by catalytic wet peroxideoxidation. Environ. Sci. Pollut. Res. 2019, 26, 22372–22388. [Google Scholar] [CrossRef]
  25. García, J.C.; Pedroza, A.M.; Daza, C.E. Magnetic fenton and photo-fenton-like catalysts supported on carbon nanotubes for wastewater treatment. Water Air Soil Pollut. 2017, 228, 246. [Google Scholar] [CrossRef]
  26. Wang, H.; Jiang, H.; Wang, S.; Shi, W.; He, J.; Liu, H.; Huang, Y. Fe3O4–MWCNT magnetic nanocomposites as efficient peroxidase mimic catalysts in a Fenton-like reaction for water purification without pH limitation. RSC Adv. 2014, 4, 45809–45815. [Google Scholar] [CrossRef]
  27. Lung, I.; Soran, M.-L.; Stegarescu, A.; Opris, O.; Gutoiu, S.; Leostean, C.; Lazar, M.D.; Kacso, I.; Silipas, T.-D.; Porav, A.S. Evaluation of CNT-COOH/MnO2/Fe3O4 nanocomposite for ibuprofen and paracetamol removal from aqueous solutions. J. Hazard. Mater. 2021, 403, 123528. [Google Scholar] [CrossRef]
  28. Álvarez-Torrellas, S.; Munoz, M.; Gläsel, J.; De Pedro, Z.M.; Domínguez, C.M.; García, J.; Etzold, B.J.; Casas, J.A. Highly efficient removal of pharmaceuticals from water by well-defined carbide-derived carbons. Chem. Eng. J. 2018, 347, 595–606. [Google Scholar] [CrossRef]
  29. Fan, X.-J.; Li, X. Preparation and magnetic property of multiwalled carbon nanotubes decorated by Fe3O4 nanoparticles. New Carbon Mater. 2012, 27, 111–116. [Google Scholar] [CrossRef]
  30. Huaccallo-Aguilar, Y.; Álvarez-Torrellas, S.; Larriba, M.; Águeda, V.I.; Delgado, J.A.; Ovejero, G.; García, J. Optimization parameters, kinetics and mechanism of naproxen removal by catalytic wet peroxide oxidation with a hybrid iron-based magnetic catalyst. Catalysts 2019, 9, 287. [Google Scholar] [CrossRef] [Green Version]
  31. Munoz, M.; Mora, F.J.; de Pedro, Z.M.; Alvarez-Torrellas, S.; Casas, J.A.; Rodriguez, J.J. Application of CWPO to the treatment of pharmaceutical emerging pollutants in different water matrices with a ferromagnetic catalyst. J. Hazard. Mater. 2017, 331, 45–54. [Google Scholar] [CrossRef]
  32. Jaafari, J.; Barzanouni, H.; Mazloomi, S.; Farahani, N.A.A.; Sharafi, K.; Soleimani, P.; Haghighat, G.A. Effective adsorptive removal of reactive dyes by magnetic chitosan nanoparticles: Kinetic, isothermal studies and response surface methodology. Int. J. Biol. Macromol. 2020, 164, 344–355. [Google Scholar] [CrossRef]
  33. Piepho, H.P.; Edmondson, R.N. A tutorial on the statistical analysis of factorial experiments with qualitative and quantitative treatment factor levels. J. Agron. Crop. Sci. 2018, 204, 429–455. [Google Scholar] [CrossRef] [Green Version]
  34. Domínguez, C.; Quintanilla, A.; Casas, J.; Rodriguez, J. Kinetics of wet peroxide oxidation of phenol with a gold/activated carbon catalyst. Chem. Eng. J. 2014, 253, 486–492. [Google Scholar] [CrossRef]
  35. Medinas, D.B.; Cerchiaro, G.; Trindade, D.F.; Augusto, O. The carbonate radical and related oxidants derived from bicarbonate buffer. IUBMB Life 2007, 59, 255–262. [Google Scholar] [CrossRef]
  36. Lagoeiro, L.E. Transformation of magnetite to hematite and its influence on the dissolution of iron oxide minerals. J. Metamorph. Geol. 2004, 16, 415–423. [Google Scholar] [CrossRef]
  37. Han, S.; Yu, H.; Yang, T.; Wang, S.; Wang, X. Magnetic activated-ATP@Fe3O4 nanocomposite as an efficient fenton-like heterogeneous catalyst for degradation of ethidium bromide. Sci. Rep. 2017, 7, 6070. [Google Scholar] [CrossRef]
  38. Hua, Y.; Wang, S.; Xiao, J.; Cui, C.; Wang, C. Preparation and characterization of Fe3O4/gallic acid/graphene oxide magnetic nanocomposites as highly efficient Fenton catalysts. RSC Adv. 2017, 7, 28979–28986. [Google Scholar] [CrossRef] [Green Version]
  39. Zgoła-Grześkowiak, A. Application of DLLME to isolation and concentration of non-steroidal anti-inflammatory drugs in environmental water samples. Chromatographia 2010, 72, 671–678. [Google Scholar] [CrossRef]
  40. Chin, C.-J.M.; Chen, T.-Y.; Lee, M.; Chang, C.-F.; Liu, Y.-T.; Kuo, Y.-T. Effective anodic oxidation of naproxen by platinum nanoparticles coated FTO glass. J. Hazard. Mater. 2014, 277, 110–119. [Google Scholar] [CrossRef]
  41. Dulova, N.; Kattel, E.; Trapido, M. Degradation of naproxen by ferrous ion-activated hydrogen peroxide, persulfate and combined hydrogen peroxide/persulfate processes: The effect of citric acid addition. Chem. Eng. J. 2017, 318, 254–263. [Google Scholar] [CrossRef]
  42. Poznyak, I.T.; Chairez Oria, A.S.; Poznyak, A. Ozonation and Biodegradation in Environmental Engineering: Dynamic Neural Network Approach, 1st ed.; Elsevier: Masson Doyma, Mexico, 2018. [Google Scholar]
  43. Kanakaraju, D.; Motti, C.A.; Glass, B.D.; Oelgemöller, M. TiO2 photocatalysis of naproxen: Effect of the water matrix, anions and diclofenac on degradation rates. Chemosphere 2015, 139, 579–588. [Google Scholar] [CrossRef]
  44. Hofmann, J.; Freier, U.; Wecks, M.; Hohmann, S. Degradation of diclofenac in water by heterogeneous catalytic oxidation with H2O2. Appl. Catal. B Environ. 2007, 70, 447–451. [Google Scholar] [CrossRef]
  45. Ziylan, A.; Dogan, S.; Agopcan, S.; Kidak, R.; Aviyente, V.; Ince, N.H. Sonochemical degradation of diclofenac: Byproduct assessment, reaction mechanisms and environmental considerations. Environ. Sci. Pollut. Res. 2014, 21, 5929–5939. [Google Scholar] [CrossRef] [PubMed]
  46. Cinar, S.A.; Ziylan-Yavaş, A.; Catak, S.; Ince, N.H.; Aviyente, V. Hydroxyl radical-mediated degradation of diclofenac revisited: A computational approach to assessment of reaction mechanisms and by-products. Environ. Sci. Pollut. Res. 2017, 24, 18458–18469. [Google Scholar] [CrossRef] [PubMed]
  47. Yu, Y.; Huang, F.; He, Y.; Wang, F.; Lv, Y.; Xu, Y.; Zhang, Y. Efficient degradation of sulfamethoxazole by catalytic wet peroxide oxidation with sludge-derived carbon as catalysts. Environ. Technol. 2018, 41, 870–877. [Google Scholar] [CrossRef]
  48. Eckner, K.F. Comparison of membrane filtration and multiple-tube fermentation by the colilert and enterolert methods for detection of Waterborne Coliform Bacteria, Escherichia coli, and Enterococci used in drinking and bathing water quality monitoring in Southern Sweden. Appl. Environ. Microbiol. 1998, 64, 3079–3083. [Google Scholar] [CrossRef] [Green Version]
  49. Márquez, J.J.R.; Levchuk, I.; Sillanpää, M. Application of catalytic wet peroxide oxidation for industrial and urban wastewater treatment: A review. Catalysts 2018, 8, 673. [Google Scholar] [CrossRef] [Green Version]
  50. Ayazi, Z.; Khoshhesab, Z.M.; Norouzi, S. Modeling and optimizing of adsorption removal of Reactive Blue 19 on the magnetite/graphene oxide nanocomposite via response surface methodology. Desalination Water Treat. 2016, 57, 25301–25316. [Google Scholar] [CrossRef]
  51. Eaton, A.D. Standard Methods for the Examination of Water and Wastewater, 21st ed.; American Public Health Association; American Water Works Association; Water Environment Federation: Washington, DC, USA, 2005. [Google Scholar]
Figure 1. TEM images of (a) FMWCNTs, (b) third reuse-catalyst 4; TGA analysis of (c) magnetic catalysts, FMWCNTs and third reuse of catalyst 4; and (d) derivate weight of FMWCNTs, catalyst 4 and its third reuse.
Catalysts 11 00514 g001
Figure 2. (a,b) FT-IR spectra of the FMWCNTs, Fe3O4 and catalysts; (c) N2 adsorption–desorption isotherms at 77 K of the FMWCNTs, and catalysts 4 and 5; (d) magnetic hysteresis curves of catalyst 4 and its third reuse.
Catalysts 11 00514 g002
Figure 3. Evolution of (a) NAP and (b) DCF degradation by CWPO.
Catalysts 11 00514 g003
Figure 4. Combined effect of H2O2 and pH on the removal of (a) NAP and (b) DCF. Reaction conditions: [NAP]0 = [DCF]0 = 5.0 mg L−1, [catalyst] = 1.0 g L−1, and 3 h of reaction time.
Catalysts 11 00514 g004
Figure 5. Combined effect of temperature and pH on the removal of (a) NAP and (b) DCF. Reaction conditions: [NAP]0 = [DCF]0 = 5.0 mg L−1, [catalyst] = 1.0 g L−1, and 3 h of reaction time.
Catalysts 11 00514 g005
Figure 6. Recycling tests of the catalyst 4 for (a) NAP and (b) DCF removal. Reaction conditions: [NAP]0 = [DCF]0 = 5.0 mg L−1, [catalyst] = 1.0 g L−1, pH = 6.5, 3 mM H2O2, 50 °C, atmospheric pressure and 3 h of reaction time.
Catalysts 11 00514 g006
Figure 7. EPR spectra of DMPO, DMPO with catalyst, and DMPO adducts formed in CWPO reaction.
Catalysts 11 00514 g007
Figure 8. Proposed reaction pathway for the degradation of NAP by CWPO.
Catalysts 11 00514 g008
Figure 9. Proposed reaction pathway for the degradation of DCF by CWPO.
Catalysts 11 00514 g009
Figure 10. (a) TOC removal percentage and (b) H2O2 removal efficiency values for treating the three environmentally relevant water matrices by CWPO.
Catalysts 11 00514 g010
Table 1. Textural properties of the materials.
MaterialSBET
(m2 g−1)
VMic
(cm3 g−1)
VTotal
(cm3 g−1)
VMic/VTotalAverage Pore Width (nm) *
FMWCNTs970.060.230.2617.9
Catalyst 4960.050.230.2217.1
Catalyst 5900.050.230.2214.7
* average pore size at 4 V/A by BET.
Table 2. Elemental analysis of the materials.
FMWCNTsCatalyst 1Catalyst 2Catalyst 3Catalyst 4Catalyst 5Third Reuse Catalyst 4
% C84.4740.7250.058.040.7258.041.65
% Fen.d.26.2219.521.035.010.636.1
n.d., not detected.
Table 3. Experimental design matrix of the degradation of NAP and DCF by CWPO.
Actual ValuesNAP Removal Efficiency (%)DCF Removal Efficiency (%)
A (H2O2 dose, mM)B (T, °C)C (pH Initial)ObservedPredictedObservedPredicted
10.50507.09.009.4230.0031.08
23.00507.011.0011.0234.7835.49
30.50707.013.0012.9837.5036.79
43.00707.018.0017.5852.0050.92
50.50606.512.6412.8537.9238.74
63.00606.518.4719.0857.0058.19
70.50607.55.004.4015.0013.81
83.00607.54.584.3713.7412.92
91.75506.517.0016.3751.0049.09
101.75706.519.0018.8254.0053.89
111.75507.52.002.188.128.23
121.75707.59.229.8522.6624.56
131.75607.010.6010.5631.0031.37
141.75607.010.1010.5631.1031.37
151.75607.011.0010.5632.0031.37
Reaction conditions: [NAP]0 = [DCF]0 = 5.0 mg L−1, [catalyst] = 1.0 g L−1, atmospheric pressure, 3 h of reaction time.
Table 4. ANOVA results of the NAP and DCF quadratic polynomial model.
DFSSMSFProb > F (p-Value)
NAPModel9373.3141.4885.03<0.000-
Residual52.440.49---
Lack of fit32.030.683.330.239Not significant
Pure error20.410.20---
Total14375.74----
DCFRegression93161.79351.31114.08<0.000-
Residual515.403.08---
Lack of fit314.794.9316.250.059Not significant
Pure error20.610.30---
Total143177.16----
DF: degrees of freedom, SS: sum of squares, MS: mean of squares, F: degree of freedom, p: probability.
Table 5. Composition of the prepared Fe3O4/MWCNTs catalysts.
Catalyst 1Catalyst 2Catalyst 3Catalyst 4Catalyst 5Magnetite
MWCNT (g)0.10.150.20.10.20
FeCl2·4H2O (g)0.080.090.10.10.080.08
FeCl3·6H2O (g)0.280.280.280.280.280.28
Table 6. Experimental design levels with three variables.
Levels Box–Behnken DesignA (H2O2) (mM)B (Temperature) (°C)C (Initial pH)
Low (−1)0.50506.5
Medium (0)1.75607.0
High (+1)3.00707.5
Publisher’s Note: MDPI stays neutral with regard to jurisdictional claims in published maps and institutional affiliations.

