Article

Palladium Particles Modified by Mixed-Frequency Square-Wave Potential Treatment to Enhance Electrocatalytic Performance for Formic Acid Oxidation

1
Key Laboratory of Advanced Ceramics and Machining Technology (Ministry of Education), Tianjin Key Laboratory of Composite and Functional Materials, School of Materials Science and Engineering, Tianjin University, Tianjin 300072, China
2
Joint School of National University of Singapore and Tianjin University, International Campus of Tianjin University, Binhai New City, Fuzhou 119077, China
*
Author to whom correspondence should be addressed.
Submission received: 1 March 2021 / Revised: 15 April 2021 / Accepted: 19 April 2021 / Published: 20 April 2021
(This article belongs to the Section Electrocatalysis)

Abstract

:
Palladium catalysts have attracted widespread attention as advanced electrocatalysts for the formic acid oxidation (FAO) due to their excellent electrocatalytic activity and relatively high abundance. At present, electrodeposition methods have been widely developed to prepare small-sized and highly-dispersed Pd electrocatalysts. However, the customary use of surfactants would introduce heterogeneous impurities, which requires complicated removal processes. In this work, we reported a two-step electrochemical method that employed square-wave potential treatment (SWPT) to modify electrodeposited Pd particles without the use of capping agents. Under the SWPT with a mixed frequency, Pd particles show significantly reduced size and more dispersed distribution, exhibiting a high mass activity of 1.43 A mg−1 toward FAO, which is 4.6 times higher than the counterpart of commercial Pd/C. The increase in electrocatalytic activity of FAO is attributed to the highly developed surface of palladium particles uniformly distributed over the support surface.

Graphical Abstract

1. Introduction

Palladium (Pd) electrocatalysts shows great significance in many applications including the fields of electrocatalytic oxidation of several organic molecules and reduction of oxygen, metal-air batteries, and fuel cells [1,2,3,4,5,6,7] due to the excellent electrocatalytic activity and relatively high abundance (compared to platinum (Pt)) [8,9]. In order to fully utilize Pd metal and improve its catalytic performance, great efforts have been devoted to reducing the particle size of Pd electrocatalysts to increase active exposed faces [10,11,12,13]. However, with decreasing particle size, the surface energy of electrocatalysts will increase, leading to severe aggregation of the small particles and thus reduction of total surface energy in the preparation process [14,15].
To date, several methods have been developed to control the size of electrocatalysts, including wet impregnation and chemical reduction [16,17,18], microemulsions [19], sonochemistry [20], microwave irradiation [21,22], and sputtering electron-beam deposition [23], etc. Compared to these methods, the electrodeposition method has special advantages such as low cost, rapid deposition rate, easy-to-operate procedure, high purity, and in-situ formation of the product [24,25,26,27]. Unfortunately, it is difficult to obtain particles which are of ideal size and distribution via commonly used galvanostatic and potentiostatic electrodeposition method because of limited controllable parameters [28]. Adding various capping agents to the electrodeposition electrolyte is a general tactic to address this issue. Capping agents could stabilize the highly reactive nanoparticles (NPs) surfaces to avoid aggregation and dissolution [29,30]. Nevertheless, the addition of the capping agents may introduce heterogeneous impurities and generally requires complicated post-treatment to remove them, which potentially hinder their electrocatalytic activities [31]. Pulse electrodeposition is another considerable strategy to regulate the size and distribution of particles because of variable controllable parameters [28], and lots of reports have focused on the pulse electrodeposition of nanoscale electrocatalysts. For example, Pt nanodendrites with a size of 100 nm could be prepared by the pulse electrodeposition method, and the Pt nanodendrites showed better methanol conversion performance with higher turnover frequency (TOF) than that of electrocatalysts with hemispherical and flower-like structures [32]. Hsieh et al. [33] utilized the pulse electrodeposition method to prepare Pd nanoclusters on graphene-based electrodes for proton exchange membrane fuel cells, and the average size of clusters is 100−150 nm. Moreover, Orest et al. [34] developed Pd NPs with a size below 100 nm by the pulse electrodeposition method. The Pd NPs were deposited on the surface of n–Si (100) substrate in dimethyl sulfoxide (DMSO) solutions of Pd(NO3)2 and the average particle size is 75 nm. Despite the achievements made in the pulse electrodeposition, it is still challenging to obtain nanoparticles with both small size (<50 nm) and highly-dispersed distribution.
Herein, we reported a two-step electrochemical method for obtaining Pd NPs with ideal size and distribution. Pd particles were deposited on carbon paper by constant current electrodeposition at first, and then they were treated with square-waves of different frequencies (<100 Hz) in the H2SO4 solution. The effect of modification time and frequency of square-wave potential treatment (SWPT) on the size and distribution of electrodeposited Pd particles was systematically investigated. Eventually, Pd NPs with remarkably reduced size and highly-dispersed distribution (Pds-Mixed) were obtained via an optimized mixed-frequency SWPT. Compared with the samples without SWPT or single-frequency SWPT, Pds-mixed exhibits superior electrocatalytic activity towards formic acid oxidation (FAO). The excellent catalytic performance of Pds-mixed is attributed to its reduced size and more dispersed distribution. This work provides a significant insight into the development of clean and in-situ preparation methods for electrocatalysts with high electrocatalytic activity.

2. Results and Discussion

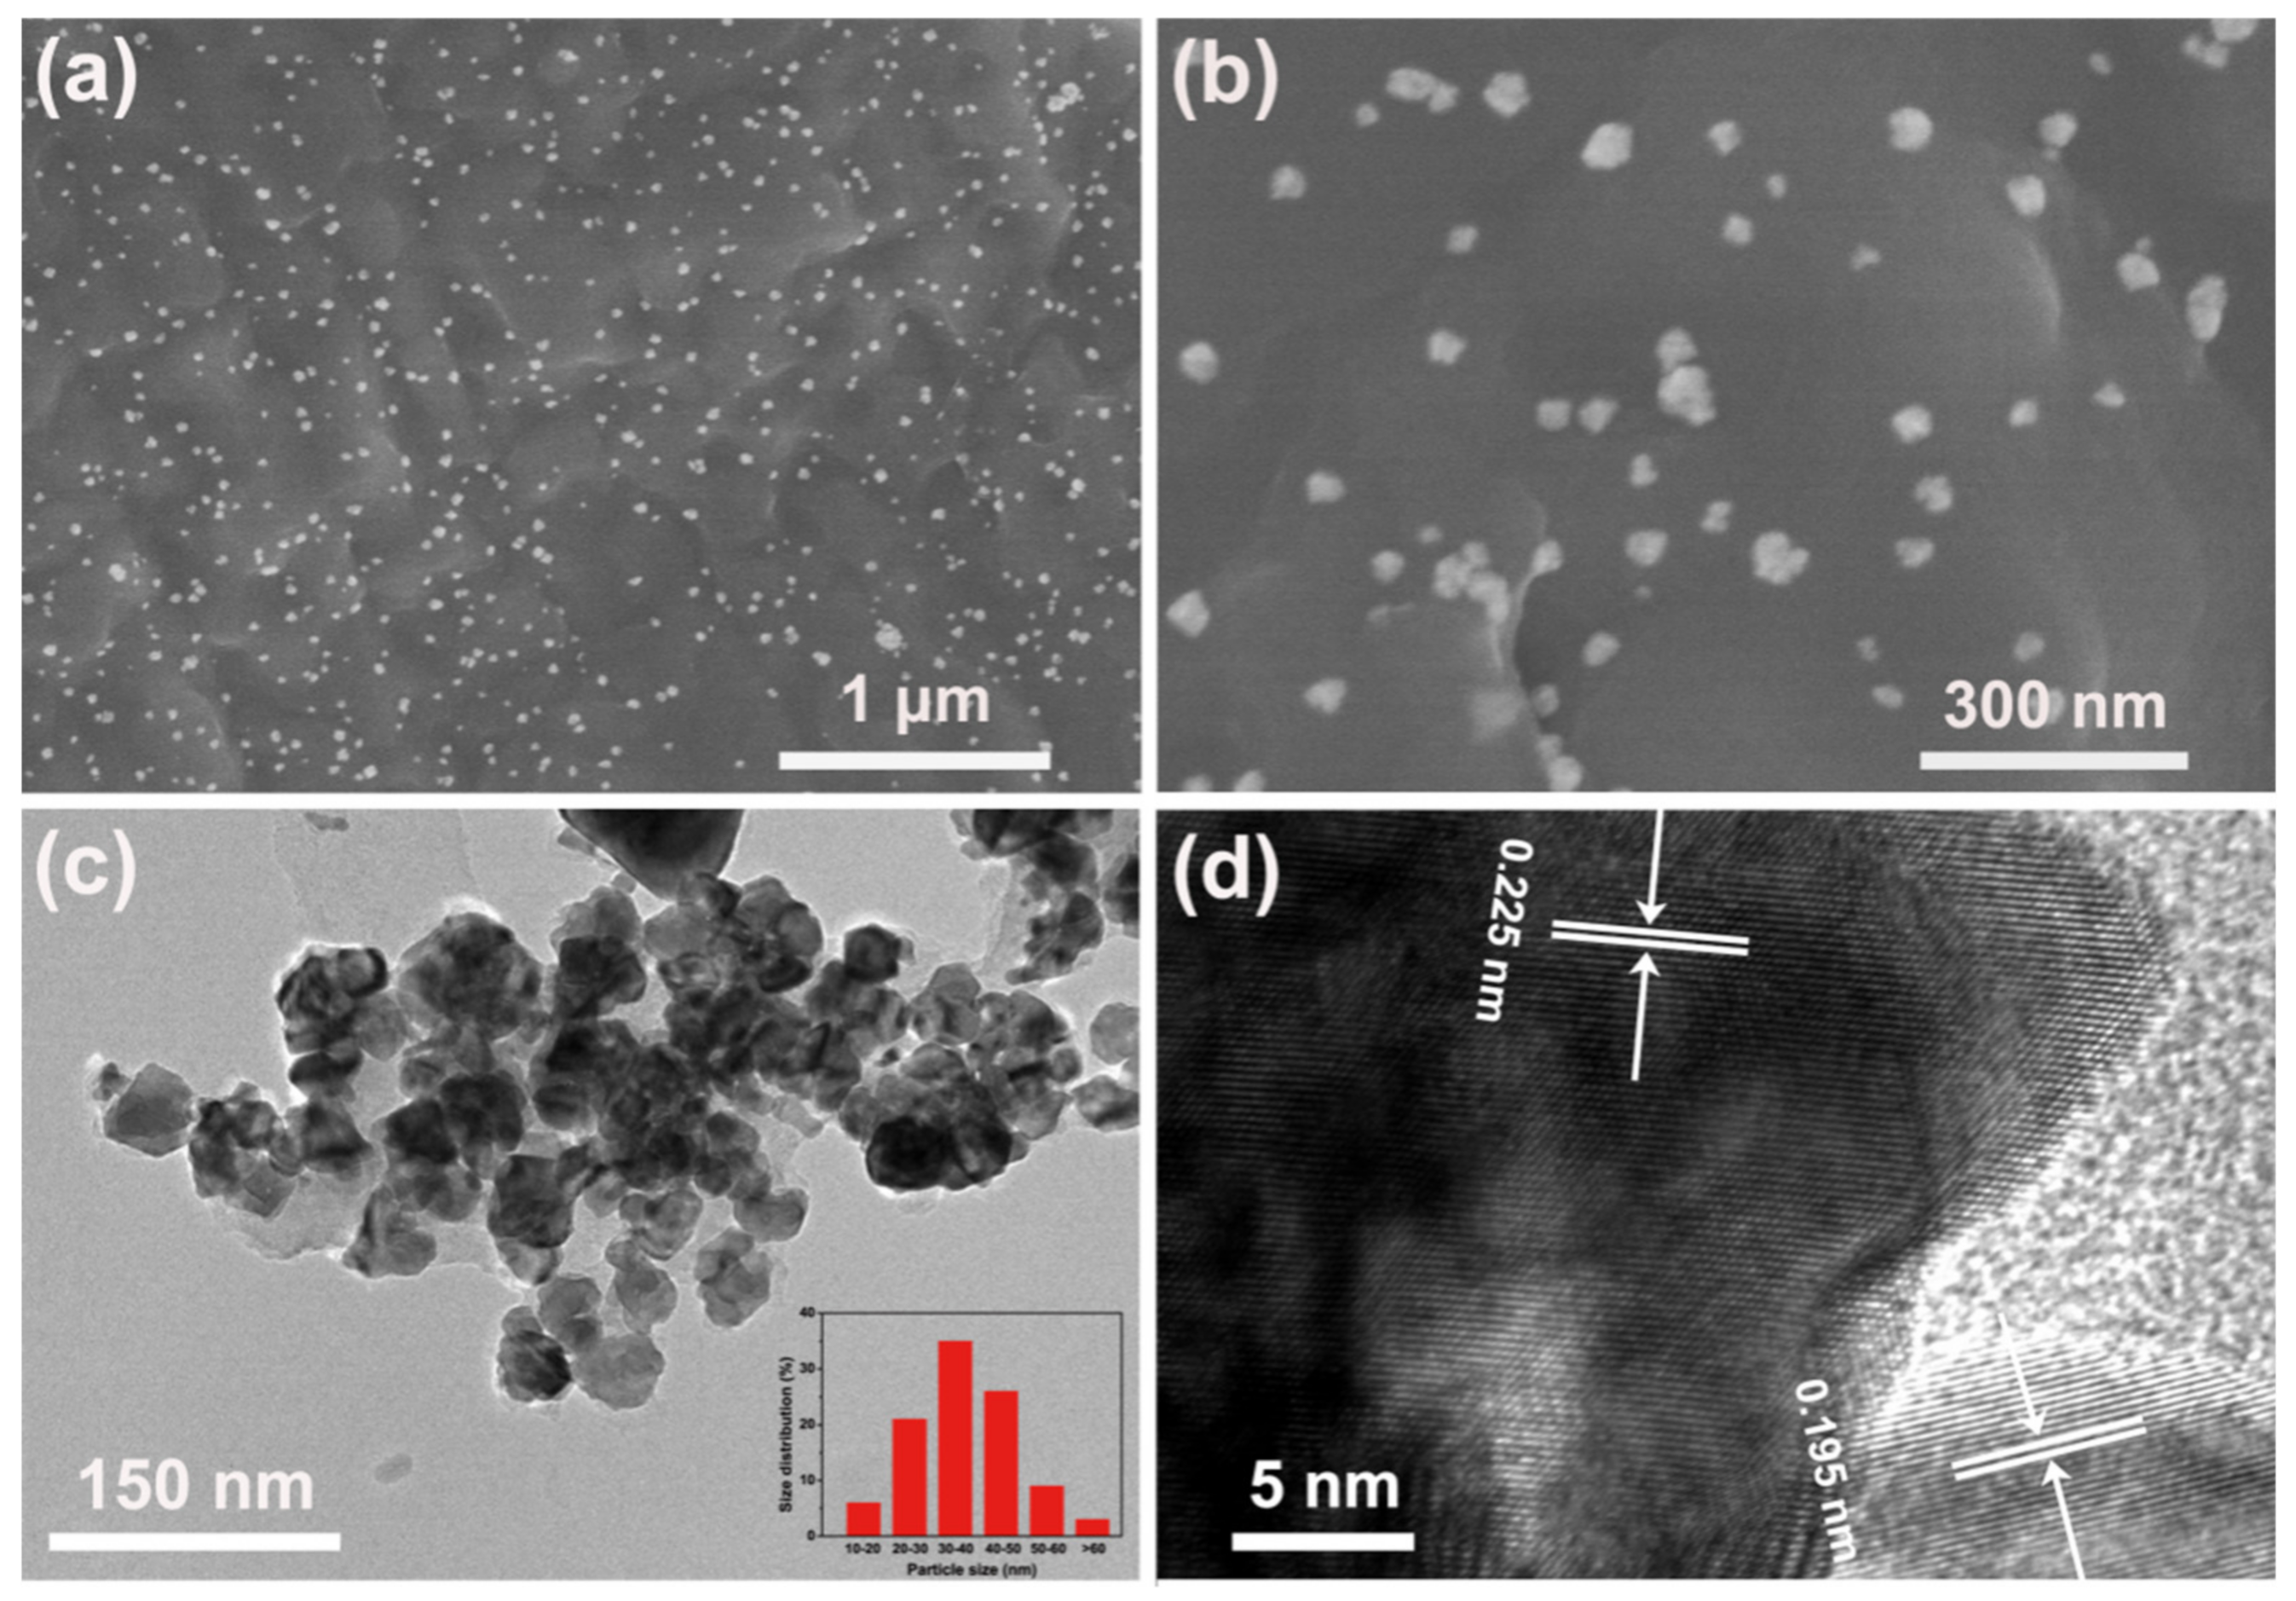
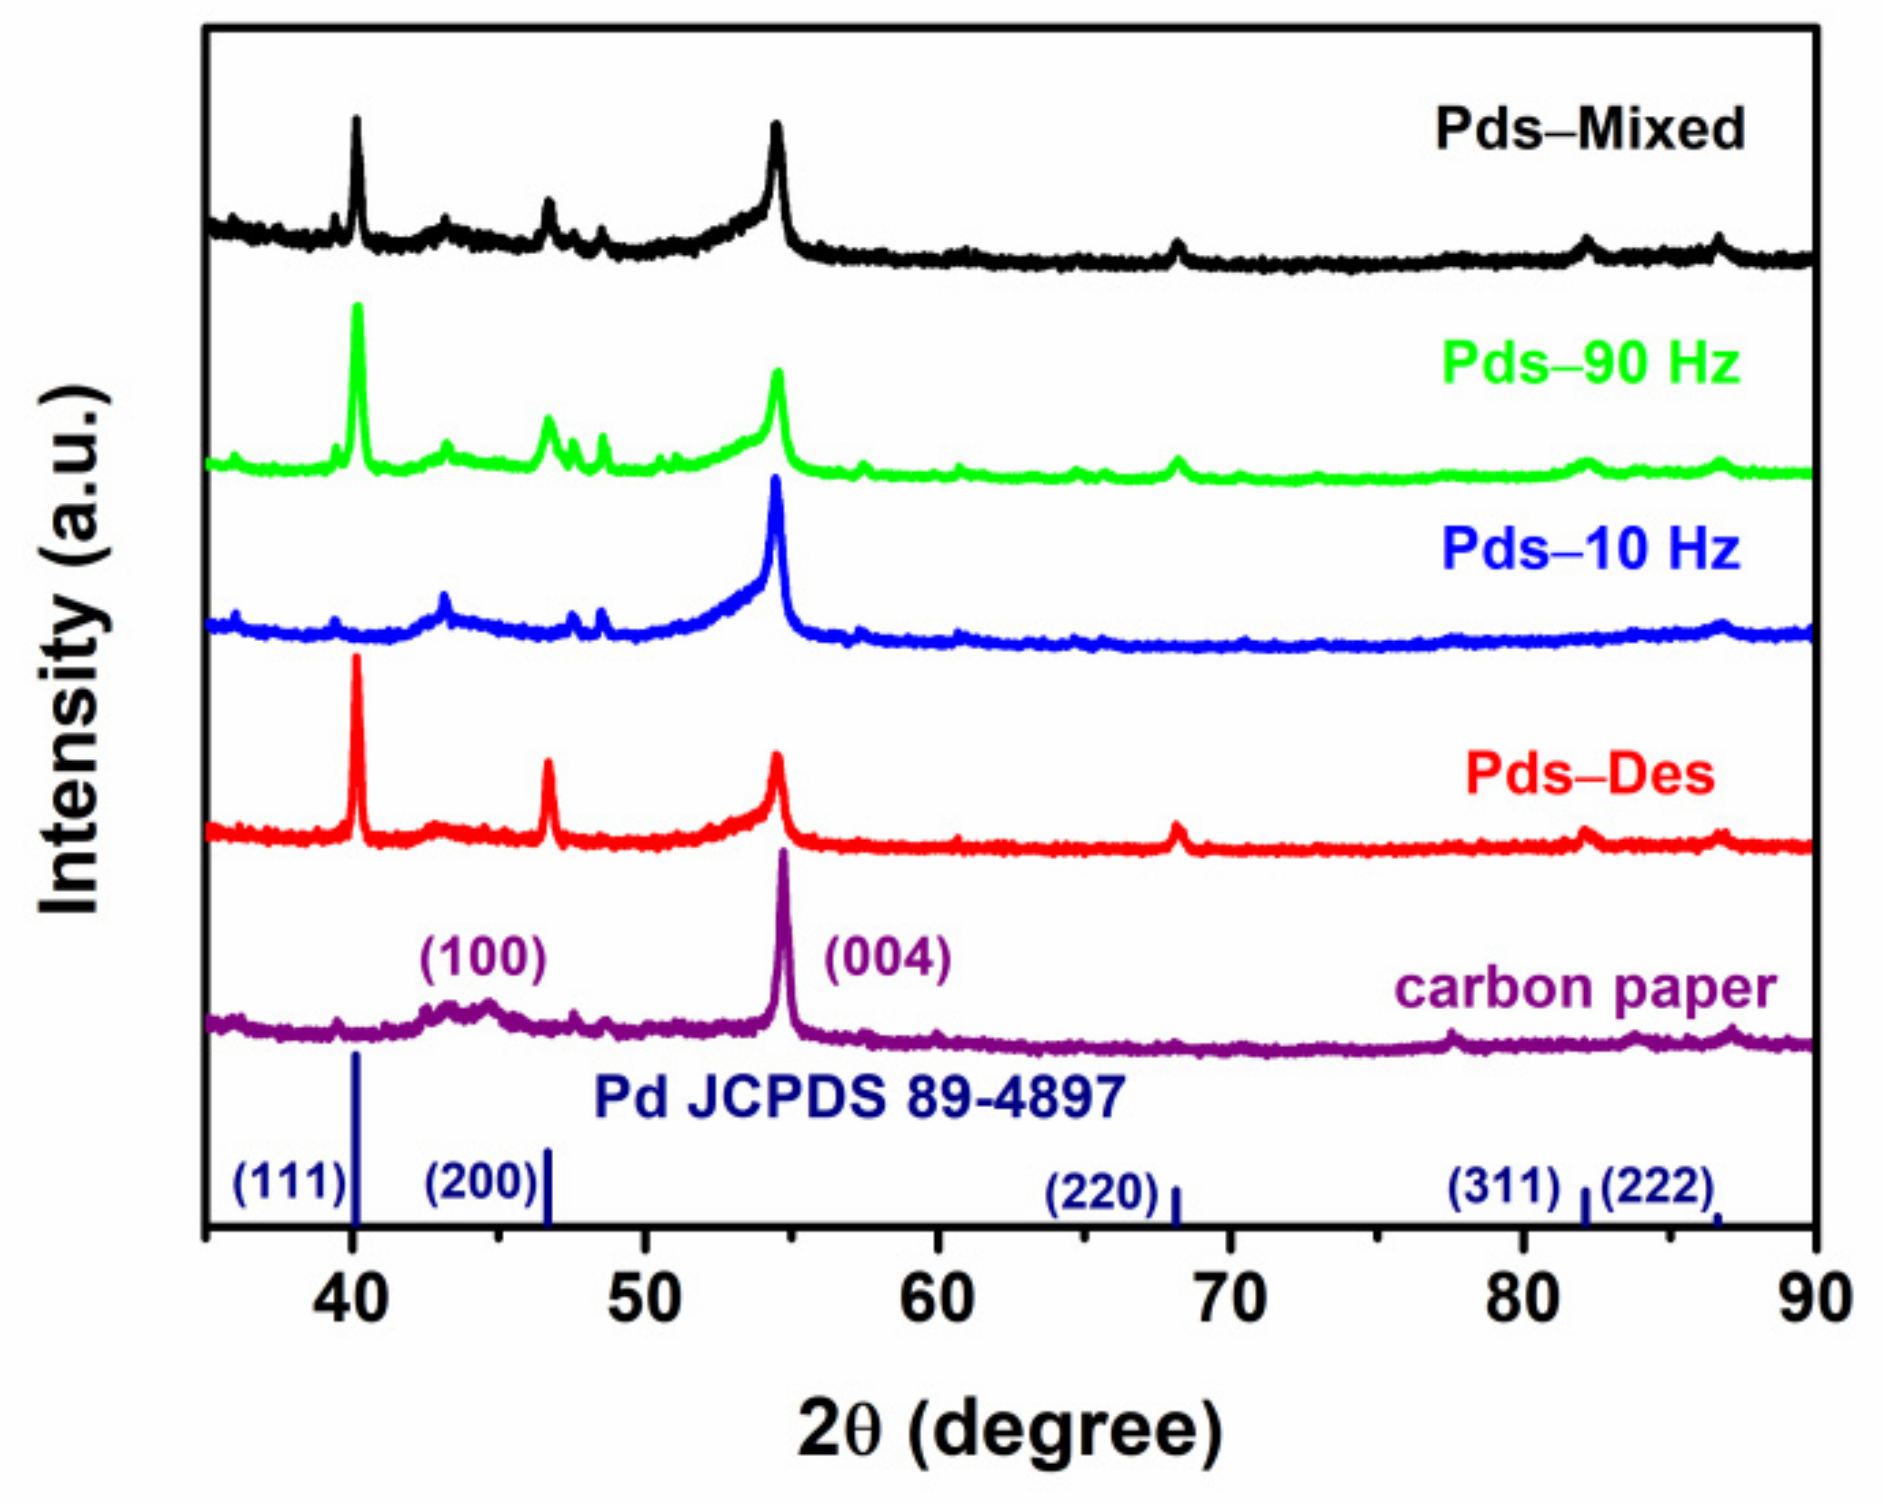
2.1. Characterizations Results

Figure 1 shows the typical scanning electron microscope (SEM) images of the surface morphologies of the Pd particles electrodeposited on the carbon paper substrate. At a constant deposition current density of −0.15 mA cm−2 in 5 mM PdCl2 and 0.5 M H2SO4, the Pd particles are featured with irregular polyhedron morphology and their sizes range from 200–300 nm (Pds–Des, Figure 1a). Moreover, few sharp edges could be observed on the surface of the particle (Figure 1b). Although single Pd particle could be identified on the surface of carbon paper, most of the particles still cluster together to form larger particle aggregates. The chronoamperograms’ responses during the galvanostatic electrodeposition of Pd on the carbon paper substrate are shown in Figure S1. From the enlarged-scale image of the curve, it can be seen that the initial potential shows drastic change which may be related to the nucleation process at first. Following the rapid change, the curve features a stable current plateau with a voltage of approximately 0.06 V (vs. mercury sulfate electrode (MSE)), which corresponds to the growth process [35,36]. It is known that the whole electrodeposition progress is controlled by both the mass transfer of Pd2+ ions from the bulk solution toward the electrode (diffusion process) and the reduction reaction on the electrode (activation process). At a low current density (−0.15 mA cm−2), the anisotropy of the particle growth process leads to the appearance of irregular polyhedron structures. Moreover, Figure S2a–d show the morphologies of Pd particles under different deposition parameters. As the electrodeposition current density is changed to −0.3 mA cm−2 (2700 s), the low-magnification SEM image (Figure S2a) shows the Pd particles aggregate to form a layered structure, and few gaps between particles can be observed. This aggregated structure greatly reduces the specific surface area of the electrocatalyst, and may further affect the electrocatalytic performance. In addition, the high-magnification SEM image (Figure S2b) shows these Pd particles exhibit irregular shapes with some sharp edges and tips. As the electrodeposition current density is shifted to −0.05 mA cm−2 (2700 s), the size of Pd NPs reduces drastically, and Pd NPs are difficult to observe in the SEM images (Figure S2c,d). Although the Pd NPs with smaller sizes are beneficial to enhance the mass electrocatalytic performance due to the higher specific area, a low Pd loading amount would make it insufficient to support the practical application because of the small areal catalytic current. In summary, the Pd electrocatalyst with small size, ideal distribution, and reasonable loading amount at the same time is hardly obtained by simply adjusting the electrodeposition current. Therefore, the square-wave potential treatment (SWPT) is applied to electrodeposited Pd particles, and its influence on the particle size and other aspects which are closely related to the catalytic performance of the Pd electrocatalyst is investigated.
To study the effect of time and frequency in the SWPT process on the morphology of Pd particles, samples were firstly deposited at a current density of −0.15 mA cm−2 on the carbon paper, and then they were treated with the SWPT between 0.6 V and −3.2 V at different frequencies in 1 M H2SO4. Figure 2a,b show SEM images of Pd particles with the SWPT at a frequency of 10 Hz for 5 h (Pds–10 Hz). Pd particles can be rarely observed in Figure 3a,b after the SWPT. This indicates that the SWPT at a frequency of 10 Hz would lead to the dissolution of Pd particles in the H2SO4 solution compared to Figure 1. Figure 2d,e show SEM images of Pd particles treated with the SWPT at a frequency of 90 Hz for 5 h (Pds–90 Hz). The size and distribution of large Pd particles are similar to the counterpart of Pds–Des. However, it is interesting to note that a large number of tiny Pd particles appear on the surface of the carbon paper, which is not observed in the images of Pds–Des and Pds–10 Hz. In addition, the Pd loading of both samples decreases after the treatment. The reason is that the amount of dissolved Pd is higher than the amount of Pd deposited on the carbon paper during the SWPT.
The SWPT on Pd particles consists of oxidation process and reduction process in an aqueous electrochemical system. When the upper potential EU is applied, the Pd particles on the carbon paper are oxidized to dissolved Pd2+ ions, which would diffuse to the bulk solution during the process. When the lower potential EL of the pulse square wave is applied, the deposition of Pd2+ ions in solution with the nucleation and growth of Pd particles on the carbon paper occur. The deposition process and the dissolution process are related to values of EU, EL, frequency, and ions concentration [37,38,39]. Limited by the low Pd2+ ion concentration of the solution, the rate of deposition is lower than that of dissolution under the selected SWPT potential (as shown in Figure 2c). Therefore, the Pd loading is lowered after a complete EU–EL process. Under the condition of the low frequency (10 Hz), the time of the EU process in a single pulse on Pd particles is longer than that of the high frequency (90 Hz). Therefore, there is more time for the dissolved Pd2+ ions to diffuse throughout the bulk H2SO4 solution at 10 Hz than that at 90 Hz, which leads to a lower deposition rate with the same EL. As a result, most of the Pd particles are dissolved when the square wave of 10 Hz is applied for long enough, which causes Pd particles to be rarely observed on the carbon paper. By contrast, the diffusion of Pd2+ ions is much less at 90 Hz with a shorter time of EU in a single wave. Therefore, more dissolved Pd2+ ions could be reduced during the EL process, and thus the morphology of particles does not change significantly in the whole process (as shown in Figure 2e). Moreover, the appearance of small Pd NPs in Figure 2d and e is due to the increment of the frequency of SWPT. These deposited Pd NPs with small size are difficult to maintain under low-frequency SWPT due to the strong dissolution effect during the EU process. As a result, they are hardly observed at the sample after SWPT with a frequency of 10 Hz in Figure 2a,b. Therefore, a mixed-frequency SWPT method is designed, whose purpose is to combine the characteristics of strong modification (dissolution) at the low frequency and the ability to retain tiny particles at the high frequency.
Figure 3a,b show SEM images of Pd particles treated with SWPT at a frequency of 10 Hz for 4 h and 90 Hz for 1 h (Pds–Mixed). Interesting changes occur on Pd particles on the carbon paper. Pds–Mixed exhibits smaller particle size which significantly decreases to 20−50 nm in comparison with that of Pds–Des (200−300 nm). Moreover, the number density of Pds–Mixed is also much higher. Compared to samples after SWPT of singe frequency (Pds–10 Hz and Pds–90 Hz), the sample after the mixed-frequency treatment remains fine particles while eliminating large-size particles. Figure 3c,d show transmission electron microscope (TEM) and high-resolution transmission electron microscope (HRTEM) images of Pds–Mixed. The size of Pd NPs in Figure 3c is around 35 nm, which is consistent with the SEM result. Moreover, the HRTEM image in Figure 3d presents the detailed crystal structure of the Pd nanocrystals. The well-defined fringes show periods of 2.25 Å and 1.95 Å, which is in good agreement with the (111) and (200) lattice of Pd, respectively.
To study the morphology transformation mechanism during the modification process with a mixed-frequency, the influence of SWPT at a frequency of 10 Hz with different modification times on the surface morphology of Pds–Des was investigated. Figure S3 shows typical SEM images of the surface morphologies of Pd particles after SWPT at a frequency of 10 Hz for 2 and 4 h. When the treatment time reaches 2 h, Pd particles exhibit a cubic-like morphology (Figure S3a,b). In addition, the size of most particles also reduces compared to that of Pds–Des, which reduces from 200−300 nm to 50−100 nm. Previous studies found that the change in the shape of noble metal particles were related to the adsorption of oxygen (O). During the treatment process, periodic redox reactions occur on the surface of the Pd, which means that O is repeatedly adsorbed and desorbed on the surface [40,41]. Moreover, O is more likely to be adsorbed at the Pd(100) crystal plane, making this crystal plane of Pd dissolve more slowly than other crystal planes, thereby most Pd particles exhibit cubic-like morphology. Moreover, when the time of SWPT at a frequency of 10 Hz is extended to 4 h, Pd particles on the carbon paper can be rarely observed (Figure S3c,d). This indicates that most of the original Pd particles have been dissolved after 4 h.
Briefly, SWPT with a mixed-frequency efficiently combines advantages of two SWPT processes at the low and high frequencies. The SWPT process demonstrates the excellent effect of refining size and improving distribution on Pd particles, and the average Pd particle size significantly decreases from 200−300 nm to about 35 nm finally (schematic diagram of the whole process is shown in Figure 4). Furthermore, the degree of the particle agglomeration in the Pds–Mixed is also decreased compared to Pds-Des, which is expected to be advantageous for the catalytic performance of Pd electrocatalyst.
Figure 5 shows X-ray diffraction patterns (XRD) of carbon paper, Pds–Des, Pds–10 Hz, Pds–90 Hz and Pds–Mixed. It can be seen that Pds–Des, Pds–90 Hz and Pds–Mixed exhibit a similar pattern. Except for diffraction peaks at 54° (corresponding to the (004) plane of carbon), all other peaks are attributed to typical diffraction peaks of Pd. These peaks appear at 40°, 46°, 68°, 81° and 86°, which are related to the Pd(111), (200), (220), (311) and (222) facets, respectively. Moreover, XRD patterns of these three samples exhibit the growth orientation of the (111) crystal plane, which is because the surface free energy (γ) of three low index surfaces has a relationship of γ{111} < γ{100} < γ{110} [42]. Besides, Pds–10 Hz shows a similar pattern to carbon paper, which is due to the fact that most Pd particles are dissolved on the sample with SWPT at 10 Hz for 5 h. In addition, the relative peak intensity of the characteristic peak of Pd(111) of Pds–Des, Pds–90 Hz and Pds–Mixed compared to the (004) peak of carbon shows a gradual decrease trend, which is consistent with SEM results. Furthermore, the size of Pd particles in Pds–Mixed is 15 nm from the calculation of the XRD result, which is less than 35 nm (TEM result). This indicates that electrodeposited Pd particle is not dense, which is composed of several smaller particles.

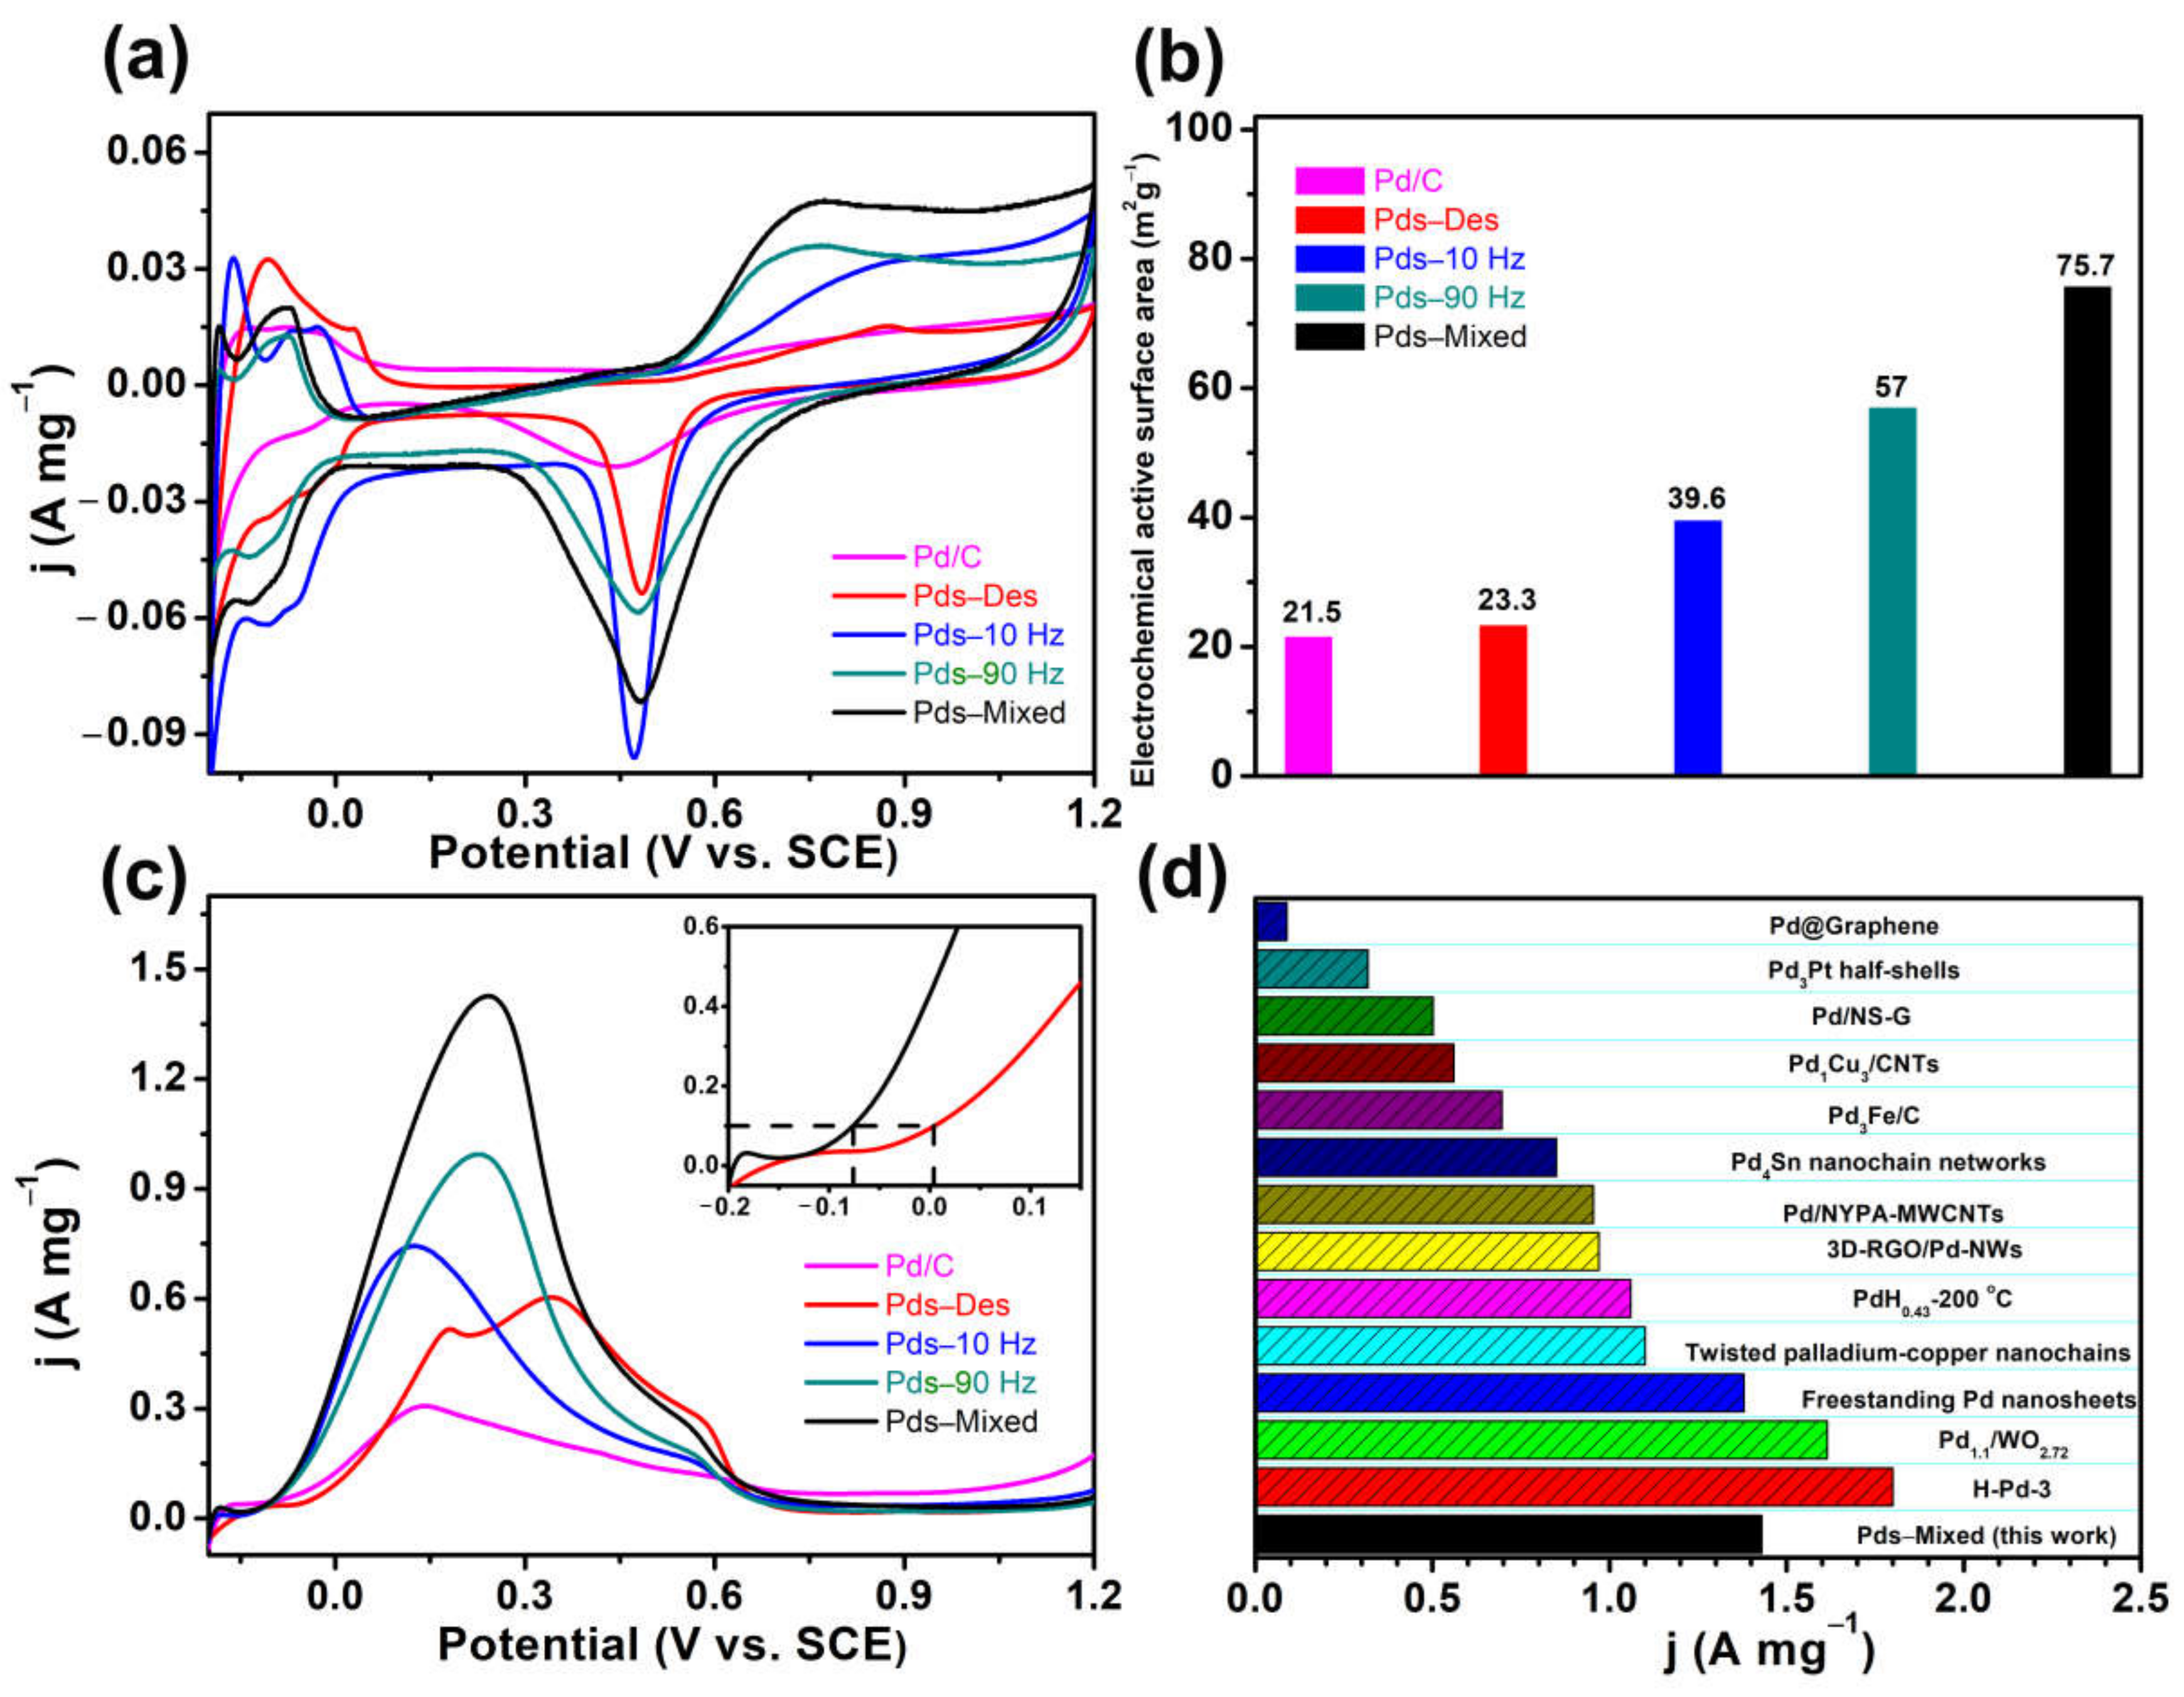
2.2. Electrochemical Results

To understand the effect of the size and the distribution of Pd particles on the electrocatalytic activity of electrocatalysts, Figure 6a shows the cyclic voltammograms (CVs) of different samples in the 0.5 M H2SO4 solution at a scan rate of 50 mV s−1. Besides, for the purpose of comparison, the CV curve of the commercial Pd/C (10 wt.% Pd loading) is obtained. To reveal the mass activity, all current is normalized by the Pd loading. As shown in Figure 6a, Pds–Mixed exhibits the largest area of oxygen adsorption peak (0.3−0.7 V, vs. saturated calomel electrode (SCE)). The oxygen adsorption peak is related to the electrochemical surface area (ECSA) of an electrode, which is an important parameter to evaluate the performance of an electrocatalyst. In general, a larger ECSA indicates a higher active surface area, and it can be calculated with the following equation [43]:
ECSA = Q/(0.424 × Pdm),
where the Q is the total charge for the O adsorption, the Pdm is the Pd loading on the electrode, and 0.424 mC cm−2 is the specific charge for a monolayer of O on Pd.
The ECSA calculation results are shown in Figure 6b. The ECSA of Pd/C, Pds–Des, Pds–10 Hz, Pds–90 Hz and Pds–Mixed are 21.5 m2 g−1, 23.3 m2 g−1, 39.6 m2 g−1, 57 m2 g−1 and 75.7 m2 g−1, respectively. This shows that Pd particles with smaller size and more dispersed distribution have higher ECSA.
The measurement of electrocatalytic performance toward FAO was carried out in a 0.5 M H2SO4 + 0.5 M HCOOH solution. As shown in Figure 6c, the peak current density of Pds–Mixed for FAO reaction reaches 1.43 A mg−1, and the counterpart of Pd/C, Pds–Des, Pds–10 Hz, Pds–90 Hz are about 0.31 A mg−1, 0.59 A mg−1, 0.74 A mg−1 and 0.99 A mg−1, respectively. The peak current density of Pds–Mixed also stays on high levels compared to state-of-the-art Pd-based electrocatalysts in terms of catalytic current density toward FAO (from Figure 6d and Table S1). Moreover, the redox peak of Pds–Mixed at about 0.24 V (vs. SCE) is ascribed to the direct dehydrogenation reaction (Pd + HCOOH → Pd + CO2 + 2H+ + 2e) [44,45]. This reaction mechanism indicates less production of CO, leading to a higher energy conversion efficiency and less catalyst poisoning. The onset potential (the value when the current density of a sample reaches 0.1 A mg−1) also characterizes the catalytic performance of Pd electrocatalysts, especially from a kinetics point of view [46]. It can be seen that the onset potential of Pds–Mixed is significantly lower than that of Pds–Des in Figure 6c, which illustrates that Pds–Mixed has more facile kinetics of FAO. The improved electrocatalytic performance of Pds–Mixed could be attributed to its small size and highly-dispersed distribution, which provides abundant active sites for electrocatalysis. By comparison, SEM and TEM images of Pd/C are shown in Figure S4. Obviously, the commercial Pd/C has smaller particle size (<10 nm. Figure S4c), which indicates larger physical surface area. However, the extra contact resistance and the increased “dead surface” due to the introduction of a polymer binder (Nafion) during the dripping method have a negative effect on the electrocatalytic activity [47]. Instead, the polymer binder is avoided during the electrochemical method in the present work, and Pd particles are all in the electrochemically active sites in the process of nucleation, growth, and modification. This leads to a larger ECSA, which results in a higher catalytic current density of electrocatalyst. Besides, the difference in diffusion restriction between commercial Pd/C and Pd/carbon paper is another factor affecting the electrocatalytic activity of FAO. Compared to Pd NPs localized in the volume of the formed porous layer on Pd/carbon paper, diffusion restriction of commercial Pd/C within the bulk porous layer is serious, which significantly affects the continuous contact between the reactant and Pd catalyst. This leads to a decrease of electrocatalytic performance for commercial Pd/C.
Figure 7 shows the chronoamperometric (CA) curves of FAO on all samples in 0.5 M H2SO4 + 0.5 M HCOOH solution. The initial current densities of Pds–Mixed, Pds–90 Hz, Pds–10 Hz, Pds–Des, Pd/C are 1.35 A mg−1, 1.04 A mg−1, 0.77 A mg−1, 0.63 A mg−1 and 0.79 A mg−1, respectively, which is close to the peak current densities toward FAO in Figure 6c. Moreover, the current densities of samples sharply decrease at the very initial stage which is related to the double-layer charging. Subsequently, controlled by the diffusion process, there is a gradual decay of current density owing to the consumed electroactive species near the electrode surface. [36]. When the test time reaches 1000 s, the current densities of Pds–Mixed and Pds–90 Hz are 0.24 A mg−1, 0.20 A mg−1, respectively, which are much higher than that of other samples The oxidation current densities of Pds–Mixed and Pds–90 Hz decreases to 18% and 19% of their initial value, which are also higher than other samples (about 2–7%). This indicates that by carefully designing the SWPT process, the size, morphology, and distribution of Pd NPs could be refined at the same time, thereby improving the electrocatalytic performance and stability of the Pd electrocatalysts.

3. Materials and Methods

3.1. Reagents and Materials

The following chemicals and materials are all commercially available and were used as received: PdCl2 (from Adamas Reagent Co.,Ltd., Shanghai, China), H2SO4 (from Tianjin Jiangtian Chemical Technology Co., Ltd., Tianjin, China), HCOOH (from Real&lead Chemical Co., Ltd., Tianjin, China), carbon paper (TGP-H-060, 0.19 mm thickness, from Toray), the commercial Pd/C (10 wt.% Pd, from Aladdin Industrial Corporation, Shanghai, China). Deionized water was obtained from an ultrapure system (18.2 MΩ cm, Milli-Q).

3.2. Reagents and Materials

Prior to use, the carbon paper was ultrasonically washed in ethanol, acetone and ethanol in turns, followed by being cleaned in deionized water by sonication and dried with a nitrogen stream. Pd particles were electrodeposited on the carbon paper by the constant current electrodeposition in 5 mM PdCl2 and 0.5 M H2SO4 at −0.15 mA cm−2 for 2700 s (Pds–Des). The electrodeposition was performed on an electrochemical workstation (IviumStat) with a three-electrode cell. A piece of carbon paper with an exposed geometry area of 1 cm2 was used as the working electrode. A mercury sulfate electrode (MSE) and a Pt plate were used as the reference and the counter electrode, respectively. After electrodeposition, the sample washed with deionized water was treated with the SWPT between 0.6 V and −3.2 V in 1 M H2SO4 solution. SWPT was performed on a bipolar DC power supply (NF BP4610) with a two-electrode cell. Pds-Des and a carbon rod acted as working electrode and the counter electrode, respectively. Moreover, a homogeneous suspension was prepared by mixing 10 mg of Pd/C, 970 μL of isopropanol, and 30 μL Nafion and dispersing using an ultrasonicator for 10 min. Then, 40 μL of the resulting suspension was dropped onto a previously cleaned surface of glassy carbon by micropipette and dried at room temperature. This electrode is called the Pd/C electrode which will be subsequently used as a substrate for the catalyst. The palladium mass fraction of electrolytically obtained Pd/carbon paper material was 0.3 wt.%, in which the weight of Pd and carbon paper (1 cm2) was 0.038 mg and 12.5 mg, respectively. The corresponding sample was composed of Pd particles treated by SWPT at a frequency of 10 Hz for 4 h and 90 Hz for 1 h. The palladium mass fraction of Pd/carbon paper samples treated by SWPT at 10 Hz and 90 Hz was 0.2 wt.% and 0.4 wt.%, respectively.

3.3. Reagents and Materials

To investigate the size and distribution of all samples, relevant characterizations were performed with a field emission scanning electron microscope (Hitachi S4800) and a high-resolution aberration-corrected transmission electron microscope (JEOL ARM200F). X-ray diffraction patterns were obtained on an X-ray diffractometer (D8 Advanced) with Cu Kα radiation. The amount of Pd loading on samples was calculated by the result of inductively coupled plasma-mass spectrometry (ICP-MS, Agilent 7700s). All electrochemical tests were carried out on the electrochemical workstation (IviumStat). A three-electrode system was also used, where prepared samples were used as the working electrode, a saturated calomel electrode and a Pt plate were used as the counter electrode and the reference electrode, respectively. The ECSA of samples was calculated from steady CV at 50 mV s−1 in 0.5 M H2SO4 solution. The electrocatalytic activity toward FAO was characterized by CV in 0.5 M HCOOH + 0.5 M H2SO4 at a scan rate of 50 mV s−1. All the solutions were deaerated with high-purity N2 gas (99.999%) for 30 min before use and throughout the test.

4. Conclusions

Pd NPs were successfully fabricated on carbon paper substrate using a two step electrodeposition–SWPT method without the use of capping agents. The influence of frequency and modification time of SWPT on the particle size and distribution of Pd NPs were systematically investigated. Tiny Pd NPs (<10 nm) are formed after SWPT with high frequency, while SWPT with low frequency mainly leads to the dissolution of the Pd particles. By adjusting the parameters of SWPT, the size and distribution of Pd particles could be effectively controlled. Pd NPs prepared via mix-frequency SWPT (Pds-Mixed) exhibit an optimal mass activity of 1.43 A mg−1 toward FAO, which is 4.6 times larger than that of commercial Pd/C. Moreover, it retains the highest current density (0.24 A mg−1) after 1000 s of CA test. The improved electrocatalytic activity of Pds-Mixed is attributed to the increment of ECSA originating from Pd NPs uniformly distributing on the carbon paper surface. These Pd NPs consist of intergrown Pd crystallites of a smaller size.

Supplementary Materials

The following are available online at https://0-www-mdpi-com.brum.beds.ac.uk/article/10.3390/catal11040522/s1, Figure S1: Chronoamperograms measured during electrodeposition at −0.15 mA cm−2 for 2700 s, Figure S2: (a) Low-magnification SEM image and (b) high-magnification SEM image of Pd particles electrodeposited for 2700 s at −0.30 mA cm−2; (c) low-magnification SEM image and d) high-magnification SEM image of Pd particles electrodeposited for 2700 s at −0.05 mA cm−2, Figure S3: (a) Low-magnification SEM image and b) high-magnification SEM image of Pd electrodeposited at −0.15 mA cm−2 for 2700 s on carbon paper and then treated by square-wave potential between 0.6 V and −3.2 V for 2 h with a frequency of 10 Hz in 1 M H2SO4 solution; (c) low-magnification SEM image and (d) high-magnification SEM image of Pd particles electrodeposited at −0.15 mA cm−2 for 2700 s and then square-wave potential between 0.6 V and −3.2 V for 4 h with a frequency of 10 Hz in 1 M H2SO4 solution, Figure S5: (a) low-magnification SEM image; (b) high-magnification SEM image; (c) TEM image of Pd/C, Table S1: Comparison between Pds–Mixed and state-of-the-art Pd-based catalysts in terms of catalytic current toward FAO.

Author Contributions

Conceptualization: F.L. and B.L.; methodology: B.L. and J.L.; validation: F.L.; formal analysis: F.L.; investigation: F.L.; data curation: F.L.; writing—original draft preparation: F.L.; writing—review and editing: B.L., Y.S. and C.Z.; visualization: F.L.; supervision: C.Z. and W.H.; project administration: C.Z. and W.H.; funding acquisition: J.L. and C.Z. All authors have read and agreed to the published version of the manuscript.

Funding

This research was funded by National Natural Science Foundation of China (51771134); Tianjin Natural Science Foundation for Distinguished Young Scholar (18JCJQJC46500); National Natural Science Foundation for Excellent Young Scholar (51722403); National Natural Science Foundation of China (51801134); Tianjin Natural Science Foundation (20JCQNJC01130); National Natural Science Foundation of China and Guangdong Province (U1601216); the National Youth Talent Support Program.

Data Availability Statement

Data is contained within the article or Supplementary Material.

Conflicts of Interest

The authors declare no conflict of interest.

References

  1. Larsen, R.; Ha, S.; Zakzeski, J.; Masel, R.I. Unusually active palladium-based catalysts for the electrooxidation of formic acid. J. Power Source 2006, 157, 78–84. [Google Scholar] [CrossRef]
  2. Shao, M.H.; Sasaki, K.; Adzic, R.R. Pd-Fe nanoparticles as electrocatalysts for oxygen reduction. J. Am. Chem. Soc. 2006, 128, 3526–3527. [Google Scholar] [CrossRef] [PubMed]
  3. Alegre, C.; Modica, E.; Lo Vecchio, C.; Siracusano, S.; Aricò, A.S.; Baglio, V. Pd supported on Ti-suboxides as bifunctional catalyst for air electrodes of metal-air batteries. Int. J. Hydrogen Energy 2016, 19579–19586. [Google Scholar] [CrossRef]
  4. Solis-Tobías, J.E.; Díaz-Guillén, J.A.; Meléndez-González, P.C.; Sánchez-Padilla, N.M.; Pérez-Hernández, R.; Alonso-Lemus, I.L.; Rodríguez-Varela, F.J. Enhanced catalytic activity of supported nanostructured Pd for the oxidation of organic molecules using γ-Fe2O3 and Fe3O4 as co-electrocatalysts. Int. J. Hydroggen Energy 2017, 42, 30301–30309. [Google Scholar] [CrossRef]
  5. Shen, T.; Zhang, J.; Chen, K.; Deng, S.; Wang, D. Recent progress of palladium-based electrocatalysts for the formic acid oxidation reaction. Energy Fuels 2020, 34, 9137–9153. [Google Scholar] [CrossRef]
  6. Chen, D.; Wang, Y.; Liu, D.; Liu, H.; Qian, C.; He, H.; Yang, J. Surface composition dominates the electrocatalytic reduction of CO2 on ultrafine CuPd nanoalloys. Carbon Energy 2020, 2, 443–451. [Google Scholar] [CrossRef] [Green Version]
  7. Li, M.; Xia, Z.; Huang, Y.; Tao, L.; Chao, Y.; Yin, K.; Yang, W.; Yang, W.; Yu, Y.; Guo, S. Rh-doped PdCu ordered intermetallics for enhanced oxygen reduction electrocatalysis with superior methanol tolerance. Acta Phys. Chim. Sin. 2020, 36, 1912049. [Google Scholar] [CrossRef]
  8. Liu, D.; Guo, Q.; Hou, H.; Niwa, O.; You, T. PdxCoy nanoparticle/carbon nanofiber composites with enhanced electrocatalytic properties. ACS Catal. 2014, 4, 1825–1829. [Google Scholar] [CrossRef]
  9. Ahmed, M.S.; Park, D.; Jeon, S. Ultrasmall PdmMn1-mOx binary alloyed nanoparticles on graphene catalysts for ethanol oxidation in alkaline media. J. Power Source 2016, 308, 180–188. [Google Scholar] [CrossRef]
  10. Shinde, V.M.; Skupien, E.; Makkee, M. Synthesis of highly dispersed Pd nanoparticles supported on multi-walled carbon nanotubes and their excellent catalytic performance for oxidation of benzyl alcohol. Catal. Sci. Technol. 2015, 5, 4144–4153. [Google Scholar] [CrossRef] [Green Version]
  11. Zhang, Y.; Yi, Q.; Zou, T.; Zhou, X.; Nie, H. In situ deposition of Pd nanoparticles on carbon paper and their electroactivity for ethanol oxidation. Ionics 2017, 23, 3169–3176. [Google Scholar] [CrossRef]
  12. Lu, Y.; Du, S.; Steinberger-Wilckens, R. Three-dimensional catalyst electrodes based on PtPd nanodendrites for oxygen reduction reaction in PEFC applications. Appl. Catal. B Environ. 2016, 187, 108–114. [Google Scholar] [CrossRef]
  13. Nguyen, D.L.T.; Kim, Y.; Hwang, Y.J.; Won, D.H. Progress in development of electrocatalyst for CO2 conversion to selective CO production. Carbon Energy 2020, 2, 72–98. [Google Scholar] [CrossRef] [Green Version]
  14. White, R.J.; Luque, R.; Budarin, V.L.; Clark, J.H.; Macquarrie, D.J. Supported metal nanoparticles on porous materials. Methods and applications. Chem. Soc. Rev. 2009, 38, 481–494. [Google Scholar] [CrossRef]
  15. Chen, X.; Wu, G.; Chen, J.; Chen, X.; Xie, Z.; Wang, X. Synthesis of “clean” and well-dispersive pd nanoparticles with excellent electrocatalytic property on graphene oxide. J. Am. Chem. Soc. 2011, 133, 3693–3695. [Google Scholar] [CrossRef]
  16. Ahmadi, T.S.; Wang, Z.L.; Green, T.C.; Henglein, A.; El-Sayed, M.A. Shape-controlled synthesis of colloidal platinum nanoparticles. Science 1996, 272, 1924–1926. [Google Scholar] [CrossRef]
  17. Ranjbar Bahadori, S.; Hart, R.; Hao, Y.W. Synthesis of cobalt, palladium, and rhenium nanoparticles. Tungsten 2020, 2, 261–288. [Google Scholar] [CrossRef]
  18. Bo Fang, L.F. PtCo-NC catalyst derived from the pyrolysis of Pt-incorporated ZIF-67 for alcohols fuel electrooxidation. Acta Phys. Chim. Sin. 2020, 36, 1905023. [Google Scholar] [CrossRef]
  19. Liu, Z.; Lee, J.Y.; Han, M.; Chen, W.; Gan, L.M. Synthesis and characterization of PtRu/C catalysts from microemulsions and emulsions. J. Mater. Chem. 2002, 12, 2453–2458. [Google Scholar] [CrossRef]
  20. Zheng, H.; Matseke, M.S.; Munonde, T.S. The unique Pd@Pt/C core-shell nanoparticles as methanol-tolerant catalysts using sonochemical synthesis. Ultrason. Sonochem. 2019, 57, 166–171. [Google Scholar] [CrossRef]
  21. Kou, J.; Bennett-Stamper, C.; Varma, R.S. Green synthesis of noble nanometals (Au, Pt, Pd) using glycerol under microwave irradiation conditions. ACS Sustain. Chem. Eng. 2013, 1, 810–816. [Google Scholar] [CrossRef]
  22. Hou, Y.; Chang, K.; Wang, Z.; Gu, S.; Liu, Q.; Zhang, J.; Cheng, H.; Zhang, S.; Chang, Z.; Lu, Z. Rapid microwave-assisted refluxing synthesis of hierarchical mulberry-shaped Na3V2(PO4)2O2F@C as high performance cathode for sodium & lithium-ion batteries. Sci. China Mater. 2019, 62, 474–486. [Google Scholar] [CrossRef] [Green Version]
  23. Fornander, H.; Birch, J.; Sandström, P.; Sundgren, J.E. Structure evolution of epitaxial Pd grown on MgO(001): A comparison between sputtering and electron-beam evaporation. Thin Solid Films 1999, 349, 4–9. [Google Scholar] [CrossRef]
  24. Liu, F.; Deng, Y.; Han, X.; Hu, W.; Zhong, C. Electrodeposition of metals and alloys from ionic liquids. J. Alloy. Compd. 2016, 654, 163–170. [Google Scholar] [CrossRef]
  25. Nasiri Vatan, H.; Mohammad Shafiee, M.; Khanfekr, A.; Laleh, M.; Kaffashan, H.; Jafarzadeh, K. Optimisation of experimental conditions for pulse electrodeposition of nanostructured platinum. Surf. Eng. 2014, 30, 89–96. [Google Scholar] [CrossRef]
  26. Lai, G.Q.; Liu, H.Z.; Chen, B.D.; Niu, D.; Lei, B.; Jiang, W.T. Electrodeposition of functionally graded Ni-W/Er2O3 rare earth nanoparticle composite film. J. Miner. Metall. Mater. 2020, 27, 818–829. [Google Scholar] [CrossRef]
  27. Wang, L.P.; Chen, G.; Shen, Q.X.; Li, G.M.; Guan, S.Y.; Li, B. Direct electrodeposition of ionic liquid-based template-free SnCo alloy nanowires as an anode for Li-ion batteries. J. Miner. Metall. Mater. 2018, 25, 1027–1034. [Google Scholar] [CrossRef]
  28. Li, S.; Chen, H.; Liu, J.; Deng, Y.; Han, X.; Hu, W.; Zhong, C. Size- and density-controllable fabrication of the platinum nanoparticle/ITO electrode by pulse potential electrodeposition for ammonia oxidation. ACS Appl. Mater. Interf. 2017, 9, 27765–27772. [Google Scholar] [CrossRef]
  29. Stankus, D.P.; Lohse, S.E.; Hutchison, J.E.; Nason, J.A. Interactions between natural organic matter and gold nanoparticles stabilized with different organic capping agents. Environ. Sci. Technol. 2011, 45, 3238–3244. [Google Scholar] [CrossRef]
  30. Yohannes, W.; Belenov, S.V.; Guterman, V.E.; Skibina, L.M.; Volotchaev, V.A.; Lyanguzov, N.V. Effect of ethylene glycol on electrochemical and morphological features of platinum electrodeposits from chloroplatinic acid. J. Appl. Electrochem. 2015, 45, 623–633. [Google Scholar] [CrossRef]
  31. Liu, J.; Hu, W.; Zhong, C.; Cheng, Y.F. Surfactant-free electrochemical synthesis of hierarchical platinum particle electrocatalysts for oxidation of ammonia. J. Power Source 2013, 223, 165–174. [Google Scholar] [CrossRef]
  32. Liu, J.; Wang, X.; Lin, Z.; Cao, Y.; Zheng, Z.; Zeng, Z.; Hu, Z. Shape-controllable pulse electrodeposition of ultrafine platinum nanodendrites for methanol catalytic combustion and the investigation of their local electric field intensification by electrostatic force microscope and finite element method. Electrochim. Acta 2014, 136, 66–74. [Google Scholar] [CrossRef]
  33. Hsieh, C.T.; Liu, Y.Y.; Roy, A.K. Pulse electrodeposited Pd nanoclusters on graphene-based electrodes for proton exchange membrane fuel cells. Electrochim. Acta 2012, 64, 205–210. [Google Scholar] [CrossRef]
  34. Kuntyi, O.; Shepida, M.; Dobrovetska, O.; Nichkalo, S.; Korniy, S.; Eliyashevskyy, Y. Pulse electrodeposition of palladium nanoparticles onto silicon in DMSO. J. Chem. 2019, 2019, 5859204. [Google Scholar] [CrossRef]
  35. Liu, J.; Chen, B.; Ni, Z.; Deng, Y.; Han, X.; Hu, W.; Zhong, C. Improving the electrocatalytic activity of Pt monolayer catalysts for electrooxidation of methanol, ethanol and ammonia by tailoring the surface morphology of the supporting core. ChemElectroChem 2016, 3, 537–551. [Google Scholar] [CrossRef]
  36. Liu, J.; Chen, B.; Kou, Y.; Liu, Z.; Chen, X.; Li, Y.; Deng, Y.; Han, X.; Hu, W.; Zhong, C. Pt-Decorated highly porous flower-like Ni particles with high mass activity for ammonia electro-oxidation. J. Mater. Chem. A 2016, 4, 11060–11068. [Google Scholar] [CrossRef]
  37. Toh, S.Y.; Loh, K.S.; Kamarudin, S.K.; Daud, W.R.W. Facile preparation of ultra-low Pt loading graphene-immobilized electrode for methanol oxidation reaction. Int. J. Hydrogen Energy 2018, 43, 16005–16014. [Google Scholar] [CrossRef]
  38. Ye, F.; Xu, C.; Liu, G.; Yuan, M.; Wang, Z.; Du, X.; Lee, J.K. Effect of pulse electrodeposition parameters on electrocatalytic the activity of methanol oxidation and morphology of Pt/C catalyst for direct methanol fuel cells. Energy Conv. Manag. 2018, 160, 85–92. [Google Scholar] [CrossRef]
  39. Visintin, A.; Canullo, J.C.; Triaca, W.E.; Arvia, A.J. Changes in real surface area, crystallographic orientation and morphology of platinum electrodes caused by periodic potential treatments: Phenomenological approach. J. Electroanal. Chem. 1988, 239, 67–89. [Google Scholar] [CrossRef] [Green Version]
  40. Perdriel, C.L.; Arvia, A.J.; Ipohorski, M. Electrochemical faceting of polycrystalline gold in 1 M H2SO4. J. Electroanal. Chem. 1986, 215, 317–329. [Google Scholar] [CrossRef] [Green Version]
  41. Tian, N.; Zhou, Z.Y.; Sun, S.G.; Ding, Y.; Zhong, L.W. Synthesis of tetrahexahedral platinum nanocrystals with high-index facets and high electro-oxidation activity. Science 2007, 316, 732–735. [Google Scholar] [CrossRef]
  42. Luo, W.; Hu, W.; Su, K.; Liu, F. The calculation of surface free energy based on embedded atom method for solid nickel. Appl. Surf. Sci. 2013, 265, 375–378. [Google Scholar] [CrossRef]
  43. Qiu, X.; Zhang, H.; Wu, P.; Zhang, F.; Wei, S.; Sun, D.; Xu, L.; Tang, Y. One-pot synthesis of freestanding porous palladium nanosheets as highly efficient electrocatalysts for formic acid oxidation. Adv. Funct. Mater. 2017, 27, 1603852. [Google Scholar] [CrossRef]
  44. Ding, J.; Liu, Z.; Liu, X.; Liu, B.; Liu, J.; Deng, Y.; Han, X.; Hu, W.; Zhong, C. Tunable periodically ordered mesoporosity in palladium membranes enables exceptional enhancement of intrinsic electrocatalytic activity for formic acid oxidation. Angew. Chem. Int. Edit 2020, 59, 5092–5101. [Google Scholar] [CrossRef]
  45. Shao, M.; Odell, J.; Humbert, M.; Yu, T.; Xia, Y. Electrocatalysis on shape-controlled palladium nanocrystals: Oxygen reduction reaction and formic acid oxidation. J. Phys. Chem. C 2013, 117, 4172–4180. [Google Scholar] [CrossRef]
  46. Ding, J.; Liu, Z.; Liu, X.; Liu, J.; Deng, Y.; Han, X.; Zhong, C.; Hu, W. Mesoporous decoration of freestanding palladium nanotube arrays boosts the electrocatalysis capabilities toward formic acid and formate oxidation. Adv. Energy Mater. 2019, 9, 1900955. [Google Scholar] [CrossRef]
  47. Zhang, G.; Lou, X.W. General solution growth of mesoporous NiCo2O4 nanosheets on various conductive substrates as high-performance electrodes for supercapacitors. Adv. Mater. 2013, 25, 976–979. [Google Scholar] [CrossRef]
Figure 1. (a) Low-magnification scanning electron microscope (SEM) image and (b) high-magnification SEM image of Pd particles electrodeposited for 2700 s at −0.15 mA cm−2 (Pds−Des).
Catalysts 11 00522 g001
Figure 2. (a) Low-magnification SEM image and (b) high-magnification SEM image of Pd electrodeposited at −0.15 mA cm−2 for 2700 s on carbon paper and then treated by square-wave potential between 0.6 V and −3.2 V for 5 h with a frequency of 10 Hz in 1 M H2SO4 solution (Pds−10 Hz); (c) the corresponding schematic diagram of Pd2+ ions movement during a complete EU–EL process at 10 Hz; (d) low-magnification SEM image and (e) high-magnification SEM image of Pd particles electrodeposited at −0.15 mA cm−2 for 2700 s and then modified by square-wave potential between 0.6 V and −3.2 V for 5 h with a frequency of 90 Hz in 1 M H2SO4 solution (Pds−90 Hz); and (f) the corresponding schematic diagram of Pd2+ ions movement during a complete EU–EL process at 90 Hz.
Catalysts 11 00522 g002
Figure 3. (a) Low-magnification SEM image, (b) high-magnification SEM image, (c) transmission electron microscope (TEM) image and (d) high-resolution TEM (HRTEM) image of Pd particles electrodeposited at −0.15 mA cm−2 for 2700 s and then treated by the square-wave potential of 10 Hz for 4 h and followed by 90 Hz for 1 h between 0.6 V and –3.2 V in 1 M H2SO4 (Pds−Mixed).
Catalysts 11 00522 g003
Figure 4. Schematic diagram of generation of Pds–Mixed.
Catalysts 11 00522 g004
Figure 5. X-ray diffraction patterns (XRD) image of different samples including carbon paper, Pds–Des, Pds–10 Hz, Pds–90 Hz, Pds–Mixed.
Catalysts 11 00522 g005
Figure 6. (a) Cyclic voltammograms of Pd/C, Pds–Des, Pds–10 Hz, Pds–90 Hz, Pds–Mixed in N2-saturated 0.5 M H2SO4 solution at a scan rate of 50 mV s−1. (b) Calculated ECSA values based on the cyclic voltammograms (CV) curves in (a). (c) Mass activity of Pd/C, Pds–Des, Pds–10 Hz, Pds–90 Hz, Pds–Mixed in 0.5 M HCOOH + 0.5 M H2SO4 solution at a scan rate of 50 mV s−1. (d) Comparison between Pds–Mixed and state-of-the-art Pd-based electrocatalysts in terms of catalytic current toward formic acid oxidation (FAO).
Catalysts 11 00522 g006
Figure 7. Chronoamperometric curves of FAO on Pd/C, Pds–Des, Pds–10 Hz, Pds–90 Hz, Pds–Mixed in 0.5 M HCOOH + 0.5 M H2SO4 solution at 0.15 V for 3000 s.
Catalysts 11 00522 g007
Publisher’s Note: MDPI stays neutral with regard to jurisdictional claims in published maps and institutional affiliations.

