Article

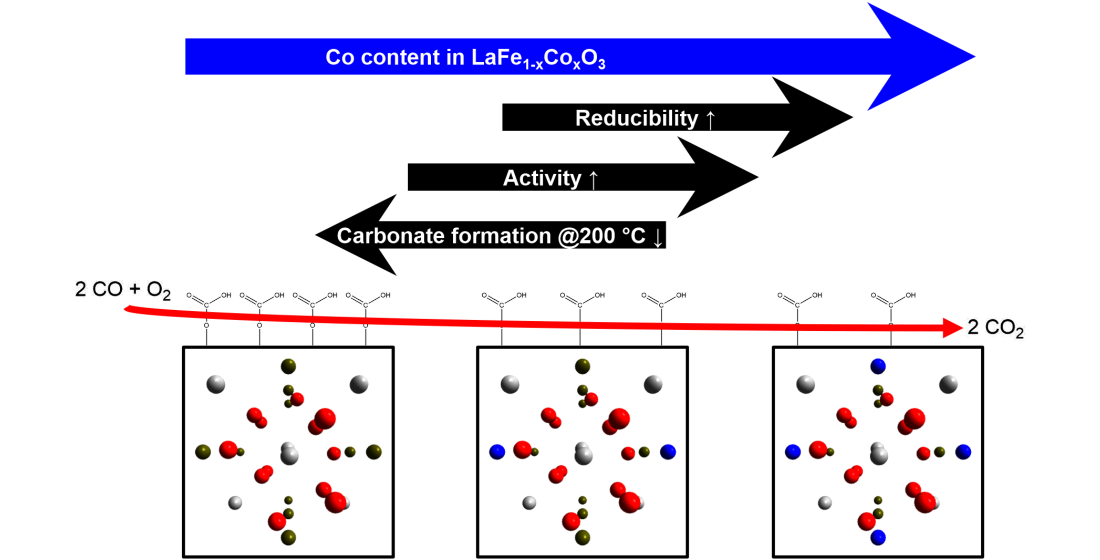
The Effect of Co Incorporation on the CO Oxidation Activity of LaFe1−xCoxO3 Perovskites

1
Faculty for Chemistry, Inorganic Chemistry, University of Duisburg-Essen, 45141 Essen, Germany
2
Institute for Inorganic Chemistry, Christian-Albrechts-Universität zu Kiel, 24118 Kiel, Germany
3
CENIDE, Center for Nanointegration, University of Duisburg-Essen, 47057 Duisburg, Germany
*
Author to whom correspondence should be addressed.
Submission received: 31 March 2021 / Revised: 23 April 2021 / Accepted: 26 April 2021 / Published: 27 April 2021
(This article belongs to the Special Issue Surface Design of Metal Oxide Catalysts)

Abstract

:
Perovskite oxides are versatile materials due to their wide variety of compositions offering promising catalytic properties, especially in oxidation reactions. In the presented study, LaFe1−xCoxO3 perovskites were synthesized by hydroxycarbonate precursor co-precipitation and thermal decomposition thereof. Precursor and calcined materials were studied by scanning electron microscopy (SEM), attenuated total reflection Fourier transform infrared spectroscopy (ATR-FTIR), thermogravimetric analysis (TG), and X-ray powder diffraction (XRD). The calcined catalysts were in addition studied by transmission electron microscopy (TEM) and N2 physisorption. The obtained perovskites were applied as catalysts in transient CO oxidation, and in operando studies of CO oxidation in diffuse reflectance infrared Fourier transform spectroscopy (DRIFTS). A pronounced increase in activity was already observed by incorporating 5% cobalt into the structure, which continued, though not linearly, at higher loadings. This could be most likely due to the enhanced redox properties as inferred by H2-temperature programmed reduction (H2-TPR). Catalysts with higher Co contents showing higher activities suffered less from surface deactivation related to carbonate poisoning. Despite the similarity in the crystalline structures upon Co incorporation, we observed a different promotion or suppression of various carbonate-related bands, which could indicate different surface properties of the catalysts, subsequently resulting in the observed non-linear CO oxidation activity trend at higher Co contents.

Graphical Abstract

1. Introduction

Perovskites ABO3 are exciting materials for oxidation catalysis as they provide considerable flexibility regarding their compositions and the possibility to implement oxygen vacancies with a selective modification of the cationic sublattice [1,2,3]. The potential use of perovskites in catalysis is extensive as they can be employed, e.g., in oxygen reduction [4], oxygen evolution [5], CO and hydrocarbon gas-phase oxidation [6], total oxidation of Volatile Organic Compounds (VOC) [7], or selective oxidation of substrates like benzyl alcohol [8] or cinnamyl alcohol [9]. These materials are accessible through a variety of synthetic approaches, such as ceramic methods [10,11], complexation with, e.g., citric acid followed by thermal decomposition [12,13], freeze-drying [14], spray-flame synthesis [15,16], or co-precipitation at increasing pH [17], decreasing pH [18], with manually adjusted constant pH [19] or automatically controlled constant pH [20]. Often, precursor compounds are formed at low temperatures. For crystallization of the material, thermal treatment of at least 500 °C is necessary [1]. Perovskite oxides with lanthanum (La) as the A-site cation and cobalt (Co) and iron (Fe) as the B-site cations have been synthesized via thermal decomposition of propionates [21], the Pechini method [22], or the sol-gel approach [23]. The synthesis of LaFexCo1−xO3 via co-precipitation assisted by microwaves has been reported [24]. Another synthesis route to LaFeO3 follows a solid-state reaction between Ancylite (La2(CO3)2(OH)2) and Fe2O3 [25].
Since Fe and Co are abundant elements, there is motivation to incorporate them as B-site cations in perovskites to obtain active and thermally stable catalysts that do not require noble metals. Furthermore, the perovskite structure is tolerant to the formation of anionic and cationic vacancies, which can tune the catalytic properties of the materials. It has been shown that an increasing Co content in LaFe1−xCoxO3 perovskites leads to enhanced catalytic activity, e.g., in VOC oxidation [7,26], soot combustion [27], and exhaust gas decomposition [23]. In NO and N2O containing atmosphere, a pronounced effect of incorporating Co into the perovskite structure has been found, but there was no linear scaling of the activity in N2O conversion with the Co content for a NO concentration of 0.5% in the feed. In a feed containing a tenfold higher NO concentration, however, sucha trend was observable with LaCo0.8Fe0.2O3 being the most active catalyst [23].
The oxygen activation and dissociation capabilities at perovskite surfaces are strongly correlated to the composition and number of oxygen vacancies [28,29]. It has been shown that such vacancies can promote the formation of monoatomic oxygen (O), which would act as the primary type of oxygen in the system [30]. One straightforward approach to determine catalytic activity and oxygen activation capability is the CO oxidation reaction as a prototypical reaction for heterogeneous processes [31]. The reaction only has a single gaseous product, which interacts with metal oxides either strongly or weakly. For Co3O4, no adsorption of CO2 on the surface was found [32], whereas an adsorption capacity has been reported for Al2O3 [33]. Furthermore, this reaction pathway is involved in the total oxidation mechanism of hydrocarbons and oxygenated molecules, which leads to a decrease in selectivity towards valuable intermediates. The effect of Co incorporation into oxides and LaFeO3 perovskite on CO oxidation catalysis has also attracted attention. For example, including only 1% Co has been shown to increase the CO oxidation activity of NiO significantly, but no steady conversion increase with Co incorporation has been observed [34]. On Sr- and Co-doped LaFeO3, extrema at intermediate Co level were observed for transition metal surface content, oxygen storage capacity, reducibility, and methanol oxidation activity [35].
In this work, we report on the synthesis of a series of LaFe1−xCoxO3 perovskites with 0 ≤ x ≤ 0.30 derived from amorphous precursors containing the corresponding Fe:Co ratios. The catalysts were prepared by constant-pH co-precipitation according to a procedure previously reported [20]. Furthermore, we systematically studied the activities of the synthesized materials in CO oxidation. We tracked the product evolution during CO oxidation by operando diffuse reflectance infrared Fourier transform spectroscopy (DRIFTS) to gain insights into changes of the surface properties induced by Co incorporation.

2. Results

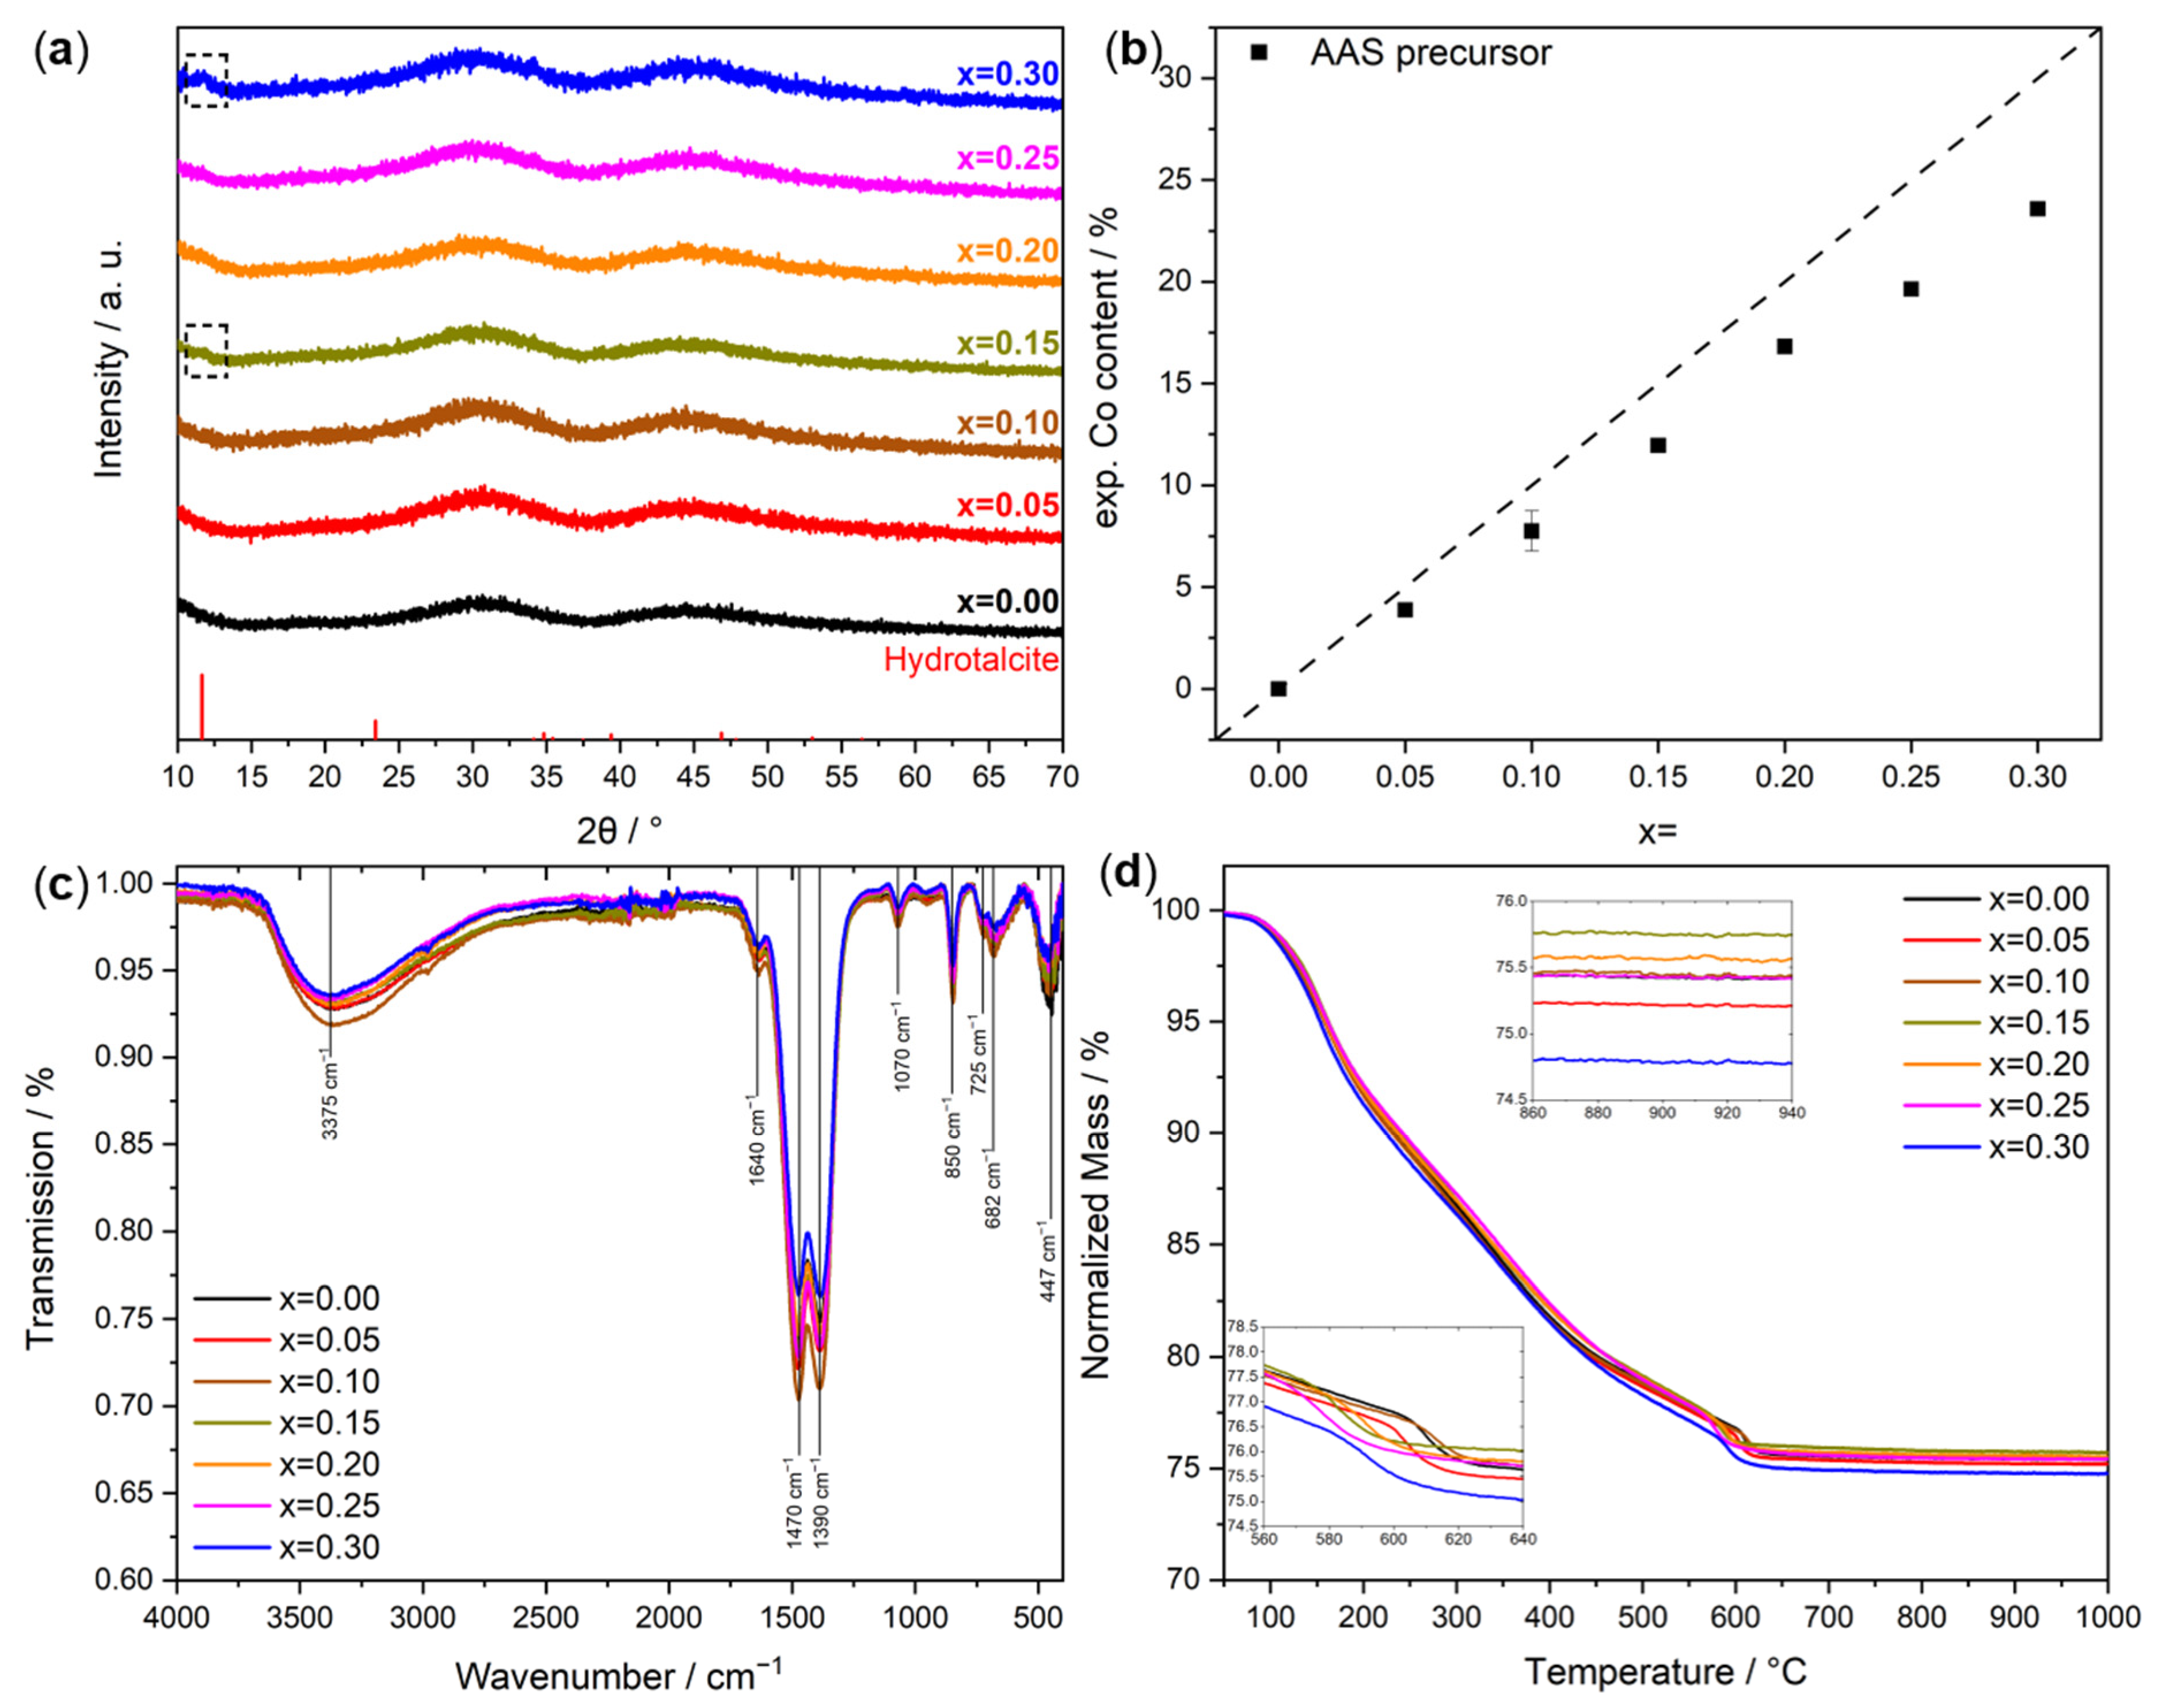
2.1. Co-Precipitation and Precursor Characterization

Syntheses were conducted in a semi-automatized laboratory workstation for co-precipitation, and the parameters were precisely controlled. Computer-controlled simultaneous dosing of the metal salt solution and the basic precipitating agent allowed to maintain a constant pH during co-precipitation. Temperature, pH, and dosage of the metal salt solution were monitored. The corresponding synthesis protocols of the series during co-precipitation are displayed in Figures S1–S7 in the Supplementary Material. The pH values at the beginning of the dosing showed a small offset, which decreased with time as the buffer system was formed in the suspension. Figure 1a shows an exemplarily SEM image of the washed and dried co-precipitate with x = 0.05. An overview of SEM images of the complete sample series is shown in Figure S8. Aggregates of small and relatively uniform spherical particles in the 50–60 nm range are visible, although the particles in the calcined samples appear to be sintered to some extent. The sample morphology can be described as a sponge-like network (also note the similarity between the x = 0.20 and 0.30 despite having different Co contents). An increase of the Co content beyond a threshold of x = 0.10 favors the formation of larger plate-like structures with sizes of 100–300 nm, which is shown as an example for x = 0.15 with arrows pointing towards anisotropic regions in Figure 1b.
The X-ray powder patterns of the co-precipitated particles are shown in Figure 2a. The particles are X-ray amorphous as similarly reported for a hydroxycarbonate precursor employed in the synthesis of co-precipitated precursors used to obtain LaNiO3 [19]. With increasing Co content, already at a nominal value of x = 0.10, a hydrotalcite-like structure is additionally formed as inferred from the low-intensity (003) reflection of the CoFe-hydrotalcite at 2θ = 12° (ICSD reference for MgAl-LDH: 6296 [36]), which is more pronounced for sample x = 0.30. This observation is well in line with larger plate-like structures encountered during SEM analysis. However, based on the weak intensity of the (003) reflection, the total amount of the impurity is considerably low. This finding is supported by the negligible fraction of hexagonal platelet structures encountered in a minority of the SEM images. The actual Co contents in the precipitates determined by AAS are lower than the nominal values, as shown by the parity plot Figure 2b. As this deviation scales with the Co content, a possible cause is an under-estimated degree of hydration of the Co nitrate salt used in the synthesis resulting in a systematic error during the reactant weighing.
In ATR-FTIR spectroscopy shown in Figure 2c, characteristic absorption bands of hydroxyl and carbonyl groups can be seen as comparable to those found for La(OH)CO3 in literature [37]. The broad band at 3375 cm−1 corresponds to stretching and bending vibrations of hydroxyl groups, whereas the band at 1640 cm−1 is representative for molecular interlayer water molecules [38]. Carbonate ion modes are present at 1070 cm−1 (ν1), 850 cm−1 (ν2), 1470 and 1390 cm−1 (ν3) as well as 730 to 690 cm−1 (ν4) [37,38]. Below 700 cm−1, the vibrations of hydroxide and oxide bonds can be seen [39]. In Figure S9a, the wavenumbers at the position of the corresponding transmission minimum are displayed. A steady shift towards higher wavenumbers with increasing Co content is visible at around 447 cm−1. However, x = 0.15 is an outlier featuring the lowest wavenumber of the minimum. In literature, a similar trend is found for Co-Fe-hydroxycarbonates which is explained by a weaker force constant of the Co(II)-O bond compared to the Fe(III)-O bond [39]. With increasing Co content, the intensity at the transmission minimum in the M-OH and M-O region (<580 cm−1) remains nearly constant, as can be seen in Figure S9b.
Thermogravimetric analysis of the precursors in a 21% O2/Ar atmosphere is shown in Figure 2d. A steady mass loss can be seen for all samples attributed to the evolution of H2O followed by a two-step CO2 formation, as reported by Kühl et al. [20]. The last abrupt mass loss was attributed to a sharp CO2 evolution in the temperature range of 580 °C to 620 °C depending on the Co content. The mass remains stable above 650 °C with an overall mass loss of about 25%. No extra mass loss indicating the formation of a secondary phase upon calcination is detected. Even for the highest Co content (x = 0.30), no characteristic mass loss at 900 °C for the thermal reduction of a potential Co3O4 by-phase to CoO can be seen [40].

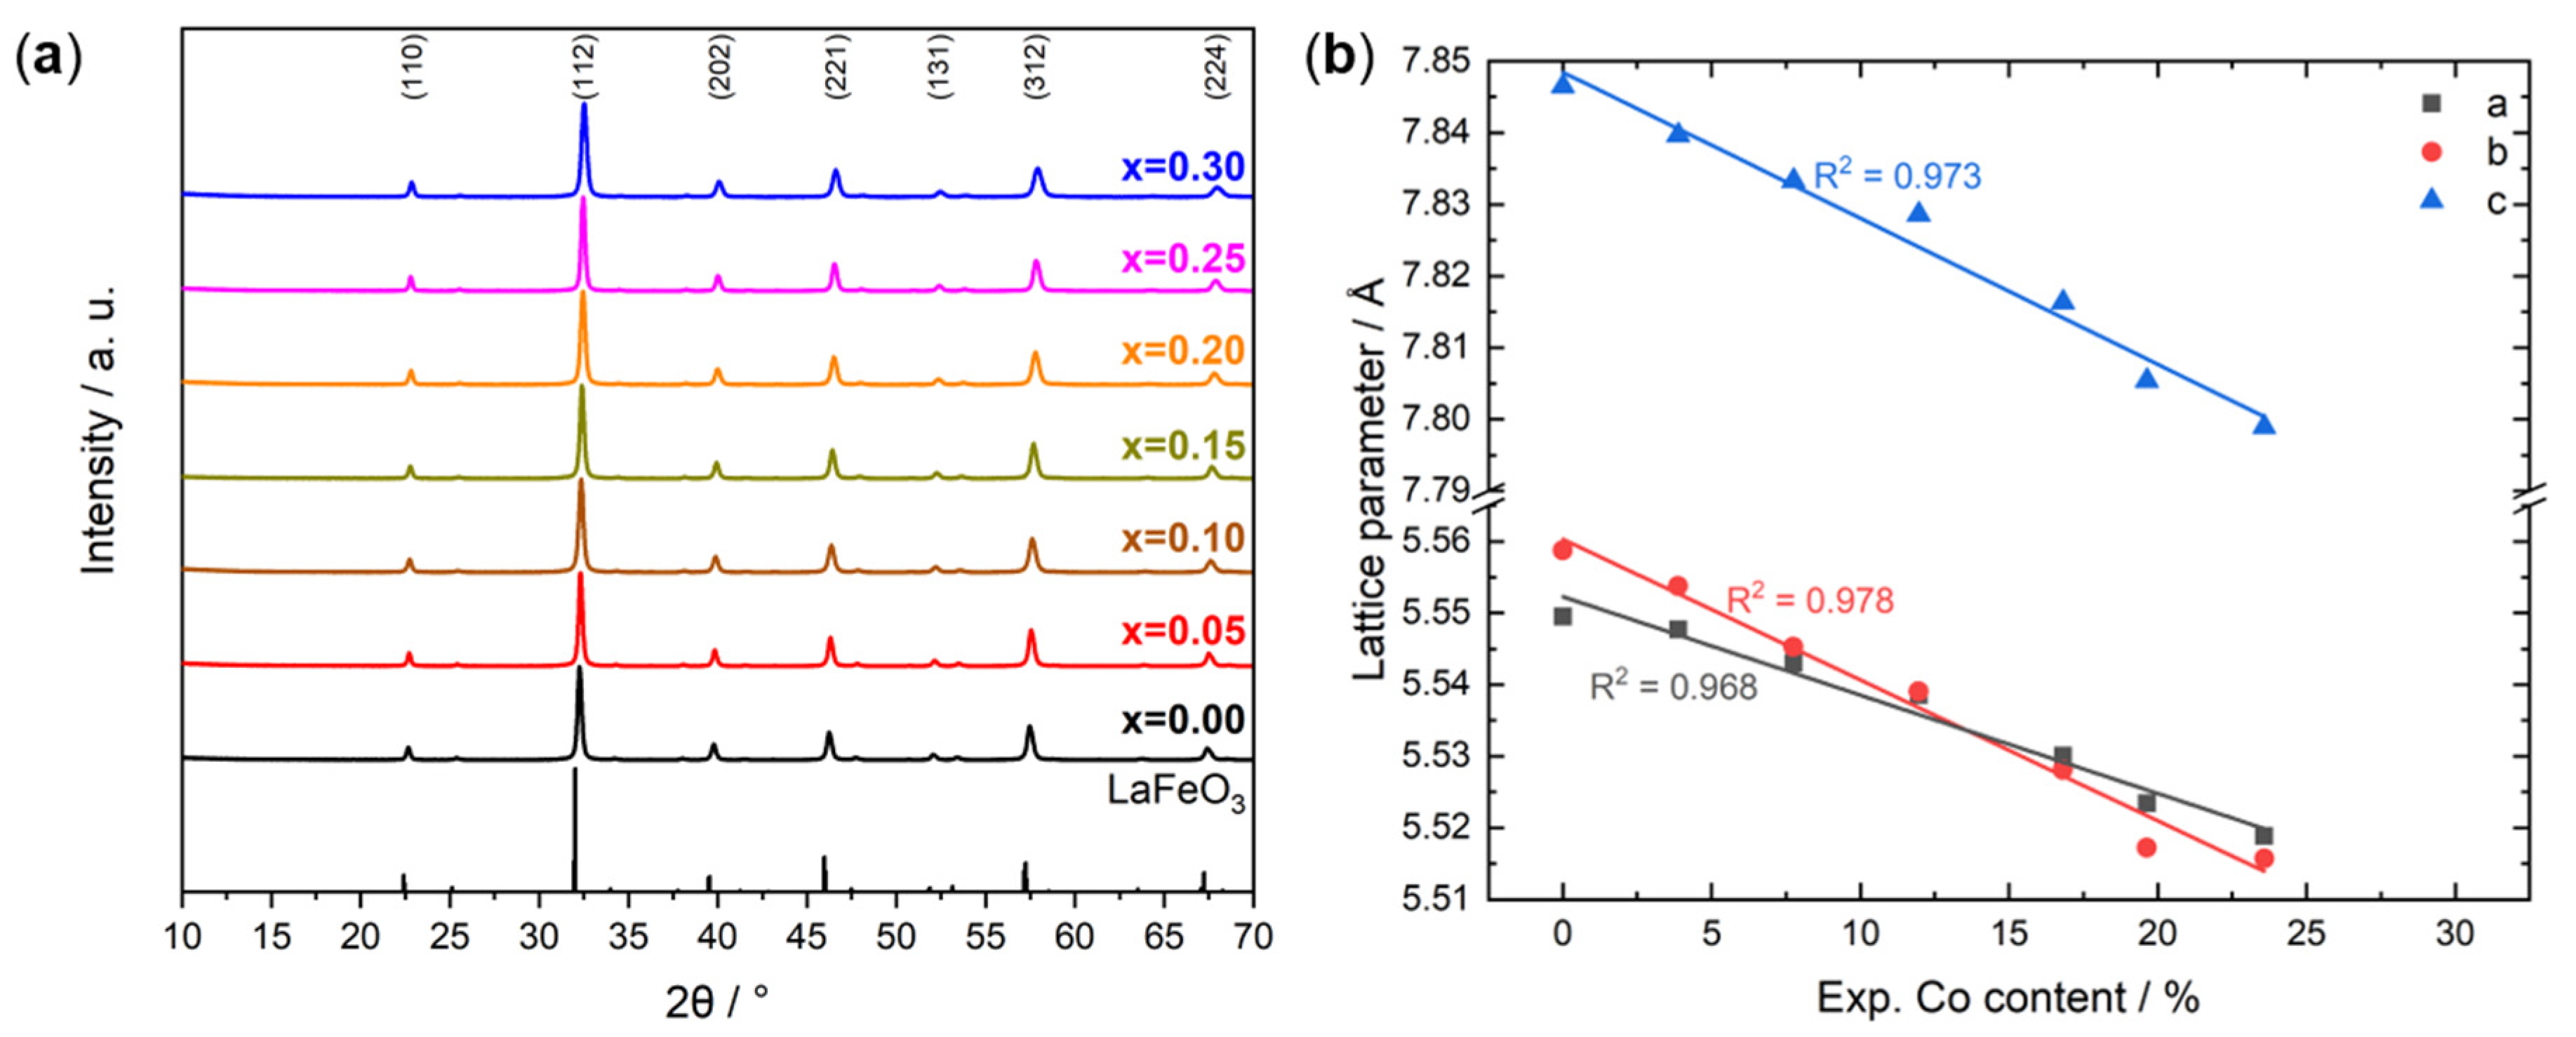
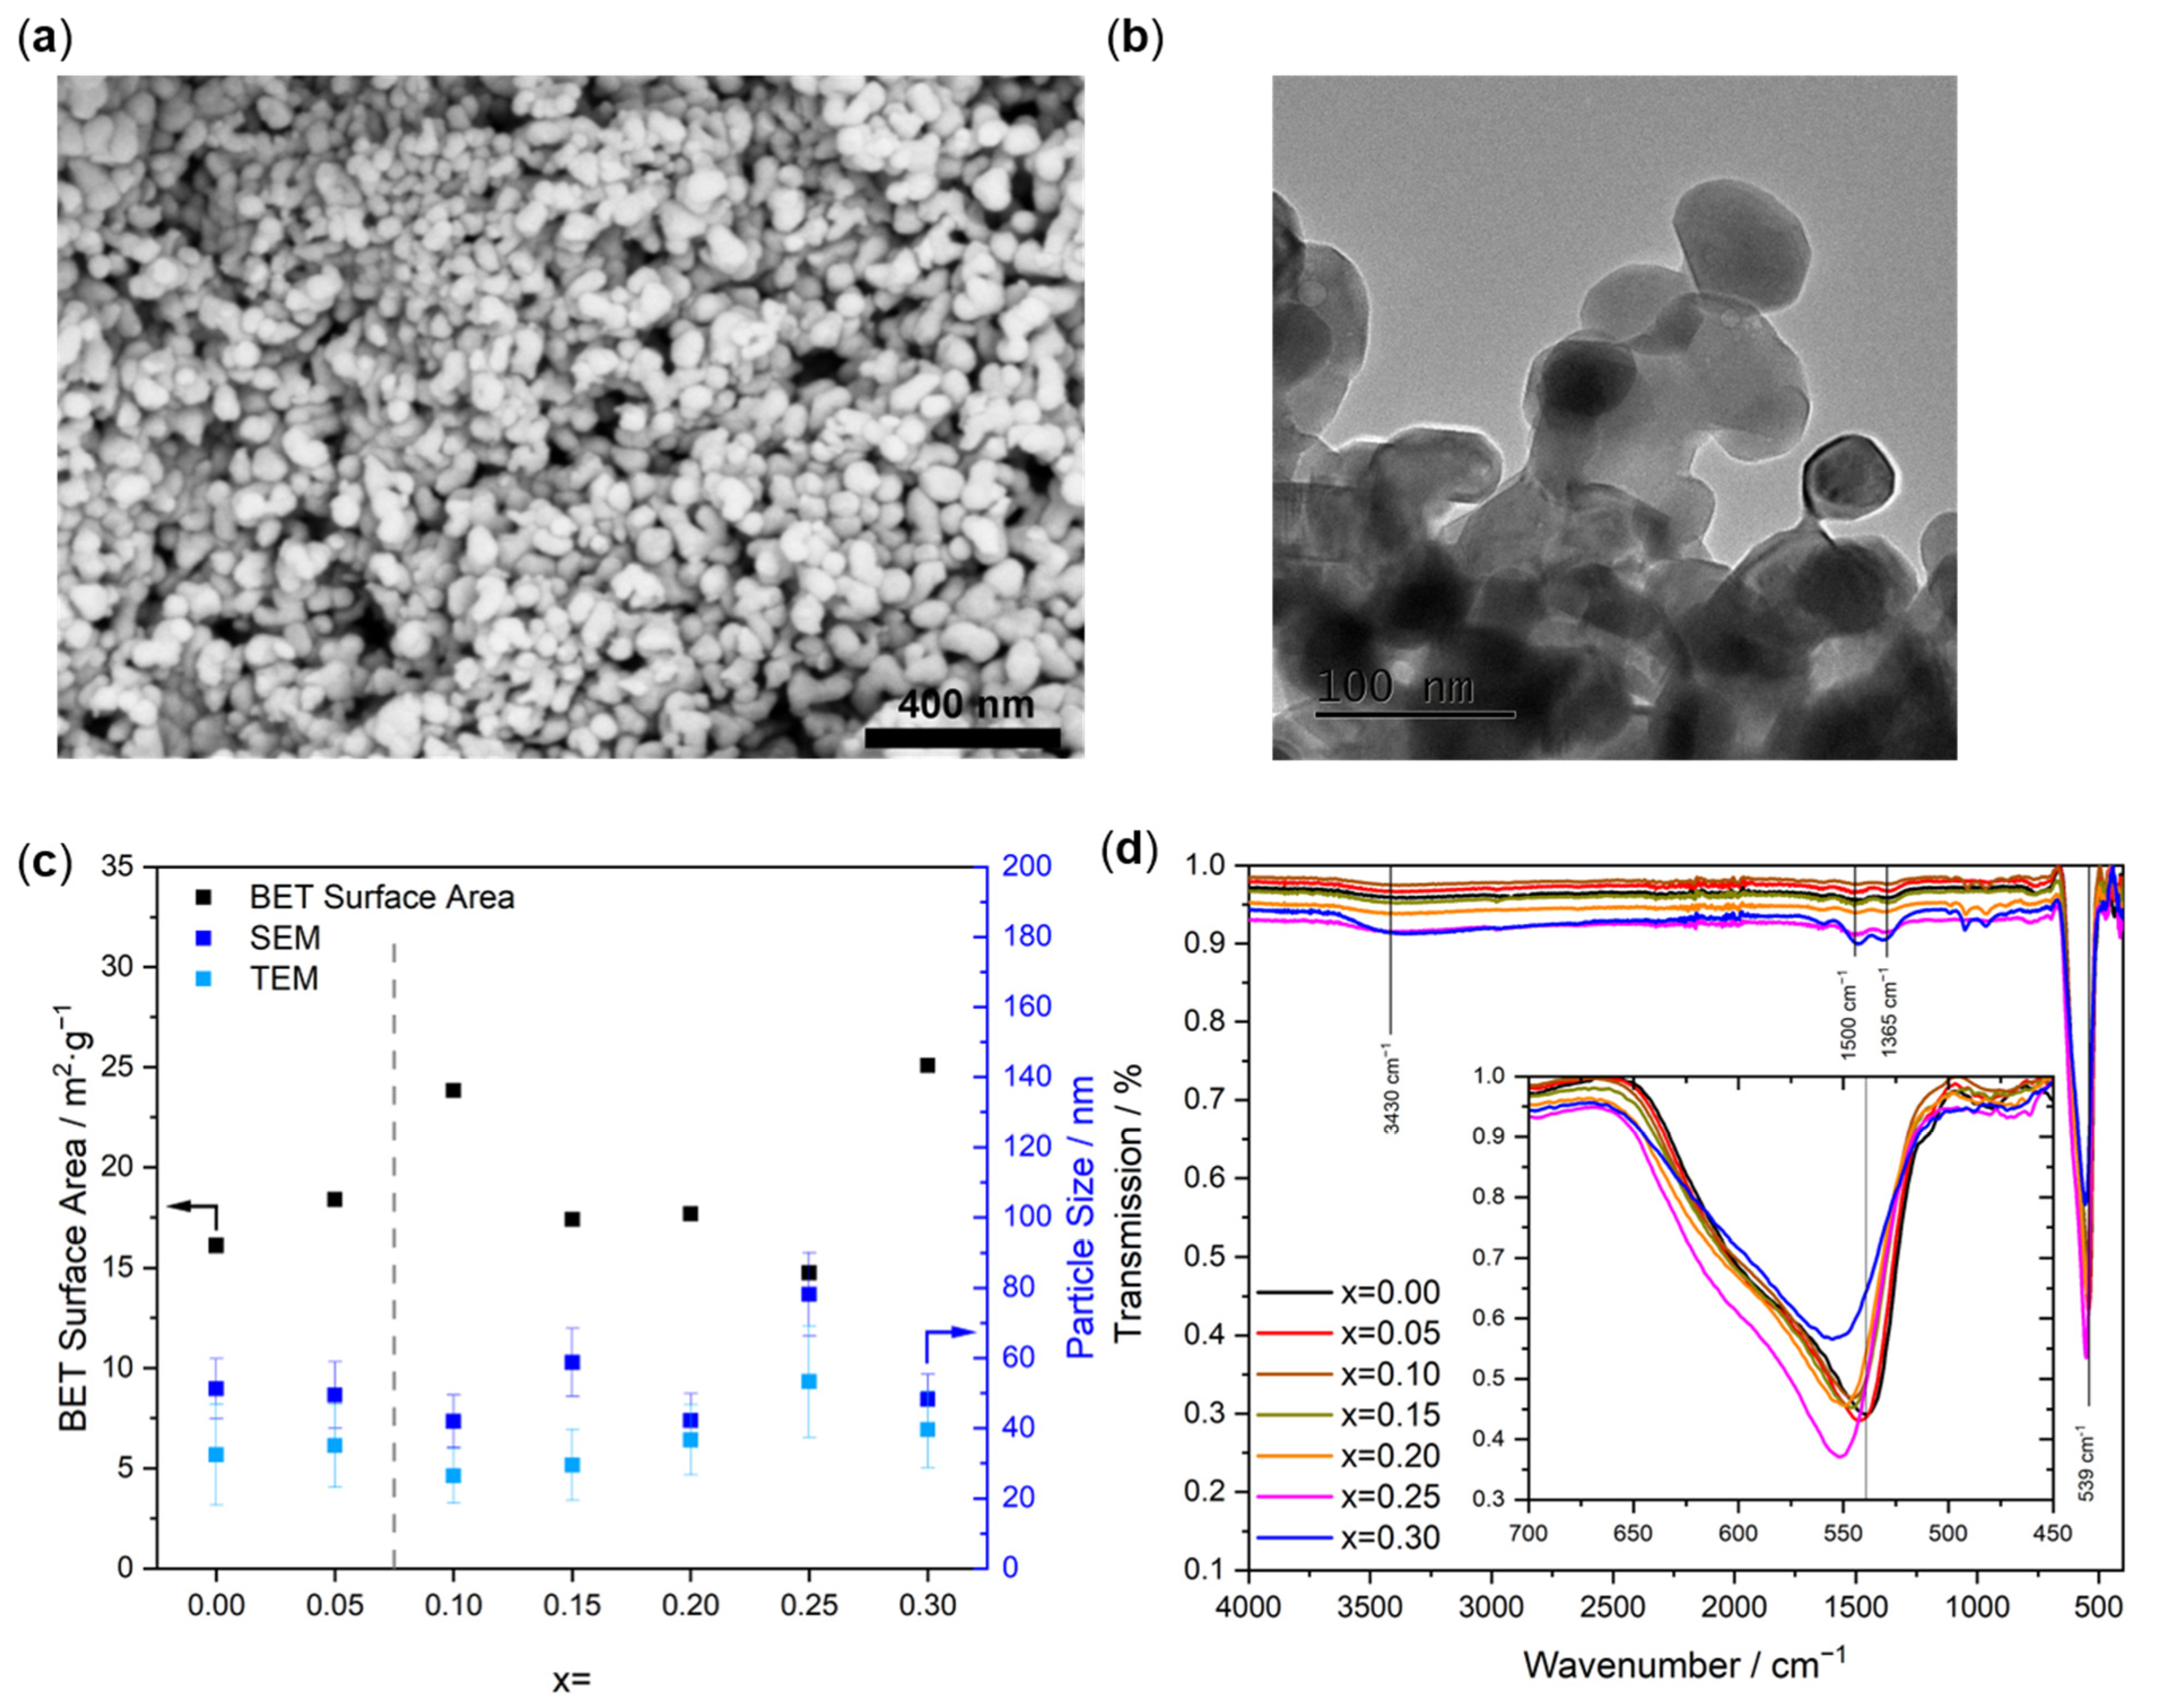
2.2. Catalyst Characterization

After thermal decomposition of the amorphous precursors during calcination at 800 °C, XRD powder patterns were recorded. The corresponding diffractograms, shown in Figure 3a, are compared to orthorhombic LaFeO3 (ICSD: 93611 [41]) with indications of the most intensive (hkl) assignments. The patterns can be fully described by the one calculated for the perovskite structure, which further confirms the absence of secondary crystalline phases. The reflections are shifted to higher angles with increasing Co content, which is indicative of the incorporation of Co into the crystal structure. This is related to replacing Fe accompanied by a decrease of the d-spacing associated with the smaller effective ionic radius of low-spin Co3+ (0.545 Å) compared to Fe3+ (0.645 Å) in the high-spin configuration [42], which in the latter case is the ground state electronic structure of octahedrally coordinated trivalent Fe cations in LaFeO3 [43]. The formation of phase-pure perovskites from non-phase-pure materials is known, which is relevant to consider in view of the hydrotalcite-like by-phase encountered for higher Co contents in the precursor stage. For example, the formation of phase-pure LaFeO3 was reported as well from Fe2O3 and La2(CO3)2(OH)2 [25]. As the homogeneity of the amorphous precursor is unknown, and a hydrotalcite-like by-phase was observed in some samples, perovskite formation from a multi-phase precursor system must also be assumed for our synthesis approach.
A plot of the lattice parameters derived from Rietveld refinement [44] with increasing Co content is shown in Figure 3b. The encountered trend is in line with the qualitative analysis of changes in the d-spacing upon isomorphic transition metal cation substitution. As expected, lattice parameters decrease monotonously with increasing the degree of Co substitution, which is in agreement with Vegard’s law [21,23]. Meanwhile, the refinement results are reported in Table 1. The crystallite size was determined as the volume-weight mean column height from integral breadth, the obtained sets of Rietveld fit parameters are summarized in Table S1. The corresponding plots are shown in Figure S10. This quantitative analysis further supports the phase purity of the samples.
The mostly spherical particle morphology remains unchanged upon calcination, as confirmed by SEM analysis. Figure 4a shows the isotropic character of the particles corresponding to sample x = 0.05, which have a mean diameter of 50 nm. This value is in good agreement with the crystallite size derived from XRD analysis. Differences are still to be expected as the calculated values are attributed to the size of the coherently diffracting domains, which are not necessarily equal to the crystallite size. SEM images of the entire sample series in the as-prepared and calcined state are shown in Figure S8. After calcination, the samples still show a spongy morphology, but x = 0.25 had a slightly more sintered structure, while x = 0.20 and x = 0.30 maintain their visual similarity. The corresponding particle size distributions in the calcined state are depicted in Figure S11. The particles appear to be partially sintered after calcination, which is also visible in the TEM image of sample x = 0.05 (Figure 4b). TEM images of the perovskite series are summarized in Figure S12. Particle size distributions derived from a detailed TEM evaluation are depicted in Figure S13. The analysis shows that the mean particle size changes, although the broadening of the statistical distribution is comparable within the sample series.
Evidently, the individual roundish particles are not dispersed but appear fused due to sintering. HR-TEM analysis (Figure S12) further confirms the high degree of crystallinity of the obtained perovskites as expected from the sharp reflections in the corresponding XRD patterns. The particles mostly exhibit isotropic faceted shapes.
The average particle sizes determined by SEM and TEM are shown in Figure 4c. The diameters are similar for all samples, with systematically slightly larger values seen in SEM. Evidently, the mean particle size is not affected by the isomorphic substitution of Fe with Co into the crystal structure. TEM particle sizes are in the range of 30 nm to 53 nm, whereas the SEM particle size is determined in a range from 48 to 70 nm. The difference might be an effect of the lower resolution of the SEM image, making a differentiation between single and fused particles challenging. The BET surface areas are inversely following the differences in particle sizes as observed in SEM and TEM, indicating low porosity of the agglomerates. Nitrogen adsorption-desorption isotherms, which are characterized by a type IVa hysteresis loop, are shown in Figure S14. The corresponding pore size distributions, which were obtained applying the BJH method on the desorption branch of the isotherms, are depicted in Figure S15. A bimodal pore size distribution can be seen with some minor pores inside the particles and the majority of the pores in the range of 20 nm, indicating mainly interparticle voids. The sample with x = 0.10 shows the smallest particle size and the second highest BET surface area of around 24 m2 g−1.
ATR-FTIR spectra of the perovskites are depicted in Figure 4d, showing the remaining hydroxide (3430 and 1500 cm−1) and carbonate bands (1365 cm−1) [37,38]. As TG in Figure 2d did not show any mass loss at higher temperatures than 800 °C, these bands can be attributed to the re-adsorption of H2O and CO2 from the atmosphere. Samples x = 0.10, x = 0.20 and x = 0.30 show additional bands at 1050 cm−1. In the metal oxide vibration region, the bands became more pronounced below 600 cm−1 than before the thermal treatment. The maximum for the LaFeO3 perovskites is observed at 539 cm−1 and confirms the presence of FeO6 octahedra and their characteristic Fe-O stretching vibration. The maximum band position is shifted to higher wavenumbers with increasing Co content in the calcined state, as displayed in Figure S9a. The shift indicates a distortion in the orthorhombic perovskite structure upon introducing Co3+ ions, which affects the Fe-O bond strength [45]. The bond strength argument is backed up by temperature-programmed reduction (H2-TPR). The reduction of Fe3+ to Fe0 in LaFeO3 is described in the literature as a two-step mechanism that takes place at temperatures above 800 °C [46]. However, reduction phenomena have also been reported at considerably lower temperatures, which have been ascribed to an increased oxygen release from Fe-Co-perovskites [47,48].
H2-TPR curves are shown in Figure S16a, which show a two-step reduction behavior in a lean hydrogen atmosphere (7% H2/N2). For LaFeO3, a first smaller reduction peak is observed at 420 °C, followed by a pronounced maximum at 892 °C. For all Co containing samples, the position of the first maximum is shifted to lower temperatures by at least 34 °C compared to LaFeO3. The shift proves the enhanced reducibility of the perovskite structure in the presence of Co in the temperature range below 500 °C, but there is no linear correlation between the Co content and the peak position, as highlighted in Figure S16b. The reducibility in the low-temperature region shows the following order in x: 0.15 > 0.05 > 0.25 > 0.10 > 0.20 > 0.30 > 0.00. In contrast, the second maximum shifts to higher temperatures with Co incorporation, while similar to the first maximum, the second does not show a clear correlation with Co content.
A similar non-linear behavior in the high-temperature region upon cation substitution has also been observed on La1−xSrxFeO3 perovskites, which was attributed to increased consumption of surface oxygen at lower temperatures originating from enhanced oxygen mobility upon Sr incorporation [48]. As a consequence, the oxygen availability at higher temperatures decreases and results in the shift of the second maximum to higher temperatures [48]. For samples with a higher oxygen activation barrier, the low-temperature peak is less pronounced, while the availability of easier-to-reduce oxygen species at higher temperatures is increased [48].
In terms of Co incorporation into LaFe1−xCoxO3 perovskites, the ratio of lattice oxygen to adsorbed oxygen decreases, resulting in higher total oxidation activity in CH4 oxidation [3]. Furthermore, Zhao et al. attributed the two-step reduction of perovskites to the stepwise reduction of adsorbed oxygen accompanied by Fe4+ to Fe3+ reduction and Co3+ to Co2+ followed by total bulk reduction of reducible cations [3].

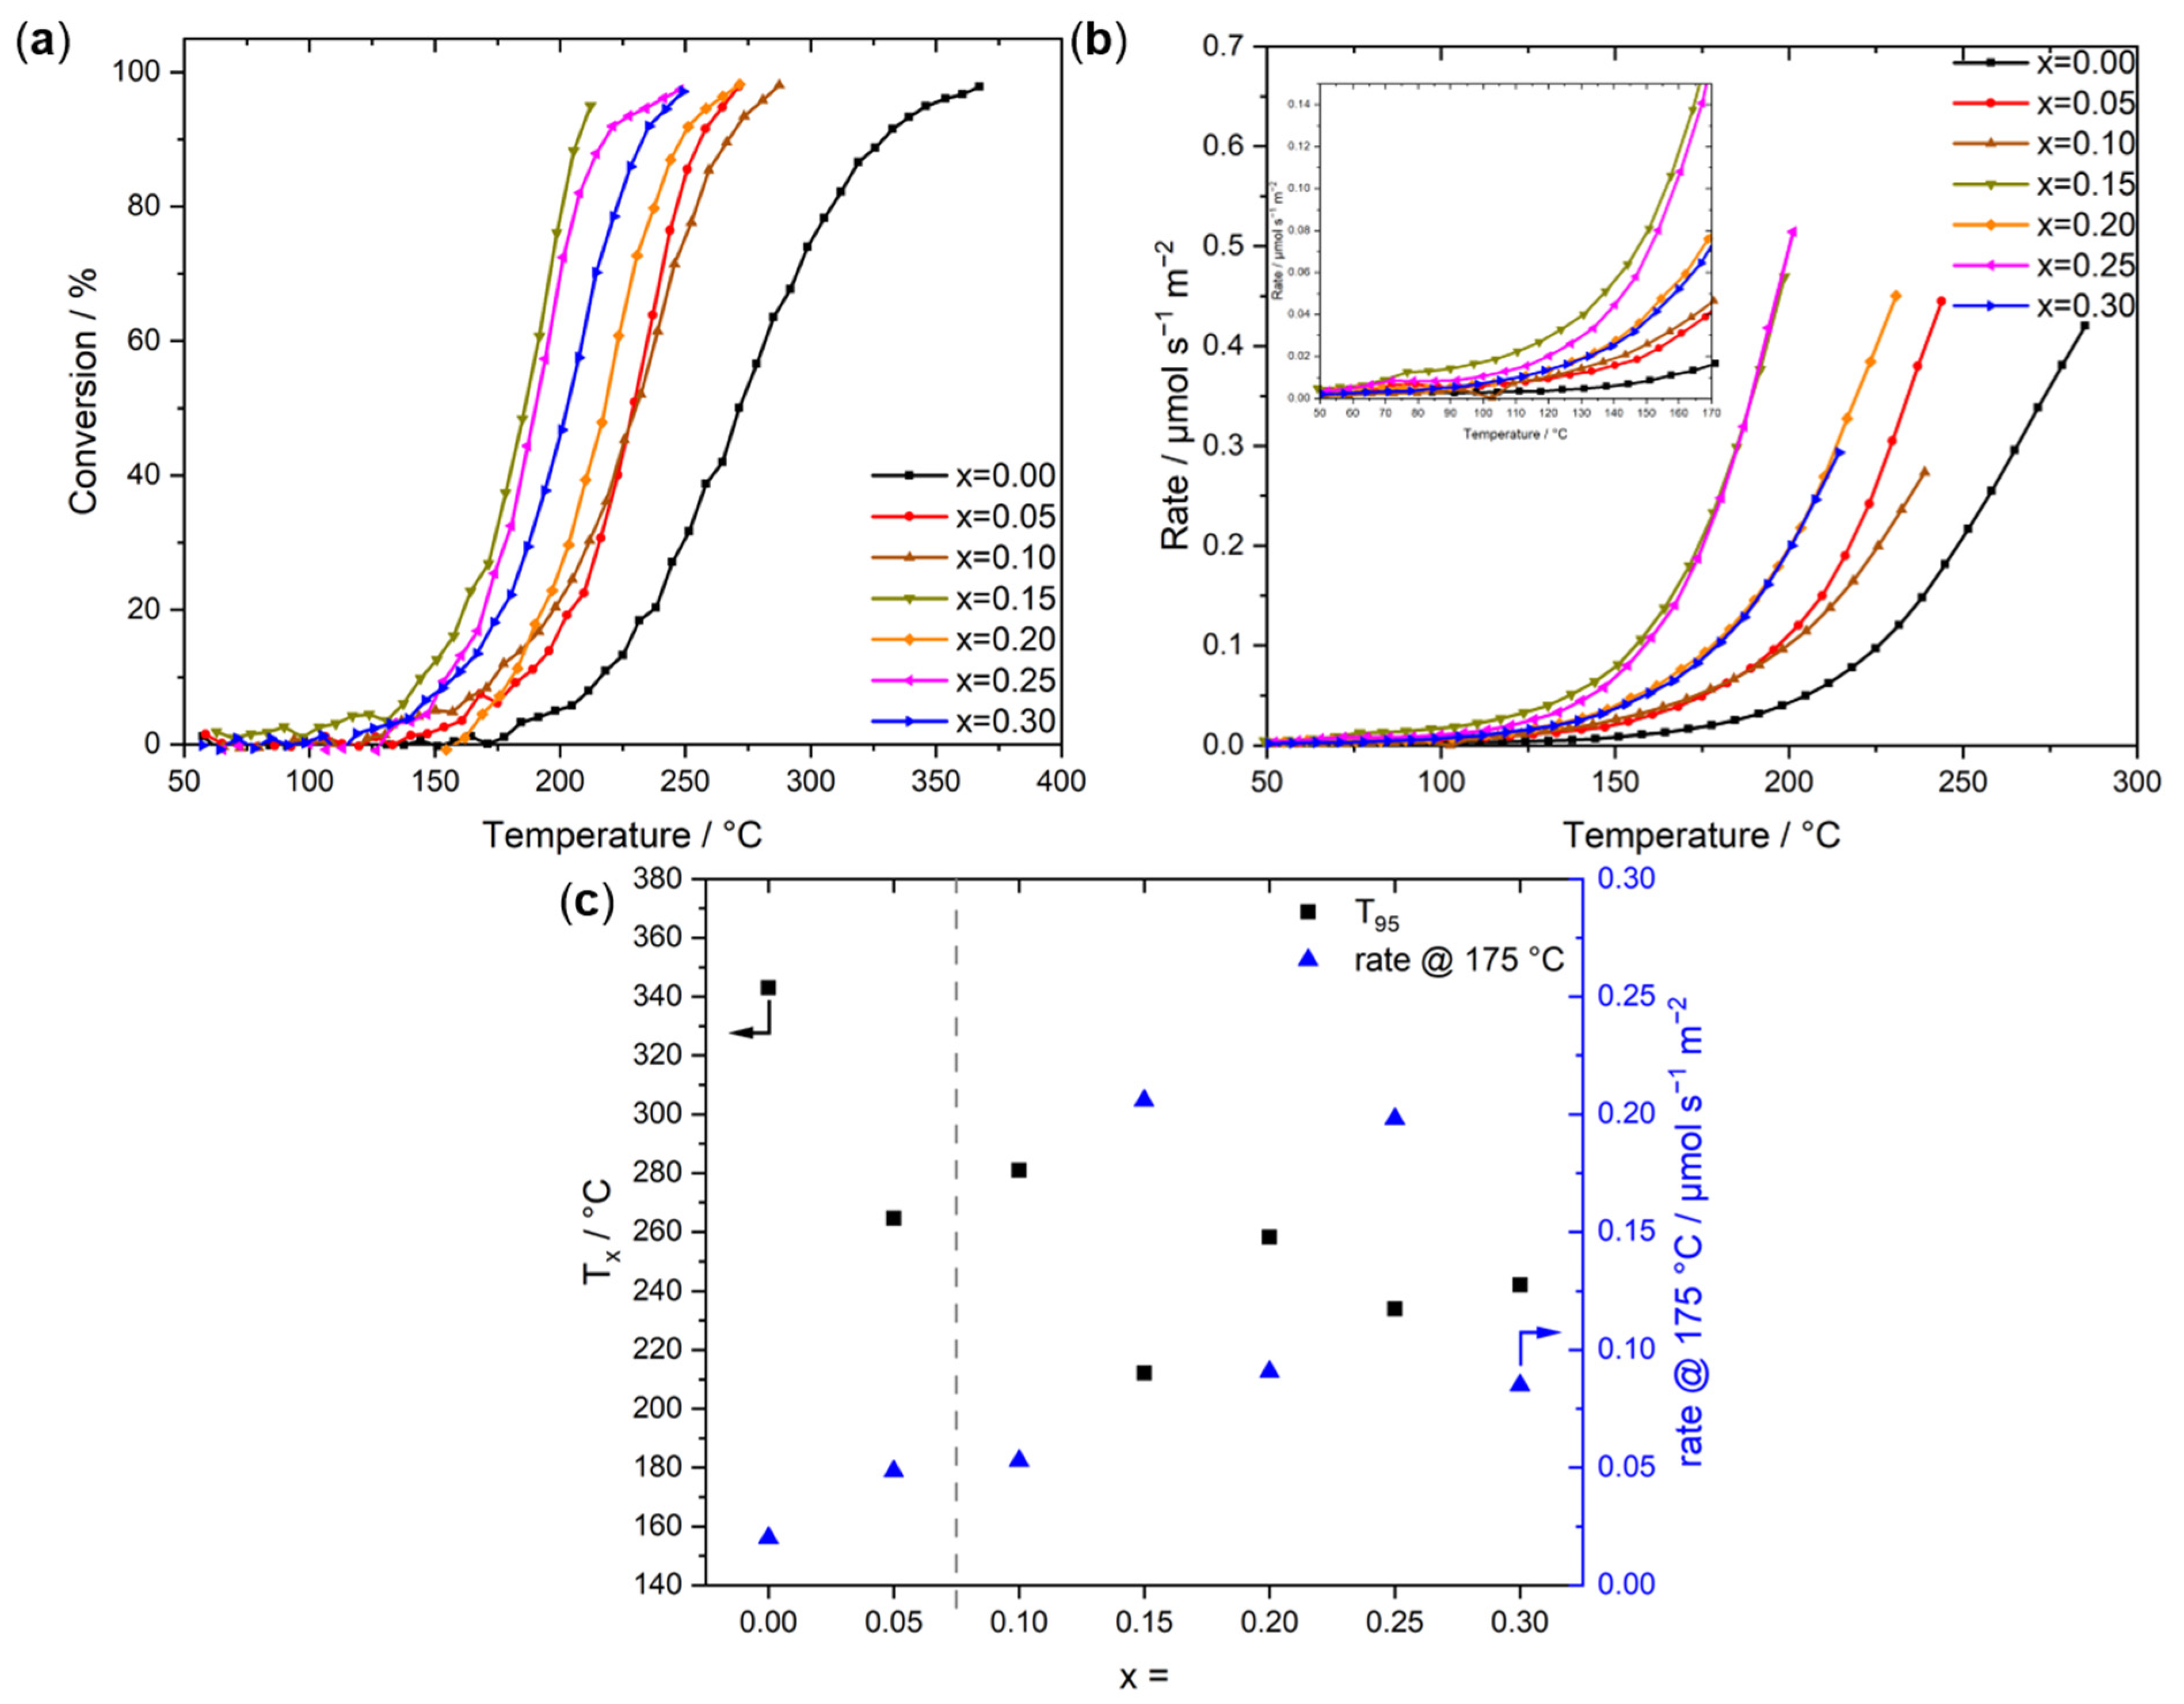
2.3. CO Oxidation Activity

Temperature-programmed CO oxidation reaction was performed in the temperature range between room temperature and 500 °C. Conversions as a function of reaction temperature are shown in Figure 5a. The reaction rates normalized by the BET surface area were calculated up to a conversion of 65% and plotted in Figure 5b. A pronounced increase in CO oxidation rate was observed in our experiments by Co incorporation as low as 5% into the perovskite structure, lowering the T50 by 42 °C. An even stronger effect was observed during CO oxidation upon the incorporation of small amounts of Co into NiO [34]. Thus, a positive impact on the catalytic activity in the presence of Co is expected. Co3+ acts as an active site for CO adsorption, while Co2+ at oxygen vacancies preferentially adsorbs molecular oxygen, as was shown for LaCoO3 perovskites [49].
Interestingly, after this activity boost, neither the conversion nor the reaction rate linearly follows the Co incorporation. Regarding conversion, x = 0.15 and x = 0.25 are the most active samples, followed by x = 0.30. After rate-normalization, the curves for x = 0.15 and x = 0.25 converge as well as the curves for x = 0.20 and x = 0.30. A similar non-linear scaling of the activity with the Co content was observed for exhaust gas decomposition containing NO and N2O on LaFexCo1−xO3 [23] and CO oxidation on Co-doped NiO [34]. Furthermore, on Sr- and Co-doped LaFeO3, extrema at intermediate Co contents were found for the methanol oxidation activity [35]. For the two samples emerging from the purely amorphous precursor without minor contributions from the anisotropic CoFe-LDH by-phase (x = 0.00 and x = 0.05), the activity increase with Co incorporation is evident, as discussed before. Nonetheless, several factors such as surface termination, surface composition, and oxygen vacancies should be taken into account to understand the non-linear change in activity with a variation of the Co content. A more detailed structural analysis is needed to address this effect. Interestingly, TPR indicates a strong correlation between the position of the reduction peak below 500 °C and the catalytic activity. The catalysts x = 0.15 and x = 0.25 are easier to reduce under reaction conditions compared to x = 0.20 and x = 0.30 and more active in the catalytic oxidation of CO.
When comparing the temperatures of 95% conversion (T95) within the series as shown in Figure 5c, the same behavior as before becomes evident. The incorporation of only small Co amounts increases the activity drastically, whereas x = 0.15 shows the lowest T95 followed by x = 0.25 and x = 0.3. In the literature, a temperature of 95% conversion (T95) is not expected before 500 °C for LaFeO3, which is higher than our result of 343 °C [50]. However, there are also examples showing T90 values of 400 °C [51], of about 370 °C [52], or near 430 °C [53]. This gap, however, might be related to differences in the experimental conditions of the catalytic testing in terms of CO concentrations and GHSVs. In comparison to LaFeO3 catalysts from spray-flame synthesis, the exposed BET surface area in the presented study is decreased by a factor of 5 for reported high surface area catalysts and comparable to low surface area catalysts [15]. The activity at 300 °C of about 73% for the sample derived from a co-precipitated precursor is increased compared to the sample obtained by spray-flame synthesis, which featured at least 30% conversion in a less oxidizing atmosphere (3% CO, 6% O2). Here, we compare our results to a study in which different amounts of ethanol as fuel were used during gas-phase synthesis. After rate-normalization, LaFeO3 synthesized in this study features 0.493 µmol s−1 m−2, whereas the spray-flame synthesized materials show rates of 0.302 (pure EtOH, 15 m2 g−1), 0.117 (35% EtOH, 92 m2 g−1), and 0.075 µmol s−1 m2 (50% EtOH, 89 m2 g−1) at 300 °C [15].
For the rate comparison at 175 °C Figure 5c, a general trend towards higher activity can be observed as a function of the Co content with the exceptions of x = 0.15 and x = 0.25, which show extraordinarily high activities.
In Figure S17a, transient CO oxidation curves of two batches of x = 0.00 are shown. A good reproducibility of the conversion profile can be seen even among different synthesis batches. The observed offset for T50 and T95 was 7.2 °C and 12.3 °C, respectively, which is considered as an error bar estimation also for the other syntheses and measurements. In addition, we performed a reusability test of the same batch (x = 0.00), which is shown in Figure S17b. Prior to each reproduction run, a temperature-programmed oxidation (TPO) up to 300 °C in 20% O2 and N2 was performed. After the oxidative treatment, the activity was slightly enhanced compared to the initial activity, which can be explained by surface cleaning and oxygen adsorption. The two runs after a TPO perfectly overlap, which proves the reproducibility of the results as well as the re-usage stability of the catalysts under these reaction conditions.
Additionally, the stabilities with time on stream of the samples x = 0.00 and x = 0.25 were investigated under steady conditions at 200 °C. The results are displayed in Figure S17c. The stability measurement of x = 0.00 indicates the pre-treated catalyst goes through a short period of deactivation but reaches a steady state after 6 h of exposure to the reaction mixture. In the deactivation period, a loss in conversion from 16.3% to 7.6% could be observed. The x = 0.25, on the other hand, showed only a slight deactivation from 99% to 95.6%, after which it reached the steady-state conversion. The decrease in conversion is thus less pronounced for x = 0.25 compared to x = 0.00 at the same temperature, suggesting that the addition of Co does not only help the activity but also has a positive effect on stability.

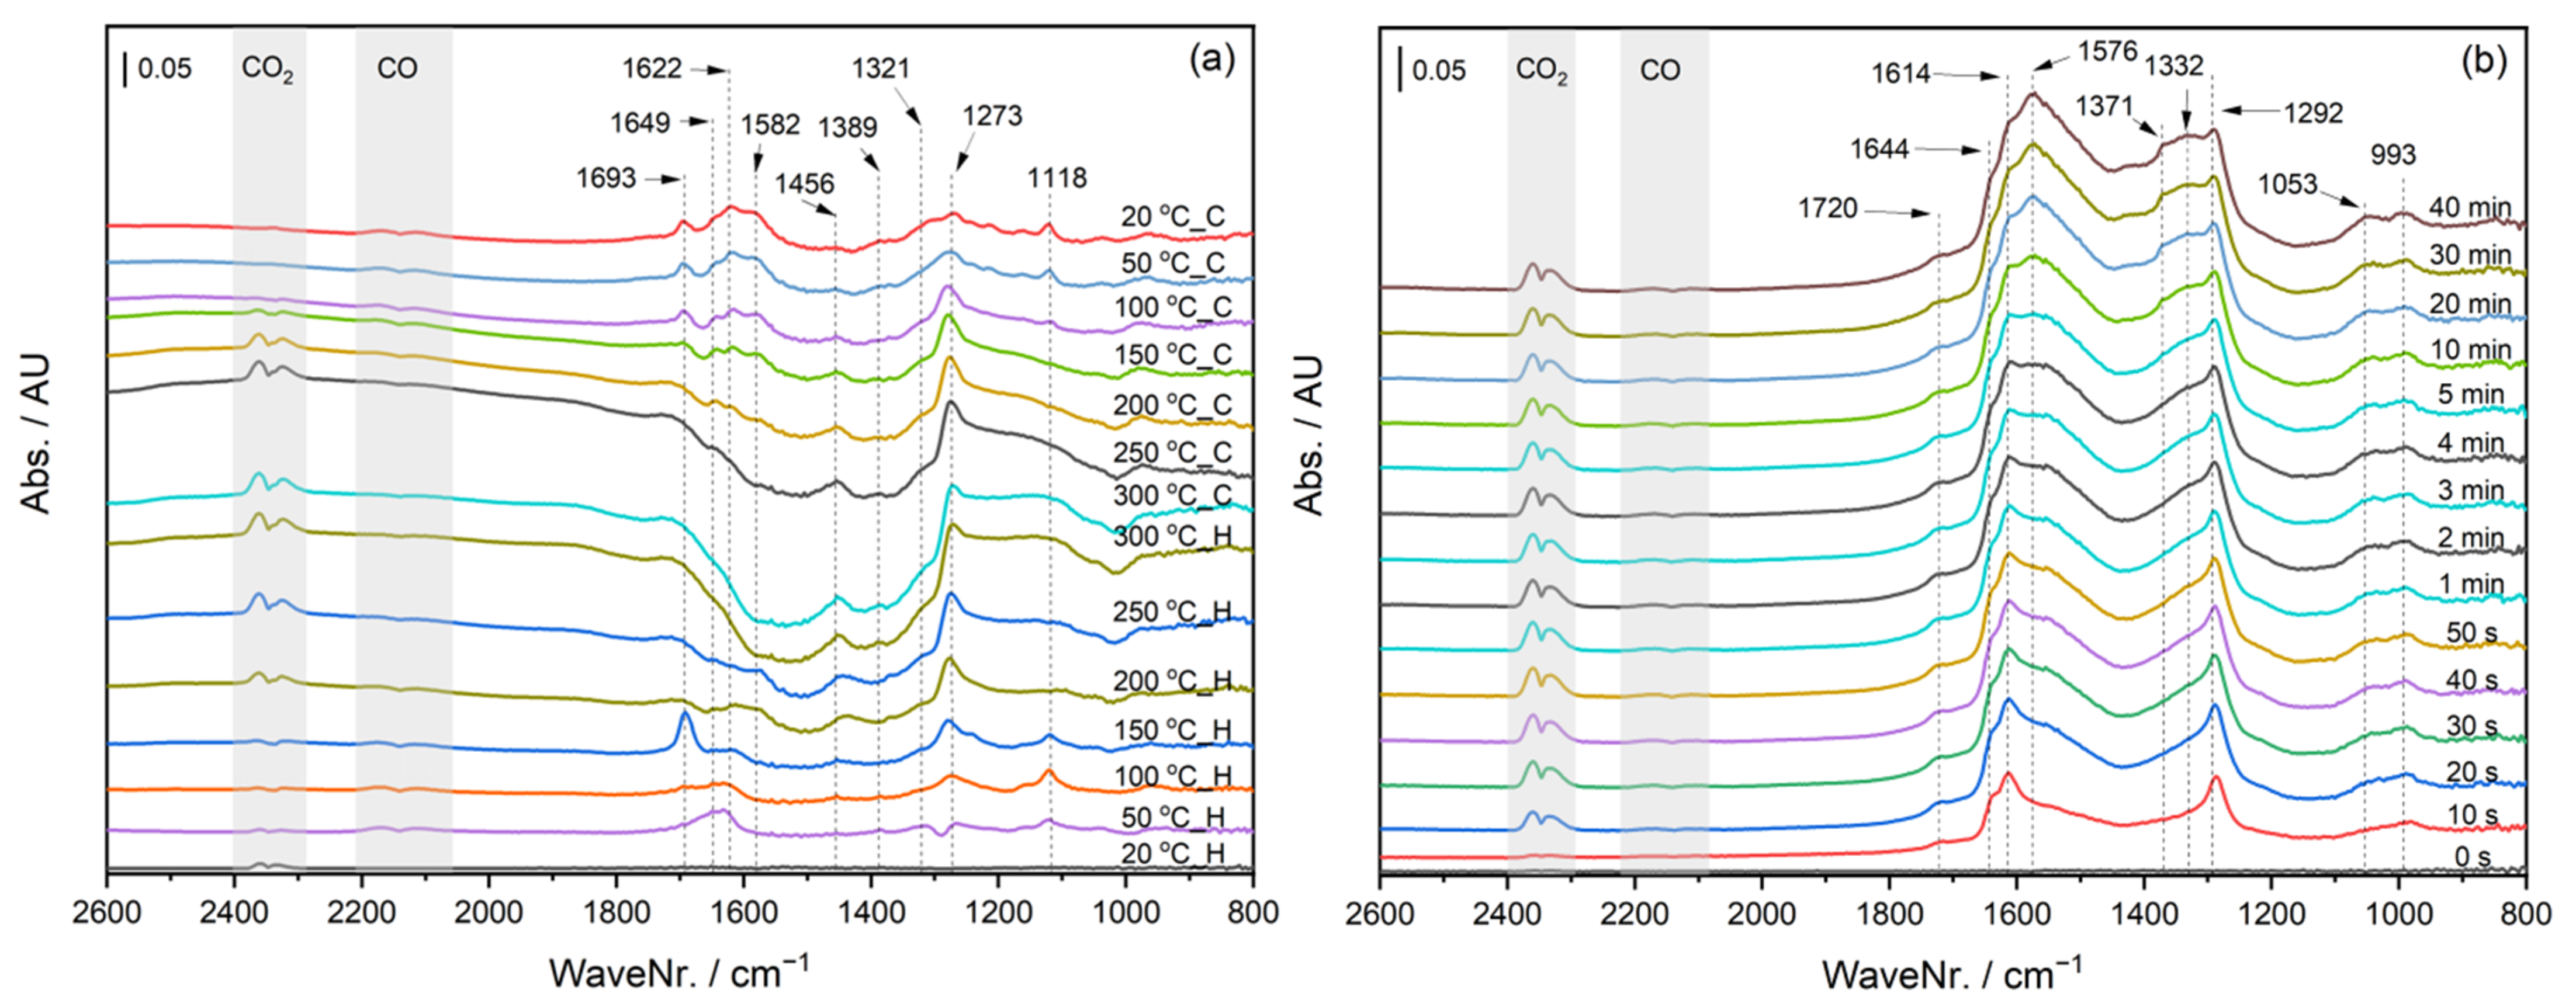
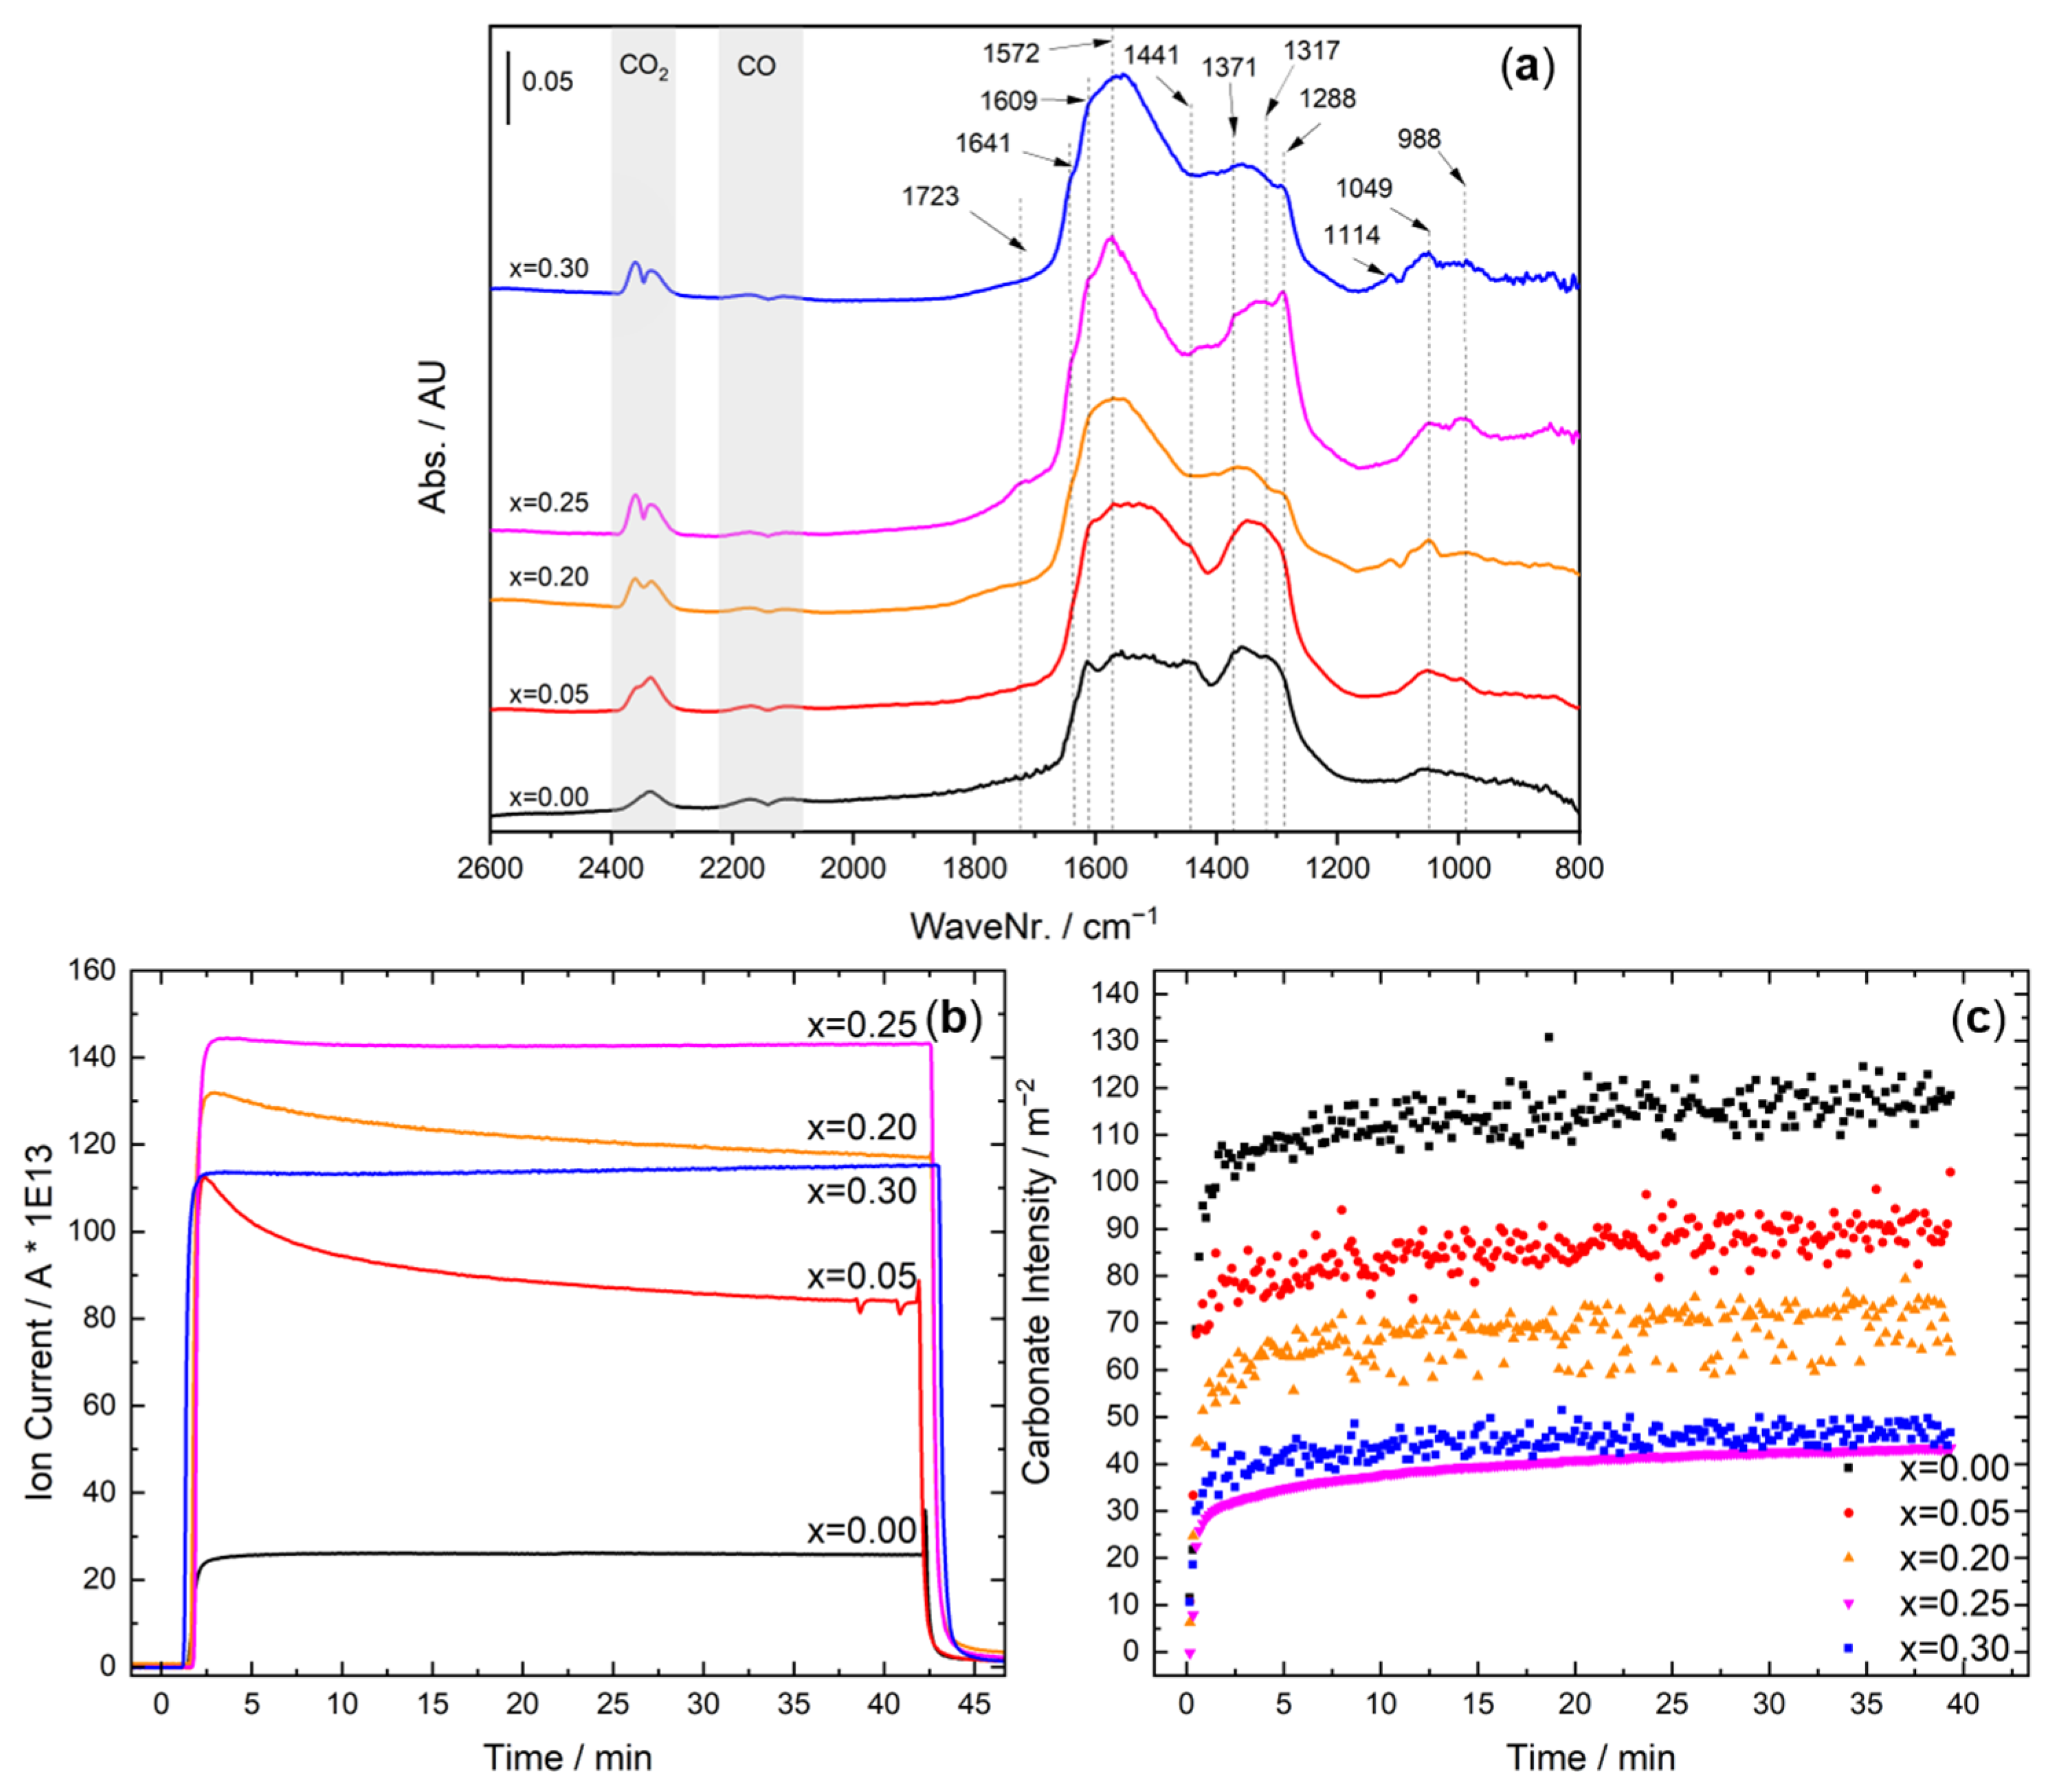
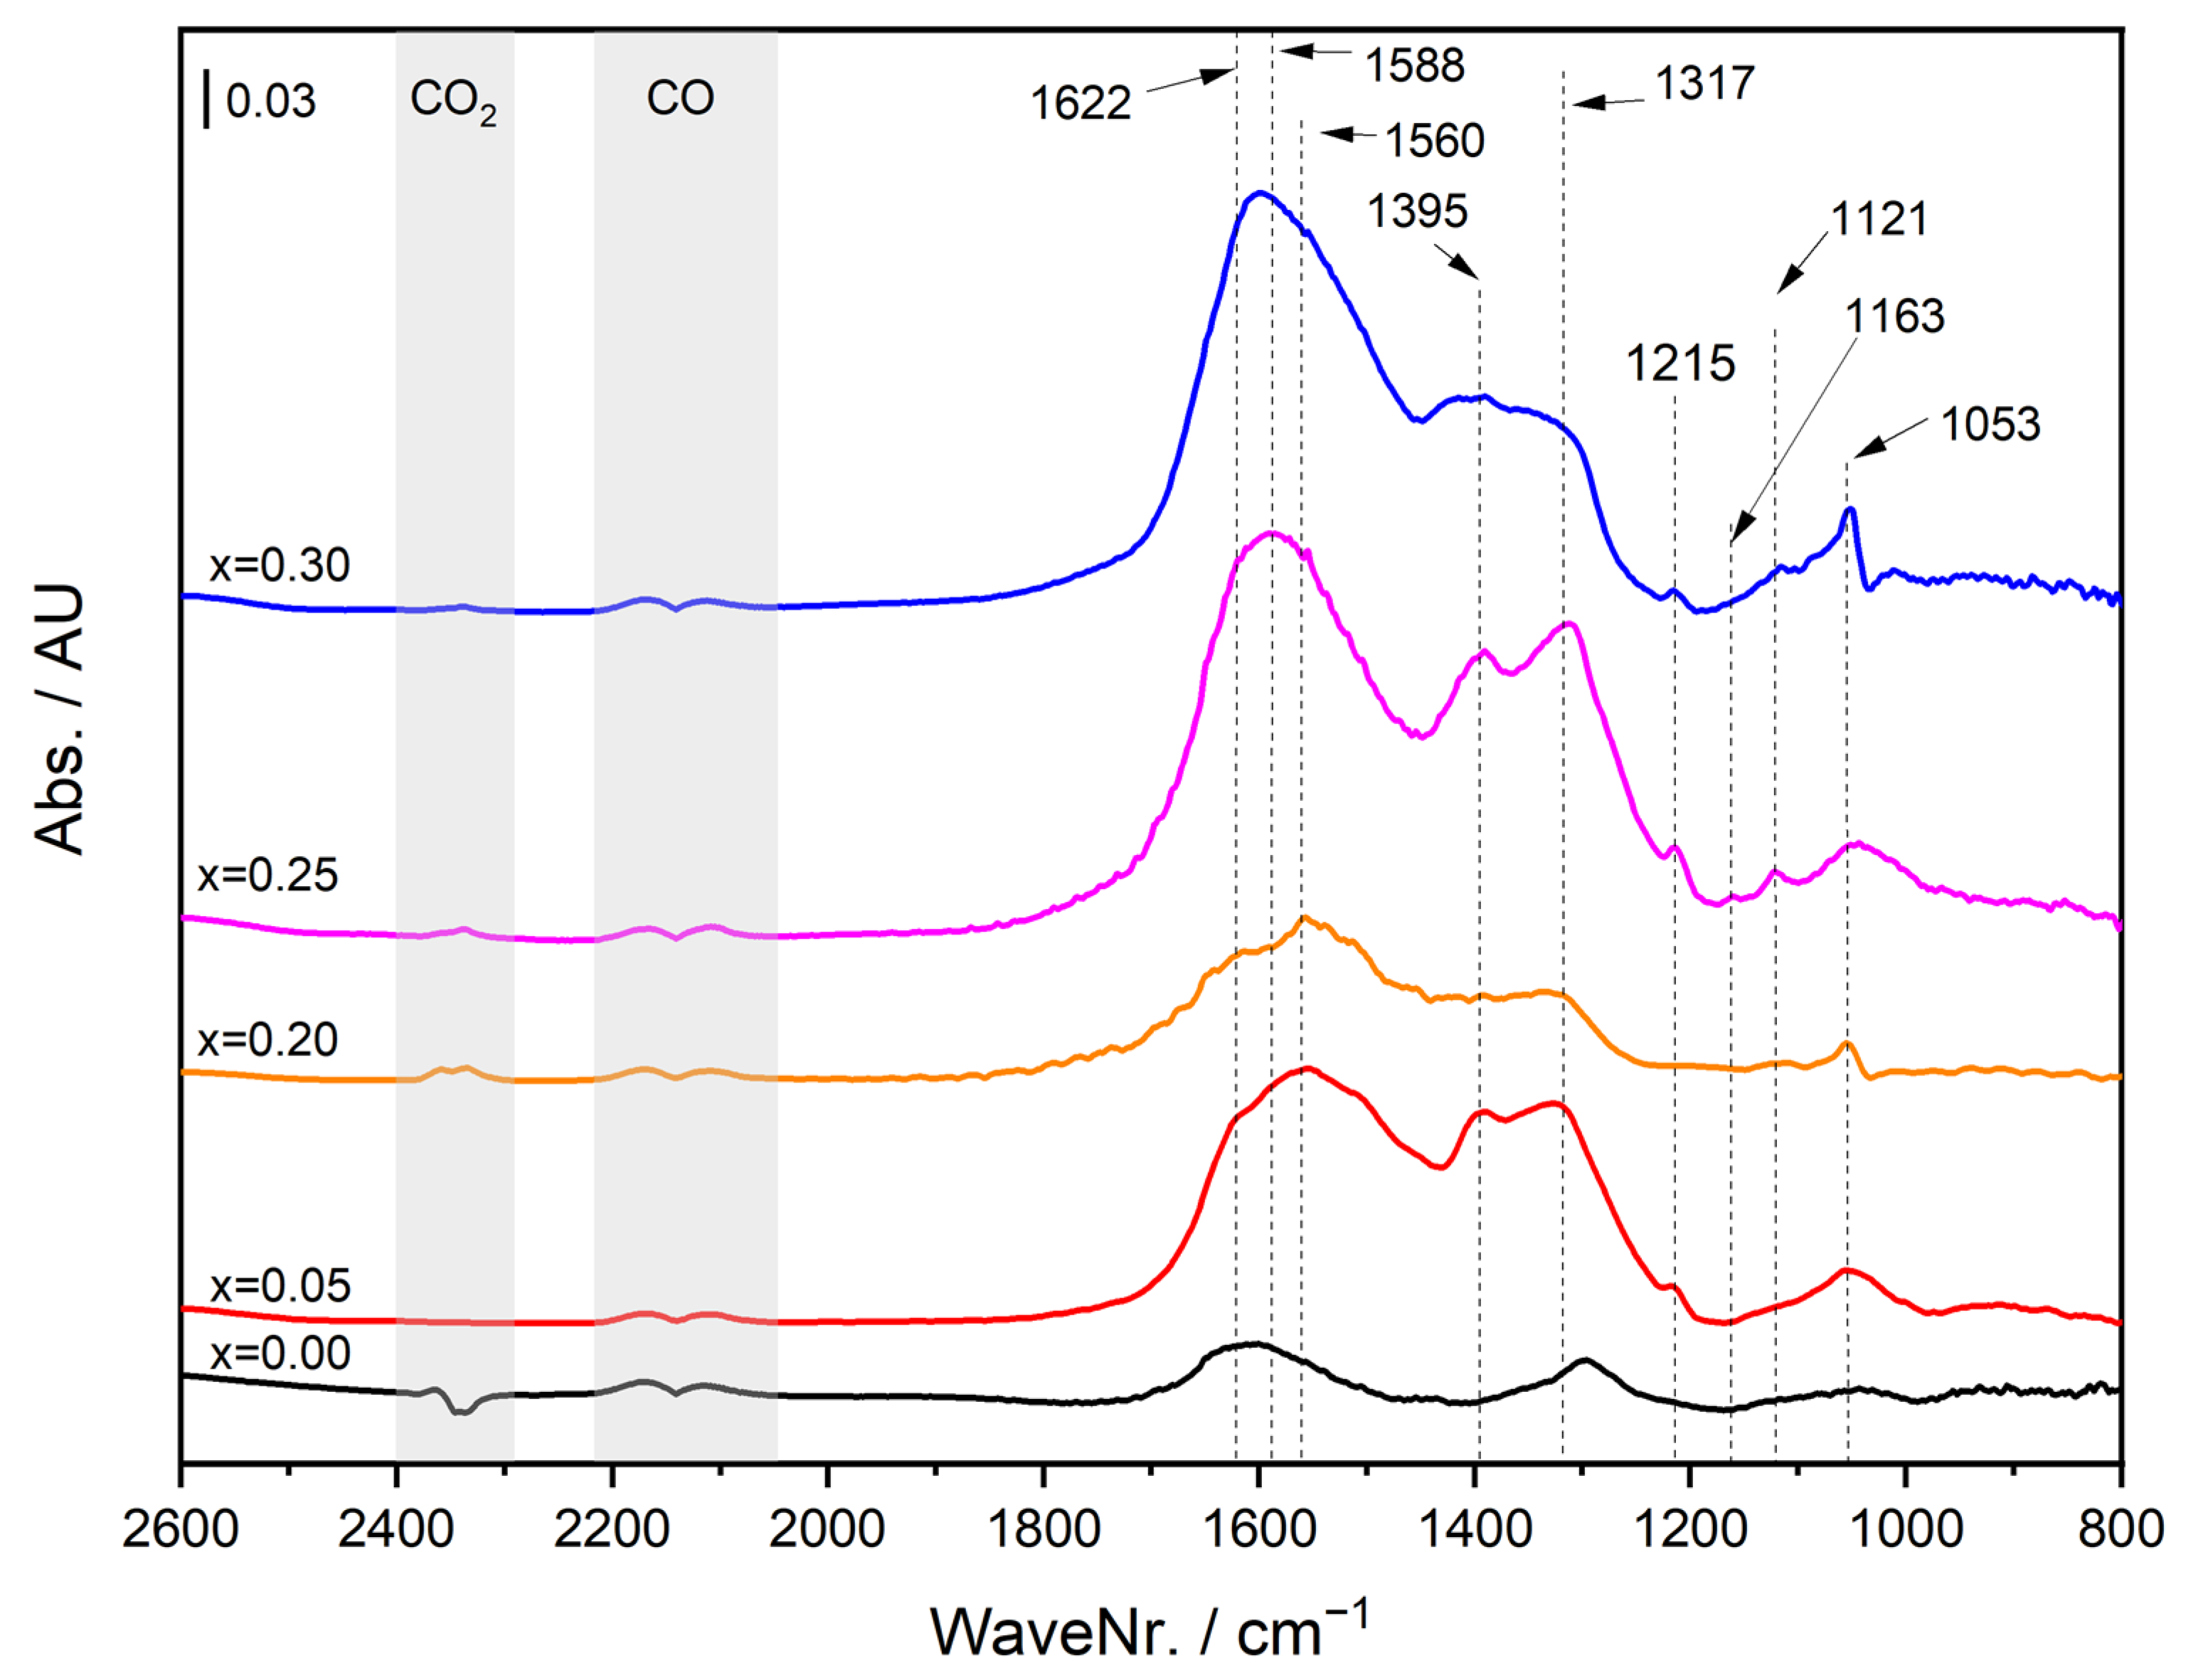
2.4. Operando DRIFTS during CO Oxidation

In order to investigate the surface properties of the catalysts, samples with nominal Co contents of x = 0.00, x = 0.05, x = 0.20, x = 0.25, and x = 0.30 were studied in the CO oxidation monitored by Diffuse Reflectance Infrared Fourier Transform Spectroscopy (DRIFTS). The selected samples include the least active catalyst (x = 0.00) and three samples with similar activities despite different Co contents (x = 0.05, x = 0.20, x = 0.30), and one sample with extraordinarily high activity (x = 0.25). Initially, the DRIFTS spectra during a transient experiment were collected while the catalyst was exposed to the reaction mixture. The spectra at selected temperatures are illustrated in Figure 6a for x = 0.25, as one of the most active samples when looking at the normalized rate, and for other samples in Figure S18a–d.
The progressive formation of CO2 at higher temperatures can be observed in all cases by the intensity of the gas-phase CO2 bands. However, it is not straightforward to internally compare the spectra due to different absorption intensities and the bending of the baseline at higher temperatures (also note the difference in the scale bars of the graphs). The activity significantly changes by incorporating Co, as observed in the catalytic experiments. It can be qualitatively compared by the intensity of the gas-phase CO vs. CO2 among the samples, which is in line with the MS signal (not shown). Several bands were observed below 1710 cm−1, which can be related to symmetric and asymmetric vibration of different carbonates, including monodentate, bidentate, bridged, polydentate, and bicarbonates [54,55]. Although detailed band assignment in these cases requires extensive assumptions about the coordination of the atoms on the surface as well as support from theoretical calculations and therefore is not reported here, there are still interesting trends to discuss. In all cases, the formation of carbonates is progressed as the temperature increases during the heating segment and stays the same during cooling. As the atmosphere is significantly richer in oxygen than in CO, this indicates that the formation of carbonates is limited by the number of adsorption sites as well as the amount of CO present in the reaction mixture, wherefore the carbonates are not built up anymore after a certain level. The former case is seen for the lower Co contents where we still see the gas-phase CO contribution while the carbonate contribution is at its highest intensity. On the other hand, the limiting factor of CO concentration is seen especially for the higher Co contents where we see that the contribution of the gas-phase CO at higher temperatures is totally diminished. This is consistent with the higher normalized rates that had been observed for the sample x = 0.25. The bands show minor shifts that could indicate different electronic properties at the surface. Indeed, the isomorphous substitution of Fe with Co in the bulk structure will induce changes in the surface composition and subsequently result in different electronic states of the adsorption sites on the surface. In addition, the presence of Co in the sample seems to suppress or promote some bands stronger than others. For instance, the band shifting among the sample between 1572–1582 cm−1, which can be attributed to asymmetric vibration of mono and/or bridged carbonates, is promoted up to x = 0.20 Co incorporation. The most active sample with x = 0.25 Co shows the lowest tendency to become poisoned at the surface by the carbonates. It is evident that Co incorporation changes the surface properties during the transient test despite similar crystal structures.
To further analyze the stability of the catalyst surface under steady-state conditions, the samples were studied after an oxidative treatment for 40 min at 200 °C upon exposure to the reaction mixture. The resulting spectra are shown in Figure 6b for x = 0.25 and for other samples in Figure S19a–d. Evidently, there was a progressive formation and build-up of carbonate-based species as soon as the catalysts were exposed to the reaction mixture. Two simultaneous pathways can be considered to form carbonates on these catalysts. One would be the result of reducing the 3+ cations at the surface by CO, especially known for Co3+ when O2 is not present, which may result in the direct formation of carbonates on the surface [56]. Simultaneously, if the catalyst has some CO oxidation activity, the produced CO2 molecules can be adsorbed on the surface and subsequently form carbonates, especially if the surface has weak Lewis basic sites, as reported for example for Al2O3 and Mg2SiO2 [33,57]. Depending on the conditions of the experiment, one or the other could be dominant, but neither could be ruled out. In the case of the herein studied perovskite catalysts, it is reasonable to assume that the formation of carbonate is mainly due to the surface reaction of CO with the two active O, as reported for Co3O4 catalysts [58]. The positive correlation of the extent of the reaction with the Co content can be qualitatively inferred by the gas phase CO and CO2 intensities. Like the transient test, similar bands are observed in the steady-state, some of which are promoted or suppressed over time. To better compare this, the DRIFTS spectra at 40 min are depicted in Figure 7a. Here, the band at 1728 cm−1, possibly related to C=O in bidentate coordination, is promoted by the Co content. The same is observed for bands at 1641, 1572, 1288 cm−1, while the band at 1439 cm−1 seems to be suppressed. The spectra were also compared in the upper range of the wavenumber, which showed a very weak yet similar interaction of CO2 with the hydroxyl group at 3633 cm−1 (see Figure S20) [59]. The similarity of the band intensity and position among the samples would suggest that the possible contribution of the OH groups of the catalyst in the CO oxidation activity was most likely insignificant and not responsible for the observed activity trend. Nevertheless, it is similar among the samples showing the same activity, particularly among x = 0.20 and 0.30, which suggest a similar surface structure for these samples despite different Co contents. The CO2 formation normalized by He intensity, sample mass, and BET surface area monitored using MS (see Figure 7b) indicated a significant promoting effect of Co. Interestingly, the deactivation of the catalysts, as indicated by a gradual decline of the CO2 signal, was suppressed at the higher Co contents. In other words, the more Co in the sample, the less significant deactivation could be observed, in line with the observations during the transient DRIFTS measurements and during the kinetic steady-state measurements of the catalysts x = 0.25 and x = 0.00 at 200 °C (Figure S17c). This could be backed up by analyzing the DRIFTS spectra in the carbonate region, i.e., in the wavenumber range of 1150–1700 cm−1. To this aim, the spectra were integrated within the specified range during the whole isothermal segment and normalized based on the BET surface area. As depicted in Figure 7c, the carbonates were formed as soon as the catalysts were exposed to the reaction mixture but their build-up was suppressed by the higher Co content in the sample. The trend between the activity observed from the transient catalytic experiments and the carbonate build-up during the transient and isothermal DRIFTS measurements were consistent (i.e., x = 0.25 > x = 0.30, x = 0.20 > x = 0.05 > 0.00). This is also in line with most of the normalized CO2 formation MS signals, with the x = 0.05 being an outlier by showing a sharp CO2 signal at the beginning, which is then diminished later on by time on stream. The inverse correlation between CO2 and carbonate formation could indicate the blocking of active sites due to a larger amount of carbonate species preferentially formed by increasing the Fe content. On the other hand, one could hypothesize that the Co incorporation enhances the decomposition of the carbonates, which are formed as reaction intermediates rather than surface poisoning species.
The CO probe gas interaction with the adsorption sites was additionally investigated at 10 °C, and the results during 40 min of exposure are plotted in Figure S21. As the extent of the reaction is limited at this temperature, the formation and build-up of carbonates can be attributed more dominantly to the reduction of the 3+ cations. However, the contribution of CO2 adsorption, whether as the product of the reaction or impurity of the CO mixture, cannot be totally excluded. Indeed, there is a positive correlation between the Co content and the build-up of the carbonates (inferred by the relative intensities of gas-phase CO and the carbonates), which is consistent with the reduction of Co3+ by CO. Additionally, our previous hypothesis in the discussion about the steady-state data can be supported in the sense that Co3+ promotes the formation of the carbonates. However, it also enhances their decomposition in an O2-rich environment. The Co-free sample shows a similar behavior, although with much lower intensities. The 40 min spectra of the catalyst are stacked in Figure 8 for better comparison. Several bands can be observed in the range of 1620 to 1053 cm−1, while others show different relative intensities. For instance, there is a positive correlation between the relative intensities of the bands at 1620, 1396, and 1121 cm−1. In summary, Co content has a positive effect on the formation of the carbonates in an O2-free environment, consistent with the higher population of reducible surface Co3+ species. On the other hand, when the atmosphere is O2-rich, the adsorption of CO is enhanced by the incorporation of Co, leading to the formation of carbonates as reaction intermediates, but their decomposition is also promoted by Co. In the end, this leads to a more active catalyst in CO oxidation, which is yet more resistant to surface poisoning. The small changes in the type of carbonates in all DRIFTS experiments could reflect minor differences in the surface properties, which could have an impact on the reaction pathway and the overall catalytic activity. The similarity of the surface properties among those samples with a comparable morphology, especially x = 0.20 and 0.30, is also consistent with the similar observed activity trend.

3. Materials and Methods

3.1. Raw Materials

For the synthesis of the investigated catalysts, commercially available reagents were used without additional purification: lanthanum(III) nitrate hexahydrate (99.9% La, abcr GmbH, Karlsruhe, Germany), iron(III) nitrate nonahydrate (≥96%, Carl Roth GmbH, Karlsruhe, Germany), cobalt(II) nitrate hexahydrate (≥98%, Carl Roth GmbH, Karlsruhe, Germany), sodium hydroxide (98.5%, Carl Roth GmbH, Karlsruhe, Germany), and sodium carbonate (≥99.5%, VWR International GmbH, Darmstadt, Germany).

3.2. Synthesis and Sample Preparation

The synthesis via co-precipitation included the preparation of metal salt stock solutions with a total ionic concentration Mx+ of 0.8 mol L−1 with the general composition La3+/Fe3+/Co2+ = 1:1–x:x. The value of x was varied in the range between 0 and 0.3. The precipitation agent was a solution consisting of 1.2 M NaOH and 0.18 M Na2CO3.
The syntheses were performed in an automated OptiMax 1001 (Mettler Toledo GmbH, Greifensee, Switzerland) synthesis workstation. The setup consists of a single-walled glass reactor fixed inside a solid-state thermostat for accurate temperature control. During precipitation and aging steps, N2 flow was employed, and the prefill volume of the reactor was purged with N2 for 30 min. The co-precipitation experiments have been performed isothermally at 10 °C and a constant pH of 9.5. A universal control box equipped with a precision balance allowed gravimetric dosing of the metal salt solutions of 75 g in 36 min. Control over the pH was achieved by simultaneous computer-controlled dosing of the metal salt solution and the precipitation agent via two ProMinent gamma/L metering pumps. The pH was monitored and adjusted using an InLab Semi-Micro-L electrode before each experiment. A pitched blade impeller rotating at a constant speed of 300 rpm was used to avoid concentration and temperature gradients. After the precipitation was finished, an aging step at 10 °C for 60 min was performed. After aging, the precipitate was isolated by centrifugation (6000 rpm, 2 min) and washed with deionized water until the conductivity of the supernatant was below 0.1 mS cm−1 in two consecutive runs. Afterwards, the samples were dried in static air at 80 °C for 12 h. The precursors were calcined at 800 °C for 3h (β = 2 °C min−1) in stagnant air in a muffle furnace (B150, Nabertherm, Lilienthal, Germany). The calcined samples were characterized as powders and pressed with a hydraulic press by Perkin-Elmer (5 t, 2 min, Überlingen, Germany), pestled, and sieved with stainless steel sieves from ATECHNIK (ISO 3310−1, Leinburg, Germany). A sieve fraction of 250–355 µm was used for the kinetic analysis with a BELCAT-B (MicrotracBEL Corp., Haradanaka Toyonaka, Japan) catalyst analyzer.

3.3. Catalyst Characterization

Fe and Co contents in the precursors were determined by atomic absorption spectroscopy (M-Series, Thermo Electron Corporation, Waltham, MA, USA).
Thermogravimetric measurements (TG) were performed in a NETZSCH STA 449F3 thermal analyzer (NETZSCH-Gerätebau GmbH, Selb, Germany). For TG measurements, 50 mg of precursor material was heated in a corundum crucible in 21% O2 in Ar from 30 °C to 1000 °C with a linear heating rate of 5 °C min−1.
N2 adsorption-desorption experiments were performed with a NOVA3000e setup (Quantachrome Instruments, Boynton Beach, Florida, USA) at −196 °C after degassing the samples at 80 °C for 2 h in a vacuum. BET (Brunauer Emmet Teller) surface areas were calculated from p/p0 data between 0.05 and 0.3. Total pore volumes were determined at p/p0 = 0.99.
Powder XRD patterns in the 2θ range from 5° to 90° were recorded on a Bruker D8 Advance (Bruker, Billerica, MA, USA) diffractometer in Bragg–Brentano geometry using a position-sensitive LYNXEYE detector (Ni-filtered CuKα radiation, Bruker, Billerica, MA, USA) applying a counting time of 0.3 s and step size of 0.018. Samples were mounted using dispersion in ethanol on a glass disc inserted in a round PMMA holder. The latter was subject to gentle rotation during scanning after removing the ethanol by drying. For structure analysis and calculation of lattice parameters, Rietveld refinement [44] was applied using the TOPAS software (Bruker, Billerica, MA, USA).
Scanning electron microscopy (SEM) studies were performed on a Apreo S LoVac Thermo Scientific (ThermoFisher, Waltham, MA, USA) microscope with a Thermo Scientific UltraDry EDS X-ray detector (ThermoFisher, Waltham, MA, USA).
High-resolution scanning transmission electron microscopy (STEM) studies were carried out on a Jeol JEM 2200 fs microscope (Akishima, Japan) equipped with a probe-side Cs-corrector operated at 200 kV acceleration voltage. Micrographs were taken in a high-angle annular darkfield (HAADF). EDX elemental mappings were acquired with a X-Max 100 detector (Oxford Instruments, Abingdon, United Kingdom. For particle size estimation, 50 particle diameters were counted using the software ImageJ.
IR spectra were obtained in a Bruker Platinum ATR Diamond spectrometer (Bruker, Billerica, MA, USA) in a spectral range between 400 cm−1 to 4000 cm−1. The step size was set to 0.1 cm−1.

3.4. Catalytic CO Oxidation at Ambient Pressure

For catalytic testing in a BELCAT-B catalyst analyzer (MicrotracBEL Corp., Japan), 100 mg (sieve fraction 250–355 μm) of each calcined catalyst sample diluted with 500 mg of silicon carbide (>355 μm) was placed inside a U-shaped quartz tube reactor (inner diameter = 8 mm). Each sample was cleaned by heating at 3 °C min−1 in He (99.9999%, Air Liquide) from room temperature to 100 °C, kept constant for 1 hr. After that, the sample was cooled down in He to 50 °C. Before starting the temperature-programmed catalytic experiments, the catalyst/SiC mixture was purged for 15 min with 2% CO and 20% O2 in He to equilibrate the gas composition. After that, the temperature was increased to 500 °C at a heating rate of 3 °C min−1. The total gas flow was 80 mLn min1. The reactor outlet stream was analyzed with a MicroGC 490 (Agilent Technologies, Santa Clara, CA, USA) equipped with a 5-Å molecular sieve and a Pora Plot Q column to detect CO, O2, and CO2.

3.5. Operando DRIFTS during CO Oxidation

DRIFTS was performed using an FTIR spectrometer from ThermoFisher Scientific (Waltham, MA, USA), i.e., Nicolet™ iS20, equipped with a DRIFTS cell (Praying Mantis™, Harrick Scientific Products Inc., Pleasantville, New York, USA) and a Mercury Cadmium Telluride detector (MCT) cooled with liquid nitrogen. The DRIFTS cell outlet gas stream was analyzed continuously during the experiment by an on-line mass spectrometer (Omnistar GSD 320, Pfeiffer Vacuum, Wetzlar, Germany). Using a four-port selector valve, the inlet gas was switched between two different streams, one for He-purging and/or pretreatments (He or 20% v/v O2 in He) and the other containing the probe gas (0.2% v/v CO in He or the reaction mixture of 0.2% v/v CO, 2% v/v O2 balanced in He). A flow-through configuration was applied in all segments with a total flowrate of 80 mLn min−1. At first, the loaded samples (~30–40 mg fine powder) were pretreated by He at 150 °C for 1 h (at a heating rate of 10 °C/min), after which the cell was cooled down to 20 °C at the same rate. After stabilizing the temperature, the background spectrum was collected in He. Then, the samples were exposed to the reaction mixture while ramping the temperature to 300 °C at a rate of 10 °C/min and collecting the spectra every 1 min (corresponding to 10 °C intervals). The samples were dwelled for 10 min at 300 °C and subsequently cooled down to 20 °C at the same rate while collecting spectra every 1 min. In the second part of the experiment, the samples were pretreated in 20% O2 for 1 h at 350 °C to clean the surface from the formed carbonate species and then cooled down to 200 °C. After stabilizing the temperature, the gas was changed to He, and the system was purged for 10 min to collect the new background. Subsequently, the catalysts were exposed to the reaction mixture for 40 min while collecting the spectra every 10 s. The first spectrum was collected before switching the gas, so it represents the time 0. In the final part of the experiment, the catalysts were pretreated in 20% O2 again at similar conditions stated above and then cooled down to 10 °C. After temperature stabilization and collecting a new He background, the samples were exposed to 0.2% CO probe gas for 40 min, and the spectra were collected every 10 s.

4. Conclusions

Synthesis of LaFe1−xCoxO3 perovskites was performed by co-precipitation of mostly amorphous precursors and thermal decomposition towards phase-pure perovskites. The precursor materials contain a minor contribution from a hydrotalcite-like secondary phase for x ≥ 0.10. In ATR-FTIR spectroscopy, indications for a weaker force constant of the Co(II)-O bond compared to that of the Fe(III)-O bond in the hydroxycarbonate precursors are observed. After thermal decomposition, the perovskites feature sintered particles with a size of ~50 nm. The BET surface area inversely follows the size of the particles, which is an indication for mainly interparticle porosity. ATR-FTIR spectroscopy of the calcined materials revealed an influence of the Co incorporation on the MO6 octahedra, indicating a distortion in the orthorhombic perovskite, which affects the Fe-O bond strength.
Strong pronounced promotion of only 5% Co incorporation is observed in transient CO oxidation, which could be related to enhancing the reducibility as inferred by the H2-TPR and ATR-FTIR results. Further Co incorporation generally enhanced the activity compared to the pure iron sample, although no linear trend could be observed with the Co content. The promoted reducibility of Co3+ compared to Fe3+ might have led to enhanced redox properties, that are not linearly following the Co content in the samples. Nevertheless, a correlation between the low-temperature TPR peak and CO oxidation activity was observed. From the CO oxidation monitored by surface-sensitive operando DRIFTS measurements, we found that the formation of carbonates in presence of the reaction mixture was suppressed at a higher Co content, while the CO2 formation was boosted. In other words, the carbonates on the catalyst with lower Co contents were more stable and possibly not acting as reaction intermediates but rather as surface poisoning species. However, minor surface modification upon Co incorporation, especially at higher loadings, could not be ruled out. Indeed, despite comparable crystalline structures, Co incorporation could result in minor distortion, as revealed by ATR-FTIR, which resulted in changes of the surface properties, which might have had an impact on the CO oxidation activity. In this regard, the samples with similar morphology and surface properties showed similar activity in spite of different Co contents. In our upcoming research work, we will perform further mechanistic studies on the CO oxidation on these perovskites and also test the catalysts in different oxidation reactions.

Supplementary Materials

The following are available online at https://0-www-mdpi-com.brum.beds.ac.uk/article/10.3390/catal11050550/s1, Figure S1. Synthesis protocol of sample x = 0.00, Figure S2. Synthesis protocol of sample x = 0.05, Figure S3. Synthesis protocol of sample x = 0.10, Figure S4. Synthesis protocol of sample x = 0.15, Figure S5. Synthesis protocol of sample x = 0.20, Figure S6. Synthesis protocol of sample x = 0.25, Figure S7. Synthesis protocol of sample x = 0.30, Figure S8. SEM images of the precursors (left column) and the calcined materials (right column), Figure S9. (a) Positions of the transmission minimum in the M-O and M-OH region (<580 cm−1) in the IR spectra. (b) Transmission minimum in IR spectra in the M-O and M-OH region (<580 cm−1) corresponding to the minimum positions shown in (a), Table 1. Criteria of fit for the Rietveld Refinements of the X-ray diffraction patterns of the calcined samples. Figure S10. (a) Rietveld plots of x = 0.00. (b) Rietveld plots of x = 0.05. (c) Rietveld plots of x = 0.10. (d) Rietveld plots of x = 0.15. (e) Rietveld plots of x = 0.20. (f) Rietveld plots of x = 0.25. (g) Rietveld plots of x = 0.30. Grey: experimental pattern; red: calculated pattern; blue: difference plot; black: Bragg peak position, Figure S11. SEM particle size counts of all samples after calcination from 100 particles per sample, Figure S12. TEM images in the magnifications 60 k (left column), 300 k (middle column), and 10 M (right column), Figure S13. TEM particle size counts of all samples after calcination from 100 particles per sample, Figure S14. BET isotherms of all samples, Figure S15. Pore size distribution of all samples, Figure S16. (a) H2-TPR profiles of the sample series. (b) Positions of the maxima below 500 °C (labelled low temperature) and above 500 °C (labelled high temperature) derived from the TPR curves in (a). Figure S17. (a) Conversion curves of x = 0.00 derived from two different synthesis batches in the reaction mixture of 2% CO + 20% O2 balanced in He. (b) Reusability and reproducibility curves on CO oxidation of sample x = 0.00 after storage in air and reproducibility tests of sample x = 0.25 in the reaction mixture of 2% CO + 20% O2 balanced in He or N2. (c) Stability test of x = 0.00 and x = 0.25 at 200 °C and of x = 0.25 at 100 °C in the reaction mixture of 2% CO + 20% O2 balanced in N2. Figure S18. DRIFTS spectra of the selected catalysts exposed to the reaction mixture of 0.2% CO + 2% O2 balanced in He, after a He-treatment at 150 °C during a transient experiment; (a) x = 0.00, (b) x = 0.05, (c) x = 0.20 and (d) x = 0.30 Co incorporation. In the legends, H and C designate the heating and cooling segments, respectively. Figure S19. DRIFTS spectra of the selected catalysts exposed to the reaction mixture of 0.2% CO + 2% O2 balanced in He, after an oxidative treatment during 40 min of steady-state condition at 200 °C; (a) x = 0.00, (b) x = 0.05, (c) x = 0.20 and (d) x = 0.30 Co incorporation, Figure S20. OH-region DRIFTS spectra of the selected catalysts exposed to the reaction mixture of 0.2% CO + 2% O2 balanced in He, after an oxidative treatment during 40 min of steady-state condition at 200 °C, Figure S21. DRIFTS spectra of the selected catalysts exposed to the probe gas of 0.2% CO in He, after an oxidative treatment during 40 min of steady-state condition at 10 °C; (a) x = 0.00, (b) x = 0.05, (c) x = 0.20, (d) x = 0.25 and (e) x = 0.30 Co incorporation.

Author Contributions

Conceptualization, M.B. and K.F.O.; methodology, A.R. and S.N.; validation, M.K. and M.D.; investigation, M.K., M.D. and S.N.; resources, M.K., M.D., S.N. and A.R.; writing—original draft preparation, M.D. and S.N.; writing—review and editing, M.K., A.R., K.F.O. and M.B.; visualization, M.K., M.D. and S.N.; supervision, M.B.; project administration, M.B.; funding acquisition, M.B. All authors have read and agreed to the published version of the manuscript.

Funding

This work was funded by the Deutsche Forschungsgemeinschaft (DFG, German Research Foundation)—388390466—TRR 247 within projects A1 and C1.

Acknowledgments

The authors thank Markus Heidelmann from the “Interdisciplinary Center for Analytics on the Nanoscale (ICAN)”, a core facility funded by the German Research Foundation (DFG, reference RI_00313) for the TEM measurements. The authors also acknowledge Kateryna Loza for SEM measurements and Robin Meya and Beate Römer for providing AAS measurements. Furthermore, we acknowledge support by the Open Access Publication Fund of the University of Duisburg-Essen.

Conflicts of Interest

The authors declare no conflict of interest.

References

  1. Royer, S.; Duprez, D.; Can, F.; Courtois, X.; Batiot-Dupeyrat, C.; Laassiri, S.; Alamdari, H. Perovskites as substitutes of noble metals for heterogeneous catalysis: Dream or reality. Chem. Rev. 2014, 114, 10292–10368. [Google Scholar] [CrossRef] [PubMed]
  2. Kayaalp, B.; Lee, S.; Klauke, K.; Seo, J.; Nodari, L.; Kornowski, A.; Jung, W.; Mascotto, S. Template-free mesoporous La0.3Sr0.7Ti1−xFexO3±δ for CH4 and CO oxidation catalysis. Appl. Catal. B Environ. 2019, 245, 536–545. [Google Scholar] [CrossRef]
  3. Zhao, K.; He, F.; Huang, Z.; Wei, G.; Zheng, A.; Li, H.; Zhao, Z. Perovskite-type oxides LaFe1−CoO3 for chemical looping steam methane reforming to syngas and hydrogen co-production. Appl. Energy 2016, 168, 193–203. [Google Scholar] [CrossRef]
  4. Suntivich, J.; Gasteiger, H.A.; Yabuuchi, N.; Nakanishi, H.; Goodenough, J.B.; Shao-Horn, Y. Design principles for oxygen-reduction activity on perovskite oxide catalysts for fuel cells and metal-air batteries. Nat. Chem. 2011, 3, 546–550. [Google Scholar] [CrossRef]
  5. Suntivich, J.; May, K.J.; Gasteiger, H.A.; Goodenough, J.B.; Shao-Horn, Y. A perovskite oxide optimized for oxygen evolution catalysis from molecular orbital principles. Science 2011, 334, 1383–1385. [Google Scholar] [CrossRef]
  6. Peña, M.A.; Fierro, J.L. Chemical structures and performance of perovskite oxides. Chem. Rev. 2001, 101, 1981–2017. [Google Scholar] [CrossRef] [PubMed]
  7. Szabo, V.; Bassir, M.; van Neste, A.; Kaliaguine, S. Perovskite-type oxides synthesized by reactive grinding: Part II: Catalytic properties of LaCo(1−x)FexO3 in VOC oxidation. Appl. Catal. B Environ. 2002, 37, 175–180. [Google Scholar] [CrossRef]
  8. Sumathi, R.; Johnson, K.; Viswanathan, B.; Varadarajan, T.K. Selective oxidation and dehydrogenation of benzyl alcohol on ABB′O3 (A=Ba, B=Pb, Ce, Ti and B′=Bi, Cu, Sb)-type perovskite oxides-temperature programmed reduction studies. Appl. Catal. A Gen. 1998, 172, 15–22. [Google Scholar] [CrossRef]
  9. Waffel, D.; Alkan, B.; Fu, Q.; Chen, Y.-T.; Schmidt, S.; Schulz, C.; Wiggers, H.; Muhler, M.; Peng, B. Towards Mechanistic Understanding of Liquid-Phase Cinnamyl Alcohol Oxidation with tert-Butyl Hydroperoxide over Noble-Metal-Free LaCo1-x FexO3 Perovskites. ChemPlusChem 2019, 84, 1155–1163. [Google Scholar] [CrossRef] [Green Version]
  10. Voorhoeve, R.J.; Remeika, J.P.; Johnson, D.W. Rare-Earth manganites: Catalysts with low ammonia yield in the reduction of nitrogen oxides. Science 1973, 180, 62–64. [Google Scholar] [CrossRef]
  11. Voorhoeve, R.J.H.; Remeika, J.P.; Trimble, L.E. Defect chemistry and catalysis in oxidation and reduction over perovskite-type oxides. Ann. N. Y. Acad. Sci. 1976, 272, 3–21. [Google Scholar] [CrossRef]
  12. Baythoun, M.S.G.; Sale, F.R. Production of strontium-substituted lanthanum manganite perovskite powder by the amorphous citrate process. J. Mater. Sci. 1982, 17, 2757–2769. [Google Scholar] [CrossRef]
  13. Taguchi, H.; Yamada, S.; Nagao, M.; Ichikawa, Y.; Tabata, K. Surface characterization of LaCoO3 synthesized using citric acid. Mater. Res. Bull. 2002, 37, 69–76. [Google Scholar] [CrossRef]
  14. Gallagher, P.K.; Johnson, D.W.; Remeika, J.P.; Schrey, F.; Trimble, L.E.; Vogel, E.M.; Voorhoeve, R. The activity of La0.7Sr0.3MnO3 without Pt and La0.7Pb0.3MnO3 with varying Pt contents for the catalytic oxidation of CO. Mater. Res. Bull. 1975, 10, 529–538. [Google Scholar] [CrossRef]
  15. Angel, S.; Neises, J.; Dreyer, M.; Friedel Ortega, K.; Behrens, M.; Wang, Y.; Arandiyan, H.; Schulz, C.; Wiggers, H. Spray-flame synthesis of La(Fe, Co)O3 nano-perovskites from metal nitrates. AIChE J. 2019, 10, 441. [Google Scholar] [CrossRef] [Green Version]
  16. Alkan, B.; Cychy, S.; Varhade, S.; Muhler, M.; Schulz, C.; Schuhmann, W.; Wiggers, H.; Andronescu, C. Spray-Flame-Synthesized LaCo1−xFexO3 Perovskite Nanoparticles as Electrocatalysts for Water and Ethanol Oxidation. ChemElectroChem 2019, 6, 4266–4274. [Google Scholar] [CrossRef] [Green Version]
  17. Junwu, Z.; Xiaojie, S.; Yanping, W.; Xin, W.; Xujie, Y.; Lude, L. Solution-Phase Synthesis and Characterization of Perovskite LaCoO3 Nanocrystals via A Co-Precipitation Route. J. Rare Earths 2007, 25, 601–604. [Google Scholar] [CrossRef]
  18. Choudhary, V.R.; Uphade, B.S.; Belhekar, A.A. Oxidative Conversion of Methane to Syngas over LaNiO3Perovskite with or without Simultaneous Steam and CO2Reforming Reactions: Influence of Partial Substitution of La and Ni. J. Catal. 1996, 163, 312–318. [Google Scholar] [CrossRef]
  19. Sim, Y.; Yoo, J.; Ha, J.-M.; Jung, J.C. Oxidative coupling of methane over LaAlO3 perovskite catalysts prepared by a co-precipitation method: Effect of co-precipitation pH value. J. Energy Chem. 2019, 35, 1–8. [Google Scholar] [CrossRef] [Green Version]
  20. Kühl, S.; Düdder, H.; Girgsdies, F.; Kähler, K.; Muhler, M.; Behrens, M. Perovskites as Precursors for Ni/La2O3 Catalysts in the Dry Reforming of Methane: Synthesis by Constant pH Co-Precipitation, Reduction Mechanism and Effect of Ru-Doping. Z. Anorg. Allg. Chem. 2017, 643, 1088–1095. [Google Scholar] [CrossRef]
  21. Bedel, L.; Roger, A.; Estournes, C.; Kiennemann, A. Co0 from partial reduction of La(Co,Fe)O3 perovskites for Fischer–Tropsch synthesis. Catal. Today 2003, 85, 207–218. [Google Scholar] [CrossRef]
  22. Derakhshi, Z.; Tamizifar, M.; Arzani, K.; Baghshahi, S. Synthesis and Characterization of LaCoxFe1−xO3 (0≤x≤1) Nano-Crystal Powders by Pechini Type Sol–Gel Method. Synth. React. Inorg. M. 2016, 46, 25–30. [Google Scholar] [CrossRef]
  23. Wu, Y.; Cordier, C.; Berrier, E.; Nuns, N.; Dujardin, C.; Granger, P. Surface reconstructions of LaCo1−xFexO3 at high temperature during N2O decomposition in realistic exhaust gas composition: Impact on the catalytic properties. Appl. Catal. B Environ. 2013, 140–141, 151–163. [Google Scholar] [CrossRef]
  24. Yang, Y.; Shi, K. Preparation of LaFeXCo1−XO3 Perovskite by Coprecipitation. Open, J. Nat. Sci. 2016, 4, 378–383. [Google Scholar] [CrossRef]
  25. Kaiwen, Z.; Xuehang, W.; Wenwei, W.; Jun, X.; Siqi, T.; Sen, L. Nanocrystalline LaFeO3 preparation and thermal process of precursor. Adv. Powder Technol. 2013, 24, 359–363. [Google Scholar] [CrossRef]
  26. Kaliaguine, S.; Szabo, V.; van Neste, A.; Gallot, J.E.; Bassir, M.; Muzychuk, R. Perovskite-Type Oxides Synthesized by Reactive Grinding. Appl. Catal. A Gen. 2001, 11, 39–56. [Google Scholar] [CrossRef]
  27. Xu, J.; Liu, J.; Zhao, Z.; Zheng, J.; Zhang, G.; Duan, A.; Jiang, G. Three-dimensionally ordered macroporous LaCoxFe1−xO3 perovskite-type complex oxide catalysts for diesel soot combustion. Catal. Today 2010, 153, 136–142. [Google Scholar] [CrossRef]
  28. Staykov, A.; Téllez, H.; Akbay, T.; Druce, J.; Ishihara, T.; Kilner, J. Oxygen Activation and Dissociation on Transition Metal Free Perovskite Surfaces. Chem. Mater. 2015, 27, 8273–8281. [Google Scholar] [CrossRef]
  29. Seo, M.H.; Park, H.W.; Lee, D.U.; Park, M.G.; Chen, Z. Design of Highly Active Perovskite Oxides for Oxygen Evolution Reaction by Combining Experimental and ab Initio Studies. ACS Catal. 2015, 5, 4337–4344. [Google Scholar] [CrossRef]
  30. Yang, J.; Hu, S.; Fang, Y.; Hoang, S.; Li, L.; Yang, W.; Liang, Z.; Wu, J.; Hu, J.; Xiao, W.; et al. Oxygen Vacancy Promoted O2 Activation over Perovskite Oxide for Low-Temperature CO Oxidation. ACS Catal. 2019, 9, 9751–9763. [Google Scholar] [CrossRef]
  31. Freund, H.-J.; Meijer, G.; Scheffler, M.; Schlögl, R.; Wolf, M. CO oxidation as a prototypical reaction for heterogeneous processes. Angew. Chem. Int. Ed. 2011, 50, 10064–10094. [Google Scholar] [CrossRef]
  32. Lukashuk, L.; Yigit, N.; Rameshan, R.; Kolar, E.; Teschner, D.; Hävecker, M.; Knop-Gericke, A.; Schlögl, R.; Föttinger, K.; Rupprechter, G. Operando Insights into CO Oxidation on Cobalt Oxide Catalysts by NAP-XPS, FTIR, and XRD. ACS Catal. 2018, 8, 8630–8641. [Google Scholar] [CrossRef]
  33. Föttinger, K.; Schlögl, R.; Rupprechter, G. The mechanism of carbonate formation on Pd-Al2O3 catalysts. Chem. Commun. 2008, 3, 320–322. [Google Scholar] [CrossRef]
  34. Yi, Y.; Zhang, P.; Qin, Z.; Yu, C.; Li, W.; Qin, Q.; Li, B.; Fan, M.; Liang, X.; Dong, L. Low temperature CO oxidation catalysed by flower-like Ni–Co–O: How physicochemical properties influence catalytic performance. RSC Adv. 2018, 8, 7110–7122. [Google Scholar] [CrossRef] [Green Version]
  35. Kuhn, J.; Ozkan, U. Surface properties of Sr- and Co-doped LaFeO3. J. Catal. 2008, 253, 200–211. [Google Scholar] [CrossRef]
  36. Allmann, R.; Jepsen, H.P. Die Struktur des Hydrotalkits. Neues Jahrb. Miner. Mon. 1969, 1969, 544–551. [Google Scholar]
  37. Xie, J.; Wu, Q.; Zhang, D.; Ding, Y. Biomolecular-Induced Synthesis of Self-Assembled Hierarchical La(OH)CO3 One-Dimensional Nanostructures and Its Morphology-Held Conversion toward La2O3 and La(OH)3. Cryst. Growth Des. 2009, 9, 3889–3897. [Google Scholar] [CrossRef]
  38. del Arco, M.; Trujillano, R.; Rives, V. Cobalt-iron hydroxycarbonates and their evolution to mixed oxides with spinel structure. J. Mater. Chem. 1998, 8, 761–767. [Google Scholar] [CrossRef]
  39. Uzunova, E.; Klissurski, D.; Mitov, I.; Stefanov, P. Cobalt-iron hydroxide carbonate as a precursor for the synthesis of high-dispersity spinel mixed oxides. Chem. Mater. 1993, 5, 576–582. [Google Scholar] [CrossRef]
  40. Wang, C.-B.; Lin, H.-K.; Tang, C.-W. Thermal Characterization and Microstructure Change of Cobalt Oxides. Catal. Lett. 2004, 94, 69–74. [Google Scholar] [CrossRef]
  41. Sangaletti, L.; Depero, L.E.; Allieri, B.; Nunziante, P.; Traversa, E. An X-ray study of the trimetallic LaxSm1−xFeO3 orthoferrites. J. Eur. Ceram. Soc. 2001, 21, 719–726. [Google Scholar] [CrossRef]
  42. Shannon, R.D. Revised effective ionic radii and systematic studies of interatomic distances in halides and chalcogenides. Acta. Cryst. 1976, 32, 751–767. [Google Scholar] [CrossRef]
  43. Gaikwad, V.M.; Acharya, S.A. Novel perovskite–spinel composite approach to enhance the magnetization of LaFeO3. RSC Adv. 2015, 5, 14366–14373. [Google Scholar] [CrossRef]
  44. Rietveld, H.M. Line profiles of neutron powder-diffraction peaks for structure refinement. Acta. Cryst. 1967, 22, 151–152. [Google Scholar] [CrossRef]
  45. Cui, H.; Zayat, M.; Levy, D. Epoxide assisted sol–gel synthesis of perovskite-type LaMxFe1−xO3 (M=Ni,Co) nanoparticles. J. Non-Cryst. Solids 2006, 352, 3035–3040. [Google Scholar] [CrossRef]
  46. Faye, J.; Baylet, A.; Trentesaux, M.; Royer, S.; Dumeignil, F.; Duprez, D.; Valange, S.; Tatibouët, J.-M. Influence of lanthanum stoichiometry in La1−xFeO3−δ perovskites on their structure and catalytic performance in CH4 total oxidation. Appl. Catal. B Environ. 2012, 126, 134–143. [Google Scholar] [CrossRef]
  47. Mihai, O.; Chen, D.; Holmen, A. Chemical looping methane partial oxidation: The effect of the crystal size and O content of LaFeO3. J. Catal. 2012, 293, 175–185. [Google Scholar] [CrossRef]
  48. Chang, H.; Bjørgum, E.; Mihai, O.; Yang, J.; Lein, H.L.; Grande, T.; Raaen, S.; Zhu, Y.-A.; Holmen, A.; Chen, D. Effects of Oxygen Mobility in La–Fe-Based Perovskites on the Catalytic Activity and Selectivity of Methane Oxidation. ACS Catal. 2020, 10, 3707–3719. [Google Scholar] [CrossRef]
  49. Khan, S.; Oldman, R.J.; Corà, F.; Catlow, C.R.A.; French, S.A.; Axon, S.A. A computational modelling study of oxygen vacancies at LaCoO3 perovskite surfaces. Phys. Chem. Chem. Phys. 2006, 8, 5207–5222. [Google Scholar] [CrossRef]
  50. Lu, H.; Zhang, P.; Qiao, Z.-A.; Zhang, J.; Zhu, H.; Chen, J.; Chen, Y.; Dai, S. Ionic liquid-mediated synthesis of meso-scale porous lanthanum-transition-metal perovskites with high CO oxidation performance. Chem. Commun. (Camb.) 2015, 51, 5910–5913. [Google Scholar] [CrossRef]
  51. Ciambelli, P.; Cimino, S.; de Rossi, S.; Lisi, L.; Minelli, G.; Porta, P.; Russo, G. AFeO3 (A=La, Nd, Sm) and LaFe1−xMgxO3 perovskites as methane combustion and CO oxidation catalysts: Structural, redox and catalytic properties. Appl. Catal. B Environ. 2001, 29, 239–250. [Google Scholar] [CrossRef]
  52. Zhang, X.; Li, H.; Li, Y.; Shen, W. Structural Properties and Catalytic Activity of Sr-Substituted LaFeO3 Perovskite. Chin. J. Catal. 2012, 33, 1109–1114. [Google Scholar] [CrossRef]
  53. Li, P.; Hu, X.; Zhang, L.; Dai, H.; Zhang, L. Sol-gel nanocasting synthesis of patterned hierarchical LaFeO3 fibers with enhanced catalytic CO oxidation activity. Nanoscale 2011, 3, 974–976. [Google Scholar] [CrossRef] [PubMed]
  54. Hwang, J.; Rao, R.R.; Katayama, Y.; Lee, D.; Wang, X.R.; Crumlin, E.; Venkatesan, T.; Lee, H.N.; Shao-Horn, Y. CO2 Reactivity on Cobalt-Based Perovskites. J. Phys. Chem. C 2018, 122, 20391–20401. [Google Scholar] [CrossRef]
  55. Coenen, K.; Gallucci, F.; Mezari, B.; Hensen, E.; van Sint Annaland, M. An in-situ IR study on the adsorption of CO2 and H2O on hydrotalcites. J. CO2 Util. 2018, 24, 228–239. [Google Scholar] [CrossRef]
  56. Hadjiivanov, K.I.; Vayssilov, G.N. Characterization of oxide surfaces and zeolites by carbon monoxide as an IR probe molecule; Elsevier: Amsterdam, The Netherlands, 2002; pp. 307–511. ISBN 9780120078479. [Google Scholar]
  57. Signorile, M.; Zamirri, L.; Tsuchiyama, A.; Ugliengo, P.; Bonino, F.; Martra, G. On the Surface Acid–Base Properties of Amorphous and Crystalline Mg2SiO4 as Probed by Adsorbed CO, CO2, and CD3CN. ACS Earth Space Chem. 2020, 4, 345–354. [Google Scholar] [CrossRef]
  58. Wang, X.; Li, X.; Mu, J.; Fan, S.; Chen, X.; Wang, L.; Yin, Z.; Tadé, M.; Liu, S. Oxygen Vacancy-rich Porous Co3O4 Nanosheets toward Boosted NO Reduction by CO and CO Oxidation: Insights into the Structure-Activity Relationship and Performance Enhancement Mechanism. ACS Appl. Mater. Interfaces 2019, 11, 41988–41999. [Google Scholar] [CrossRef]
  59. Drenchev, N.L.; Chakarova, K.K.; Lagunov, O.V.; Mihaylov, M.Y.; Ivanova, E.Z.; Strauss, I.; Hadjiivanov, K.I. In situ FTIR Spectroscopy as a Tool for Investigation of Gas/Solid Interaction: Water-Enhanced CO2 Adsorption in UiO-66 Metal-Organic Framework. J. Vis. Exp. 2020, 156. [Google Scholar] [CrossRef]
Figure 1. (a) SEM image of the x = 0.05 sample after co-precipitation, washing, and drying. (b) The SEM image of the sample with x = 0.15 shows the formation of hexagonal platelet structures, highlighted by green arrows.
Catalysts 11 00550 g001
Figure 2. (a) XRD powder patterns of the as-prepared sample series. (b) Co contents in the samples before calcination. (c) ATR-FTIR spectra of the samples before calcination. (d) Thermogravimetry mass losses.
Catalysts 11 00550 g002
Figure 3. (a) XRD powder patterns of the samples after calcination. (b) Lattice parameters of the samples from Rietveld refinement plotted against the experimental Co content.
Catalysts 11 00550 g003
Figure 4. (a) SEM image of the sample with x = 0.05 after calcination. (b) TEM image of the sample with x = 0.05 after calcination. (c) BET surface areas compared to the particle diameters. (d) ATR-FTIR spectra of the samples after calcination.
Catalysts 11 00550 g004
Figure 5. (a) CO oxidation conversions of the perovskites from 50 to 500 °C in the reaction mixture of 2% CO + 20% O2 balanced in He. (b) Rates of the sample series up to a conversion of 65% in the same reaction mixture. (c) Comparison between CO oxidation conversions for 95% conversion and rates at 175 °C derived from (a,b).
Catalysts 11 00550 g005
Figure 6. (a) DRIFTS spectra of sample x = 0.25 exposed to the reaction mixture of 0.2% CO + 2% O2 balanced in He, after a He-treatment at 150 °C during a transient experiment (b) DRIFTS spectra of sample x = 0.25 exposed to the reaction mixture of 0.2% CO + 2% O2 balanced in He, after an oxidative treatment during 40 min of steady-state condition at 200 °C.
Catalysts 11 00550 g006
Figure 7. (a) DRIFTS spectra of the selected 20% O2-treated catalysts after 40 min of exposure to the reaction mixture of 0.2%CO + 2% O2 in He at 200 °C. The labels represent the Co content in the catalysts. (b) MS CO2 traces during the isothermal holding period in the reaction mixture of 0.2% CO + 2% O2 balanced in He. (c) Integrals of the carbonate region normalized on exposed BET surface area in the spectra during the experiment in the reaction mixture of 0.2% CO + 2% O2 balanced in He.
Catalysts 11 00550 g007
Figure 8. DRIFTS spectra of the selected 20% O2-treated catalysts after 40 min of exposure to the probe gas of 0.2% CO in He at 10 °C. The labels represent the Co content in the catalysts.
Catalysts 11 00550 g008
Table 1. Characterization data of the samples after calcination, including Rietveld refinement, surface area, pore-volume, and particle size. The crystallite size was determined as the volume-weight mean column height from integral breadth.
x =a [Å]b [Å]c [Å]Cell Volume [Å3]Crystallite Size (LVol-IB)
[nm]
SABET
[m2 g−1]
Pore Volume
[cm3 g−1]
Particle Size (TEM)
[nm]
Particle Size (SEM)
[nm]
0.005.5494 (7)5.5587 (2)7.8464 (6)242.047346.6160.1332.4 ± 14.551.2 ± 8.6
0.055.5477 (0)5.5537 (6)7.8396 (2)241.544145.7180.1235.1 ± 11.949.4 ± 9.5
0.105.5429 (5)5.5452 (7)7.8332 (7)240.773433.2240.1626.4 ± 7.841.9 ± 7.5
0.155.5385 (1)5.5390 (2)7.8286 (1)240.166434.4170.1629.5 ± 10.258.7 ± 9.7
0.205.5300 (8)5.5280 (7)7.8163 (2)238.950832.3180.1536.6 ± 10.042.2 ± 7.6
0.255.5234 (3)5.5172 (5)7.8054 (2)237.863745.4150.0453.3 ± 15.978.2 ± 11.9
0.305.5188 (9)5.5157 (3)7.7989 (8)237.407033.8250.2639.6 ± 10.848.2 ± 7.2
Publisher’s Note: MDPI stays neutral with regard to jurisdictional claims in published maps and institutional affiliations.

