Article

Characterization and Structure Elucidation of Binary Zr:Ti MEL Structure; Simultaneous Photodegradation/Removal of Organic–Inorganic Pollutants

by
Samia A. Kosa
1,*,
Islam H. Abd El Maksod
1,2,*,
Eman Z. Hegazy
1,2 and
Naha M. Al-sebaii
1
1
Chemistry Department, Faculty of Science, King Abdulaziz University, Jeddah 21589, Saudi Arabia
2
Physical Chemistry Department, National Research Centre (NRC), Dokki, Cairo 12622, Egypt
*
Authors to whom correspondence should be addressed.
Submission received: 30 March 2021 / Revised: 29 April 2021 / Accepted: 11 May 2021 / Published: 14 May 2021
(This article belongs to the Special Issue Catalysts for Advanced Synthesis)

Abstract

:
The preparation of a series of different Ti/Zr MEL structure was performed successfully. Full characterization of the prepared materials was done using XRD, IR, DR, and SEM. The results show that the prepared materials contain only one crystalline phase (ZSM-11). The affinity of Zr to form the crystalline phase alone in a binary Zr/Ti synthesizing mixture was approved by SEM and elemental analysis results. The percentage of each active site was calculated. DR spectra were deconvoluted, and three active sites were supposed and quantified (tetragonal, octahedral, and crystalline). The mutual effect of ions (lead, copper, cobalt, and nickel) and methylene blue dye on the removal efficiency with and without ultraviolet irradiation was examined and fully characterized. The ions largely influence the photodegradation process, and a mechanism was formulated. Meanwhile, the presence of dye showed a negligible effect on the removal of ions.

1. Introduction

Zeolite Socony Mobile 11 or ZSM-11 with a bi-dimensional ten-ring pore system structure is still attracting more and more attention, hence its first patent by Mobil Oil Company in the 1970s [1]. Due to its unique structure, it is considered as a good high shape-selective catalyst in petrochemical industries [2,3]. In addition to that, ZSM-11 exhibits outstanding properties such as large surface area, hydrothermal constancy, sharp unipore distribution profile, and the capability of restricting the active species on and inside its pores [4,5,6]. Moreover, ZSM-11 enters also the field of fine chemical synthesis such as the conversion of methanol into olefins [7,8,9,10].
The incorporation of foreign cation into the framework of a zeolite structure usually attains new useful characteristics to the modified materials. Thus, for example, the incorporation of vanadium into an analcime structure resulted in increasing the removal capacity for heavy metal through its inclusion as an octahedral species rather than the usual isomorphs substitution of Si in tetrahedral positions [11].
Moreover, the recent incorporation of photoactive centers into the zeolite framework such as Ti4+ ions added excellent photocatalytic properties in addition to its original properties [12,13]. Although the incorporation of Ti4+ or Sn4+ and V4+ into the MEL structure could be found in the literature [14,15,16,17], only a few papers dealt with the incorporation of Zr4+ into the framework of the MEL structure [18].
The removal of pollutants, especially organic dyes and heavy metals, is still considered to be challenging work. Hence, the purpose of treatment is not only the removal process, but it is extended to include many environmental restrictions either for the methods and/or effectiveness. Among many methods of removal, the photodegradation of organic pollutants is environmentally safe; it uses only light and non-poisonous photocatalyst. It attracts also special interest when it uses the direct sunlight in removal [19]. In addition, due to the variety of industrial applications and consequent multiple kinds of pollutants as waste, urgent demands to find a mutual treatment of different kinds of pollutants in the same process are arising. Our previous work [20] used a simultaneous treatment of organic and inorganic pollutants using mixed adsorbents of zeolite and active carbon to remove organic dye in contact with heavy metals. Although the adsorption process was effective, the post-treatment of the adsorbents bearing very poisonous organic dye may cause other environmental issues.
In this work, for the first time, the preparation of only a Ti-Zr MEL structure with the full characterization and elucidation of a crystal structure was performed. After which, the study of its use in the simultaneous removal of organic dyes and heavy metals in one process in the presence and absence of light irradiation was performed. To our knowledge, this is the first time to study such a system for this purpose.

2. Results and Discussion

2.1. XRD

Figure 1 shows the XRD diffraction patterns of ZSM-11 prepared samples. From this figure, it could be concluded that the ZSM-11phase is the only crystalline phase found. Table 1 shows the crystal lattice analysis related to the reference PDF card. A Scherer equation was used to calculate the crystallite size of each pattern [11].
From Table 1, it could be concluded that the deviation in lattice parameters from the reference pattern was observed in all samples. Thus, ZSM-11 reference is originally tetragonal. Pure Zr and pure Ti ZSM-11 samples showed only deviation in lattice constants (a, b, c) where they exhibit orthorhombic crystals. However, mixed Zr:Ti samples, showed higher deviation order as the percentage of Zr increases. The sample of 66% Zr (2Zr: 1Ti) showed maximum deviation with triclinic symmetry. This deviation gives us more or less some evidence about the introduction of both Ti and Zr in the lattice.

2.2. SEM and EDX Analysis

Figure 2 shows the SEM images of all investigated samples. From this figure, it could be observed that orthorhombic shapes were observed in all samples superimposed on an amorphous undefined shaped matrix. In addition to that, spherical-shaped particles were observed in some samples and very well observed in the 1Ti:1Zr sample.
Table 2 shows an EDX analysis of orthorhombic shapes, which indicates that orthorhombic shapes contain no Ti except for 100% Ti and 2Zr:1Ti samples where Ti is incorporated. In addition, the analysis of spherical particles in some different samples (given in Table 3) contains both Ti and Zr with constant ratio of Si/(Zr + Ti) ratio (≈12) where Si/(Zr + Ti) ratios in orthorhombic shapes differs according to the variation of samples.
The formation of Ti-ZSM-11 and Zr-ZSM-11 was obtained in a pure crystalline form. An orthorhombic crystal was observed as evidenced by XRD lattice analysis. In addition, these orthorhombic crystals are well observed in the SEM image. Although both are well crystalline, the Zr ZSM-11 is much more crystalline than the corresponding Ti analog.
However, trying to mix Zr and Ti within the same molar ratio resulted in a dramatic behavior. Thus, although XRD patterns give only a ZSM-11 phase, the SEM image shows two forms of shapes; one is orthorhombic crystal and the other is a small spherical shapes. The EDX spot analysis of each form revealed that the orthorhombic shapes contain only Zr in its structure beside other components (Na, Si, O), while the spherical shape contains both Zr and Ti. In addition, the XRD patterns shows only the ZSM-11 phase. This could be explained by the affinity of Zr to form ZSM-11 phase being much higher than that of Ti when they exist together in the same synthesizing mixtures. Thus, the 1Zr:1Ti molar ratio starting mixture revealed less crystalline phase of ZSM-11 (28.6% partial crystallinity related to the 100% Zr sample). Changing the ratio of Zr:Ti resulted in a variety of observations. Thus, by increasing the Ti in the synthesizing mixture to be 2Ti:1Zr; the overall XRD patterns show an increase in the degree of crystallinity of only the ZSM-11 phase. However, the SEM image supported by EDX analysis shows that the orthorhombic crystals contain only Zr, while the spherical shapes contain again Zr and Ti. This leads us to conclude that the presence of Ti enhances the crystallization rate with Zr. Combining these results with those obtained from XRD patterns that show only ZSM-11 and no other phases enables us to conclude that the spherical shapes have no XRD evidence or at least it is beyond its detection limits. Here, we assume that the degree of crystallinity should proportional to the amount of Zr. Although this assumption could be correct, the degree of crystallinity of the 2Ti:1Zr sample should be less than that of the 1Zr:1Ti sample; hence, the relative amount of Zr in the former sample is 33.33%, while in the last sample, it is 50%. Comparing the partial crystallinity values (Table 2) with previous values, a reverse manner was observed. Thus, the 50% Zr sample shows only a 28.6% degree of partial crystallinity, while the 33.33% Zr sample shows 53.8% crystallinity. This problem could be resolved only if we assume that not all Zr is contributed in the orthorhombic phase of pure Zr sample. In other words, not all the Zr matrix is crystallized. We assume by this assumption that the presence of Ti in the synthesizing mixture enhances more Zr that was not crystallized before it is crystallized. First, we assume that the degree of crystallinity is proportional to the percentage of Zr. The sample 1Ti:1Zr will be 50%, which means that the degree of relative crystallinity should be 50%. Subtracting this value from the actual relative degree of crystallinity (related to 100% Zr) results in obtaining the amount of Zr responsible for amorphous phases (50–28.6 = 21.4%). Again, if we assume that the amount of Zr attracted to amorphous phases is proportional to the percentage of Ti that exists in the synthesizing mixture, then we assume that 50%Ti will attract 21.4% Zr. Assuming linearity, then by simple calculation, we can calculate the percentage of Zr attracted to amorphous phases in other samples containing 66.6% Ti (2Ti:1Zr sample) to be 28.5% Zr. Subtracting this value from the percentage of Zr that exists in the sample (33.33%) resulted in the amount of Zr that theoretically remained for the formation of the crystallized ZSM-11 phase. This gives us the value of 4.8%. Now, if we correlate this value to the partial degree of crystallinity (53.8%), then we can conclude that for the 100% Zr sample, the actual degree of crystallinity should be 1120.8 if we assume all Zr contributed. The new degree of crystallinity is divided by this value nominated “normalized crystallinity” (Table 4).
Increasing the amount of Zr in the synthesizing mixture to be 66.66% enhances the incorporation of Ti as well as Zr in the orthorhombic crystals as could be evidenced by EDX analysis. However, in this time, crystal lattice analysis revealed that this crystal system transformed from orthorhombic to triclinic, evidencing the strain in the crystal resulted from the presence of both Ti and Zr in the same crystal system.

2.3. Diffuse Reflectance Spectra

The band gap energy could be calculated using the Kubelka–Munk method [21] (Figure 3). The band gap values were found to be decreased as the percentage of Zr increased. In all cases, the band gap value (3.48–365 eV) is higher than that of anatase form TiO2 (3.2 eV) [22]. This may reflect the crystalline environment of the zeolite structure around M4+, which put it in a more restricted environment.
In addition, the deep analysis of the diffuse spectra reveals three peaks: one around 220 nm, the second in the center around 250 nm, and the third is around 270 nm. In order to quantify these peaks, deconvolution analysis using origin 8.5 were performed. The results are shown in Table 5 and Figure 4. These results show that all samples exhibit three peaks with different intensities except for that of 100% Zr, where the peak around 270 nm is missing. Searching the literature for interpretation of these peaks, it was found that the peak around 220 nm is attributed to tetrahedral M4+ ions [23] and the peak around 270 is attributed to octahedral M4+ [23,24,25], while the peak around 250 nm is due to the presence of M4+ in an ultra-thin environment and resulting from the quantum size effect of nano crystal [23,24]. The tetrahedral and octahedral peaks could be quantified and rationalized [23], while the middle peak around 250 nm could not quantified because of the quantum size effect, which may replicate the transition of electrons between the quantum levels.
In order to deduce the active centers, it was assumed that the crystalline part is completely tetragonal: either it contains Ti or Zr. Moreover, the amorphous part should contain both tetragonal and octahedron Ti or Zr. Returning to the above calculations (Table 4) of amorphous and crystalline parts, we can rationalize the tetragonal and octahedral sites in the amorphous part after subtracting the percentage of crystalline from tetragonal sites to obtain the data in Table 6.

2.4. Infrared Spectra of the Samples

The IR spectra of all samples are given in Figure 5. From this figure, it could be observed that the following peaks are found: 544, 794, 973, 1070, and 1230 cm−1.
The peak at 450 cm−1 is attributed to the internal tetrahedral bending vibration of O-M-O (M = Ti or Zr Or Si) and peaks around 794 are attributed to the symmetrical stretching of external tetrahedral linkage [25]. In addition, the band at 1078 refers to internal bridging, while the one at 1230 refers to external bridging [26]. Furthermore, the more intense peak at 1230 could be an indication of changing the density of the framework [27]. From Figure 5, it observed that this peak becomes much more intense as the percentage of Zr increases, which is much more clear and sharp in 100% Zr.

2.5. Simultaneous Photodegradation Removal of Ions and MB Dye

In order to examine the prepared materials in the simultaneous removal of organic and inorganic pollutants, a series of experiments were performed using different concentration of ions (Pb2+, Cu2+, Ni2+, Co2+) and methylene blue dye as an example of organic pollutant over the prepared materials. Methylene blue dye is an example of cationic dye, which may be a good competitor for the inorganic cations in solutions.

2.5.1. Effect of Ions on Photodegradation of Dye

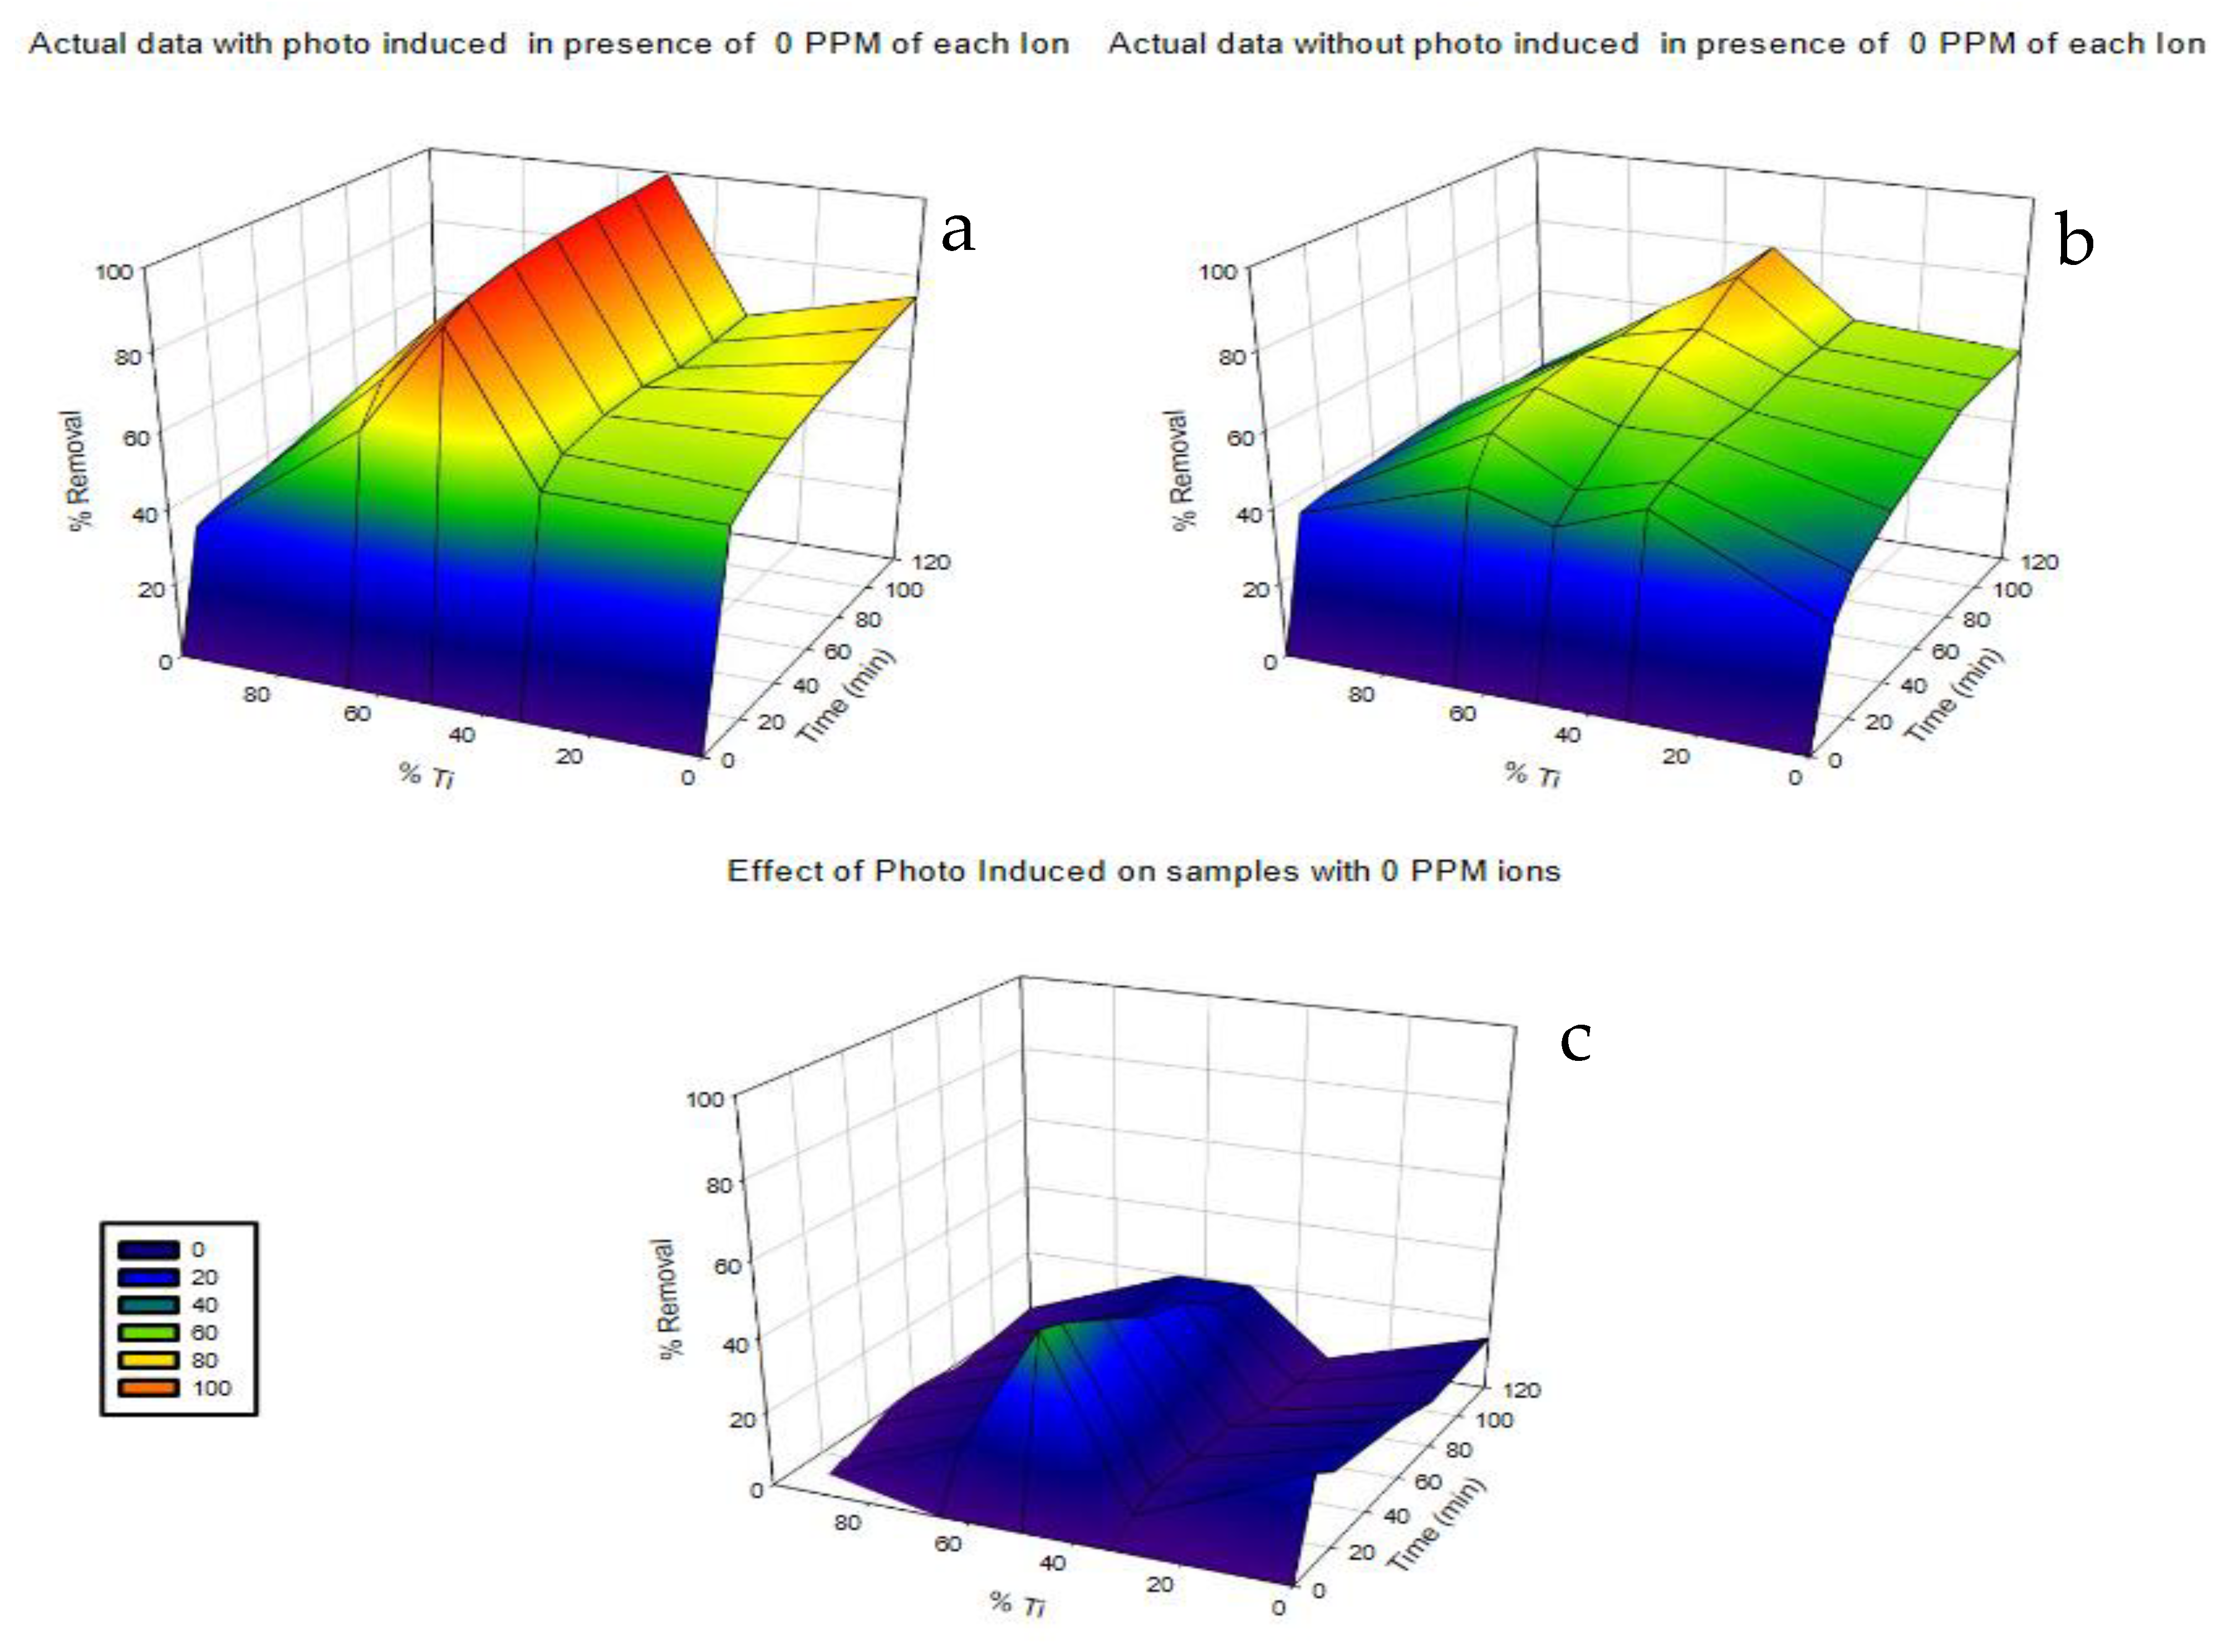
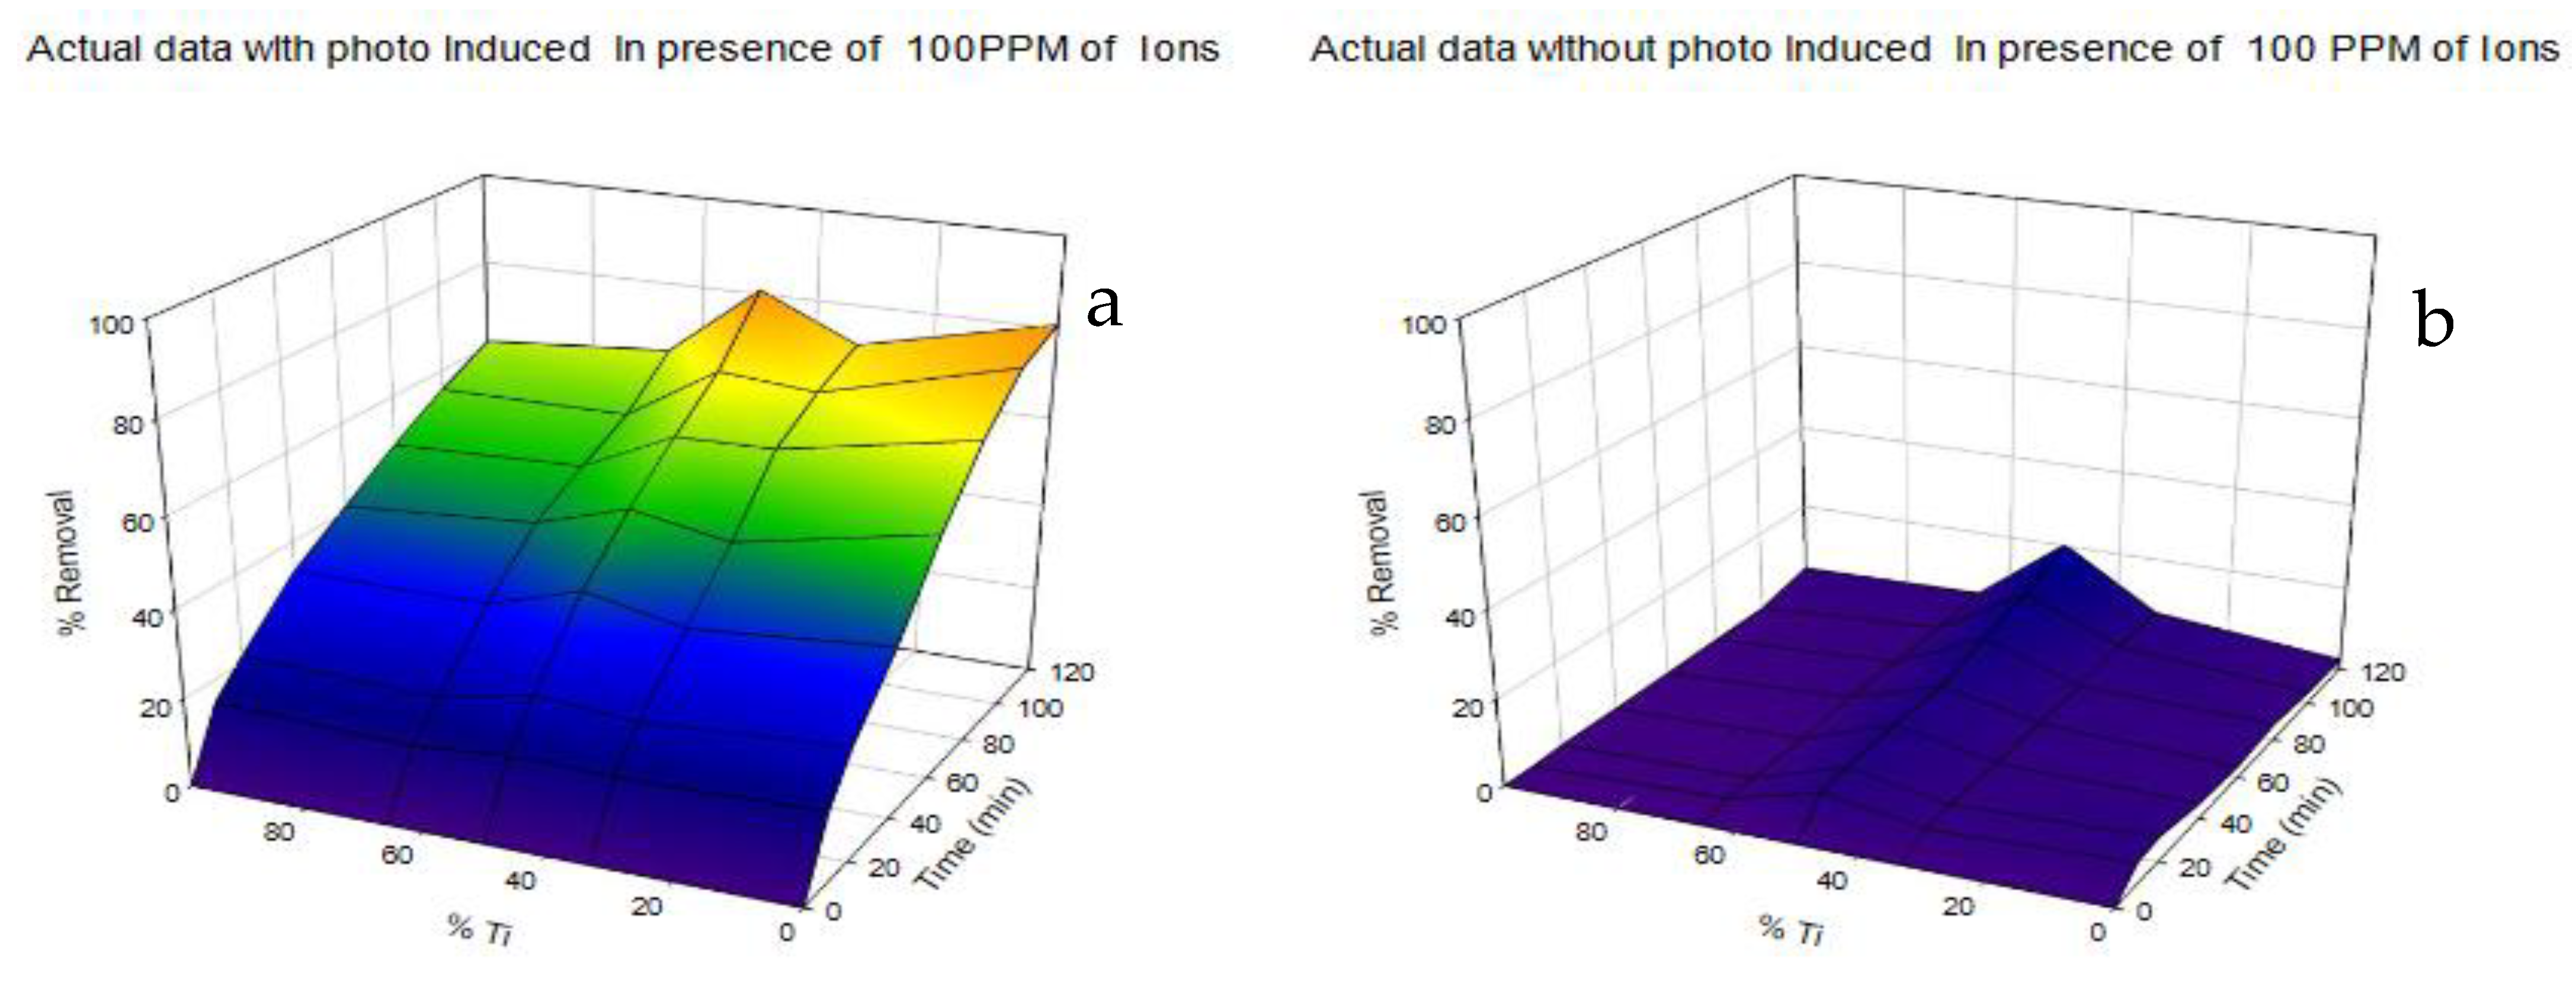
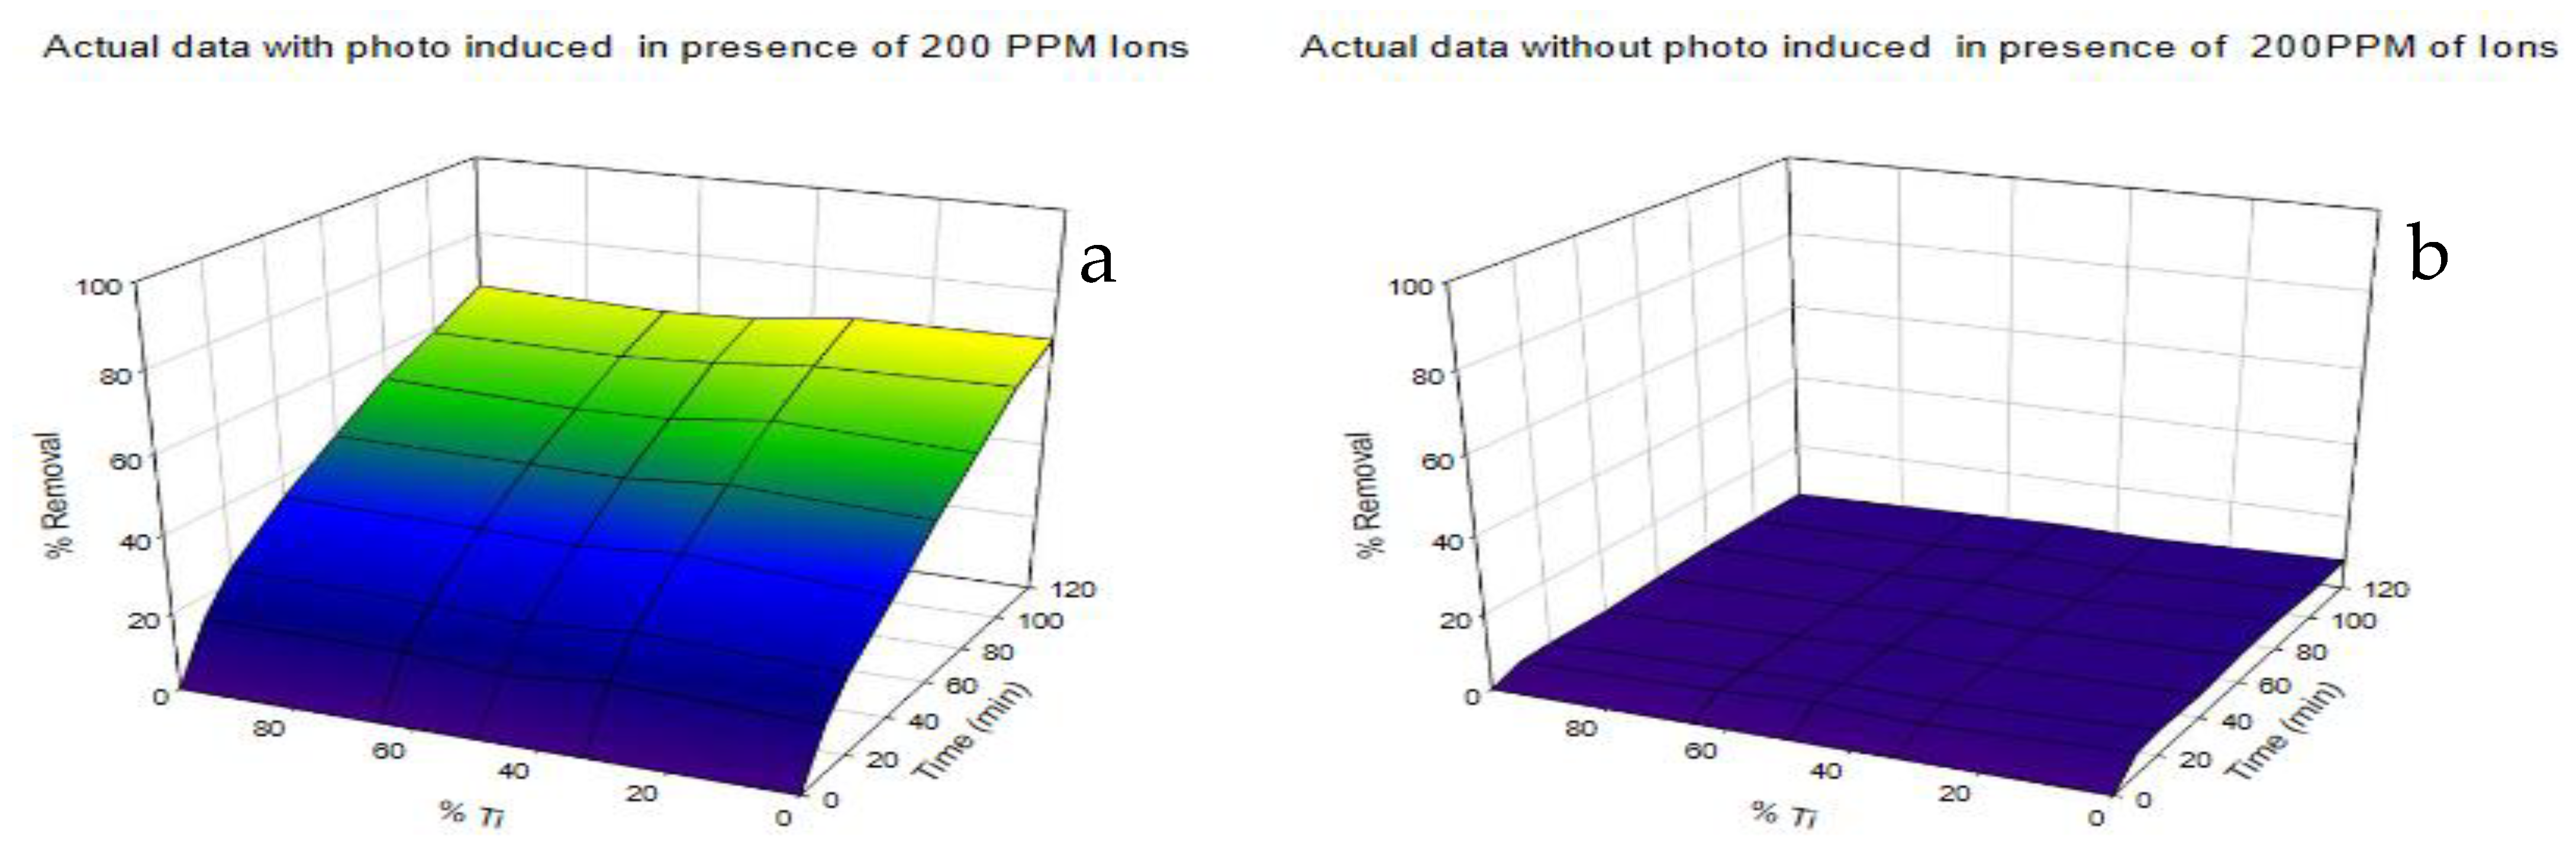
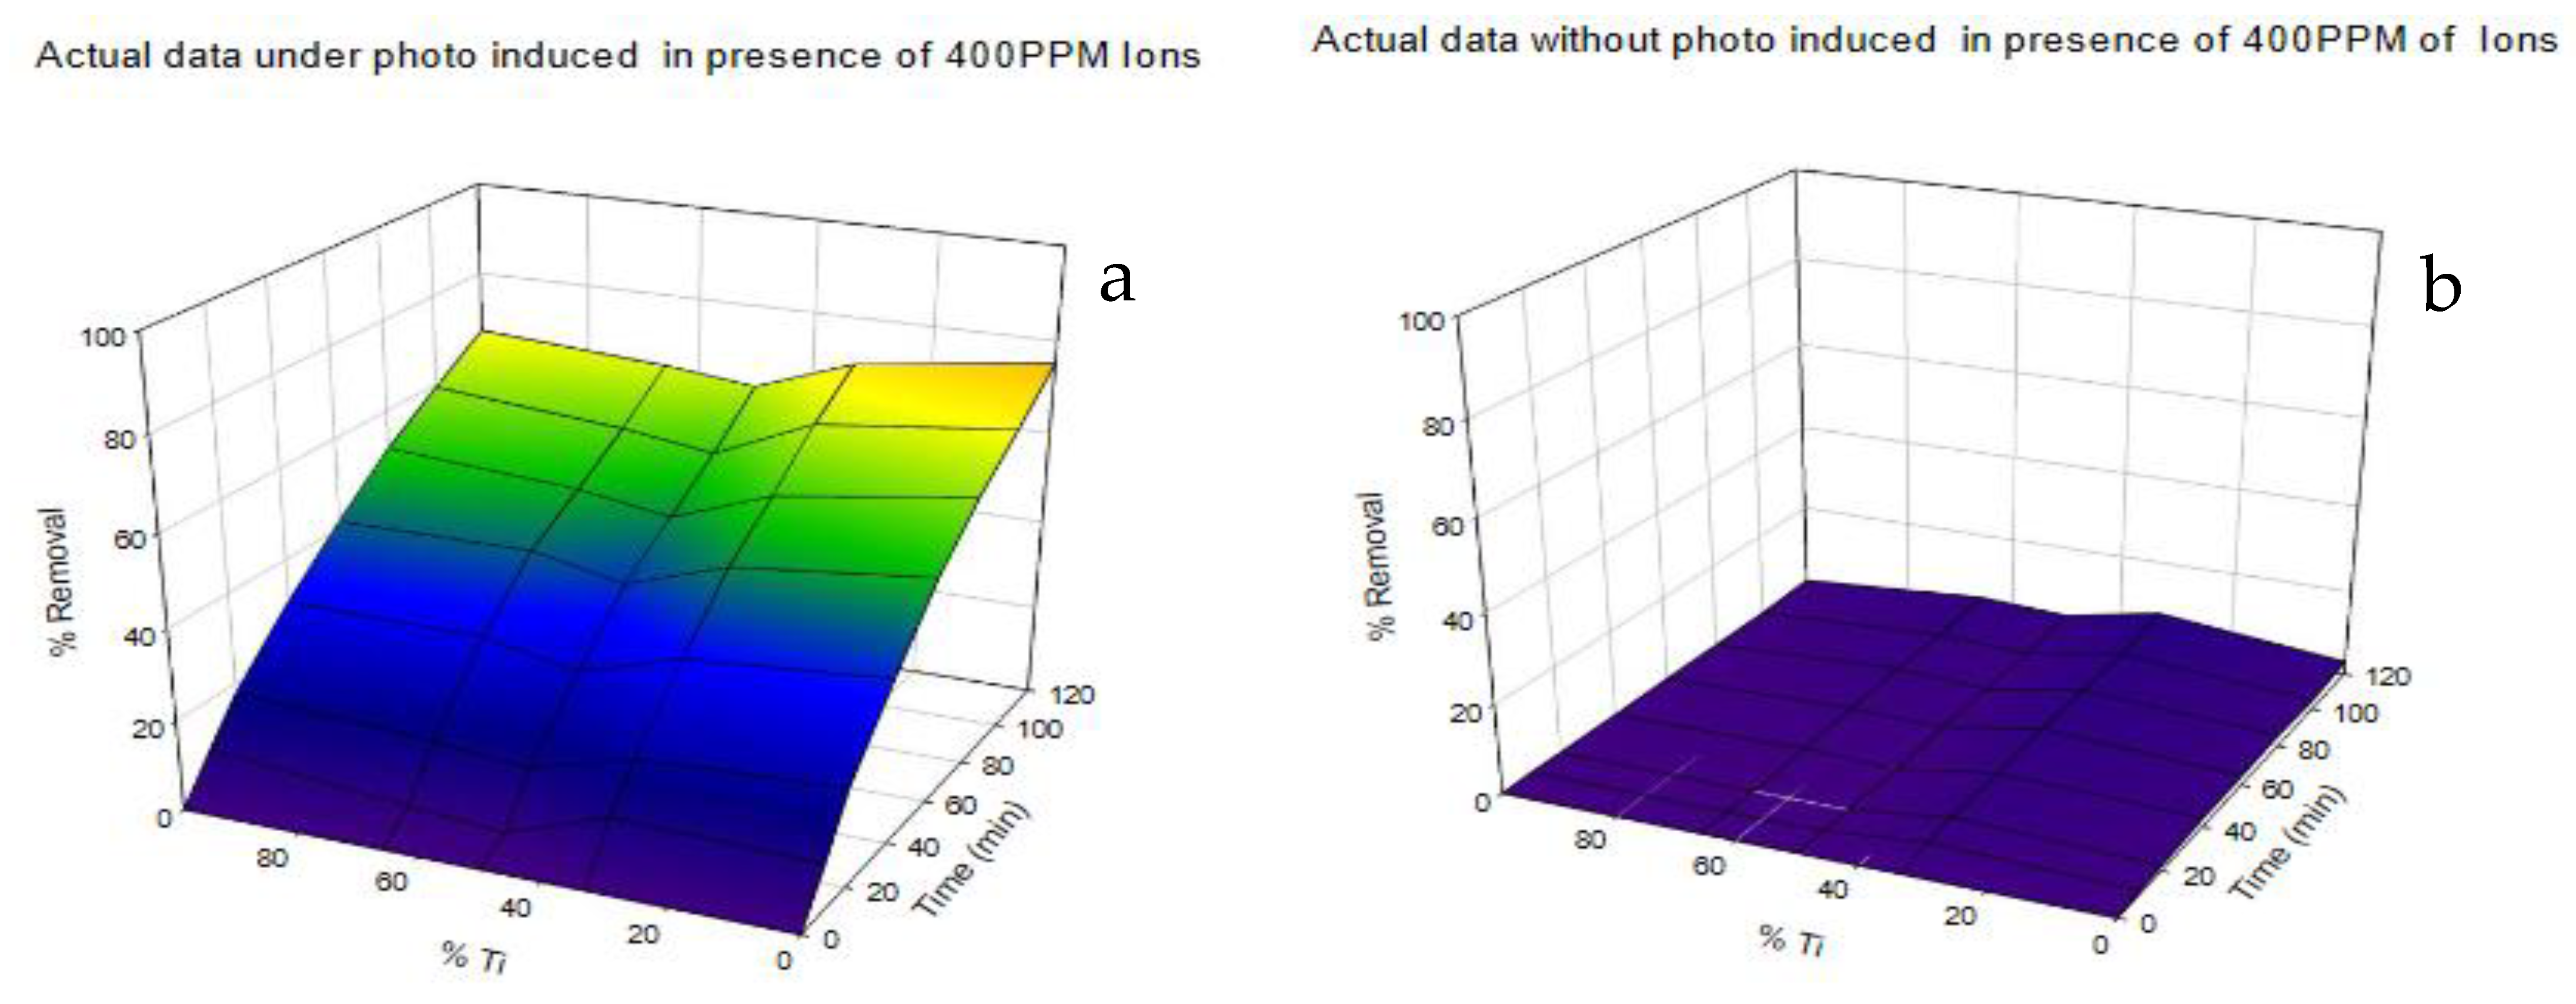
In order to study the effect of ions on the photodegradation of dye at different concentration of ions, namely 400, 200, and 100 ppm, equal concentrations of each ion were combined with 10 ppm dye and mixed with each sample. The removal process was performed in the presence and absence of UV irradiation (Figure 6, Figure 7, Figure 8 and Figure 9). From these figures, it was observed that in the absence of ions, amounts of dye adsorbed are very high (>40%), and the effect of photo irradiation on the removal of dye is very limited (less than 40%). In addition, the 1Ti:1Zr sample shows higher photocatalytic activity than the other samples. A dramatic change was observed after introducing the ions into the solution. Thus, even at 100 ppm ions, the adsorption curves of the dye were very low (not exceeding 10%), while the effect of photo irradiation is enlarged (>60%). This behavior may be explained by the fact that the MB dye is cationic and the presence of other cations in solution will enhance the competition among them on the surface of adsorbent sites and repel out the dye from its surface.
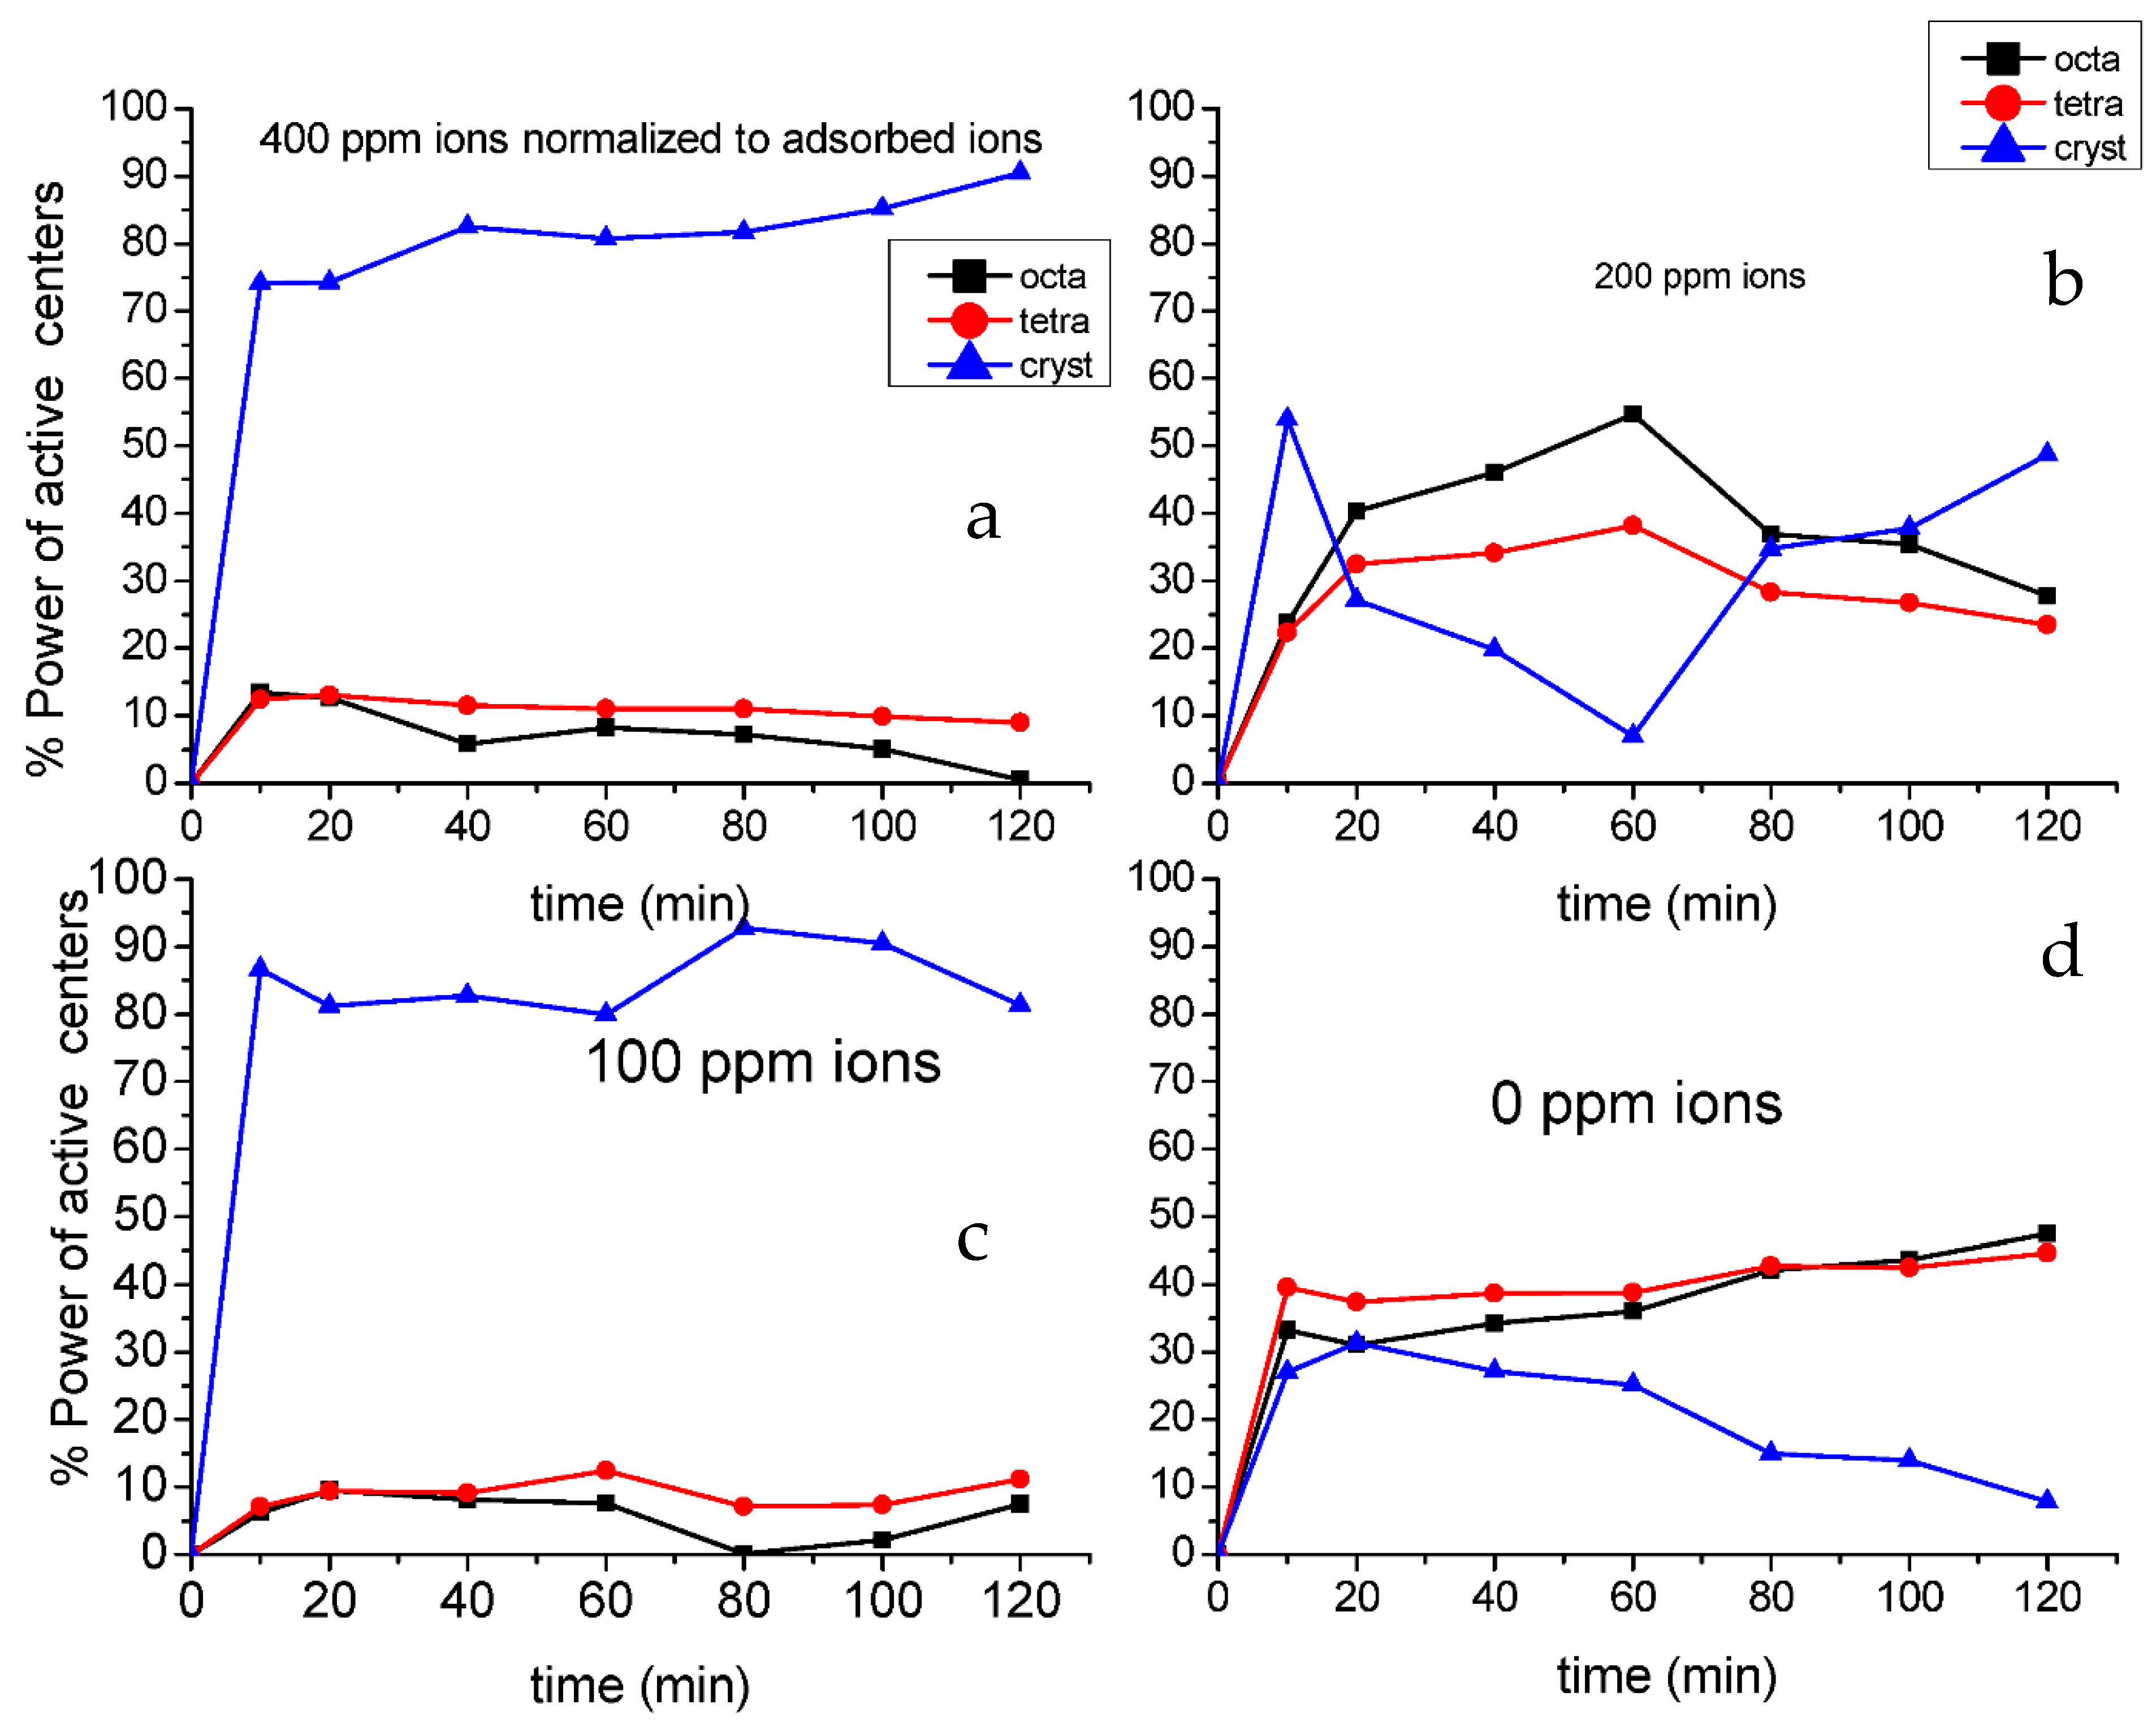
In order to deeply analyze the effect of ions, we suppose an equation of
N1 × X + M1 × Y + L1 × Z = R1
where X is the power of octahedral sites, Y is the power of tetrahedral amorphous sites, and Z is the power of crystallite sites. N1, M1, and L1 are the percentage of each site (Table 6). By definition, the power of an active site is the percentage contribution of each active site in the photodegradation process. In order to solve this equation, mixed samples of 2Ti:1Zr, 1Ti:1Zr, and 2Zr:1Ti were chosen to solve these equations with time (details of calculations could be found in Supplementary Files). In the above solutions, we use only the effect of photoinduction by subtracting the irradiated curves with non-irradiated ones and then applying them in the equation. Figure 10 represents the results of solving the above equation with time. We use the data from the above equation and predict 100% Ti and 100% Zr samples (Table 7).
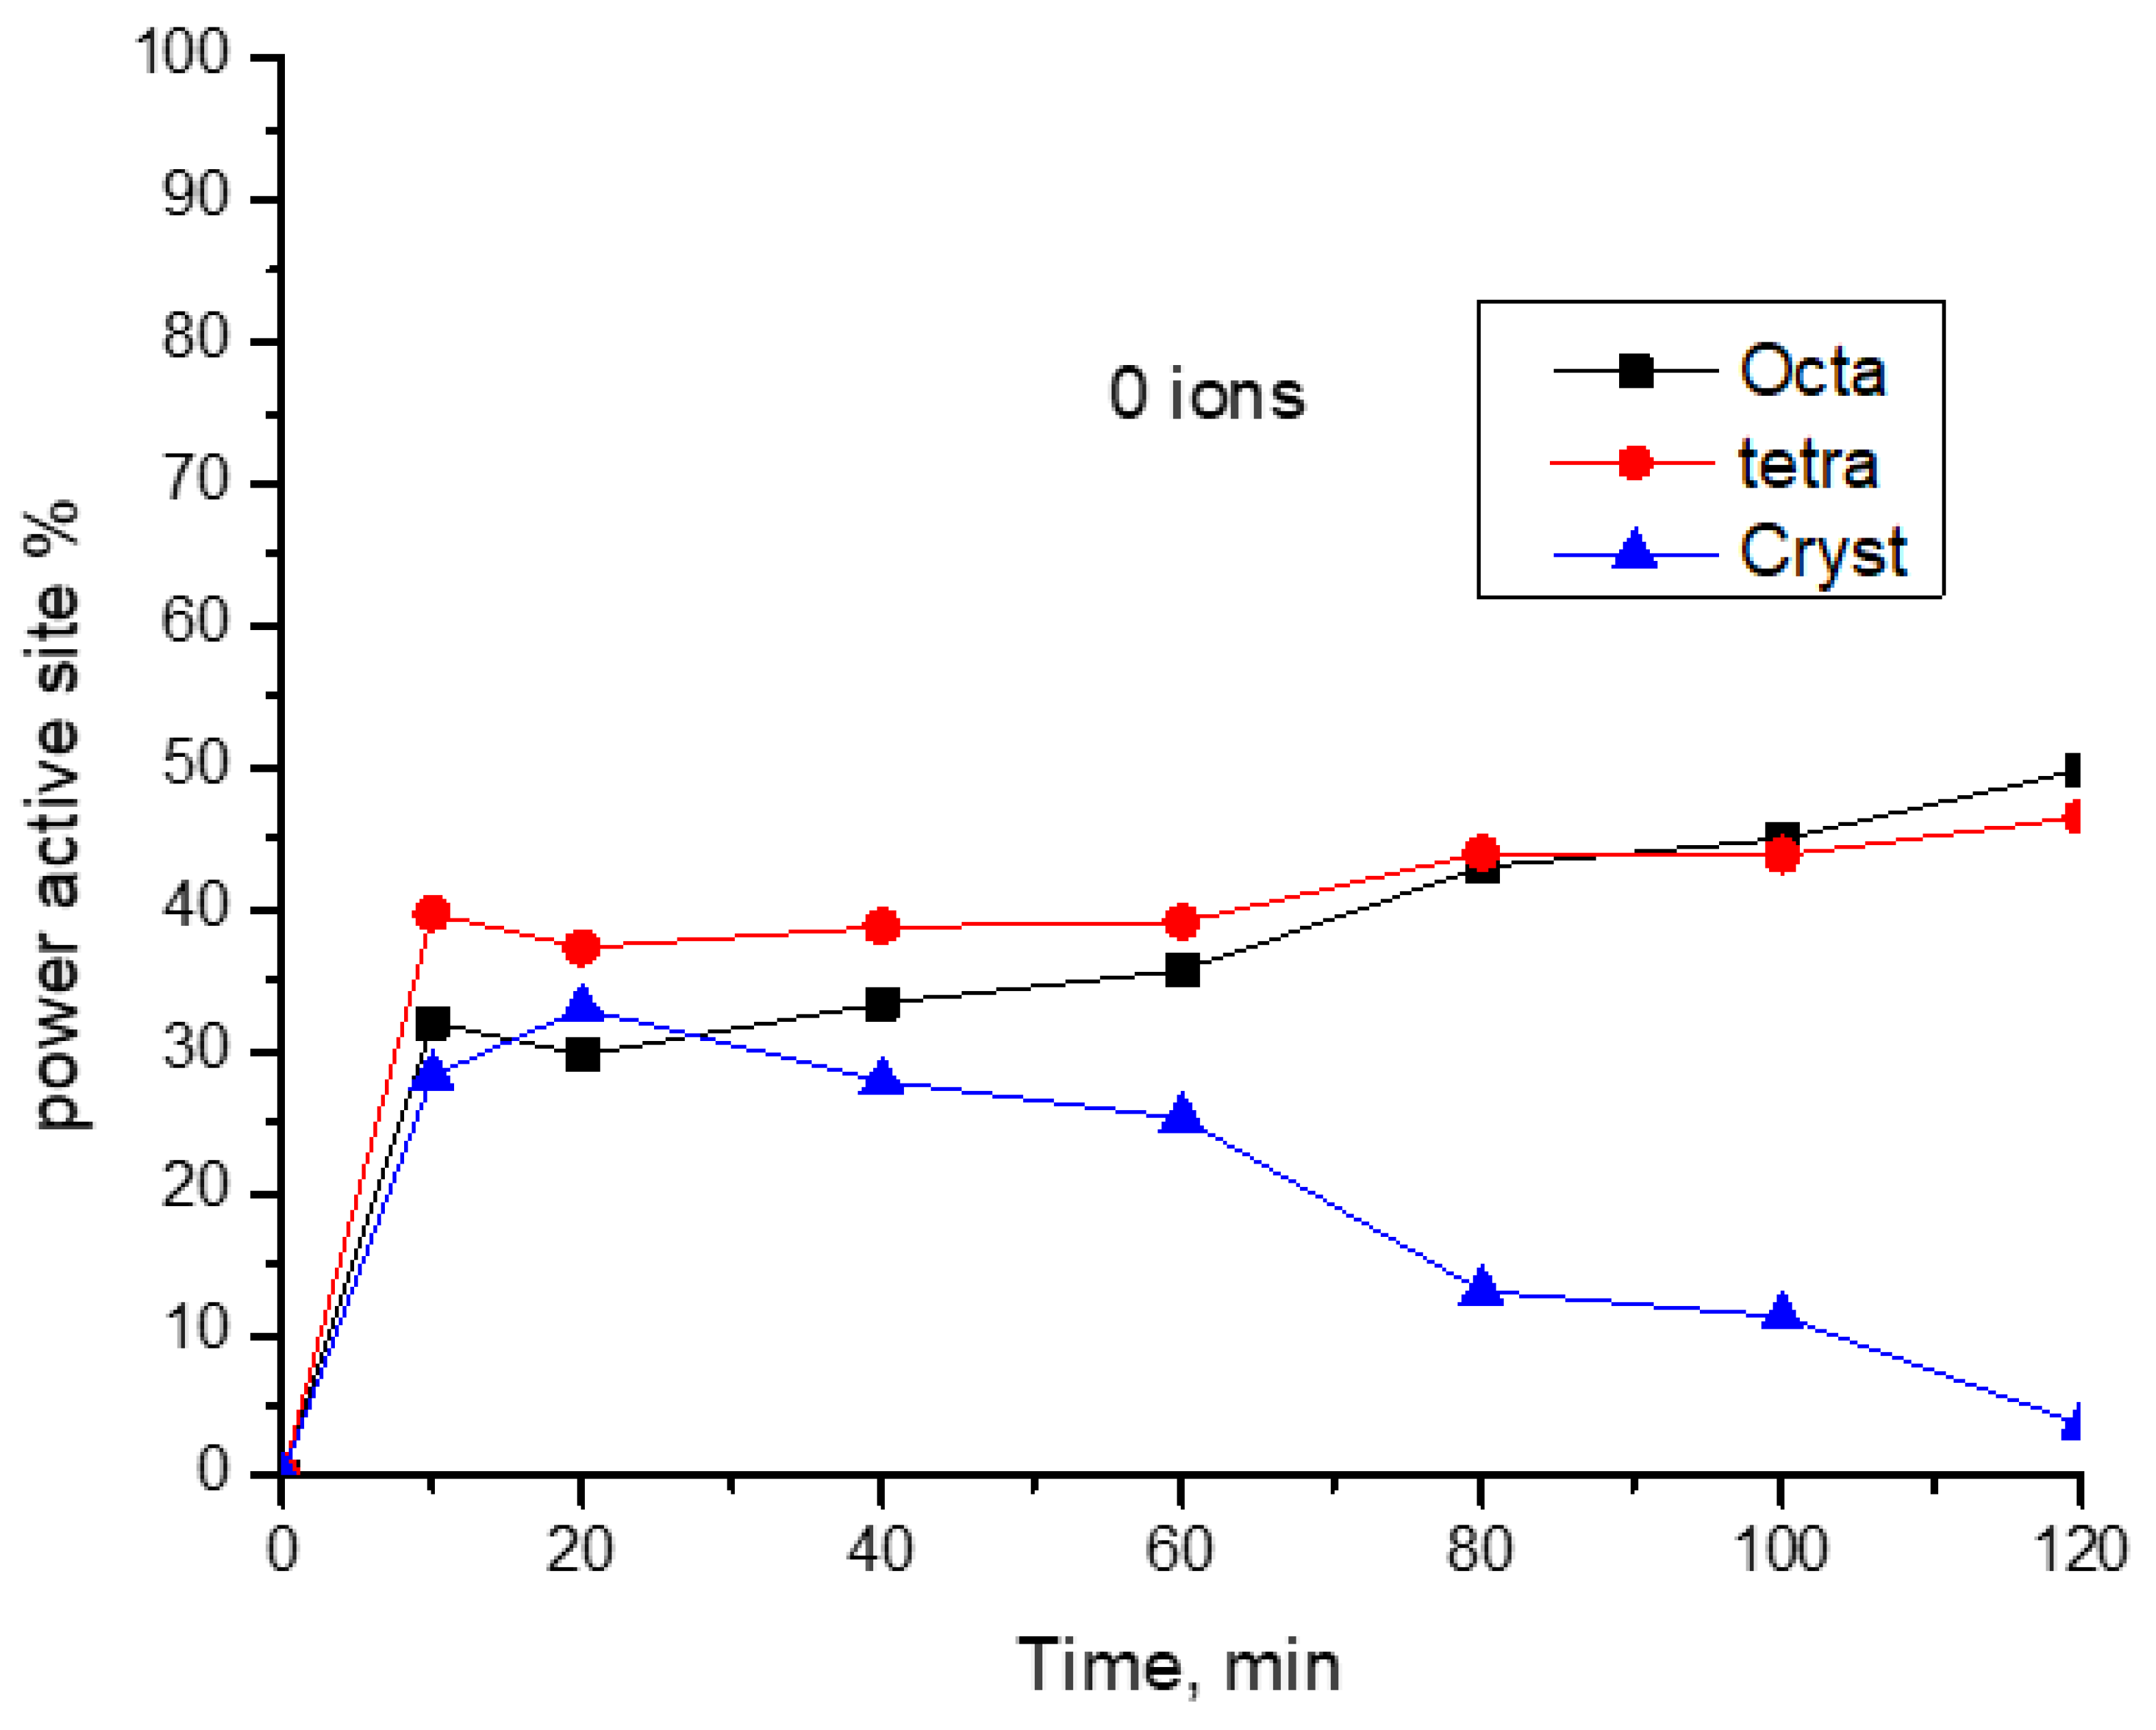
From the above curves and tables, it could be concluded that the power of tetragonal amorphous and octahedral active sites in the zero ions sample are nearly the same (about 40%), while the crystalline part power decreases with time. This may be explained by carbon deposit perhaps blocking the pores of the ZSM-11 crystalline phase much more than that of the amorphous sites. Introducing ions in solution changes the situation dramatically. Thus, in 100 ppm ions samples, the power of the crystalline part is much higher than the amorphous ones (>80%) and remains constant along with time. The same situation was observed in 400ppm ions. This could be translated into two observations; first, the presence of ions enhances the power of the crystalline active site, and the second is that the presence of adsorbed ions protects the crystalline part from deactivation.
In case of 200 ppm ions samples, the situation may differ a little bit where the deactivation of the crystalline part is observed along time and then regenerated again. This may reflect the high complexity and dynamicity of the adsorption desorption–photodegradation process that occurs simultaneously.
In addition, an evaluation of Equation (1) in the prediction of 100% Ti and 100% Zr samples is shown in Table 7. From this table, it could be observed that, in 0 ions samples, a larger percentage of errors was observed. This could be predicted, taking into consideration that for these samples, the effect of adsorption is much higher than that of photodegradation.
Introducing the ions into the solutions enhances the photodegradation efficiency in two ways; it enhances the power of active sites and decreases the adsorption contributions by repelling the dye from the surface with the aid of ions. This is reflected by decreasing the percentage error that does not exceed 5% on average.
The above results explain that the presence of ions, without any doubt, plays an important role in the photodegradation process. To shed some light on this effect, a deeper analysis is performed.
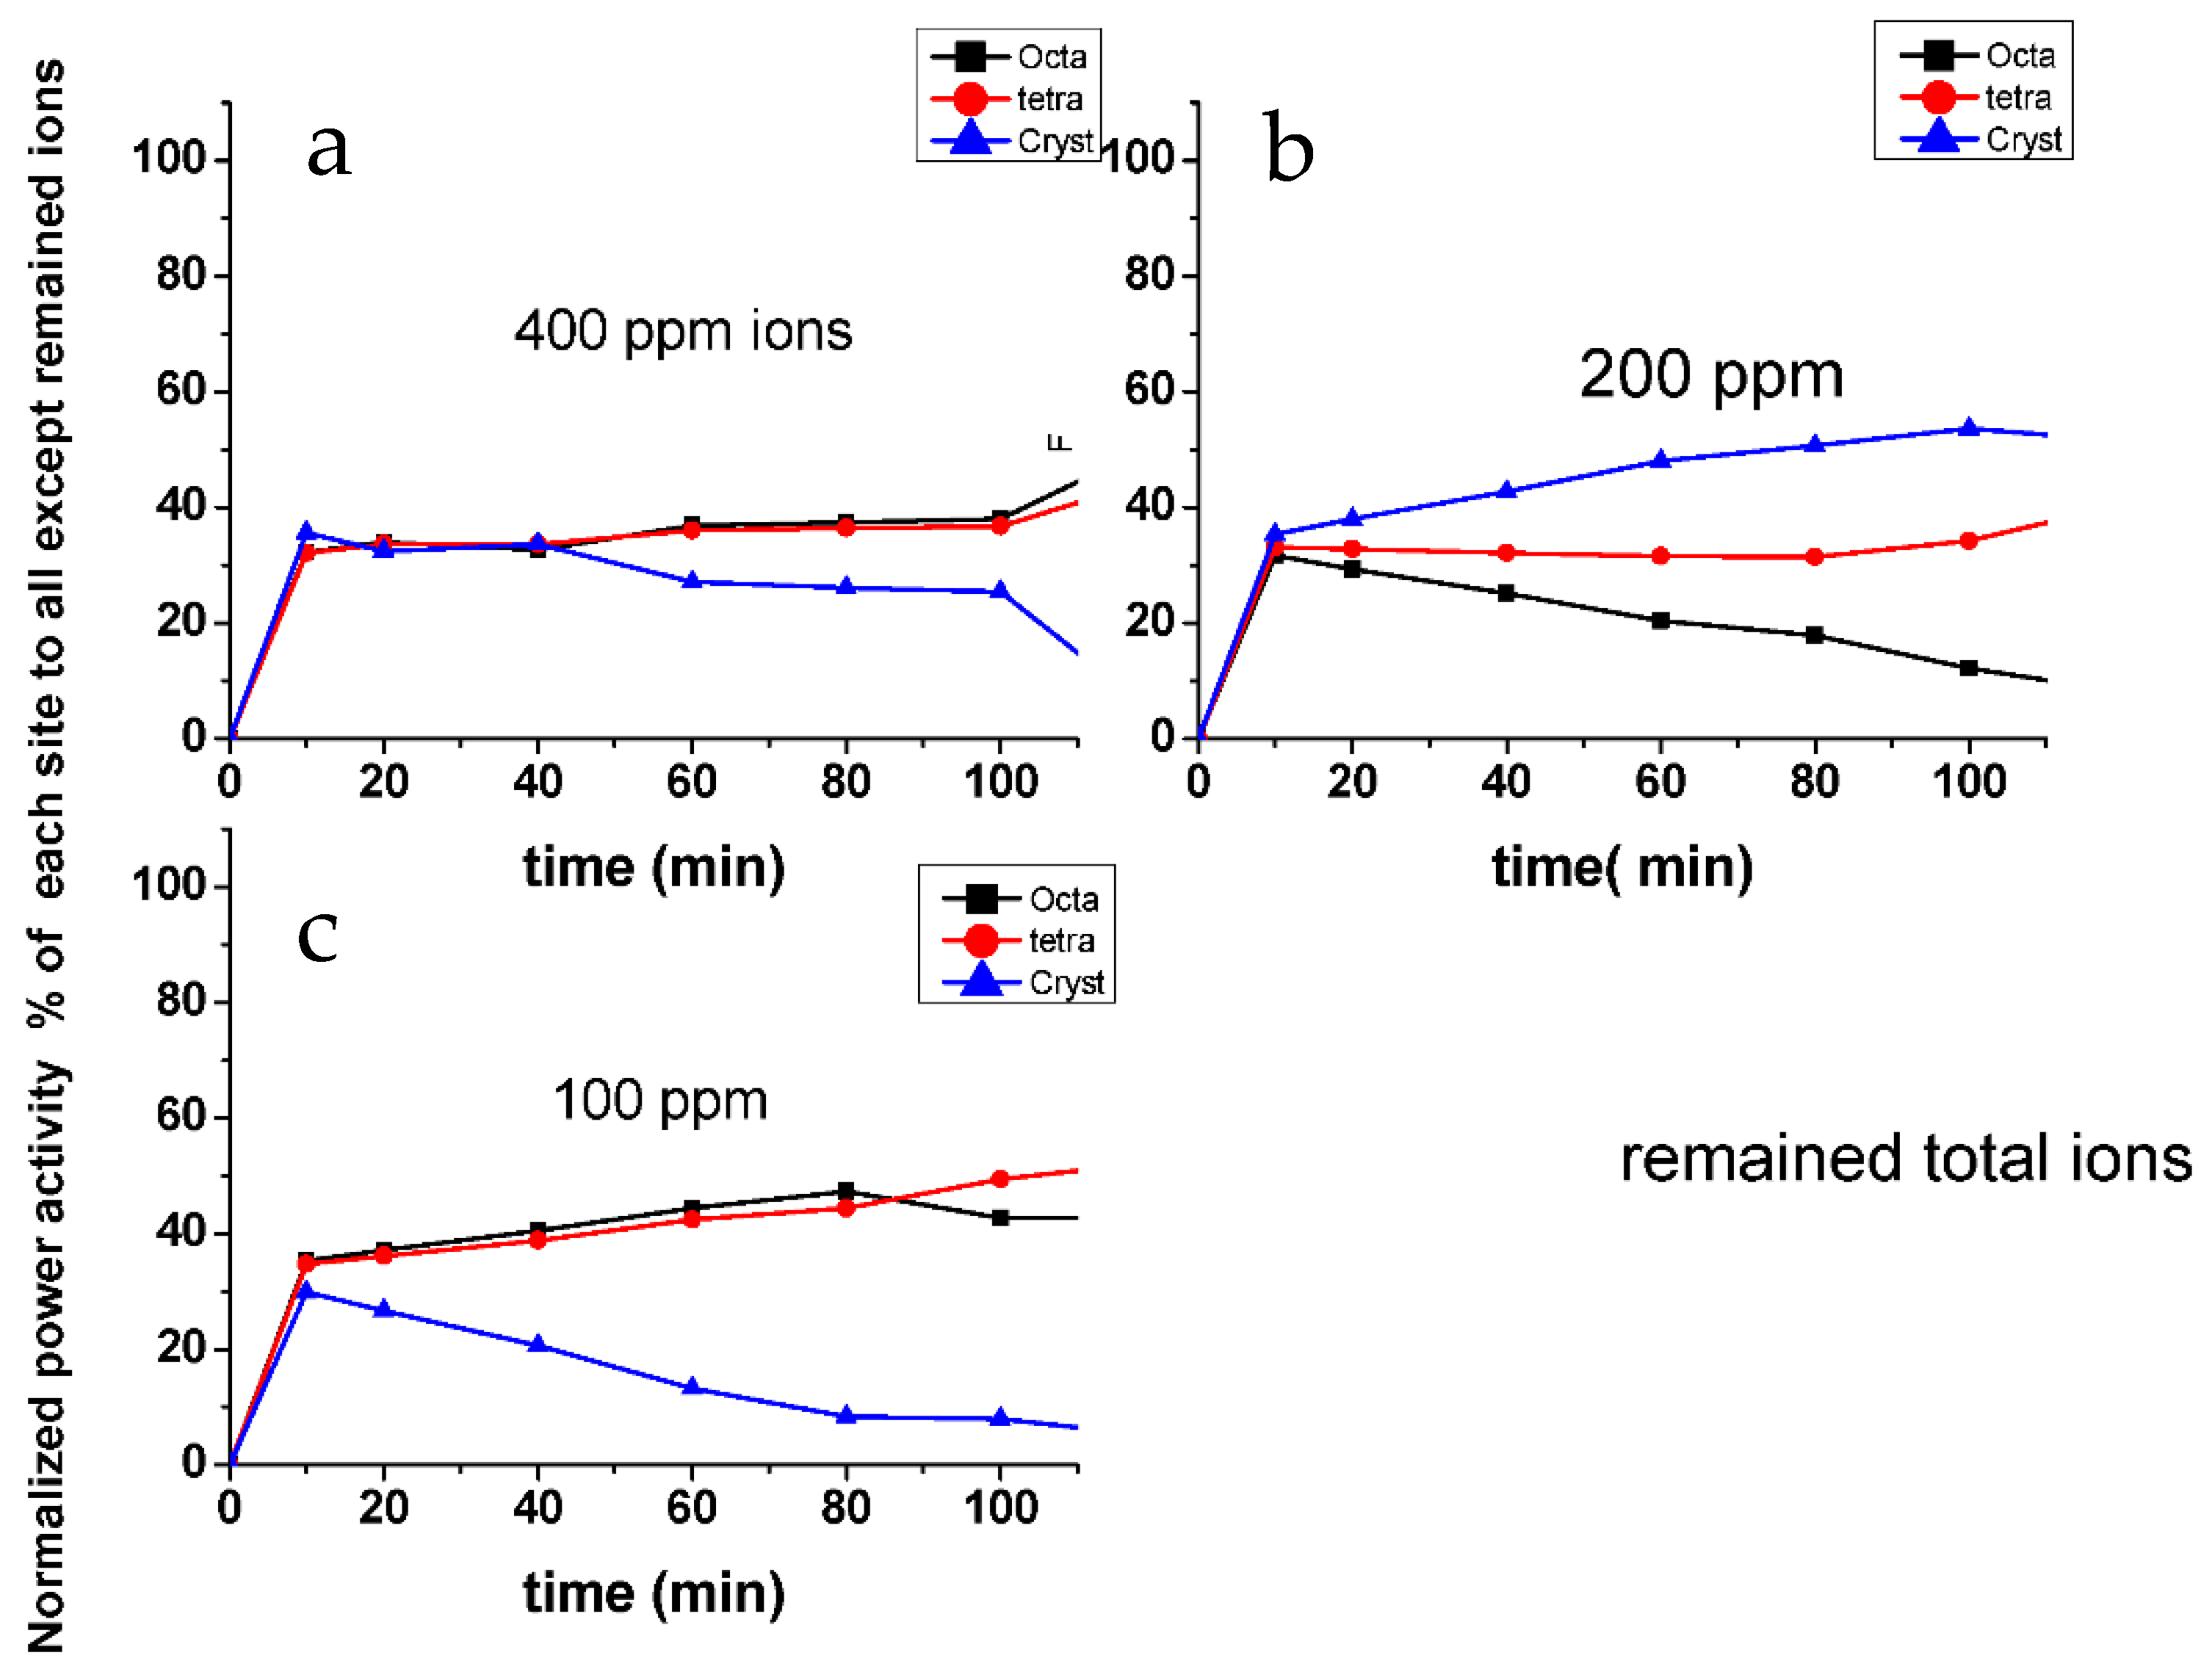
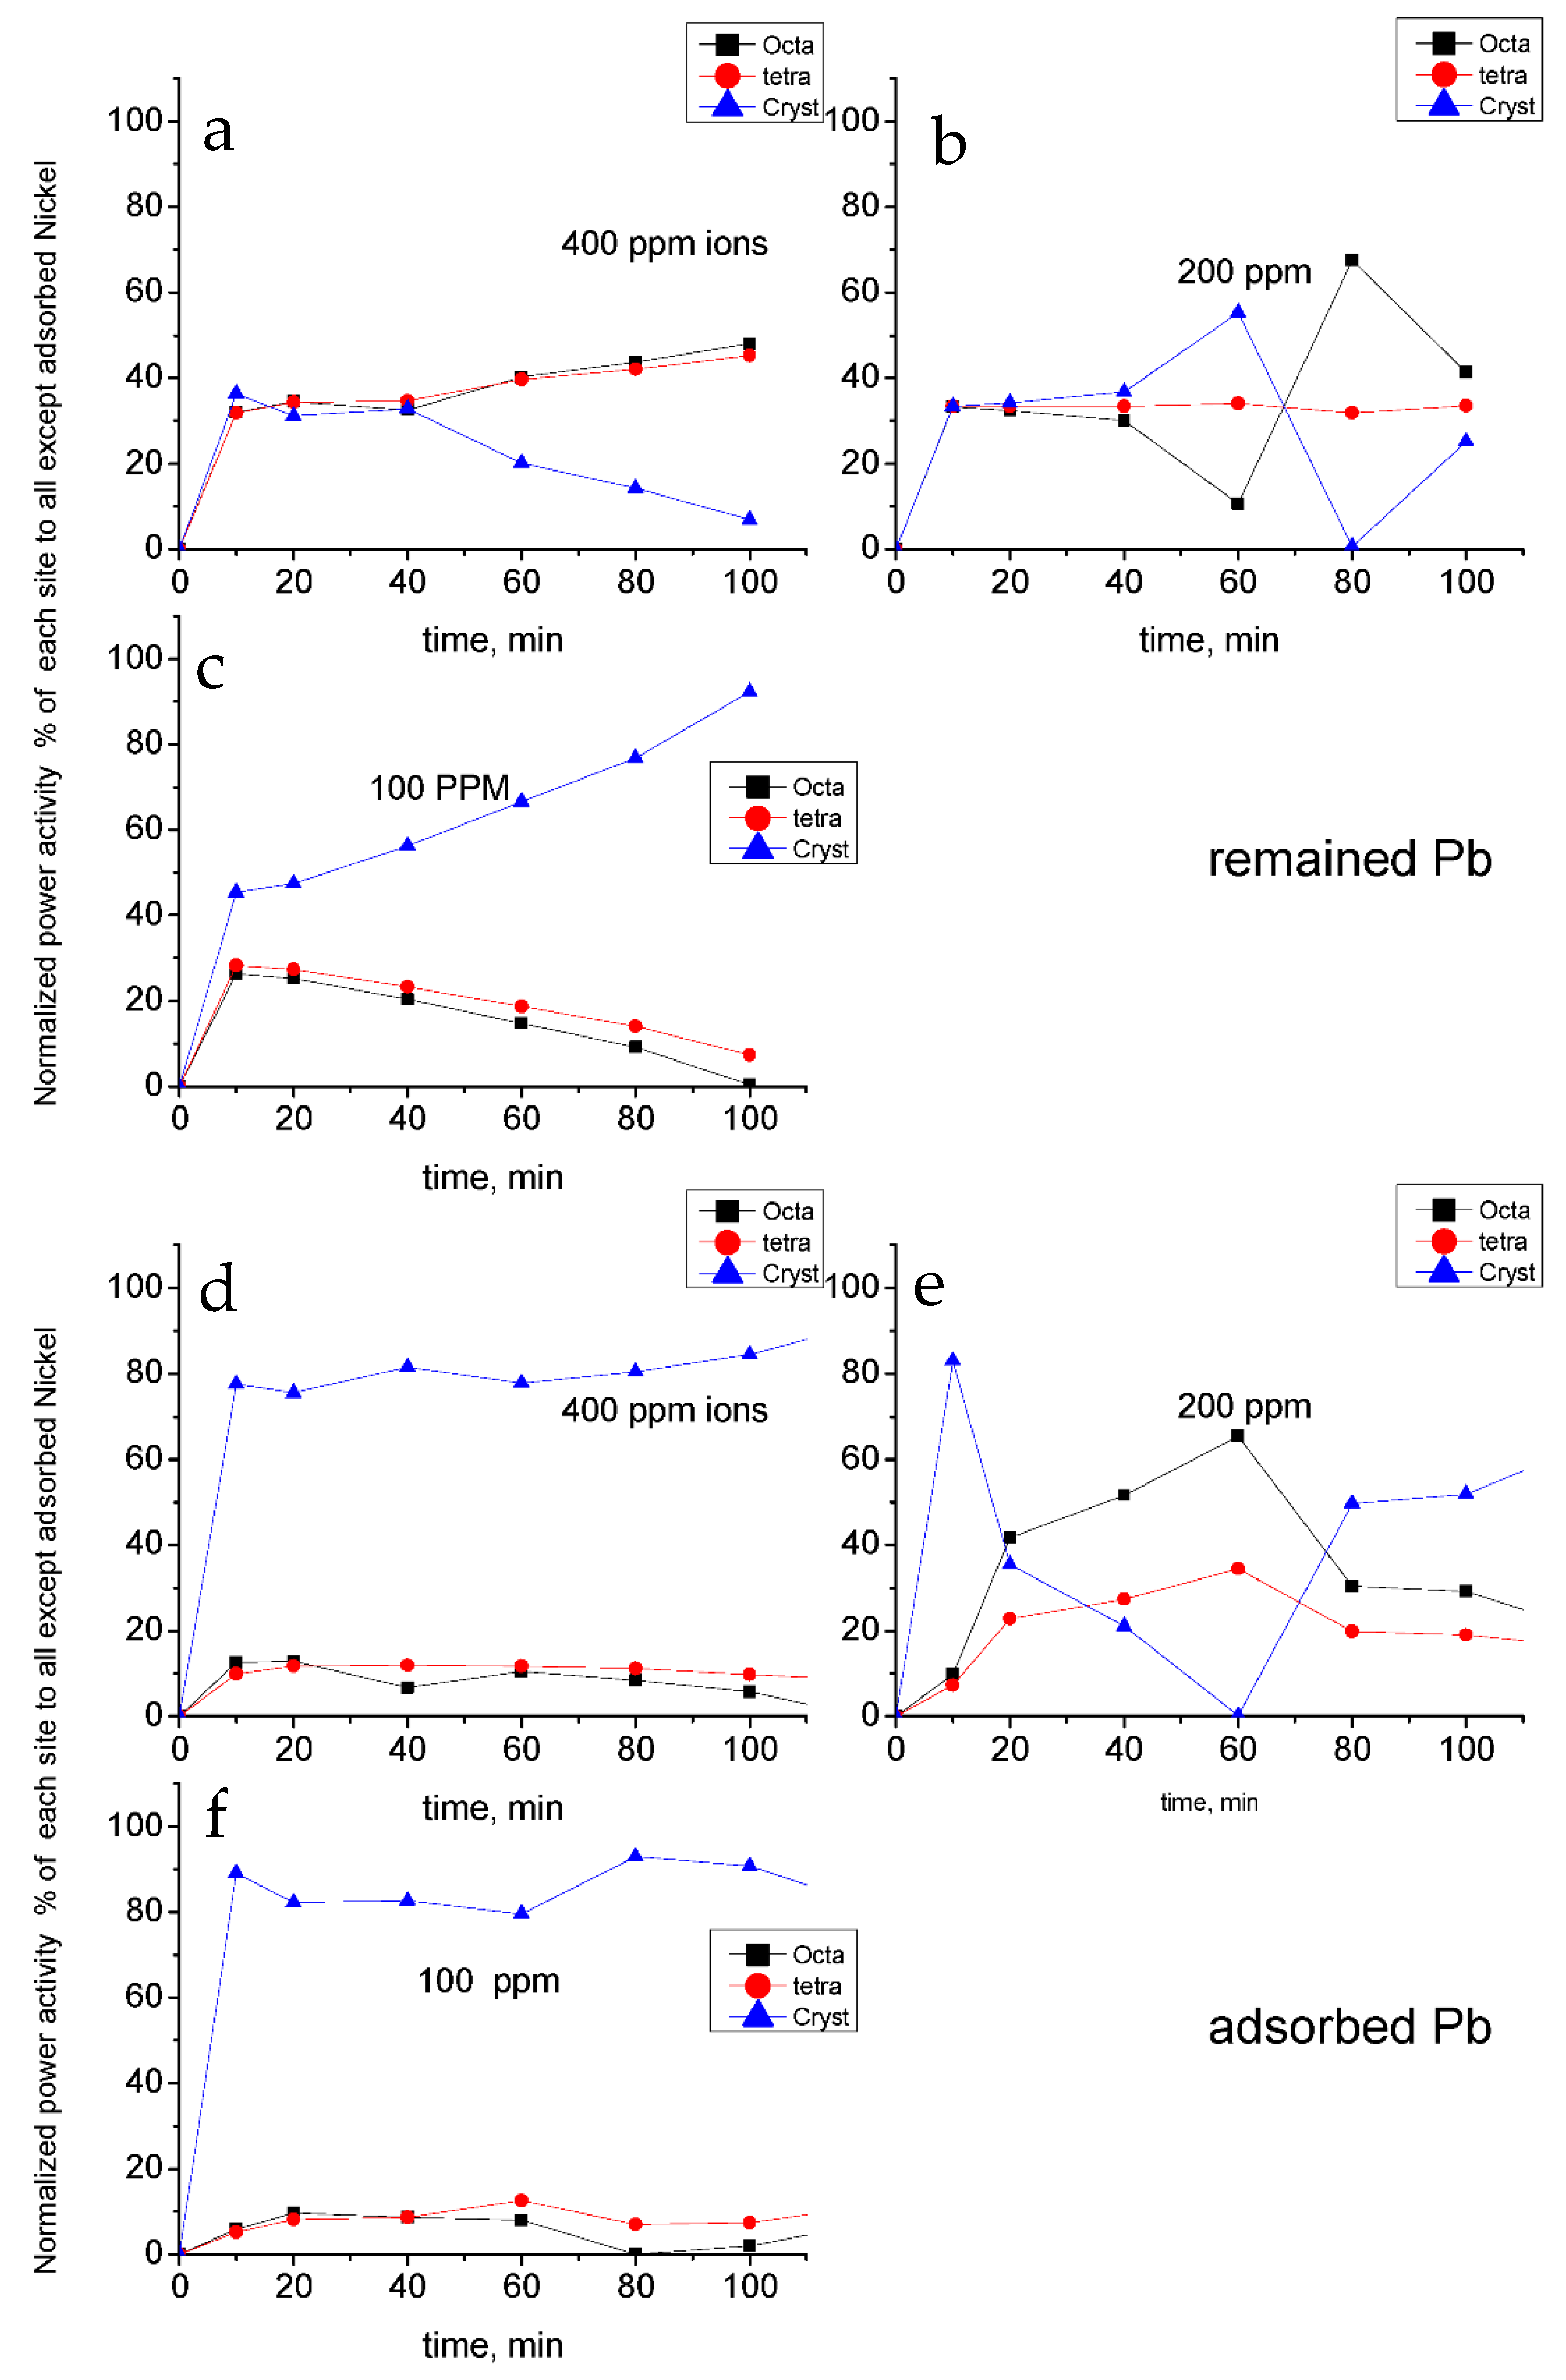
The ions in solution either remained or are adsorbed on the surface. In order to study the effect of the remaining ions, we should normalize the photoinduction effect to adsorbed ones and vice versa. This could be done mathematically by dividing the photo-induced removal percentage by either the adsorbed or remaining ions in order to study their effects. Afterwards, we resolve again Equation (1) to see the power map of the active site.
Figure 11 represents the effect of the remaining and adsorbed ions, respectively. From that figure, it could be concluded that the remaining ions nearly have no effects on the power activity of each site except for the 200 ppm ions samples where crystalline active sites are slightly increased by time with larger values than amorphous sites (tetragonal or octahedral). The other curves for 100 or 400 ppm ions are very similar to that corresponding to the curve with zero ions (
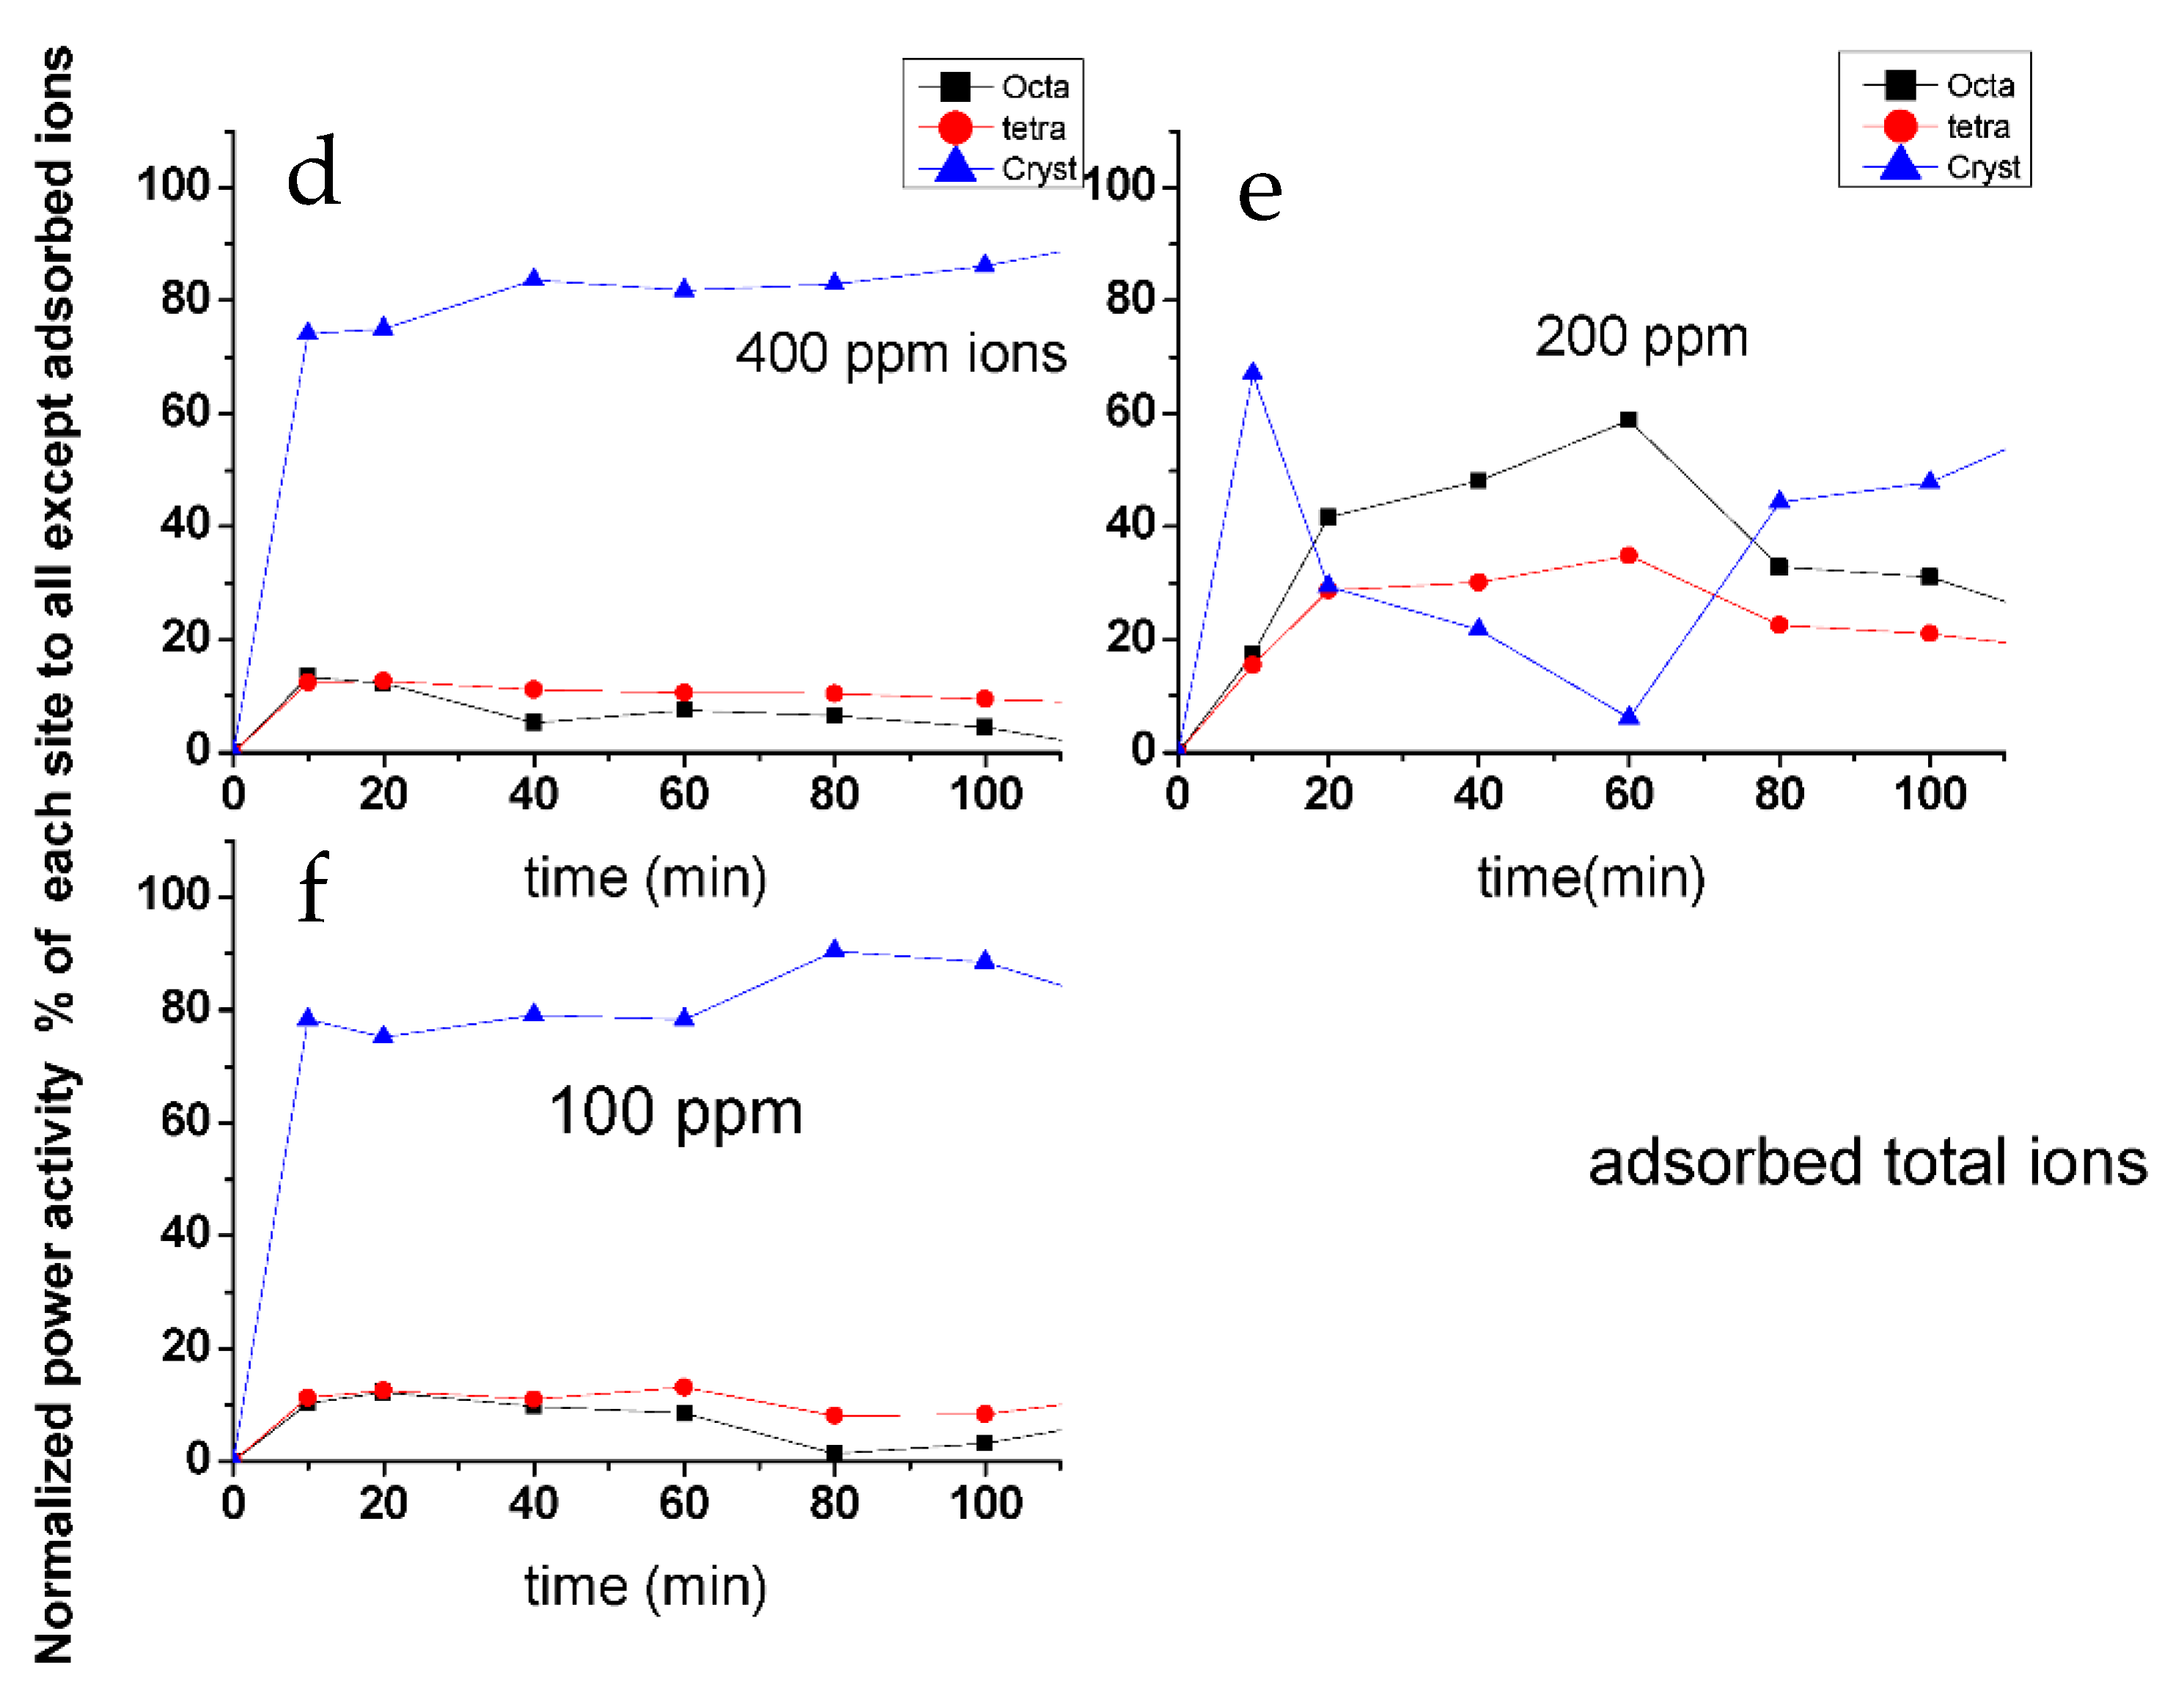
Figure 12). In contrast, the adsorbed ions show high influence on crystalline part of active sites. Again, in the 200 ppm ion samples, the crystalline part power begins high; then, it is deactivated and then regenerated again with time. The adsorption effect curves are very similar to original power active centers map (Figure 12). This gives us the impression that the adsorbed ions are those that may play a major role especially on the crystalline part of the active site.
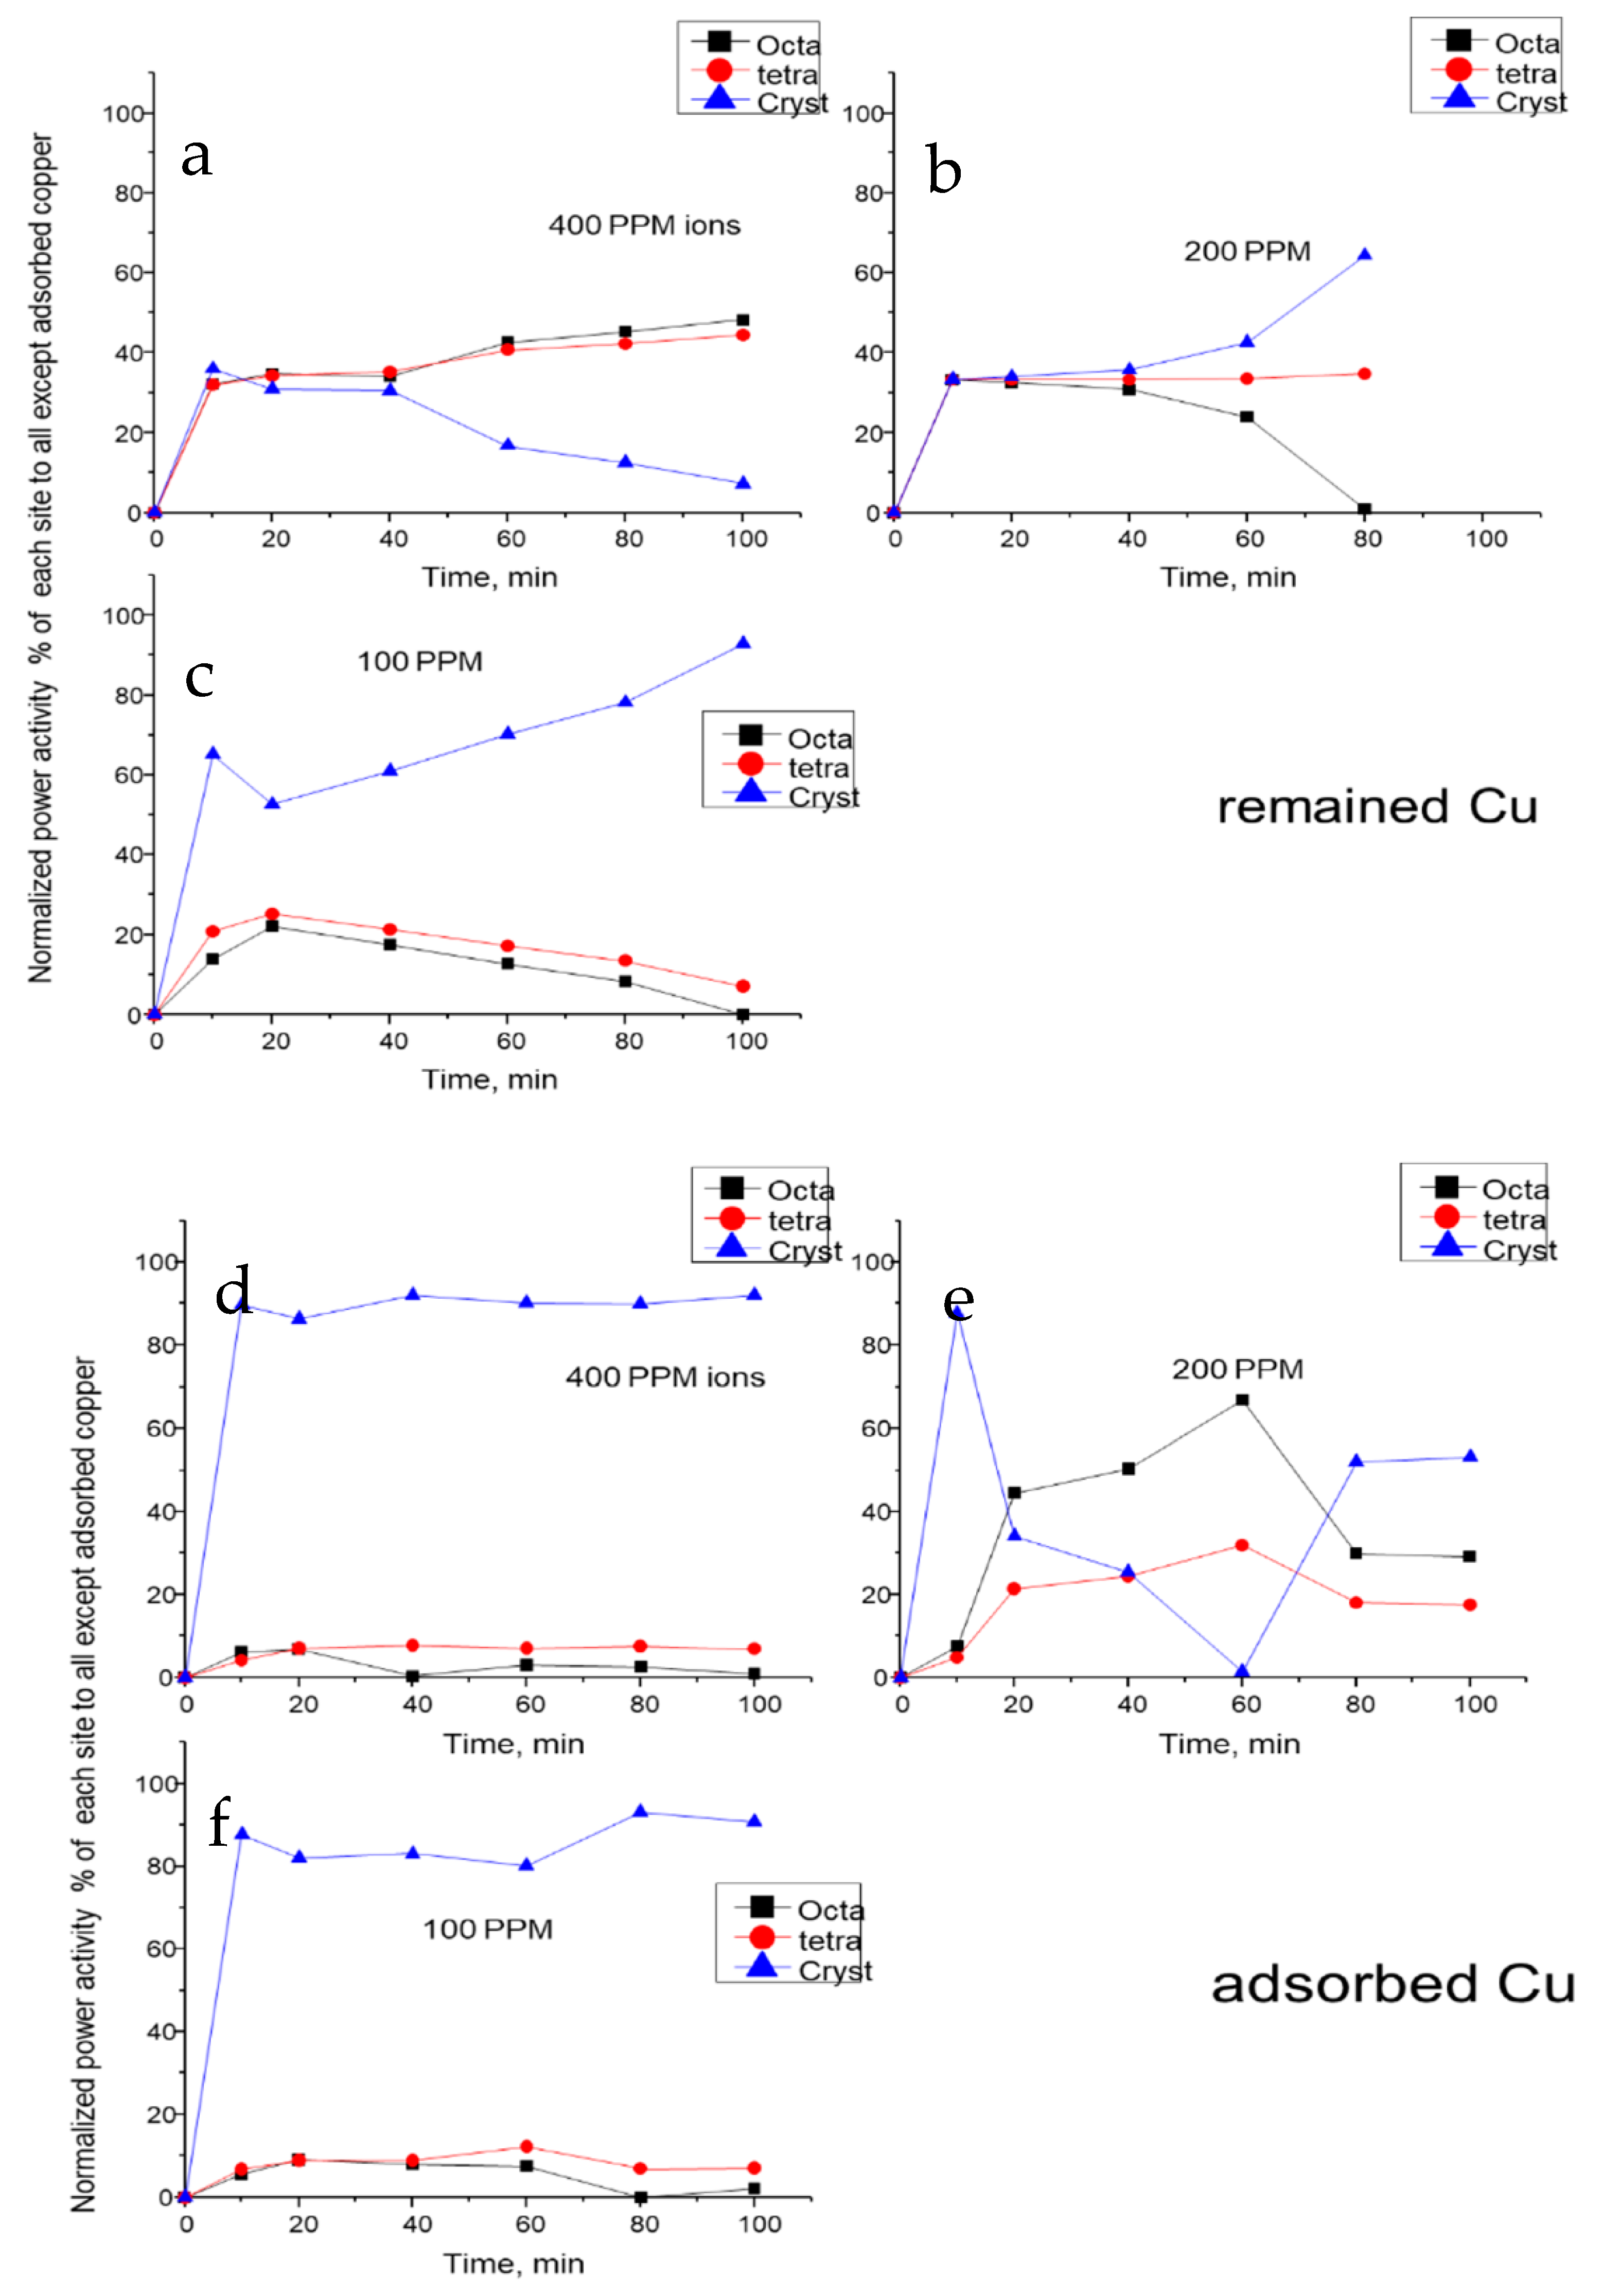
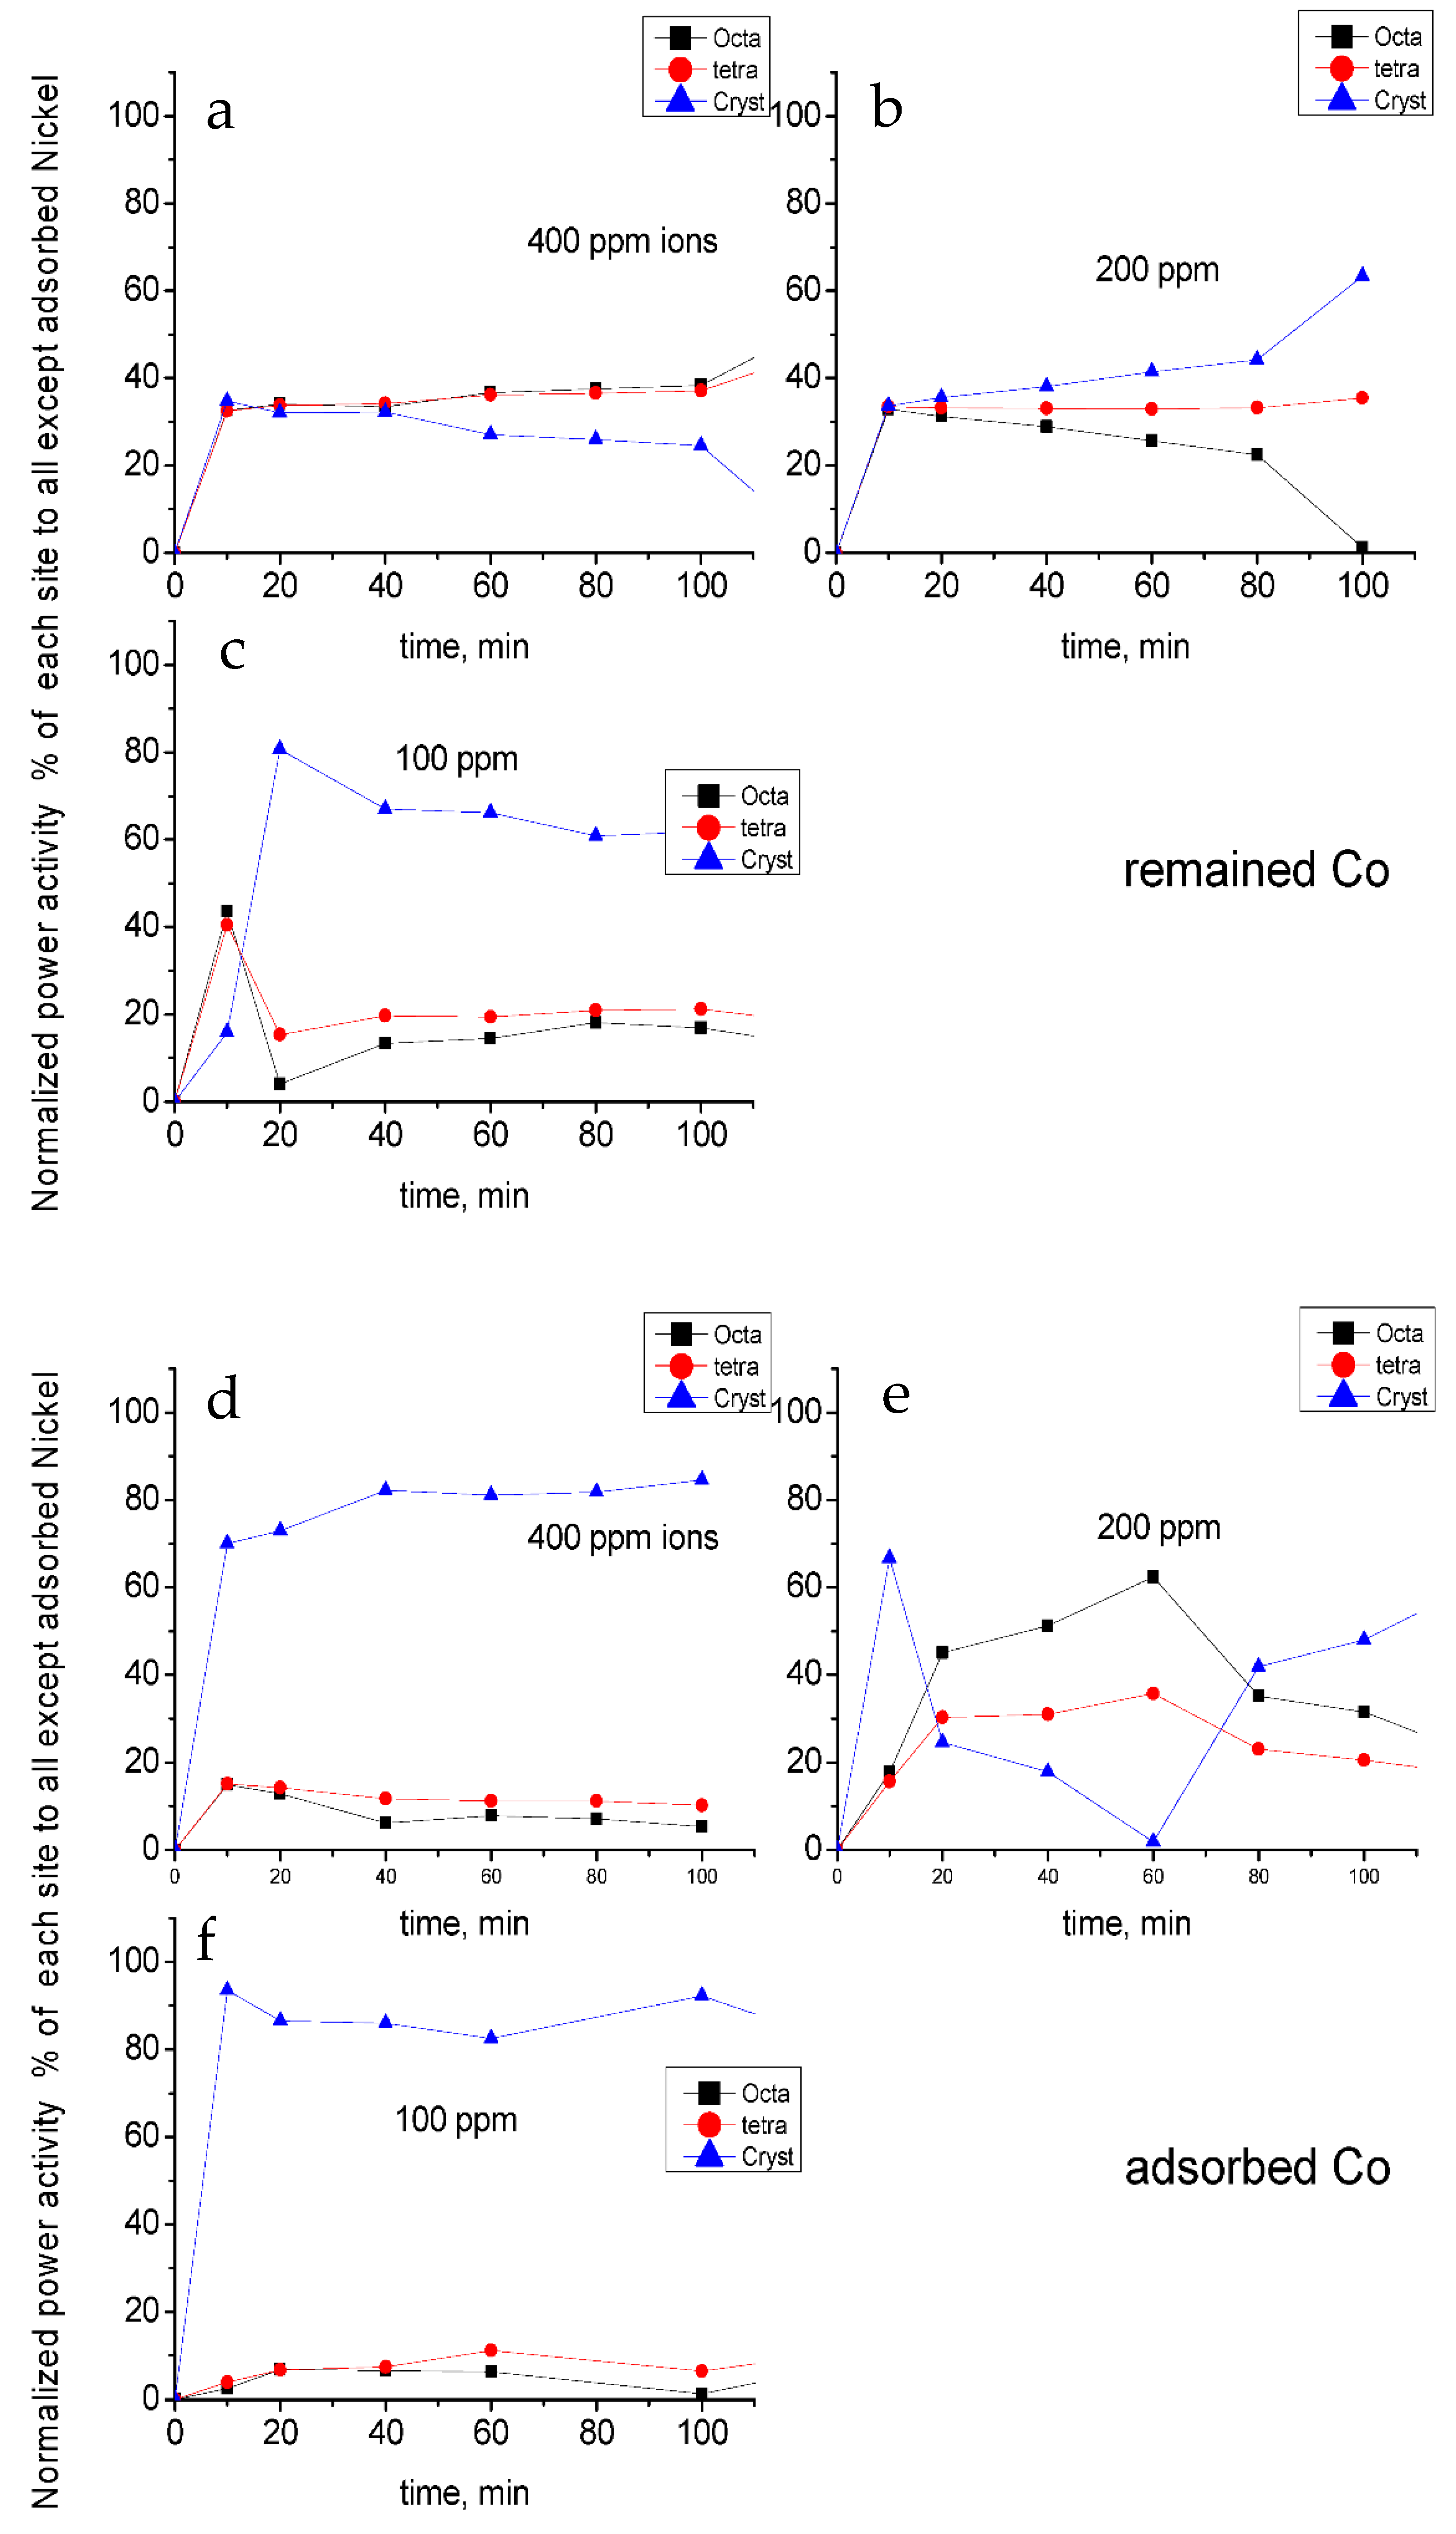
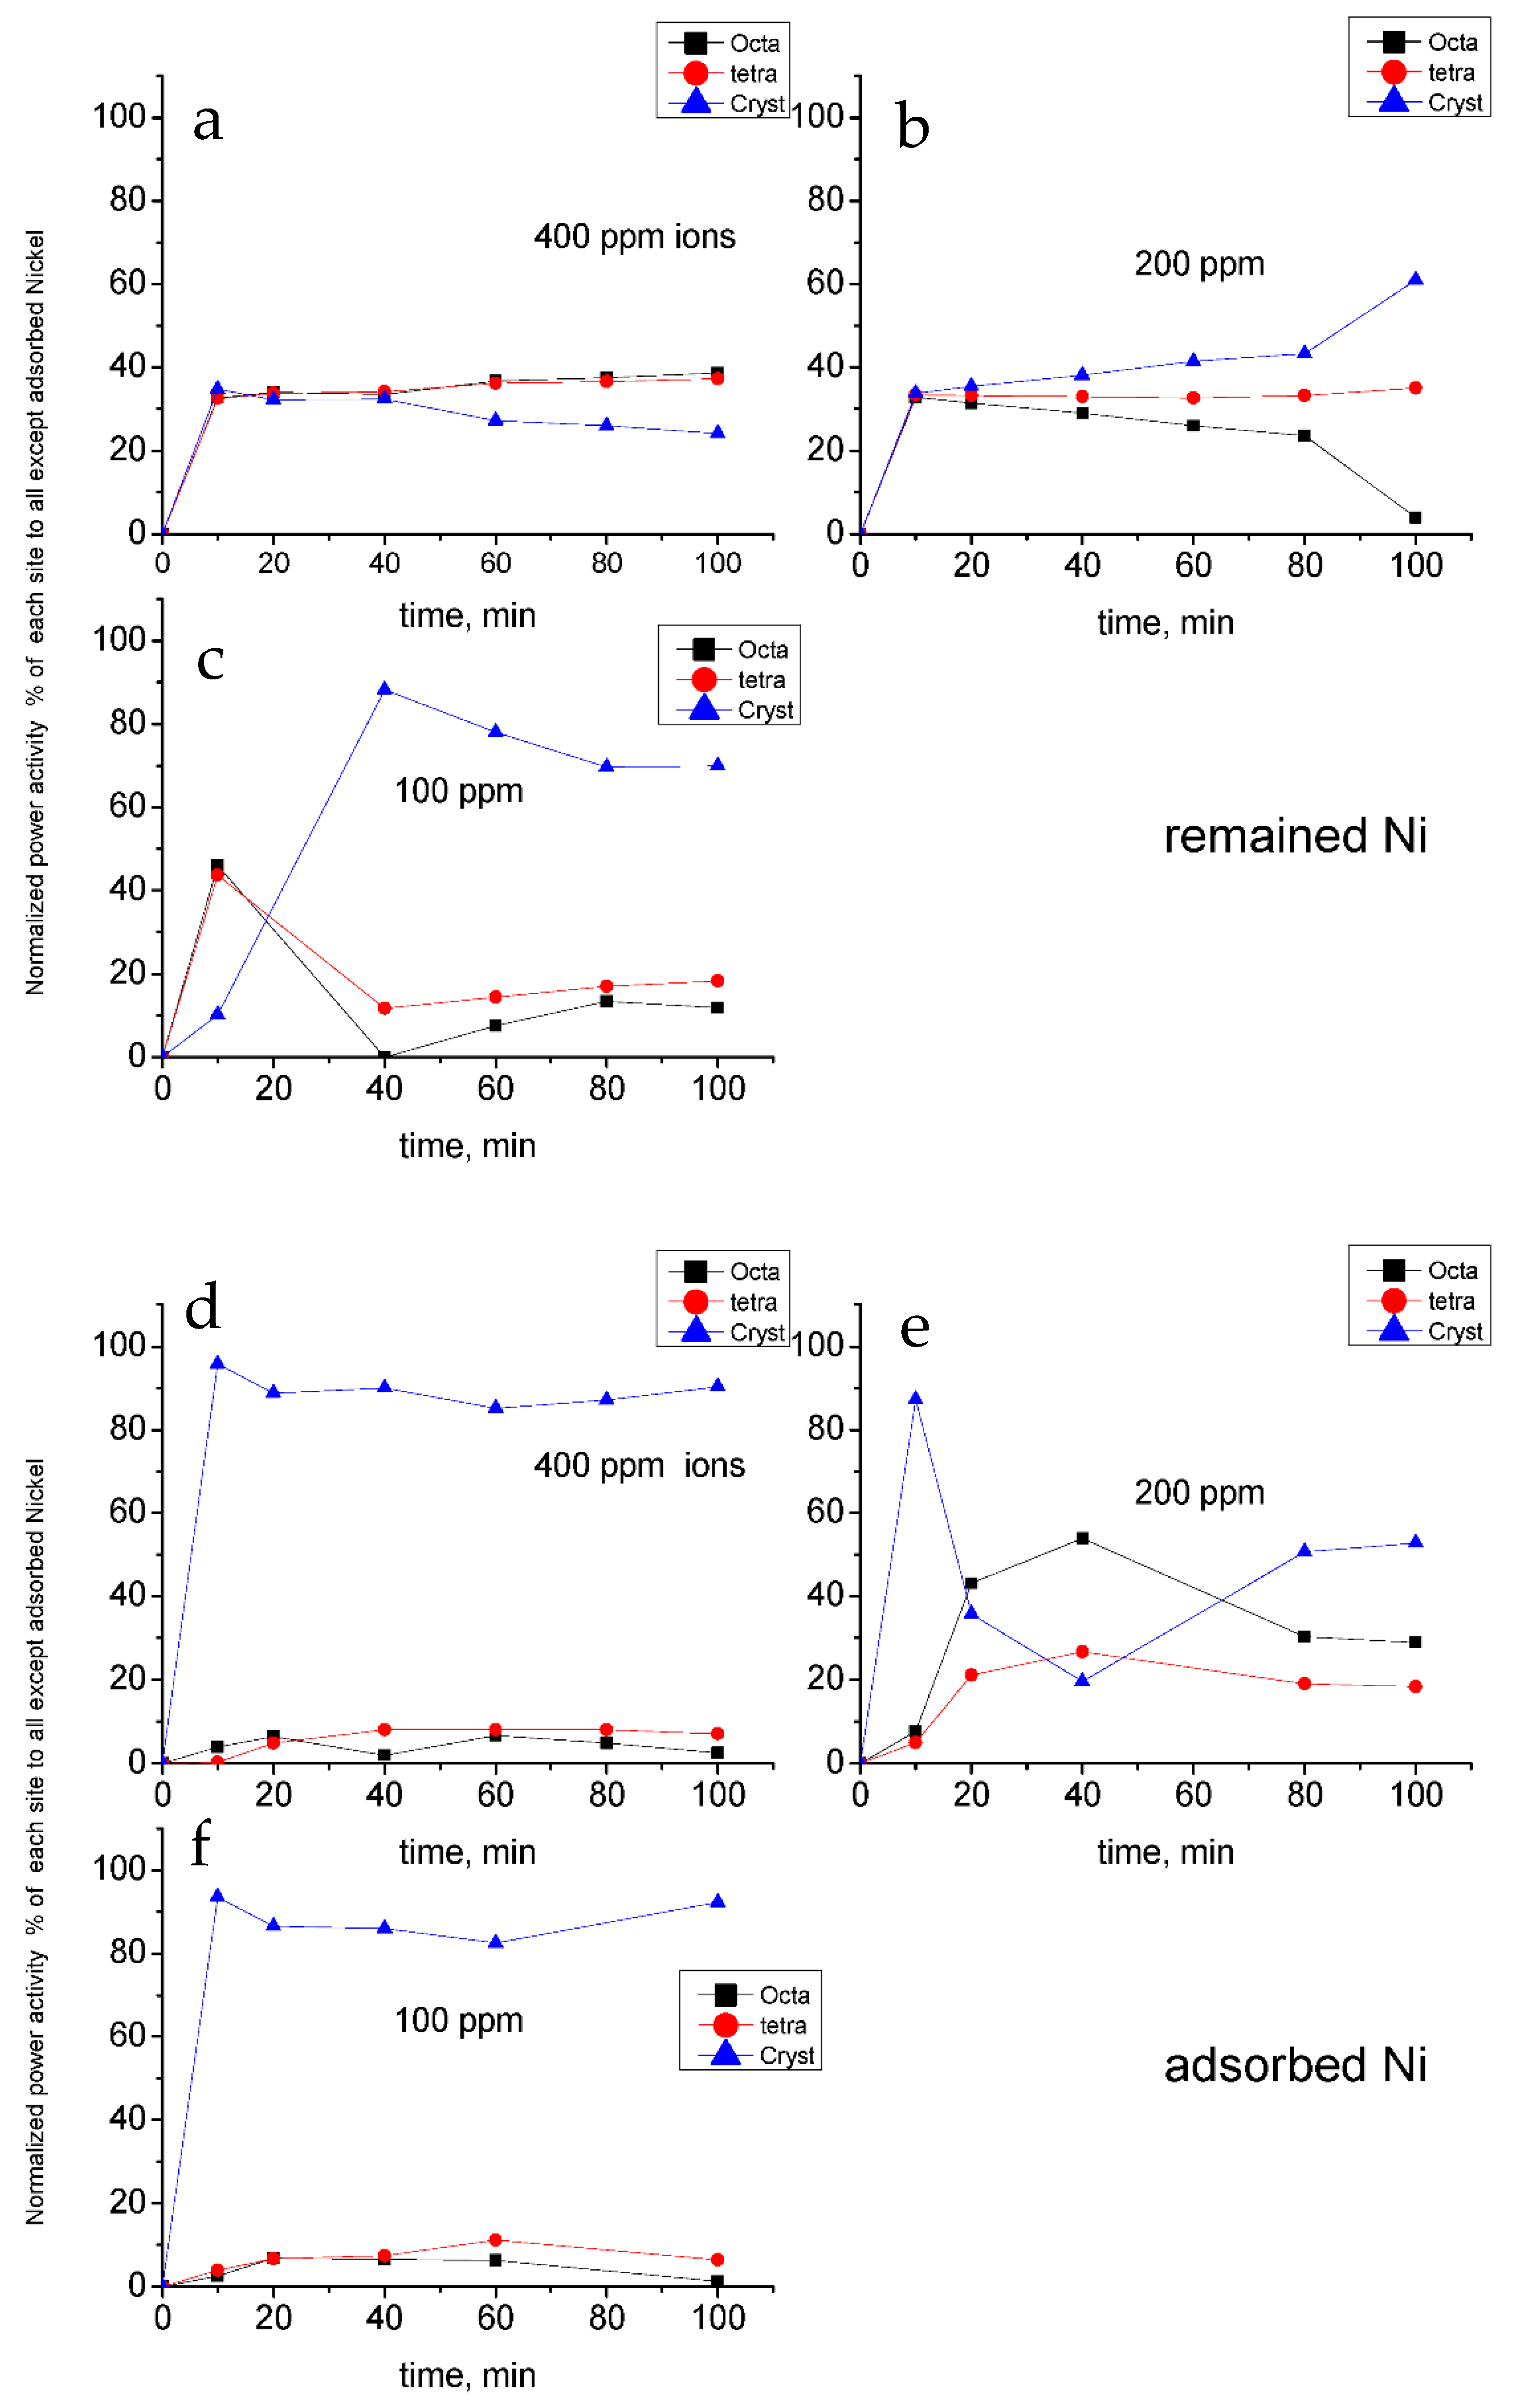
The secret of influencing the ions on active sites may be more or less mysterious; however, it could be more explained if each ion is studied individually. Again, the percentage removal was divided over all the percentage of ions except those under investigation in order to bring its effect; see Figure 13, Figure 14, Figure 15 and Figure 16. From the above figures, it could be concluded that all of the ions exhibit a high effect on the crystalline active site when it is absorbed. Again, adsorbed ions on the 200 ppm ions-impeded sample show different profiles of activation and deactivation of active sites over time. This behavior resembles more or less the total ion adsorbed effect (Figure 11). While this is expected for adsorbed ions, for the remaining ions, the situation differs; thus, as the initial concentration of ions reduced, the effect of the remaining ions increased, especially on the crystalline part, while it inhibits the other amorphous phases (tetragonal and octahedral sites). While this behavior was seen in all ions, some strange curves may appear for Cu and Pb where 100% removal was reached. At this extreme limit, mathematical treatment especially after 60 min will be more or less inaccurate because of the division on zero limit. These effects of ions open an argument about the mechanism of its role, which will be discussed in a separate section.

2.5.2. Effect of Dye on the Removal of Ions

In order to study the effect of dye on the removal of ions, a series of experiments was performed with different concentrations of dye (2.5, 5, 10 ppm, and constant amount of ions (400 ppm)). As a general argument, the dye may affect either the amount of ions and/or the selectivity of ions. In addition, the study of the effect of irradiation is also studied, as will be seen in this section. The results show that the total ions removed is not affected greatly by neither the photoirradiation nor by the change of the concentration of dye. This may be logical if the main mechanism of removal of ions is adsorption, and consequently, the photoirradiation has no effect on this mechanism. Moreover, a selectivity study shows also a small difference that lies within the experimental error and the high dynamicity of the system details of these calculations can be seen in the supplementary files.

2.6. Mechanism of Photodegradation of Methylene Blue

In order to speculate the mechanism of degradation of MB in the presence and absence of ions, first, kinetic analysis was performed for pseudo first and second and third orders; all degradation were found to follow pseudo first order (Table 8). The detailed calculations of all samples were given in the supplementary files.
The effect of addition of transition metal ions (Co2+, Cu2+, Pb2+, and Ni2+), as seen before from the activity results, shows various effects enhancements, retardations, and also differentiation between active sites. The increase of photocatalytic power of some active sites by metal ions may be attributed to the creation of new trapping sites by the introduction of these ions either remaining in solution or adsorbed on the surface of the catalyst [28]. On irradiation, migrating electrons from the valence band of the active site are trapped by the M2+ ion because of having partially filled d-orbital, and thus, electron–hole recombination is suppressed [29,30,31,32]. The hole generated is being labile enough to transfer to the surface of an active site at which the degradation of methylene blue could happen. On the other hand, the retardation or inhibition of some ions may be due to the blocking of active sites by the adsorption of metal on it [33]. Moreover, it was observed that when the concentration of some ions becomes small, its effectiveness in enhancement of the photo active site is enlarged.
The mechanism of degradation in the presence of ions could be formulated as follows:
1M.B + hν🡪1M.B1 (singlet state)
1M.B1🡪3M.B1 (triplet state)
PAS🡪PAS*(h+vb + ecb)
Mn+ + ecb🡪M(n−1)+
M(n−1)+ + O2🡪Mn+ + O2
PAS*(h+vb) + OH🡪 PAS + ·OH
3M.B1 + ·OH/O2 🡪 Degradtion of the dye.
PAS: photo active site; M.B; methylene blue dye
From the above mechanism, it can be seen that the M.B dye is first affected by irradiation transforming from a singlet state to a triplet one. At the same time, the photoactive sites generate holes at the valence band and electrons on the conduction band. These generated electrons reduce the metal in the vicinity, which reoxidized again, generating oxygen free radicals. In addition to that, the photo active sites generated holes, reacting with OH to generate hydroxyl free radicals. Both oxygen and hydroxyl free radicals attack the triplet states of M.B and degrade it. This mechanism shows the role of metal on the degradation of dye besides the ordinary mechanism corresponding to photo active sites.

3. Experimental

3.1. Materials

All chemicals used for preparation of ZSM-11 were analytical grade reagents as follows: tetraethyl orthosilicate (TEOS) (SiC8H20O4) (98%) (Merck, Darmstadt, Germany), sodium hydroxide (NaOH) (Merck), titanium (IV) chloride (TiCl4) (Merck), zirkonium (IV) chloride (ZrCl4) (Merck), tetrabutylammonium hydroxide (TBAOH), copper nitrate (Cu(NO3)2·3H2O (Sigma-Aldrich, Darmstadt, Germany), nickel nitrate (Ni(NO3)2·6H2O (Sigma-Aldrich), lead nitrate (Pb(NO3)2(Sigma-Aldrich), cobalt nitrate (Co(NO3)2·6H2O (Sigma-Aldrich), and methylene blue dye (C16H18ClN3S·xH2O) (Sigma-Aldrich).

3.2. Preparation of ZSM-11

In a typical synthesis of Zr-ZSM-11, a solution of 11.93 g of TBAOH solution was added on 0.7 g of NaOH in 55 mL distilled water. Then, this solution (named as solution A) was added slowly to solution B. Solution B was prepared by mixing 0.73 g of ZrCl4 in 5 g of distilled water with 21.35 g of TEOS (0.933 g/mL). The whole mixture was stirred at 60–80 °C for 1 h. Then, the mixture was left for 24 h for aging and then autoclaved for 3 days at 175 °C. After that, the mixture is washed, filtered, and dried. Titanium is introduced as a molar ratio, replacing the zirconium, keeping the total number of moles of both constant. Table 9 shows the elemental ratios of different samples prepared

3.3. Photocatalytic Experiments

First, 100 mL of methylene blue of 10 ppm solution was mixed with 0.1 g of composite using a horizontal cylinder annular batch reactor. A mercury lamp (300 W) was used for irradiation of the photocatalyst. The photocatalytic reaction was carried out at room temperature. Different amounts of solutions are collected by time for analysis. Figure 17 shows the image of used instrument.

3.4. DRUV-VIS Spectral Data

DRUV-VIS spectral data were collected using a Thermo-Scientific evolution spectrophotometer (Waltham, MA, USA) equipped with an integrating sphere in the wavelength range of 200–800 nm to measure the reflectance spectra of samples. The data were collected as an absorbance either as a reflectance.

3.5. Inductively Coupled Plasma (ICP)

ICP analysis of metals was analyzed using Perkin Elmer Optima (Waltham, MA, USA) 7000 DV. Calibration was performed using a stock solution of each metal with known concentration.

3.6. X-ray Powder Diffraction Analysis (XRD)

X-ray powder diffraction (XRD) patterns were collected using a Rigaku X-ray diffractometer system (Tokyo, Japan) equipped with a RINT 2000 wide angle Goniometer using Cu Kα radiation (λ = 0.15478 nm) and a power of 40 kV × 30 mA. The intensity data were collected at room temperature over a 2Ɵ ranging from 10 to 80°.

3.7. Scanning Electron Microscopy (SEM)

Samples were examined via a field emission scanning electron microscope (SEM), which was obtained using JEOL JSM-7600F (Tokyo, Japan). The power limit of magnification was 100 k. This system is combined with energy-dispersive X-ray spectroscopy for (EDX) composition and elemental analysis.

3.8. Fourier-Transform Infrared Spectroscopy (FTIR)

A Perkin-Elmer Spectrum100 FTIR spectrometer (Burladingen, Germany) was used to obtain FTIR spectra. The sample was introduced as it is in powder form. The range of measuring was adjusted between 500 and 4000 cm−1.

4. Conclusions

The prepared Zr-Ti ZSM-11 composites contain both crystalline phases and remaining amorphous matrix. The analysis shows that Ti and Zr both exhibit tetragonal and octahedral symmetry in the composites. The simultaneous photodegradation/removal of dye with some heavy metals enables us to quantify the power of three different photoactive sites. For the first time, we can draw and quantify the active sites map by calculations and solving three linear equations systems. The presence of ions was proved to play an important role in the photodegradation of MB dye. In contrast, the presence of dye was found to have less of an influence on the removal of ions.

Supplementary Materials

Author Contributions

Conceptualization, I.H.A.E.M.; formal analysis, N.M.A.-s.; investigation, S.A.K.; methodology, E.Z.H. All authors have read and agreed to the published version of the manuscript.

Funding

This research was funded by the Deanship of Scientific Research (DRS), King Abdul-Aziz University, Jeddah, under grant no. (G: 153-247-1440). The authors, therefore, acknowledge with thanks DRS technical and financial support.

Acknowledgments

This project was funded by the Deanship of Scientific Research (DRS), King Abdul-Aziz University, Jeddah, under grant no. (G: 153-247-1440). The authors, therefore, acknowledge with thanks DRS technical and financial support.

Conflicts of Interest

The authors declare no conflict of interest.

References

  1. Available online: https://www.acsmaterial.com/zsm-11.html (accessed on 14 May 2021).
  2. Zhang, L.; Liu, H.; Li, X.; Xie, S.; Wang, Y.; Xin, W.; Liu, S.; Xu, L. Differences between ZSM-5 and ZSM-11 zeolite catalysts in 1-hexene aromatization and isomerization. Fuel Process. Technol. 2010, 91, 449–455. [Google Scholar] [CrossRef]
  3. Gao, S.; Zhu, X.; Li, X.; Wang, Y.; Zhang, Y.; Xie, S.; An, J.; Chen, F.; Liu, S.; Xu, L. Thermodynamic study of direct amination of isobutylene to tert-butylamine. Chin. J. Catal. 2017, 38, 106–114. [Google Scholar] [CrossRef]
  4. Liu, H.; Zhang, S.; Xie, S.; Zhang, W.; Xin, W.; Liu, S.; Xu, L. Synthesis, characterization, and catalytic performance of hierarchical ZSM-11 zeolite synthesized via dual-template route. Chin. J. Catal. 2018, 39, 167–180. [Google Scholar] [CrossRef]
  5. Li, H.-J.; Zhou, X.-D.; Di, Y.-H.; Zhang, J.-M.; Zhang, Y. Effect of Si-ATP/CTAB ratio on crystal morphology, pore structure and adsorption performance of hierarchical (H) ZSM-11 zeolite. Microporous Mesoporous Mater. 2018, 271, 146–155. [Google Scholar] [CrossRef]
  6. Zhang, W.; Gao, S.; Xie, S.; Liu, H.; Zhu, X.; Shang, Y.; Liu, S.; Xu, L.; Zhang, Y. A shaped binderless ZSM-11 zeolite catalyst for direct amination of isobutene to tert-butylamine. Chin. J. Catal. 2017, 38, 168–175. [Google Scholar] [CrossRef]
  7. Wang, S.; Zhang, L.; Li, S.; Qin, Z.; Shi, D.; He, S.; Yuan, K.; Wang, P.; Zhao, T.-S.; Fan, S.; et al. Tuning the siting of aluminum in ZSM-11 zeolite and regulating its catalytic performance in the conversion of methanol to olefins. J. Catal. 2019, 377, 81–97. [Google Scholar] [CrossRef]
  8. Xie, P.; Luo, Y.; Ma, Z.; Wang, L.; Huang, C.; Yue, Y.; Hua, W.; Gao, Z. CoZSM-11 catalysts for N2O decomposition: Effect of preparation methods and nature of active sites. Appl. Catal. B Environ. 2015, 170–171, 34–42. [Google Scholar] [CrossRef]
  9. Dyballa, M.; Becker, P.; Trefz, D.; Klemm, E.; Fischer, A.; Jakob, H.; Hunger, M. Parameters influencing the selectivity to propene in the MTO conversion on 10-ring zeolites: Directly synthesized zeolites ZSM-5, ZSM-11, and ZSM-22. Appl. Catal. A Gen. 2016, 510, 233–243. [Google Scholar] [CrossRef]
  10. Liu, H.; Xie, S.; Xin, W.; Liu, S.; Xu, L. Hierarchical ZSM-11 zeolite prepared by alkaline treatment with mixed solution of NaOH and CTAB: Characterization and application for alkylation of benzene with dimethyl ether. Catal. Sci. Technol. 2016, 6, 1328–1342. [Google Scholar] [CrossRef]
  11. Eman, Z.; Hegazy, I.H.; Abd El Maksod, R.M.M.; El Enin, R.A. Preparation and characterization of Ti and V modified analcime from local kaolin. Appl. Clay Sci. 2010, 49, 149–155. [Google Scholar] [CrossRef]
  12. Kosa, S.A.; El Maksod, I.H.; Hegazy, E.Z.; Baamer, D.F. Photo Catalytic Behavior of some Pharmacosiderite Titanium Analogs. Silicon 2020, 12, 813–820. [Google Scholar] [CrossRef]
  13. Hegazy, E.Z.; Kosa, S.A.; Abd El Maksod, I.H.; Baamer, D.F. Structural and Photocatalytic Behavior of Vanadium Incorporated ETS-4 Zeolite. Silicon 2020, 12, 2525. [Google Scholar] [CrossRef]
  14. Bellusi, G.; Carati, A.; Clerici, M.G.; Esposito, A.; Milllini, R.; Buonomo, F.B. Patent No. 1,001,038, 1989.
  15. Reddy, J.S.; Kumar, R.; Ratnasamy, P. Titanium silicalite-2: Synthesis, characterization and catalytic properties. Appl. Catal. 1990, 58, L1–L4. [Google Scholar] [CrossRef]
  16. Kishormal, N.; Ramaswamy, V.; Ganapathy, S.; Ramaswamy, A. Synthesis of tin-silicalite molecular sieves with MEL structure and their catalytic activity in oxidation reactions. Appl. Catal. A Gen. 1995, 125, 233–245. [Google Scholar] [CrossRef]
  17. Sen, T.; Ramaswamy, V.; Ganapathy, S.; Rajamohanan, P.R.; Sivasanker, S. Incorporation of Vanadium in Zeolite Lattices: Studies of the MEL (ZSM-11) System. J. Phys. Chem. 1996, 100, 3809–3817. [Google Scholar] [CrossRef]
  18. Rakshe, B.; Ramaswamy, V. Synthesis and characterization of zirconium silicate molecular sieves of MEL type using two different zirconium sources. In Recent Advances in Basic and Applied Aspects of Industrial Catalysis, Proceedings of the 13th National Symposium and Silver Jubilee Symposium of Catalysis of India, Dehradun, India, 2–4 April 1997; Elsevier: Amsterdam, The Netherlands, 1998; Volume 113, pp. 219–224. [Google Scholar] [CrossRef]
  19. Al-Harbi, L.M.; Kosa, S.A.; El Maksod, I.H.A.; Hegazy, E.Z. The Photocatalytic Activity of TiO2-Zeolite Composite for Degradation of Dye Using Synthetic UV and Jeddah Sunlight. J. Nanomater. 2015, 2015, 565849. [Google Scholar] [CrossRef] [Green Version]
  20. El Maksod, I.H.A.; Elzaharany, E.A.; Kosa, S.A.; Hegazy, E.Z. Simulation program for zeolite A and X with an active carbon composite as an effective adsorbent for organic and inorganic pollutants. Microporous Mesoporous Mater. 2016, 224, 89–94. [Google Scholar] [CrossRef]
  21. Schabbach, L.M.; Santos, B.C.d.; de Bortoli, L.S.; Fredel, M.C.; Henriques, B. Application of Kubelka-Munk model on the optical characterization of translucent dental zirconia. Mater. Chem. Phys. 2021, 258, 123994. [Google Scholar] [CrossRef]
  22. El Maksod, I.H.A.; Al-Shehri, A.; Bawaked, S.; Mokhtar, M.; Narasimharao, K. Structural and photocatalytic properties of precious metals modified TiO2-BEA zeolite composites. Mol. Catal. 2017, 441, 140–149. [Google Scholar] [CrossRef]
  23. Wu, C.-M.; Peng, R.; Dimitrijevic, N.M.; Rajh, T.; Koodali, R.T. Preparation of TiO2–SiO2 aperiodic mesoporous materials with controllable formation of tetrahedrally coordinated Ti4+ ions and their performance for photocatalytic hydrogen production. Int. J. Hydrogen Energy 2014, 39, 127–136. [Google Scholar] [CrossRef]
  24. Al-Asbahi, B.A.; Jumali, M.H.H.; Yap, C.C.; Salleh, M.M.; AlSalhi, M.S. Inhibition of dark quenching by TiO2 nanoparticles content in novel PFO/Fluorol 7GA hybrid: A new role to improve OLED performance. Chem. Phys. Lett. 2013, 570, 109–112. [Google Scholar] [CrossRef]
  25. Wu, C.-H.; Li, H.; Fong, H.H.; Pozdin, V.A.; Estroff, L.A.; Malliaras, G.G. Room-temperature preparation of crystalline TiO2 thin films and their applications in polymer/TiO2 hybrid optoelectronic devices. Org. Electron. 2011, 12, 1073–1079. [Google Scholar] [CrossRef]
  26. Hoeven, N.; Mali, G.; Mertens, M.; Cool, P. Design of Ti-Beta zeolites with high Ti loading and tuning of their hydrophobic/hydrophilic character. Microporous Mesoporous Mater. 2019, 288, 109588. [Google Scholar] [CrossRef]
  27. Collart, O.; Van Der Voort, P.; Vansant, E.F.; Desplantier, D.; Galarneau, A.; Di Renzo, F.; Fajula, F. A High-Yield Reproducible Synthesis of MCM-48 Starting from Fumed Silica. J. Phys. Chem. B 2001, 105, 12771–12777. [Google Scholar] [CrossRef]
  28. Barakat, N.A.; Kanjwal, M.A.; Chronakis, I.S.; Kim, H.Y. Influence of temperature on the photodegradation process using Ag-doped TiO2 nanostructures: Negative impact with the nanofibers. J. Mol. Catal. A Chem. 2013, 366, 333–340. [Google Scholar] [CrossRef] [Green Version]
  29. Liu, Y.; Ohko, Y.; Zhang, R.; Yang, Y.; Zhang, Z. Degradation of malachite green on Pd/WO3 photocatalysts under simulated solar light. J. Hazard. Mater. 2010, 184, 386–391. [Google Scholar] [CrossRef]
  30. Shifu, C.; Wei, Z.; Wei, L.; Huaye, Z.; Xiaoling, Y. Preparation, characterization and activity evaluation of p–n junction photocatalyst p-CaFe2O4/n-ZnO. Chem. Eng. J. 2009, 155, 466–473. [Google Scholar] [CrossRef]
  31. Zhang, Q.; Zhang, Q.; Wang, H.; Li, Y. A high efficiency microreactor with Pt/ZnO nanorod arrays on the inner wall for photodegradation of phenol. J. Hazard. Mater. 2013, 254–255, 318–324. [Google Scholar] [CrossRef]
  32. Gurjar, L.; Sharma, B.K. Effect of metal ion (common cations with same concentration) on photo assisted bleaching of methylene blue by Nb2O5, Der Chem. Sinica 2015, 6, 55–63. Available online: https://www.imedpub.com/abstract/effect-of-metal-ion-common-cations-with-same-concentration-onrnphotoassisted-bleaching-of-methylene-blue-by-nb2o5-12776.html (accessed on 14 May 2021).
  33. Obaidullah, M.; Miah, M.J.; Kayes, M.N.; Suzuki, N.; Hossain, M.M. Effect of Transitional Metal Ions on Photodegradation of Remazol Black B (RBB) in the Aqueous Suspension of ZnO under Solar Light Irradiation. J. Adv. Chem. Sci. 2017, 3, 445–448. Available online: https://www.jacsdirectory.com/journal-of-advanced-chemical-sciences/articleview.php?id=142 (accessed on 14 May 2021).
Figure 1. XRD patterns of all investigated samples.
Catalysts 11 00633 g001
Figure 2. SEM Image of investigated samples: (a) 2Ti:1Zr; (b) 1Ti:2Zr; (c) 1Ti:1Zr; (d) 100% Zr; (e) 100% Ti.
Catalysts 11 00633 g002
Figure 3. Kubelka–Munk method curves combined with a relation between percentage of Ti and band gap values: (a) 100% Ti; (b) 66%Ti; (c) 50% Ti; (d) 33%Ti; (e) 0 %Ti; (f) effect of %Ti on band gap.
Catalysts 11 00633 g003
Figure 4. Deconvolution graphs of diffuse reflectance spectra: (a) 100% Ti; (b) 2Ti:1Zr; (c) 2Zr:1Ti; (d) 1Ti:1Zr; (e) 100%Zr.
Catalysts 11 00633 g004
Figure 5. Infrared spectra of all investigated samples.
Catalysts 11 00633 g005
Figure 6. Three-dimensional curves of removal of 0 ppm ions with 10 ppm dye in the presence and absence of UV irradiation and the difference between curves: (a) under UV irradiation; (b) without UV irradiation; (c) two curves difference.
Catalysts 11 00633 g006
Figure 7. Three-dimensional curves of removal of 100 ppm ions with 10 ppm dye in the presence and absence of UV irradiation: (a) under UV irradiation; (b) without UV irradiation.
Catalysts 11 00633 g007
Figure 8. Three-dimensional curves of removal of 200 ppm ions with 10 ppm dye in the presence and absence of UV irradiation: (a) under UV irradiation; (b) without UV irradiation.
Catalysts 11 00633 g008
Figure 9. Three-dimensional curves of removal of 400 ppm ions with 10 ppm dye in the presence and absence of UV irradiation: (a) under UV irradiation; (b) without UV irradiation.
Catalysts 11 00633 g009
Figure 10. The power of each active site as a function of time with different initial concentrations of ions: (a) 400 ppm; (b) 200 ppm; (c) 100 ppm; (d) 0 ppm.
Catalysts 11 00633 g010
Figure 11. The effect of adsorbed ions and remaining ions on the power activity of each site: (a) 400 ppm remained; (b) 200 ppm remained; (c) 100 ppm remained; (d) 400 ppm adsorbed; (e) 200 ppm adsorbed; (f) 100 ppm adsorbed.
Catalysts 11 00633 g011aCatalysts 11 00633 g011b
Figure 12. Active power of each active site in the absence of ions.
Catalysts 11 00633 g012
Figure 13. Effect of remained and adsorbed copper ions on the power activity map: (a) 400 ppm remained; (b) 200 ppm remained; (c) 100 ppm remained; (d) 400 ppm adsorbed; (e) 200 ppm adsorbed; (f) 100 ppm adsorbed.
Catalysts 11 00633 g013
Figure 14. Effect of remained and adsorbed cobalt ions on the power activity map: (a) 400 ppm remained; (b) 200 ppm remained; (c) 100 ppm remained; (d) 400 ppm adsorbed; (e) 200 ppm adsorbed; (f) 100 ppm adsorbed.
Catalysts 11 00633 g014
Figure 15. Effect of remained and adsorbed nickel ions on the power activity map: (a) 400 ppm remained; (b) 200 ppm remained; (c) 100 ppm remained; (d) 400 ppm adsorbed; (e) 200 ppm adsorbed; (f) 100 ppm adsorbed.
Catalysts 11 00633 g015
Figure 16. Effect of remained and adsorbed lead ions on the power activity map: (a) 400 ppm remained; (b) 200 ppm remained; (c) 100 ppm remained; (d) 400 ppm adsorbed; (e) 200 ppm adsorbed; (f) 100 ppm adsorbed.
Catalysts 11 00633 g016
Figure 17. Photochemical reactor.
Catalysts 11 00633 g017
Table 1. Crystal lattice analysis of investigated samples.
Crystallite Size (nm)Amorphous PhaseRelative CrystallinityγβαCbaVolume of Unit CrystalCrystal SystemPhase NameSample
---90909013.420.0620.06-TetragonalZSM-11Reference
Pdf no (P420022)
47.7335.264.89090908.02844.412.774556.1 Pm3OrthorhombicZSM-11100% Ti
41.6246.253.890909019.821.220.68669.89 Pm3OrthorhombicZSM-11(1Zr:2Ti)
47.7471.428.690104.69018.4628.827.714,262.2 Pm3MonoclinicZSM-11(1Zr:1Ti)
49.171.498.696.492.810211.3820.3518.044086.11 Pm3TriclinicZSM-11(2Zr:1Ti)
54.09010090909013.428.428.210,811.7 Pm3OrthorhombicZSM-11100%Zr
Table 2. Results of EDX analysis of orthorhombic shapes.
SampleSiOZrTiNaSi/(Ti + Zr)
100% Zr23.87740.97-1.0824.61
2Zr:1Ti25.170.61.430.442.3413.42
1Ti:1Zr28.769.50.86-0.933.37
2Ti:1Zr40.4357.71.31-0.5930.86
100% Ti25.570.8-1.242.3820.56
Table 3. EDX analysis of spherical shapes in different samples.
SampleSiOZrTiNaSi/(Zr + Ti)
1Ti:1Zr21.974.71.120.71.5812.03297
2Ti:1Zr27.567.81.320.952.512.11454
Table 4. Normalized real crystallinity against real amorphous ratios.
Real AmorphousNormalized Crystallinity (Actual Related to Yield)Sample
94.225.78100% Ti
95.24.8(1Zr:2Ti)
97.452.55(1Zr:1Ti)
91.218.79(2Zr:1Ti)
91.18.9100%Zr
Table 5. Deconvolution data of diffuse reflectance spectra.
SamplePeaksAreaCenterWidthHeight
100% Ti138.2225.941.10.59
238.9257.742.70.58
322.0288.138.20.37
2Ti:1Zr140.9224.443.00.61
242.9256.245.30.60
321.1285.641.50.32
1Ti:1Zr142.4220.248.50.56
276.1254.861.00.79
33.7288.235.50.066
1Ti:2Zr128.9223.034.20.54
240.5248.742.70.60
320.5277.348.40.27
100% Zr1127.6193.7133.00.61
232.17248.0549.050.42
3
Table 6. Ratios among octahedral, tetrahedral, and crystalline active sites.
% Amorphous% Crystalline
% TiOctaTetra
10036.3257.895.78
6633.3261.874.8
504.8392.612.55
3336.8254.388.79
0091.218.9
Table 7. Evaluation of Equation (1) in the prediction of 100% Ti and 100% Zr samples.
0 Ions
Time100% Zr Simulated100% Zr Real% Error100% Ti Real100% Ti Simulated% ErrorAverage Error
0000000-
1044.0624.7219.3410.01−3.4613.48-
2048.3720.2828.099.6−2.5112.11-
4034.2818.1916.0911.4−0.7212.11-
6023.4616.257.2212.350.9411.41-
806.1812.626.4413.52−0.4814-
100−413.7117.7113.620.1913.43-
120−13.2214.6927.9115.712.2413.47-
average error-15.35--11.2513.3
100 ppm Ions
Time100% Zr Simulated100% Zr Real% Error100% Ti Simulated100% Ti Actual% ErrorAverage Error
0000000-
1018.8311.077.7613.7414.941.2-
2022.5319.82.7319.4621.011.56-
4033.6634.81.1432.0232.790.77-
6041.5452.0610.5141.2240.480.74-
8046.6664.1717.5146.8547.911.07-
10051.3174.6623.3551.8554.592.73-
12058.8178.4119.659.757.412.29-
average error 10.33 1.293.87
200 ppm Ions
Time100% Zr Simulated100% Zr Real% Error100% Ti Simulated100% Ti Actual% ErrorAverage Error
0000000-
1016.47.059.3511.7711.270.5-
2020.5614.336.2418.1619.971.81-
4032.8724.947.9329.7431.131.39-
6041.4234.956.4638.8939.130.24-
8047.0944.142.9545.7647.121.36-
10053.3754.491.1252.9753.270.3
12056.8859.82.9357.3160.212.9-
average error-4.62--1.062.84
400 ppm Ions
Time100% Zr Simulated100% Zr Real% Error100% Ti Simulated100% Ti Actual% ErrorAverage Error
0000000
108.029.331.315.728.873.15-
2018.8120.391.5815.9117.561.65-
4035.3834.011.3830.7230.110.62-
6046.5347.230.741.740.870.84-
8049.4456.77.2546.6950.814.12-
10056.3564.938.5853.7758.64.83-
12061.672.1510.5560.1365.345.21-
average error-3.92--2.553.23
Table 8. Kinetic summary of samples.
0 Ions100 ppm Ions200 ppm Ions400 ppm Ions
SampleR2KR2kR2kR2k
100% Zr0.760.200.860.160.870.150.920.15
2Zr:1Ti0.770.210.850.160.850.160.880.15
1Zr:1Ti0.760.230.850.160.880.150.990.13
2Ti:1Zr0.770.210.850.150.850.150.990.14
100% Ti0.770.180.840.150.860.160.910.14
Table 9. Elemental composition (atomic ratio) in synthesizing mixture.
SampleSiZrTiNaSi/(Zr + Ti)
100% Zr83.22.54014.232.7
2Zr:1Ti83.21.690.8514.232.7
1Ti:1Zr83.21.31.314.232.7
2Ti:1Zr83.20.851.714.232.7
100% Ti83.202.514.232.7
Publisher’s Note: MDPI stays neutral with regard to jurisdictional claims in published maps and institutional affiliations.

