
Decomposition of Tars on a Nickel Honeycomb Catalyst
by
 ,
,
Joanna Woroszył-Wojno
1,*, 
Michał Młotek
1,
Michalina Perron
1,
Paweł Jóźwik
2,
Bogdan Ulejczyk
1 and
Krzysztof Krawczyk
1 1
Faculty of Chemistry, Warsaw University of Technology, Noakowskiego 3, 00-664 Warsaw, Poland
2
Faculty of Advanced Technologies and Chemistry, Military University of Warsaw, Kaliskiego 2, 00-908 Warsaw, Poland
*
Author to whom correspondence should be addressed.
Catalysts 2021, 11(7), 860; https://0-doi-org.brum.beds.ac.uk/10.3390/catal11070860
Submission received: 24 June 2021
/
Revised: 8 July 2021
/
Accepted: 13 July 2021
/
Published: 19 July 2021
(This article belongs to the Special Issue Towards Catalysts Prepared by Cold Plasma)
Abstract
:Biomass can be considered a renewable energy source. It undergoes a gasification process to obtain gaseous fuel, which converts it into combustible gaseous products such as hydrogen, carbon monoxide, and methane. The process also generates undesirable tars that can condense in gas lines and cause corrosion, and after processing, can be an additional source of combustible gases. This study focused on the processing of tar substances with toluene as a model substance. The effect of discharge power and carrier gas composition on toluene conversion was tested. The process was conducted in a plasma-catalytic system with a new Ni3Al system in the form of a honeycomb. The toluene conversion reached 90%, and small amounts of ethane, ethylene, acetylene, benzene, and C3 and C4 hydrocarbons were detected in the post-reaction mixture. Changes in the surface composition of the Ni3Al catalyst were observed throughout the experiments. These changes did not affect the toluene conversion.
1. Introduction
Biomass can be a renewable energy source. To obtain gaseous fuel, biomass undergoes gasification or fermentation processes. Biomass gasification is a conversion of biomass into combustible gaseous products, such as hydrogen, carbon monoxide, and methane. This process is carried out at elevated temperatures, and the products also include undesirable substances, such as tar [1]. Tar is a complex mixture containing carcinogenic, mono- and polycyclic aromatic hydrocarbons, which can condense in gas pipes and cause corrosion. The composition and concentration of tars in the gas depend on the type of biomass, its size, and the gasification conditions [2,3,4,5]. After processing, tars can be an additional source of gaseous fuels such as H2, CO, and CH4.
The use of pyrolysis gas as a fuel obtained from biomass requires its purification since gas engines require fuel of a specific purity. According to different sources, the concentration of tar substances cannot exceed the value of 50–100 mg/m3, and their content after gasification can reach up to 180 mg/m3 [3,4,5].
Common methods of tar removal are absorption, adsorption, and plasma treatment [3], as well as plasma-catalytic and catalytic methods. The most effective catalysts used to decompose tar from the biomass gasification product stream are nickel catalysts [6,7,8,9]. The disadvantages of catalytic processes are the high process temperature of 600–800 °C, which is economically unfavorable, and the formation of carbon deposits on the catalyst surface [5,10]. A way to solve these problems is to use non-equilibrium plasma with a catalyst [11,12,13]. Most studies are conducted on supported or co-precipitated catalysts [5,8,14,15]. The novelty of these studies is the use of a metal catalyst made of Ni3Al intermetallic alloy strips with a high nickel content together with a gliding discharge plasma.
2. Results and Discussion
2.1. Studies on Changes of the Catalyst Surface after Toluene Decomposition Process
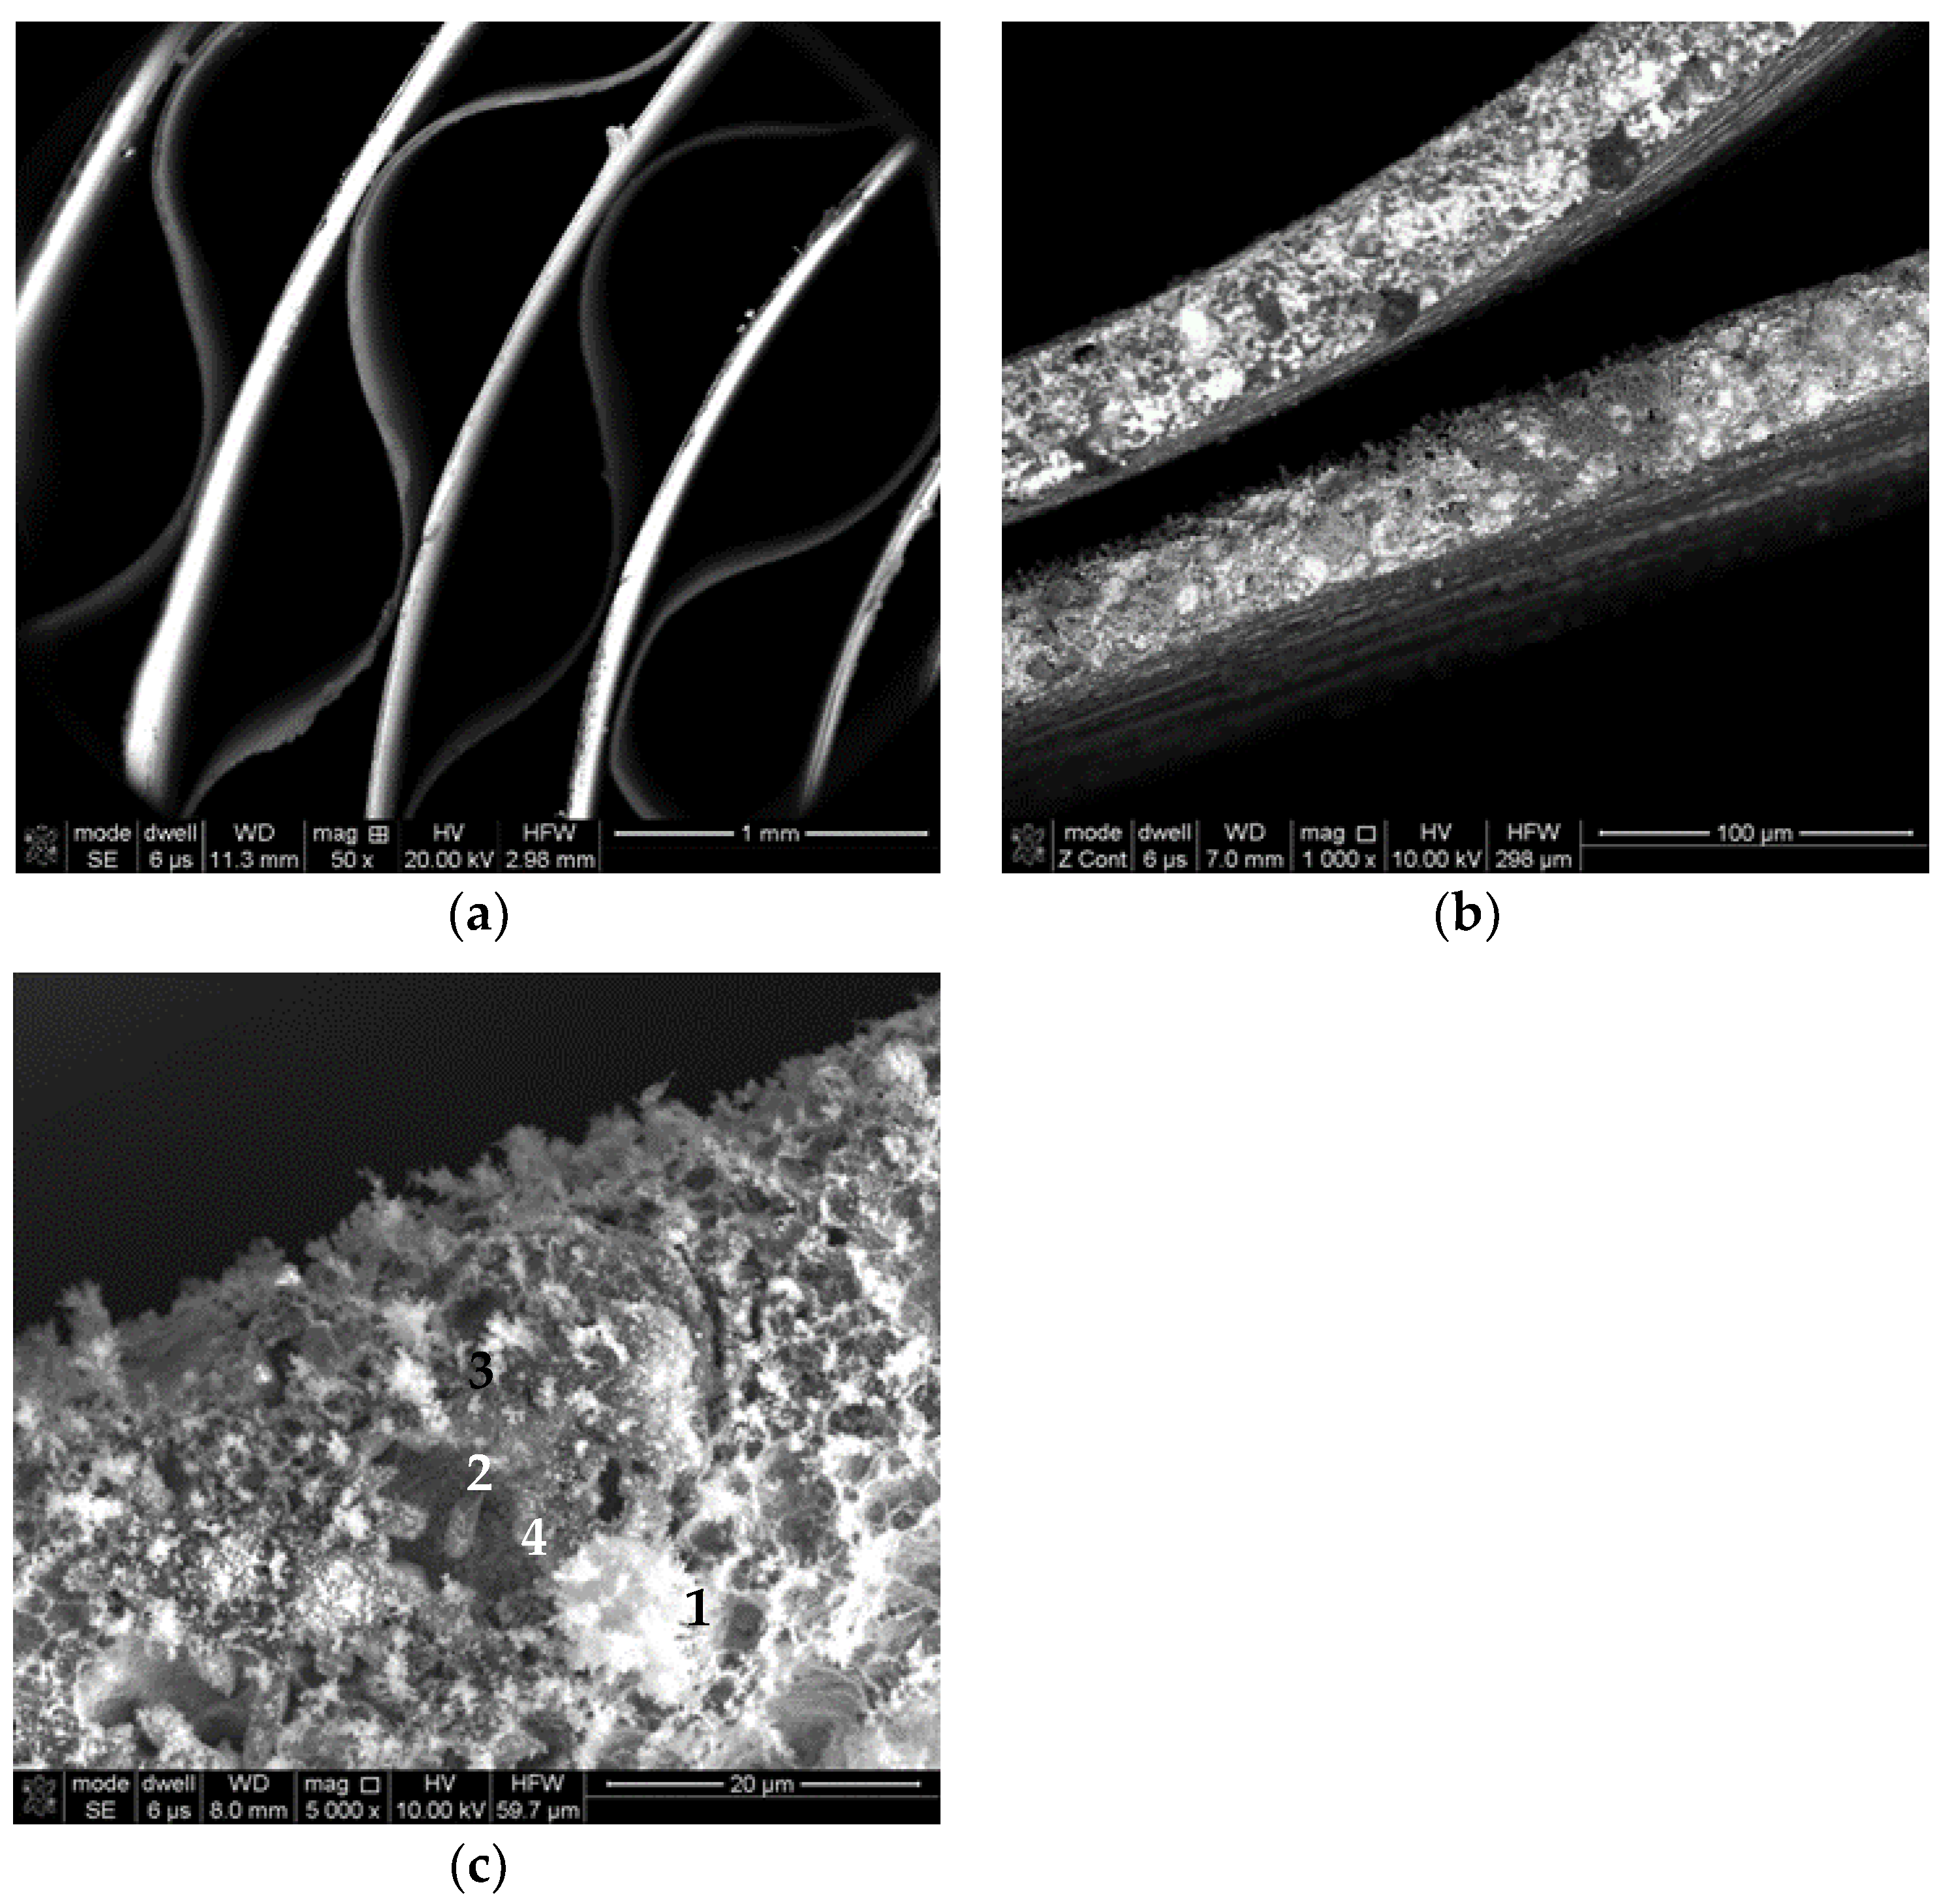
Scanning electron microscope observations revealed a complex morphology on both front and side surfaces of the catalyst (Figure 1). Spherical particles were found (Figure 1b) due to the over-melting of the surfaces of the high-voltage electrodes made of Al–Si alloys. At the edge of the catalyst, nanofibers of complex composition were also observed (Figure 1b,c). In addition, the surface of the catalyst was changed. New areas appeared; their composition was different from the original catalyst composition (Table 1). New elements (Si and C) were detected, and the amount of oxygen on the surface increased in many places. The presence of oxygen may result from the oxidation of the catalyst surface, but the new elements come from electrode corrosion and toluene processing.
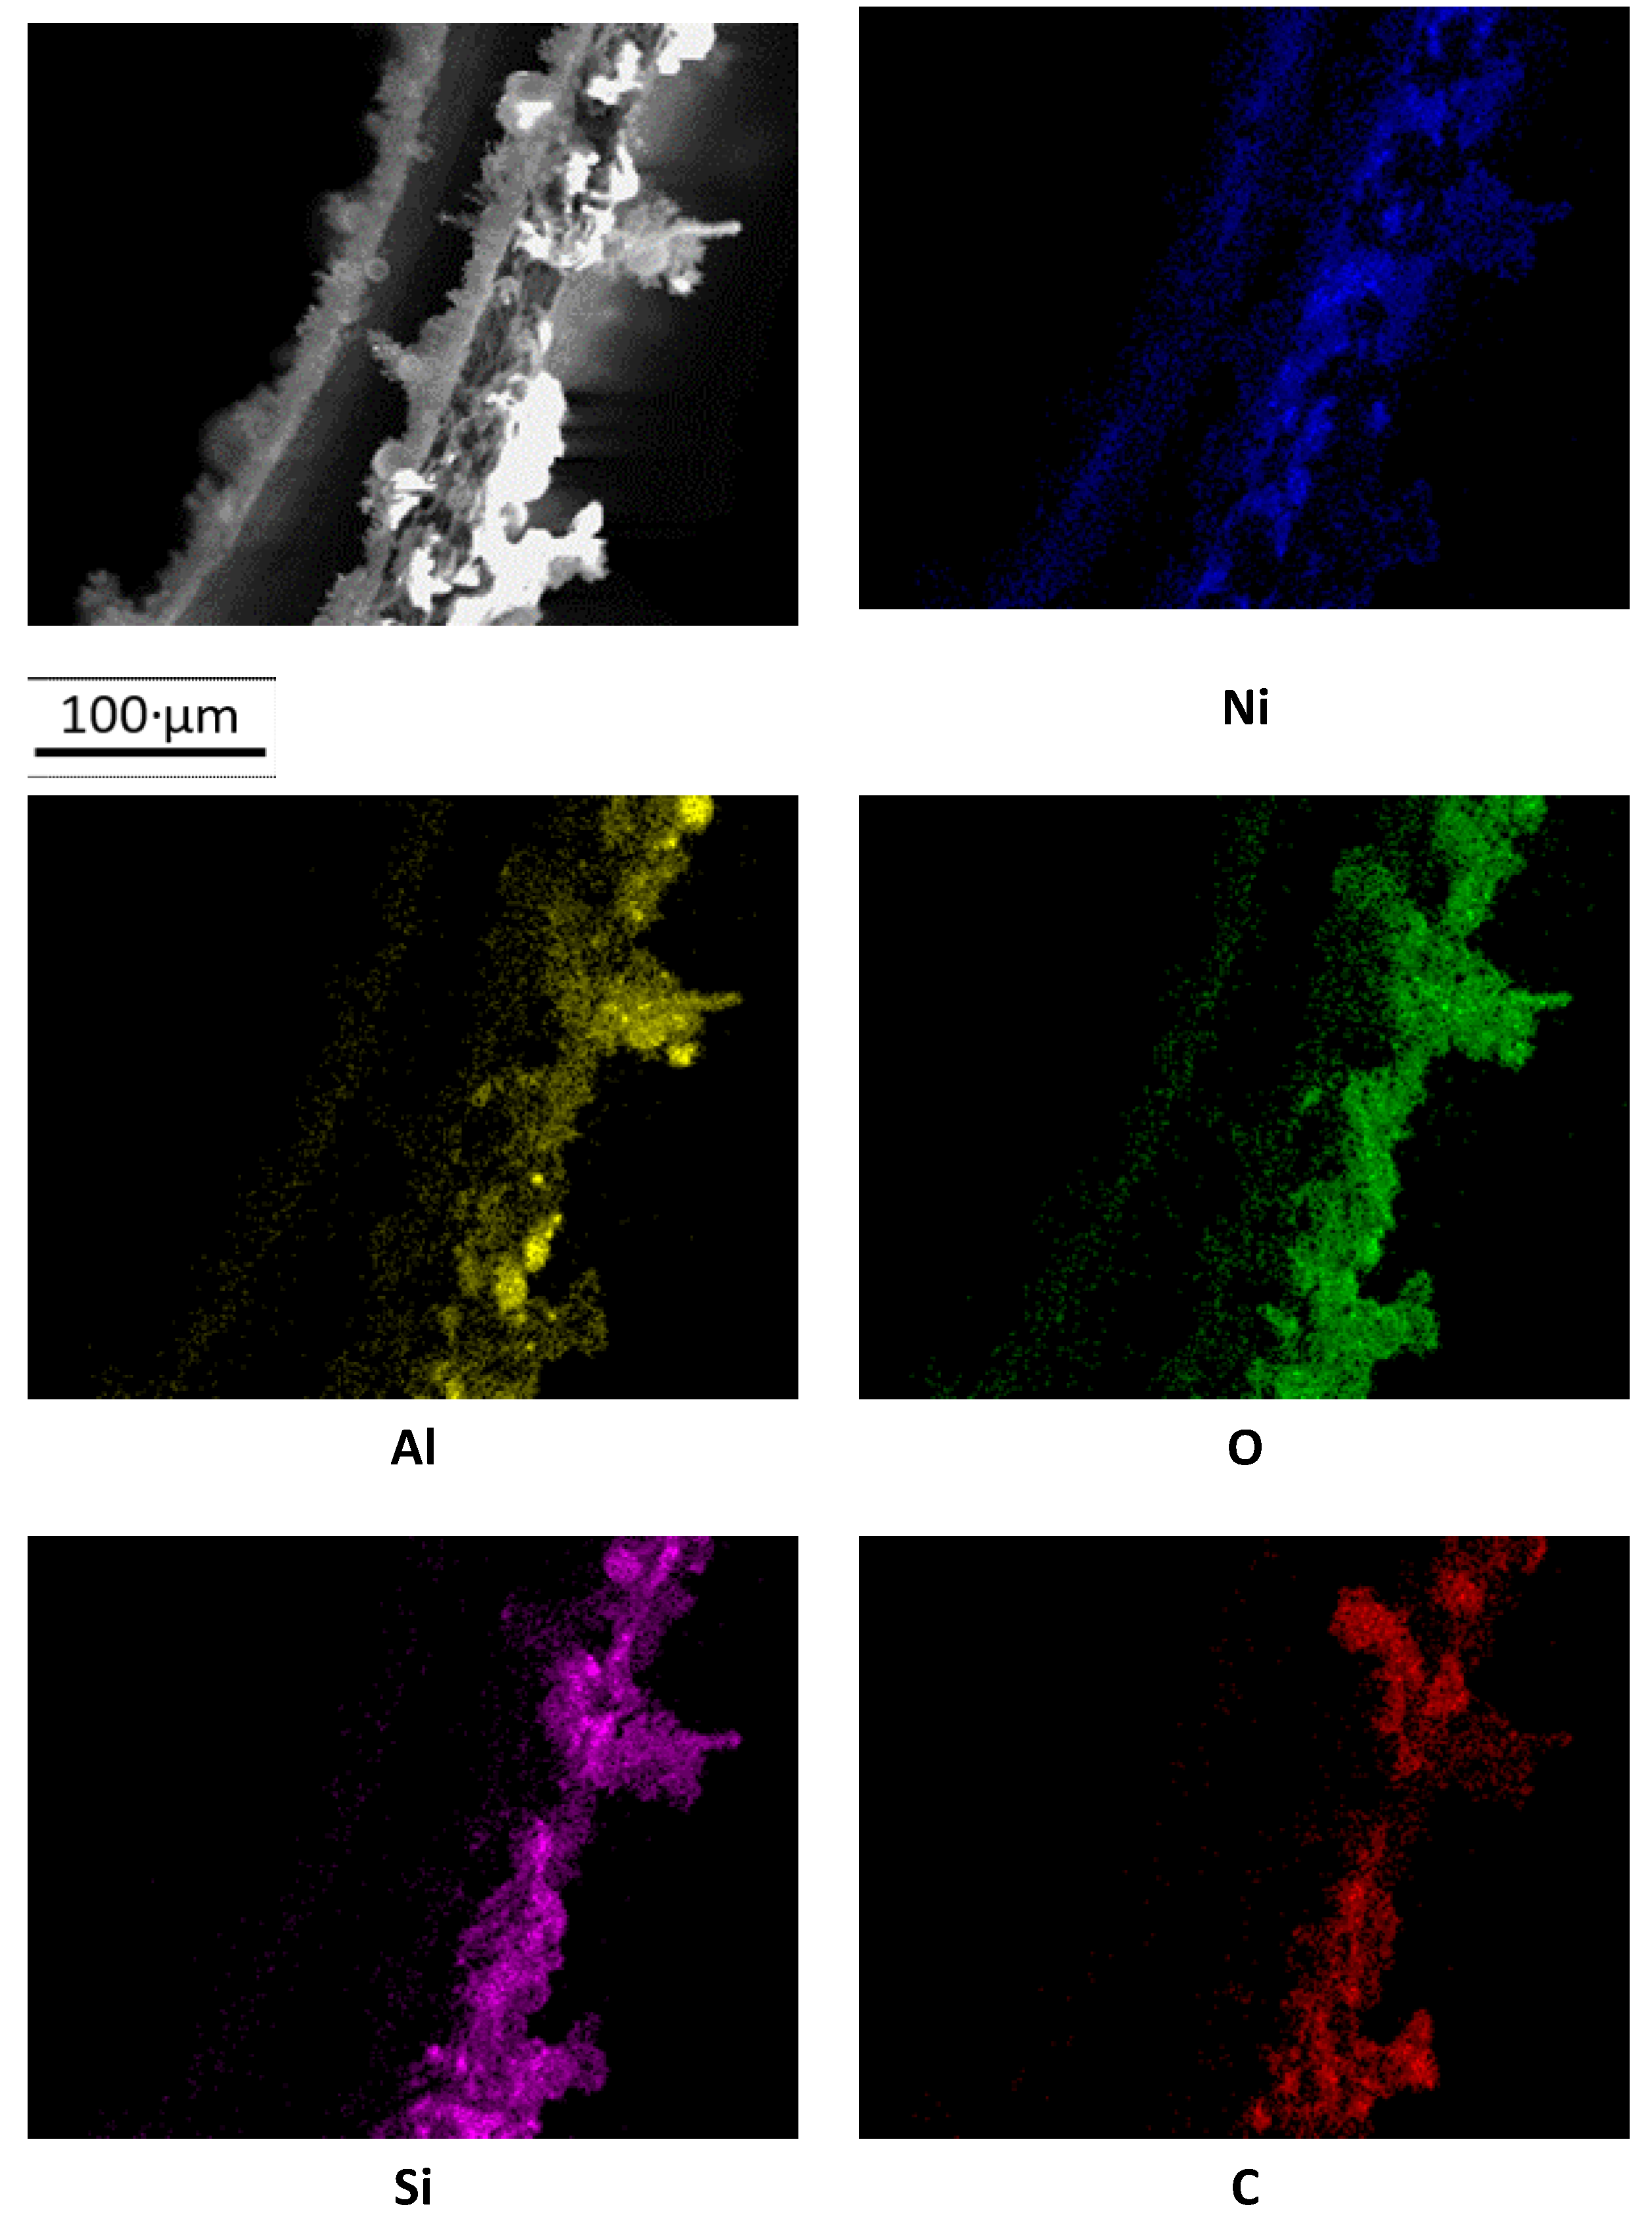
Analysis of the chemical composition by an EDS spectrometer revealed a significant share of oxygen in the resulting nanofibers and at the edges of the catalyst (Figure 2). It is a component of several chemical compounds formed in the process. Small amounts of carbon were deposited on the resulting nanofibers. The nickel in the nanofibers comes from the catalyst surface. It means that during the toluene conversion, the catalyst’s surface was oxidized, and the resulting oxides form a new phase in the shape of fibers. The fibers also include Al and Si. Aluminum can come from the catalyst material, but the presence of silicon is the result of the corrosion of the electrodes. Therefore, the formation of nanofibers is not a favorable process, as it indicates the ongoing corrosion processes of the electrodes and the catalyst itself. Moreover, metallic nickel is an active phase in tar decomposition. Therefore, the formation of nickel oxide and carbon deposits may limit the activity of the catalyst.
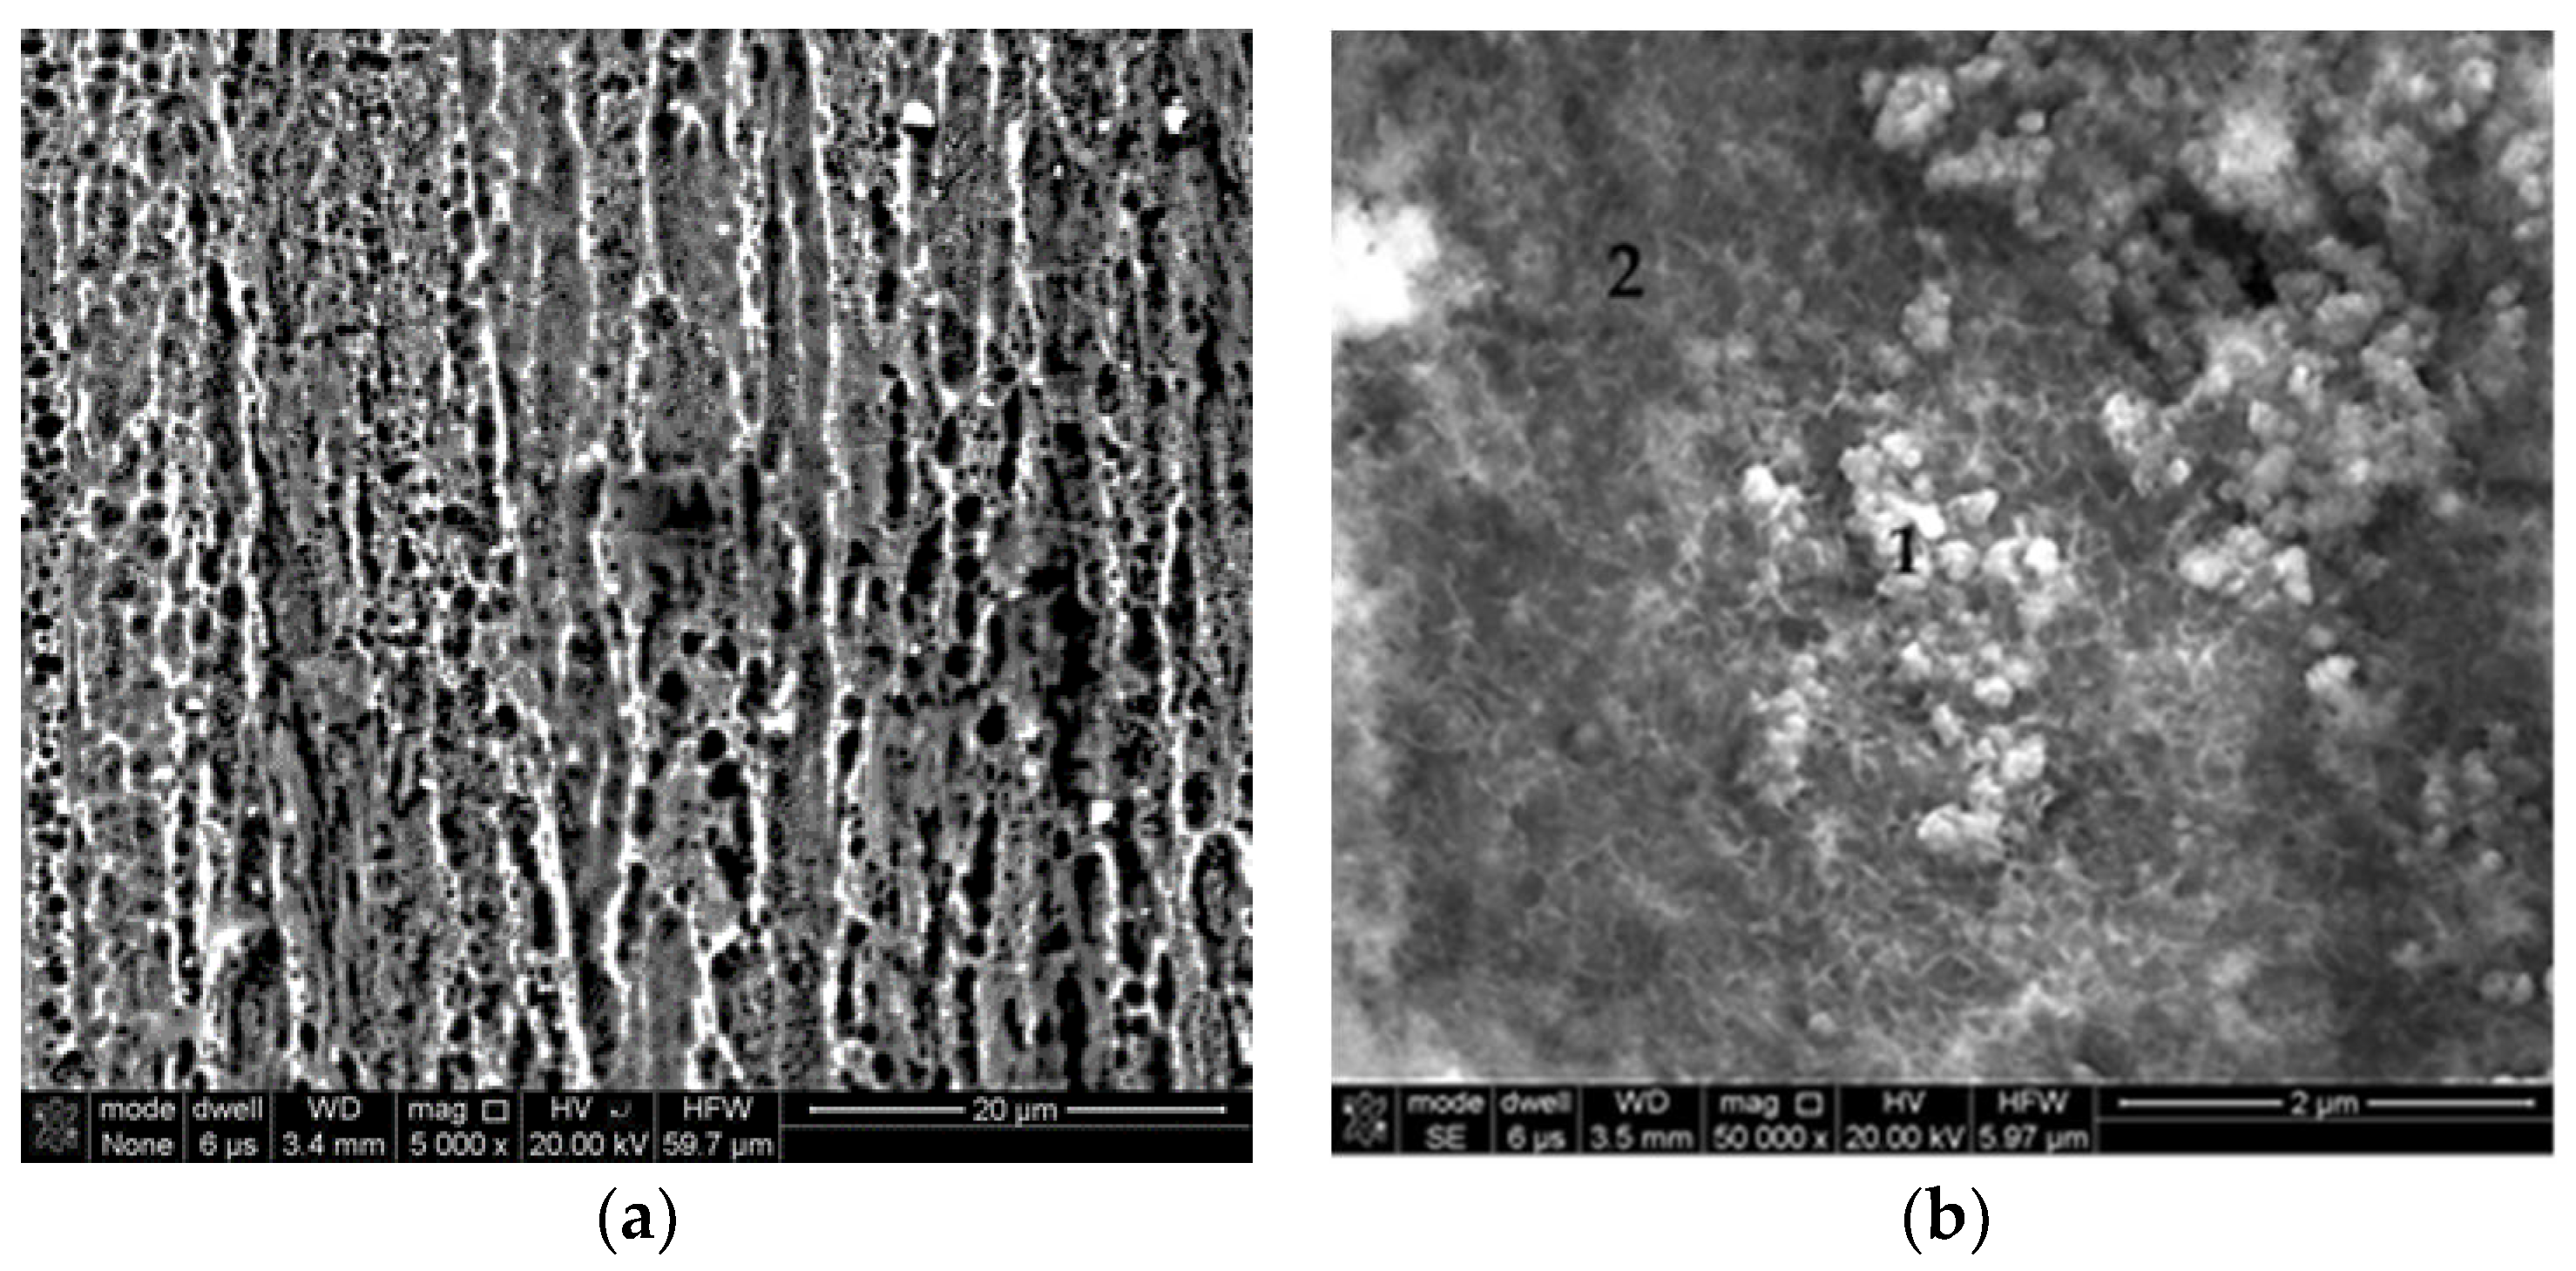
Analysis of the Ni3Al catalyst’s side surface after toluene decomposition using SEM imaging (Figure 3) performed at high magnification showed a slight surface development. No nanofibers were observed, and the oxygen- and silicon-rich areas occupy a small area. The side surface of the catalyst is also not covered with carbon, i.e., there was no carbon deposition. The amount of carbon on the surface is constant and much lower than on the edges of the nanofibers (Table 2).
2.2. Plasma-Catalytic Conversion of Toluene
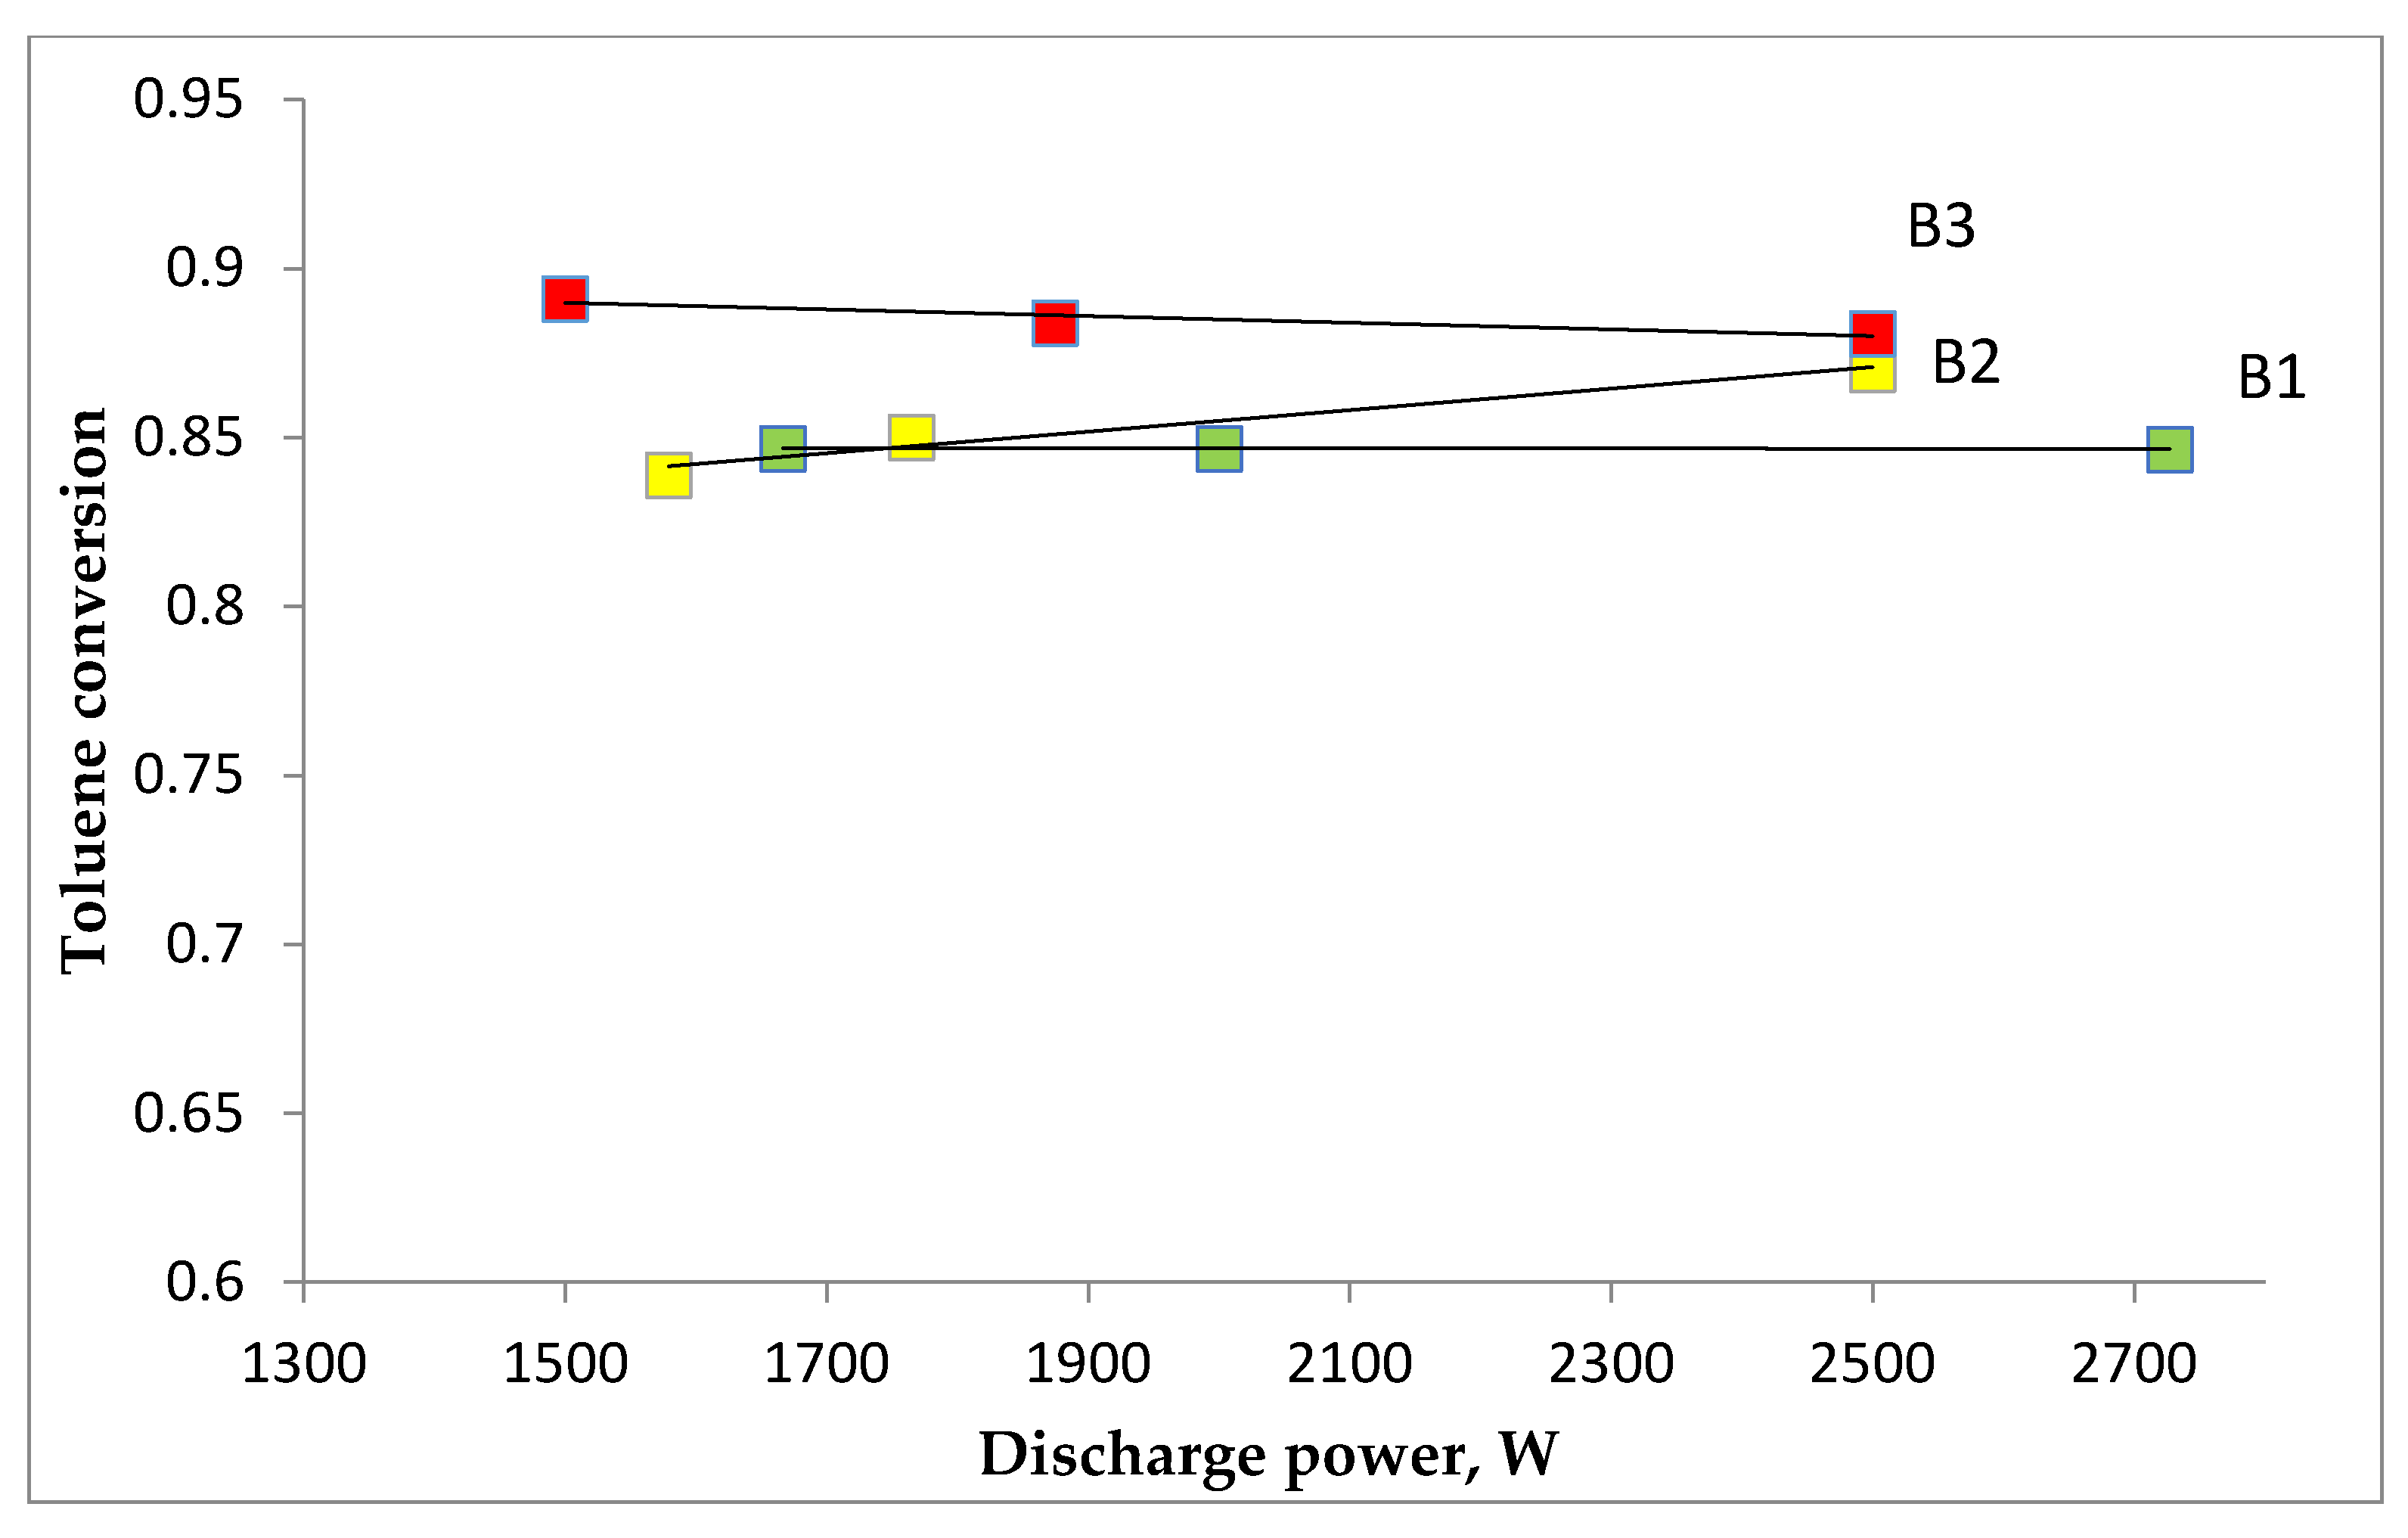
A high conversion of toluene (90%) was obtained. Using a hydrogen concentration of 36% and toluene concentrations of 2000 (B1), 3000 (B2), and 4500 (B3) ppm, a marginal change in toluene conversion was observed with increasing discharge power. With the discharge power above 2200 W, toluene conversion reaches similar values (above 85%), regardless of its initial concentration (Figure 4). The increase in the initial concentration of toluene increased its conversion. The minor influence of the discharge power on the change in the toluene conversion indicates that the catalytic process affects the toluene conversion to a greater extent than the plasma one. The observed effect of the change in toluene conversion with increasing initial concentration is due to the increase in the reaction rate on the catalyst’s surface.
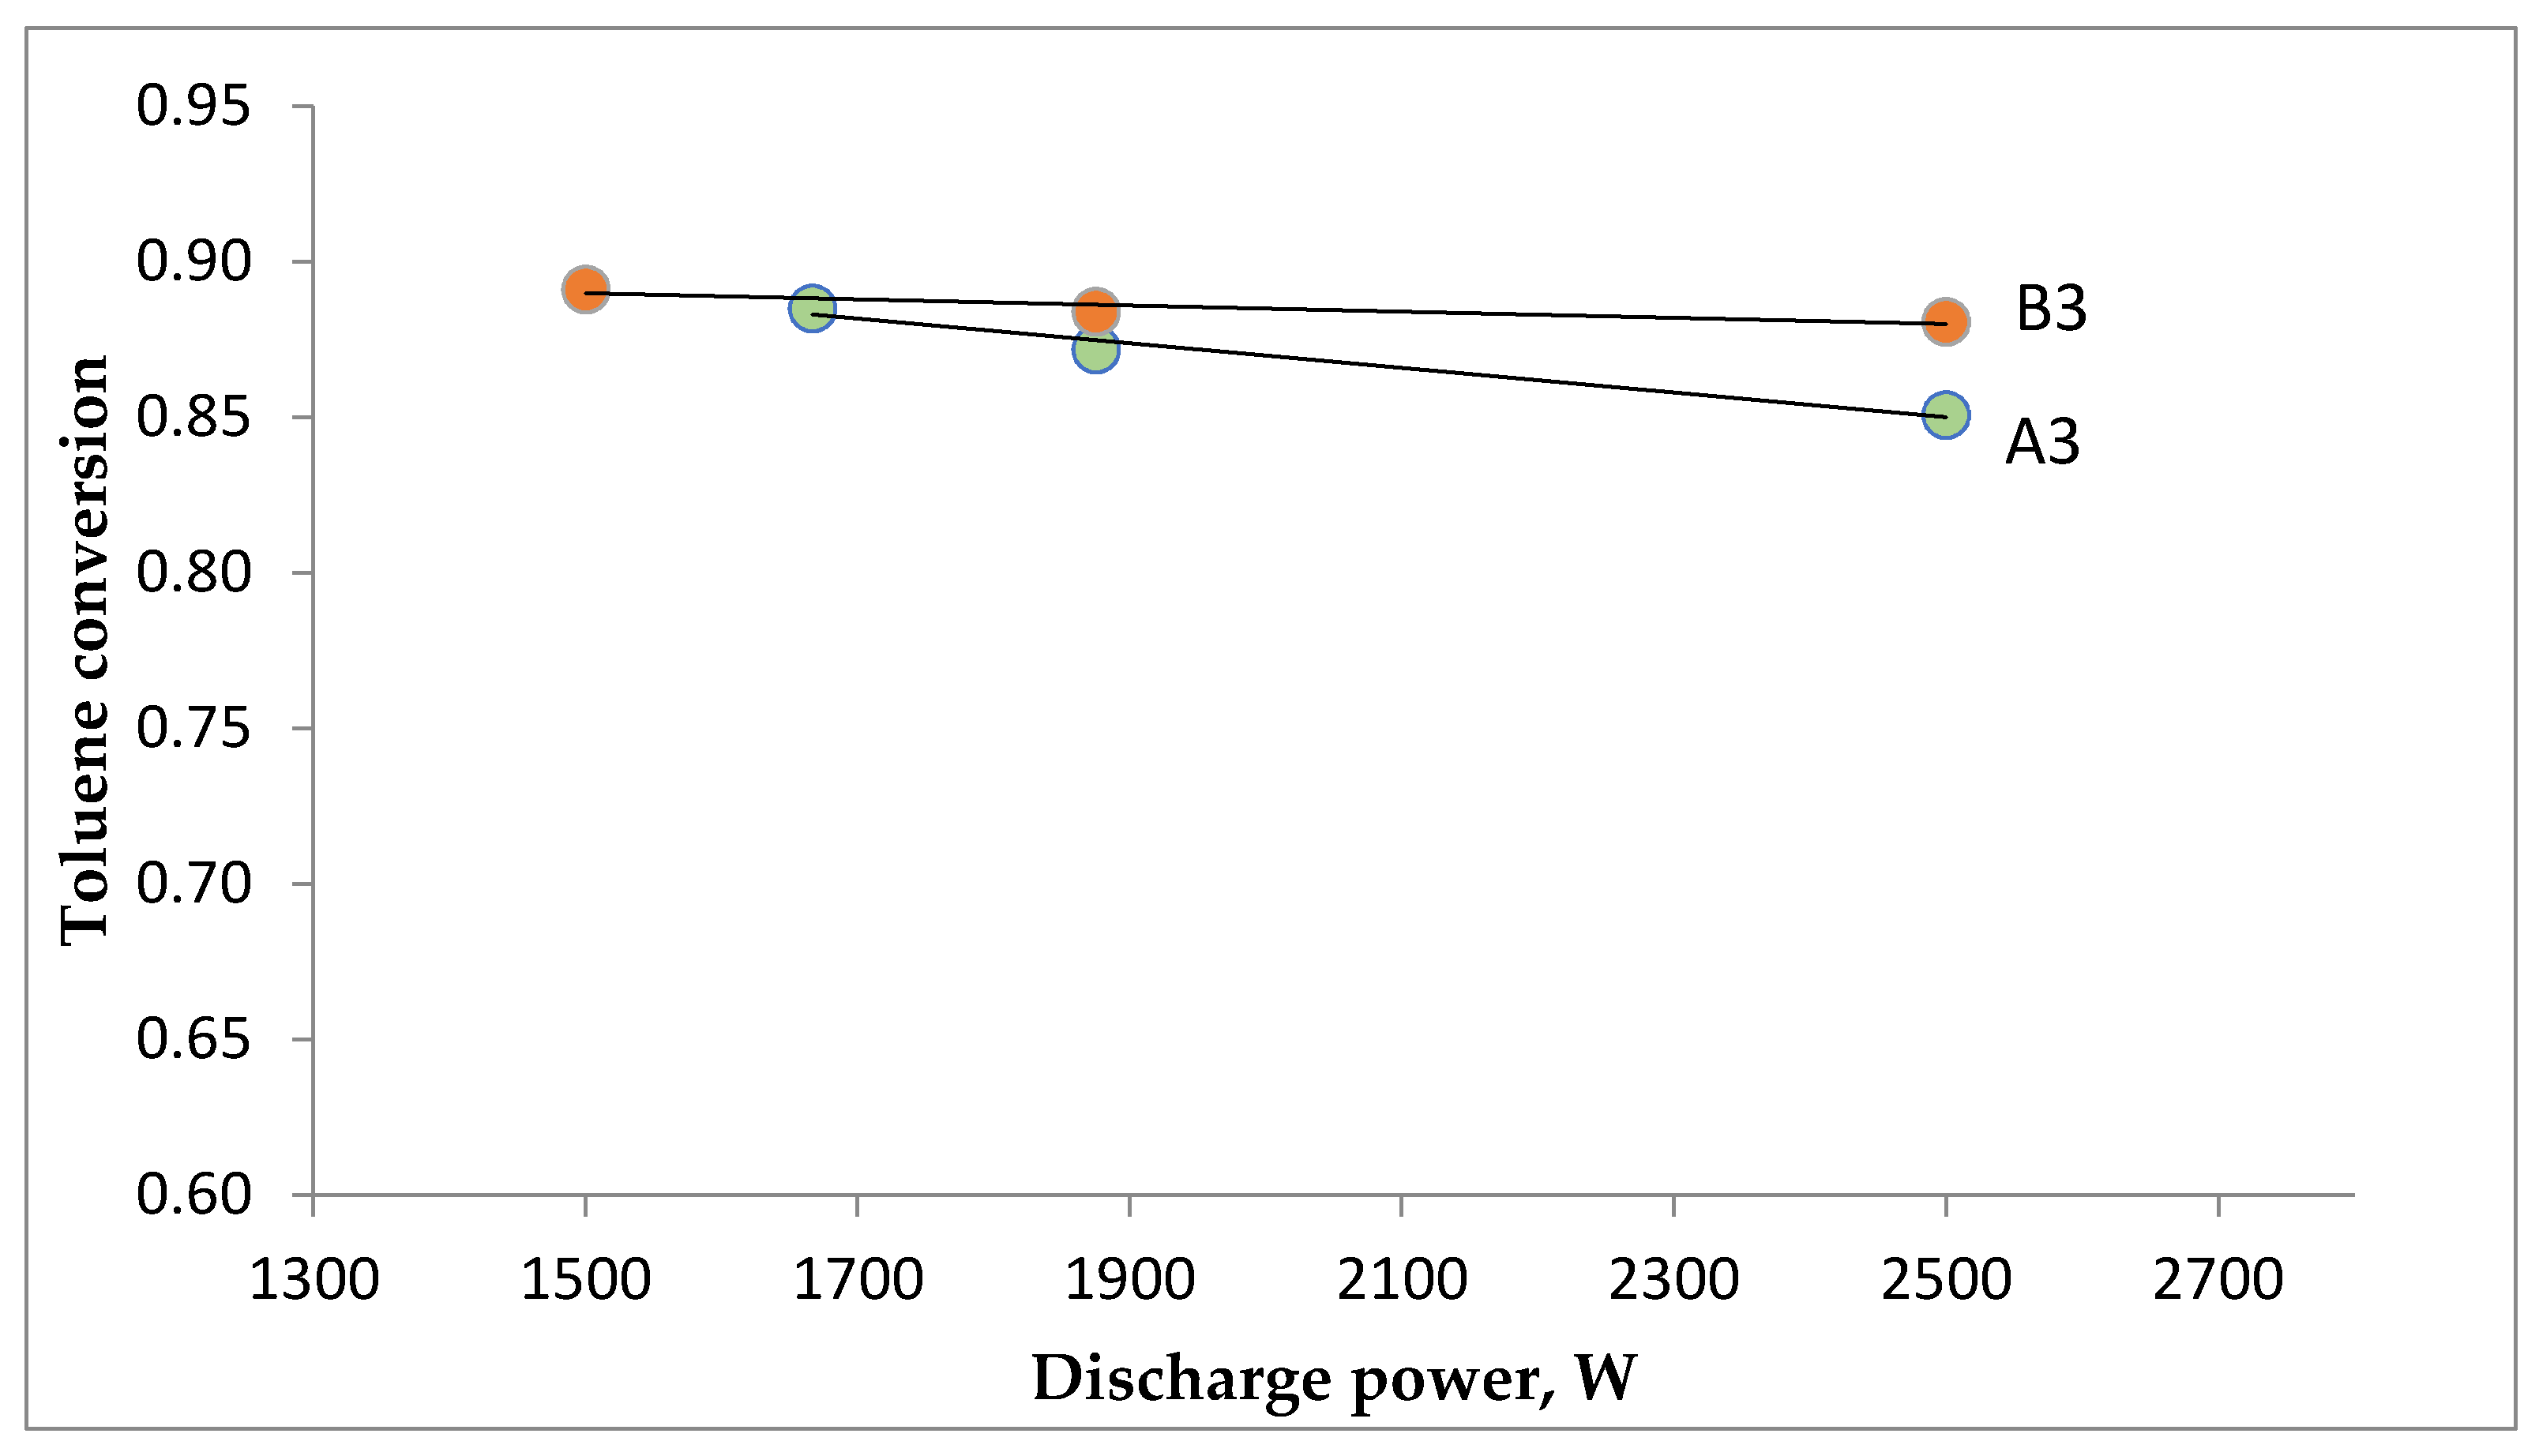
With the increase in discharge power at an initial hydrogen concentration of 36% (B3), a higher toluene conversion was achieved than at a H2 concentration of 32% (A3). Furthermore, for the A3 series, as the discharge power increases, the conversion of toluene decreases by about 5% (Figure 5). This may be due to the lower concentration of hydrogen radicals generated in plasma (compared to the gas B3), which are involved in the activation reaction of toluene in the catalytic process [16]. Moreover, the values of toluene conversion obtained in the plasma-catalytic system are higher than in the homogeneous system [10] throughout the investigated range of initial toluene concentration.
In the gas after the reaction, apart from the components introduced into the reactor, a small amount of methane, C2–C4 aliphatic hydrocarbons, and trace amounts of benzene were observed. No higher aromatic hydrocarbons were found.
Changes in the concentrations of the individual components were small. A decrease in the concentration of hydrogen and carbon dioxide was observed. Hydrogen was used for the methanation of CO or hydrogenation of acetylene. A part of the hydrogen was used to bind the oxygen formed from the dissociation of CO2. As a result, the carbon monoxide content was increased by up to 5%. It is a very beneficial effect because, instead of non-combustible carbon dioxide, the concentration of combustible carbon monoxide increases in the pyrolysis gas, which increases the calorific value of the gas.
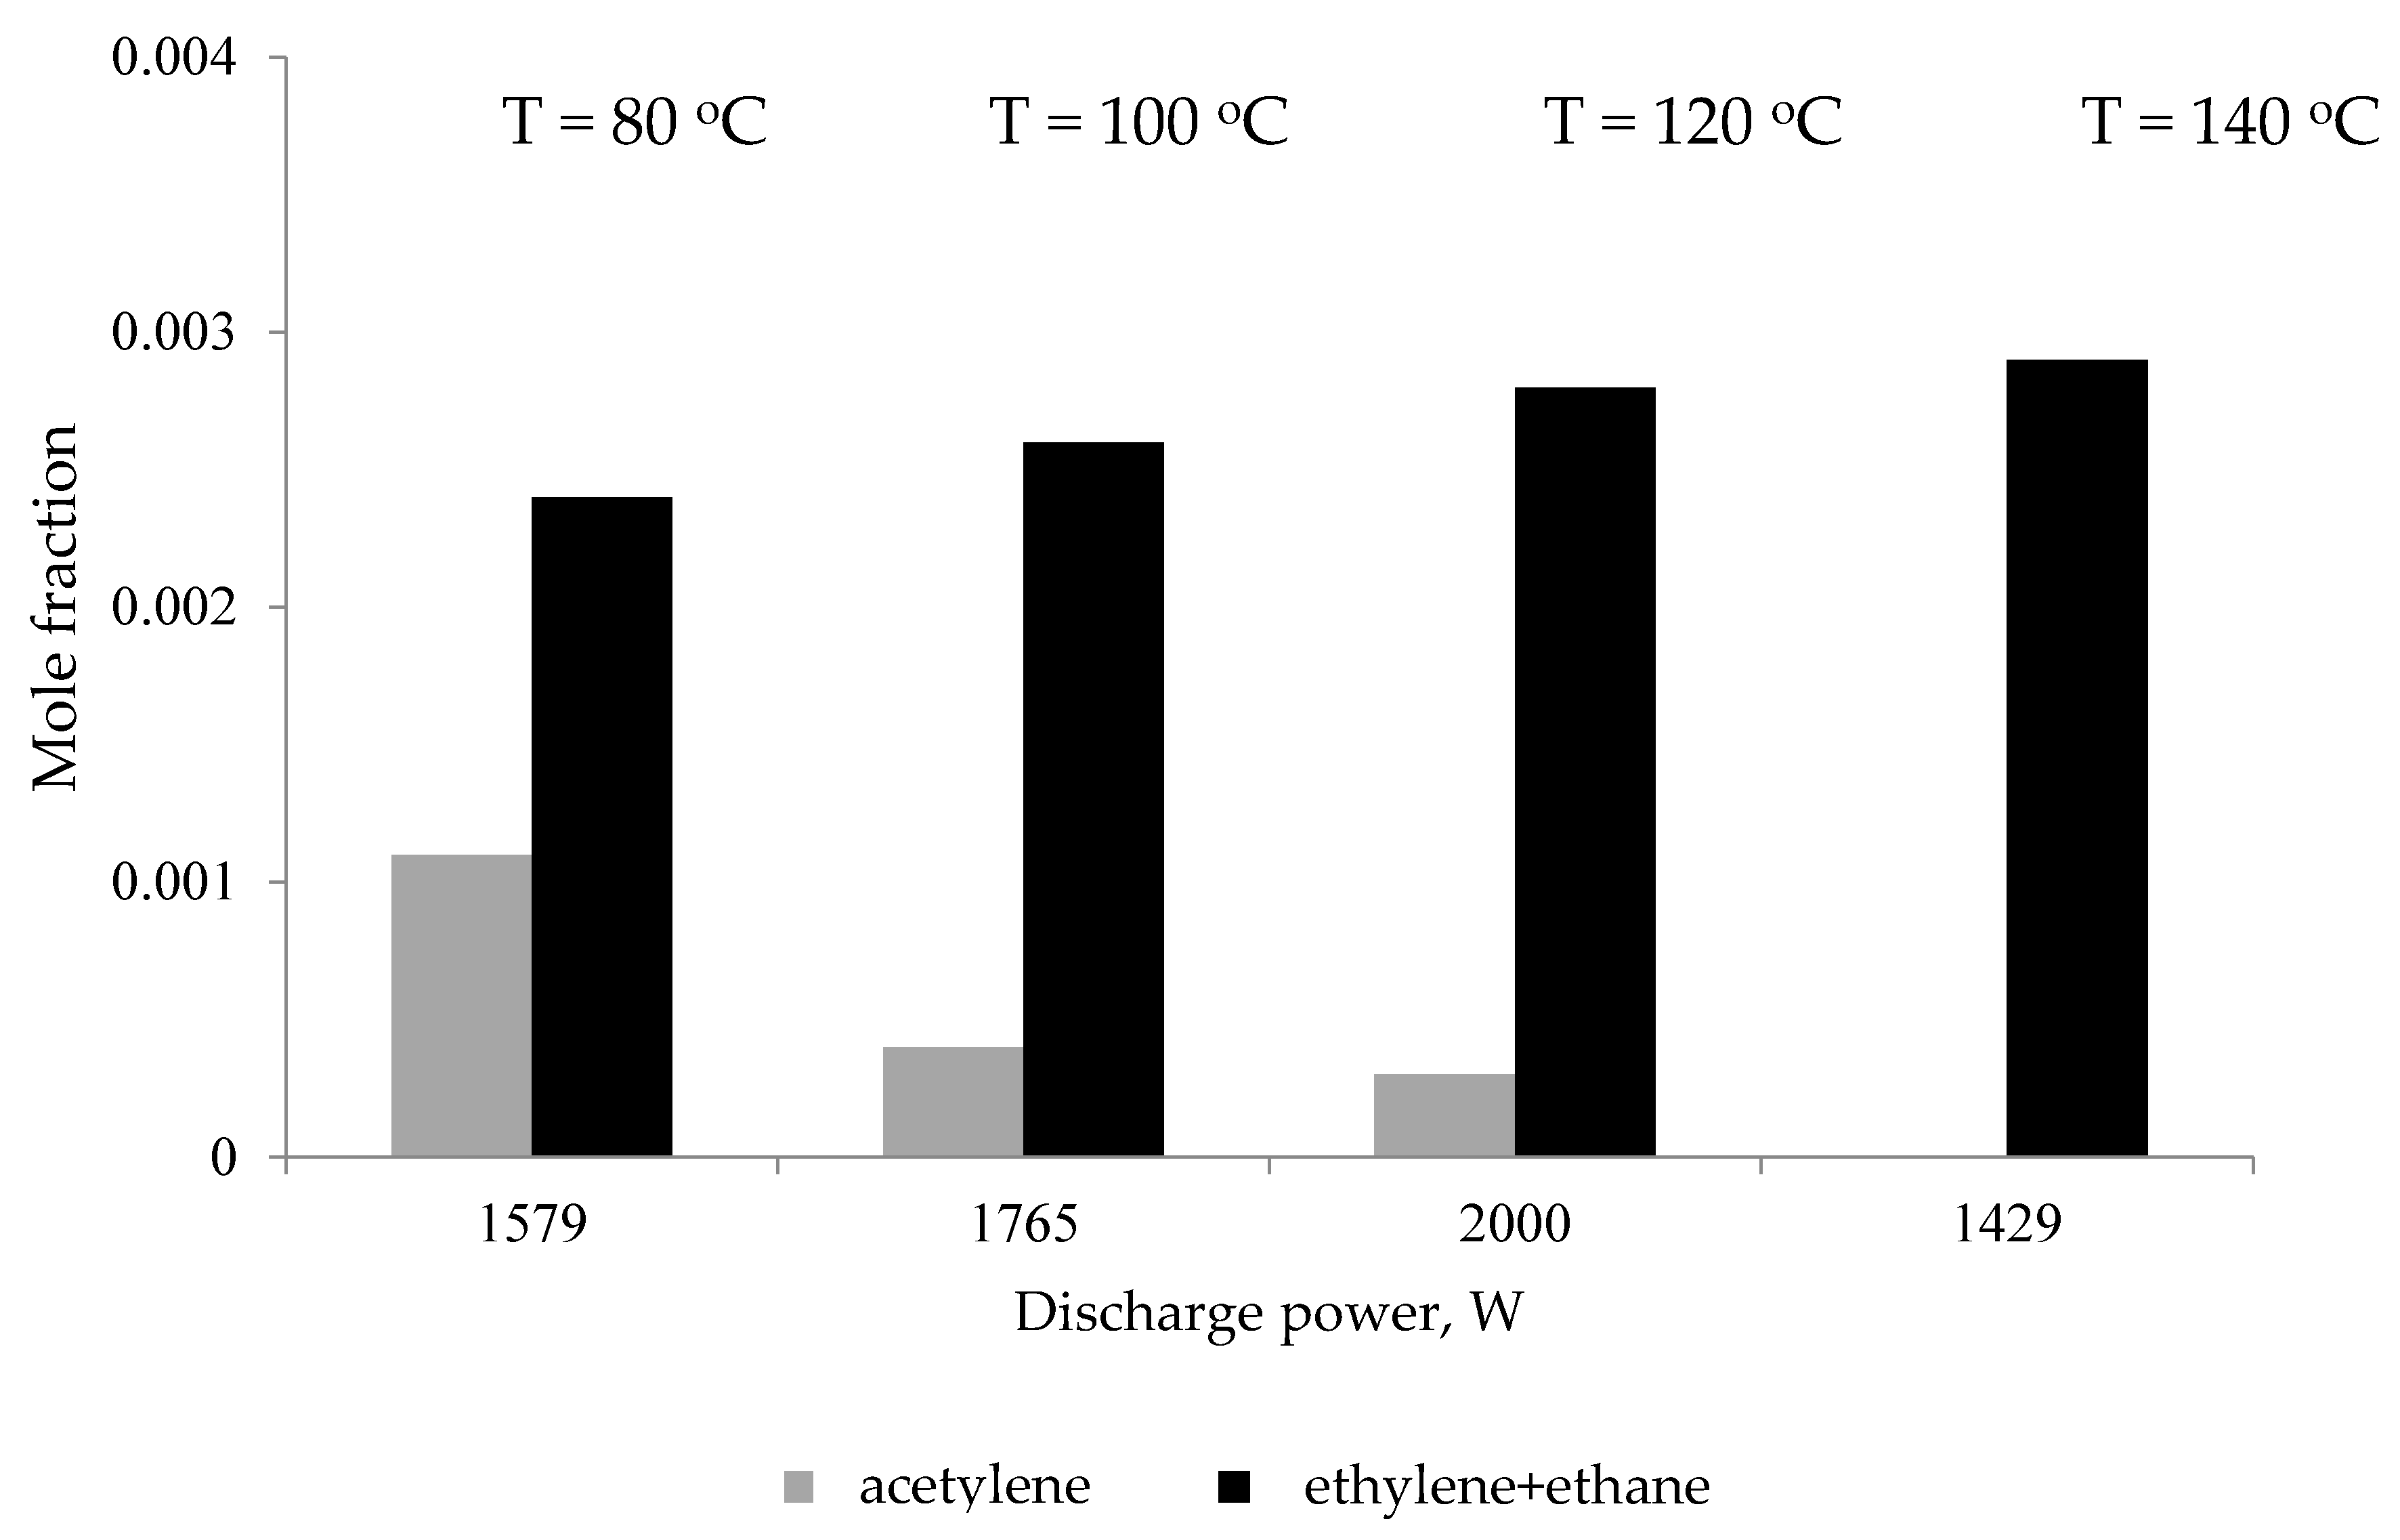
Changes in the concentration of C2 hydrocarbons were observed depending on the discharge power and initial hydrogen concentration. The highest ethylene and ethane concentrations (about 0.3% mol) were obtained using 36% hydrogen and 3000 ppm of toluene. In this system, the relationship between the different C2 hydrocarbon components is also interesting. With increasing discharge power, the amount of ethylene and ethane increases, and the concentration of acetylene decreases. The temperature of the catalytic bed also depends on the discharge power. The measurement at 140 °C was carried out immediately after the measurement at the highest discharge power. The low discharge power and higher catalyst temperature resulted in the presence of ethylene and ethane in the reaction products instead of acetylene (Figure 6). At high discharge powers, acetylene is hydrogenated to ethylene and ethane on the Ni3Al catalyst.
3. Experimental Procedure
The research was conducted in a synthetic pyrolysis gas containing CO, CO2, H2, and N2. A constant initial concentration of CO and CO2 of 10 and 12.5% and two initial hydrogen concentrations of 32 and 36% (series A, B, respectively) were used. The rest of the gas was nitrogen. Gases of 99.95–99.99% purity were used in this study, and Bronkhorst mass flow controllers regulated their flow rates. The mixed gases were saturated with toluene, which was used as a model substance for tars [5,11,12,13,17,18] and its starting concentration was 2000, 3000, and 4500 ppm. After setting the discharge power, it was left to stabilize the process conditions for 10 min, and then the gas was collected for chromatographic analysis. Three gas analyses were performed under each condition. The entire measurement for a given value of the discharge power lasted approx. 30 min.
The total gas flow rate was 1000 Nl/h. The reactor described in [4] was used for this study. The discharge power was in the range of 1500–2700 W. The gas upstream and downstream of the reactor was analyzed using gas chromatography. The gas was analyzed with two chromatographs: Agilent 6890 N with FID and TCD detectors (Agilent Technologies, CA, USA) and the Schincarbon (Restek, PA, USA) column for permanent gases, C2, C3 hydrocarbons, and Chrompack 9001 with FID detector and HP5 column for toluene determination. The decomposition of toluene in a plasma-catalytic system with the Ni3Al honeycomb catalyst (Figure 1) and the effect of discharge power, hydrogen concentration, and initial concentration of toluene on its conversion were investigated. The same catalyst bed was used in all experiments. The SEM images were collected at the end of the studies.
Preparation of the Catalyst
The Ni3Al intermetallic catalyst consisted of (expressed in atomic %) 83.7% Ni, 16% Al, 0.2% Zr, 0.1% B. Intermetallic alloys, such as Ni3Al, are advanced materials with a wide area of potential applications. The advantages of Ni3Al alloys are high strength at elevated temperature, relatively low density, and high corrosion resistance, which predisposed those materials to many high-temperature applications [19,20]. For several years, Ni3Al alloys have also been used as catalysts, mostly in the decomposition of organic compounds [21,22,23]
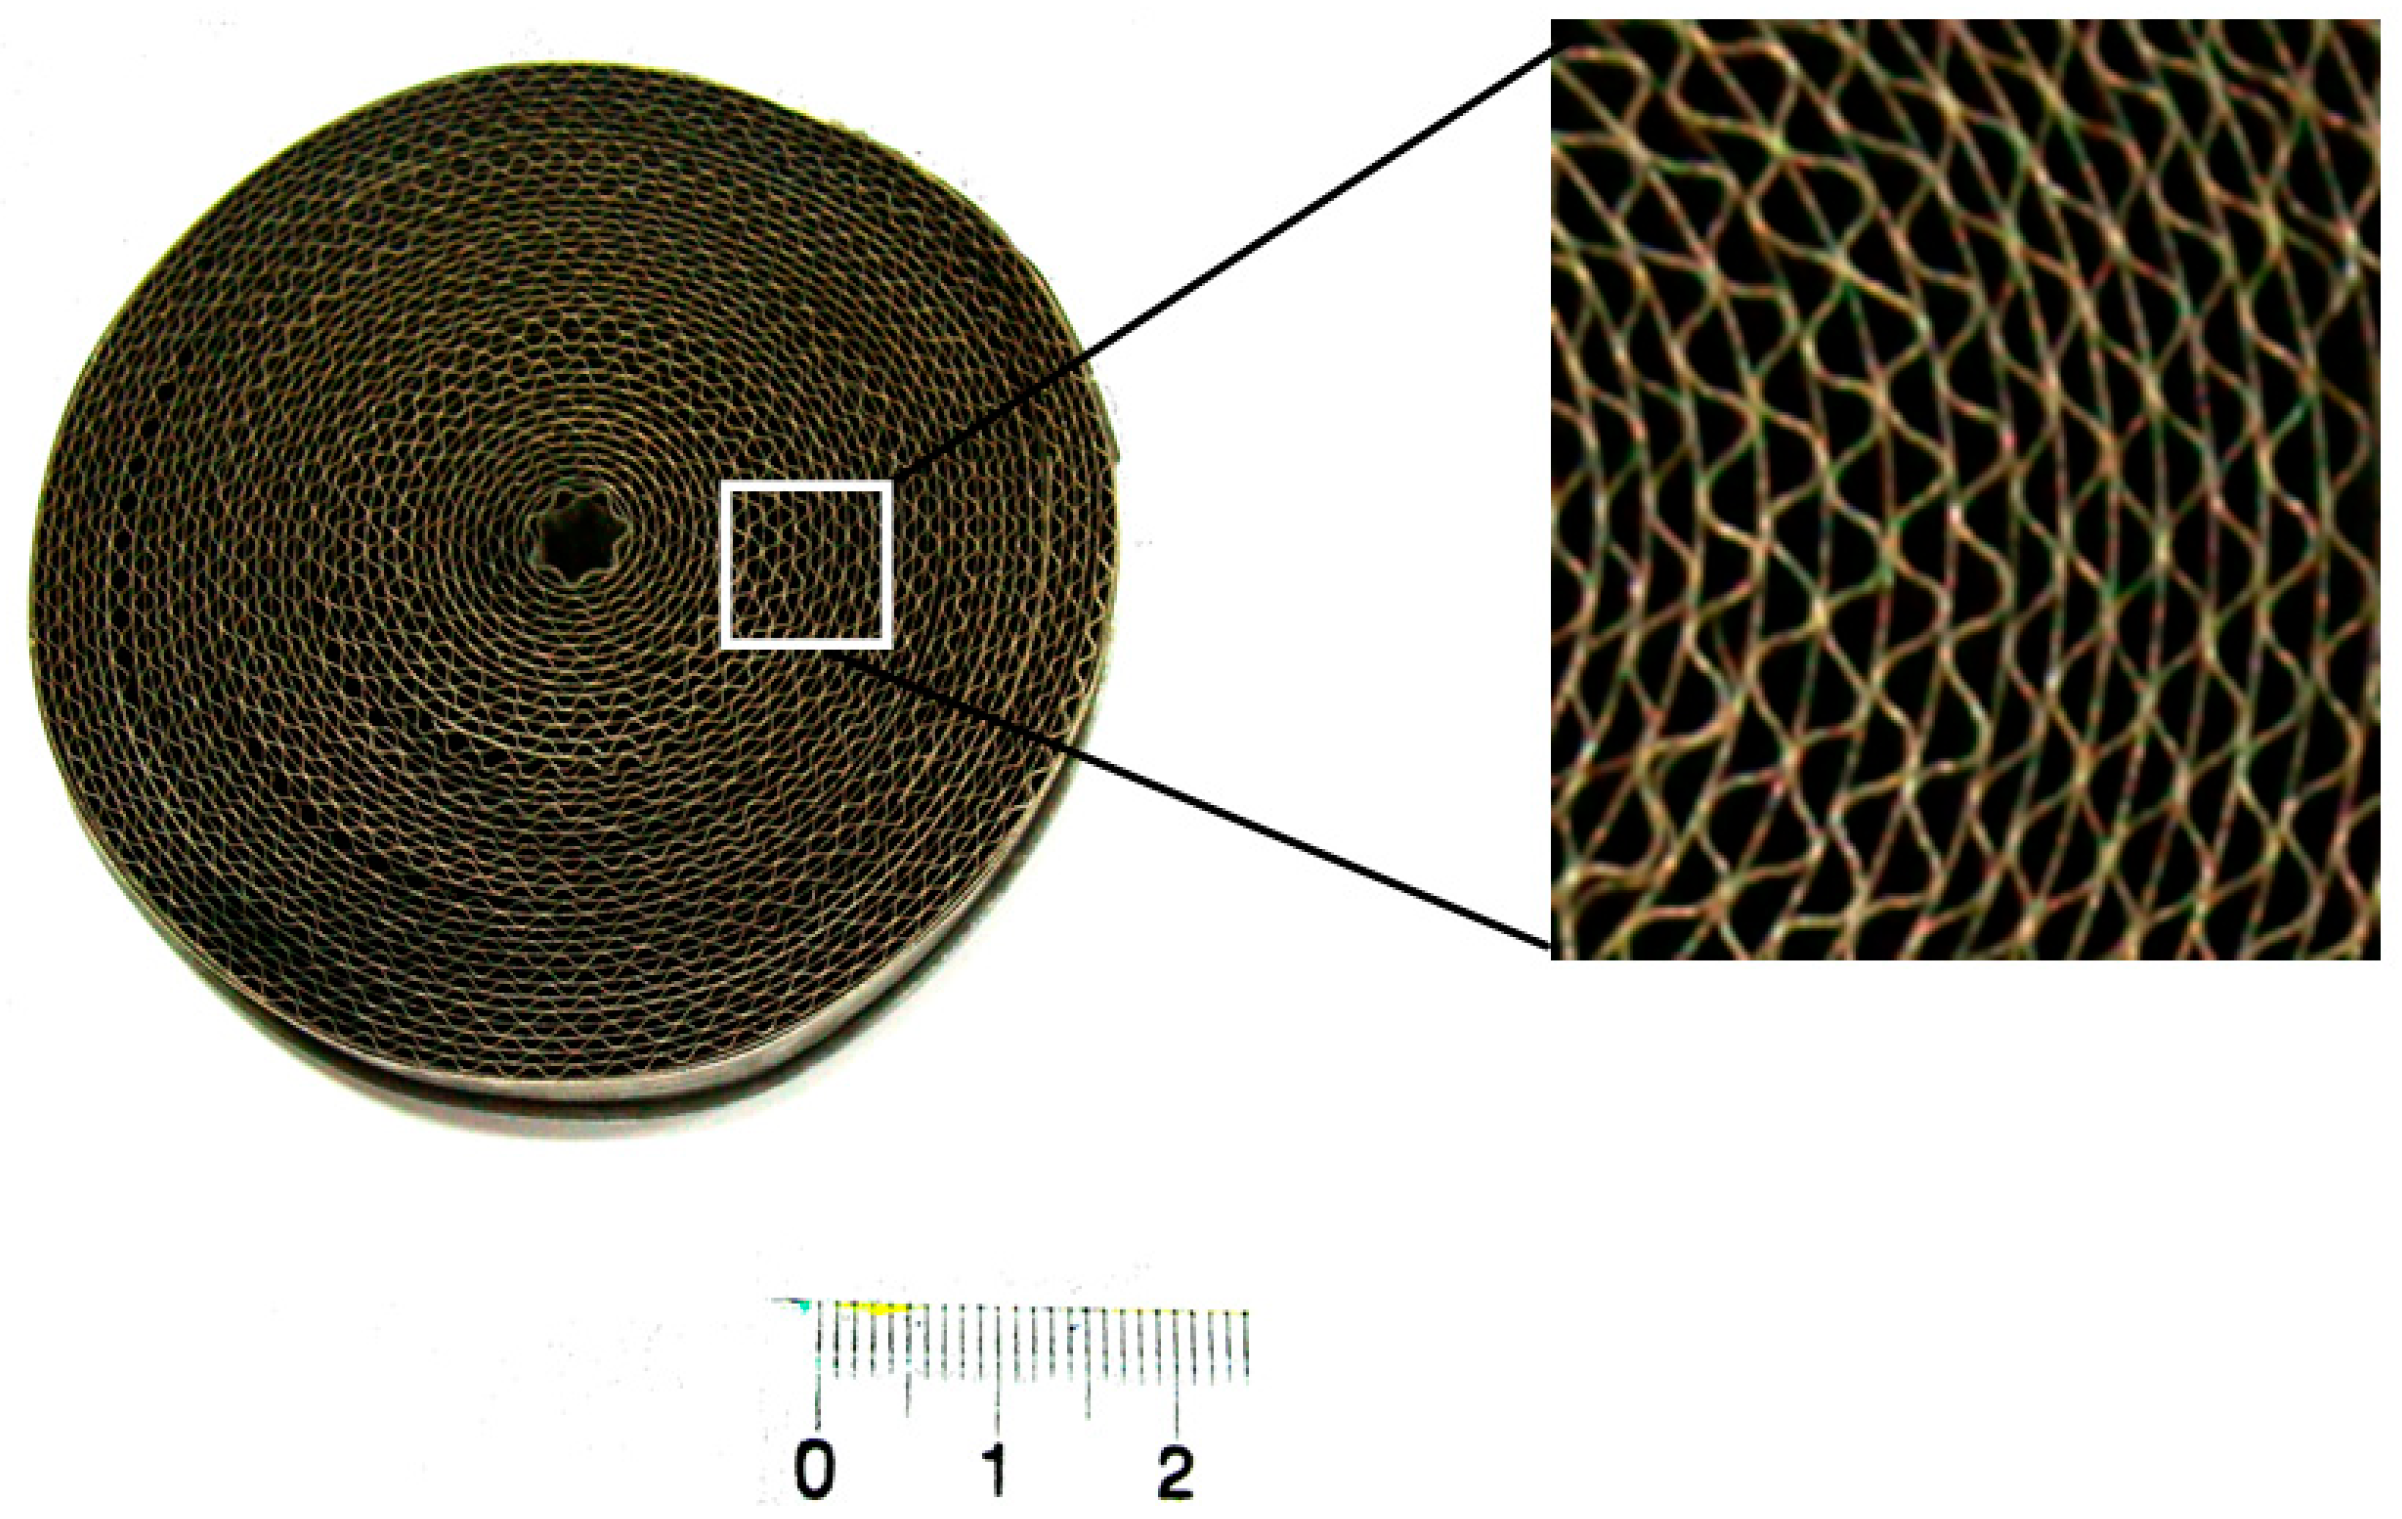
The catalyst was made from approximately 50 μm thick Ni3Al foils obtained by sequential thermo-plastic treatment, including cold-rolled to 90% reduction and annealed temperatures up to 1200 °C for 1.5 h under argon atmosphere. One of the Ni3Al foils was folded with a wave’s height of 0.8 mm. After that, two strips, corrugated and straight, were rolled together to form a honeycomb structure with 12 mm height and 40 mm diameter (Figure 7). More details of the procedures are given in the papers [24,25]. The surface investigation was performed using a Quanta 3D FEG scanning electron microscope coupled with an energy dispersive X-ray spectrometer (EDS).
4. Conclusions
The catalyst changed on the edges due to soot formation and electrode material deposition. This change did not influence the toluene decomposition. On the side surface of the catalyst, no carbon deposits were observed. In the combined plasma-catalytic system using the Ni3Al honeycomb catalyst, toluene can be decomposed with high conversion rates, higher than those obtained in the homogeneous system (without the catalyst). Using a discharge power above 2200 W, toluene conversion reached similar values (above 85%), regardless of its initial concentration. Under these conditions, the initial hydrogen concentration influenced the process. In the combined plasma-catalytic system with Ni3Al as the catalyst, it was found that with the increase in the discharge power, the amount of acetylene decreases, and the amount of ethylene and ethane increases.
Author Contributions
Conceptualization, M.M., K.K.; methodology, J.W.-W.; formal analysis, B.U.; investigation, J.W.-W., M.P., P.J.; resources, P.J.; writing—original draft M.M., M.P. writing—review and editing. M.M.; funding acquisition, K.K. All authors have read and agreed to the published version of the manuscript.
Funding
This research was funded by National Center for Research and Development agreement no. PBS2/A1/10/2013.
Conflicts of Interest
The authors declare no conflict of interest.
References
- Elliott, D.C. Catalytic hydrothermal gasification of biomass. Biofuels Bioprod. Biorefining 2008, 2, 254–264. [Google Scholar] [CrossRef]
- Chan, F.L.; Tanksale, A. Review of recent develompents In Ni-based catalysts for biomass gasification. Renew. Sustain. Energy Rev. 2014, 38, 428–438. [Google Scholar] [CrossRef]
- Pikoń, K.; Czekalska, Z.; Stelmach, S.; Ścierski, W. Zastosowanie metod plazmowych do oczyszczania gazu procesowego ze zgazowania biomasy. Arch. Gospod. Odpadami Ochr. Sr. 2010, 12, 4. [Google Scholar]
- Młotek, M.; Ulejczyk, B.; Woroszył, J.; Krawczyk, K. Decomposition of Toluene in Coupled Plasma-Catalytic System. Ind. Eng. Chem. Res. 2020, 59, 4239–4244. [Google Scholar] [CrossRef]
- Shen, Y.; Yoshikawa, K. Recent progress in catalytic tar elimination during biomass gasification or pyrolysis—A review. Renew. Sust. Energy Rev. 2013, 21, 371–392. [Google Scholar] [CrossRef]
- Coll, R.; Salvado, J.; Farriol, X.; Montane, D. Steam reforming model compounds of biomass gasification tars: Conversion of didderent operating conditions and tendency towards coke formation. Fuel Process. Technol. 2001, 74, 19–31. [Google Scholar] [CrossRef]
- Di Carlo, D.; Borello, D.; Sisinni, M.; Savuto, E.; Venturini, P.; Bocci, E.; Kuramoto, K. Reforming of tar contained in a raw fuel gas from biomass gasification using nickel-mayenite catalyst. Int. J. Hydrogen Energy 2015, 40, 9088–9095. [Google Scholar] [CrossRef]
- Oh, G.; Park, S.; Won Seo, M.; Ku Kim, Y.; Won Ra, H.; Lee, J.; Jun Yoon, S. Ni/Ru–Mn/Al2O3 catalysts for steam reforming of toluene as model biomass tar. Renew. Energy 2016, 86, 841–847. [Google Scholar] [CrossRef]
- Młotek, M.; Ulejczyk, B.; Woroszył, J.; Walerczak, I.; Krawczyk, K. Purification of the gas after pyrolysis in coupled plasma-catalytic system. Pol. J. Chem. Technol. 2017, 19, 94–98. [Google Scholar] [CrossRef] [Green Version]
- Lin, M.S.; Chun, Y.N. Light tar decomposition of product pyro lysis gas from sewage sludge in a gliding arc plasma reformer. Environ. Eng. Res. 2012, 17, 89–94. [Google Scholar]
- Cimerman, R.; Cíbiková, M.; Satrapinskyy, L.; Hensel, K. The effect of packing material properties on tars removal by plasma catalysis. Catalysts 2020, 10, 1476. [Google Scholar] [CrossRef]
- Whitehead, J.C. Plasma-catalysis: The known knowns, the known unknowns and the unknown unknowns. J. Phys. D Appl. Phys. 2016, 49, 243001. [Google Scholar] [CrossRef]
- Bogaerts, A.; Zhang, Q.Z.; Zhang, Y.-R.; Van, K.; Wang, W. Burning questions of plasma catalysis: Answers by modeling. Catal. Today 2019, 337, 3–14. [Google Scholar] [CrossRef]
- Neyts, E.C.; Bogaerts, A. Understanding plasma catalysis through modelling and simulation—A review. J. Phys. D Appl. Phys. 2014, 47, 224010. [Google Scholar] [CrossRef]
- Vaiano, V.; Iervolino, G. Non-Thermal Plasma-Assisted Catalytic Reactions for Environmental Protection. Catalysts 2021, 11, 509. [Google Scholar] [CrossRef]
- Mlotek, M.; Woroszył, J.; Ulejczyk, B.; Krawczyk, K. Coupled plasma-catalytic system with Rang 19pr catalyst for conversion of tar. Sci. Rep. 2019, 9, 13562. [Google Scholar] [CrossRef] [Green Version]
- Lu, P.; Qian, X.; Huang, Q.; Chi, Y.; Yan, J. Catalytic cracking of toluene as a tar model compound Rusing sewage- sludge- derived char. Energy Fuel 2016, 30, 8327–8334. [Google Scholar] [CrossRef]
- Koike, M.; Hisada, Y.; Eang, L.; Li, D.; Watanabe, H.; Nakagawa, Y.K. Tomishige, High catayltic activity of Co- Fe/ α- Al2O3 in the steam reforming of toluene in presence of hydrogen. Appl. Catal. B-Environ. 2013, 140–141, 652–662. [Google Scholar] [CrossRef]
- Jozwik, P.; Polkowski, W.; Bojar, Z. Applications of Ni3Al based intermetallic alloys—Current stage and potential perceptivities. Materials 2015, 8, 2537–2568. [Google Scholar] [CrossRef]
- Liu, C.T.; Pope, D.P. Ni3Al and its alloys. In Structural Applications of Intermetallic Compounds; Westbrook, J.H., Fleischer, R.L., Eds.; John Wiley & Son, Ltd.: Hoboken, NJ, USA, 2000; pp. 15–32. [Google Scholar]
- Chun, D.H.; Xu, Y.; Demura, M.; Kishida, D.M.; Wee, T. Hirano, Spontaneous catalytic activation of Ni3Al thin foils in methanol decomposition. J. Catal. 2006, 243, 99–107. [Google Scholar] [CrossRef]
- Arkatova, L.A. The deposition of coke during carbon dioxide reforming of methane over intermetallides. Catal. Today 2010, 157, 170–176. [Google Scholar] [CrossRef]
- Jóźwik, P.; Salerno, M.; Stępniowski, W.J.; Bojar, Z.; Krawczyk, K. Decomposition of cyclohexane on Ni3Al thin foil intermetallic catalyst. Materials 2014, 7, 7039–7047. [Google Scholar] [CrossRef] [Green Version]
- Jozwik, P.; Bojar, Z. Influence of heat treatment on the structure and mechanical properties of Ni3Al—Based alloys. Arch. Metall. Mater. 2010, 55, 271–279. [Google Scholar]
- Jóźwik, P.; Polkowski, W.; Schindler, I.; Rusz, S.; Kawulok, P.; Krawczyk, C.Z. Bojar Influence of temperature and deformation speed on microstructure of Ni3Al-based intermetallic alloy. Hut. Wiadomości Hut. 2014, 81, 549–551. [Google Scholar]
Figure 1.
SEM images of the Ni3Al catalyst after toluene processing. (a) catalyst’s edge structure (magnification 50×); (b) new deposits on catalyst’s edge arisen during toluene decomposition (magnification 1000×); (c) new areas on catalyst’s edge (magnification 5000×).
Figure 1.
SEM images of the Ni3Al catalyst after toluene processing. (a) catalyst’s edge structure (magnification 50×); (b) new deposits on catalyst’s edge arisen during toluene decomposition (magnification 1000×); (c) new areas on catalyst’s edge (magnification 5000×).

Figure 2.
Chemical composition distribution on the front surface of the Ni3Al catalyst.

Figure 3.
SEM images of the Ni3Al catalyst surface after toluene decomposition. (a) side surface of the catalyst (magnification 5000×); (b) new areas deposited on catalyst’s surface—(magnification 50,000×).
Figure 3.
SEM images of the Ni3Al catalyst surface after toluene decomposition. (a) side surface of the catalyst (magnification 5000×); (b) new areas deposited on catalyst’s surface—(magnification 50,000×).

Figure 4.
Dependence of toluene conversion on its initial concentration and discharge power with the Ni3Al catalyst, initial hydrogen concentration: 36%. Initial toluene concentration of 2000 (B1), 3000 (B2) and 4500 (B3).
Figure 4.
Dependence of toluene conversion on its initial concentration and discharge power with the Ni3Al catalyst, initial hydrogen concentration: 36%. Initial toluene concentration of 2000 (B1), 3000 (B2) and 4500 (B3).

Figure 5.
Dependence of toluene conversion on initial hydrogen concentration and discharge power. The Ni3Al catalyst, initial concentration of toluene: 4500 ppm. Hydrogen concentration: A3—32%, B3—36%.
Figure 5.
Dependence of toluene conversion on initial hydrogen concentration and discharge power. The Ni3Al catalyst, initial concentration of toluene: 4500 ppm. Hydrogen concentration: A3—32%, B3—36%.

Figure 6.
Dependence of C2 hydrocarbon concentration on discharge power and temperature at the initial hydrogen concentration of 36%, initial toluene concentration of 2000 ppm.
Figure 6.
Dependence of C2 hydrocarbon concentration on discharge power and temperature at the initial hydrogen concentration of 36%, initial toluene concentration of 2000 ppm.

Figure 7.
The Ni3Al catalyst of a honeycomb structure before the toluene decomposition process.


Table 1.
Elemental composition of the edge surface of the Ni3Al catalyst.
| Area | Element [% wt.] | ||||
|---|---|---|---|---|---|
| Ni | Al. | Si | O | C | |
| 1 | 20.49 | 6.20 | 20.95 | 32.74 | 19.63 |
| 2 | 79.55 | 13.02 | 0.63 | 4.28 | 2.52 |
| 3 | 31.42 | 11.40 | 10.18 | 28.21 | 18.78 |
| 4 | 67.78 | 11.00 | 2.38 | 17.67 | 1.17 |
Table 2.
Elemental composition of the side surface of the Ni3Al catalyst.
| Area | Element, %wt. | ||||
|---|---|---|---|---|---|
| Ni | Al | Si | O | C | |
| 1 | 74.01 | 12.38 | 20.95 | 9.33 | 3.15 |
| 2 | 83.94 | 9.97 | 0.55 | 3.30 | 2.24 |
Publisher’s Note: MDPI stays neutral with regard to jurisdictional claims in published maps and institutional affiliations. |
© 2021 by the authors. Licensee MDPI, Basel, Switzerland. This article is an open access article distributed under the terms and conditions of the Creative Commons Attribution (CC BY) license (https://creativecommons.org/licenses/by/4.0/).
Share and Cite
MDPI and ACS Style
Woroszył-Wojno, J.; Młotek, M.; Perron, M.; Jóźwik, P.; Ulejczyk, B.; Krawczyk, K. Decomposition of Tars on a Nickel Honeycomb Catalyst. Catalysts 2021, 11, 860. https://0-doi-org.brum.beds.ac.uk/10.3390/catal11070860
AMA Style
Woroszył-Wojno J, Młotek M, Perron M, Jóźwik P, Ulejczyk B, Krawczyk K. Decomposition of Tars on a Nickel Honeycomb Catalyst. Catalysts. 2021; 11(7):860. https://0-doi-org.brum.beds.ac.uk/10.3390/catal11070860
Chicago/Turabian StyleWoroszył-Wojno, Joanna, Michał Młotek, Michalina Perron, Paweł Jóźwik, Bogdan Ulejczyk, and Krzysztof Krawczyk. 2021. "Decomposition of Tars on a Nickel Honeycomb Catalyst" Catalysts 11, no. 7: 860. https://0-doi-org.brum.beds.ac.uk/10.3390/catal11070860
Note that from the first issue of 2016, this journal uses article numbers instead of page numbers. See further details here.