
Controlled Synthesis of CuS and Cu9S5 and Their Application in the Photocatalytic Mineralization of Tetracycline


1
Material Science Innovation and Modelling (MaSIM) Research Focus Area, Faculty of Natural and Agricultural Sciences, Mafikeng Campus, North-West University, Private Bag X2046, Mmabatho 2735, South Africa
2
Department of Chemistry, School of Physical and Chemical Sciences, Faculty of Natural and Agricultural Sciences, Mafikeng Campus, North-West University, Private Bag X2046, Mmabatho 2735, South Africa
3
Department of Science and Technology Education, University of Johannesburg, Johannesburg 2092, South Africa
*
Author to whom correspondence should be addressed.
Catalysts 2021, 11(8), 899; https://0-doi-org.brum.beds.ac.uk/10.3390/catal11080899
Submission received: 5 July 2021
/
Revised: 20 July 2021
/
Accepted: 22 July 2021
/
Published: 25 July 2021
(This article belongs to the Special Issue Application of Photocatalysts in Environmental Chemistry)
Abstract
:Pure-phase Cu2−xS (x = 1, 0.2) nanoparticles have been synthesized by the thermal decomposition of copper(II) dithiocarbamate as a single-source precursor in oleylamine as a capping agent. The compositions of the Cu2−xS nanocrystals varied from CuS (covellite) through the mixture of phases (CuS and Cu7.2S4) to Cu9S5 (digenite) by simply varying the temperature of synthesis. The crystallinity and morphology of the copper sulfides were studied using X-ray diffraction (XRD), scanning electron microscopy (SEM), and transmission electron microscopy (TEM), which showed pure phases at low (120 °C) and high (220 °C) temperatures and a mixture of phases at intermediate temperatures (150 and 180 °C). Covellite was of a spherical morphology, while digenite was rod shaped. The optical properties of these nanocrystals were characterized by UV−vis–NIR and photoluminescence spectroscopies. Both samples had very similar absorption spectra but distinguishable fluorescence properties and exhibited a blue shift in their band gap energies compared to bulk Cu2−xS. The pure phases were used as catalysts for the photocatalytic degradation of tetracycline (TC) under visible-light irradiation. The results demonstrated that the photocatalytic activity of the digenite phase exhibited higher catalytic degradation of 98.5% compared to the covellite phase, which showed 88% degradation within the 120 min reaction time using 80 mg of the catalysts. The higher degradation efficiency achieved with the digenite phase was attributed to its higher absorption of the visible light compared to covellite.
1. Introduction
Copper sulfide is among the interesting metal sulfides that have attracted significant research attention due to its interesting optical and structural properties. It exists in different stoichiometry and crystalline phases, and it is a typical p-type semiconductor. Its bandgap energy ranges from 1.2 to 2.0 eV and is greatly dependent on both stoichiometry and phases. Its nontoxicity, unique structural properties, and fascinating functional properties are some of its advantages over other related semiconductors such as CdS [1,2]. Its stoichiometry varies from Cu-rich to Cu-deficient phases [3,4], as well as nonstoichiometric phases. These include digenite (Cu1.8S) [5], roxbyite (Cu7S4) [6], djurleite (Cu1.97S) [7,8], anilite (Cu1.75S) [9], spionkopite (Cu1.4S) [10], yarrowite (Cu1.12S) [10], and geerite (Cu1.6S) [10]. They all exhibit strong optical absorption in the near-infrared region [11]. These properties make them promising materials in various areas of application such as photocatalysis, solar cells, lithium batteries, and sensing materials. Accurate stoichiometry, which is dependent on the preparative conditions used, has an effect on the properties of copper sulfide [12].
The synthesis of copper sulfide has been achieved using different approaches such as microwave irradiation [13,14], hydrothermal [15,16], sonochemical [17,18], hot injection [19], solvothermal [20], and thermolysis of a single-source precursor [3]. The use of single-source precursor compounds is of great interest because they generate mostly more stable nanoparticles, are cheaper, and eliminate side reactions that may result in the formation of unwanted side products. The use of copper dithiocarbamate complexes as single-source precursors to prepare copper sulfide nanoparticles has proven to be an efficient route and gives rise to good-quality copper sulfides [3,21]. In copper dithiocarbamate complexes, the crystallinity phase, size, shape, and physical properties of the copper sulfide are determined by the type of capping agent used and temperature. Capping agents could be used to stabilize the surface of copper sulfide in order to prevent agglomeration and obtaining monodispersed nanoparticles [22]. The varying morphology of copper sulfide such as nanorods [13,23], nanowires [7], flowerlike [14,24], nanotubes [25], nanoplates [26,27], spherical [3,6], nanodisks [28], nanosheets [29], and hollow spheres [30] also depend largely on the type of capping agent used, among other factors.
Antibiotics are among the most important drugs used for the prevention and treatment of microbial infections [31], and tetracycline (TC) is one of the common antibiotics used to treat animal and human diseases. It is made up of multiple ionizable functional groups such as hydroxyl, phenolic, and dimethylamino groups. In addition, TC is a hydrophilic antibiotic; therefore, is attracted to water molecules and easily goes into dissolution [32]. However, the unreasonable use of TC and its release into the environment results in the contamination of water courses [33]. The severity of health risks posed by TC has been well studied [31]. For example, wastewater from pharmaceutical, aquaculture, and hospital activities contains decomposed chemicals and a high concentration of TC, posing a serious risk to humans and the environment [34]. A series of health issues related to the consumption of high amounts of TC has been widely reported [35]. Excessive TC in the human body could cause nausea, vomiting, diarrhea, loss of appetite, headache, mouth sores, sore throat, dizziness, and rectal discomfort [36]. The abuse of TC has been reported to also increase the chances of disease transmission to humans through water, soil, or the consumption of affected food products, animals, or livestock [37]. TC also carries the risk of bone growth reduction and permanent discoloration of teeth when consumed by pregnant women or children under the age of nine years [38].
The existing advanced methods for TC removal or mineralization include adsorption [39,40,41], coagulation/flocculation [42], and degradation using a catalyst [43,44]. Adsorption is commonly used in developing countries because of its low cost and ease of material preparation [45]. However, the ability to degrade TC into harmless and useful minerals using the photocatalysis route provides an additional benefit and high economic feasibility over the adsorption route in terms of efficiency and no secondary waste generation. Hence, the preparation of semiconductor materials as possible photocatalysts for the effective removal of pollutants from water continues to generate research interest.
In this paper, we report a solvothermal method for the controlled synthesis of covellite (CuS) and digenite (Cu9S5) nanostructures by using copper dithiocarbamate as a single-source precursor, temperature variation, and oleylamine as a stabilizing agent. The as-prepared nanopowders were also successfully used as a photocatalyst for the photodegradation of tetracycline in aqueous solution.
2. Results and Discussion
2.1. Structural Studies
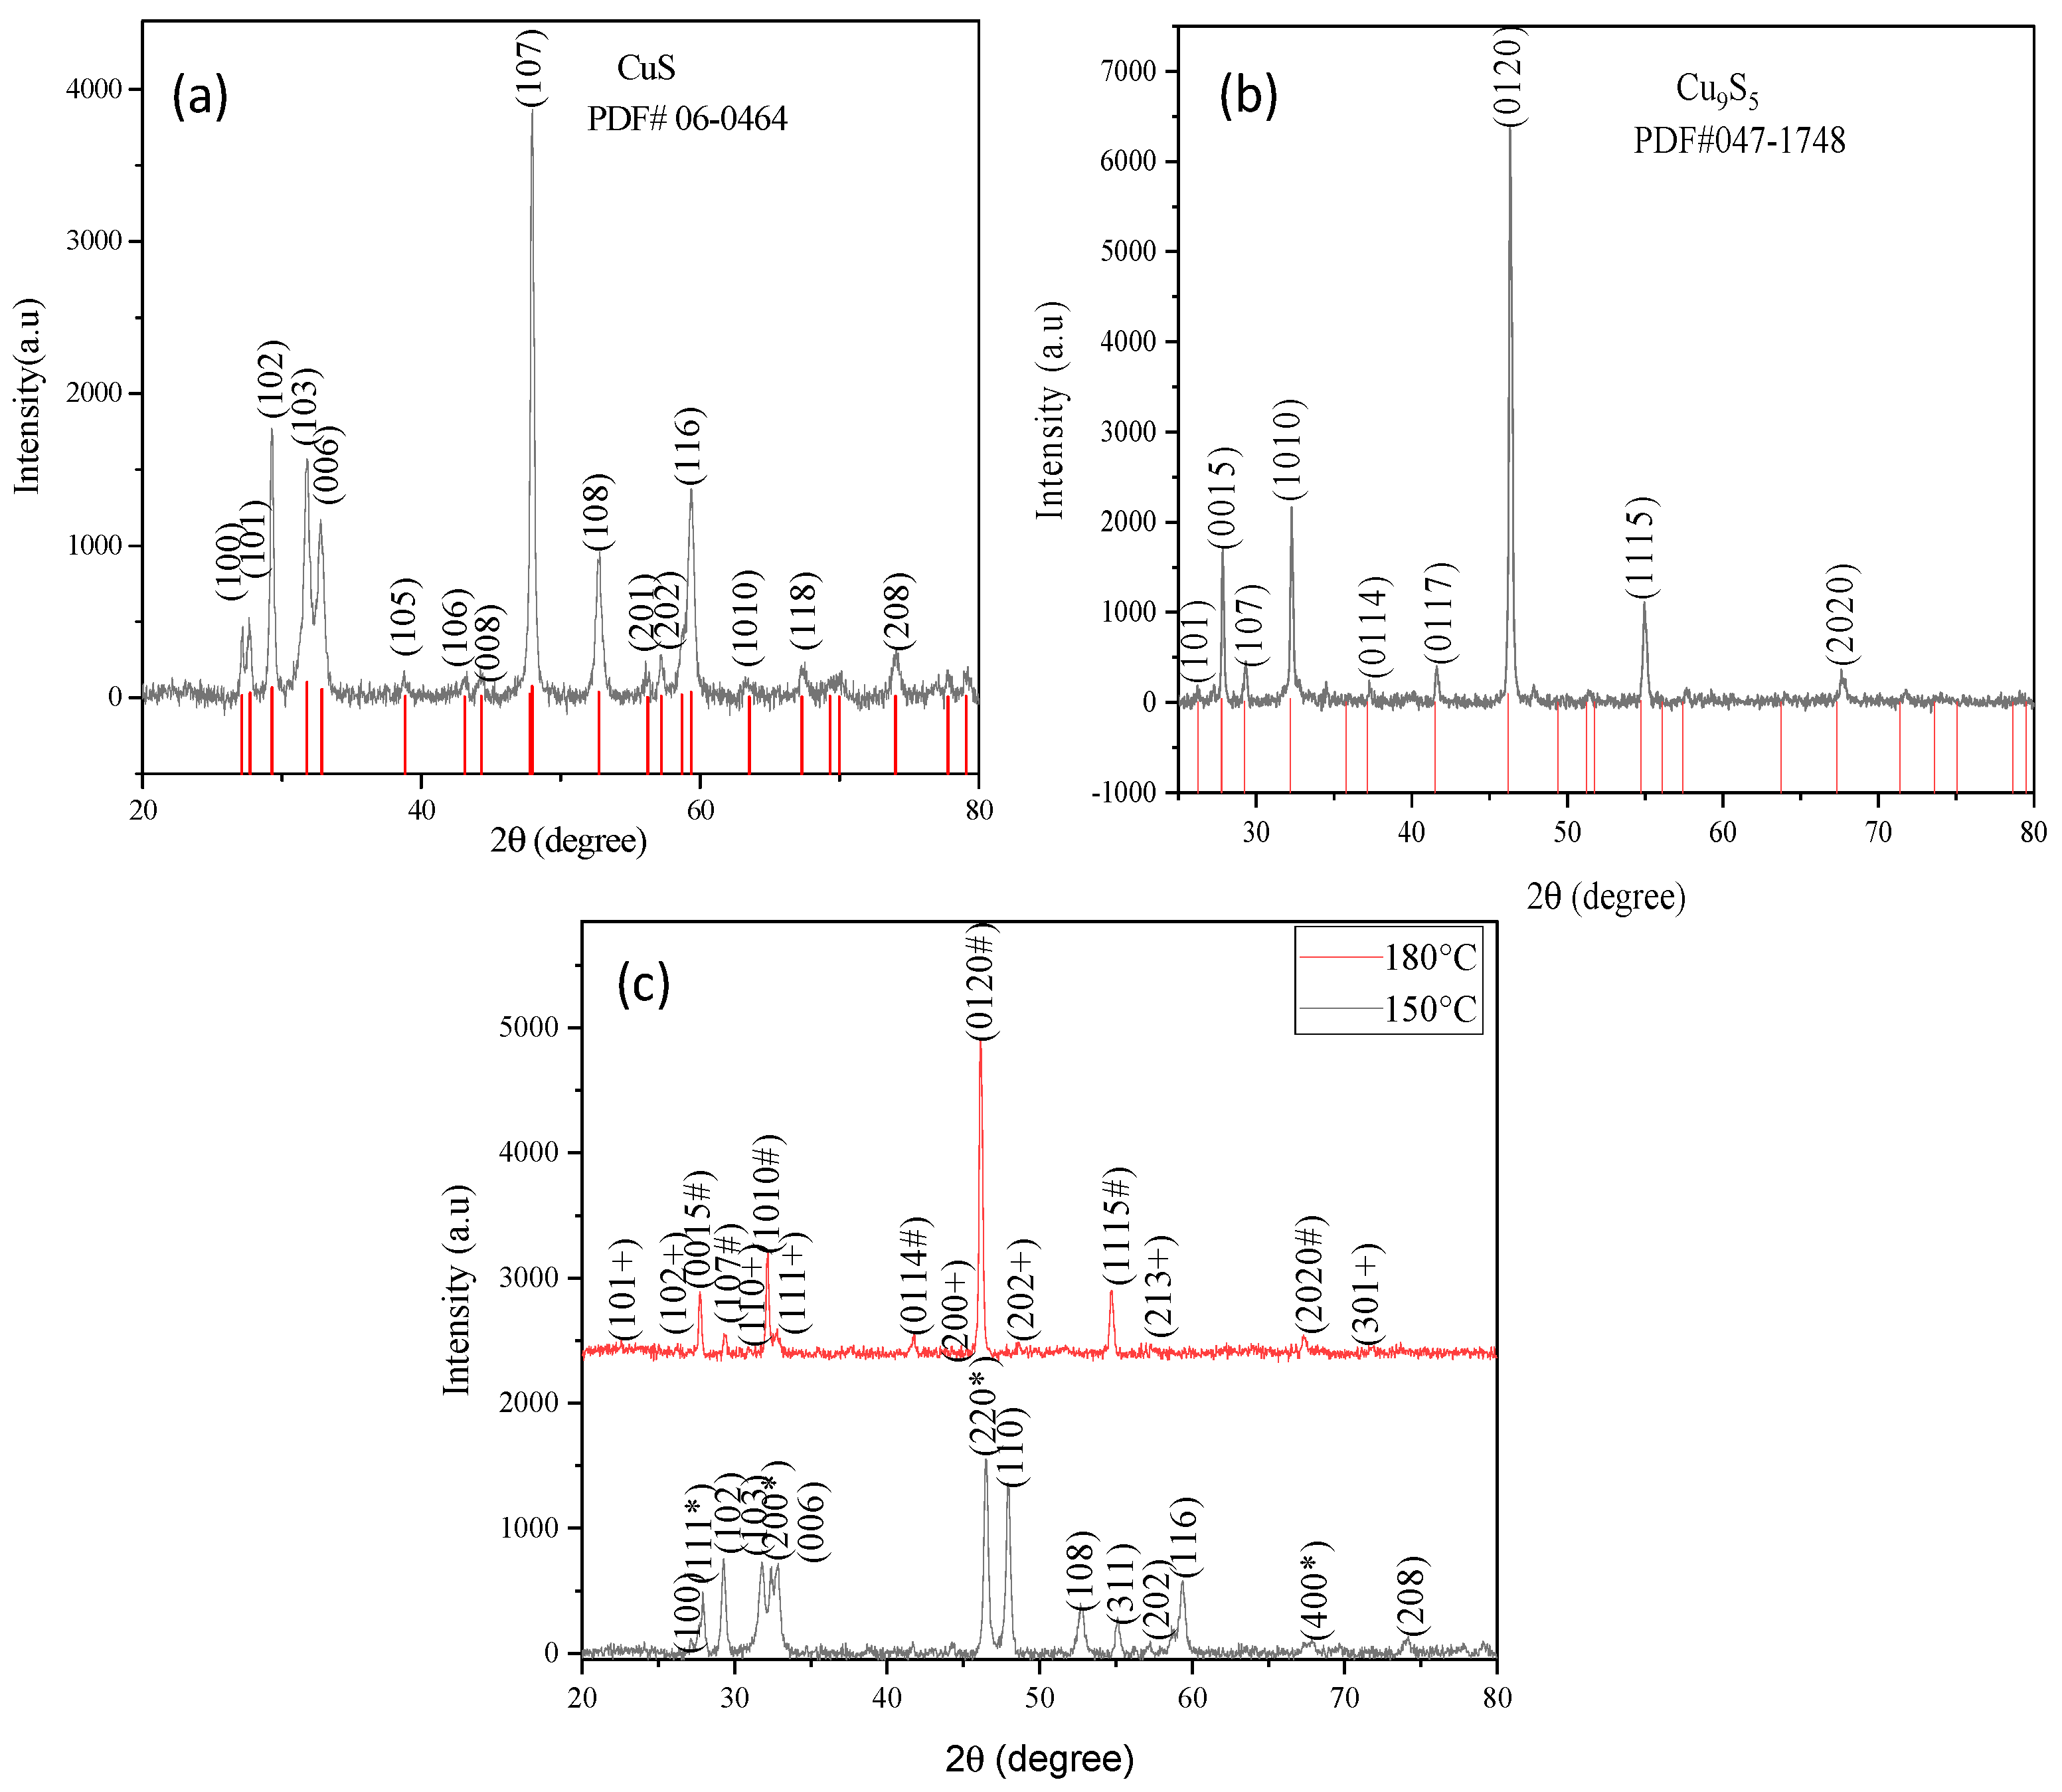
The crystal structure and confirmation of the phase purity of copper sulfide at different temperatures were carried out by XRD analysis and are presented in Figure 1a–c. The XRD patterns showed that, at the lowest synthesis temperature (120 °C), a covellite CuS structure was formed. The pattern matched well with JCPDS No. 06-0464 and conformed well with previous reports on CuS nanostructures [46,47]. An increase in temperature to 150 °C resulted in the formation of additional peaks at 27.98, 32.38, 46.58, and 55.03º, which were attributed to the (111), (200), (220), and (311) patterns of the nonstoichiometric phase of copper sulfide (Cu7.2S4). At 180 °C, the disappearance of the peaks due to CuS and Cu7.2S4 occurred, and the appearance of peaks ascribed to high-temperature stable-phase digenite (Cu9S5) resulted. However, at this reaction temperature, impurity peaks were observed at 2θ values of 22.57, 27.14, 31.55, and 32.60, which were due to the (101), (102), (110), and (111) patterns of dicopper sulfide (Cu2S) [48]. A further increase to 220 °C gave rise to the pure form of digenite (Cu9S5), with peaks assigned to the (101), (0015), (107), (1010), and (0114), which were consistent with the standard values according to JCPDS No. 047-1748 and corresponded to the rhombohedral structure belonging to the space group R3 m [49,50] (Figure 1b). There was no other phase of copper sulfide or any impurity peaks generated at this temperature. The strong and sharp diffraction peaks observed in the XRD patterns as the temperature increased indicated an increase in the crystalline nature of the samples. The absence of any diffraction peaks corresponding to CuO and/or Cu2S in the XRD pattern of the digenite at this high reaction temperature showed no probable impurities and indicated that high temperature favors the formation of this phase. This temperature-controlled solvothermal synthesis technique confirmed that, by using copper dithiocarbamate, pure-covellite CuS and digenite Cu9S5 could easily be synthesized at low and high temperatures, respectively. An earlier report on the preparation of copper sulfide nanocrystals using copper dithiocarbamate as a precursor also showed the formation of mixed phases (Figure 1c) at a lower temperature and pure-phase Cu9S5 at a higher temperature of synthesis [51]. Because the samples obtained at 150 and 180 ºC resulted in mixed phases, their characterization was not pursued further for both optical- and morphology-based studies.
The average crystalline sizes of the pure-phase covellite (CuS) and digenite (Cu9S5) nanocrystals were determined using the Scherrer equation d = 0.9λ/(β cos θ), where d is the crystalline size, λ is the wavelength of X-ray used for the measurement (1.540598 Å), β is the full width at half maximum using the most intense peak (after the correction of the instrumental broadening) expressed in radians, and θ is the Bragg angle. The values obtained were 24.94 and 32.06 nm for the covellite (CuS) and digenite (Cu9S5) nanocrystals, respectively.
2.2. SEM and TEM Analysis
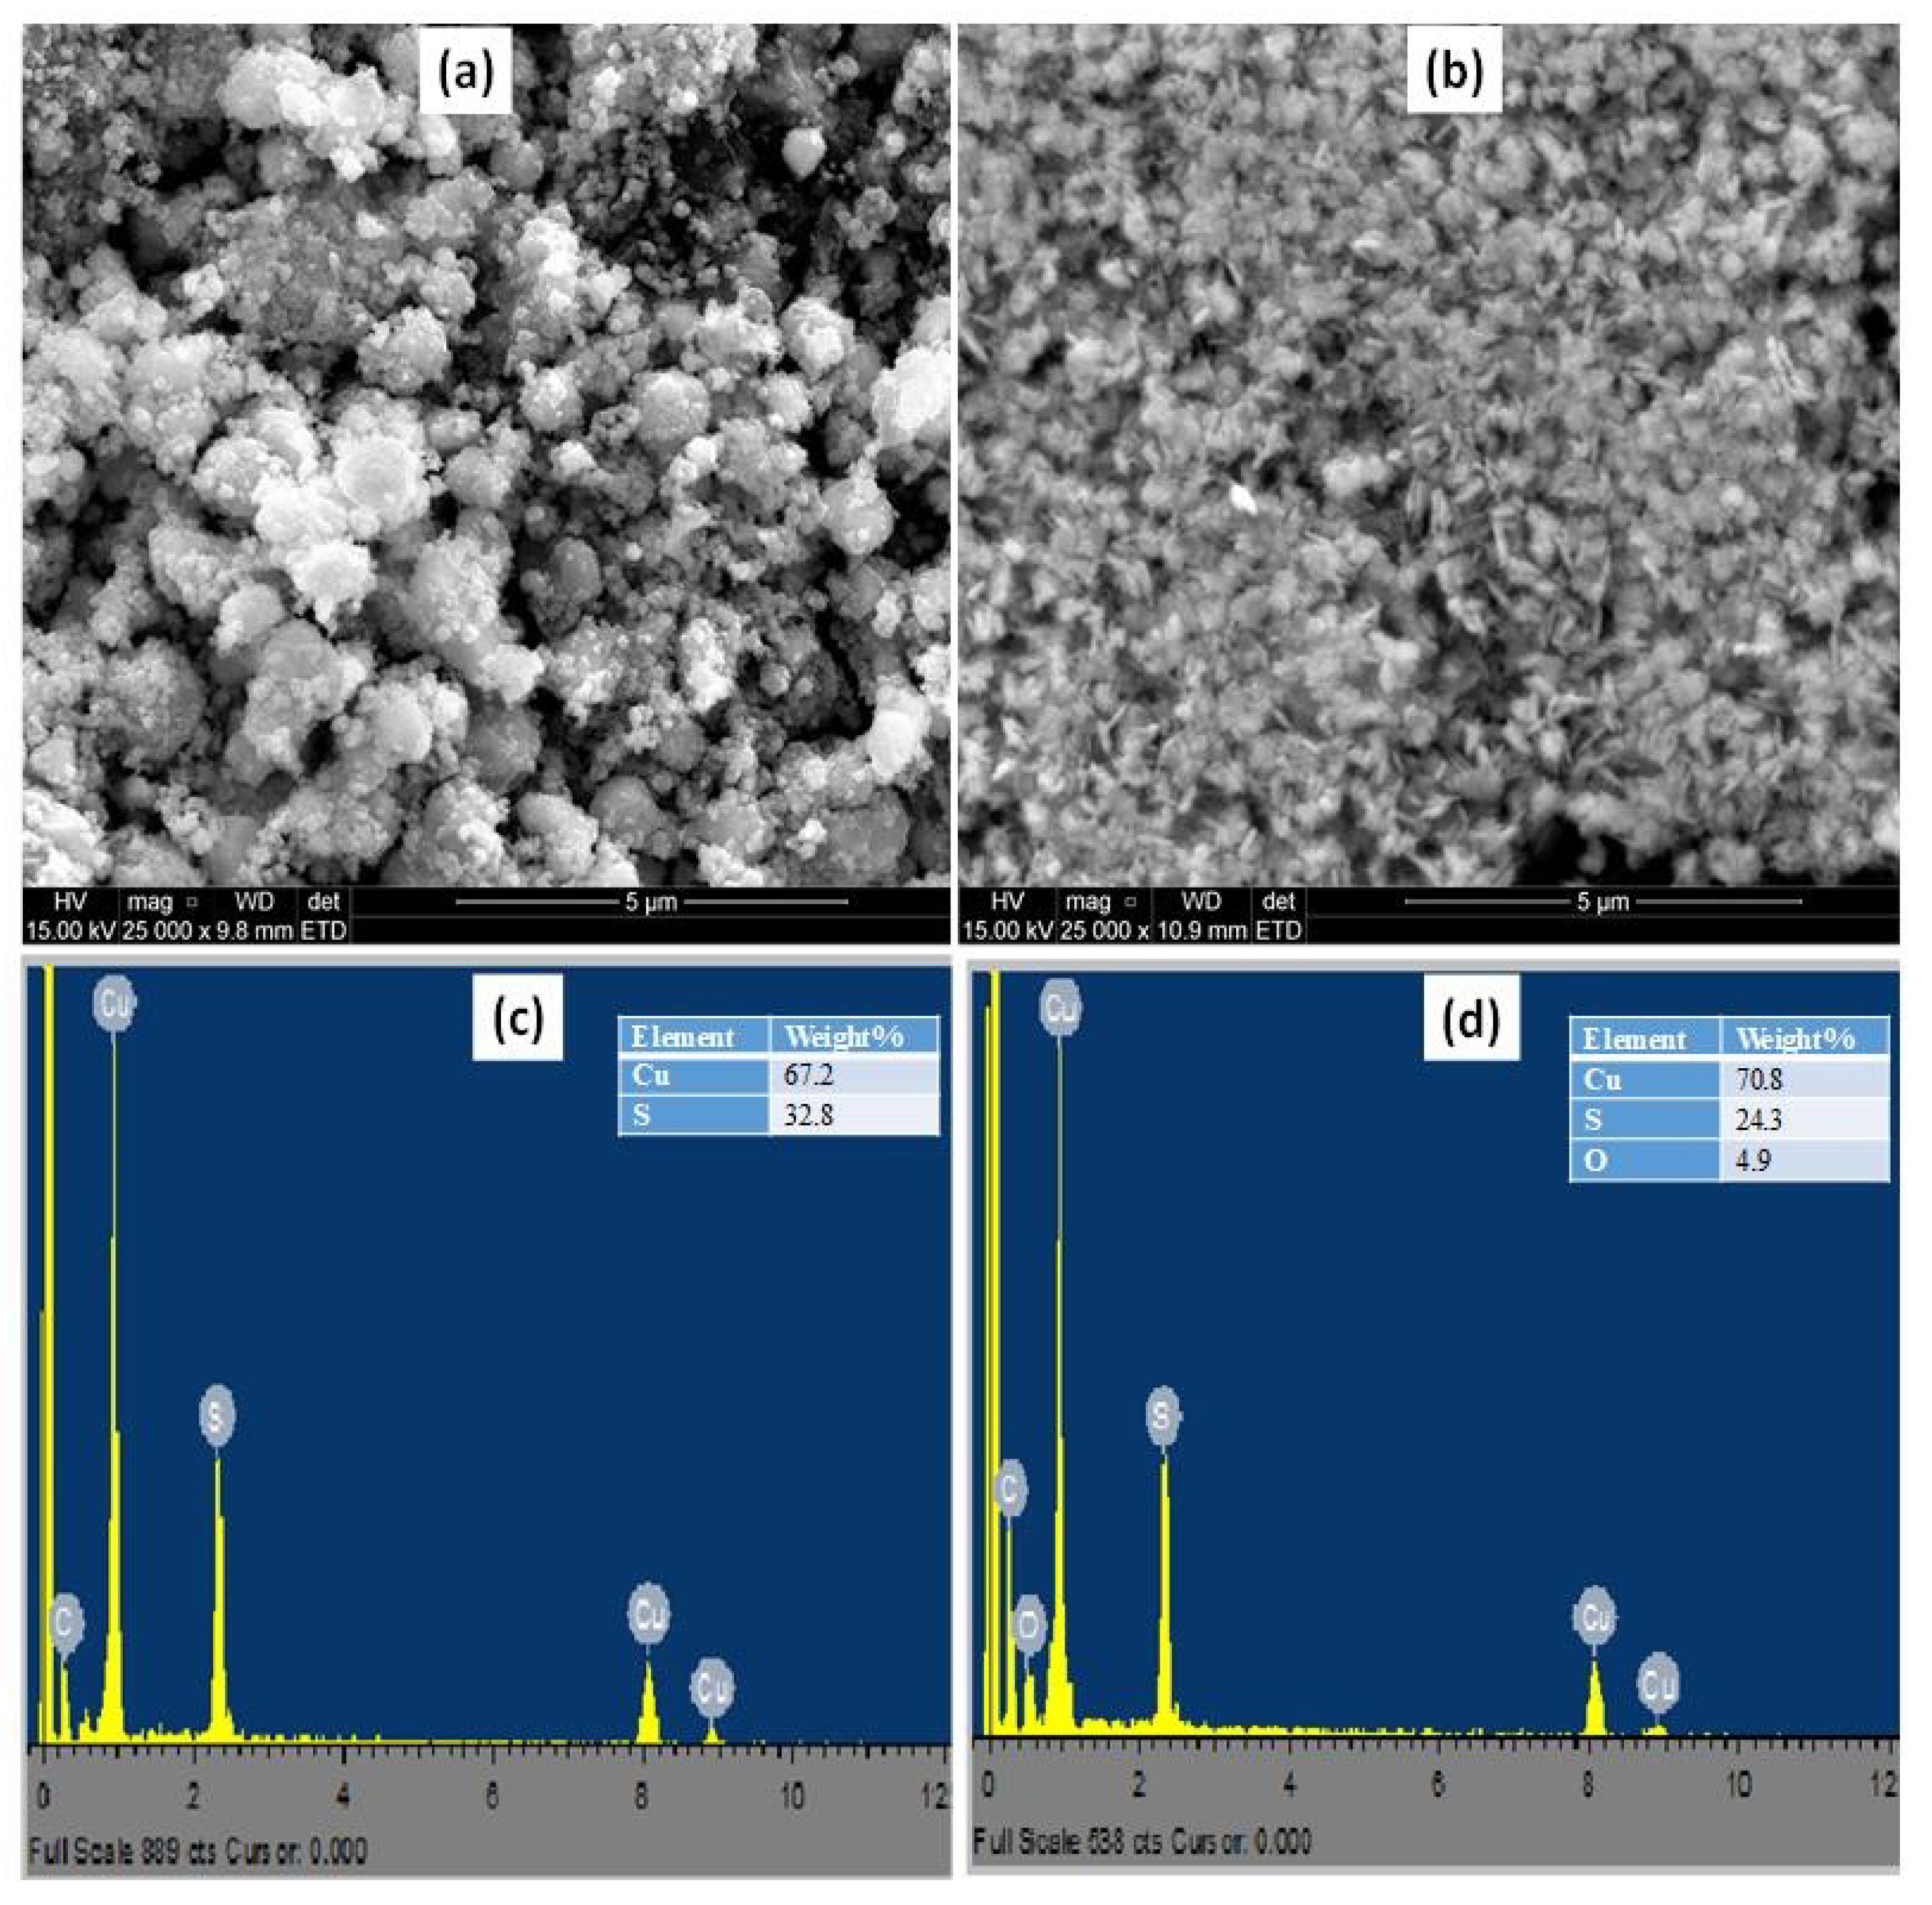
The surface morphologies of the as-prepared copper sulfide samples were studied by SEM, and the micrographs are presented in Figure 2a,b. The two images demonstrate their morphological differences, with significant differences in their packing and particle distribution. The covellite (CuS) sample consists of spherical and more agglomerated nanoparticles, while the digenite (Cu9S5) sample was composed of small rods arranged parallel and fairly distributed across the mat.
The EDS spectra of both copper sulfides (Figure 2c,d) demonstrated that they mainly comprise Cu and S elements. The weight % of Cu and S estimated for both covellite and digenite phases are shown as tables in the inset of the respective EDX spectrum. Ideally, the weight % of Cu and S in covellite should be 66.46/33.54%. The table shows that the estimated values were quite close to the ideal values, with the percentage of Cu being slightly higher than the expected value, similar to an earlier report. This higher percentage of Cu could be attributed to the excessive absorption of copper ions on the surface of nanoparticles [52]. The ideal amount of Cu/S in the digenite phases is 78.10/21.90%, and the EDX spectrum showed the presence of an O atom, which was due to the generation of SO2 as a byproduct of the oxidation of CuS into Cu9S5 [53]. The structural evolution of Cu9S5 nanosheets from CuS nanoflowers was reported at 250 °C, with the generation of SO2 as a byproduct [54].
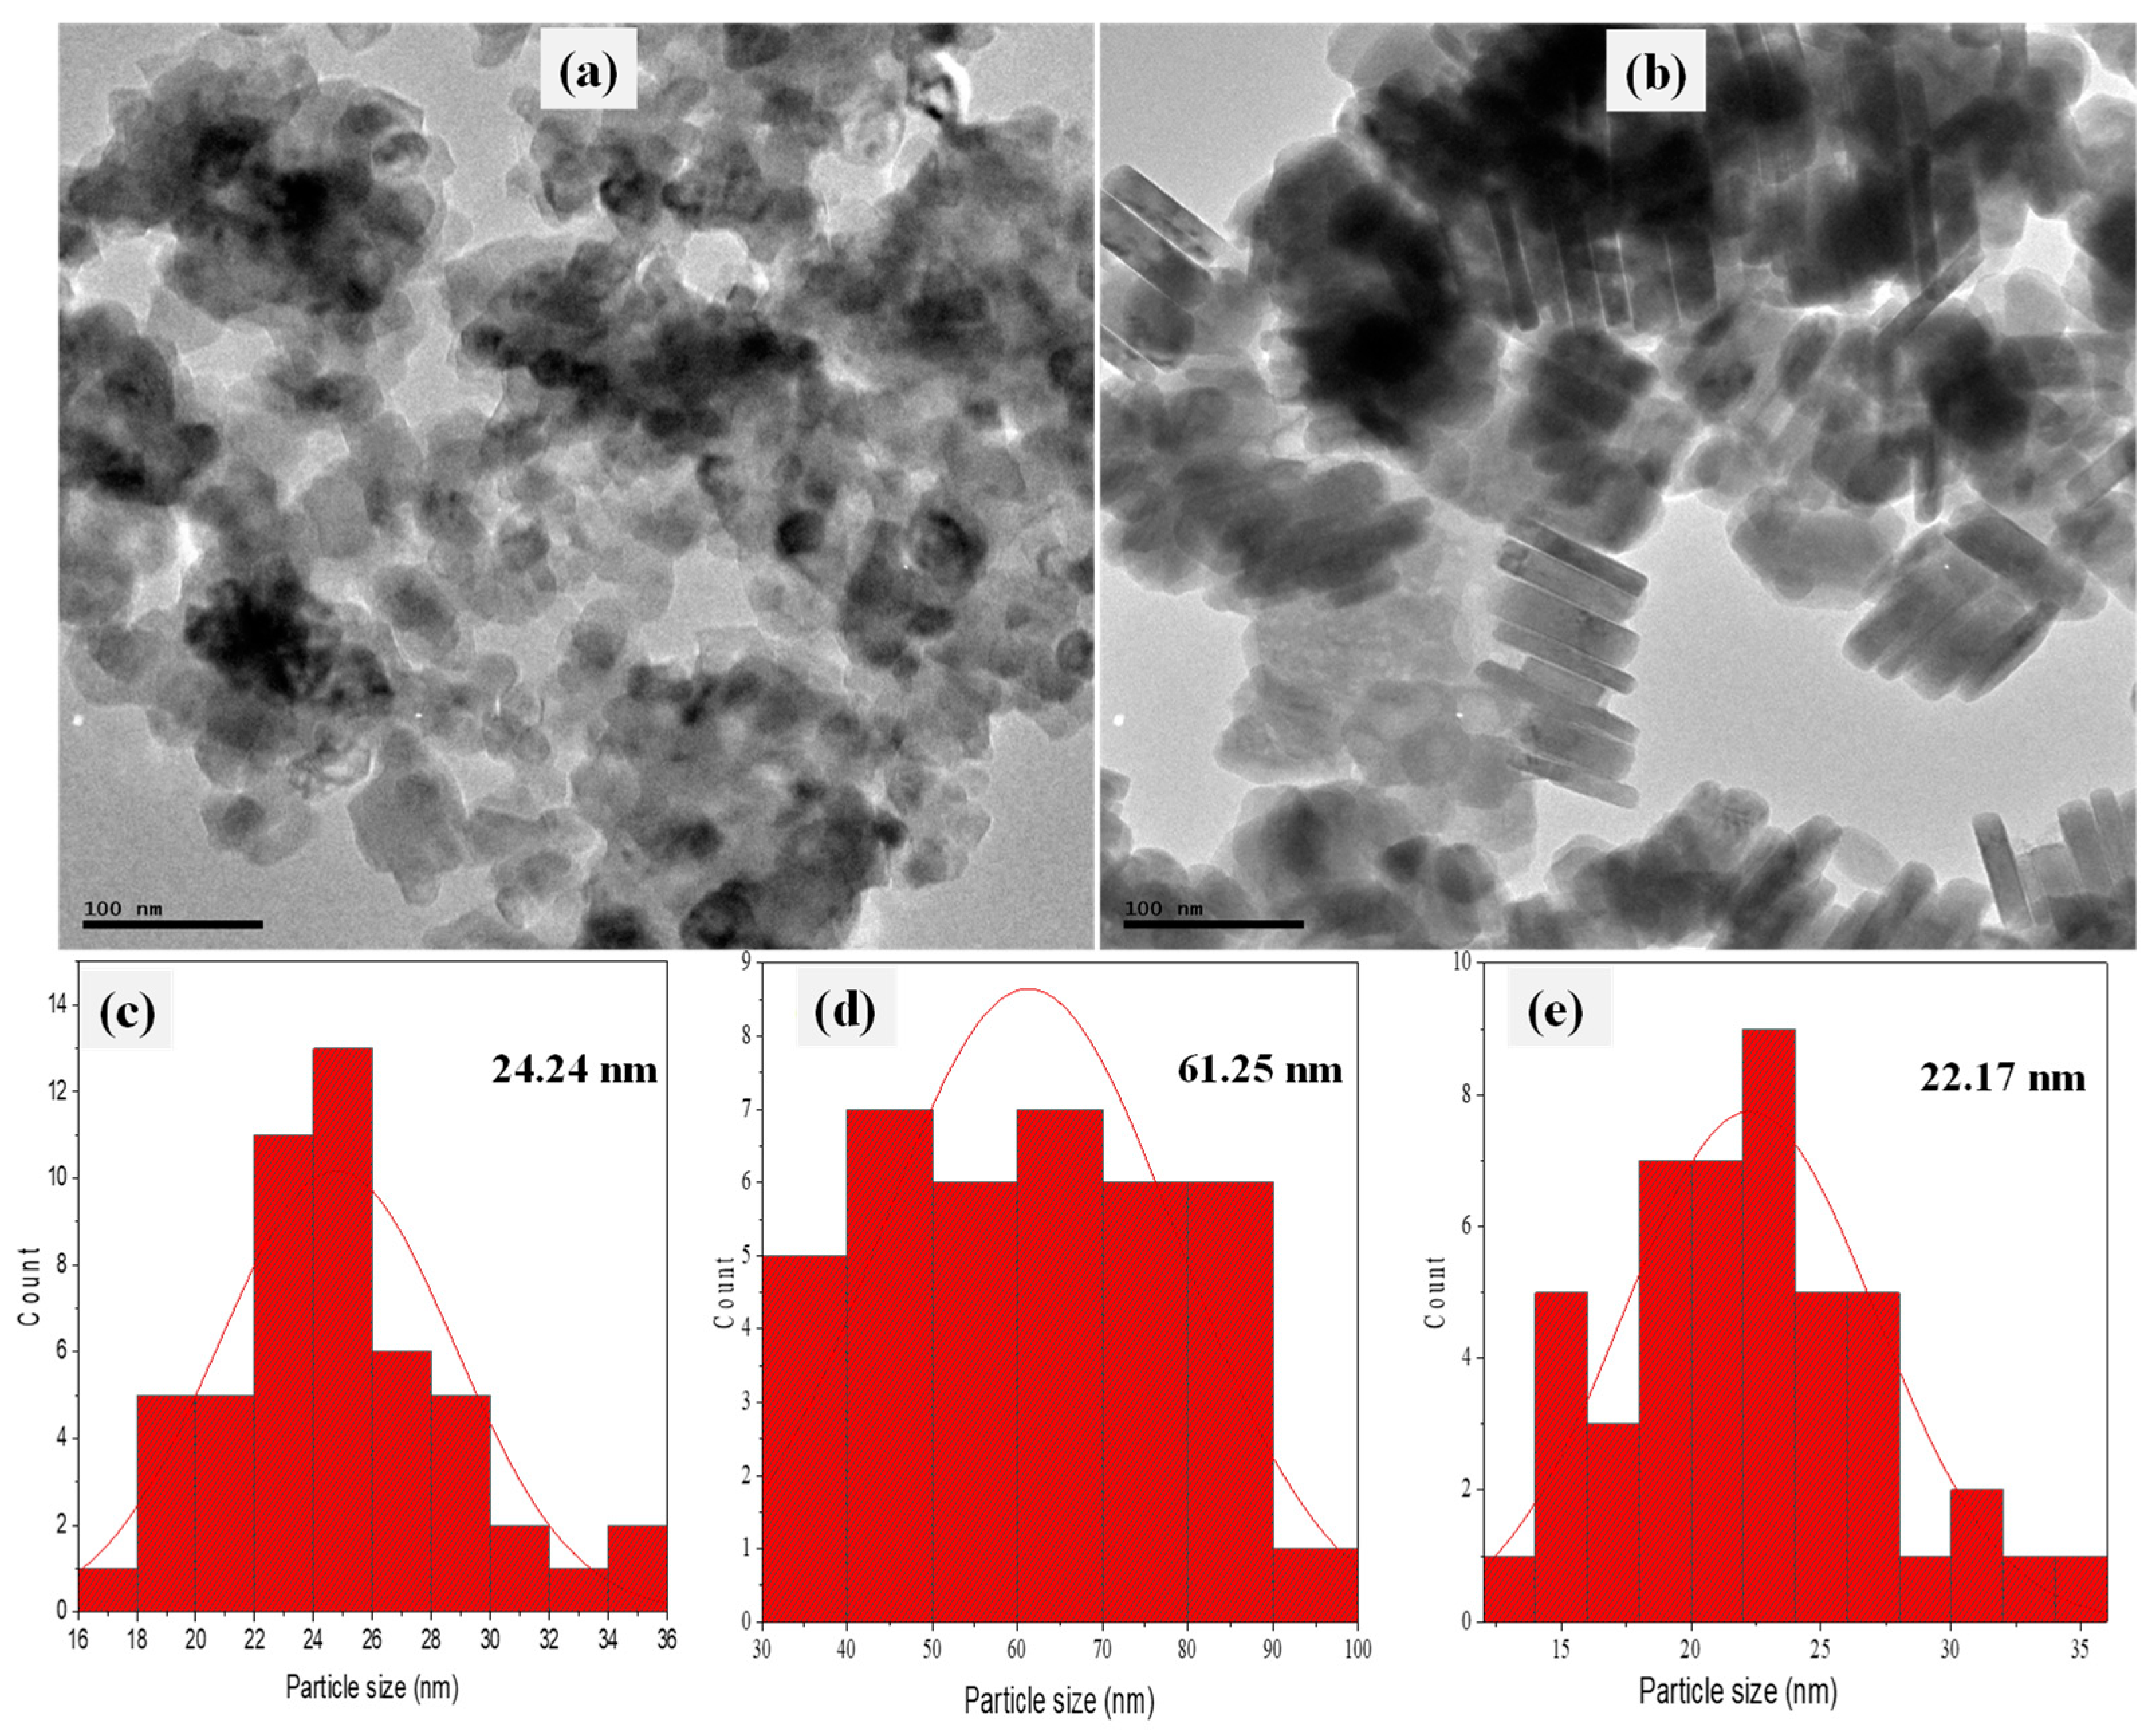
The TEM micrographs presented in Figure 3a,b conform with the observation in the SEM micrographs. It is apparent that both samples were distinctly different in their morphologies. The covellite CuS in Figure 3a shows a cluster of spherical nanoparticles with an average particle size of 24.24 nm, while the digenite Cu9S5 presents some stacks of nanorods oriented parallel and with an average length and width of 61.25 and 22.71 nm, respectively, as shown in their particle size distribution histograms in Figure 3c,d, respectively.
2.3. UV–Vis and Photoluminescence Spectra
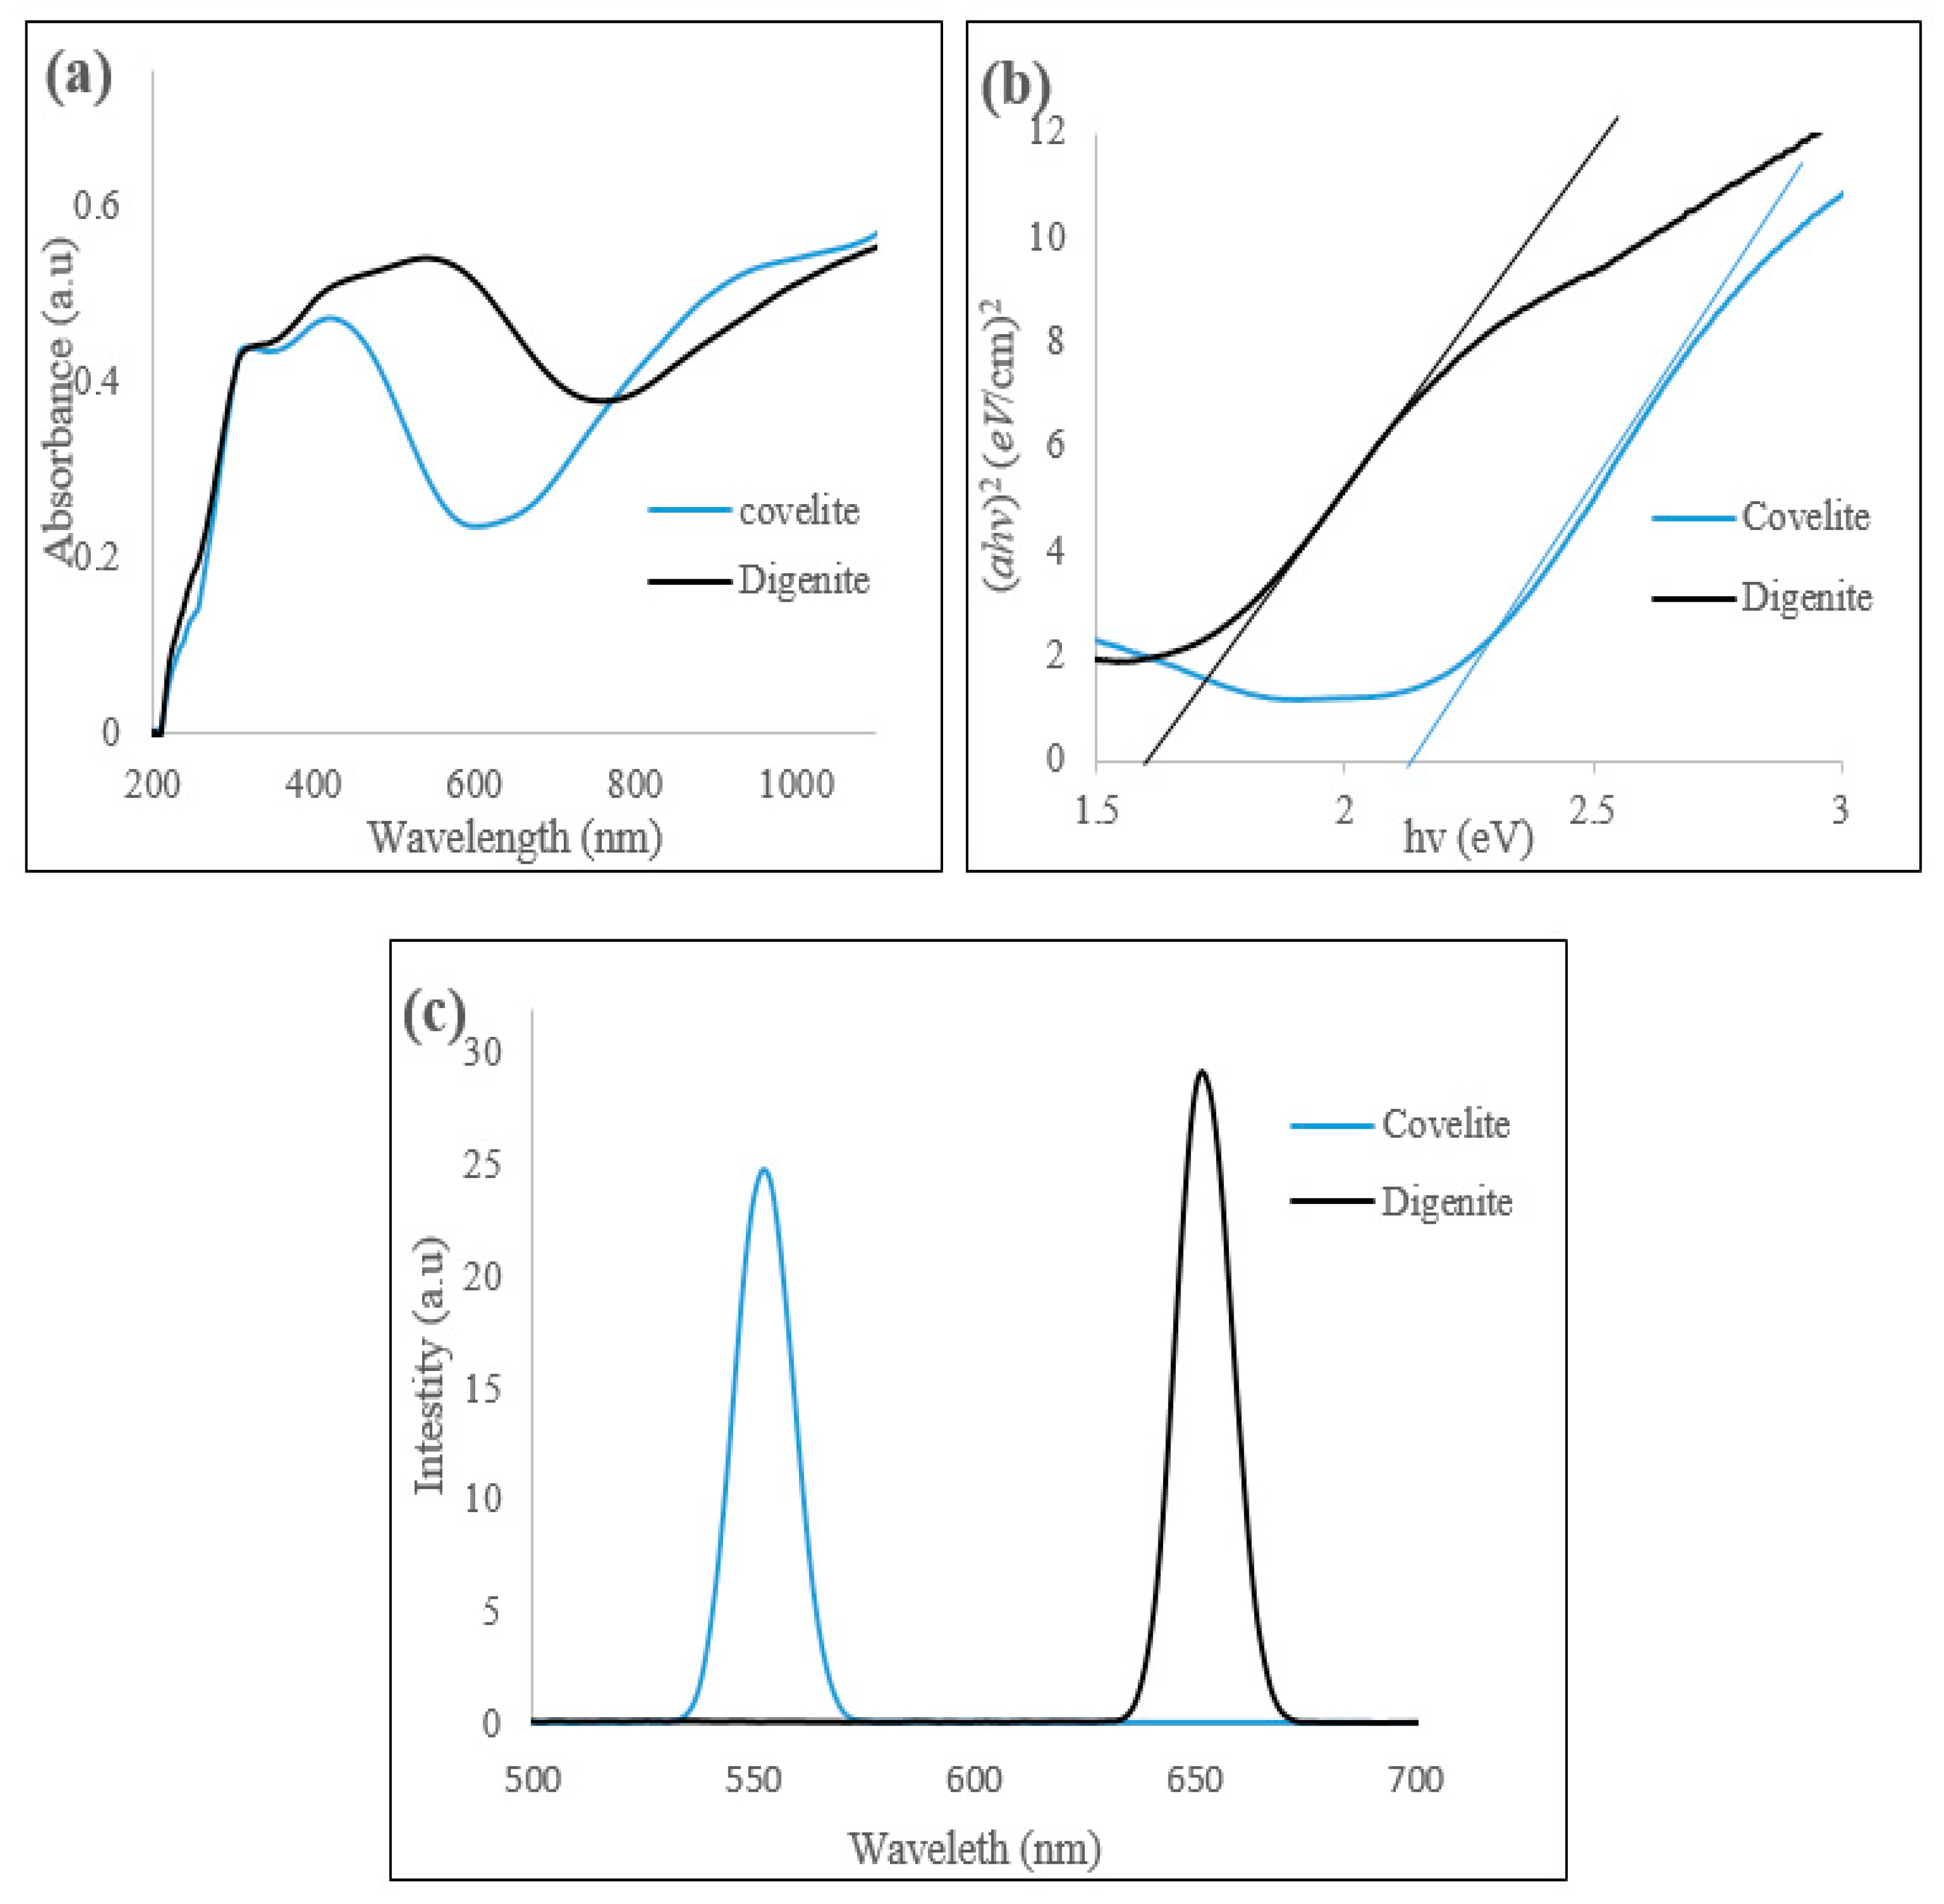
The absorption spectra of both covellite and digenite are shown in Figure 4a. The absorption spectrum of the covellite CuS showed a broad absorption from 300 to 600 nm, with a peak around 475 nm, and then gradually increased from around 630 nm into the infrared region. The observed absorption in the range 300–600 nm was attributed to the excitonic absorption of covellite CuS [55], and the absorption that tailed into the infrared region is characteristic of covellite CuS and was due to the interband transitions from the valence states to the unoccupied states [55,56]. The absorption spectrum of the digenite Cu9S5 phase showed a broader absorption from 300 nm and extended into the near-infrared region around 800 nm before increasing gradually beyond 780 nm. The absorption spectra of both samples were similar to previously reported covellite and digenite phases [51,57].
The band gap (Eg) energies could be obtained from the high-frequency region of the spectra by using the Tauc equation (αhυ)1/m = k (hυ − Eg) [58]. This involves a plot of (αhν)2 versus energy (hν), where α is the absorption, ν is the frequency, h is a Planck constant, hν is the photon energy, m = 2 for a direct energy gap, and m = 1/2 for the indirect gap. The extrapolation of the linear region of the band gap to the point x = 0 gives the band gap values of the CuS and Cu9S5 samples as 2.25 and 1.60 eV, respectively. These values were in the range of the band gap energies reported earlier [59,60,61].
The photoluminescence spectra of both covellite and digenite at room temperature, at an excitation wavelength of 400 and 500 nm, respectively, are shown in Figure 4c. The PL of covellite showed that the nanoparticles had emissions at 554 nm, which could be associated with the transition that occurred between the electronic states near band edges (i.e., band-to-band transition) [62]. Variation in the emission peak of covellite was observed. While no emission peak was reported for covellite in the range of 400–800 nm [63], Sreelekha et al. reported two PL emissions at 417 and 444 nm for CuS prepared by the coprecipitation route [64]. These observations further indicated that the nature and position of the emission spectrum are heavily dependent on the morphology and also the inherent structure of the samples [65,66]. The photoluminescence spectrum of digenite showed emissions at 650 nm, also suggesting a near band-edge emission. The difference in the spectra obtained could be ascribed to their microstructural and morphological variation, which could influence their electronic transition [67].
2.4. Photocatalysis Studies
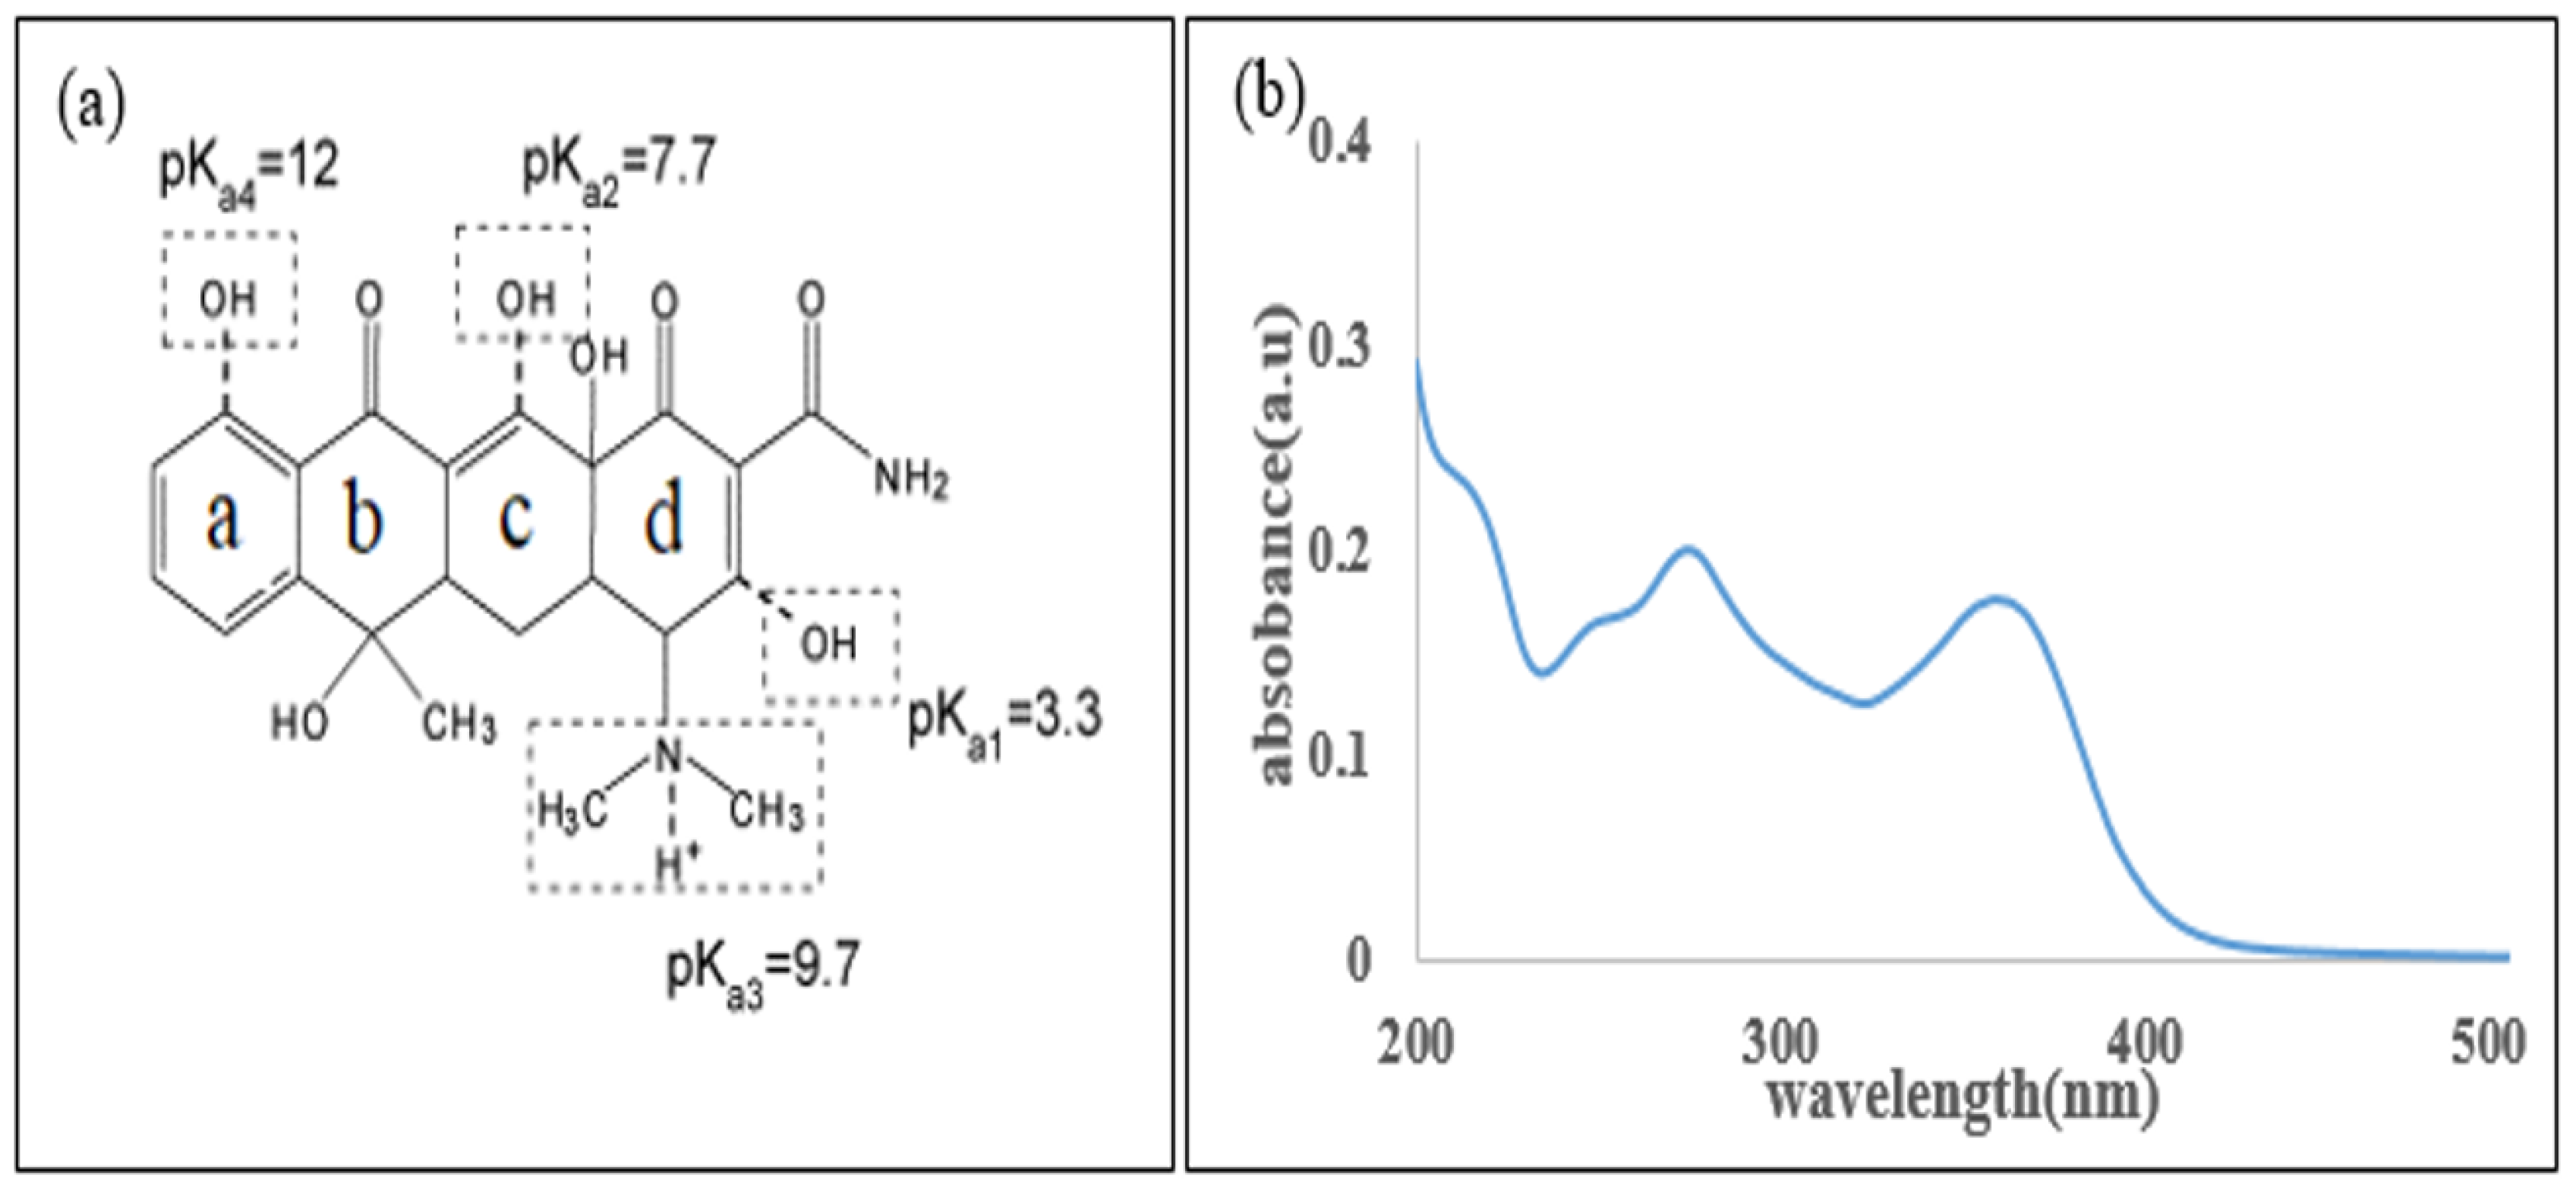
The structure of tetracycline is shown in Figure 5a, and it consists of two chromophores that are made up of four rings labeled a, b, c, and d [68]. It is an amphoteric molecule with pKa values of 3.3, 7.7, 9.7, and 12 [69,70]. At pH 4, the molecules exist in the neutral and positively charged states (TC+), and as the solution is increased to pH 9, the negatively charged TC molecules become dominant [71]. Figure 5b presents the absorption spectrum of TC, which showed absorption peaks around 275 and 360 nm. The first absorption peak corresponds to ring (a), while the second peak corresponds to the other aromatic rings (b), (c), and (d) and the developing chromophores. The photolytic degradation of TC has been well studied [72], indicating that the process was distinctly inhibited in the positively charged forms (TC+) and promoted in the negatively charged (TC−) form. The results of other similar studies also showed that the reliance of photolysis on the pH of the solution is related to the protonation states and also the absorbance spectra of other organic pollutants [71]. The effect of pH on the degradation of the TC molecule and also on the shifting of the peak position has been studied. The results showed that at pH 4, the absorbance of TC was relatively lower compared to that at pH 6, indicating that the extinction efficiency of TC+ is lower compared to TC0. This observation also indicated that the rate constant of photolysis at pH 4 was lower than that at pH 6. However, a further increase in the pH from 6 to 9 resulted in the increase in the photolysis rate constant, indicative of the low stability of TC at high pH [72]. Yu et al. [73] reported that the phenolic, acylamino, and hydroxyl groups of TC remained incompletely degraded by photolysis even after 300 min of simulated light irradiation. The results agreed with previous reports that photolysis alone is not capable of completely degrading these groups in TC [72]. This further confirmed that the naphthol ring of TC remained intact during photolysis, and only partial mineralization was achieved.
2.5. Dark Absorption and Photocatalytic Performances
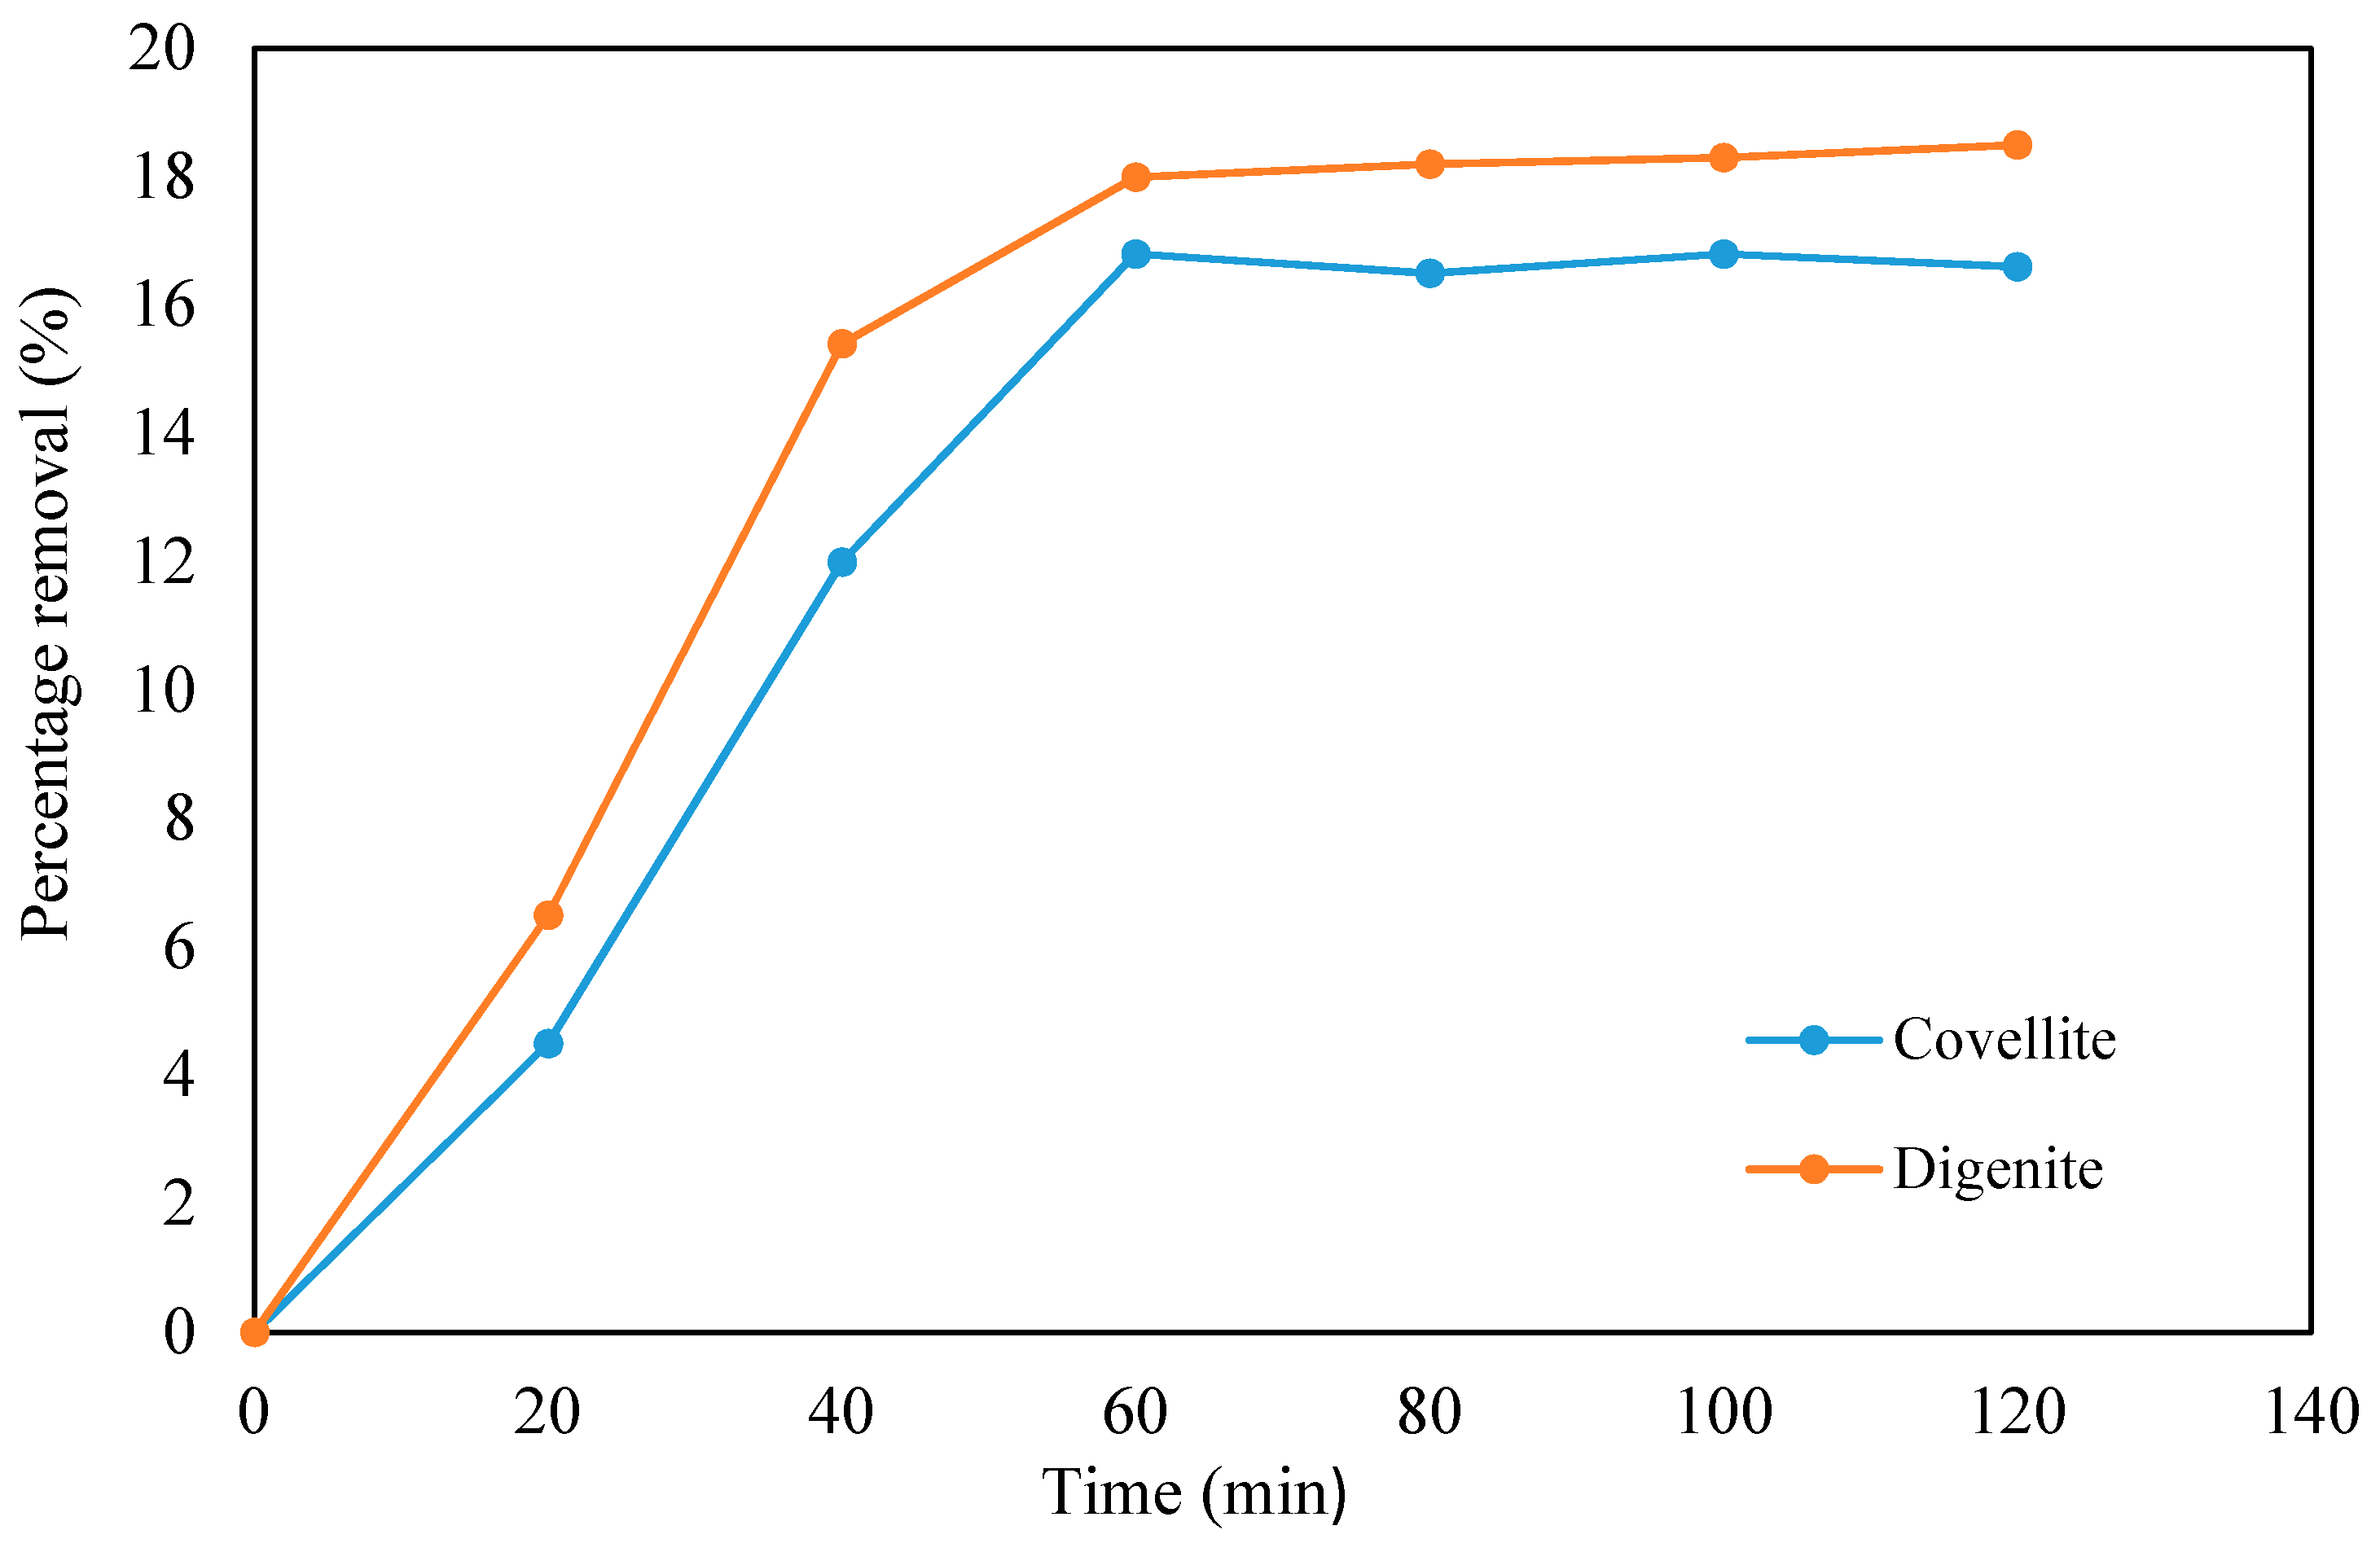
The dark adsorption experiment was conducted prior to photodegradation by stirring the mixture of the prepared samples with the TC solution in the dark in order to attain the dark adsorption–desorption equilibrium. The results presented in Figure 6 showed that an adsorption equilibrium was reached between the TC solution and the catalyst after 60 min when the samples were taken at 20 min intervals. In addition, the results indicated that less than 20% degradation efficiency of the TC was achieved in the dark adsorption experiment for digenite, while 15% was achieved using covellite as a photocatalyst. Additionally, the adsorption process did not show a significant effect on tetracycline degradation, indicating that dual activities or the mechanism of adsorption and degradation would be required for the total removal of TC from aqueous solution. The adsorption performance of digenite was higher than covellite, similar to previous studies on the degradation of TC [74].
2.6. Photocatalytic Degradation of TC Using Digenite and Covellite Catalysts
The photocatalytic degradation experiments were conducted under visible light (l > 420 nm) using both digenite and covellite separately. Aliquots were taken at 15 min intervals in both cases. Figure 7a,b presents the time-resolved UV–vis spectra during the photodegradation of TC. A decrease in the absorption of TC at the wavelength of 357 nm occurred, accompanied by a shift in the absorption band to a shorter wavelength, which is an indication of the degradation of TC [68]. The main absorption peak corresponding to TC sequentially shifted from 357 to 350 nm, which implied that the degradation of TC occurred gradually, with an increase in contact time, during the photodegradation process. Therefore, a direct relationship between contact time and degradation percentage was observed through the wavelengths. The digenite phase exhibited higher catalytic ability with 98.5% degradation compared to the covellite phase, which showed 88% degradation within the 120 min reaction time using 80 mg of the catalysts. The higher degradation efficiency achieved with the digenite phase might be due to its higher absorption property for light in the visible region, observed in its UV–visible spectrum (Figure 4) compared to the covellite. Hence, it was able to generate more radicals compared to the covellite phase.
2.7. Effect of Catalysts Loading
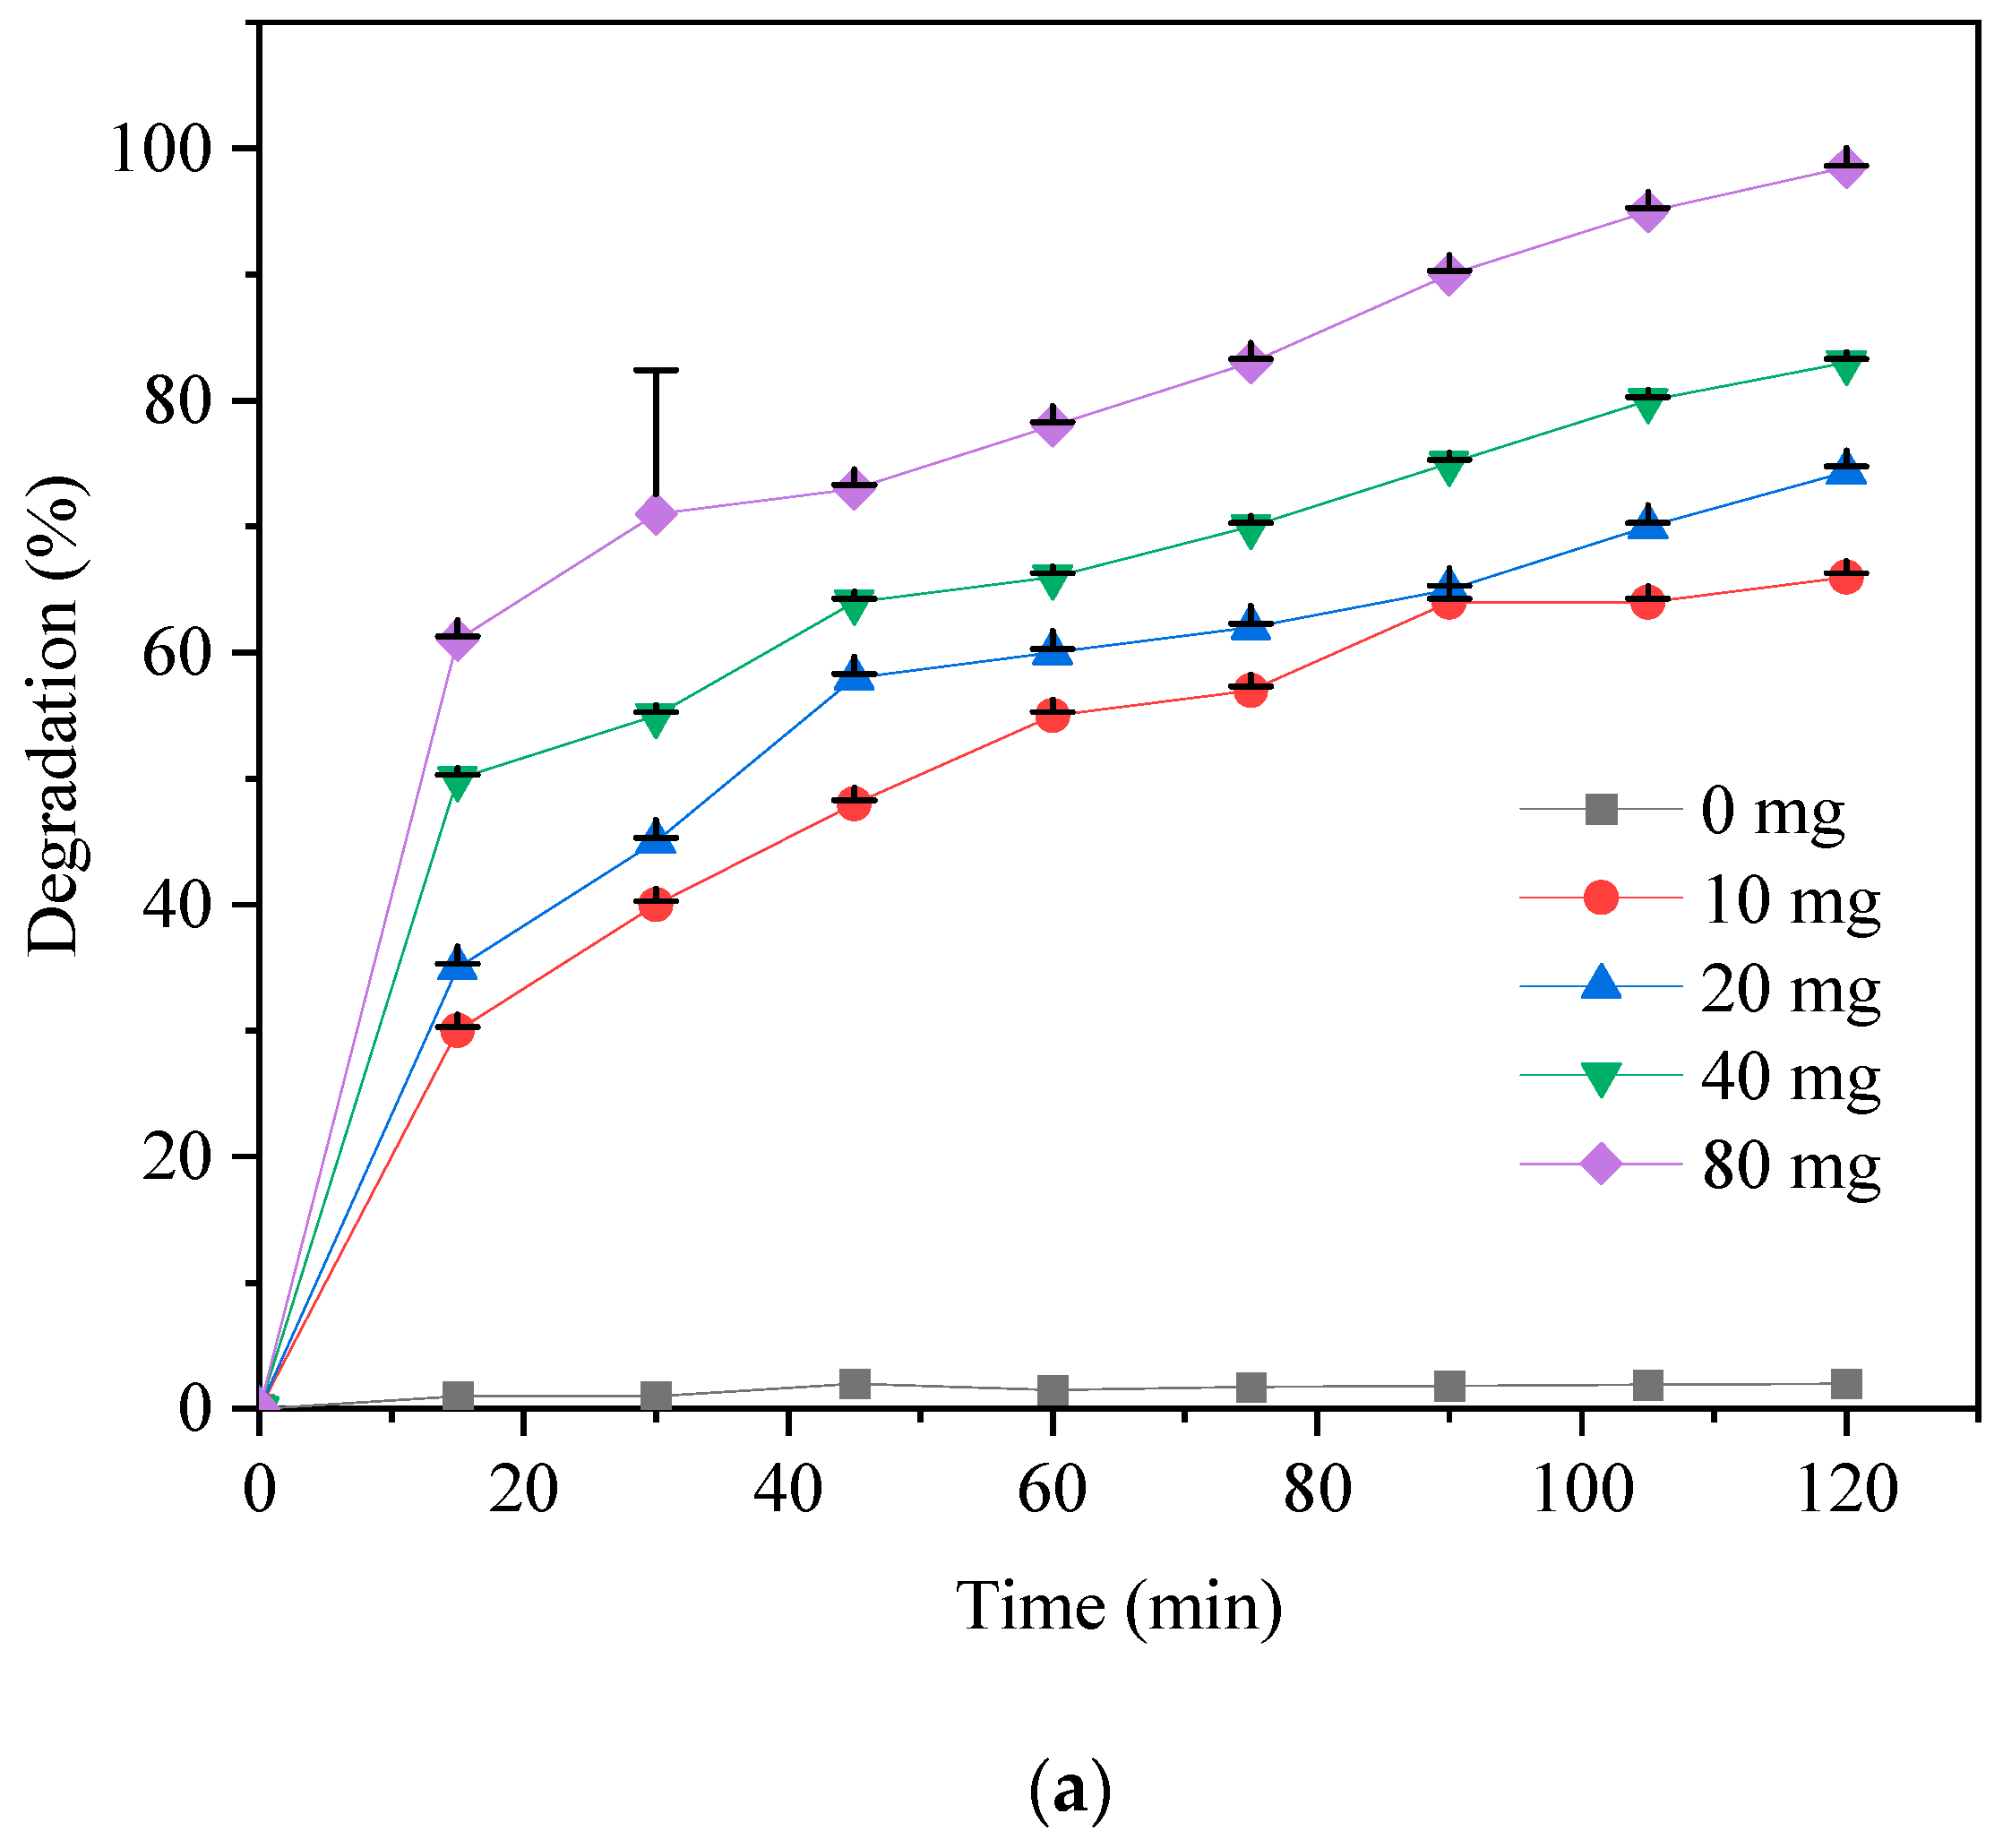
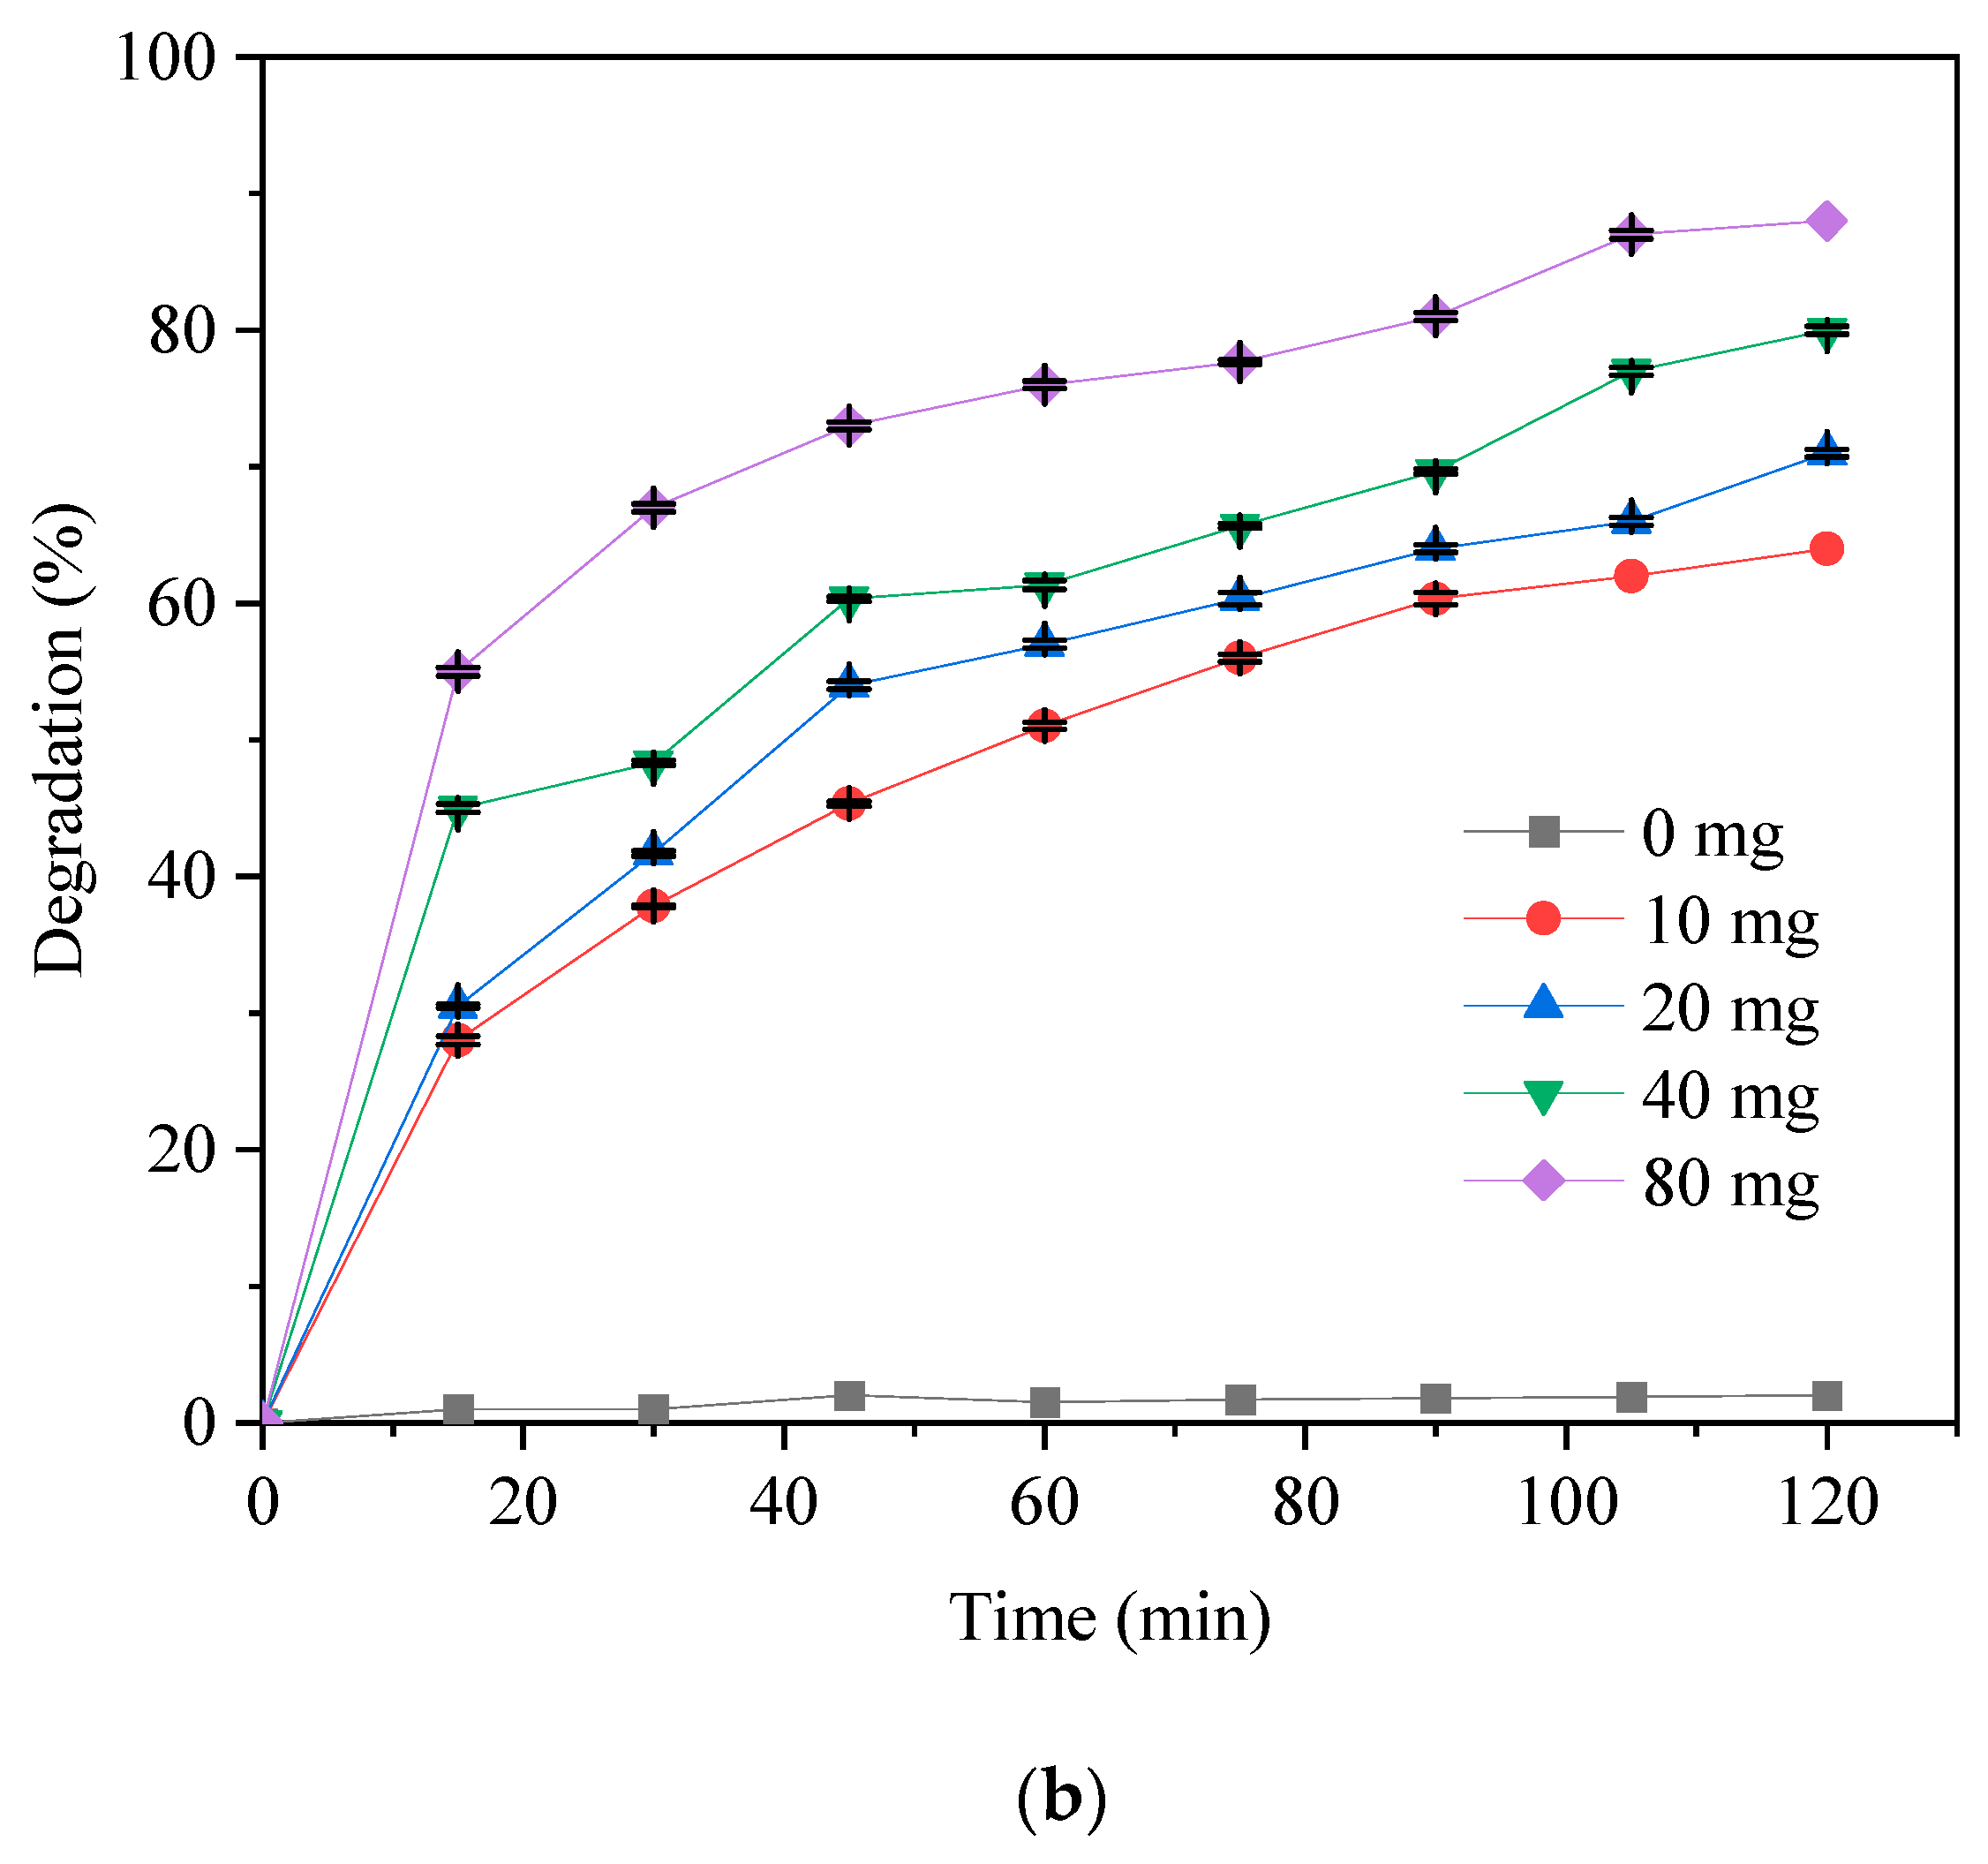
The amount of catalyst used in a degradation experiment has a significant effect on the efficiency of the degradation. The degradation study of TC solution was conducted with and without a photocatalyst under visible light in order to establish the role of the photocatalysts. The results presented in Figure 8a,b indicate that little or no degradation of TC occurred prior to the introduction of photocatalyst in both cases. About 5% degradation occurred in the absence of the catalyst after 120 min under visible light. The sharp increase in degradation only started after the introduction of digenite and covellite into the system. The degradation efficiency of TC increased with the catalyst loading up to 200 mg/L, implying a direct relationship between the catalyst loading and the percentage degradation. In addition, photoresponse due to adsorptive degradation is a predominant mechanism for TC removal using both catalysts. Therefore, enhanced degradation achieved with an increase in catalyst loading could be attributed to the increase in the number of active sorption or catalytic sites available on the surface of these catalysts. However, excess catalyst loading above the optimum dosage might cause the scattering of light and a screening effect, which might lead to a reduction in the specific activities of the photocatalysts. A degradation efficiency of 98.5% (Figure 8a) was obtained for digenite using 200 mg loading after 120 min, while only 88% (Figure 8b) was achieved for covellite using the same operating condition. This could be attributed to both the difference in their band gap energy and visible-light absorption property. The oxidative potential of materials reduces with a decrease in the band gap energy, and this may impact the photocatalytic potency of materials [75]. Both digenite and covellite exhibited comparable and highly competitive percentage degradation for TC in the first 110 min of exposure to light. Although covellite has a lower degradation ability owing to less absorption intensity under visible light compared to digenite, more than 80% degradation was achieved after 120 min, which showed that the covellite phase also has good photocatalytic behavior. Nagami et al. [76] studied the photocatalytic degradation of TC using cadmium sulfide nanocomposite (CdS/NC-T). About 83% degradation efficiency was obtained with an initial tetracycline concentration of 50 mg/L. Compared to our result, digenite and covellite could be better candidates for the complete removal of TC from water.
3. Materials and Methods
All the chemical reagents used, including 4-ethylaniline, p-tolualdehyde, methanol, ethanol, carbon disulfide, dichloromethane, potassium hydroxide, sodium borohydride, and copper(II) chloride dihydrate, were purchased from Merck Chemicals (Germany). They were of analytical grade and used as received without further purification.
3.1. Instrumentation
The crystalline structures were studied using powder XRD on a Bruker D8 Avance X-Ray Diffractometer (Karlsruhe, Germany). Microstructural studies were carried out using a transmission electron microscope (Hitachi HF–2000 TEM at 200 kV by Hitachi High-Tech Corporation, Tokyo, Japan) operated at 200 kV and a JEOL 6400F field-emission SEM (Zeiss, Oberkochen Germany). The atomic-level compositions were examined by energy-dispersive spectroscopy (EDS) attached to the SEM. Functional groups of the complex were studied using Fourier transform infrared (FTIR) spectroscopy on a Bruker Alpha-P FTIR spectrometer (Bremen, Germany). The absorption spectra were measured using Prove 300 Spectroquant (Merck, Burlington MA, USA), while the photoluminescence measurement was carried out using LS 45 Fluorimeter (Perkin Elmer, Waltham, MA, USA).
3.2. Preparation of Copper(II) bis(N-4-methylbenzyl)-N-(4-ethylphenyl) Dithiocarbamate
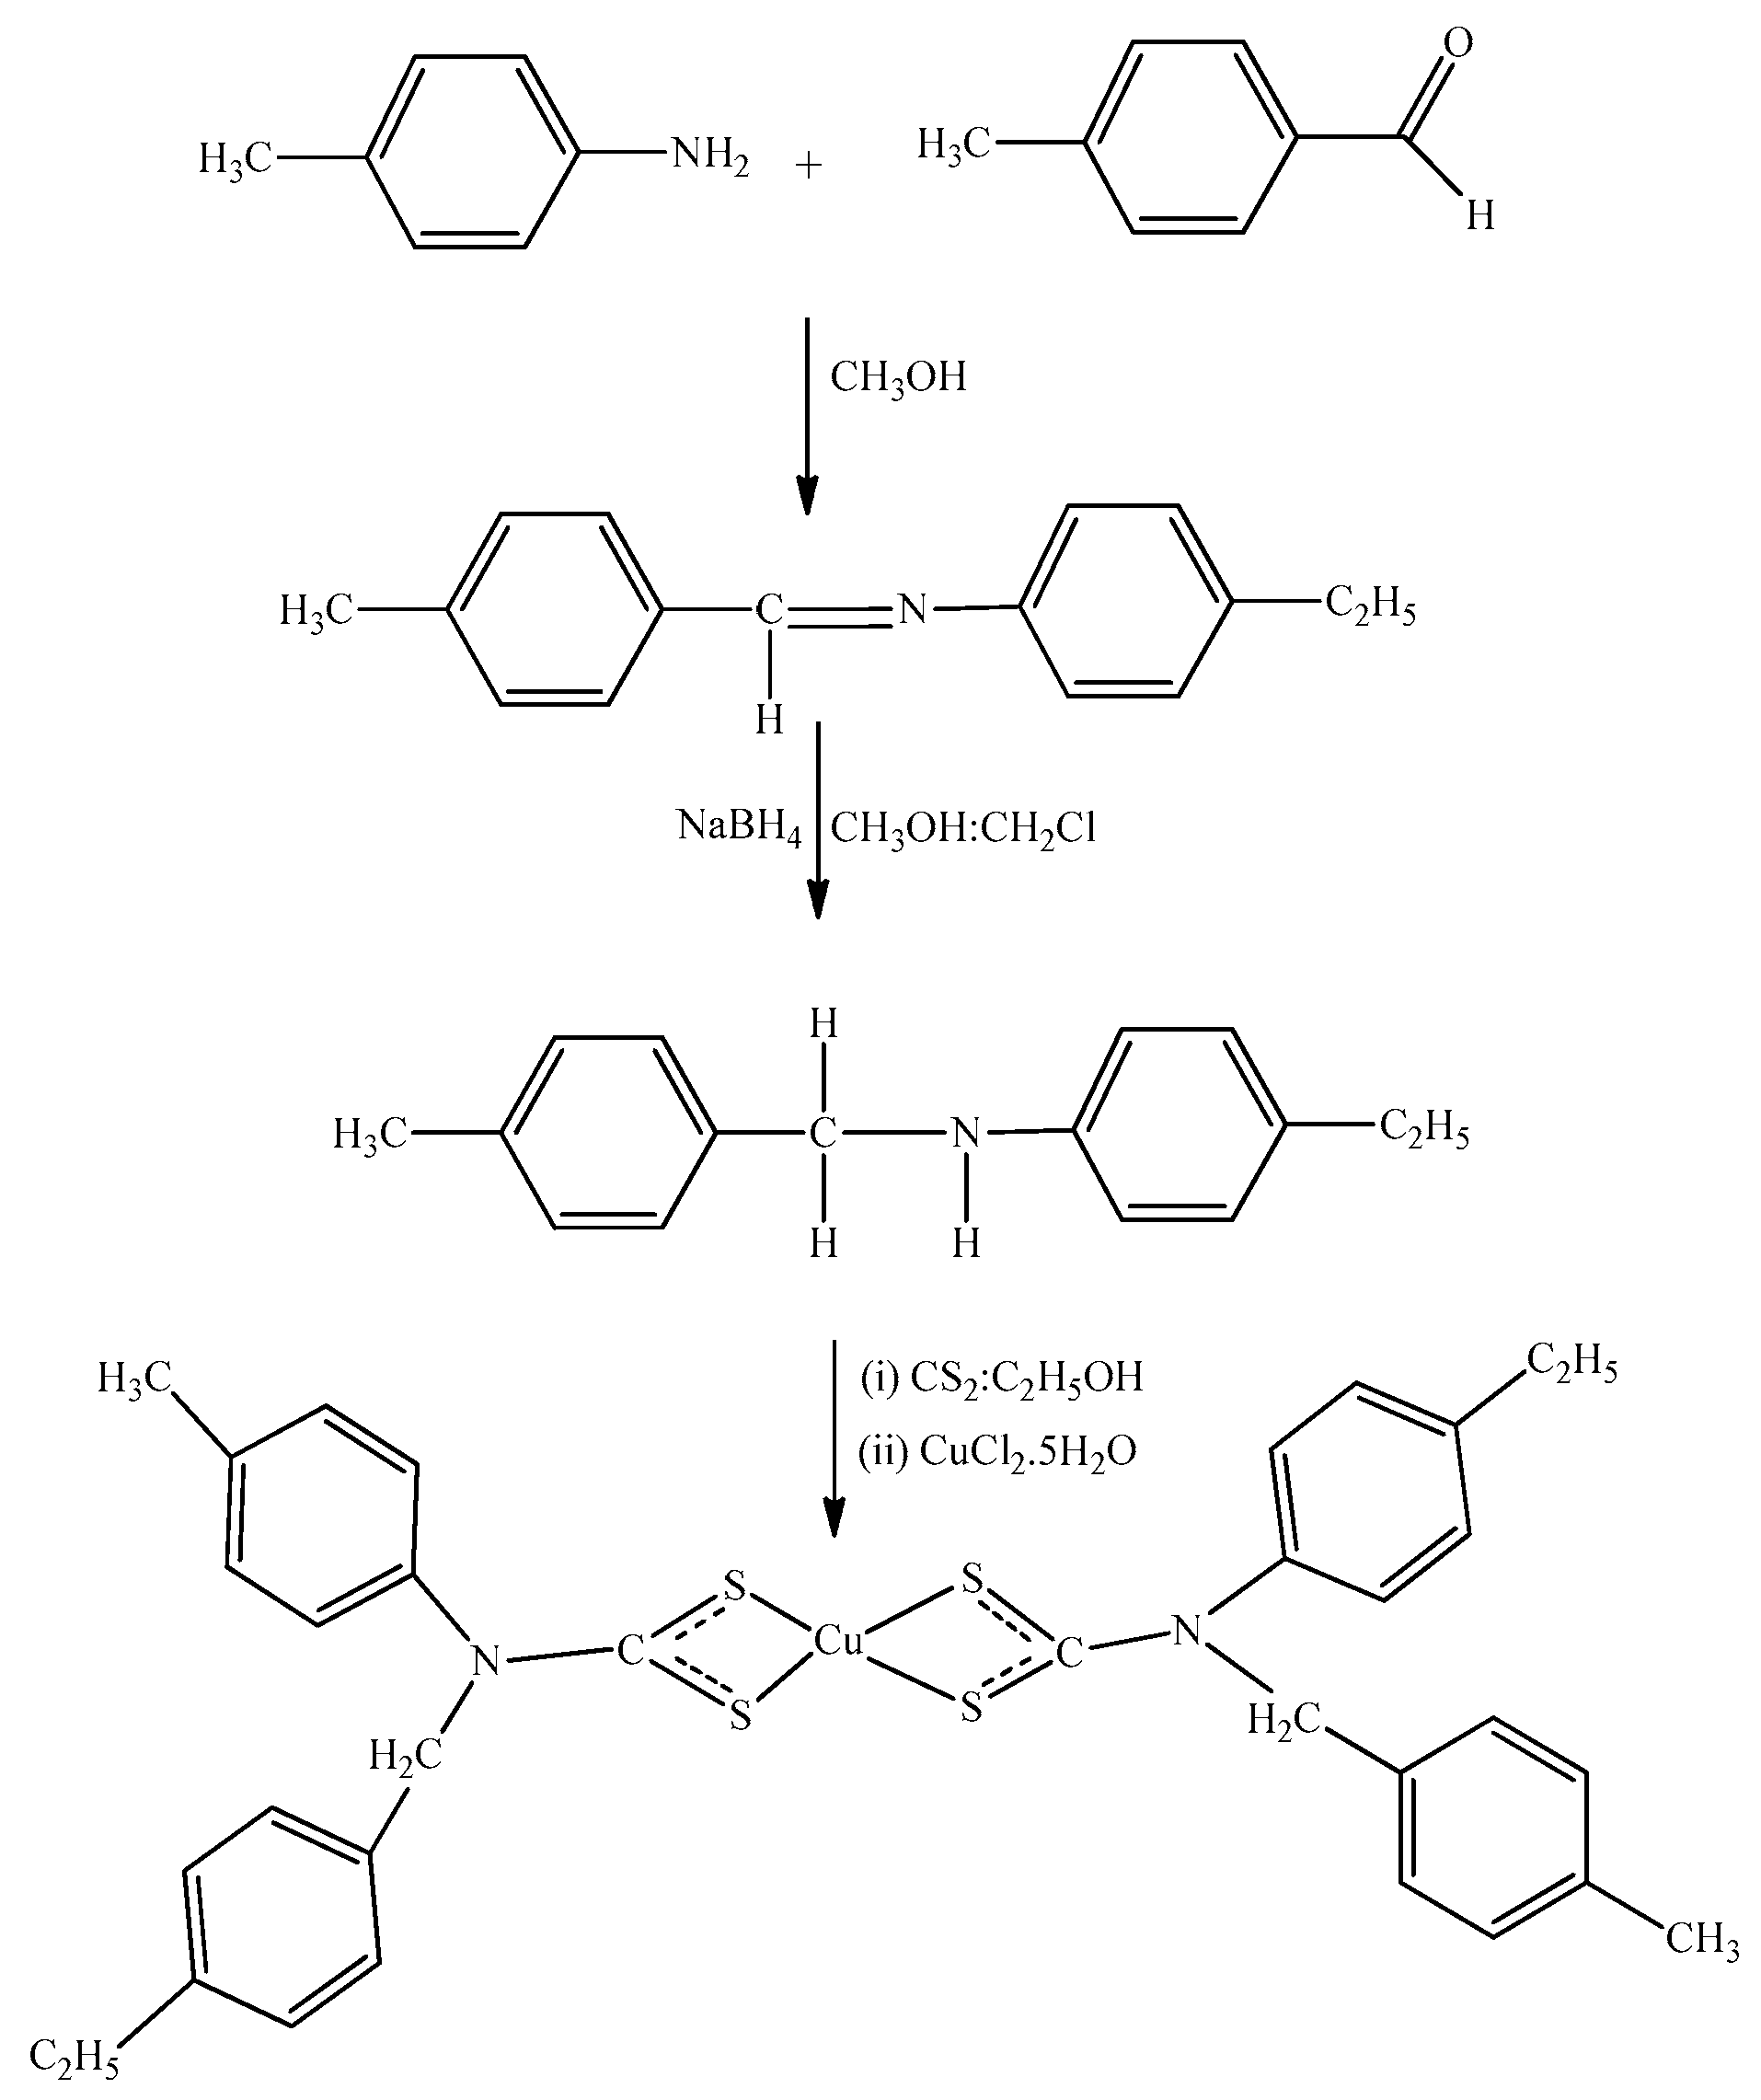
4-ethylaniline (4.0 mmol) and p-tolualdehyde (4.0 mmol) were dissolved in methanol, after which their solutions were mixed together and then stirred steadily at room temperature. After 2 h, the solution was evaporated to remove the solvent. The resulting oily product was dissolved in a 20 mL solution of methanol and dichloromethane (1:1). To this solution, was added sodium borohydride (2.8 mmol) and stirring was maintained for 2 h in ice, followed by 20 h stirring at room temperature. Thereafter, the solvent was evaporated, rinsed with water, and extracted with dichloromethane. The solvent was removed to give oily substituted amine and the product was rinsed with water and extracted using dichloromethane. The evaporation of the organic layer gave the substituted amine as a brownish oil. The substituted amine was dissolved in ethanol and then potassium hydroxide (4.0 mmol) was added to the solution and stirred for 30 min, followed by dropwise addition of carbon disulfide (4.0 mmol), while the temperature was maintained for 2 h. Copper(II) chloride dihydrate (2.0 mmol) was added to the solution with constant stirring. The resulting precipitate, copper(II) bis(N-4-methylbenzyl)-N-(4-ethylphenyl) dithiocarbamate, was washed with cold water and then air dried (Scheme 1) [77].
Color: purple brown; Yield 65%, mpt 178–180 °C. FTIR (cm−1): ν = 2046 (νNCS); 1457 (νC–N); 1029 (νC–S), 540 (νCu–S), 2985 (ν = C–H), 2931 (ν = C–H), Anal. Calcd. For Chemical Formula: C34H60N2S4Cu (688.66 g.mol−1): Elemental Analysis: C, 59.30; H, 8.78; N, 4.07; S, 18.62. Found: C, 61.80; H, 5.32; N, 4.45; S, 19.63.
3.3. Preparation of Copper Sulfide Nanoparticles
About 0.5 g of the copper dithiocarbamate complex was dispersed in a 100 mL three-necked flask 10 mL containing oleylamine. The mixture was then degassed for 10 min at room temperature by passing nitrogen through the set-up and heated up to 120 °C. After 1 h, the resultant solution was cooled to room temperature, followed by washing with ethanol and toluene, leading to the precipitation of the nanoparticles. The obtained product was centrifuged and washed severally to isolate the pure nanoparticles and then air dried. This process was repeated at different reaction temperatures of 150, 180, and 220 ℃ to give a green powder at lower temperatures and black powder and higher temperatures.
3.4. Photocatalytic Experiment
An 80 mg amount of each photocatalyst was introduced into the 200 mL flask containing a 100 mL aqueous solution of 50 mg/L TC in the photocatalytic reactor. After stirring the solution in the dark for 60 min in order to attain an adsorption–desorption equilibrium between the TC molecules and photocatalysts, the reactor was illuminated with visible light, and the process lasted for 120 min. During the experiment, about 5 mL aliquots of the solution were collected at 15 min intervals, centrifuged, and filtered using 0.22 μm PTFE syringe filters (Merck, Burlington, MA, USA). A UV–vis spectrophotometer was used to measure the concentration of the residual TC during the photodegradation process.
4. Conclusions
A simple, one-pot solvothermal route was utilized to prepare pure-phase hexagonal covellite and rhombohedral digenite nanoparticles, which were characterized by structural, morphological, and optical techniques. The phase transformation from covellite to digenite was accompanied by the formation of mixed phases of Cu7.2S4 and Cu2S at 150 and 180 ºC, in addition to a morphological transformation from spherical- to rod-shaped structures. The pure phases were further used to affect the photodegradation of tetracycline in aqueous solution. The digenite phase exhibited higher catalytic degradation of 98.5% compared to the covellite phase, which showed 88% degradation within the 120 min reaction time using 80 mg of the catalysts. A study of the effect of the concentration of copper sulfide on the photocatalytic properties showed that the activity not only depended on their phases but also strongly depended on the dosage of the catalyst used. This study provides a simple strategy for the preparation of different phases of copper sulfide with a low cost and improved photocatalytic activity.
Author Contributions
Methodology, investigation, writing—original draft preparation, M.P.R.; conceptualization, writing—review and editing, D.C.O.; formal analysis, writing—review and editing, O.A.O.; All authors have read and agreed to the published version of the manuscript.
Funding
Authors acknowledge the financial support from North-West University, South Africa, and the payment of the APC.
Acknowledgments
The authors gratefully acknowledge the North-West University and the National Research Foundation, South Africa, for providing financial assistance.
Conflicts of Interest
The authors declare no conflict of interest.
References
- Senthilkumar, M.; Babu, S.M. Synthesis and characterization of hexagonal faceted copper sulfide (Cu1.8S) nanodisks. Mater. Sci. Semicond. Process. 2015, 40, 203–208. [Google Scholar] [CrossRef]
- Zheng, L.; Teng, F.; Ye, X.; Zheng, H.; Fang, X. Photo/electrochemical applications of metal sulfide/TiO2 heterostructures. Adv. Energy Mater. 2020, 10, 1902355. [Google Scholar] [CrossRef]
- Botha, N.L.; Ajibade, P.A. Effect of temperature on crystallite sizes of copper sulfide nanocrystals prepared from copper (II) dithiocarbamate single source precursor. Mater. Sci. Semicond. Process. 2016, 43, 149–154. [Google Scholar] [CrossRef]
- Wang, Y.; Hu, Y.; Zhang, Q.; Ge, J.; Lu, Z.; Hou, Y.; Yin, Y. One-pot synthesis and optical property of copper (I) sulfide nanodisks. Inorg. Chem. 2010, 49, 6601–6608. [Google Scholar] [CrossRef]
- Tian, Q.; Jiang, F.; Zou, R.; Liu, Q.; Chen, Z.; Zhu, M.; Yang, S.; Wang, J.; Wang, J.; Hu, J. Hydrophilic Cu9S5 nanocrystals: A photothermal agent with a 25.7% heat conversion efficiency for photothermal ablation of cancer cells in vivo. ACS Nano 2011, 5, 9761–9771. [Google Scholar] [CrossRef]
- Abdelhady, A.L.; Malik, M.A.; O’Brien, P. High-throughput route to Cu2− xS nanoparticles from single molecular precursor. Mater. Sci. Semicond. Process. 2012, 15, 218–221. [Google Scholar] [CrossRef]
- Ghahremaninezhad, A.; Asselin, E.; Dixon, D. Electrodeposition and growth mechanism of copper sulfide nanowires. J. Phys. Chem. C 2011, 115, 9320–9334. [Google Scholar] [CrossRef]
- Yoon, D.; Jin, H.; Ryu, S.; Park, S.; Baik, H.; Oh, S.J.; Haam, S.; Joo, C.; Lee, K. Scalable synthesis of djurleite copper sulphide (Cu1.94S) hexagonal nanoplates from a single precursor copper thiocyanate and their photothermal properties. CrystEngComm 2015, 17, 4627–4631. [Google Scholar] [CrossRef]
- Zhang, H.; Zhang, Y.; Yu, J.; Yang, D. Phase-selective synthesis and self-assembly of monodisperse copper sulfide nanocrystals. J. Phys. Chem. C 2008, 112, 13390–13394. [Google Scholar] [CrossRef]
- Whiteside, L.S.; Goble, R.J. Structural and compositional changes in copper sulfide during leaching and dissolution. Can. Mineral. 1986, 24, 247–258. [Google Scholar]
- Senthilkumar, M.; Mary, C.I.; Manobalaji, G.; Babu, S.M. Ligand assisted tunability of morphological and optical properties of copper sulfide nanocrystals. Mater. Sci. Semicond. Process. 2019, 104, 104685. [Google Scholar] [CrossRef]
- Liu, Y.; Liu, M.; Swihart, M.T. Reversible crystal phase interconversion between covellite CuS and high chalcocite Cu2S nanocrystals. Chem. Mater. 2017, 29, 4783–4791. [Google Scholar] [CrossRef]
- Liao, X.-H.; Chen, N.-Y.; Xu, S.; Yang, S.-B.; Zhu, J.-J. A microwave assisted heating method for the preparation of copper sulfide nanorods. J. Cryst. Growth 2003, 252, 593–598. [Google Scholar] [CrossRef]
- Mu, C.-F.; Yao, Q.-Z.; Qu, X.-F.; Zhou, G.-T.; Li, M.-L.; Fu, S.-Q. Controlled synthesis of various hierarchical nanostructures of copper sulfide by a facile microwave irradiation method. Colloids Surf. A Physicochem. Eng. Asp. 2010, 371, 14–21. [Google Scholar] [CrossRef]
- Jia, B.; Qin, M.; Jiang, X.; Zhang, Z.; Zhang, L.; Liu, Y.; Qu, X. Synthesis, characterization, shape evolution, and optical properties of copper sulfide hexagonal bifrustum nanocrystals. J. Nanoparticle Res. 2013, 15, 1469. [Google Scholar] [CrossRef]
- Chen, L.; Yu, W.; Li, Y. Synthesis and characterization of tubular CuS with flower-like wall from a low temperature hydrothermal route. Powder Technol. 2009, 191, 52–54. [Google Scholar] [CrossRef]
- Phuruangrat, A.; Thongtem, T.; Thongtem, S. Characterization of copper sulfide hexananoplates, and nanoparticles synthesized by a sonochemical method. Chalcogenide Lett. 2011, 8, 291–295. [Google Scholar]
- Singh, A.; Manivannan, R.; Victoria, S.N. Simple one-pot sonochemical synthesis of copper sulphide nanoparticles for solar cell applications. Arab. J. Chem. 2019, 12, 2439–2447. [Google Scholar] [CrossRef] [Green Version]
- Cheng, Z.; Wang, S.; Si, D.; Geng, B. Controlled synthesis of copper sulfide 3D nanoarchitectures through a facile hydrothermal route. J. Alloys Compd. 2010, 492, L44–L49. [Google Scholar] [CrossRef]
- Li, J.; Zhao, H.; Chen, X.; Jia, H.; Zheng, Z. In situ fabricate Cu2S thin film with hierarchical petal-like nanostructures. Mater. Res. Bull. 2013, 48, 2940–2943. [Google Scholar] [CrossRef]
- Coughlan, C.; Ibanez, M.; Dobrozhan, O.; Singh, A.; Cabot, A.; Ryan, K.M. Compound copper chalcogenide nanocrystals. Chem. Rev. 2017, 117, 5865–6109. [Google Scholar] [CrossRef]
- Ajibade, P.A.; Botha, N.L. Synthesis and structural studies of copper sulfide nanocrystals. Results Phys. 2016, 6, 581–589. [Google Scholar] [CrossRef] [Green Version]
- Dhasade, S.; Patil, J.; Han, S.; Rath, M.; Fulari, V. Copper sulfide nanorods grown at room temperature for photovoltaic application. Mater. Lett. 2013, 90, 138–141. [Google Scholar] [CrossRef]
- Ke, H.; Luo, W.; Cheng, G.; Tian, X.; Pi, Z. Synthesis of flower-like CuS nanostructured microspheres using poly (ethylene glycol) 200 as solvent. J. Nanosci. Nanotechnol. 2010, 10, 7770–7773. [Google Scholar] [CrossRef]
- Das, G.; Kakati, N.; Lee, S.H.; Karak, N.; Yoon, Y.S. Water soluble sodium sulfate nanorods as a versatile template for the designing of copper sulfide nanotubes. J. Nanosci. Nanotechnol. 2014, 14, 4455–4461. [Google Scholar] [CrossRef]
- Lim, W.P.; Wong, C.T.; Ang, S.L.; Low, H.Y.; Chin, W.S. Phase-selective synthesis of copper sulfide nanocrystals. Chem. Mater. 2006, 18, 6170–6177. [Google Scholar] [CrossRef]
- Du, W.; Qian, X.; Ma, X.; Gong, Q.; Cao, H.; Yin, J. Shape-Controlled Synthesis and Self-Assembly of Hexagonal Covellite (CuS) Nanoplatelets. Chem. A Eur. J. 2007, 13, 3241–3247. [Google Scholar] [CrossRef] [PubMed]
- Zhang, P.; Gao, L. Copper sulfide flakes and nanodisks. J. Mater. Chem. 2003, 13, 2007–2010. [Google Scholar] [CrossRef]
- Du, Y.; Yin, Z.; Zhu, J.; Huang, X.; Wu, X.-J.; Zeng, Z.; Yan, Q.; Zhang, H. A general method for the large-scale synthesis of uniform ultrathin metal sulphide nanocrystals. Nat. Commun. 2012, 3, 1177. [Google Scholar] [CrossRef] [Green Version]
- Zhu, H.; Ji, X.; Yang, D.; Ji, Y.; Zhang, H. Novel CuS hollow spheres fabricated by a novel hydrothermal method. Microporous Mesoporous Mater. 2005, 80, 153–156. [Google Scholar] [CrossRef]
- Wu, S.; Hu, H.; Lin, Y.; Zhang, J.; Hu, Y.H. Visible light photocatalytic degradation of tetracycline over TiO2. Chem. Eng. J. 2020, 382, 122842. [Google Scholar] [CrossRef]
- Leng, Y.; Bao, J.; Xiao, H.; Song, D.; Du, J.; Mohapatra, S.; Werner, D.; Wang, J. Transformation mechanisms of tetracycline by horseradish peroxidase with/without redox mediator ABTS for variable water chemistry. Chemosphere 2020, 258, 127306. [Google Scholar] [CrossRef] [PubMed]
- Rizzi, V.; Lacalamita, D.; Gubitosa, J.; Fini, P.; Petrella, A.; Romita, R.; Agostiano, A.; Gabaldón, J.A.; Fortea Gorbe, M.I.; Gómez-Morte, T.; et al. Removal of tetracycline from polluted water by chitosan-olive pomace adsorbing films. Sci. Total Environ. 2019, 693, 133620. [Google Scholar] [CrossRef]
- Zhang, Z.; Ding, C.; Li, Y.; Ke, H.; Cheng, G. Efficient removal of tetracycline hydrochloride from aqueous solution by mesoporous cage MOF-818. SN Appl. Sci. 2020, 2, 669. [Google Scholar] [CrossRef] [Green Version]
- Wu, K.; Zhang, C.; Liu, T.; Lei, H.; Yang, S.; Jin, P. The removal of tetracycline, oxytetracycline, and chlortetracycline by manganese oxide-doped copper oxide: The behaviors and insights of Cu-Mn combination for enhancing antibiotics removal. Environ. Sci. Pollut. Res. Int. 2020, 27, 12613–12623. [Google Scholar] [CrossRef]
- Smilack, J.D. The tetracyclines. Mayo Clin. Proc. 1999, 74, 727–729. [Google Scholar] [CrossRef]
- Græsbøll, K.; Larsen, I.; Clasen, J.; Birkegård, A.C.; Nielsen, J.P.; Christiansen, L.E.; Olsen, J.E.; Angen, Ø.; Folkesson, A. Effect of tetracycline treatment regimens on antibiotic resistance gene selection over time in nursery pigs. BMC Microbiol. 2019, 19, 269. [Google Scholar] [CrossRef] [Green Version]
- Garrett, J.P.D.; Margolis, D.J. Impact of Long-Term Antibiotic Use for Acne on Bacterial Ecology and Health Outcomes: A Review of Observational Studies. Curr. Dermatol. Rep. 2012, 1, 23–28. [Google Scholar] [CrossRef] [Green Version]
- Miao, J.; Wang, F.; Chen, Y.; Zhu, Y.; Zhou, Y.; Zhang, S. The adsorption performance of tetracyclines on magnetic graphene oxide: A novel antibiotics absorbent. Appl. Surf. Sci. 2019, 475, 549–558. [Google Scholar] [CrossRef]
- Gao, Y.; Li, Y.; Zhang, L.; Huang, H.; Hu, J.; Shah, S.M.; Su, X. Adsorption and removal of tetracycline antibiotics from aqueous solution by graphene oxide. J. Colloid Interface Sci. 2012, 368, 540–546. [Google Scholar] [CrossRef] [PubMed]
- Zhao, C.; Yin, W.; Xu, J.; Zhang, Y.; Shang, D.; Guo, Z.; Wang, Q.; Wang, J.; Kong, Q. Removal of Tetracycline from Water Using Activated Carbon Derived from the Mixture of Phragmites australis and Waterworks Sludge. ACS Omega 2020, 5, 16045–16052. [Google Scholar] [CrossRef]
- Saitoh, T.; Shibata, K.; Fujimori, K.; Ohtani, Y. Rapid removal of tetracycline antibiotics from water by coagulation-flotation of sodium dodecyl sulfate and poly (allylamine hydrochloride) in the presence of Al (III) ions. Sep. Purif. Technol. 2017, 187, 76–83. [Google Scholar] [CrossRef]
- Jeong, J.; Song, W.; Cooper, W.J.; Jung, J.; Greaves, J. Degradation of tetracycline antibiotics: Mechanisms and kinetic studies for advanced oxidation/reduction processes. Chemosphere 2010, 78, 533–540. [Google Scholar] [CrossRef] [PubMed]
- Guo, J.; Jiang, L.; Liang, J.; Xu, W.; Yu, H.; Zhang, J.; Ye, S.; Xing, W.; Yuan, X. Photocatalytic degradation of tetracycline antibiotics using delafossite silver ferrite-based Z-scheme photocatalyst: Pathways and mechanism insight. Chemosphere 2021, 270, 128651. [Google Scholar] [CrossRef]
- Vu, T.H.; Ngo, T.M.V.; Duong, T.T.A.; Nguyen, T.H.L.; Mai, X.T.; Pham, T.H.N.; Le, T.P.; Tran, T.H. Removal of Tetracycline from Aqueous Solution Using Nanocomposite Based on Polyanion-Modified Laterite Material. J. Anal. Methods Chem. 2020, 2020, 6623511. [Google Scholar] [CrossRef]
- Ji, H.; Cao, J.; Feng, J.; Chang, X.; Ma, X.; Liu, J.; Zheng, M. Fabrication of CuS nanocrystals with various morphologies in the presence of a nonionic surfactant. Mater. Lett. 2005, 59, 3169–3172. [Google Scholar] [CrossRef]
- Rajendran, V.; Gajendiran, J. Nonionic surfactant poly (ethane 1, 2-diol)-400 assisted solvothermal synthesis of copper monosulfide (CuS) nanoplates and their structural, topographical, optical and luminescent properties. Mater. Sci. Semicond. Process. 2015, 36, 92–95. [Google Scholar] [CrossRef]
- Yadav, S.; Bajpai, P.K. Synthesis of copper sulfide nanoparticles: pH dependent phase stabilization. Nano Struct. Nano Objects 2017, 10, 151–158. [Google Scholar] [CrossRef]
- Leidinger, P.; Popescu, R.; Gerthsen, D.; Lünsdorf, H.; Feldmann, C. Nanoscale copper sulfide hollow spheres with phase-engineered composition: Covellite (CuS), digenite (Cu1.8S), chalcocite (Cu2S). Nanoscale 2011, 3, 2544–2551. [Google Scholar] [CrossRef] [PubMed]
- Sithole, R.K.; Machogo, L.F.E.; Moloto, M.J.; Gqoba, S.S.; Mubiayi, K.P.; Van Wyk, J.; Moloto, N. One-step synthesis of Cu3N, Cu2S and Cu9S5 and photocatalytic degradation of methyl orange and methylene blue. J. Photochem. Photobiol. A Chem. 2020, 397, 112577. [Google Scholar] [CrossRef]
- Olalekan, O.C.; Onwudiwe, D.C. Temperature controlled evolution of pure phase Cu9S5 nanoparticles by solvothermal process. Front. Mater. 2021, 7562. [Google Scholar] [CrossRef]
- Yadav, S.; Shrivas, K.; Bajpai, P. Role of precursors in controlling the size, shape and morphology in the synthesis of copper sulfide nanoparticles and their application for fluorescence detection. J. Alloys Compd. 2019, 772, 579–592. [Google Scholar] [CrossRef]
- Iqbal, S.; Shaid, N.A.; Sajid, M.M.; Javed, Y.; Fakhar-e-Alam, M.; Mahmood, A.; Ahmad, G.; Afzal, A.M.; Hussain, S.Z.; Ali, F. Extensive evaluation of changes in structural, chemical and thermal properties of copper sulfide nanoparticles at different calcination temperature. J. Cryst. Growth 2020, 547, 125823. [Google Scholar] [CrossRef]
- Tao, F.; Zhang, Y.; Zhang, F.; An, Y.; Dong, L.; Yin, Y. Structural evolution from CuS nanoflowers to Cu9S5 nanosheets and their applications in environmental pollution removal and photothermal conversion. RSC Adv. 2016, 6, 63820–63826. [Google Scholar] [CrossRef]
- Hosseinpour, Z.; Alemi, A.; Khandar, A.A.; Zhao, X.; Xie, Y. A controlled solvothermal synthesis of CuS hierarchical structures and their natural-light-induced photocatalytic properties. New J. Chem. 2015, 39, 5470–5476. [Google Scholar] [CrossRef]
- Zhao, Y.; Pan, H.; Lou, Y.; Qiu, X.; Zhu, J.; Burda, C. Plasmonic Cu2−xS nanocrystals: Optical and structural properties of copper-deficient copper (I) sulfides. J. Am. Chem. Soc. 2009, 131, 4253–4261. [Google Scholar] [CrossRef]
- Jiang, J.; Jiang, Q.; Deng, R.; Xie, X.; Meng, J. Controllable preparation, formation mechanism and photocatalytic performance of copper base sulfide nanoparticles. Mater. Chem. Phys. 2020, 254, 123504. [Google Scholar] [CrossRef]
- Tauc, J. Optical properties and electronic structure of amorphous Ge and Si. Mater. Res. Bull. 1968, 3, 37–46. [Google Scholar] [CrossRef]
- Kundu, J.; Pradhan, D. Controlled synthesis and catalytic activity of copper sulfide nanostructured assemblies with different morphologies. ACS Appl. Mater. Interfaces 2014, 6, 1823–1834. [Google Scholar] [CrossRef]
- Cruz, J.S.; Hernández, S.M.; Delgado, F.P.; Angel, O.Z.; Pérez, R.C.; Delgado, G.T. Optical and electrical properties of thin films of CuS nanodisks ensembles annealed in a vacuum and their photocatalytic activity. Int. J. Photoenergy 2013, 2013, 178017. [Google Scholar]
- Senthilkumar, M.; Babu, S.M. Crystal structure controlled synthesis and characterization of copper sulfide nanoparticles. Proc. AIP Conf. 2016, 050131. [Google Scholar] [CrossRef]
- Shi, J.; Zhou, X.; Liu, Y.; Su, Q.; Zhang, J.; Du, G. Sonochemical synthesis of CuS/reduced graphene oxide nanocomposites with enhanced absorption and photocatalytic performance. Mater. Lett. 2014, 126, 220–223. [Google Scholar] [CrossRef]
- Jiang, X.; Xie, Y.; Lu, J.; He, W.; Zhu, L.; Qian, Y. Preparation and phase transformation of nanocrystalline copper sulfides (Cu9S8, Cu7S4 and CuS) at low temperature. J. Mater. Chem. 2000, 10, 2193–2196. [Google Scholar] [CrossRef]
- Sreelekha, N.; Subramanyam, K.; Reddy, D.A.; Murali, G.; Ramu, S.; Varma, K.R.; Vijayalakshmi, R. Structural, optical, magnetic and photocatalytic properties of Co doped CuS diluted magnetic semiconductor nanoparticles. Appl. Surf. Sci. 2016, 378, 330–340. [Google Scholar] [CrossRef]
- Kalyanikutty, K.; Nikhila, M.; Maitra, U.; Rao, C.N.R. Hydrogel-assisted synthesis of nanotubes and nanorods of CdS, ZnS and CuS, showing some evidence for oriented attachment. Chem. Phys. Lett. 2006, 432, 190–194. [Google Scholar] [CrossRef]
- Wang, X.-y.; Fang, Z.; Lin, X. Copper sulfide nanotubes: Facile, large-scale synthesis, and application in photodegradation. J. Nanoparticle Res. 2009, 11, 731–736. [Google Scholar] [CrossRef]
- Zhang, F.; Wong, S.S. Controlled synthesis of semiconducting metal sulfide nanowires. Chem. Mater. 2009, 21, 4541–4554. [Google Scholar] [CrossRef]
- Wessels, J.; Ford, W.; Szymczak, W.; Schneider, S. The complexation of tetracycline and anhydrotetracycline with Mg2+ and Ca2+: A spectroscopic study. J. Phys. Chem. B 1998, 102, 9323–9331. [Google Scholar] [CrossRef]
- Jin, L.; Amaya-Mazo, X.; Apel, M.E.; Sankisa, S.S.; Johnson, E.; Zbyszynska, M.A.; Han, A. Ca2+ and Mg2+ bind tetracycline with distinct stoichiometries and linked deprotonation. Biophys. Chem. 2007, 128, 185–196. [Google Scholar] [CrossRef] [PubMed]
- Figueroa, R.A.; Leonard, A.; MacKay, A.A. Modeling tetracycline antibiotic sorption to clays. Environ. Sci. Technol. 2004, 38, 476–483. [Google Scholar] [CrossRef] [PubMed]
- Boreen, A.L.; Arnold, W.A.; McNeill, K. Photochemical fate of sulfa drugs in the aquatic environment: Sulfa drugs containing five-membered heterocyclic groups. Environ. Sci. Technol. 2004, 38, 3933–3940. [Google Scholar] [CrossRef] [PubMed]
- Jiao, S.; Zheng, S.; Yin, D.; Wang, L.; Chen, L. Aqueous photolysis of tetracycline and toxicity of photolytic products to luminescent bacteria. Chemosphere 2008, 73, 377–382. [Google Scholar] [CrossRef]
- Yu, X.; He, J.; Zhang, Y.; Hu, J.; Chen, F.; Wang, Y.; He, G.; Liu, J.; He, Q. Effective photodegradation of tetracycline by narrow-energy band gap photocatalysts La2−xSrxNiMnO6 (x = 0, 0.05, 0.10, and 0.125). J. Alloys Compd. 2019, 806, 451–463. [Google Scholar] [CrossRef]
- Yousaf, M.; Minallah, S.; Niazi, M.; Pervaiz, E.; Yang, M.; Liu, H. Ternary adsorbent photocatalyst hybrid (APH) nanomaterials for improved abstraction of tetracycline from water. Sep. Sci. Technol. 2019, 54. [Google Scholar] [CrossRef]
- Lou, Y.; Chen, X.; Samia, A.C.; Burda, C. Femtosecond Spectroscopic Investigation of the Carrier Lifetimes in Digenite Quantum Dots and Discrimination of the Electron and Hole Dynamics via Ultrafast Interfacial Electron Transfer. J. Phys. Chem. B 2003, 107, 12431–12437. [Google Scholar] [CrossRef]
- Nagamine, M.; Osial, M.; Jackowska, K.; Krysinski, P.; Widera-Kalinowska, J. Tetracycline Photocatalytic Degradation under CdS Treatment. J. Mar. Sci. Eng. 2020, 8, 483. [Google Scholar] [CrossRef]
- Sathiyaraj, E.; Thirumaran, S.; Ciattini, S.; Selvanayagam, S. Synthesis and characterization of Ni (II) complexes with functionalized dithiocarbamates: New single source precursors for nickel sulfide and nickel-iron sulfide nanoparticles. Inorg. Chim. Acta 2019, 498, 119162. [Google Scholar] [CrossRef]
Figure 1.
XRD patterns of (a) pure covellite, (b) pure digenite, and (c) mixed phases of copper sulfide (# Cu9S5, * Cu7.2S4, and + Cu2S) nanoparticles obtained from the thermolysis of the copper(II) dithiocarbamate complex.
Figure 1.
XRD patterns of (a) pure covellite, (b) pure digenite, and (c) mixed phases of copper sulfide (# Cu9S5, * Cu7.2S4, and + Cu2S) nanoparticles obtained from the thermolysis of the copper(II) dithiocarbamate complex.

Figure 2.
(a,b) SEM and (c,d) EDX of covellite (CuS) and digenite (Cu9S5) nanoparticles, respectively.
Figure 2.
(a,b) SEM and (c,d) EDX of covellite (CuS) and digenite (Cu9S5) nanoparticles, respectively.

Figure 3.
(a) TEM micrographs of covellite (CuS) and (b) digenite (Cu9S5); particle size distribution histograms of (c) covellite and (d,e) digenite nanoparticles.
Figure 3.
(a) TEM micrographs of covellite (CuS) and (b) digenite (Cu9S5); particle size distribution histograms of (c) covellite and (d,e) digenite nanoparticles.

Figure 4.
(a) UV–vis–NIR spectra of covellite (CuS) and (b) digenite (Cu9S5); (c) their photoluminescence spectra.
Figure 4.
(a) UV–vis–NIR spectra of covellite (CuS) and (b) digenite (Cu9S5); (c) their photoluminescence spectra.

Figure 5.
(a) Structure and (b) absorption spectrum of tetracycline (TC).

Figure 6.
Adsorption equilibrium graph between the TC solution and the photocatalysts (digenite and covellite).
Figure 6.
Adsorption equilibrium graph between the TC solution and the photocatalysts (digenite and covellite).

Figure 7.
Photocatalytic degradation of tetracycline under visible-light irradiation using the (a) digenite and (b) covellite phases of copper sulfide.
Figure 7.
Photocatalytic degradation of tetracycline under visible-light irradiation using the (a) digenite and (b) covellite phases of copper sulfide.

Figure 8.
The effect of catalyst loading on the photoreduction of TC on (a) digenite and (b) covellite.
Figure 8.
The effect of catalyst loading on the photoreduction of TC on (a) digenite and (b) covellite.


Scheme 1.
Preparation of the copper(II) bis(N-4-methylbenzyl)-N-(4-ethylphenyl) dithiocarbamate complex.
Scheme 1.
Preparation of the copper(II) bis(N-4-methylbenzyl)-N-(4-ethylphenyl) dithiocarbamate complex.

Publisher’s Note: MDPI stays neutral with regard to jurisdictional claims in published maps and institutional affiliations. |
© 2021 by the authors. Licensee MDPI, Basel, Switzerland. This article is an open access article distributed under the terms and conditions of the Creative Commons Attribution (CC BY) license (https://creativecommons.org/licenses/by/4.0/).
Share and Cite
MDPI and ACS Style
Ravele, M.P.; Oyewo, O.A.; Onwudiwe, D.C. Controlled Synthesis of CuS and Cu9S5 and Their Application in the Photocatalytic Mineralization of Tetracycline. Catalysts 2021, 11, 899. https://0-doi-org.brum.beds.ac.uk/10.3390/catal11080899
AMA Style
Ravele MP, Oyewo OA, Onwudiwe DC. Controlled Synthesis of CuS and Cu9S5 and Their Application in the Photocatalytic Mineralization of Tetracycline. Catalysts. 2021; 11(8):899. https://0-doi-org.brum.beds.ac.uk/10.3390/catal11080899
Chicago/Turabian StyleRavele, Murendeni P., Opeyemi A. Oyewo, and Damian C. Onwudiwe. 2021. "Controlled Synthesis of CuS and Cu9S5 and Their Application in the Photocatalytic Mineralization of Tetracycline" Catalysts 11, no. 8: 899. https://0-doi-org.brum.beds.ac.uk/10.3390/catal11080899
Note that from the first issue of 2016, this journal uses article numbers instead of page numbers. See further details here.