Article

Post-Plasma Catalysis for Trichloroethylene Abatement with Ce-Doped Birnessite Downstream DC Corona Discharge Reactor

1
Univ. Lille, CNRS, Centrale Lille, Univ. Artois, UMR 8181-UCCS-Unité de Catalyse et Chimie du Solide, F-59000 Lille, France
2
Research Unit Plasma Technology (RUPT), Department of Applied Physics, Faculty of Engineering and Architecture, Ghent University, Sint-Pietersnieuwstraat 41 (B4), 9000 Ghent, Belgium
*
Author to whom correspondence should be addressed.
Submission received: 19 July 2021 / Revised: 3 August 2021 / Accepted: 3 August 2021 / Published: 5 August 2021

Abstract

:
Trichloroethylene (TCE) removal was investigated in a post-plasma catalysis (PPC) configuration in nearly dry air (RH = 0.7%) and moist air (RH = 15%), using, for non-thermal plasma (NTP), a 10-pin-to-plate negative DC corona discharge and, for PPC, Ce0.01Mn as a catalyst, calcined at 400 °C (Ce0.01Mn-400) or treated with nitric acid (Ce0.01Mn-AT). One of the key points was to take advantage of the ozone emitted from NTP as a potential source of active oxygen species for further oxidation, at a very low temperature (100 °C), of untreated TCE and of potential gaseous hazardous by-products from the NTP. The plasma-assisted Ce0.01Mn-AT catalyst presented the best CO2 yield in dry air, with minimization of the formation of gaseous chlorinated by-products. This result was attributed to the high level of oxygen vacancies with a higher amount of Mn3+, improved specific surface area and strong surface acidity. These features also allow the promotion of ozone decomposition efficiency. Both catalysts exhibited good stability towards chlorine. Ce0.01Mn-AT tested in moist air (RH = 15%) showed good stability as a function of time, indicating good water tolerance also.

Graphical Abstract

1. Introduction

Trichloroethylene (TCE) is a chlorinated VOC commonly used in industry as a solvent and which acts as a degreaser in the semiconductor and metal industries [1,2,3]. Release of TCE into outdoor and indoor air can occur during degreasing operations and consumption of related products [2]. The International Agency for Research on Cancer (IARC) listed TCE as potentially carcinogenic (Group 2A) and a recent evaluation based on new data has proven that there is sufficient evidence to conclude that TCE is carcinogenic to humans (Group 1) [4]. Due to its adverse impacts on environmental and human health, TCE removal from waste gas streams is an issue of major concern. Conventional techniques, such as adsorption, thermal incineration or catalytic oxidation can been used for chlorinated VOC removal. However, the use of such techniques for the removal of diluted VOCs (<1000 ppmv) from waste gas is not energy-efficient [5,6,7,8,9].
In recent decades, post-plasma catalysis (PPC), resulting from the coupling of a non-thermal plasma (NTP) reactor with a catalytic reactor positioned downstream, has been recognized as an advanced oxidation process for removal of diluted VOCs from waste air [10,11]. Although NTP displays a high reactivity towards VOC removal at 20 °C, the selectivity of this process for COx (CO and CO2) is poor and hazardous gaseous by-products are formed. In the PPC configuration, catalytic reactions can take advantage of the NTP-emitted O3 as a potential source of active oxygen species, enabling further oxidation, at ambient or very low temperatures, of the NTP non-degraded parent VOC and gaseous hazardous by-products. The resulting hybrid technology therefore improves upon NTP and total oxidation catalysis in terms of selectivity, efficiency and energy cost.
The catalyst positioned after the plasma reactor should have specific characteristics, such as high efficiency in plasma-generated ozone decomposition, high oxygen mobility and high CO2 selectivity, coupled with an elevated resistance to chlorine. MnO2-based catalysts in particular have been studied for TCE removal in the PPC configuration because of their efficient ability to decompose ozone to provide surface active oxygen species for the decomposition of plasma-generated polychlorinated by-products [12,13]. However, the plasma-generated by-products are not fully decomposed into CO2 and the catalysts deactivate over time due to chlorine-induced deactivation. In order to promote the efficiency of the PPC process in terms of chlorinated VOC abatement, the catalyst efficiency should be improved.
Doping manganese oxides with Ce, such as Ce-doped todorkite [14], α-MnO2 [15], γ-MnO2 [16], MnaOx [17] and birnessite (layered MnO2) [18,19,20,21], has been found to lead to the enhancement of the catalytic performance in terms of ozone decomposition and the catalytic oxidation of various organic pollutants. Such enhancement has been explained by an improvement of the textural properties, a modification of the Mn average oxidation state and an increase of structural defects, e.g., oxygen vacancies due to the formation of crystal boundaries between MnO2 and CeO2. Furthermore, it has recently been reported [22,23] that birnessite treated with nitric acid is a good candidate for ozone decomposition, especially in the presence of water, because of the increase of material hydrophobicity. Additionally, for abatement of VOC chlorination, catalysts with strong acidity could effectively prevent the chlorination [24,25].
In this paper, TCE abatement was investigated in dry and humid air. The catalysts used in the PPC system was composed of Ce-doped birnessite (Ce0.01Mn; molar ratio Ce/Mn = 0.01) and either treated with nitric acid, which met most criteria discussed above, or calcined at 400 °C for use as a reference. In order to increase the efficiency of the NTP-assisted catalyst for TCE total oxidation, particular attention was paid to regulating the ratio of the concentration of NTP-generated ozone to that of inlet TCE. The effect of humidity towards TCE abatement in plasma alone and in the PPC process was also investigated. Finally, the performance of the plasma-assisted catalysts for TCE abatement was correlated with the physico-chemical properties of the tested catalysts.

2. Results and Discussion

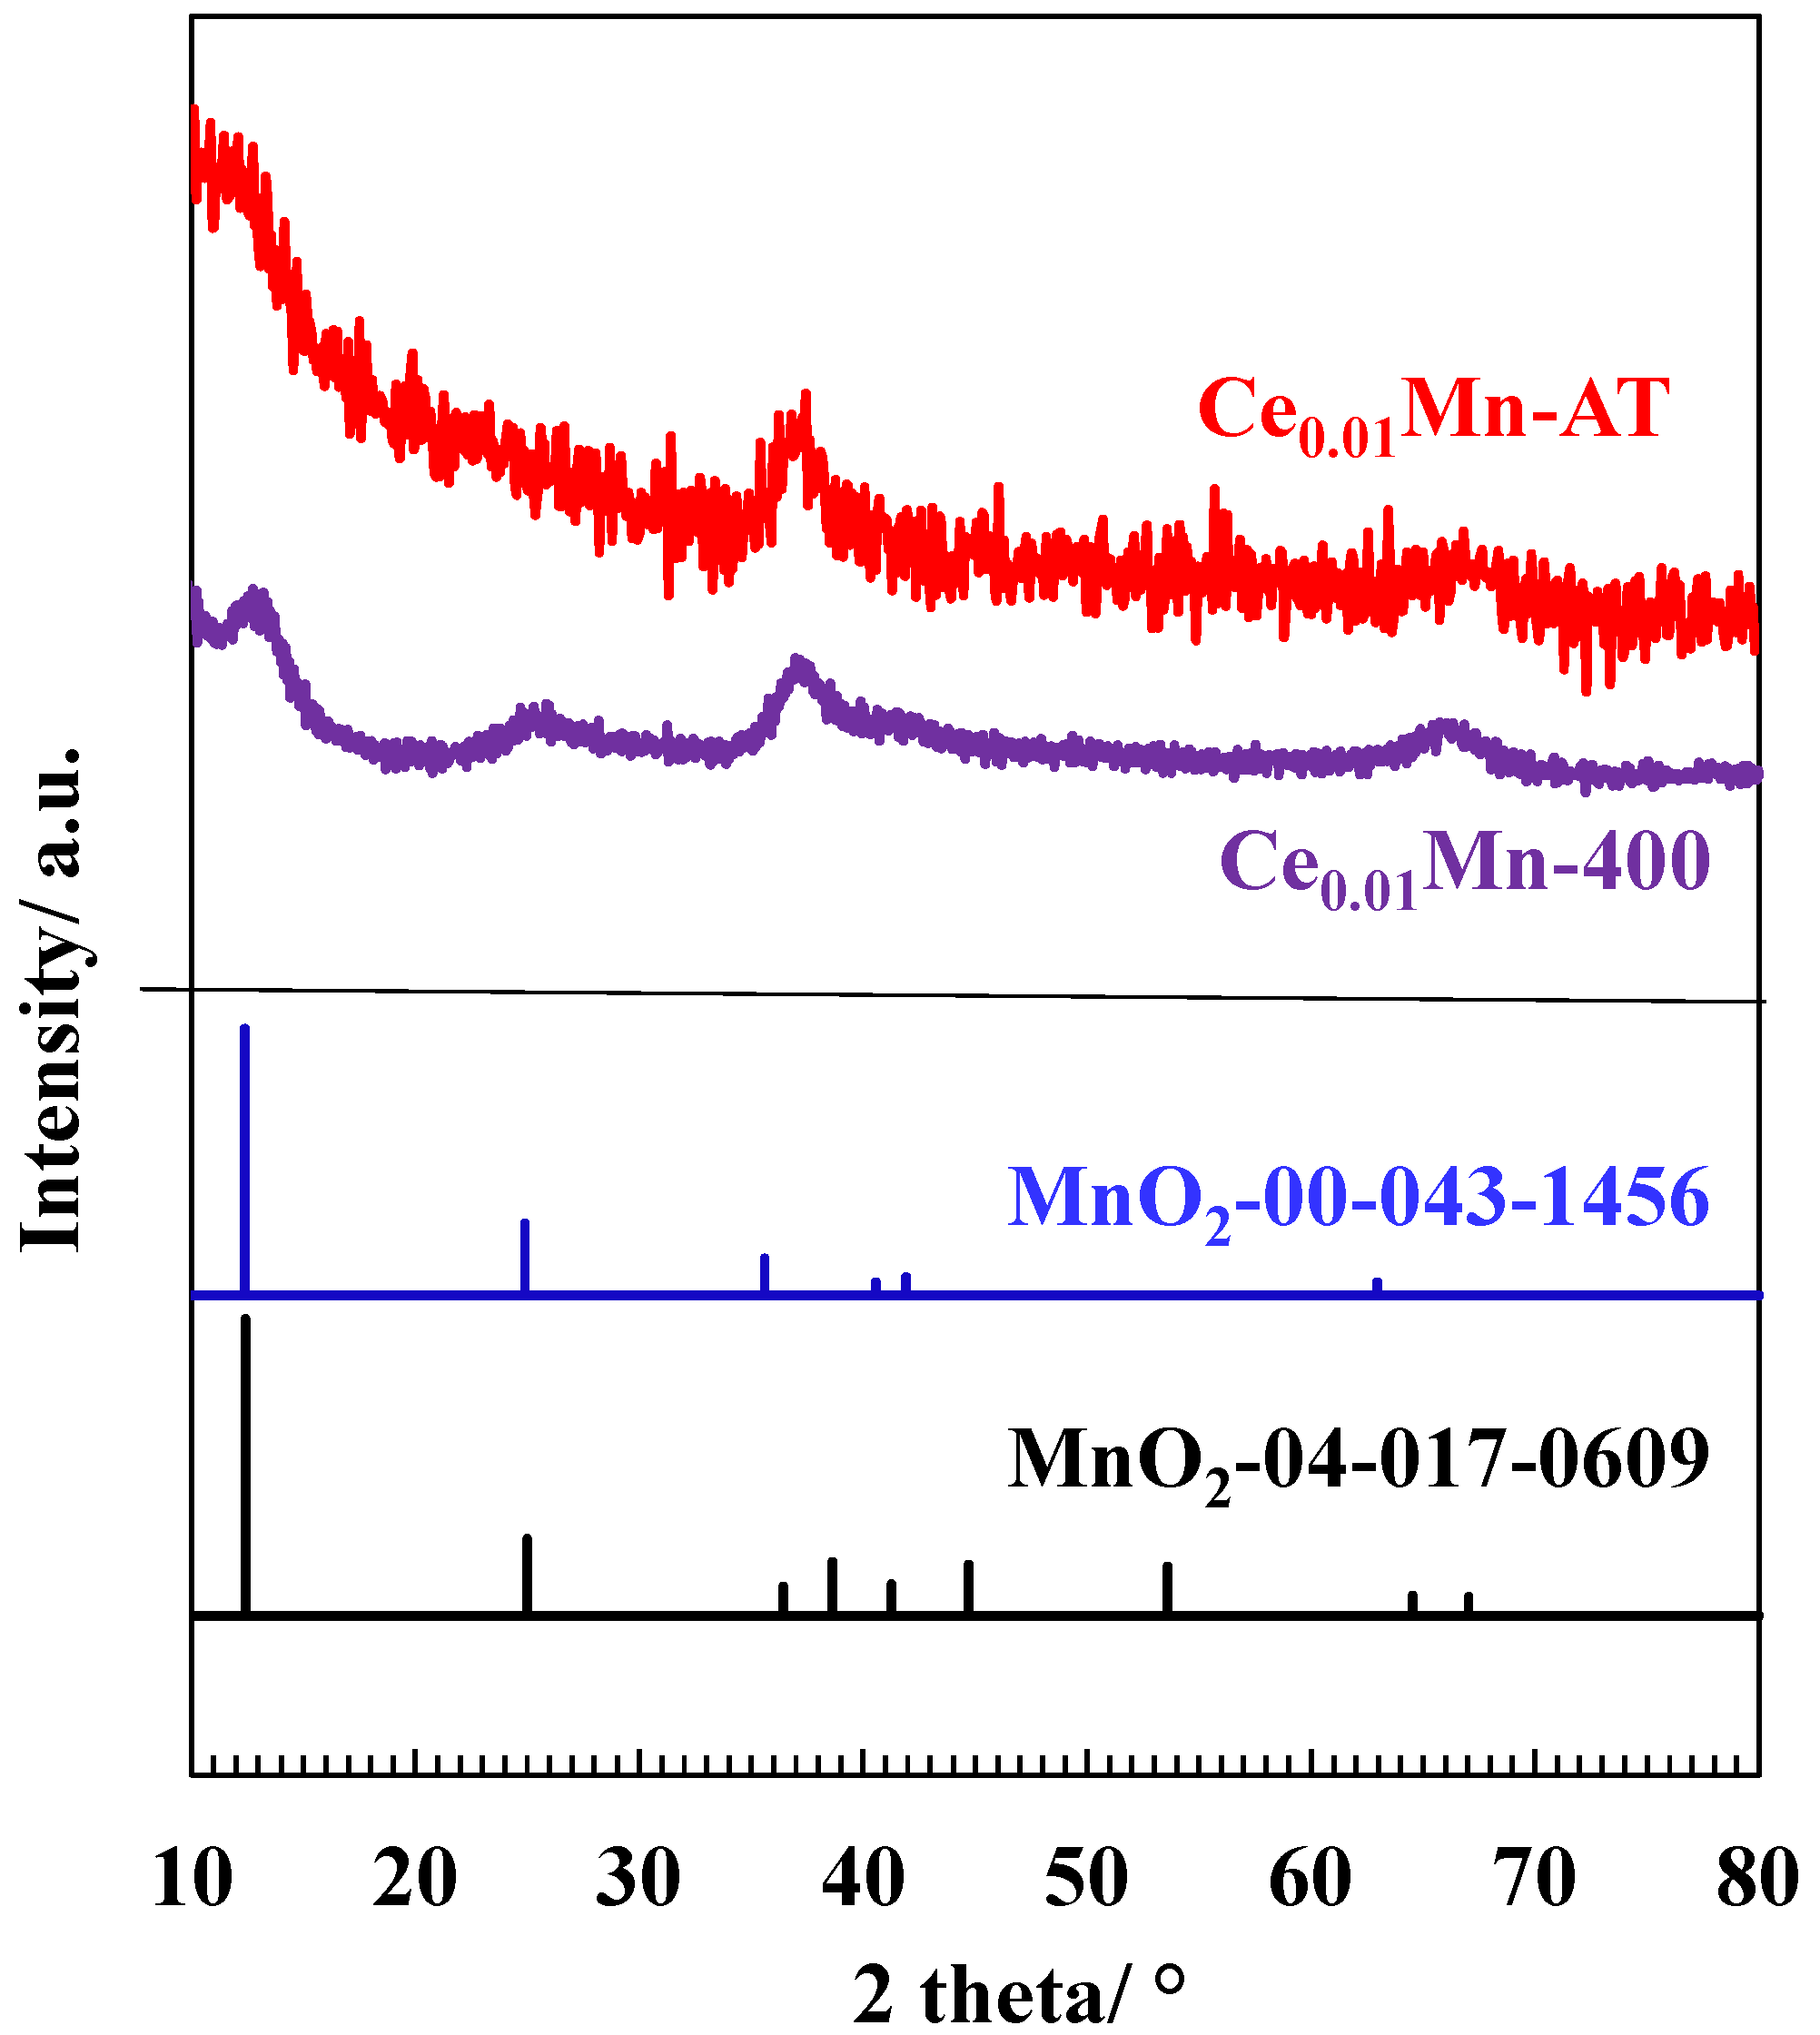
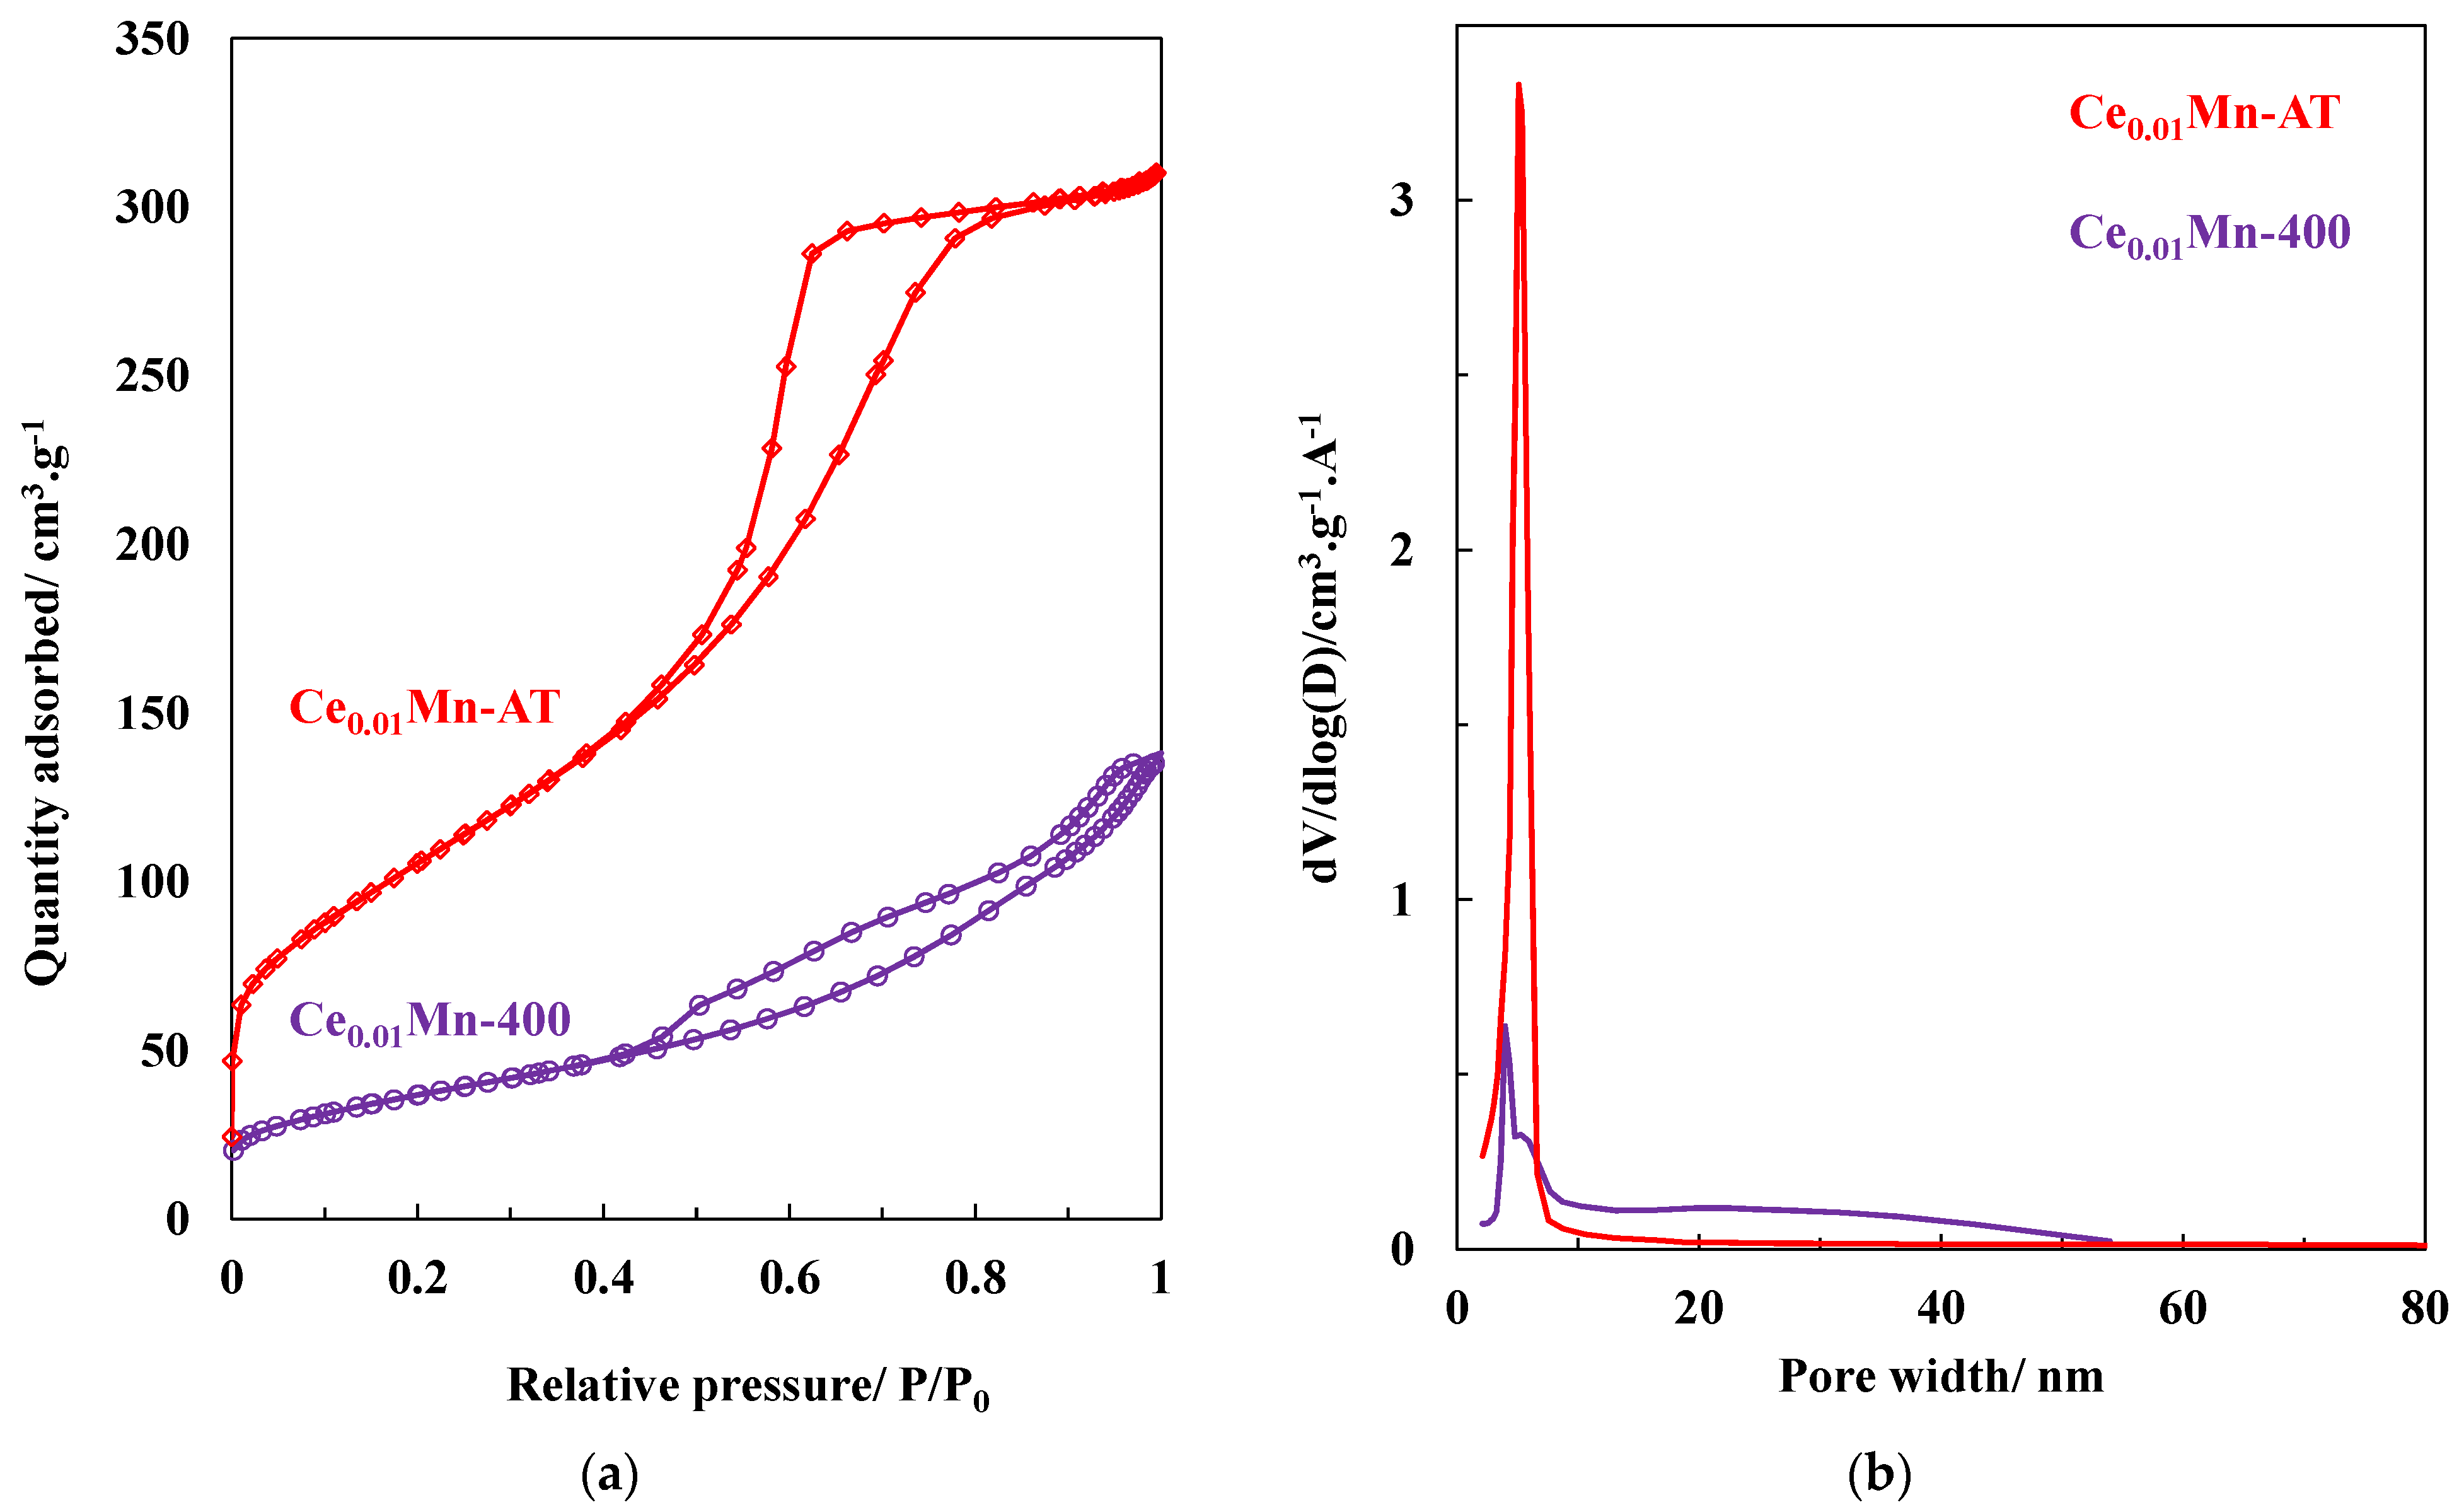
2.1. Main Physicochemical Characteristics of the Fresh Materials

The powder XRD patterns of the samples are shown in Figure 1. The Ce0.01Mn-400 sample was poorly crystallized and exhibited four broad peaks centered at 12.2° (001), 24.5° (002), 37.0° (110) and 66.2° (110), which are characteristics of a turbostratic birnessite structure [26]. The XRD pattern of the Ce0.01Mn-AT sample was ill-defined and presented diffraction peaks centered at 37.0° and 66.2°. However, the two diffraction peaks (001) and (002) were no more visible in the powder XRD pattern of the Ce0.01Mn-AT sample. This could have been related to the diminution of the number of layers stacked in the crystal after the acidic treatment. Indeed, when the coherent scattering domain size decreases, the intensity of the peaks decreases and their full width at half the maximum increases [27,28].
The elemental compositions of the material after calcination and acid treatment are given in Table 1. The Ce/Mn atomic ratio for Ce0.01Mn-400 was close to the expected value (0.01) and it was slightly modified after acid treatment. After acid treatment, the Na and K contents decreased drastically; the Na/Mn as well the K/Mn ratio significantly dropped. This result can be partly explained by Na+-H+ and K+-H+ ion exchange reactions [22,23].
The N2 adsorption/desorption isotherms and the pore size distribution of the Ce0.01Mn-400 and Ce0.01Mn-AT samples are shown in Figure 2 and the data obtained from these isotherms—the BET surface area (SBET), pore diameter (Dp) and total pore volume (Vp)—are shown in Table 2. The two samples exhibited type IV isotherms, which are given by mesoporous materials. However, the two physisorption hysteresis loops appeared in different shapes. The Ce0.01Mn-400 sample presented an H3 loop while Ce0.01Mn-AT presented an H2 loop. This change in hysteresis loop from H3 to H2 can be ascribed to the change in pore shape [29] caused by the acid treatment. Both the surface area and total pore volume were significantly increased after acid treatment. Such modification of textural properties can be explained by the H+ exchange during the acid treatment, which can destabilize the layered structure.
The change in surface acidity was evaluated using pyridine as an infrared probe molecule for the dried Ce0.01Mn-and Ce0.01Mn-AT samples. FTIR spectra of the pyridine region obtained after pyridine adsorption at 150 °C for the dried Ce0.01Mn and Ce0.01Mn-AT samples are shown in Figure 3. The interaction of pyridine with dried Ce0.01Mn led to a spectrum with large bands. A narrower band can be observed at 1540 cm−1, which can be assigned to the formation of pyridinium ions resulting from pyridine protonation on Brønsted acid sites. The interaction of pyridine with Ce0.01Mn-AT gave rise to a set of several bands: (i) two bands at 1540 and 1635 cm−1, associated with pyridinium ions resulting from pyridine protonation on Brønsted acid sites; (ii) two bands at 1450 and 1610 cm−1, attributed to pyridine coordinated with Lewis acid sites; and (iii) overlapping bands of pyridine on Lewis and Brønsted acid sites at 1487 cm−1 [22,30,31,32,33]. Moreover, the band at 1573 cm−1 can be attributed to the pyridine physisorption (P) [20], while the band at 1471 cm−1 could have resulted from the interaction between the adsorbed pyridine and manganese oxides [34]. Mn3+ and Mn4+ species, as coordinatively unsaturated metal atoms which can accept an electron pair, can be considered as Lewis acid sites, while the hydroxyl groups attached to the metal oxides (Mn-OH) can be identified as Brønsted acid sites [35].
The surface speciation of manganese species in both samples was assessed by analyzing the 2p photopeak of Mn. The Mn 2p3/2 signal was decomposed by considering a mixture of Mn (III) and Mn (IV), as shown in Figure 4 [36]. The obtained Mn3+/Mn4+ ratio was higher for the acid-treated sample (0.38) compared to the calcined one (0.34). In addition to curve-fitting of the Mn 2p3/2 signal, the Mn 3s photopeak can also provide useful insight into the Mn average oxidation state (Mn AOS) [37,38]. Indeed, the Mn 3s photopeak is split into two signals and the value of the splitting is an indication of the average oxidation state of Mn. The Mn AOS values calculated from the Mn 3s splitting were 3.32 and 3.44 for the Ce0.01Mn-400 and Ce0.01Mn-AT samples, respectively. These results agree with the aforementioned Mn3+/Mn4+ ratio. As expected, the acid treatment generated additional oxygen vacancies to maintain electronic balance, and more Mn3+ species were present at the surface of the Ce0.01Mn-AT sample [23,39].
It should be noted, however, that it was not possible to assess the proportion of Ce3+/Ce4+ in the samples due to overlap of the Ce 3d and Auger Mn LMN peaks.

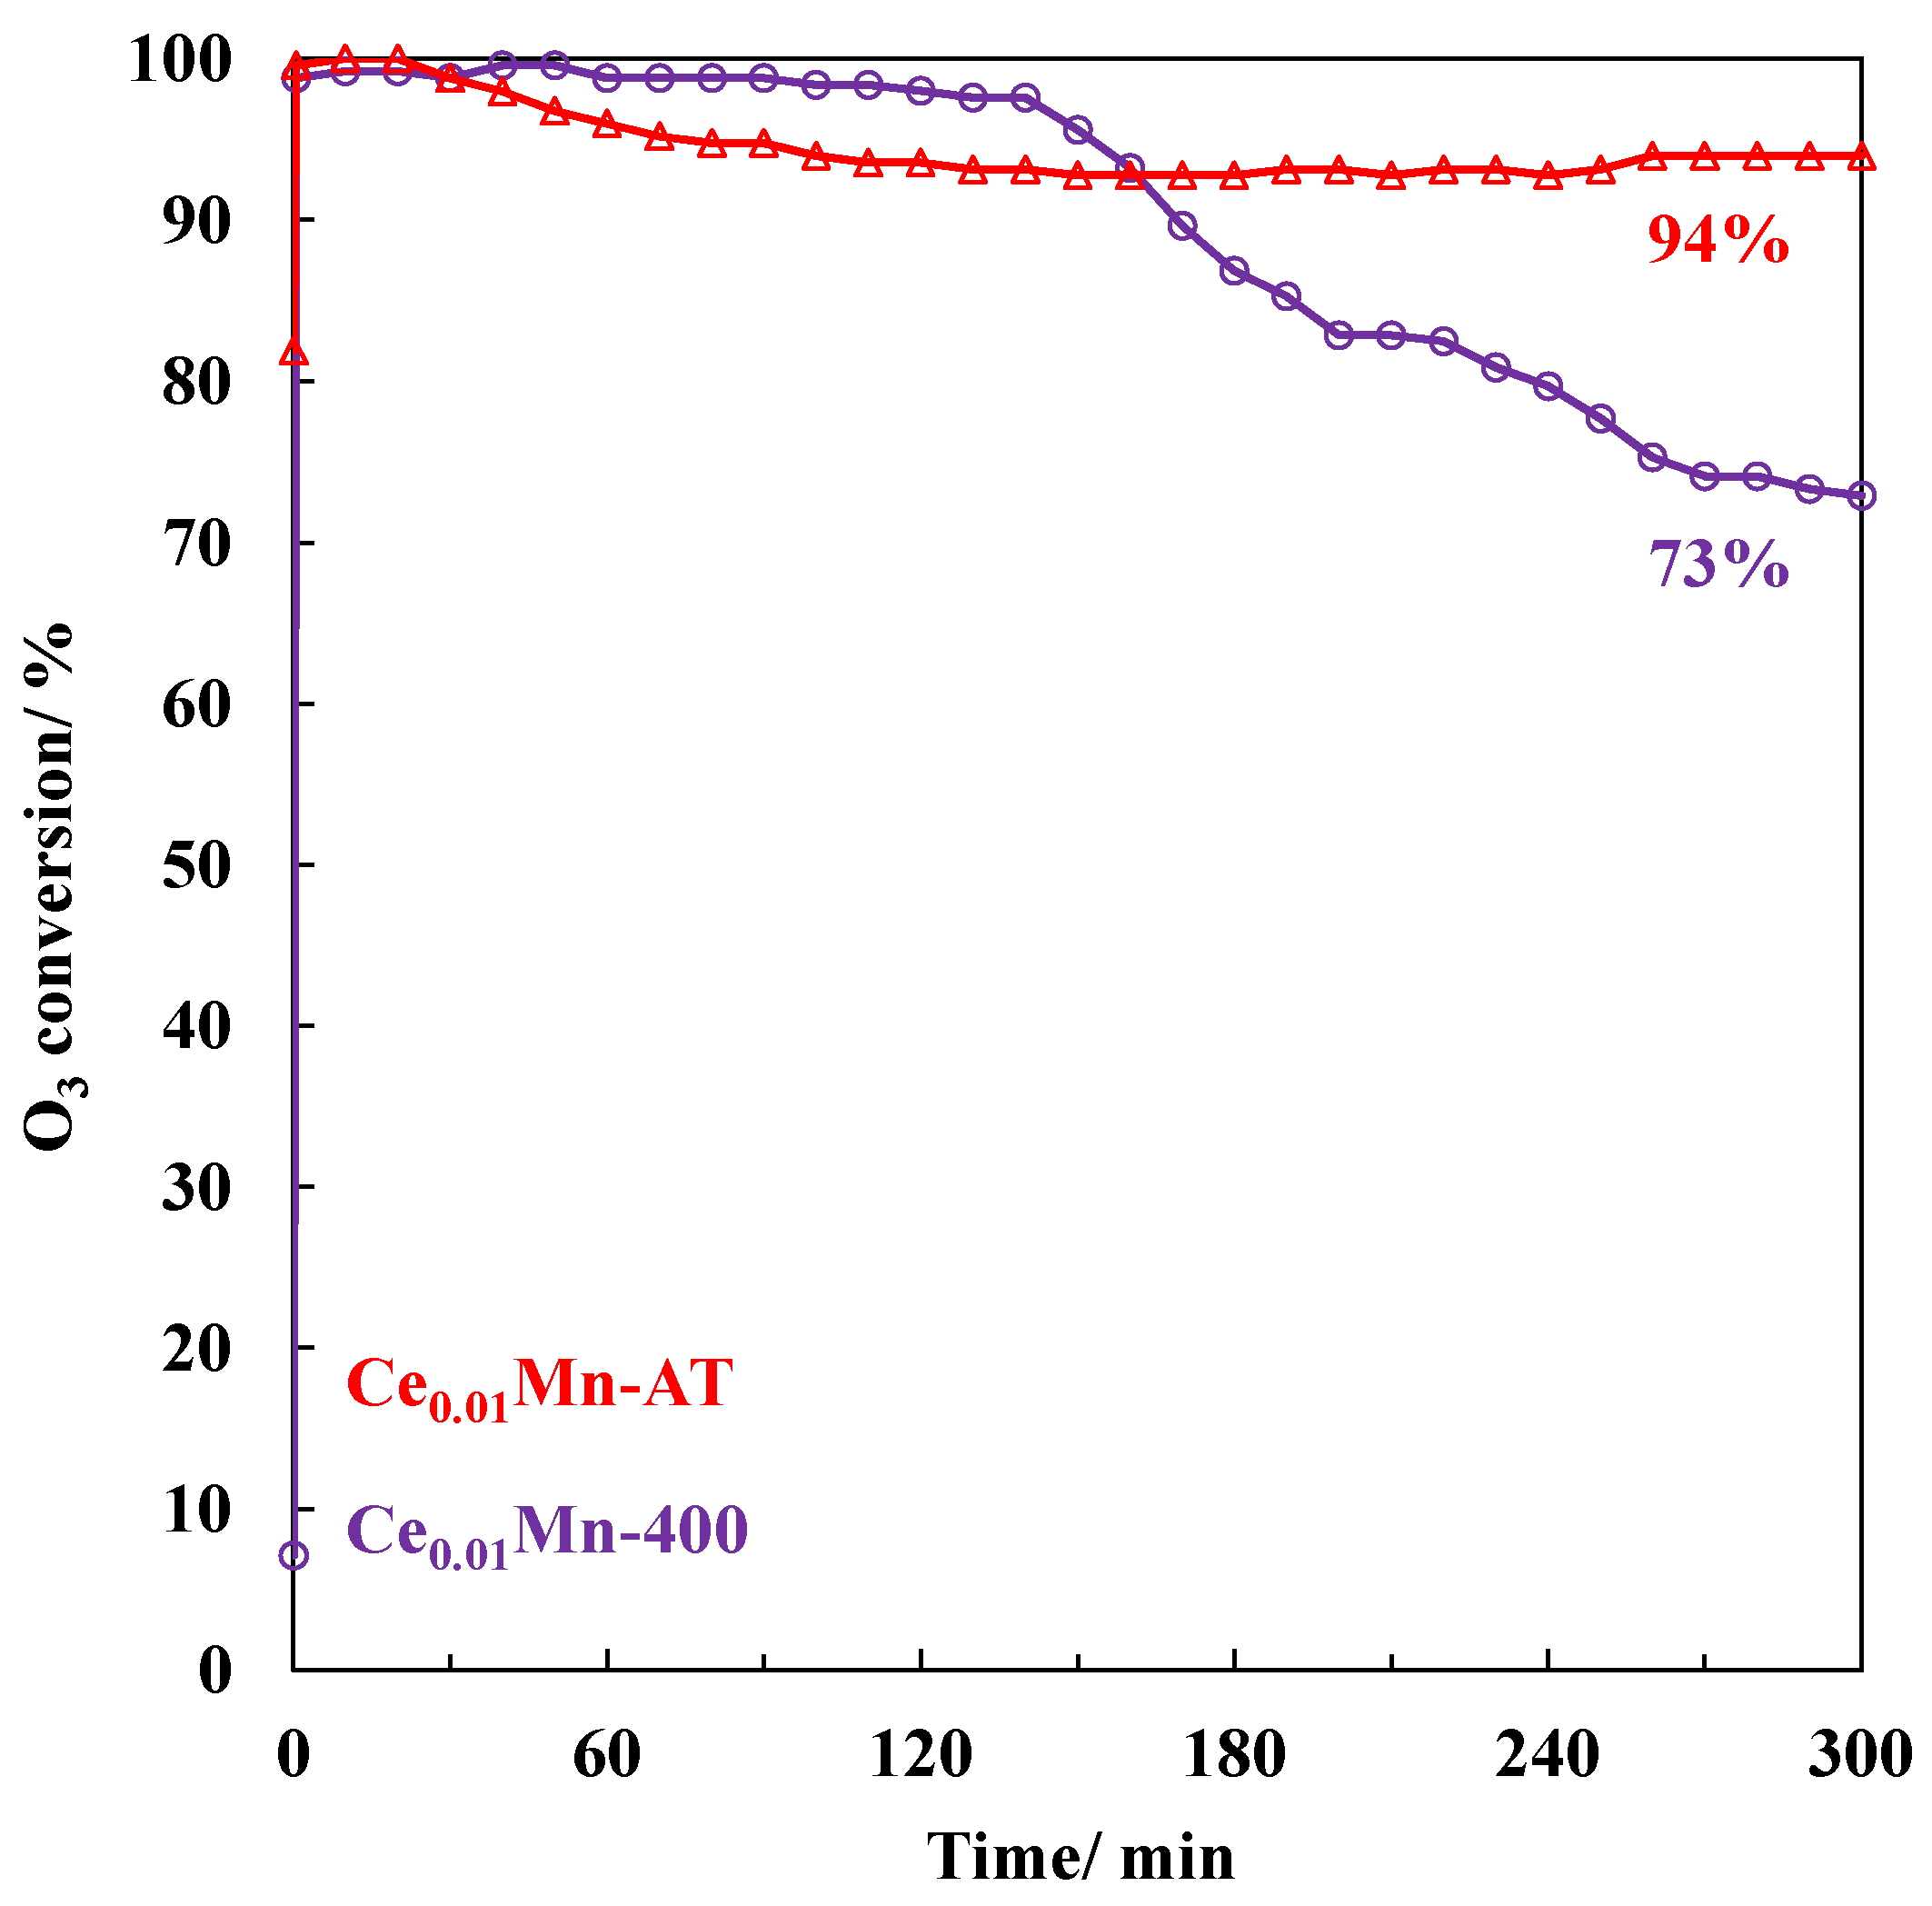
2.2. O3 Decomposition in Ce0.01Mn-400 and Ce0.01Mn-AT Samples Using Non-Thermal Plasma (NTP) as Ozoner

Figure 5 presents the ozone decomposition at room temperature as a function of time with Ce0.01Mn-400 and Ce0.01Mn-AT catalysts. Ce0.01Mn-400 maintained high ozone conversion (>97%) for 140 min but then showed a gradual decrease in ozone conversion to 73% after 5 h. Ce0.01Mn-AT exhibited different behavior, with a low decrease in ozone conversion after 30 min of testing from 100% to 94% after 120 min. Thereafter, Ce0.01Mn-AT was able to maintain this high conversion over time. It has been reported previously that oxygen vacancies play a key role in ozone decomposition in manganese oxides. Therefore, the better catalytic performance of Ce0.01Mn-AT compared to that of Ce0.01Mn-400 was consistent with its more abundant oxygen vacancies, which were in accordance with the larger amount of surface Mn3+ species (XPS). This result confirms the important role of oxygen vacancies in catalytic ozone decomposition, as reported in the literature [40,41,42,43]. In addition, the larger specific surface area of Ce0.01Mn-AT may contribute to a wider surface exposure of oxygen vacancies. This could explain the high ozone conversion maintained in the presence of Ce0.01Mn-AT alongside the avoidance of the saturation of the oxygen vacancies sites, which was probably at the origin of the deactivation observed in the presence of Ce0.01Mn-400 [44,45].

2.3. TCE Abatement by Non-Thermal Plasma (NTP)

The initial TCE concentration ([TCE]0) was set at 150 ppmv based on the O3 production through the plasma reactor. Indeed, without TCE and H2O in the feed, the ozone concentration at the exit of the plasma reactor was 600 ppmv. Thus, the [O3]/[TCE]0 ratio equal to the stoichiometric ratio for 4 O3 molecules, considering the total transformation of the initial amount of C into CO2, can be deduced as follows:
C2Cl3H + 4 O3 = 2 CO2 + 4 O2 + HCl + Cl2
Regardless of the water content in the feed, RH = 0.7% or RH = 15%, TCE molecules were not fully degraded in the NTP process, since the TCE conversion reached 85% and 59%, respectively. Moreover, O3 molecules were still present at the outlet of the plasma reactor at 315 and 190 ppmv. The fact that the lowest O3 concentration was found at the outlet of the plasma reactor for the NTP-RH15% test, despite also having the lowest obtained TCE conversion, can be ascribed to the reaction of OH radicals coming from the H2O decomposition in the plasma reactor [46,47], as these radicals can react with O3 in the plasma [48,49,50,51]. Additionally, the COx yields were 46% and 34% for the NTP TCE abatement with RHs of 0.7% and 15%, respectively (Figure 6). Interestingly, in comparison with results obtained with the same plasma discharge and plasma reactor (COx yield of 15% in humid air (RH = 15%) for ED of 120 J·L−1), the mineralization of TCE was here much higher, probably as a result of the optimized [O3]/[TCE]0 ratio of 4, instead of less than 1 as used in previous studies [12,13,52,53].
The FTIR spectra of the inlet TCE and outlet stream after NTP TCE abatement, with 0.7% and 15% as the relative humidity, are presented in Figure 7. The FTIR spectra for the inlet TCE showed the characteristic bands of TCE. The characteristics bands for TCE at 945 and 865 cm−1 were still present but their relative intensities were higher in humid air, in accordance with the lowest TCE conversion discussed above. Furthermore, (oxi-)chlorinated by-products, such as dichloroacetchloride (DCAC; IR bands at 740, 989, 1076, 1055 (overlap with O3) and 1773 cm−1), phosgene (PG; IR bands at 852 (overlap with TCE) and 1827 cm−1) and trichloroacetaldehyde (TCAD; IR band at 1760 cm−1), were also detected in line with the incomplete gaseous oxidation of TCE. The detection and possible reaction schemes of formation of such (oxi-)chlorinated oxidation by-products have already been discussed elsewhere [46,47,48]. With almost no water in the feed (RH = 0.7%), TCE molecules react with ClO radicals to produce DCAC, then DCAC molecules further decompose from the attack of Cl radicals to produce CCl4, CHCl3 and COCl2 molecules [46,53]. However, with RH of 15%, ClO radicals will certainly be quenched by OH radicals (coming from H2O), leading to a lower amount of DCAC (Figure 7).

2.4. TCE Abatement by Non-Thermal Plasma (NTP)

In the PPC configuration with RH = 0.7%, TCE was fully converted regardless of the catalysts (Ce0.01Mn-AT and Ce0.01Mn-400) used. Figure 8 shows the COx and CO2 yields with the two catalysts as a function of time. Compared with NTP, the COx yield increased and the CO2 yield especially significantly improved from 4 to 58% at t = 0. Of the two PPC configurations, the one with Ce0.01Mn-AT downstream of the NTP outperformed the one with Ce0.01Mn-400 for the 5 h test. For both configurations, COx and CO2 yields decreased over the time of the reaction. However, for Ce0.01Mn-400 the decay was more pronounced during the first 30 min. After 120 min the catalysts seemed to reach a steady state, as the COx and CO2 yield values were rather constant (Figure 8).
Figure 9 and Figure 10 present the FTIR spectra recorded between 700 and 1110 cm−1 and 1700 and 1800 cm−1 for the inlet TCE and the outlet gaseous stream as a function of time after post-plasma treatment using Ce0.01Mn-400 and Ce0.01Mn-AT with RH = 0.7%. In the PPC configurations, as compared with NTP, the band at 945 cm−1, corresponding to TCE, was not observed, while the intensity of the bands corresponding to CO2 vibration increased for both catalysts. Similarly, the ozone band disappeared. Interestingly, the characteristic bands of DCAC and TCAC decreased in intensity when Ce0.01Mn-400 was used as the catalyst and even disappeared with the Ce0.01Mn-AT catalyst. Such results could have been related to the efficient O3 activation of the catalysts, allowing the decomposition of the DCAC and TCAC by-products. Based on the relative intensity of the PG band, it seems that after one hour the PG amount was almost the same, irrespective of the catalyst. It is noticeable that new bands emerged corresponding to C-Cl bond vibrations relative to CHCl3 and CCl4, located at wavenumbers of 774 cm−1 and 794 cm−1, respectively. These C1 chlorinated formations can be explained by the reaction of CHCl2 and CCl3 radicals, resulting mainly from the easy cleavage of the carbon–carbon bond of DCAC with adsorbed chlorine.

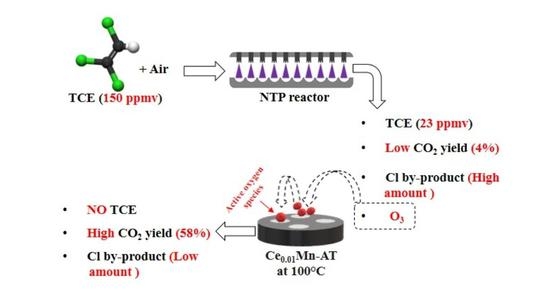
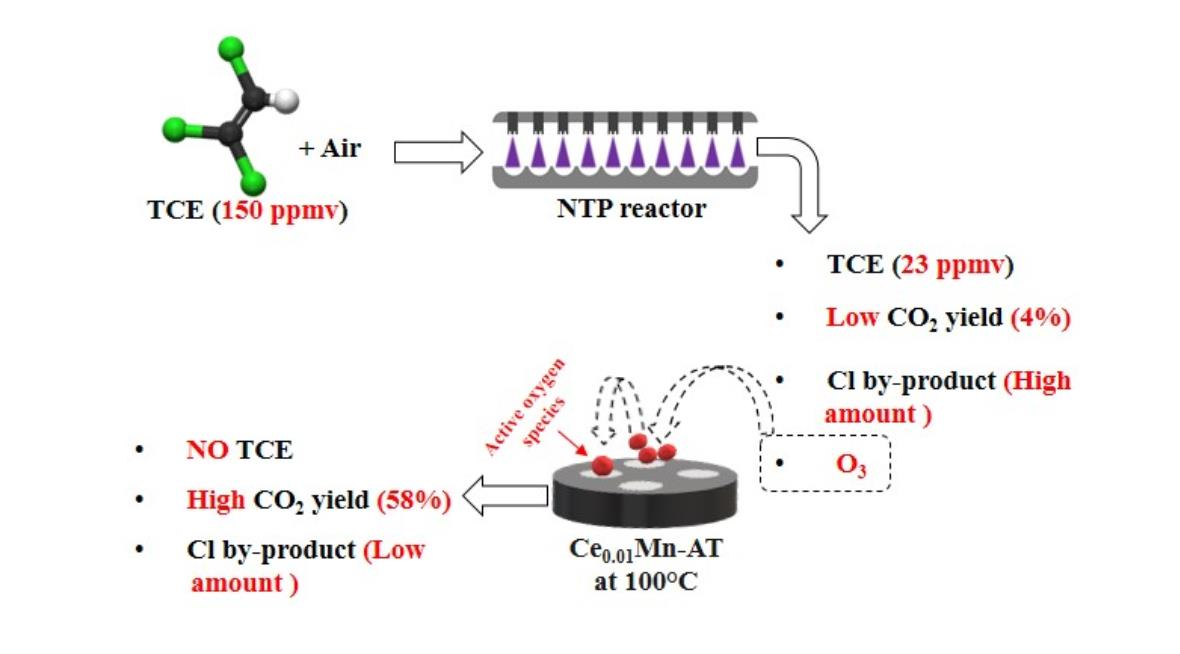
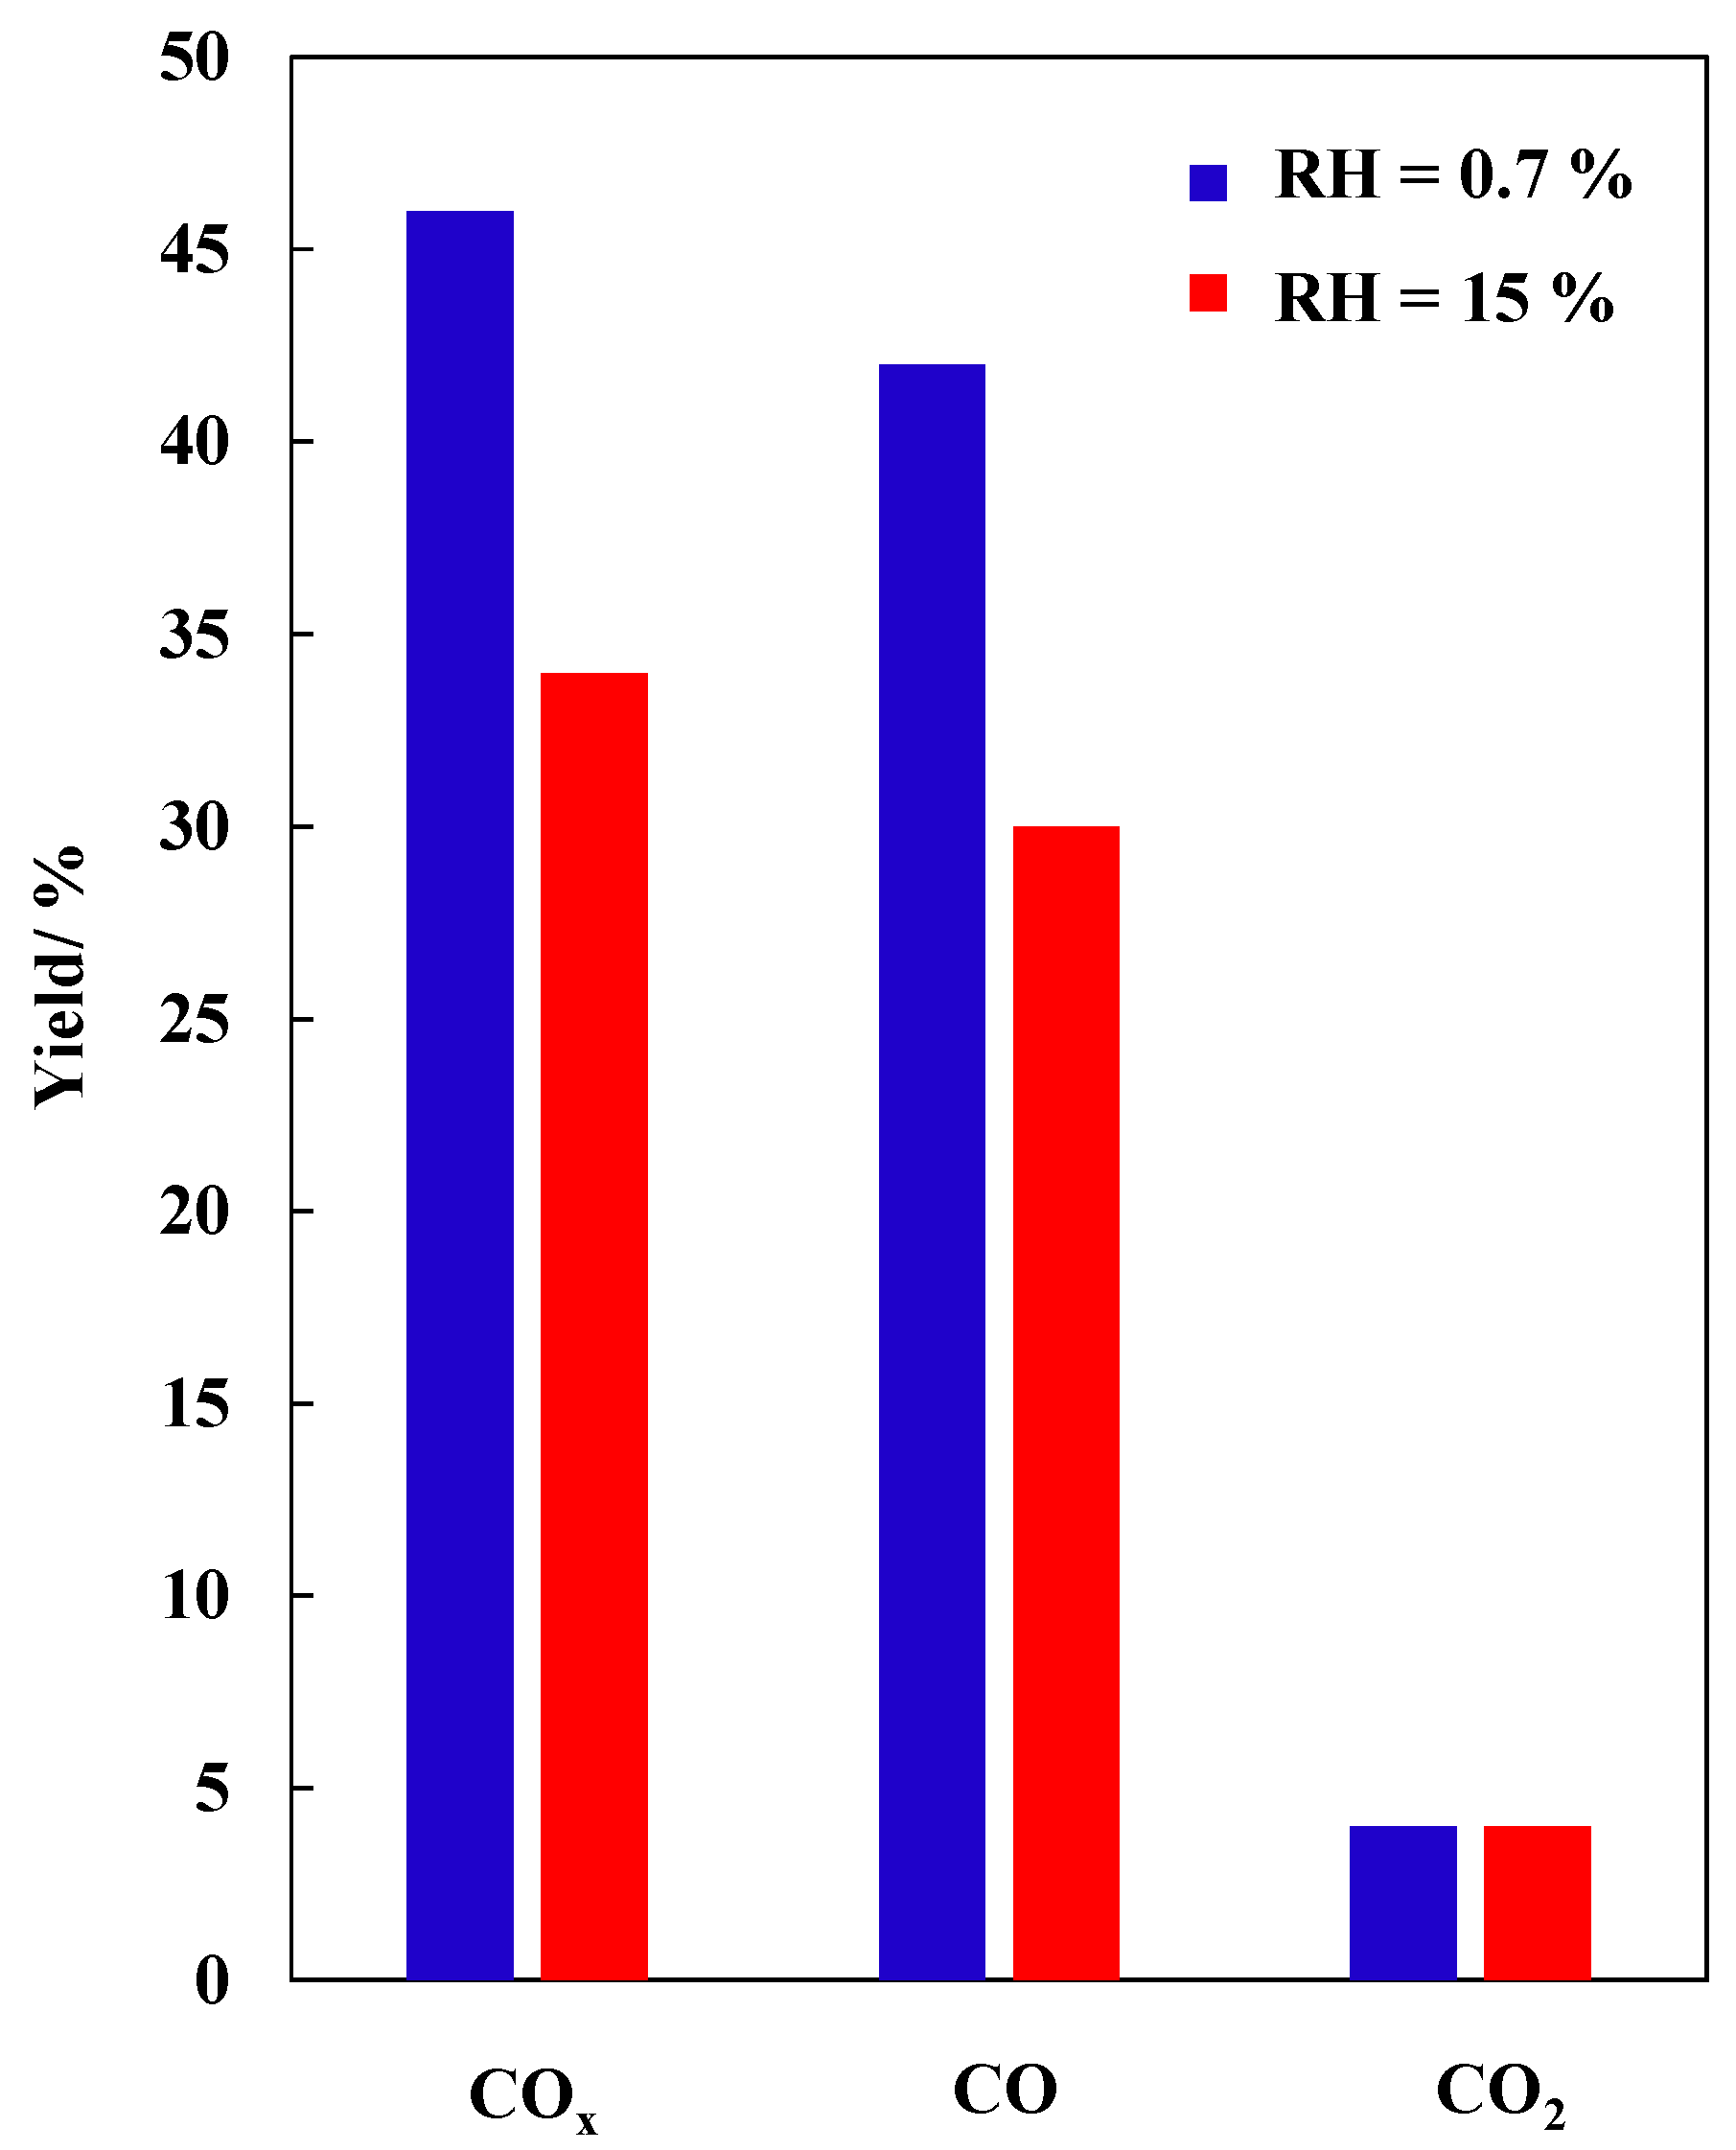
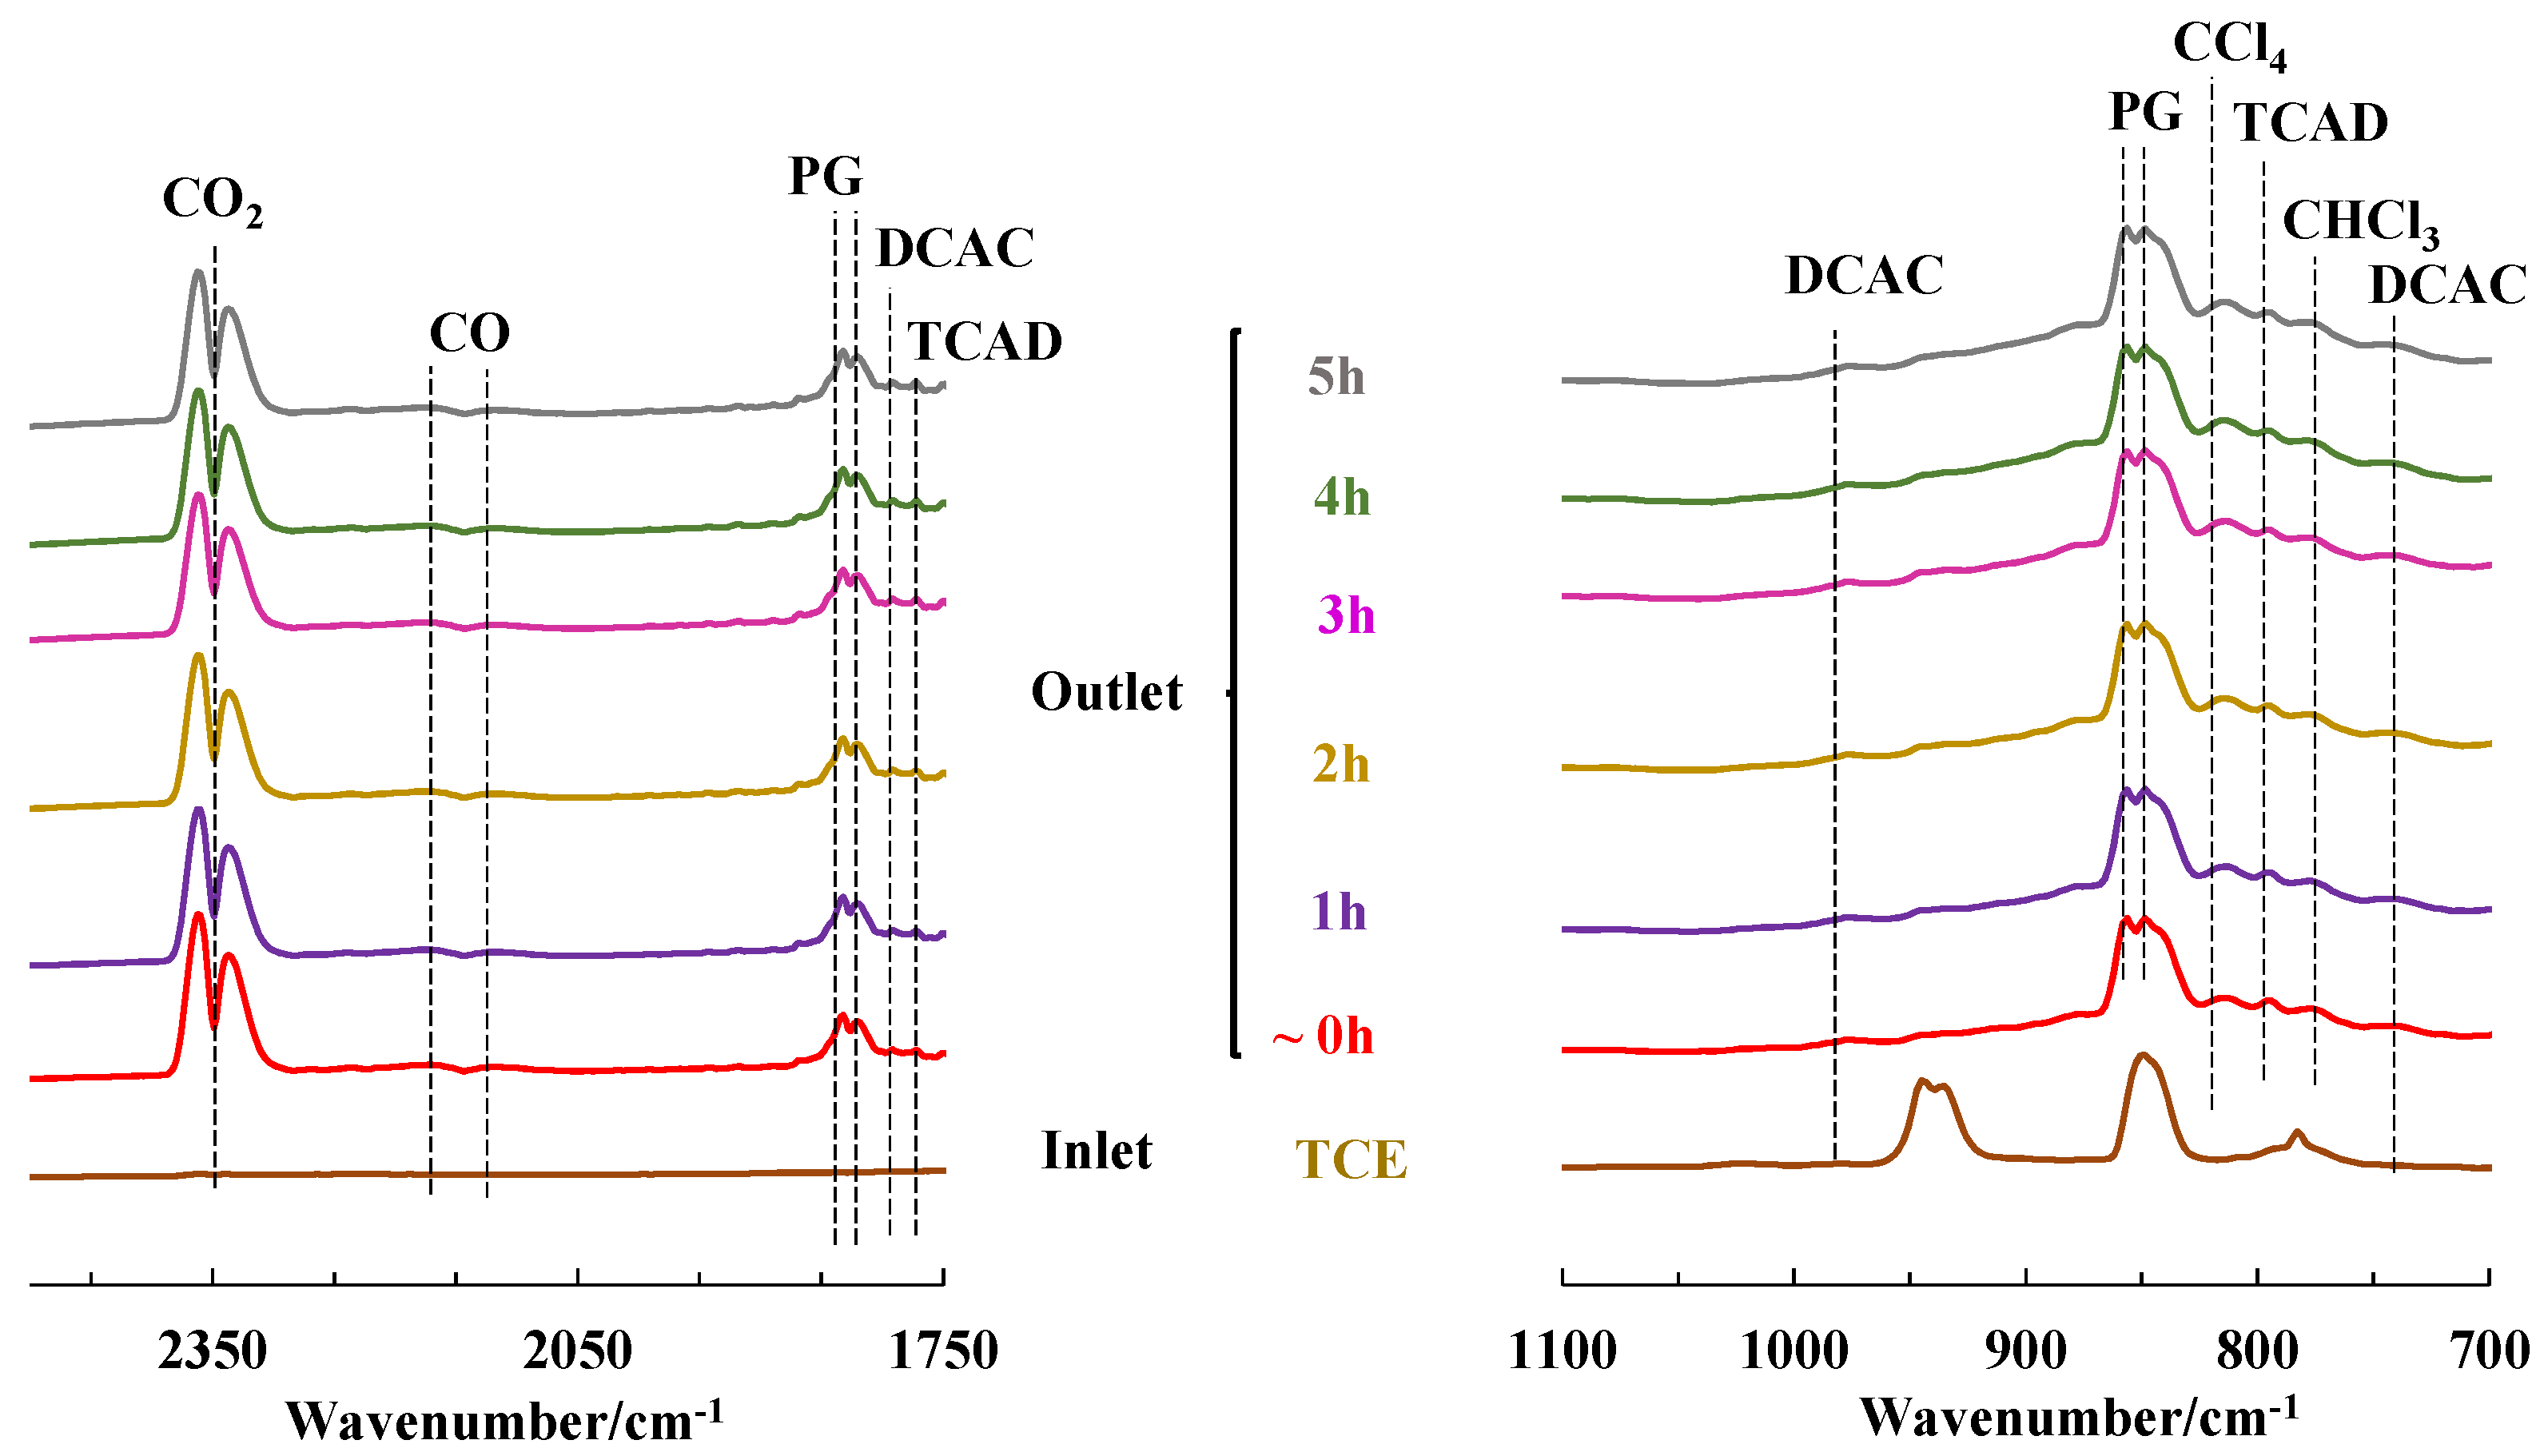
2.5. TCE Abatement in Post-Plasma Catalysis (PPC) Configuration—RH = 15%

The effect of relative humidity on the PPC process for TCE decomposition was studied in the presence of Ce0.01Mn-AT as the best catalyst. Figure 11 shows the COx and CO2 yields obtained as a function of time in humid air (RH = 15%). In comparison with the RH = 0.7% condition, the yields were lower but rather stable during the 5 h of the experiment.
Figure 12 presents the FT-IR spectra of the inlet TCE and outlet gaseous stream after the PPC process (RH = 15%) with Ce0.01Mn-AT as catalyst as a function of time. As previously observed with RH = 0.7%, neither the bands for TCE nor the ozone bands were observed after the PPC process. The DCAC and TCAD bands were observed, in contrast to what we observed in the PPC process with RH = 0.7%. However, it is usually reported that (i) the DCAC formation comes from the reaction of TCE with ClO radicals and (ii) in the presence of water, DCAC formation is suppressed because of the quenching of ClO radicals by OH radicals according to the following reaction: ClO + OH → HCl + O2. This discrepancy could be explained by the presence of ozone in higher quantities in our experimental conditions in comparison with those found in the literature. In our experimental conditions, OH radicals could react with O3 in sufficient quantities, instead of ClO radicals. This result could also explain the lowest COx yield value, owing to O3 consumption by OH radicals.

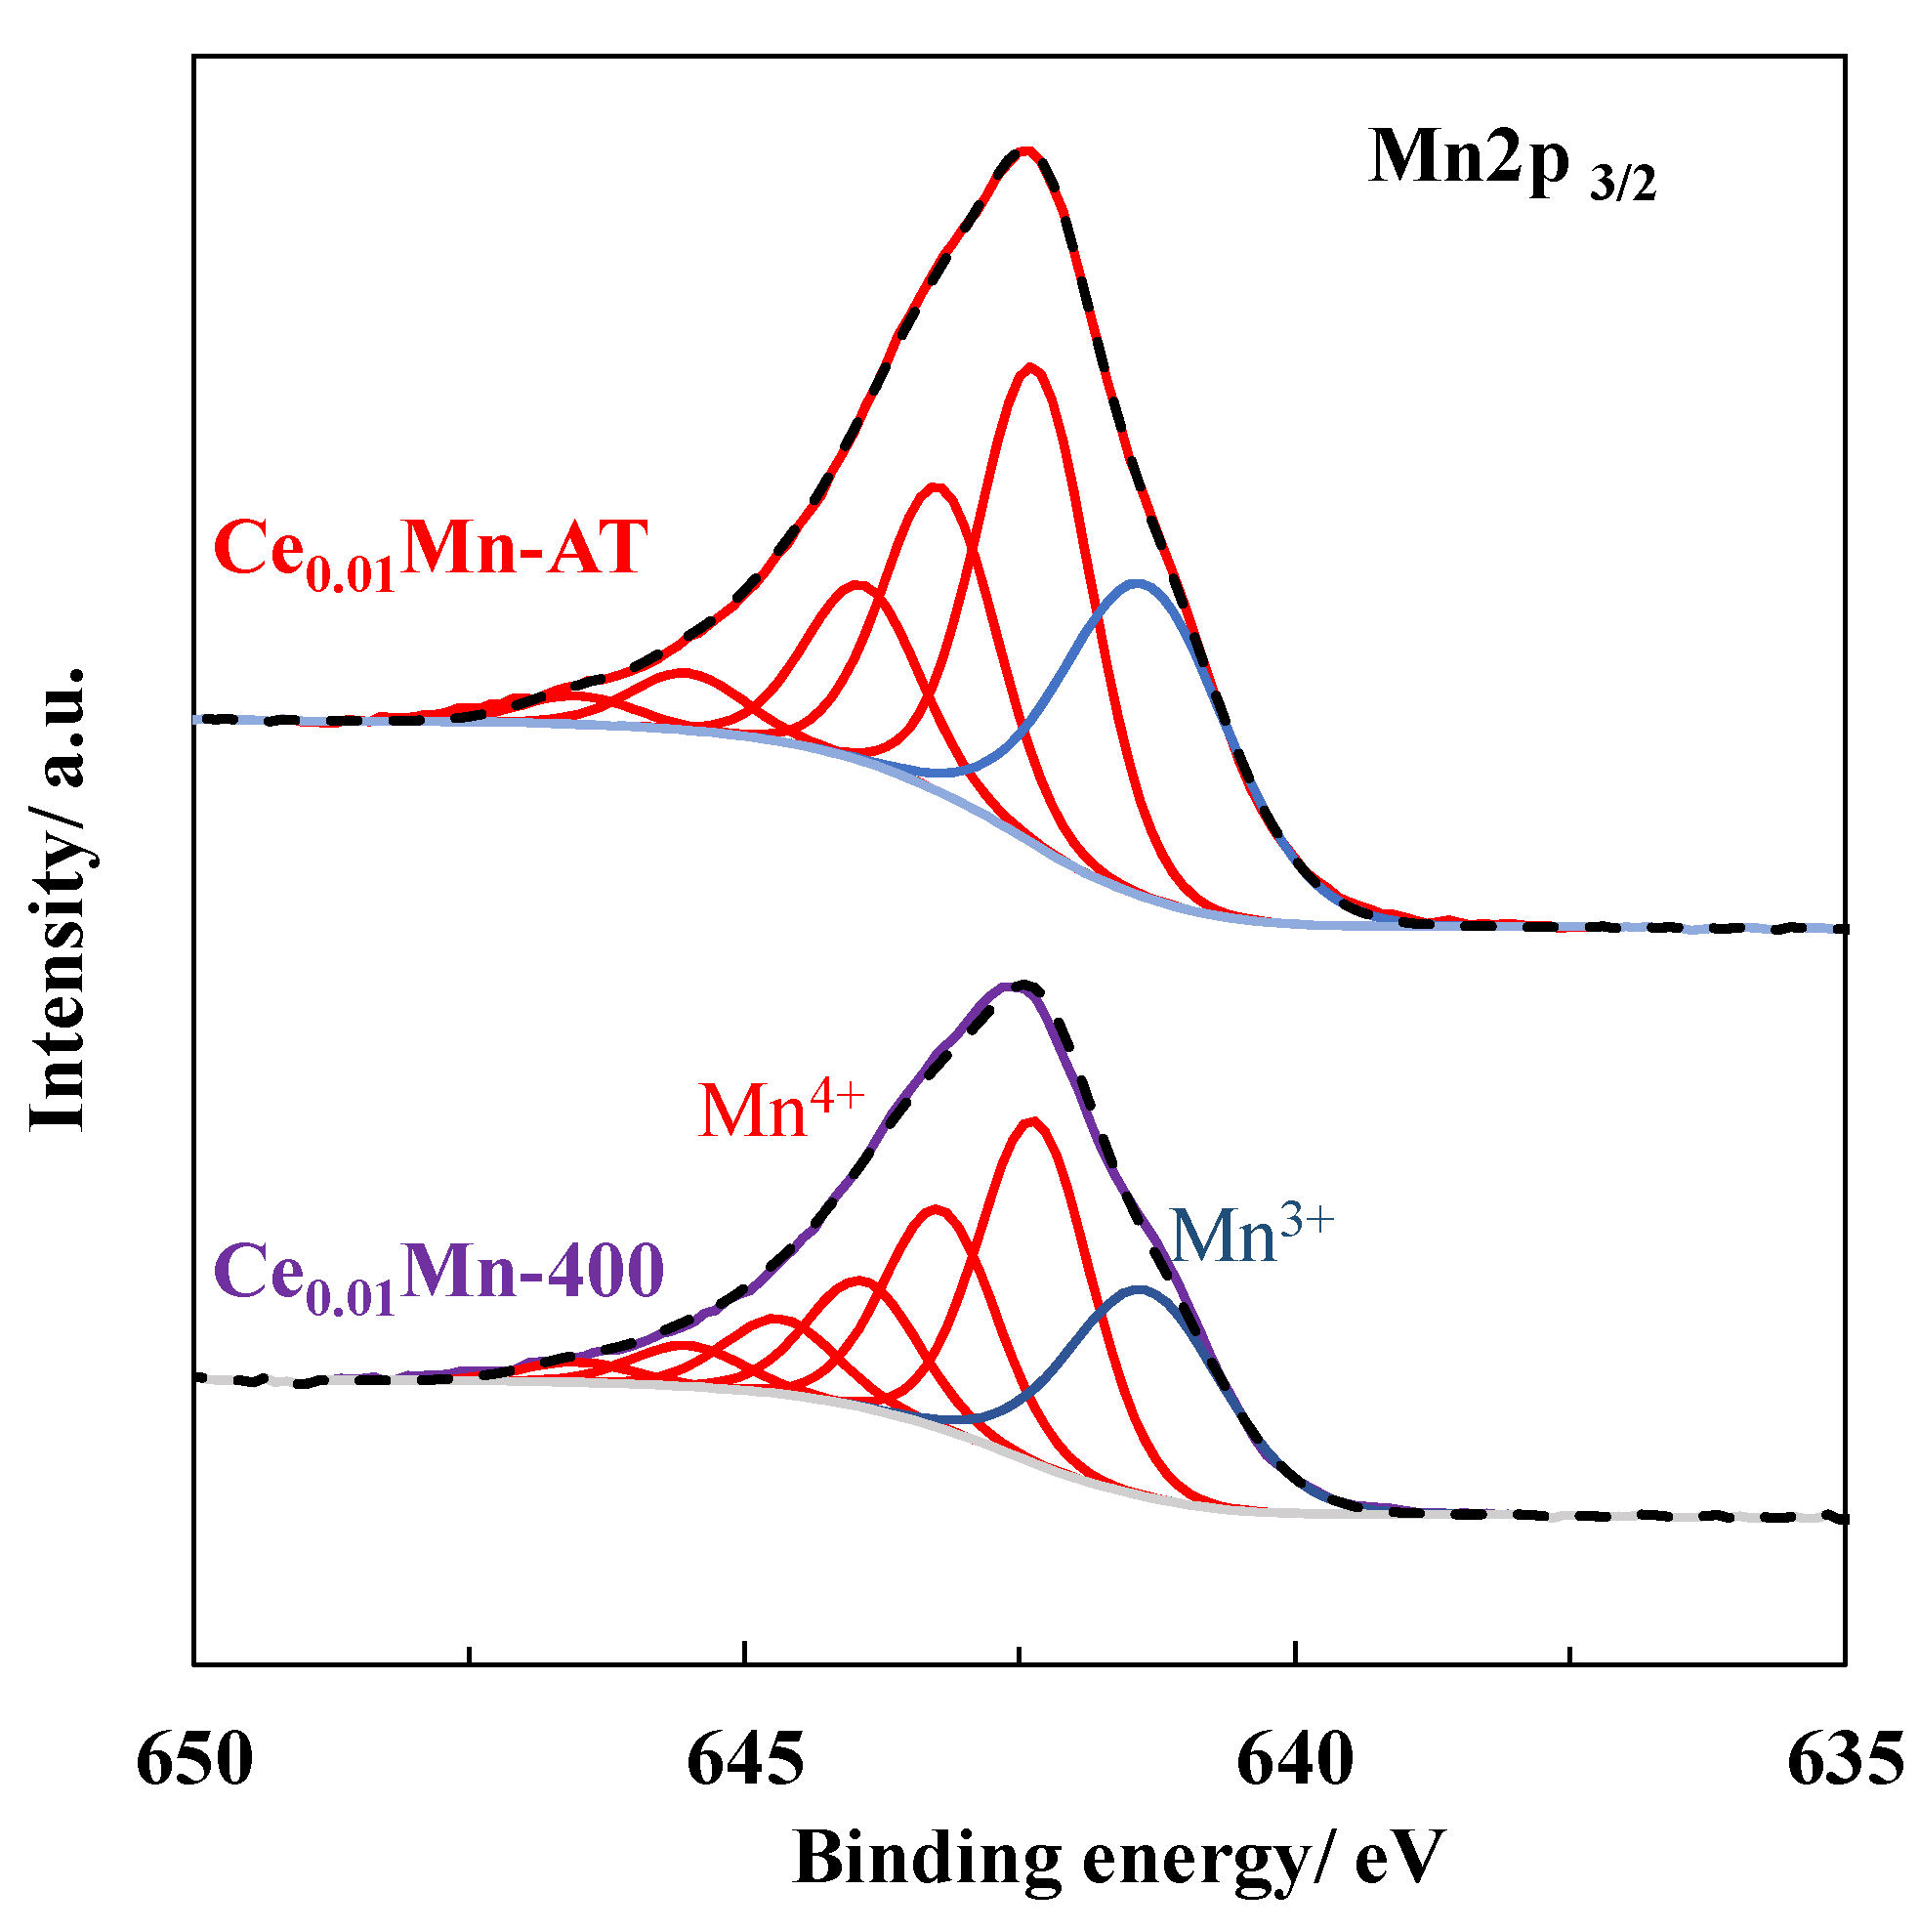
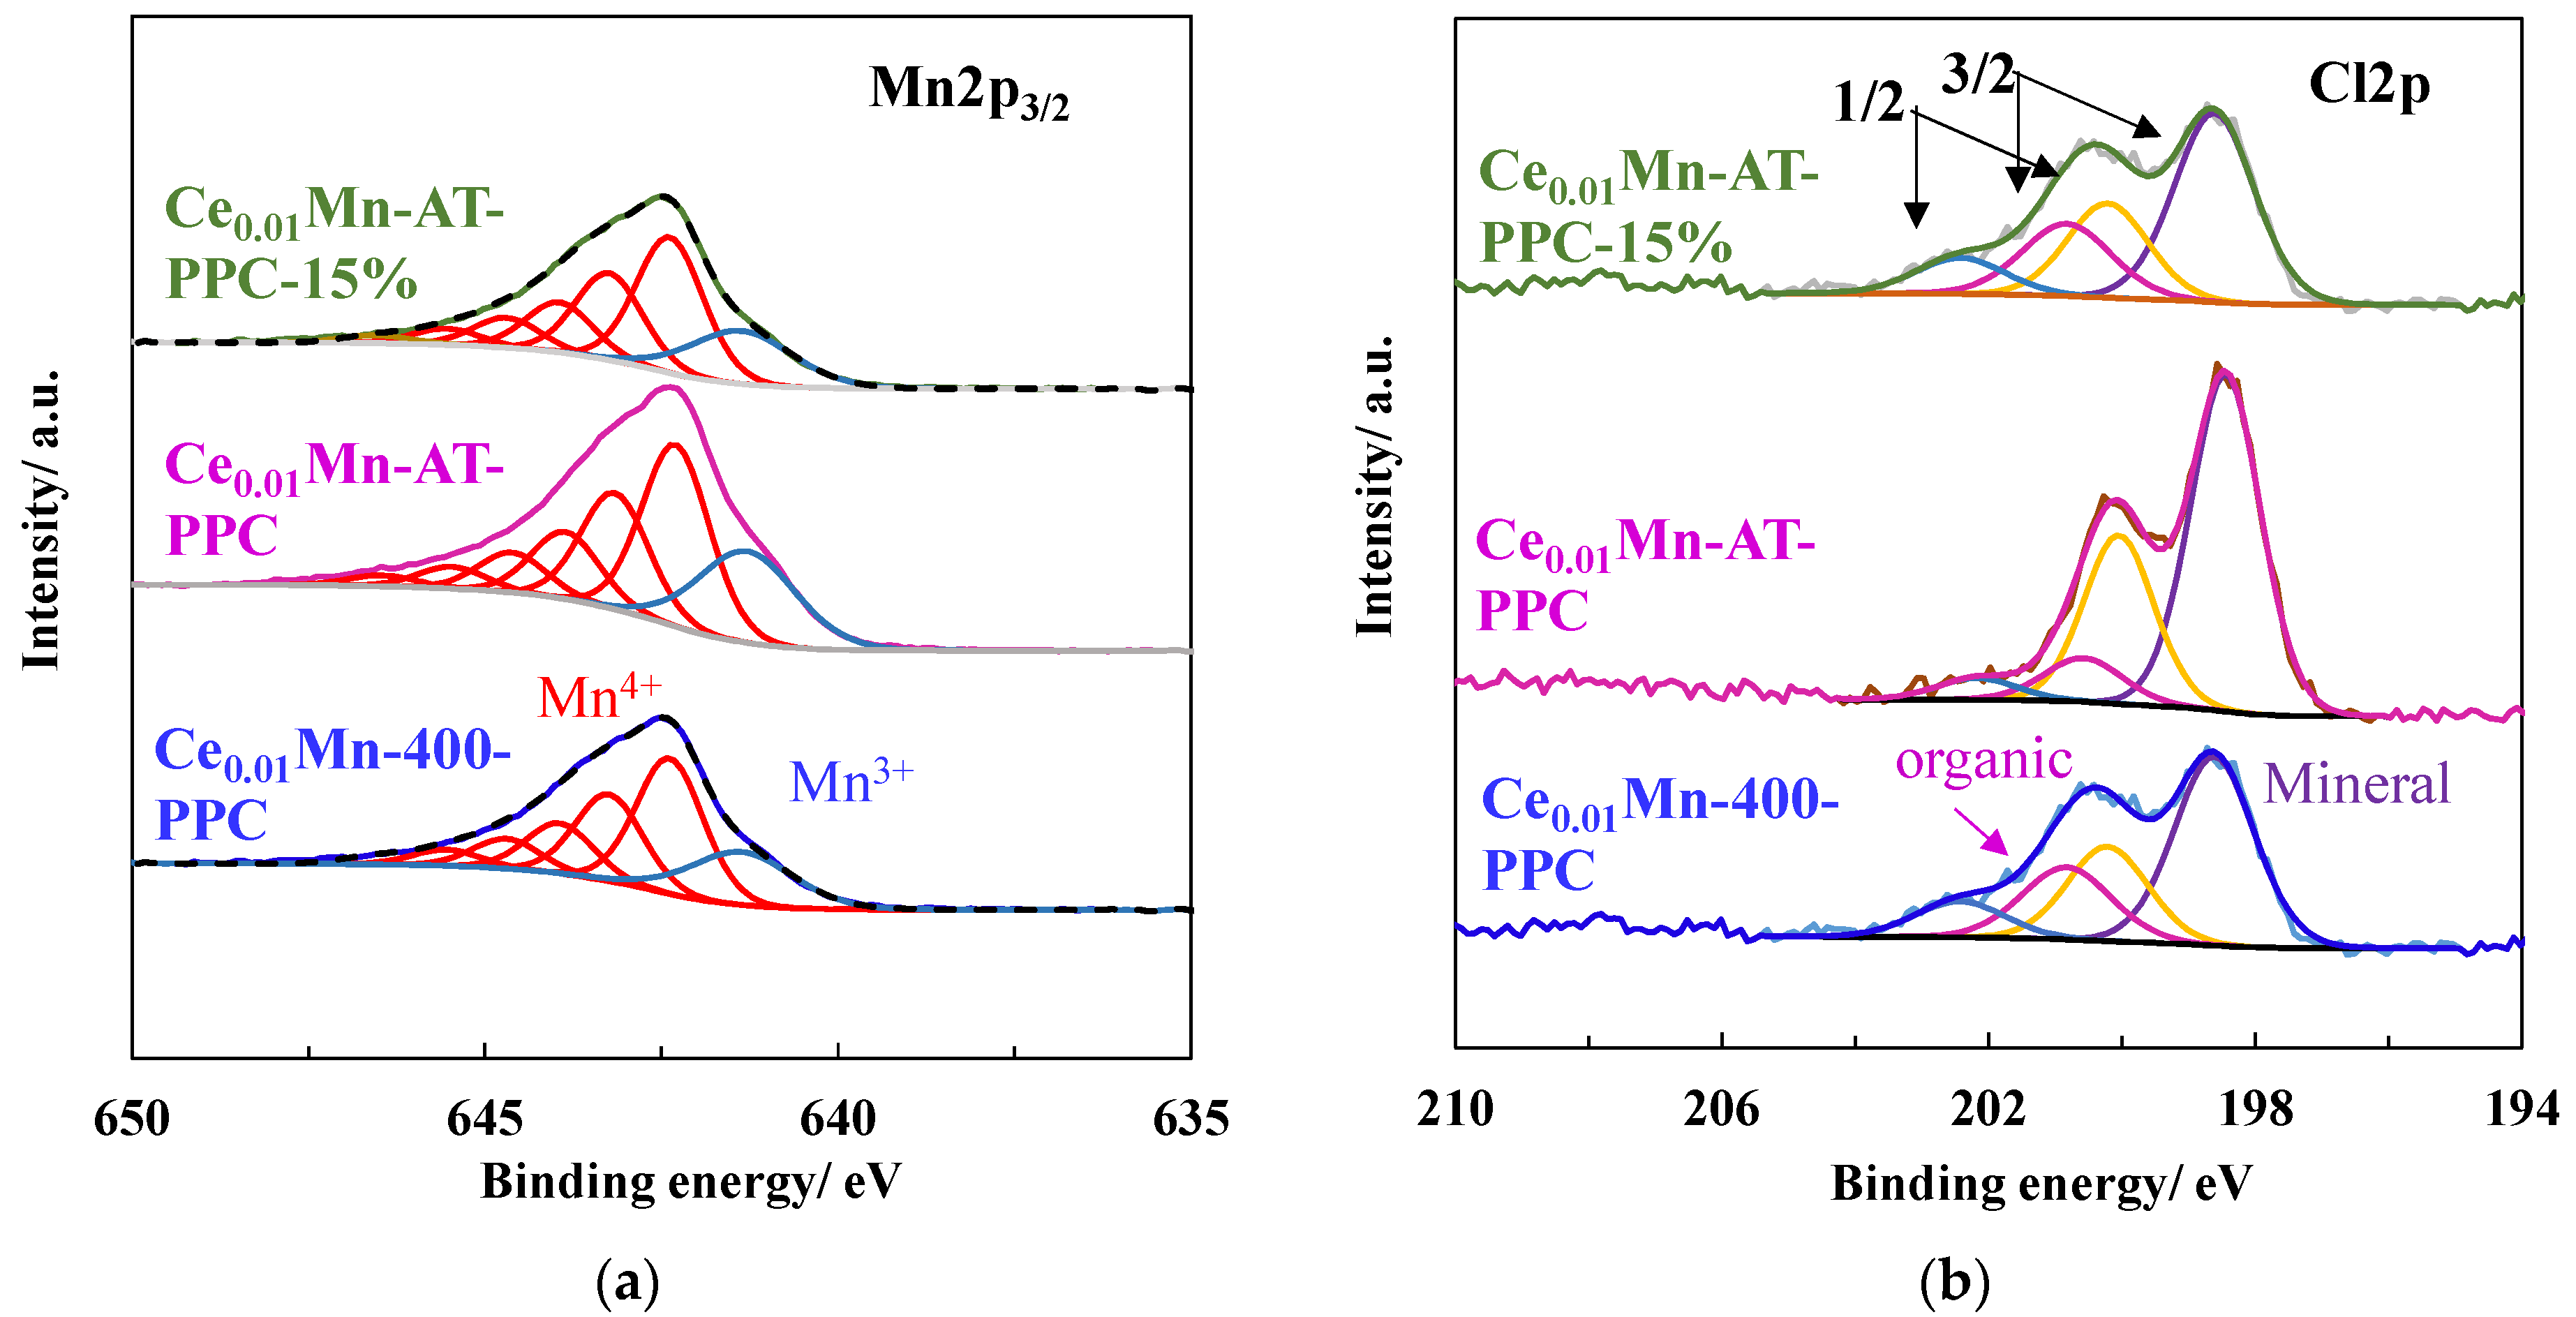
2.6. XPS Characterization of the Used Catalysts after the PPC Process

After the PPC process, a slight oxidation of manganese species was observed at the surface in both catalysts. Indeed, the Mn3+/Mn4+ decreased (Figure 13a), which was in agreement with the increase of Mn AOS calculated from Mn 3s splitting (Table 3). All catalysts also presented a surface Ce enrichment in Mn after the PPC process. After the reaction, the chlorine element was detected on the surfaces of both catalysts (Table 3). This can be explained by the incomplete degradation of TCE during the PPC process. The Cl 2p core level envelope can be simulated by considering two types of chlorine (Figure 13b). The Cl 2p3/2 photopeak at 198.5 ± 0.2 eV can be attributed to metal (M) chloride, with M = Ce and/or Mn [49,52], while the Cl 2p3/2 photopeak at 200.6 ± 0.2 eV can be ascribed to (oxi-)chlorinated organic species such as CHxCly(Oz) [49,52]. The organic chlorine to mineral chlorine ratio (Clorg/Clmin) was calculated for the tested catalysts. The best catalyst for TCE degradation (Ce0.01Mn-AT) presented a lower Clorg/Clmin ratio (0.14) in comparison with the ratio obtained for Ce0.01Mn-400 (0.42), suggesting that the formation of (oxi-)chlorinated organic species at the surface is detrimental to the catalytic performance. This assumption is reinforced by comparing the ratios obtained for the catalysts tested in different RH conditions. Indeed, with RH = 15%, the activity of Ce0.01Mn-AT was lower and the Clorg/Clmin ratio was higher (0.35).

3. Materials and Methods

3.1. Catalyst Preparation

Ce-doped birnessite with a ratio of Ce/Mn = 0.01 was prepared following a redox method. Typically, 4.0 g (25.3 mmol) of KMnO4 (Fluka, ≥99%, Strasbourg, France) was dissolved into 400 mL of distilled water under stirring (350 rpm). Ce (NO3)3.6H2O (Alfa Aesar; ≥99.5%, Kandel, Germany) was dissolved concomitantly with KMnO4 and 4 mL (22.54 mmol) of NaC3H5O3 (50% w/w) (Fisher Chemical, solution 60% w/w, Stasbourg, France) was added dropwise to the aqueous KMnO4 solution. The resulting brown suspension was stirred for 2 h. After centrifugation (4000 rpm for 20 min), the collected brown precipitate was washed two times (25 mL of distilled water each time) and finally dried in an oven at 40 °C for 48 h to give a black powder. The dried sample was then calcined at 400 °C for 5 h in flowing dry air (1.0 g; 2 L/h; 2 °C/min) and labeled as Ce0.01Mn-400. The dried sample was also treated with 0.2 M HNO3 solution (VWR 68%), with a ratio mcatalyst (g)/VHNO3 (mL) = 1/20, for 6 h at 50 °C under vigorous stirring (500 rpm). Then, the black suspension was filtered and washed continuously with distilled water until the pH of the eluate reached ~7.0. After washing, the resulting black solid was dried at 105 °C for 18 h and the sample was labeled as Ce0.01Mn-AT.

3.2. Catalyst Characterization

X-ray diffraction (XRD) patterns were collected on a D8 Advanced Bruker AXS diffractometer equipped with a Cu Kα1 monochromatic radiation source (λ = 1.5418 Å) and Lynxeye super speed detector, with the power levels set at 40 kV and 40 mA. The X-ray diffraction patterns were recorded within the range 5–80° with a 0.02° step size in 2θ and a step time of 1s.
The elemental analysis was performed with an inductively coupled plasma—Optic emission spectroscope 720-ES ICP-OES. The sample preparation was undertaken by dissolving 10 mg of dried and ground catalyst samples in concentrated aqua regia solution. The sample solution was heated up to 110 °C in a Vulcan autodigester for 2 h. Then, it was diluted to 20 mL by ultrapure water before analysis by the ICP-OES. Metal in sample, allowing the estimation of the weight, was undertaken for the analysis-certificated standard solution.
N2 physisorption isotherms were recorded at −196 °C using a TriStar II 3020 gas sorption analyzer from Micromeretics. Prior to analysis, the samples were heated at 100 °C for 4 h in a dynamic vacuum. The Brunauer–Emmett–Telller (BET) method was used to calculate the specific surface areas. The total pore volume Vp was determined at P/P0 = 0.99. The Barret–Joyner–Halenda (BJH) equation was used to estimate the pore size distributions (PSDs) for the desorption branch.
Pyridine adsorption measurements followed by Fourier-transform infrared spectroscopy (FTIR-pyridine) were undertaken with a Thermo Nicolet 460 protege instrument equipped with a CSi beam splitter and an MCT detector with a 2 cm−1 resolution. A total of 256 scans were collected over the spectral range extending from 4000 to 400 cm−1. The samples were ground in an agate mortar and pressed into the form of self-supporting wafers (1 ton/cm2, 2.01 cm2), then placed in a quartz sample holder and afterwards in a quartz cell equipped with KBr windows. The sample was first activated at 105 °C in a high vacuum. Then, the pyridine adsorption occurred at 105 °C. After reaching the equilibrium, the excess of pyridine was evacuated in a vacuum at 105 °C over 30 min. Then, the spectrum acquisition was performed. All recorded spectra were recalculated to a normalized wafer of 10 mg and then the FTIR spectrum of the activated surface was subtracted from the pyridine-adsorbed one.
X-ray photoelectron spectroscopy (XPS) experiments were performed using an AXIS Ultra DLD Kratos spectrometer equipped with a monochromatic aluminum source (Al Kα = 1486.7 eV) and charge compensation gun. The binding energies (BEs) were referenced from adventitious C 1s at 284.8 eV. High resolution spectra were collected with a constant pass energy (40 eV). Quantification and spectral decomposition were processed using CasaXPS software. Quantification was performed based on Mn 2p, Ce 4d, K 2p, O 1s, Na 1s and C 1s. The Ce 4d core-level was considered for quantification instead of Ce 3d due to the Ce 3d/Auger Mn LMM peak overlap.

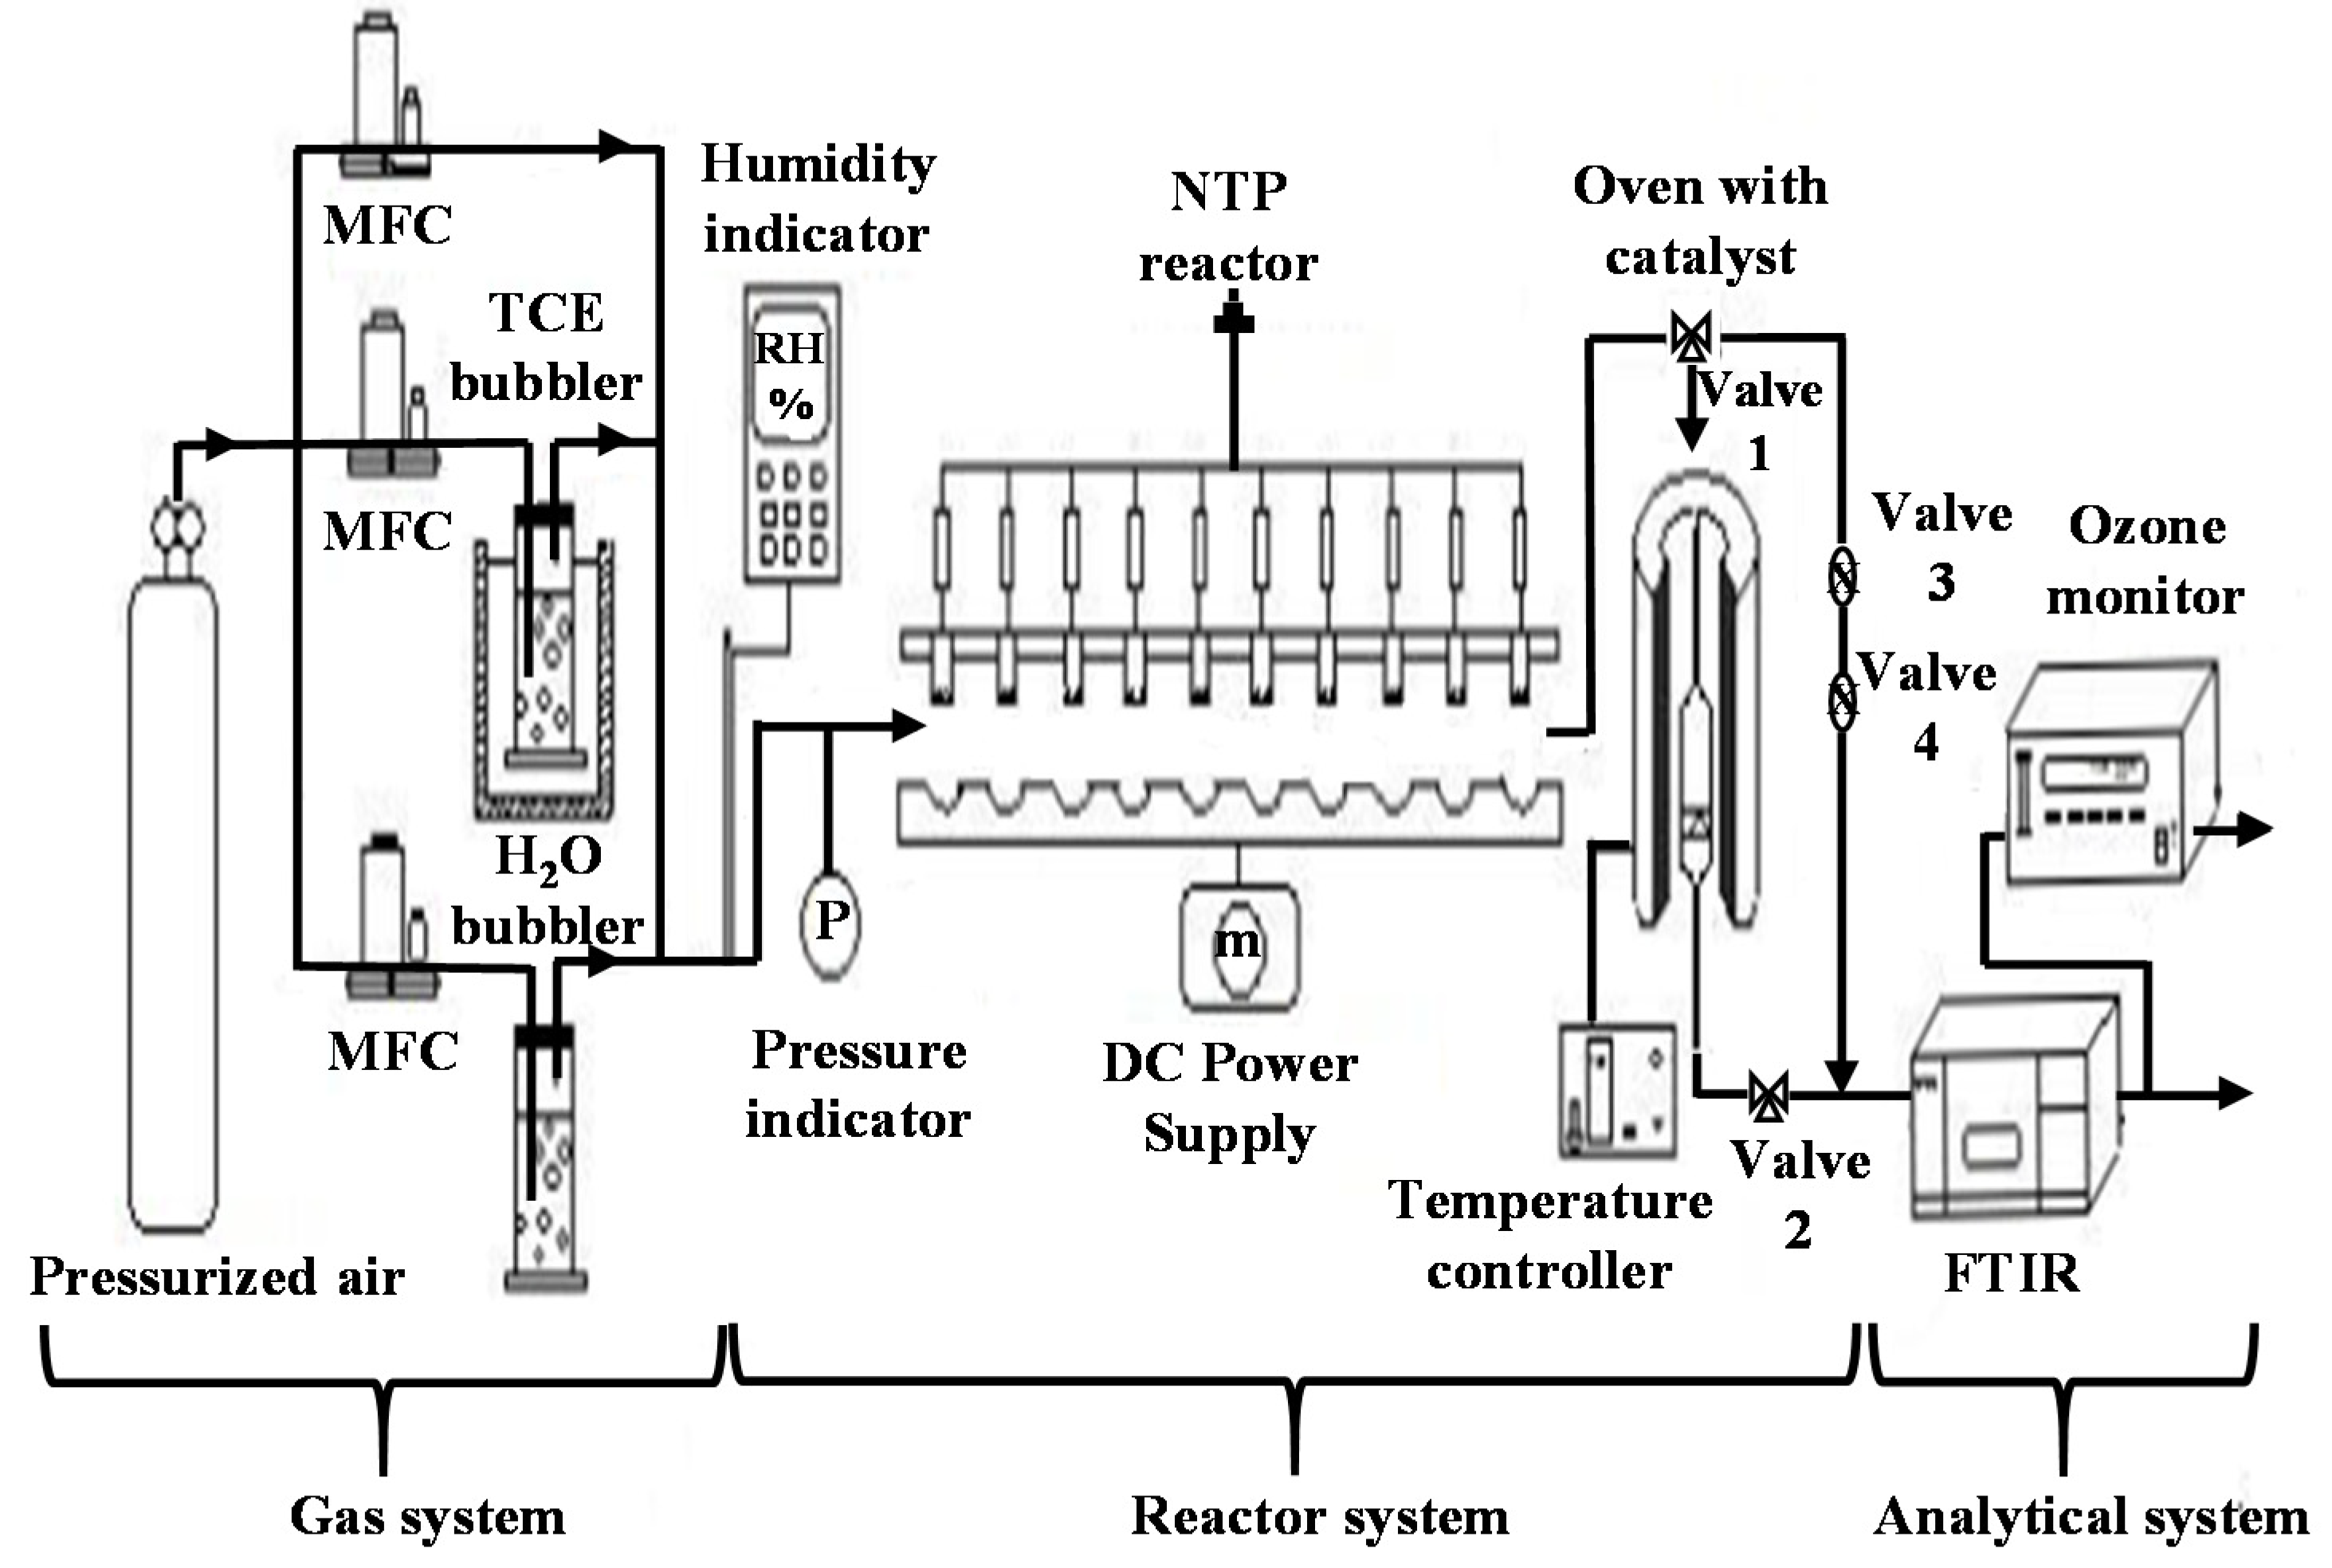
3.3. Ozone Decomposition Using Non-Thermal Plasma (NTP)

Figure 14 presents the schematic diagram of the experimental setup, which consisted of three main parts: the gas analysis system, the reactor system (NTP reactor and catalyst reactor) and the gas analysis system. A total of 300 ppm of ozone was generated by flowing 1L/min of dry air (RH = 0.7%) through the NTP reactor. Ozone concentration was obtained via linear regression applied to the integration area (obtained by FTIR in the range of 1050 to 1000 cm−1) as a function of the ozone concentration obtained with an ozone monitor (Teledyne API’s model 465M). Ozone decomposition tests were carried out for 5 h at atmospheric pressure and room temperature (20 °C) over 0.05 g of catalyst mixed with 1 g of SiC (EMB 45053 Prolabo, 0.150 mm). The ozone conversion efficiency was calculated using the following equation:
O 3   conversion   =   [ O 3 ] i n [ O 3 ] o u t [ O 3 ] i n   ×   100
where [O3]in and [O3]out were the ozone concentration introduced in the reactor and that measured at the exit of the catalytic reactor, respectively.

3.4. Post-Plasma Catalysis for TCE Abatement

Trichloroethylene (TCE; 99.99% purity, ACROS, Merelbeke, Belgium) was evaporated by bubbling dry (RH = 0.7%) or moist air (RH = 15%) into a saturator and then introduced into the plasma reactor after being diluted with air (Figure 14). The total flow rate and TCE concentration in air were maintained at 1 L/min and 150 ppmv, respectively, using mass flow controllers (MFCs; El-Flow, Bronkhorst, Bethlehem, PA, USA) the different experimental conditions are listed in Table 4. A 10-pin-to-plate plasma reactor configuration was used, working in a negative DC corona discharge. A total of 0.1 g of catalyst diluted in 1 g of SiC and placed in a quartz reactor was activated for 1 h in dry air (0.2 L/min) at 100 °C and maintained at this temperature during the test.
The TCE abatement (conversion) efficiency was calculated from:
TCE   conversion =   [ T C E ] i n [ T C E ] o u t [ T C E ] i n   ×   100
where [TCE]in and [TCE]out were the inlet and outlet concentrations, respectively.
The CO2, CO and COx yields were calculated as follows:
Y C O 2   ( % )   =   [ C O 2 ] o u t 2 x [ T C E ] i n   ×   100
Y C O   ( % )   =   [ C O ] o u t 2 x [ T C E ] i n   ×   100
YCOx (%) = YCO2 (%) + YCO (%)
An FTIR spectrometer (Bruker, Billerica, MA, USA, Vertex 70) equipped with a 20 cm optical path length, a window diameter of 45 mm and resolution of 4 cm−1 was used to analyze the gaseous species at the exit of the plasma reactor for plasma alone (reactive gas-flow bypassing the catalytic reactor) and at the exit of the catalytic reactor for PPC (reactive gas-flow passing through the catalytic reactor). This reactive gas was sampled 10 times at intervals of 30 s for plasma alone and sampled 60 times at intervals of 30 s, and then 135 times at intervals of 120 s, for PPC. The number of scans for each spectrum was 10 in both cases. In order to quantify the TCE, CO2 and CO, the FTIR spectrometer was calibrated with a calibration mixture delivered by Air liquid. The band areas between 916–966 cm−1 (TCE), 2388–2287 cm−1 (CO2) and 2140–2071 cm−1 (CO) were integrated and a linear regression was applied to the integration area.

4. Conclusions

In this study, TCE abatement was investigated at 100 °C in nearly dry (RH = 0.7%) and moist air (RH = 15%) in a PPC configuration using a 10-pin-to-plate negative DC corona discharge NTP reactor and cerium-modified birnessites calcined at 400 °C or treated with nitric acid as catalysts. The plasma conditions were chosen in order to treat a low concentration of TCE (150 ppmv) and be as close as possible to industrial issues in terms of VOC concentration abatement. A stoichiometric ratio ([O3]/[TCE]0) of 4 was adopted in order to take advantage of the efficient properties of the catalysts for O3 decomposition.
In these conditions, the TCE removal efficiency was 85% but the COx yield was only 46% for the NTP process alone. Adding a catalyst downstream of the NTP reactor enhanced the performances of the process in dry and humid air in terms of TCE removal efficiency and CO2 selectivity due to the ability of the catalyst to totally decompose ozone and generate surface active oxygen species able to oxidize the unreacted TCE and some of the polychlorinated by-products. The plasma-assisted Ce0.01Mn-AT catalyst presented the best CO2 yield in dry air (58%) at the beginning of the experiment, reaching 40% after 5 h with no production of DCAC and TCAD in hard experimental conditions, such as high GHSV of 600 L/g·h, with only 0.1 g of catalyst. In this configuration the formation of gaseous chlorinated by-products was minimized but not totally suppressed. Both catalysts exhibited good stability for TCE abatement, which means they were chlorine-tolerant. Ce0.01Mn-AT was tested in moist air and was also stable over time, which means it is also water-tolerant.

Author Contributions

G.A. conducted all the experiments except the O3 decomposition tests, which were done by R.B., J.-M.G., R.M. and J.-F.L., who also supervised the work. G.A. wrote the first draft of the paper. G.A., J.-M.G., N.D.G., R.M. and J.-F.L. contributed to the data interpretation, the discussion, and the revision of the paper. Funding acquisition: J.-F.L. and R.M. All authors have read and agreed to the published version of the manuscript.

Funding

This research was supported by the European Program INTERREG V France-Wallonie-Flanders (FEDER) (DepollutAir). The Fonds Européen de Développement Régional (FEDER), CNRS, Région Nord Pas-de-Calais and Ministère de l’Education Nationale de l’Enseignement Supérieur et de la Recherche are acknowledged for funding for X-ray diffractometers. The Chevreul institute (FR 2638), Ministère de l’Enseignement Supérieur et de la Recherche and Région Hauts-de-France are acknowledged for their support of this work. This research was carried out in the French–Belgium Associated International Laboratory “Plasma & Catalysis”, supported by the universities of Lille and Ghent.

Data Availability Statement

All the results are present in the main content of article.

Acknowledgments

The authors thank Pardis Simon, Laurence Burylo and Jean-Charles Morin for their contribution to the XPS, XRD and IR-pyridine measurements, respectively.

Conflicts of Interest

The authors declare no conflict of interest.

References

  1. Huang, B.; Lei, C.; Wei, C.; Zeng, G. Chlorinated Volatile Organic Compounds (Cl-VOCs) in Environment-Sources, Potential Human Health Impacts, and Current Remediation Technologies. Environ. Inter. 2014, 71, 118–138. [Google Scholar] [CrossRef] [PubMed]
  2. Wu, C.; Schaum, J. Exposure Assessment of Trichloroethylene. Environ. Health Perspect. 2000, 108, 359–363. [Google Scholar] [CrossRef] [Green Version]
  3. Doherty, R.E. A History of the Production and Use of Carbon Tetrachloride, Tetrachloroethylene, Trichloroethylene and 1,1,1-Trichloroethane in the United States: Part 1--Historical Background; Carbon Tetrachloride and Tetrachloroethylene. Environ. Forensics 2000, 1, 69–81. [Google Scholar] [CrossRef]
  4. Rusyn, I.; Chiu, W.A.; Lash, L.H.; Kromhout, H.; Hansen, J.; Guyton, K.Z. Trichloroethylene: Mechanistic, Epidemiologic and Other Supporting Evidence of Carcinogenic Hazard. Pharmacol. Ther. 2014, 141, 55–68. [Google Scholar] [CrossRef] [PubMed] [Green Version]
  5. Holzer, F.; Kopinke, F.D.; Roland, U. Influence of Ferroelectric Materials and Catalysts on the Performance of Non-Thermal Plasma (NTP) for the Removal of Air Pollutants. Plasma Chem. Plasma Process. 2005, 25, 595–611. [Google Scholar] [CrossRef]
  6. Schiavon, M.; Torretta, V.; Casazza, A.; Ragazzi, M. Non-Thermal Plasma as an Innovative Option for the Abatement of Volatile Organic Compounds: A Review. Water Air Soil Pollut. 2017, 228, 388. [Google Scholar] [CrossRef]
  7. Thevenet, F.; Sivachandiran, L.; Guaitella, O.; Barakat, C.; Rousseau, A. Plasma–Catalyst Coupling for Volatile Organic Compound Removal and Indoor Air Treatment: A Review. J. Phys. D Appl. Phys. 2014, 47, 224011. [Google Scholar] [CrossRef]
  8. Chen, H.L.; Lee, H.M.; Chen, S.H.; Chang, M.B.; Yu, S.J.; Li, S.N.I. Removal of Volatile Organic Compounds by Single-Stage and Two-Stage Plasma Catalysis Systems: A Review of the Performance Enhancement Mechanisms, Current Status, and Suitable Applications. Environ. Sci. Technol. 2009, 43, 2216–2227. [Google Scholar] [CrossRef]
  9. Subrahmanyam, C.; Renken, A.; Kiwi-Minsker, L. Catalytic Non-Thermal Plasma Reactor for Abatement of Toluene. Chem. Eng. J. 2010, 160, 677–682. [Google Scholar] [CrossRef]
  10. Wu, J.; Xia, Q.; Wang, H.; Li, Z. Catalytic Performance of Plasma Catalysis System with Nickel Oxide Catalysts on Different Supports for Toluene Removal: Effect of Water Vapor. App. Catal. B Environ. 2014, 156–157, 265–272. [Google Scholar] [CrossRef]
  11. Tu, X.; Gallon, H.J.; Whitehead, J.C. Electrical and Spectroscopic Diagnostics of a Single-Stage Plasma-Catalysis System: Effect of Packing with TiO2. J. Phys. D Appl. Phys. 2011, 44, 482003. [Google Scholar] [CrossRef]
  12. Sultana, S.; Ye, Z.; Veerapandian, S.K.P.; Löfberg, A.; De Geyter, N.; Morent, R.; Giraudon, J.M.; Lamonier, J.F. Synthesis and Catalytic Performances of K-OMS-2, Fe/K-OMS-2 and Fe-K-OMS-2 in Post Plasma-Catalysis for Dilute TCE Abatement. Catal. Today 2018, 307, 20–28. [Google Scholar] [CrossRef]
  13. Veerapandian, S.K.P.; Ye, Z.; Giraudon, J.-M.; De Geyter, N.; Morent, R.; Lamonier, J.-F. Plasma Assisted Cu-Mn Mixed Oxide Catalysts for Trichloroethylene Abatement in Moist Air. J. Hazar. Mater. 2019, 379, 120781. [Google Scholar] [CrossRef]
  14. Liu, Y.; Zhang, P. Catalytic Decomposition of Gaseous Ozone over Todorokite-Type Manganese Dioxides at Room Temperature: Effects of Cerium Modification. Appl. Catal. A Gen. 2017, 530, 102–110. [Google Scholar] [CrossRef]
  15. Ma, J.; Wang, C.; He, H. Transition Metal Doped Cryptomelane-Type Manganese Oxide Catalysts for Ozone Decomposition. Appl. Catal. B Environ. 2017, 201, 503–510. [Google Scholar] [CrossRef]
  16. Li, X.; Ma, J.; Yang, L.; He, G.; Zhang, C.; Zhang, R.; He, H. Oxygen Vacancies Induced by Transition Metal Doping in γ-MnO2 for Highly Efficient Ozone Decomposition. Environ. Sci. Technol. 2018, 52, 12685–12696. [Google Scholar] [CrossRef] [PubMed]
  17. Ma, J.; Li, X.; Zhang, C.; Ma, Q.; He, H. Novel CeMnaOx Catalyst for Highly Efficient Catalytic Decomposition of Ozone. Appl. Catal. B Environ. 2020, 264, 118498. [Google Scholar] [CrossRef]
  18. Tang, X.; Li, Y.; Huang, X.; Xu, Y.; Zhu, H.; Wang, J.; Shen, W. MnOx–CeO2 Mixed Oxide Catalysts for Complete Oxidation of Formaldehyde: Effect of Preparation Method and Calcination Temperature. Appl. Catal. B Environ. 2006, 62, 265–273. [Google Scholar] [CrossRef]
  19. Liu, Y.; Zhou, H.; Cao, R.; Sun, T.; Zong, W.; Zhan, J.; Liu, L. Different Behaviors of Birnessite-Type MnO2 Modified by Ce and Mo for Removing Carcinogenic Airborne Benzene. Mater. Chem. Phys. 2019, 221, 457–466. [Google Scholar] [CrossRef]
  20. Chen, J.; Chen, X.; Yan, D.; Jiang, M.; Xu, W.; Yu, H.; Jia, H. A Facile Strategy of Enhancing Interaction between Cerium and Manganese Oxides for Catalytic Removal of Gaseous Organic Contaminants. Appl. Catal. B Environ. 2019, 250, 396–407. [Google Scholar] [CrossRef]
  21. Zhu, L.; Wang, J.; Rong, S.; Wang, H.; Zhang, P. Cerium Modified Birnessite-Type MnO2 for Gaseous Formaldehyde Oxidation at Low Temperature. Appl. Catal. B Environ. 2017, 211, 212–221. [Google Scholar] [CrossRef]
  22. Liu, Y.; Yang, W.; Zhang, P.; Zhang, J. Nitric Acid-Treated Birnessite-Type MnO2: An Efficient and Hydrophobic Material for Humid Ozone Decomposition. Appl. Surf. Sci. 2018, 442, 640–649. [Google Scholar] [CrossRef]
  23. Gopi, T.; Swetha, G.; Chandra Shekar, S.; Ramakrishna, C.; Saini, B.; Krishna, R.; Rao, P.V.L. Catalytic Decomposition of Ozone on Nanostructured Potassium and Proton Containing α-MnO2 catalysts. Catal. Comm. 2017, 92, 51–55. [Google Scholar] [CrossRef]
  24. Lin, F.; Zhang, Z.; Li, N.; Yan, B.; He, C.; Hao, Z.; Chen, G. How to Achieve Complete Elimination of Cl-VOCs: A Critical Review on Byproducts Formation and Inhibition Strategies during Catalytic Oxidation. Chem. Eng. J. 2021, 404, 126534. [Google Scholar] [CrossRef]
  25. Abedi, K.; Ghorbani-Shahna, F.; Jaleh, B.; Bahrami, A.; Yarahmadi, R.; Haddadi, R.; Gandomi, M. Decomposition of Chlorinated Volatile Organic Compounds (CVOCs) Using NTP Coupled with TiO2/GAC, ZnO/GAC, and TiO2–ZnO/GAC in a Plasma-Assisted Catalysis System. J. Electrost. 2015, 73, 80–88. [Google Scholar] [CrossRef]
  26. Drits, V.A.; Silvester, E.; Gorshkov, A.I.; Manceau, A. Structure of Synthetic Monoclinic Na-Rich Birnessite and Hexagonal Birnessite; I, Results from X-Ray Diffraction and Selected-Area Electron Diffraction. Am. Mineral. 1997, 82, 946–961. [Google Scholar] [CrossRef]
  27. Gaillot, A.-C. Caractérisation Structurale de La Birnessite: Influence Du Protocole de Synthèse. Ph.D. Thesis, Université Joseph-Fourier-Grenoble I, Grenoble, France, 2002. [Google Scholar]
  28. Villalobos, M.; Lanson, B.; Manceau, A.; Toner, B.; Sposito, G. Structural Model for the Biogenic Mn Oxide Produced by Pseudomonas Putida. Am. Mineral. 2006, 91, 489–502. [Google Scholar] [CrossRef] [Green Version]
  29. Li, L.; Zhang, P.; Cao, R. Porous Manganese Oxides Synthesized with Natural Products at Room Temperature: A Superior Humidity-Tolerant Catalyst for Ozone Decomposition. Catal. Sci. Technol. 2020, 10, 2254–2267. [Google Scholar] [CrossRef]
  30. Cao, R.; Zhang, P.; Liu, Y.; Zheng, X. Ammonium-Treated Birnessite-Type MnO2 to Increase Oxygen Vacancies and Surface Acidity for Stably Decomposing Ozone in Humid Condition. Appl. Surf. Sci. 2019, 495, 143607. [Google Scholar] [CrossRef]
  31. Liu, Y.; Zhou, H.; Cao, R.; Liu, X.; Zhang, P.; Zhan, J.; Liu, L. Facile and Green Synthetic Strategy of Birnessite-Type MnO2 with High Efficiency for Airborne Benzene Removal at Low Temperatures. Appl. Catal. B Environ. 2019, 245, 569–582. [Google Scholar] [CrossRef]
  32. De Rivas, B.; López-Fonseca, R.; González-Velasco, J.R.; Gutiérrez-Ortiz, J.I. On the Mechanism of the Catalytic Destruction of 1,2-Dichloroethane over Ce/Zr Mixed Oxide Catalysts. J. Mol. Catal. A Chem. 2007, 278, 181–188. [Google Scholar] [CrossRef]
  33. Eren, E.; Gumus, H.; Eren, B.; Sarihan, A. Surface Acidity of H-Birnessite: Infrared Spectroscopic Study of Formic Acid Decomposition. Spectrosc. Lett. 2013, 46, 60–66. [Google Scholar] [CrossRef]
  34. Tang, X.; Li, J.; Sun, L.; Hao, J. Origination of N2O from NO Reduction by NH3 over β-MnO2 and α-Mn2O3. Appl. Catal. B Environ. 2010, 99, 156–162. [Google Scholar] [CrossRef]
  35. Sun, M.; Zhang, B.; Liu, H.; He, B.; Ye, F.; Yu, L.; Sun, C.; Wen, H. The Effect of Acid/Alkali Treatment on the Catalytic Combustion Activity of Manganese Oxide Octahedral Molecular Sieves. RSC Adv. 2017, 7, 3958–3965. [Google Scholar] [CrossRef] [Green Version]
  36. Biesinger, M.C.; Payne, B.P.; Grosvenor, A.P.; Lau, L.W.M.; Gerson, A.R.; Smart, R.S.C. Resolving Surface Chemical States in XPS Analysis of First Row Transition Metals, Oxides and Hydroxides: Cr, Mn, Fe, Co and Ni. Appl. Surf. Sci. 2011, 257, 2717–2730. [Google Scholar] [CrossRef]
  37. Galakhov, V.R.; Demeter, M.; Bartkowski, S.; Neumann, M.; Ovechkina, N.A.; Kurmaev, E.Z.; Lobachevskaya, N.I.; Mukovskii, Y.M.; Mitchell, J.; Ederer, D.L. Mn 3 s Exchange Splitting in Mixed-Valence Manganites. Phys. Rev. B 2002, 65, 113102. [Google Scholar] [CrossRef]
  38. Santos, V.P.; Pereira, M.F.R.; Órfão, J.J.M.; Figueiredo, J.L. Catalytic Oxidation of Ethyl Acetate over a Cesium Modified Cryptomelane Catalyst. Appl. Catal. B Environ. 2009, 88, 550–556. [Google Scholar] [CrossRef]
  39. Dhandapani, B.; Oyama, S.T. Gas Phase Ozone Decomposition Catalysts. Appl. Catal. B Environ. 1997, 11, 129–166. [Google Scholar] [CrossRef]
  40. Li, W.; Oyama, S.T. Mechanism of Ozone Decomposition on a Manganese Oxide Catalyst. 2. Steady-State and Transient Kinetic Studies. J. Am. Chem. Soc 1998, 120, 9047–9052. [Google Scholar] [CrossRef]
  41. Li, W.; Gibbs, G.V.; Oyama, S.T.; April, R.V. Mechanism of Ozone Decomposition on a Manganese Oxide Catalyst. 1. In Situ Raman Spectroscopy and Ab Initio Molecular Orbital Calculations. J. Am. Chem. Soc. 1998, 120, 9041–9046. [Google Scholar] [CrossRef]
  42. Zhu, G.; Zhu, J.; Jiang, W.; Zhang, Z.; Wang, J.; Zhu, Y.; Zhang, Q. Surface Oxygen Vacancy Induced A-MnO2 nanofiber for Highly Efficient Ozone Elimination. Appl. Catal. B Environ. 2017, 209, 729–737. [Google Scholar] [CrossRef]
  43. Gopi, T.; Swetha, G.; Chandra Shekar, S.; Ramakrishna, C.; Saini, B.; Krishna, R.; Rao, P.V.L. Catalytic Decomposition of Gaseous Ozone over Manganese Dioxides with Different Crystal Structures. Catal. Comm. 2016, 189, 210–218. [Google Scholar]
  44. Li, X.; Ma, J.; He, H. Recent Advances in Catalytic Decomposition of Ozone. J. Environ. Sci. 2020, 94, 14–31. [Google Scholar] [CrossRef]
  45. Vandenbroucke, A.M.; Dinh, M.T.N.; Giraudon, J.M.; Morent, R.; De Geyter, N.; Lamonier, J.F.; Leys, C. Qualitative By-Product Identification of Plasma-Assisted TCE Abatement by Mass Spectrometry and Fourier-Transform Infrared Spectroscopy. Plasma Chem. Plasma Process. 2011, 31, 707–718. [Google Scholar] [CrossRef]
  46. Vandenbroucke, A.M.; Morent, R.; De Geyter, N.; Leys, C. Decomposition of Trichloroethylene with Plasma-Catalysis: A Review. J. Adv. Oxid. Technol. 2011, 14, 165–175. [Google Scholar] [CrossRef]
  47. Vandenbroucke, A.M.; Aerts, R.; Van Gaens, W.; De Geyter, N.; Leys, C.; Morent, R.; Bogaerts, A. Modeling and Experimental Study of Trichloroethylene Abatement with a Negative Direct Current Corona Discharge. Plasma Chem. Plasma Process. 2015, 35, 217–230. [Google Scholar] [CrossRef]
  48. Vandenbroucke, A.M.; Nguyen Dinh, M.T.; Nuns, N.; Giraudon, J.-M.; De Geyter, N.; Leys, C.; Lamonier, J.-F.; Morent, R. Combination of Non-Thermal Plasma and Pd/LaMnO3 for Dilute Trichloroethylene Abatement. Chem. Eng. J. 2016, 283, 668–675. [Google Scholar] [CrossRef]
  49. Peyrous, R. The Effect of Relative Humidity on Ozone Production by Corona Discharge in Oxygen or Air-A Numerical Simulation-Part II: Air. Ozone Sci. Eng. 1990, 12, 41–64. [Google Scholar] [CrossRef]
  50. Chen, J.; Wang, P. Effect of Relative Humidity on Electron Distribution and Ozone Production by DC Coronas in Air. IEEE trans. Plasma Sci. 2005, 33, 808–812. [Google Scholar] [CrossRef]
  51. Dinh, M.T.N.; Giraudon, J.-M.; Vandenbroucke, A.M.; Morent, R.; De Geyter, N.; Lamonier, J.-F. Post Plasma-Catalysis for Total Oxidation of Trichloroethylene over Ce–Mn Based Oxides Synthesized by a Modified “Redox-Precipitation Route”. App. Catal. B Environ. 2015, 172, 65–72. [Google Scholar] [CrossRef]
  52. Dinh, M.T.N.; Giraudon, J.M.; Lamonier, J.F.; Vandenbroucke, A.; De Geyter, N.; Leys, C.; Morent, R. Plasma-Catalysis of Low TCE Concentration in Air Using LaMnO3+δ as Catalyst. Appl. Catal. B Environ. 2014, 147, 904–911. [Google Scholar] [CrossRef]
  53. Vandenbroucke, A. Abatement of Volatile Organic Compounds by Combined Use of Non-Thermal Plasma and Heterogeneous catalysis. Ph.D. Thesis, University of Ghent, Ghent, Belgium, 2015. [Google Scholar]
Figure 1. XRD patterns of the Ce0.01Mn-400 and Ce0.01Mn-AT samples.
Catalysts 11 00946 g001
Figure 2. (a) N2 adsorption and desorption and (b) pore size distribution of Ce0.01Mn-400 and Ce0.01Mn-AT samples.
Catalysts 11 00946 g002
Figure 3. FTIR spectra of the Py region obtained after Py adsorption at 150 °C for the dried Ce0.01Mn and Ce0.01Mn-AT samples.
Catalysts 11 00946 g003
Figure 4. XPS Mn2p3/2 core level decomposition for Ce0.01Mn-400 and Ce0.01Mn-AT samples.
Catalysts 11 00946 g004
Figure 5. Ozone conversion in Ce0.01Mn-400 and Ce0.01Mn-AT ([O3] = 300 ppmv, GHSV = 1200 L/(gcata·h); RH = 0.7%).
Catalysts 11 00946 g005
Figure 6. COx, CO and CO2 yields obtained in NTP TCE abatement with RH of 0.7% and 15% (ED = 150 J/L; Q = 1 L/min; [TCE]0 = 150 ppmv).
Catalysts 11 00946 g006
Figure 7. FT-IR spectra for the ranges 2500–1700 cm−1 and 1110–700 cm−1 of the outlet stream after NTP with 0.7% 15% as relative humidity (ED = 150 J/L, Q= 1 L/min). PG: phosgene; DCAC: dichloroacetylchloride; TCAD: trichloroacetaldehyde.
Catalysts 11 00946 g007
Figure 8. COx and CO2 yields obtained for TCE abatement (RH = 0.7%) in the PPC configuration with Ce00.1Mn-400 and Ce0.01Mn-AT as catalysts.
Catalysts 11 00946 g008
Figure 9. FT-IR spectra of the inlet TCE and outlet gaseous stream after the PPC process (RH = 0.7%) as a function of time with Ce0.01Mn-400 as the catalyst. PG: phosgene; DCAC: dichloroacetylchloride; TCAD: trichloroacetaldehyde.
Catalysts 11 00946 g009
Figure 10. FT-IR spectra of the inlet TCE and outlet gaseous stream after the PPC process (RH = 0.7%) as a function of time with Ce0.01Mn-AT as the catalyst. PG: phosgene; DCAC: dichloroacetylchloride; TCAD: trichloroacetaldehyde.
Catalysts 11 00946 g010
Figure 11. COx and CO2 yields obtained for TCE abatement (RH = 15%) in the PPC configuration with Ce0.01Mn-AT as the catalyst.
Catalysts 11 00946 g011
Figure 12. FT-IR spectra of the inlet TCE and outlet gaseous stream after the PPC process (RH = 15%) with Ce0.01Mn-AT as the catalyst as a function of time. PG: phosgene; DCAC: dichloroacetylchloride; TCAD: trichloroacetaldehyde.
Catalysts 11 00946 g012
Figure 13. Decomposition of XPS (a) Mn2p3/2 and (b) Cl2p core levels after the PPC process.
Catalysts 11 00946 g013
Figure 14. Schematic diagram of the experimental setup.
Catalysts 11 00946 g014
Table 1. Weight composition and atomic ratio for the Ce0.01Mn-400 and Ce0.01Mn-AT samples.
SampleWeight/%Atomic Ratio
KNaCeMnK/MnNa/MnCe/Mn
Ce0.01Mn-4007.101.991.1849.200.3400.0570.009
Ce0.01Mn-AT1.300.011.0652.010.0590.0040.008
Table 2. Textural properties of the Ce0.01Mn-400 and Ce0.01Mn-AT samples.
SampleSBET/m2/gDp max/nmVp tot/cm3/g
Ce0.01Mn-4001324.00.22
Ce0.01Mn-AT3855.30.37
Table 3. Semi-quantitative XPS analysis for used (PPC) catalysts.
CatalystO/MnK/MnNa/MnCe/MnCl/MnMn3+/Mn4+Mn AOS from Mn 3s Splitting
Ce0.01Mn-4002.070.180.050.015 0.343.44
Ce0.01Mn-400-PPC2.340.260.050.0240.180.213.56
Ce0.01Mn-AT1.970.06-0.018 0.383.32
Ce0.01Mn-AT-PPC1.910.04-0.0280.160.293.42
Ce0.01Mn-AT-PPC-15%1.810.04-0.0250.220.283.41
Table 4. Experimental conditions for the PPC tests.
Air sourceAir liquid, Alphagaz 1
Flow rate1 L/min
Relative humidity (RH)0.7%/15%
Energy density150 J/L
Initial TCE concentration150 ppmv
CatalystCe0.01Mn-400 and Ce0.01Mn-AT
0.1 g of catalyst mixed with 1 g of SiC
Activation conditions200 mL/min, 100 °C for 1 h
Catalyst temperature100 °C
Publisher’s Note: MDPI stays neutral with regard to jurisdictional claims in published maps and institutional affiliations.

