Article

Noble Metal Promoted TiO2 from Silver-Waste Valorisation: Synergism between Ag and Au

1
Chemistry Department, University of Milan, Via Golgi 19, 20133 Milan, Italy
2
Centre for Energy Research, Thin Film Physics Department, Institute of Technical Physics and Materials Science, P.O. Box 49, H-1525 Budapest, Hungary
*
Author to whom correspondence should be addressed.
Submission received: 18 January 2022 / Revised: 10 February 2022 / Accepted: 17 February 2022 / Published: 19 February 2022
(This article belongs to the Special Issue Catalytic Processes of Bimetallic Nanoparticles)

Abstract

:
Wastewaters from precious metal industries contain high amounts of noble metals, but their efficient recycling is hindered by the wastewater complex composition. Here, we propose an innovative approach for the efficient recovery of noble metals contained in these metal-enriched wastewaters as precursors for the synthesis of noble metal nanoparticles (NPs) and supported metal catalysts. Silver NPs were synthesized from Ag-enriched wastewater and then deposited on TiO2 to prepare photocatalysts. Then, further promotion of the photocatalytic activity of Ag-modified TiO2 was achieved by the addition of as little as 0.5 wt.% of Au. STEM-EDS analyses proved that Au NPs were located on Ag or AgOx nanoparticles. The contact between the two metal-containing NPs results in charge transfer effects, appreciable both in terms of oxidation states determined by XPS and of optical properties. In particular, the plasmon band of Au NPs shows photochromic effects: under UV light irradiation, bimetallic samples exhibit a blue-shift of the plasmon band, which is reversible under dark storage. The activity of the materials was tested towards ethanol photodegradation under UV light. Adding 0.5 wt.% Au NPs resulted in a promoted activity compared to Ag-TiO2, thus showing synergistic effects between Au and Ag. Ethanol was completely converted already after 1 h of UV irradiation, acetaldehyde was formed as the main oxidation product and fully degraded in less than 180 min. Notably, bimetallic samples showed ethylene formation by a parallel dehydration mechanism.

1. Introduction

Noble metal nanoparticles (NPs) absorb light because of the localized surface plasmon resonance (LSPR) phenomenon [1]. Silver NPs coupled with large band gap semiconductors, such as TiO2 show many advantages with respect to the unpromoted oxide semiconductor regarding materials energy and sustainability, such as plasmon-enhanced photocatalytic activity [2,3], improved antibacterial properties [4], extended visible light absorption for solar energy conversion and promoted H2 production [5]. Moreover, Ag2O can be coupled with TiO2, which has been reported to result in a large improvement of photocatalytic activity under UV/vis irradiation as well as high antimicrobial properties [6]. However, the use of noble metals is still limited by their high cost [7], thus search for alternatives is one of the greatest interest topics of nowadays. Most studies aim to find alternatives based on inexpensive and earth-abundant elements. On the other hand, much less space has been given to valorisation of noble metal containing waste. Wastewaters from precious metal industries can in fact contain high amounts of metals, even if their efficient recycling can be challenging. An innovative approach to recover them could be using these metal-enriched wastewaters as a precursor for the synthesis of noble metal nanoparticles, which can be in turn utilized to synthesize supported metal catalysts.
Waters coming from these industrial effluents are mostly enriched in noble metal ions, which can be chemically or electrochemically reduced. Indeed, small metal particles can be prepared by the chemical reduction of metal salts [8], as well as by electrochemistry [9]. Electrochemical methods show some advantages over chemical methods in terms of the possibility of obtaining high purity particles and an accurate particle size control by adjusting current density or applied potential [10]. Chen et al. [11] reported an electrochemical method to prepare well-dispersed silver nanoparticles in an aqueous phase using poly(N-vinylpyrrolidone) (PVP) as the protecting agent, showing that PVP played a role in accelerating the Ag particle formation reducing its deposition at the cathode. To the best of our knowledge, this methodology has not been yet applied to a wastewater solution enriched in Ag ions. Moreover, there are no studies in the literature presenting the use of such waters for preparing catalysts.
Thus, this research aims first to apply an electrochemical method to obtain silver nanoparticles using a wastewater Ag-enriched solution as a precursor, which are then used to prepare an Ag-modified TiO2 photocatalyst. TiO2 is one of the semiconductors most used as a photocatalyst for the degradation of organic compounds. The reaction occurs because when TiO2 is irradiated by the light of the proper wavelength [12], some of its electrons are promoted from the valence band to the conduction band, creating electron–hole pairs capable of inducing reduction and oxidation reactions [13]. Here, a pigmentary TiO2 has been used as photocatalytic support, according to [14]; however, it should be noted that the procedure of deposition of Ag nanoparticles recovered from waste holds a general validity and can be applied to different kinds of photocatalytic materials. Then, considering the possible limitations coming from the composition of material prepared using a non-pure precursor, we investigated the possibility to enhance its catalytic activity by adding a second metal. Bimetallic structures are often reported to have improved catalytic performances because of synergistic effects occurring between the two metal species [15].
It has been reported that the chemical stability of Ag nanostructures can be improved by forming bimetallic structures with a more stable metal as Au [16]. Ag/Au bimetals have shown high chemical stability and excellent electron trapping performance [17]. Furthermore, the combination between Ag and Au has been proposed to reduce the amount of noble metal and hence the cost of the whole material, being the required amount of Au in bimetallic structure is usually lower than the monometallic counterpart [15]. Moreover, as in the case of Ag, gold nanoparticles (Au NPs) are photosensitizers and are able to improve the efficiency of TiO2-based catalysts [18], because of their strong absorption of light based on their characteristics of localized surface plasmon resonance (LSPR) [19].
In this context, here we investigated the possible promotion of monometallic Ag species, obtained from silver-rich wastewater and supported on TiO2, with a small amount (0.5–2 wt.%) of Au NPs. In particular, the potential synergisms of bimetallic promotion were investigated towards ethanol photocatalytic degradation. Ethanol was chosen as the target molecule since it is one of the leading volatile organic compounds (VOCs) emitted in the atmosphere: in the last decades, it has been receiving increasing attention as the main product from biomass fermentation [20] and from solvent emission [21]. In this sense, the study of sustainable processes for the conversion of polluting molecules is crucial [22].

2. Results and Discussion

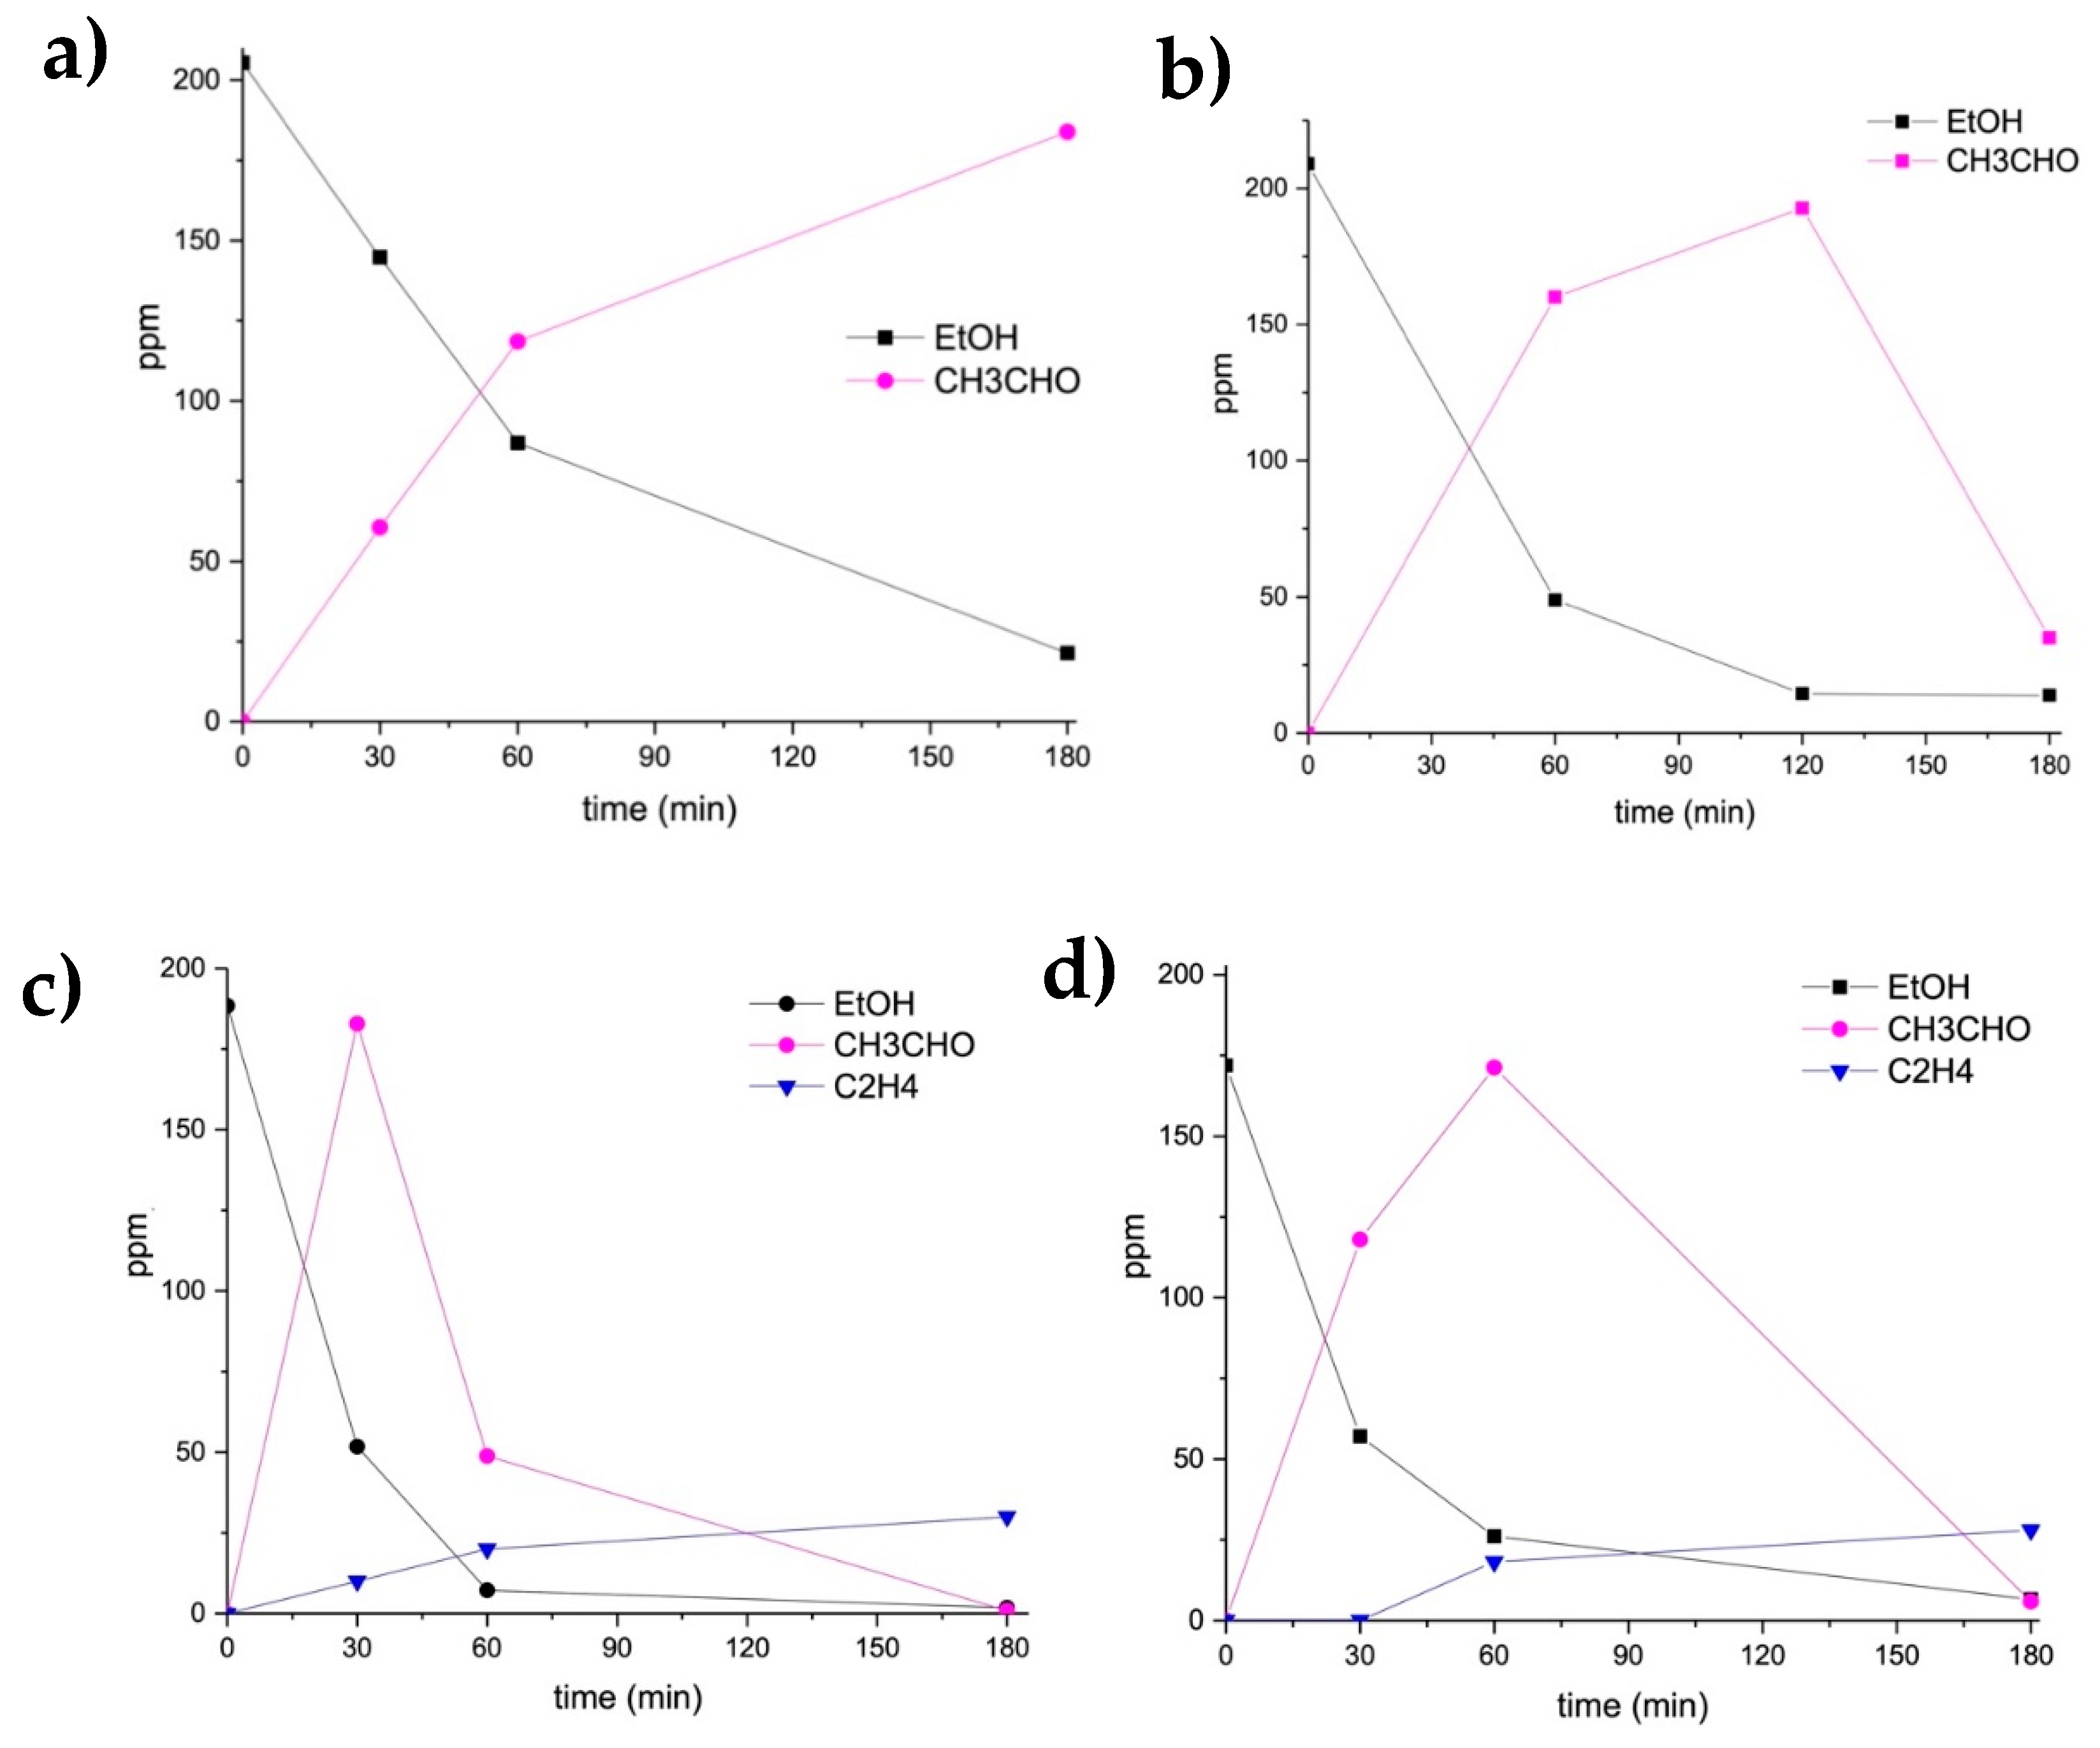
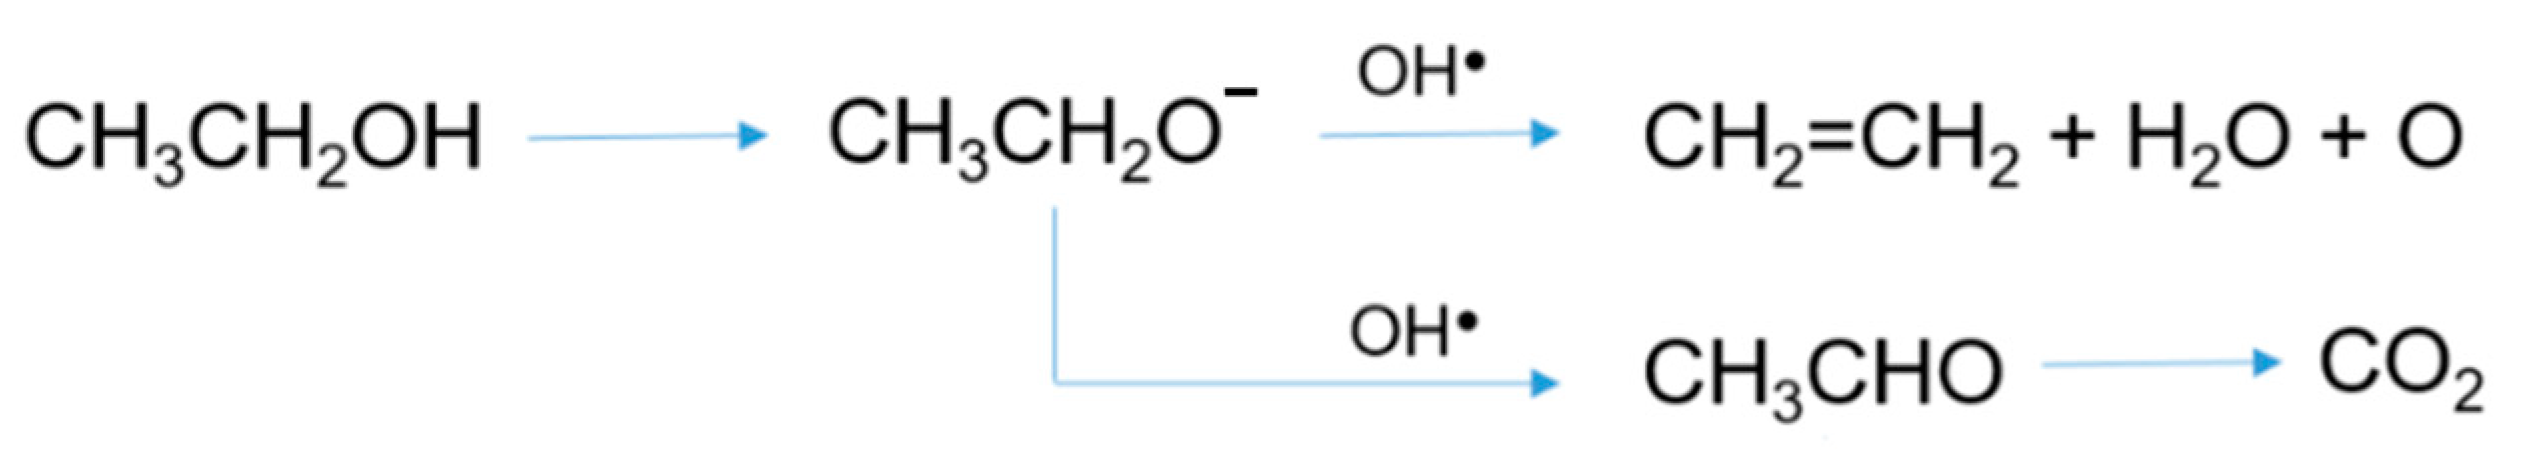
2.1. Catalytic Results: Photocatalytic Oxidation of Ethanol

We tested the samples in the photocatalytic oxidation of ethanol as a model compound, considering that it is now estimated to be the most important VOC emitted by mass (in 2017 approx. 16.8% of total VOC emissions) [21]. Alcohol oxidation is also interesting for obtaining some value-added products: in the case of ethanol photo-oxidation, the reaction can proceed through the dehydration to ethylene or the dehydrogenation to acetaldehyde [20].
The photocatalytic activity of the bare Kronos 1077 has already been reported by some of us [23]. This low cost, pigmentary TiO2 (Kronos 1077) was active under UV light. However, while it showed ethanol degradation and acetaldehyde formation, the degradation of the latter required a longer irradiation time compared to the metal-modified sample here reported. It should be considered that acetaldehyde is far more toxic and more stable to degradation compared to ethanol [24].
The photocatalytic degradation of ethanol under UV irradiation was then performed using the metal-promoted photocatalysts, i.e., the monometallic samples 3%Ag-TiO2 and 0.5%Au-TiO2, and the bimetallic samples 0.5%Au-TiO2 or 2%Au-3%Ag-TiO2 (Table 1).
The reaction profiles of ethanol photo-oxidation using the monometallic samples are reported in Figure 1a,b.
Looking at the photo-oxidation of ethanol using the monometallic 3%Ag-TiO2 (Figure 1a), ethanol was only partially converted in acetaldehyde, which was the sole detected product.
The monometallic Au supported on TiO2 (Figure 1b) was more active than 3%Ag-TiO2. Acetaldehyde was formed as a single product, but differently from the case of 3%Ag-TiO2. Here, its further degradation started after 2 h of reaction. However, also the monometallic gold was not able to reach the complete photodegradation of ethanol after 3 h of UV irradiation.
The ethanol photodegradation by the bimetallic samples was then performed. The reaction profiles over time during the ethanol photo-oxidation are reported in Figure 1c,d. These samples were obtained supporting Au nanoparticles (0.5–2 wt.%) on the previously synthesized 3%Ag-TiO2 using the Ag-enriched wastewater as a precursor.
Adding 0.5 wt.% Au nanoparticles markedly increased the activity compared to Ag-TiO2 catalyst (Figure 1c). Ethanol was almost completely converted already after 1 h of UV irradiation, forming acetaldehyde as the main oxidation product, and ethylene, which can be formed by a parallel pathway of dehydration (Figure 2), as reported by Nadeem et al. [20]. No other intermediates were detected: on these grounds and based on previous literature reports [24], acetaldehyde can be assumed to be further converted to CO2, as reported in Figure 2.
Thus, in our system, the presence of the two metals seems to favor a reduction mechanism. Similar behavior was also reported by Farfan-Arribas and co-authors [25] while studying the reaction of ethanol on bulk rutile-TiO2 (110) single crystals. They showed that both oxidation and a reduction of ethanol occurs on the surface, as both acetaldehyde and ethylene products were observed. In particular, the formation of oxidized versus reduced products was dependent on the number of defects in the crystal surface, as an increased concentration of oxygen vacancies promoted the formation of ethylene.
Similar behavior was obtained increasing the Au loading (2 wt.%), but the conversion of ethanol to acetaldehyde and its further degradation was slower than that obtained using the 0.5%Au-sample. Therefore, a very low Au content seems to promote better performances.
In order to explain these different results, deep characterization of the materials has been performed and results are discussed as follows.

2.2. Characterization Analyses
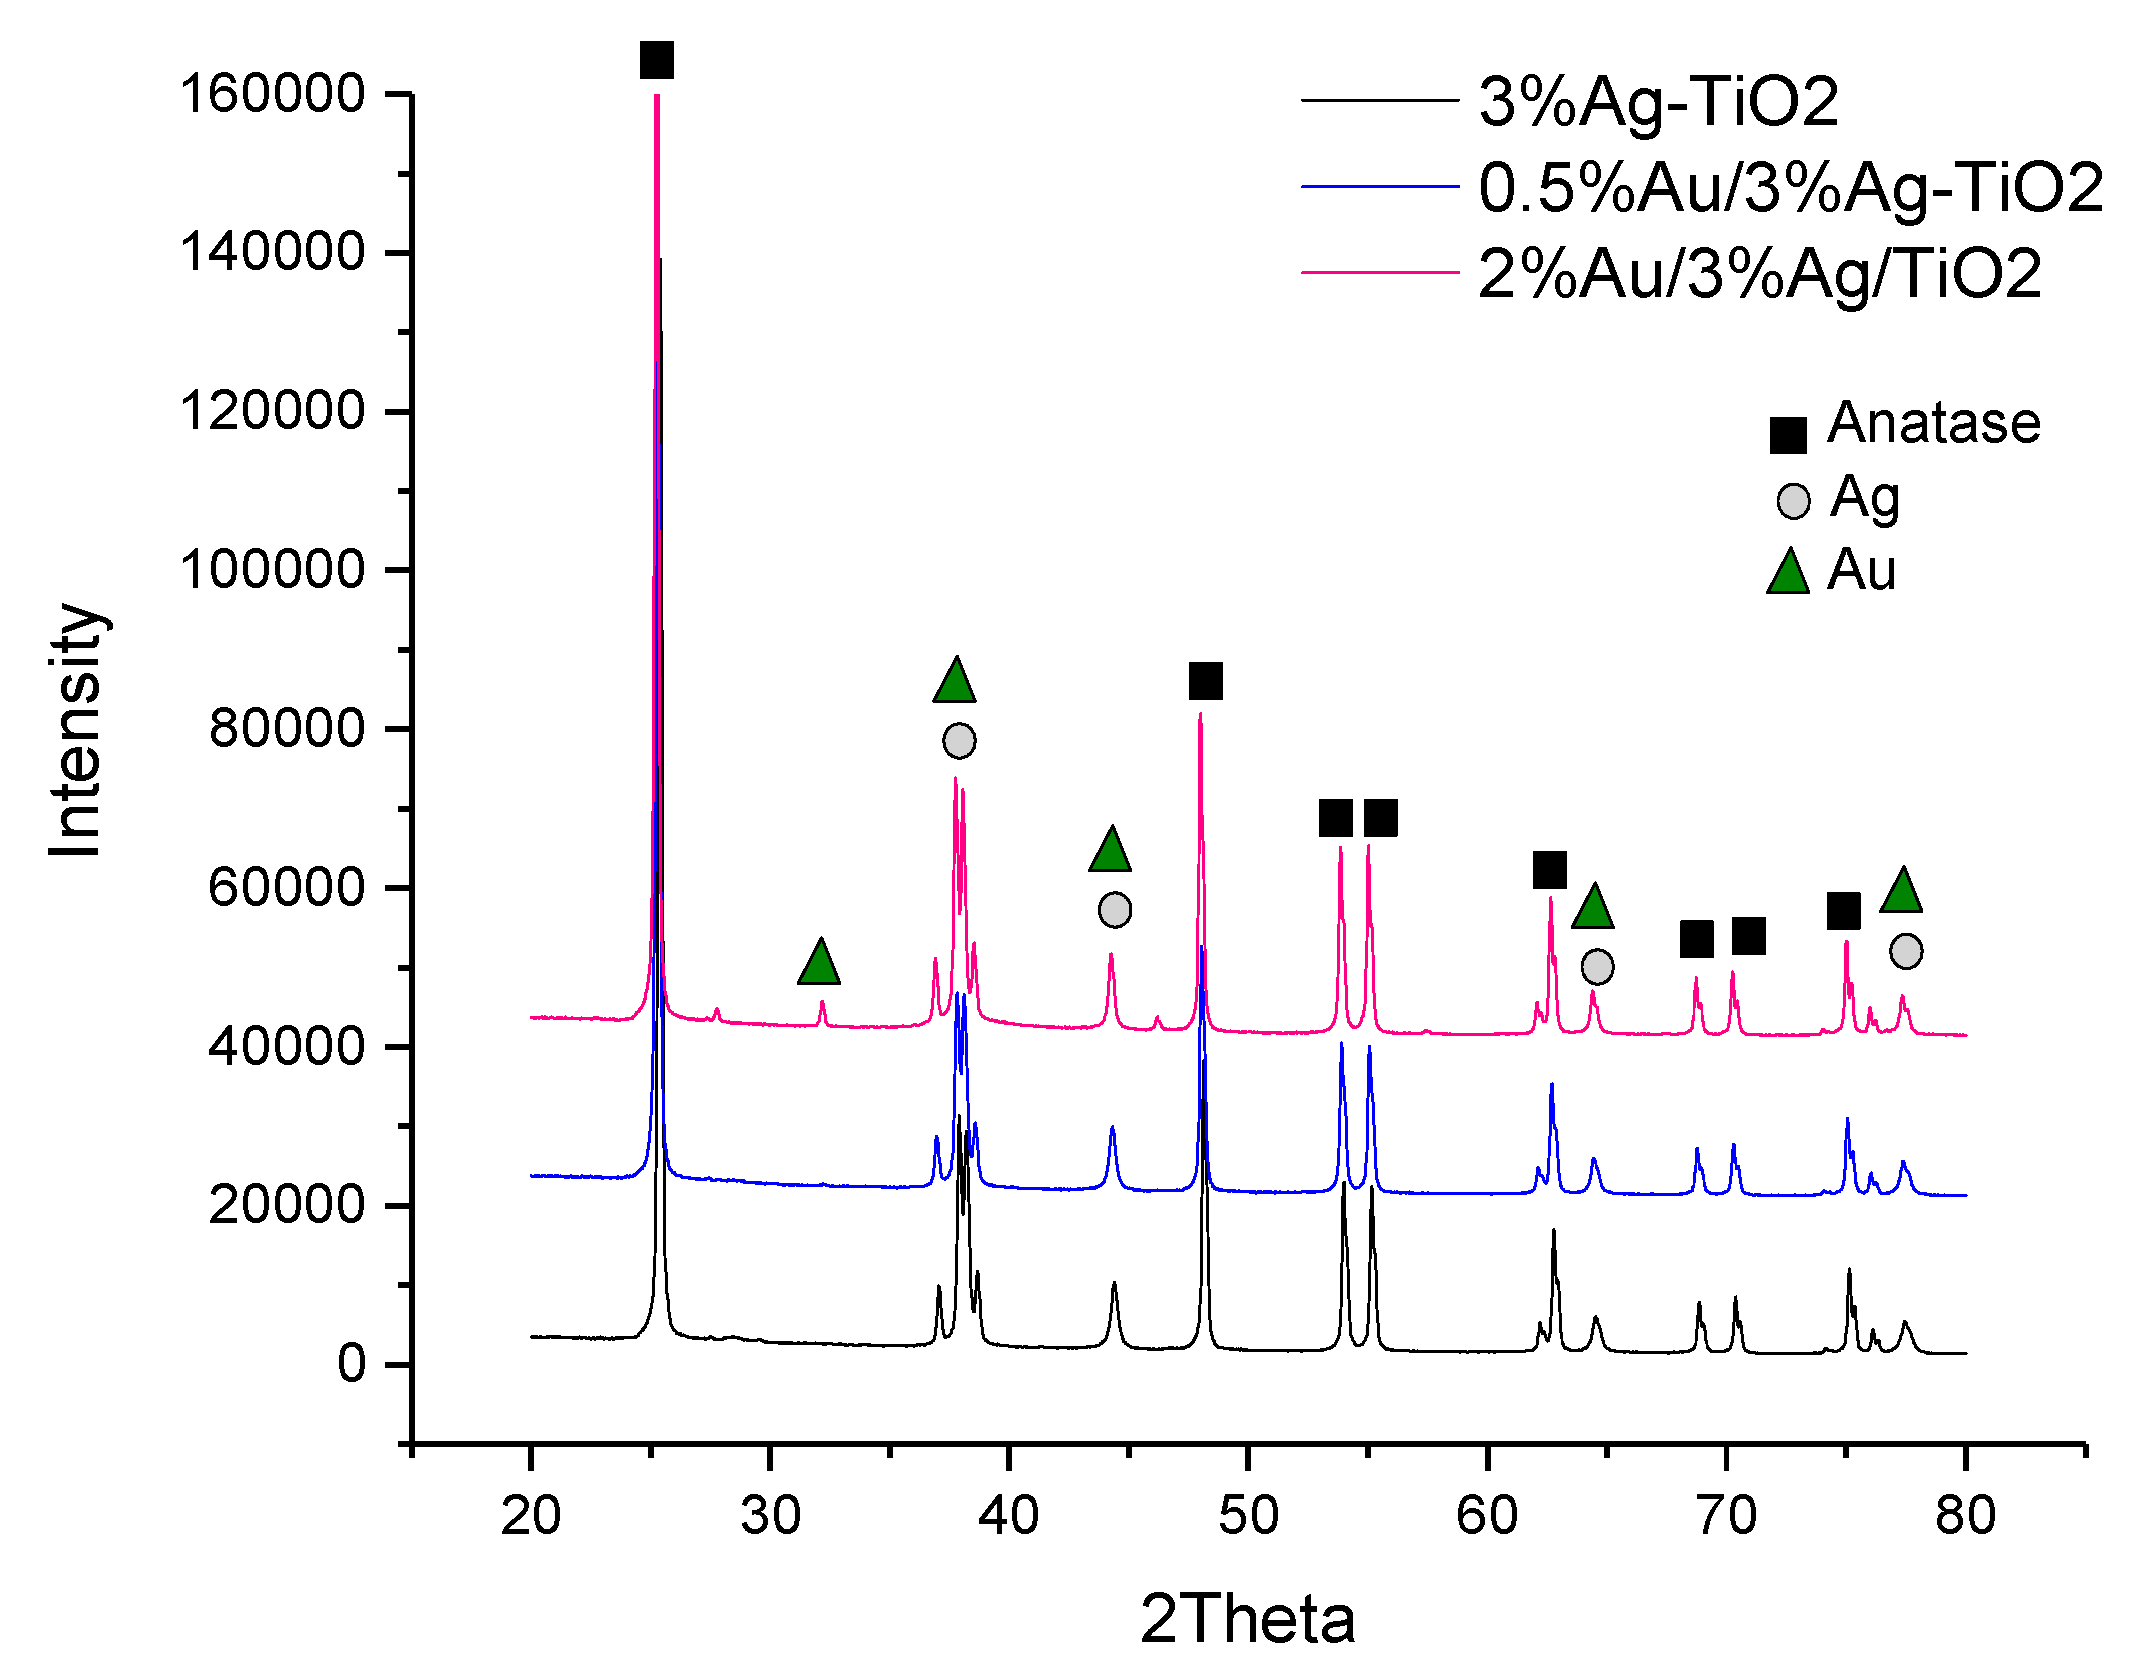
2.2.1. XRD Analyses

XRD analyses (Figure 3) were performed on the monometallic 3%Ag-TiO2 and on the corresponding bimetallic samples.
From the diffractograms reported in Figure 3, peaks related to TiO2 anatase (JCPDS No.: 88–1175 and 84–1286) are clearly detectable in all samples. The phase composition of the oxide support is not affected by the metal deposition procedure and ensuing calcination, as expected on the grounds of the low calcination temperature adopted. In Ag-promoted samples (3%Ag-TiO2, 0.5%Au/3%Ag-TiO2 and 2%Au/3%Ag-TiO2) peaks at 2θ of 65°, 78°, 45° confirm the presence of crystalline metallic Ag, whereas the peak at a 2θ of 38° reveals the presence of Ag2O, ascribable to the oxidation of Ag during the calcination step [26]. As expected, the low amount of Au did not allow for detecting any peaks related to the Au-containing phase in the XRD pattern of 0.5%Au/3%Ag-TiO2. On the other hand, the Au metal phase was detectable in the 2%Au/3%Ag-TiO2 sample. In particular, the latter shows a characteristic peak at 2θ 32–33° non-overlapping with other phases.

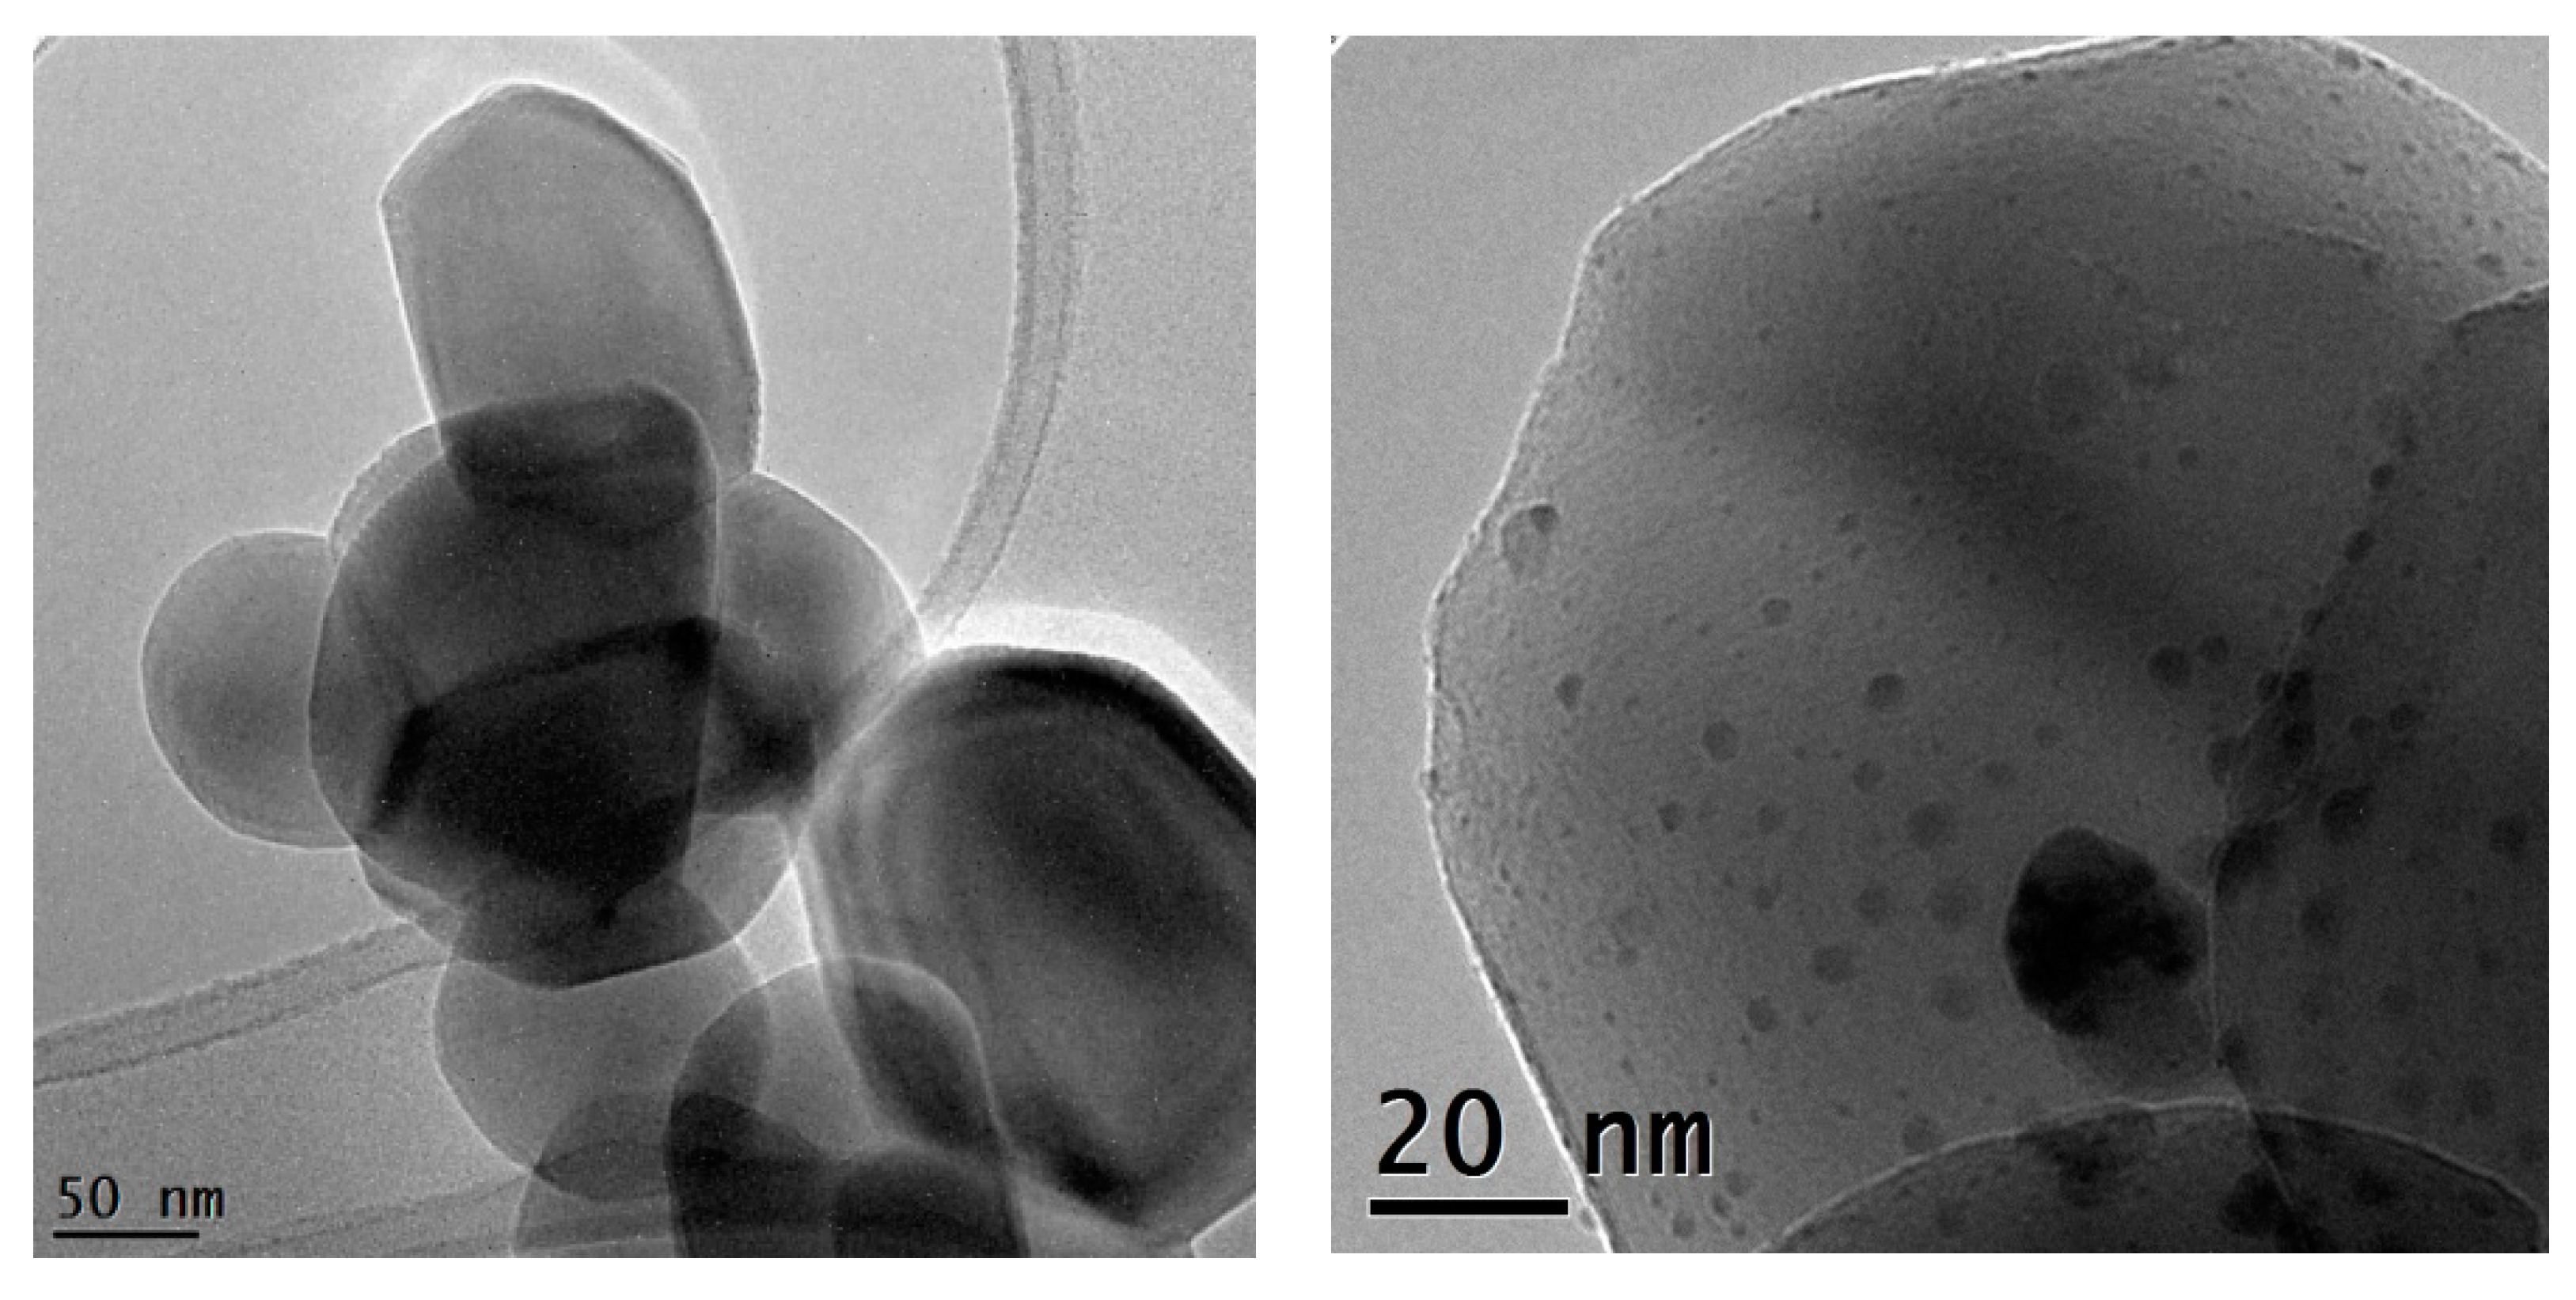
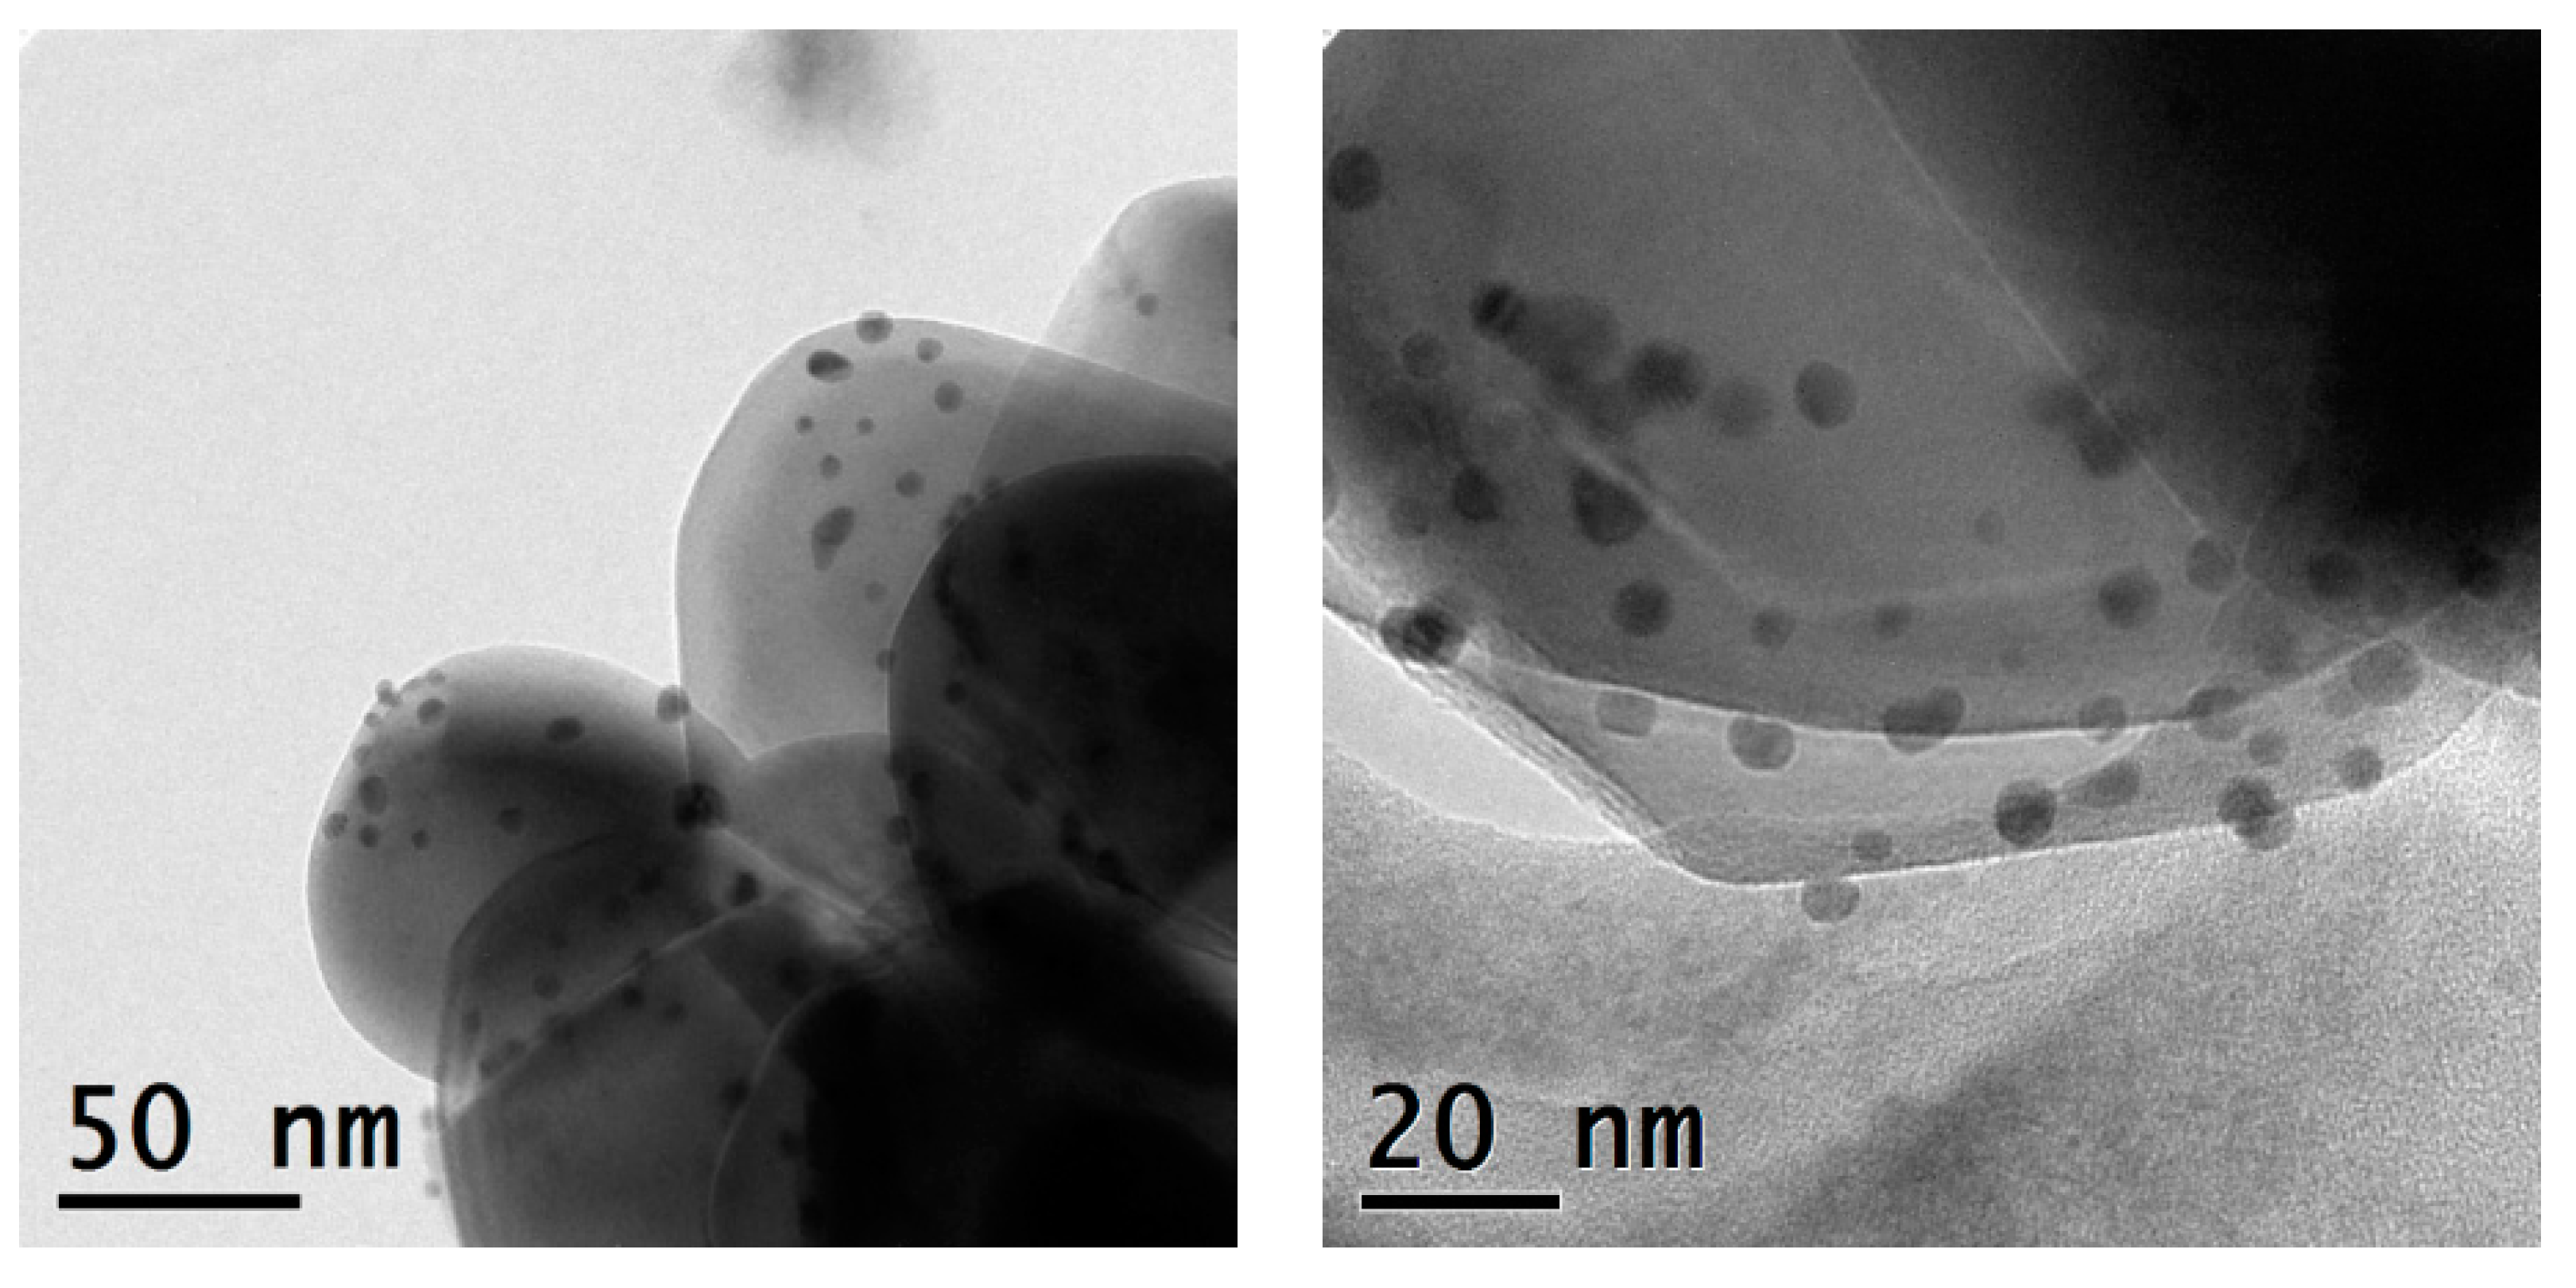
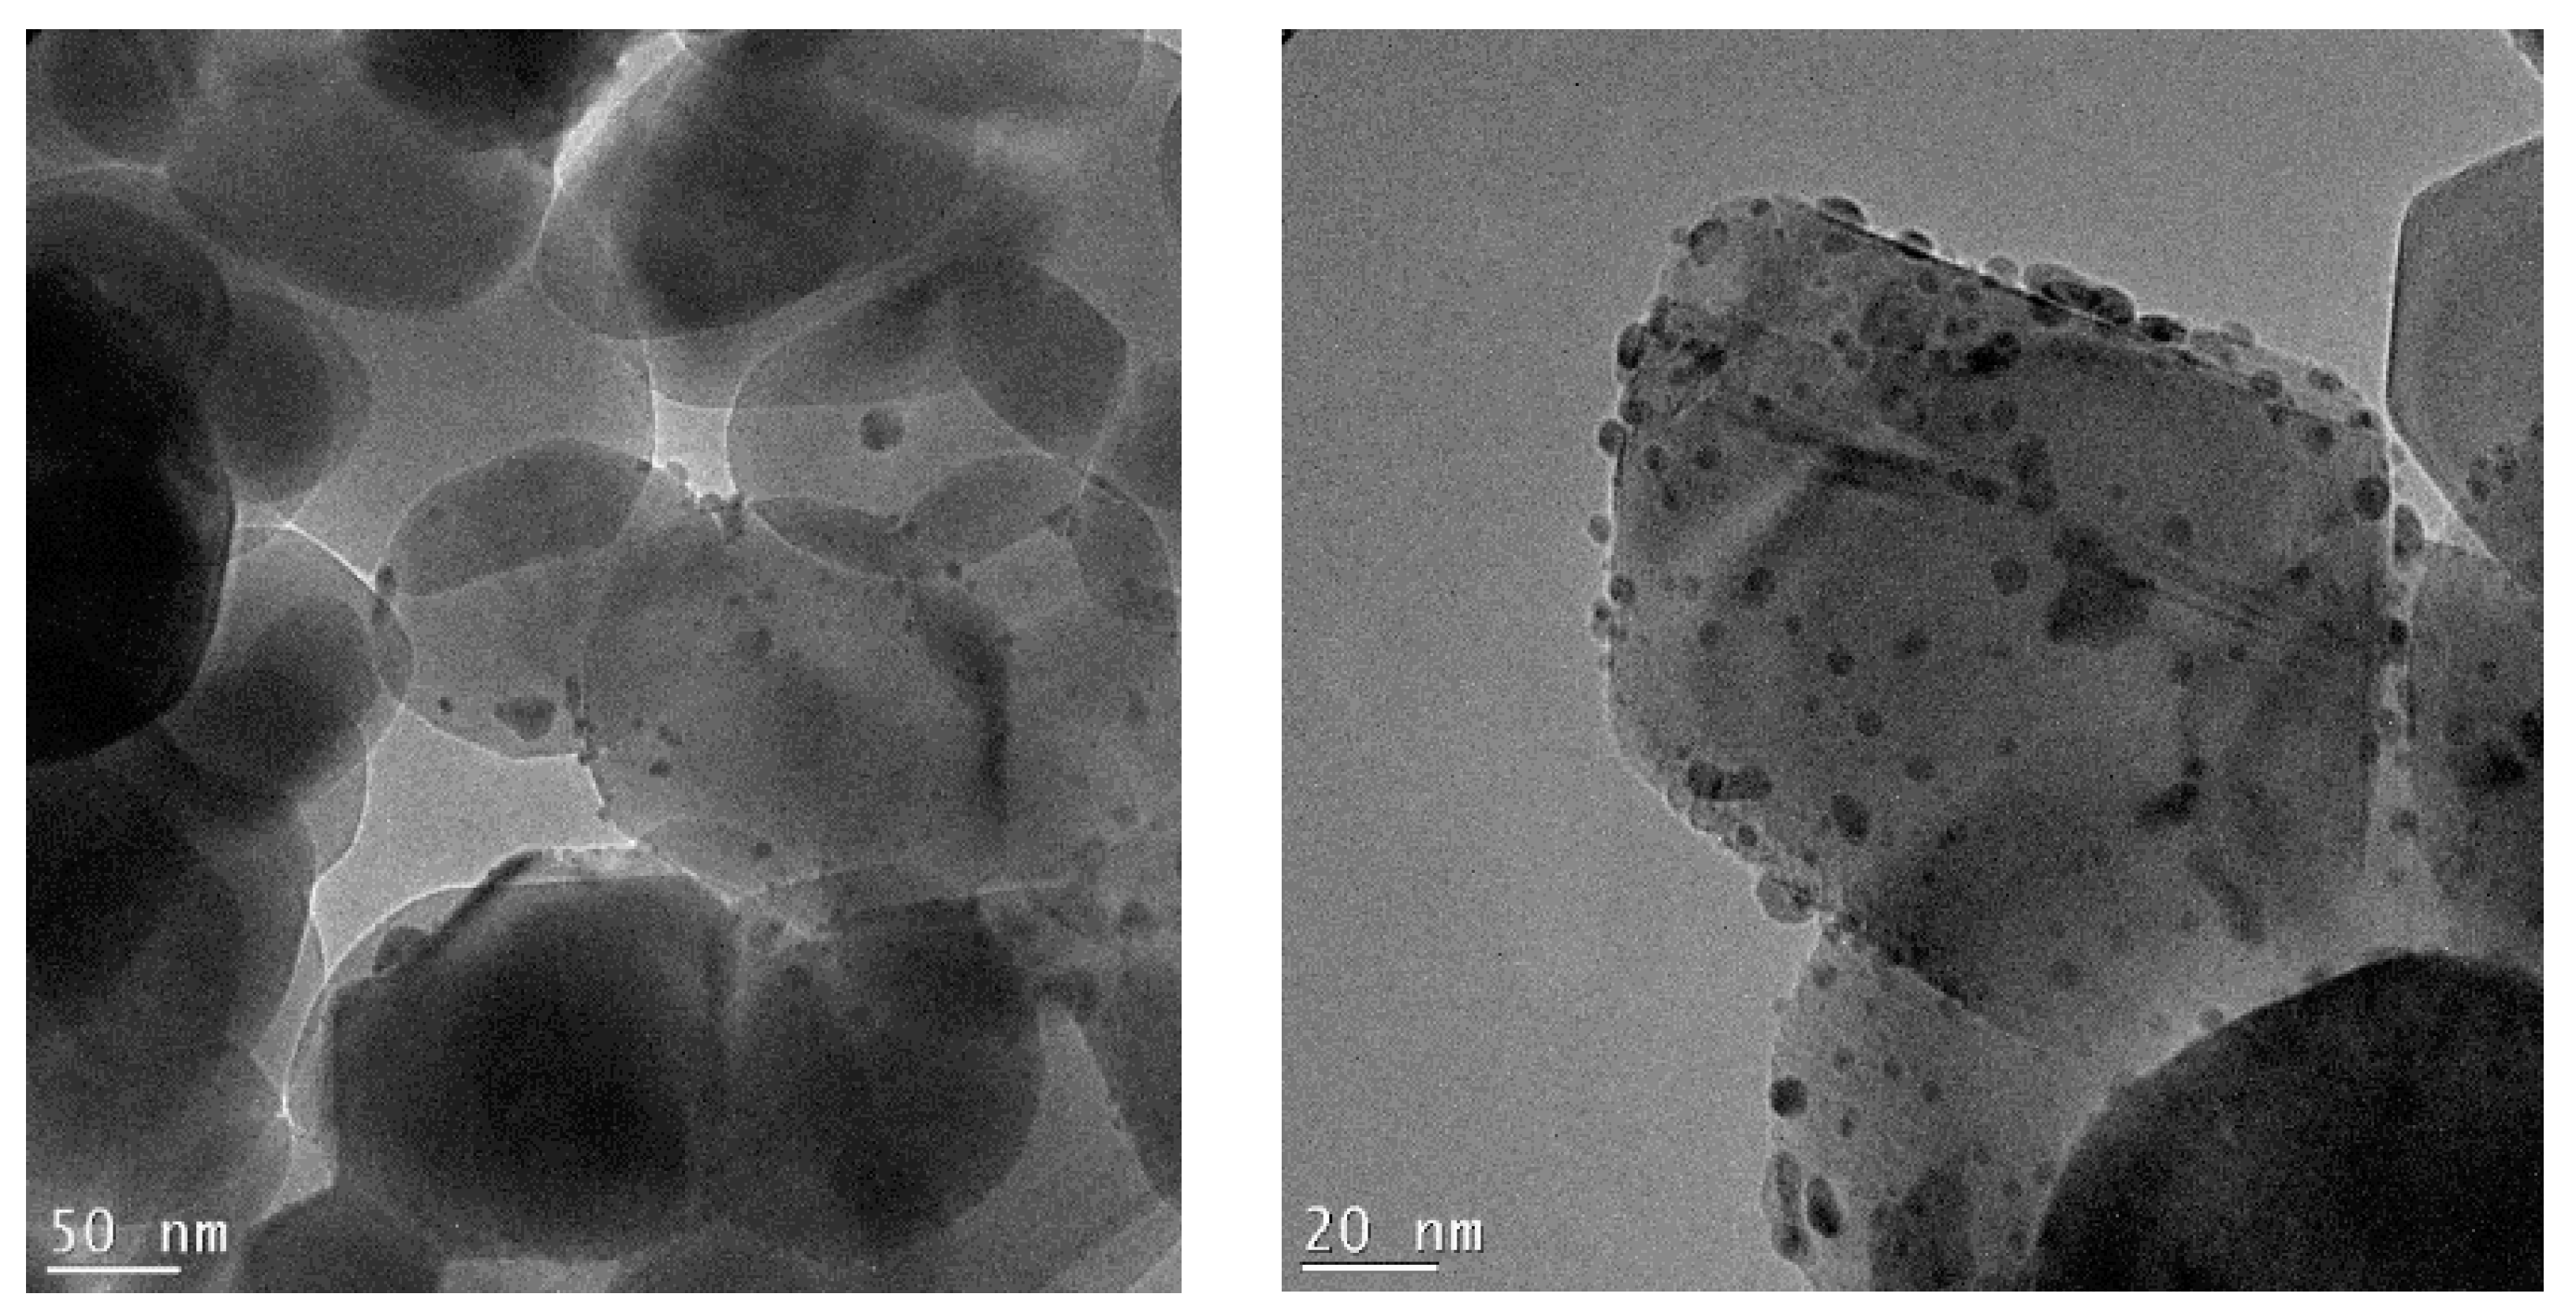
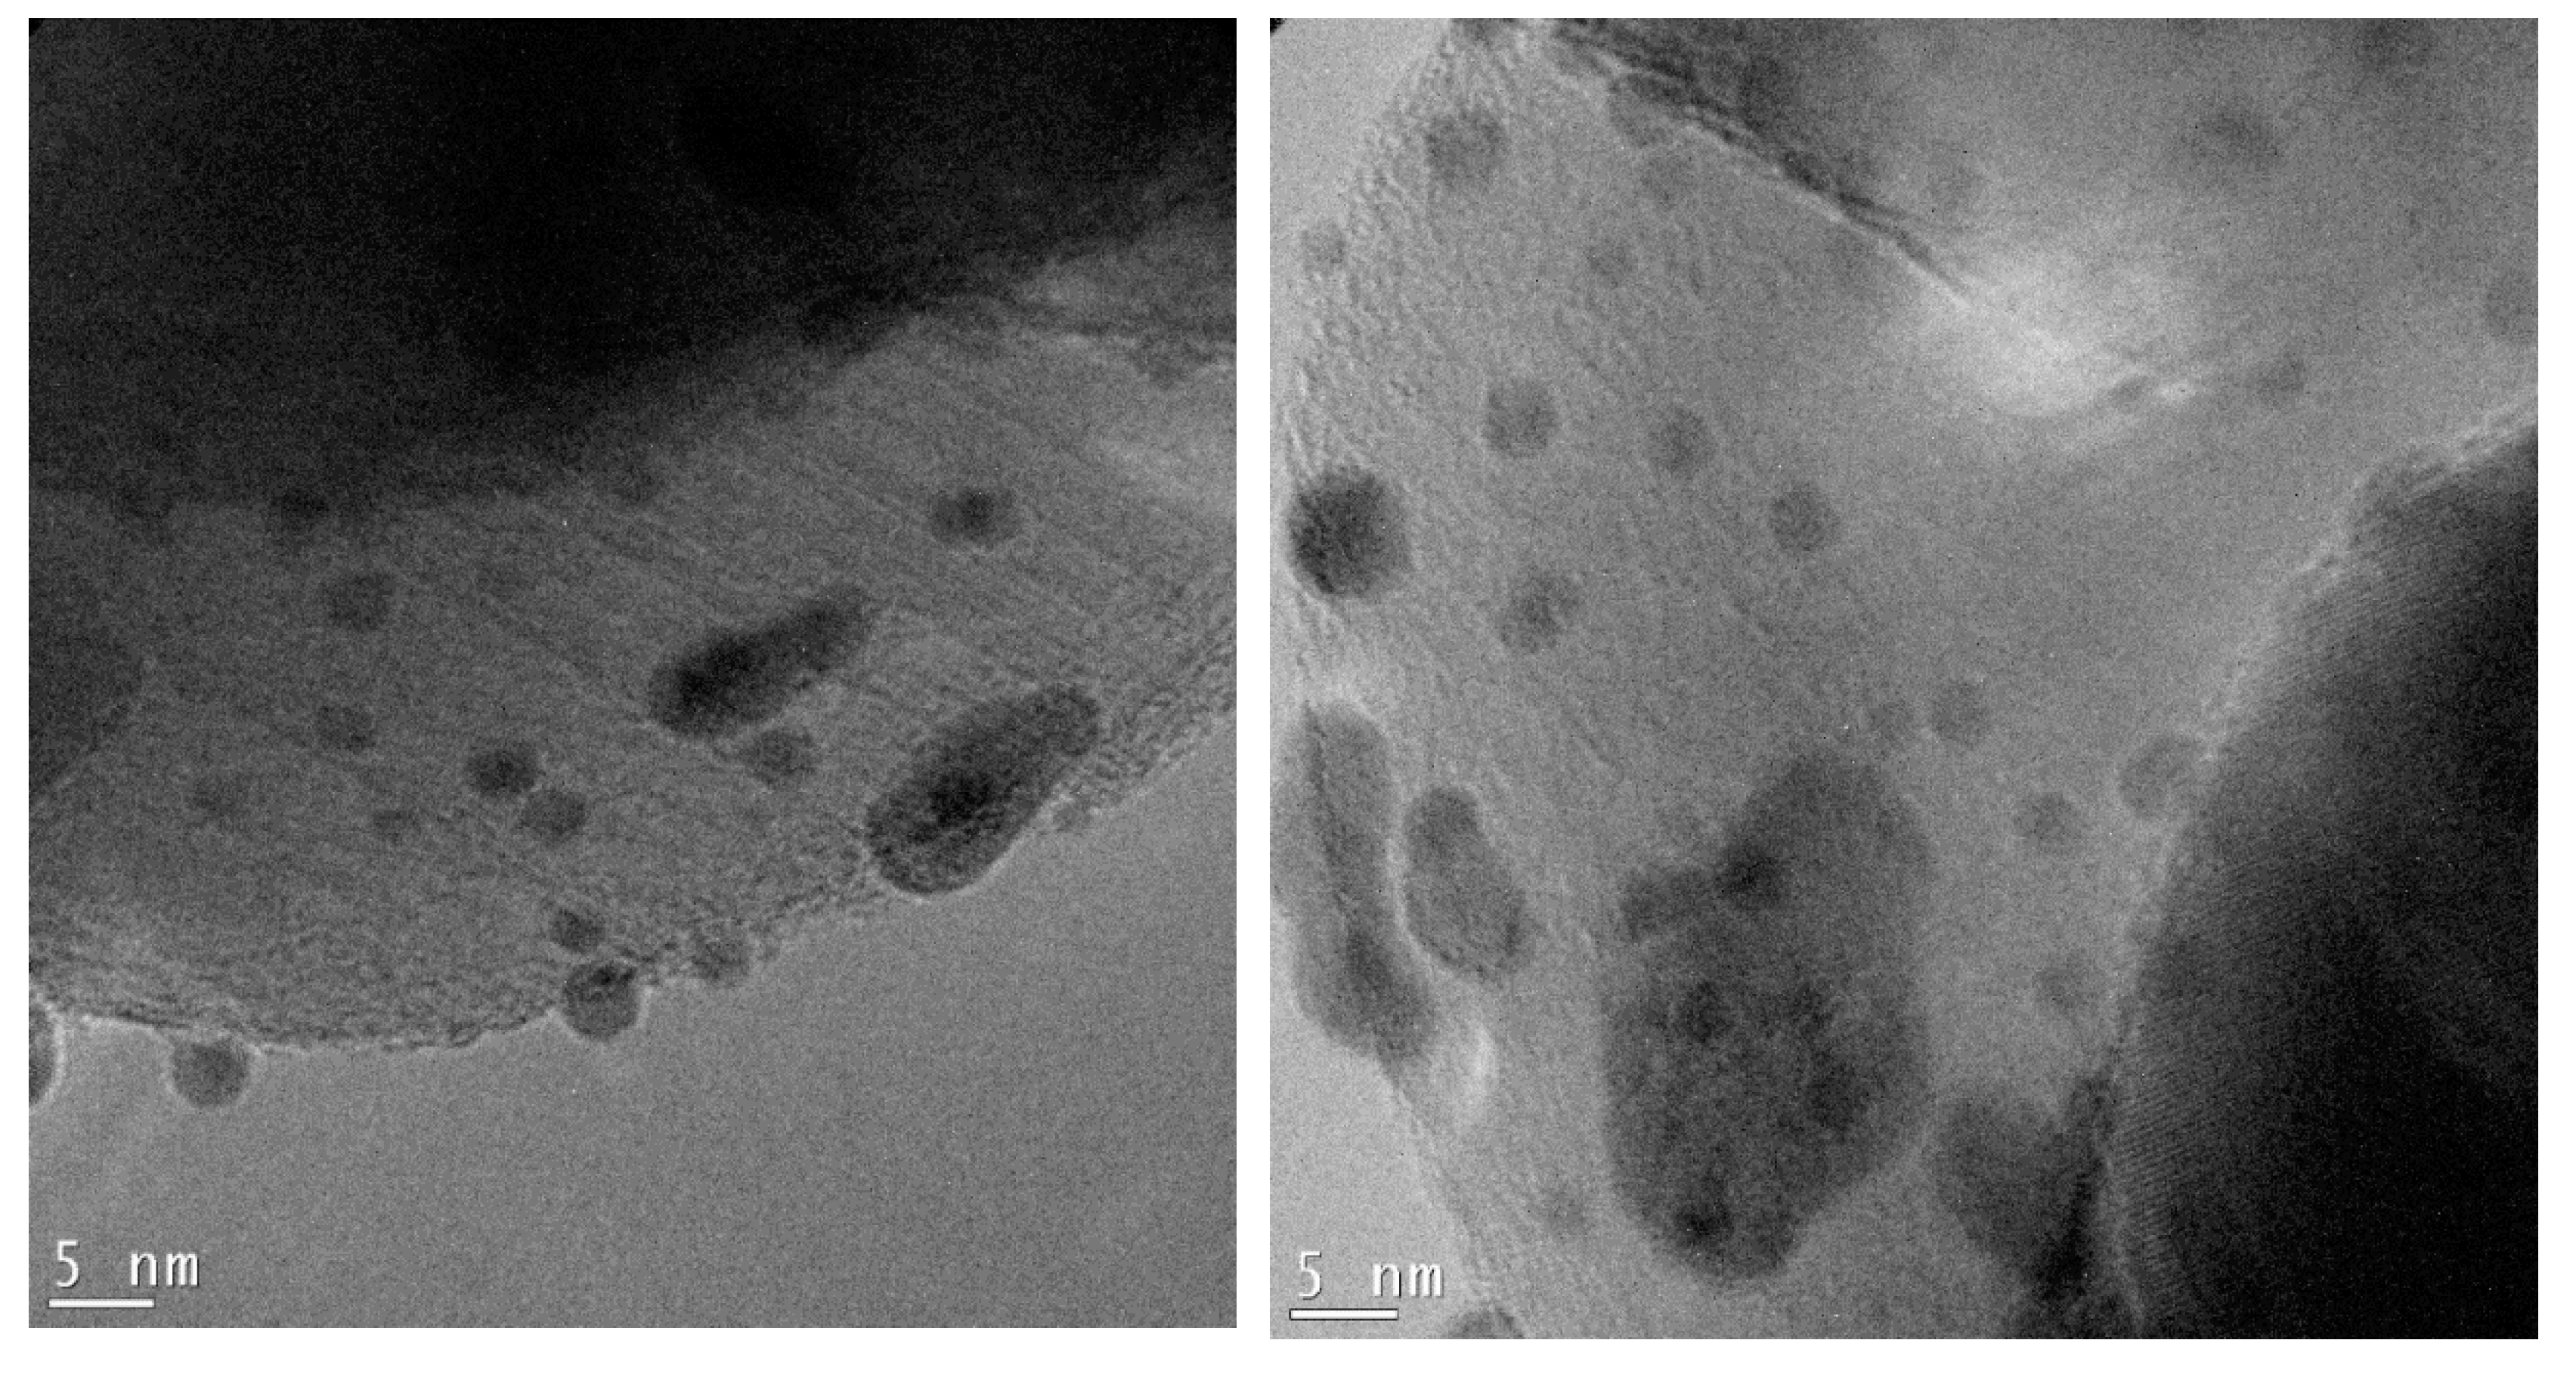
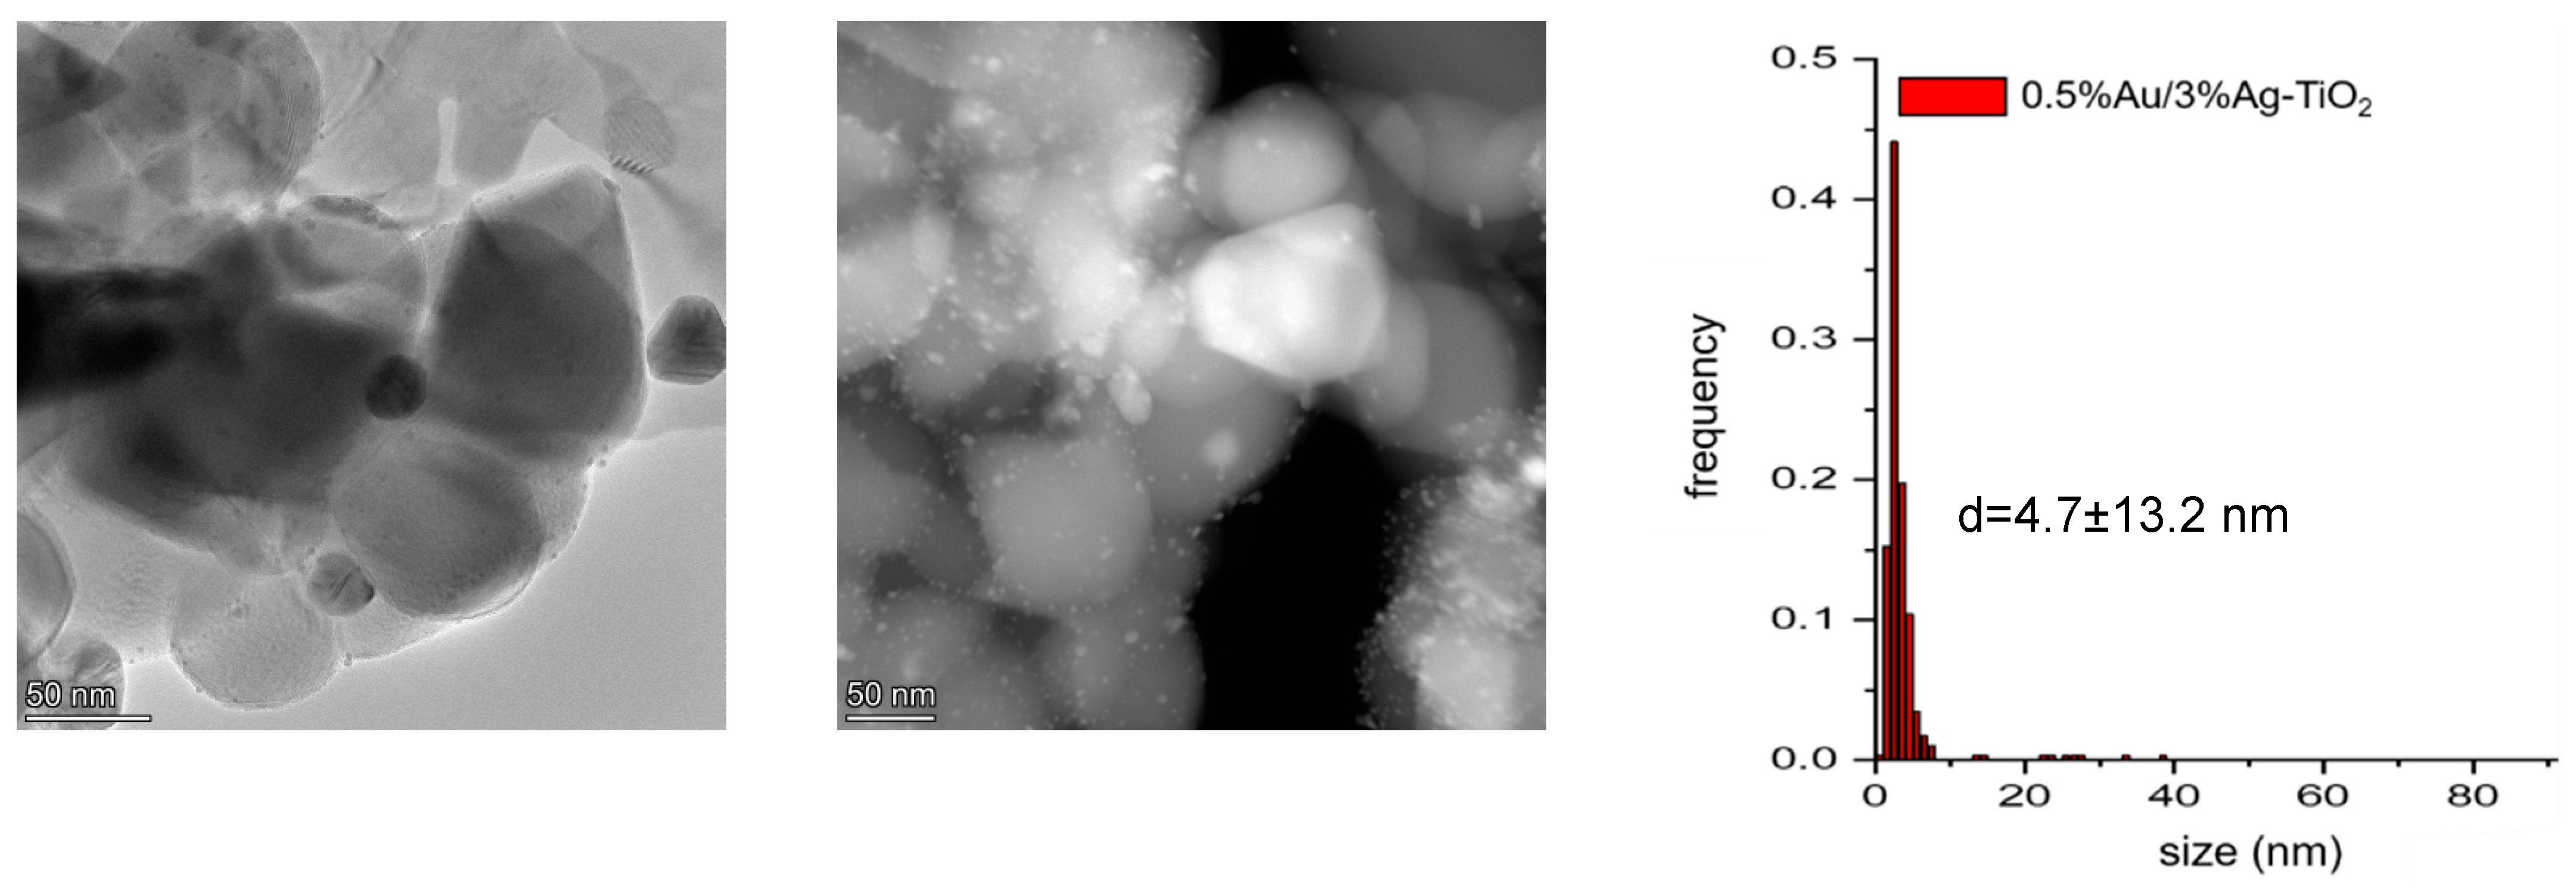
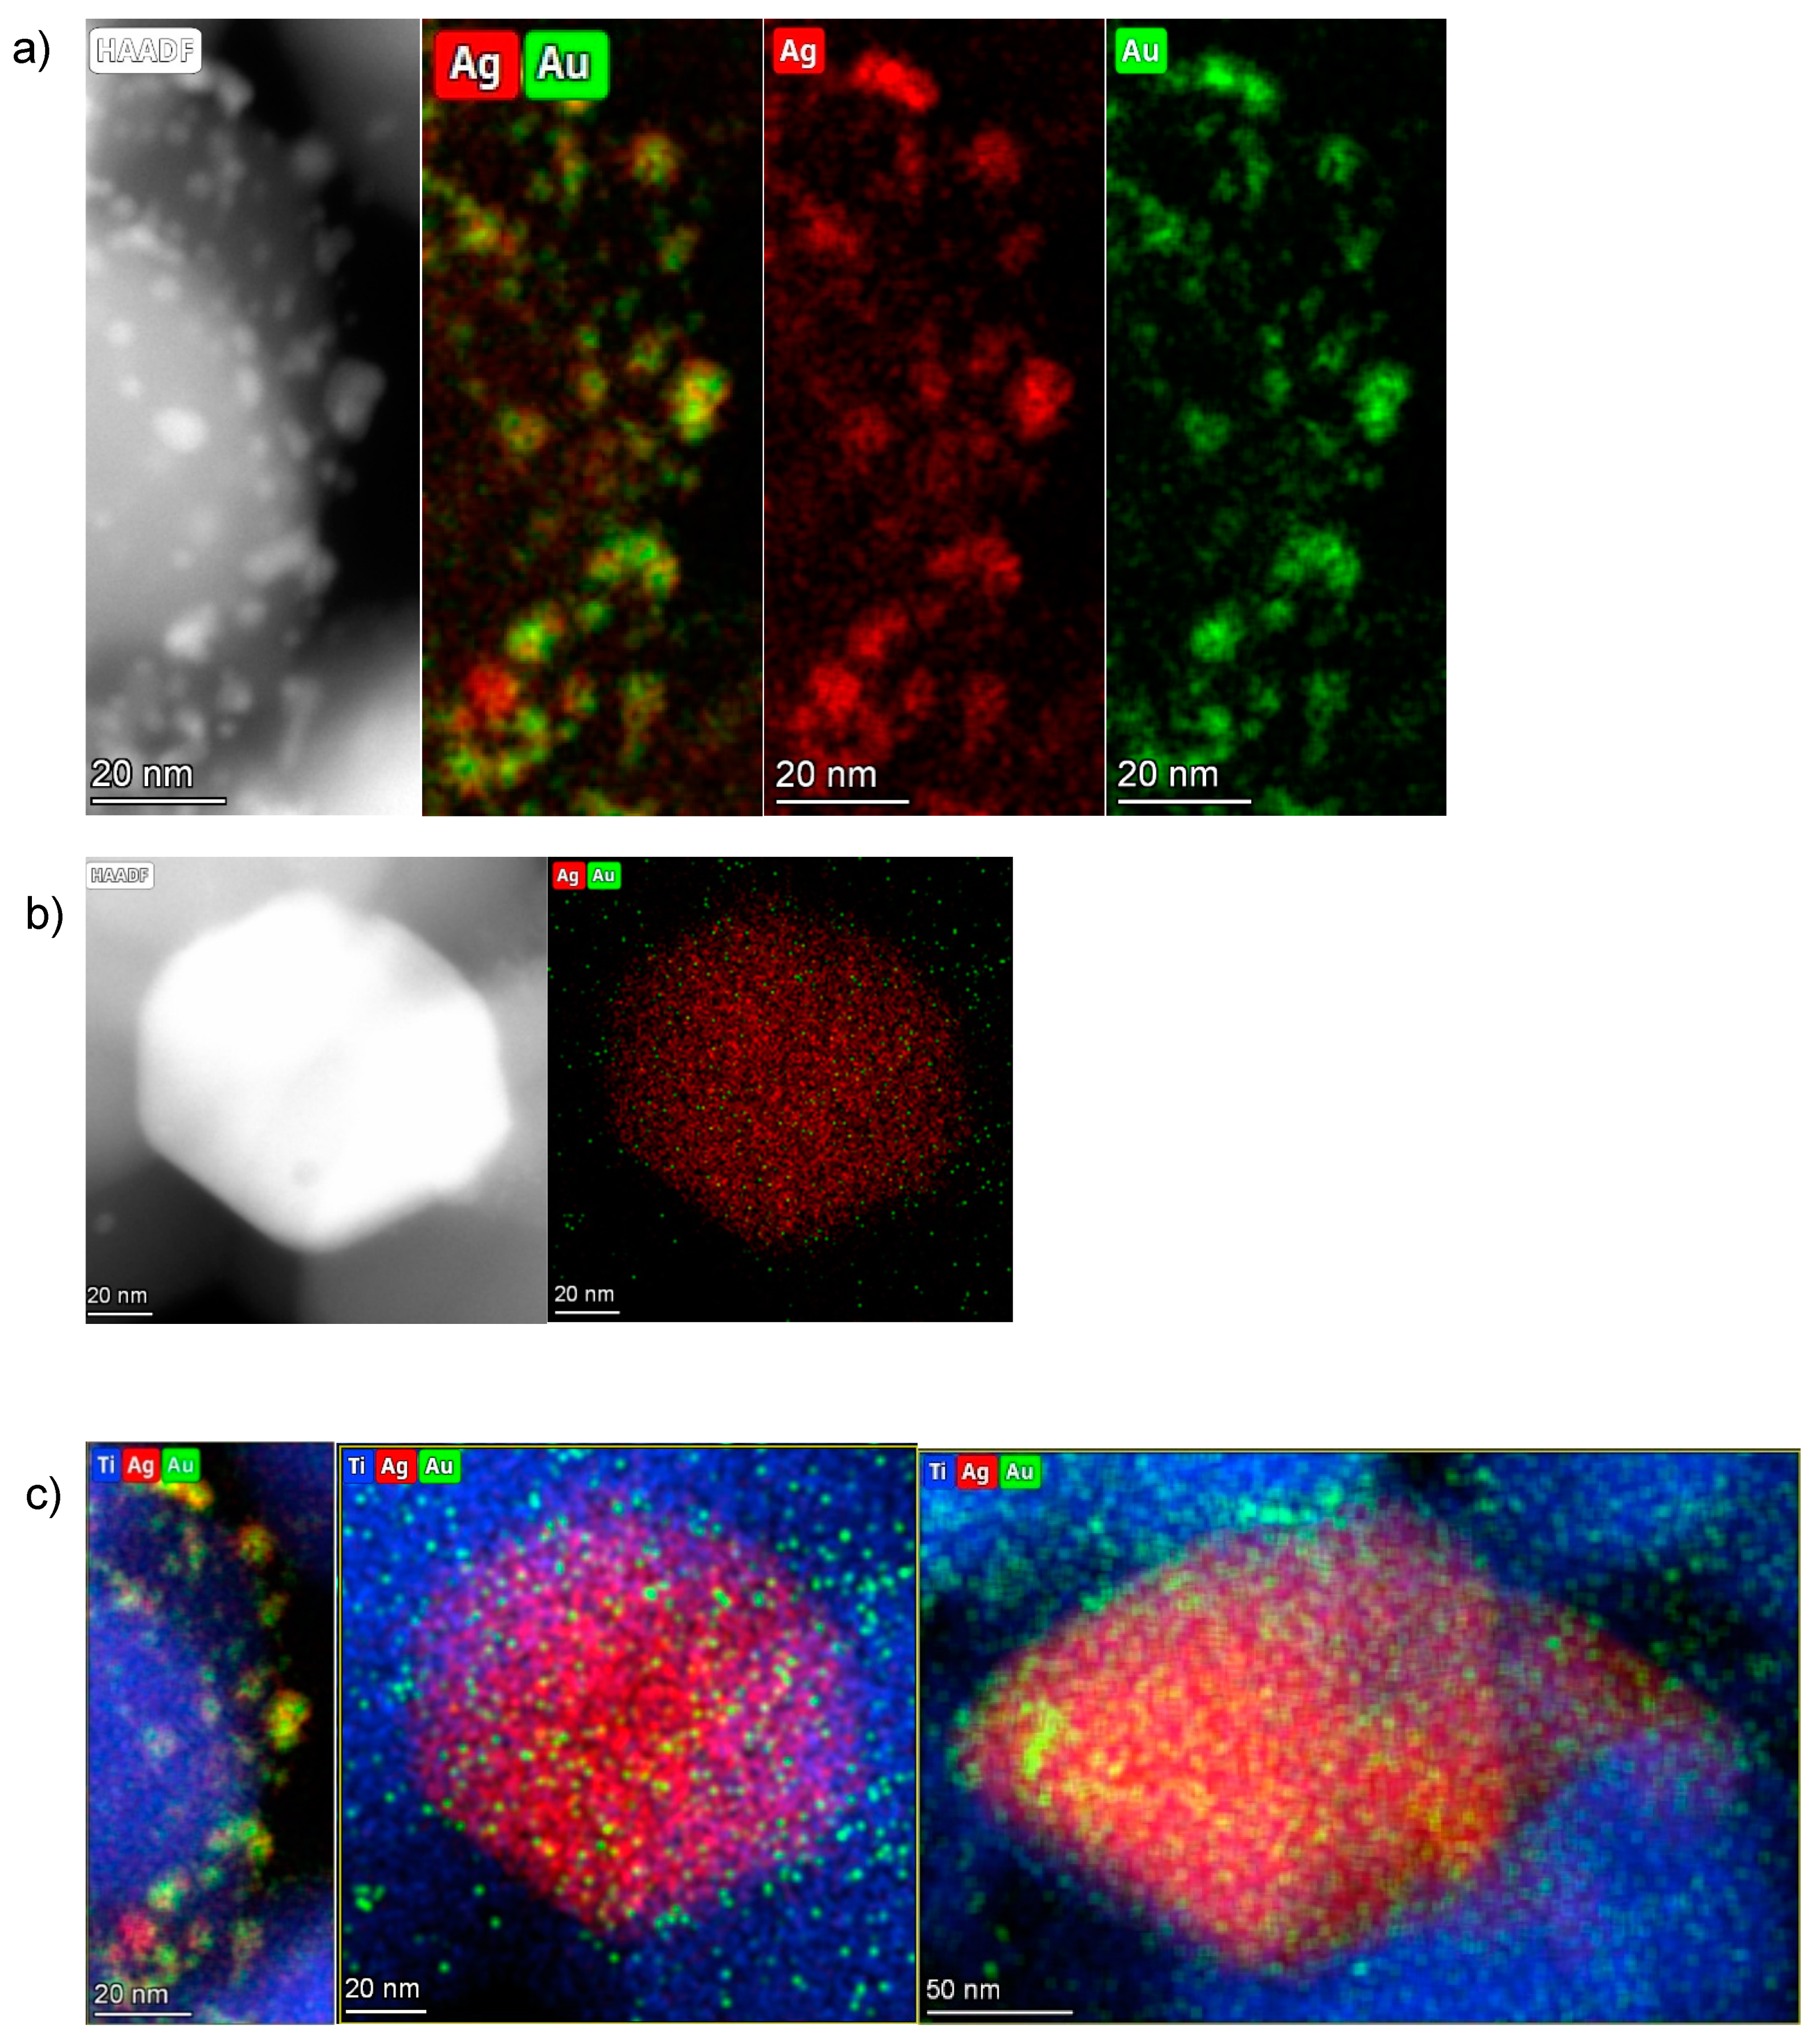
2.2.2. TEM and STEM-EDS Measurements

The monometallic Ag- and Au-TiO2 and the bimetallic Au/Ag-TiO2 samples were investigated by TEM and STEM-EDS analyses. The TEM images of the monometallic 3%Ag-TiO2 and 0.5%Au-TiO2 samples are reported in Figure 4 and Figure 5, respectively.
Metal-promoted samples show clear evidence of metal nanoparticles’ formation at the oxide surface, in good agreement with XRD findings. The monometallic 3%Ag-TiO2 sample showed a quite heterogeneous size distribution of Ag-containing nanoparticles (Figure 4). The dimensional range is very varied: besides very small particles (2–3 nm) larger agglomerates of about 20 nm are also visible. On the other hand, the monometallic 0.5%Au-TiO2 sample showed a rather homogeneous distribution of Au nanoparticles, with dimensions around 4–5 nm (Figure 5).
TEM images of the bimetallic 0.5%Au/3%Ag-TiO2 are reported in Figure 6 and Figure 7.
Figure 6 shows the bimetallic sample prepared depositing Au NPs on the previously synthesized 3%Ag-TiO2. Very interestingly, high magnification images (Figure 7) showed the presence of some larger particles (10–20 nm) on which some smaller ones (3–4 nm) have grown, which could represent evidence of a direct contact between the larger Ag-based particles and Au NPs, as further confirmed by elemental mapping (vide infra).
Together with a large population of particles with a size <10 nm, significantly larger particles could be observed (Figure 8). The bimetallic 0.5%Au/3%Ag-TiO2 sample showed nanoparticles with a mean diameter of d = 4.7 ± 13.2 nm.
The distribution of Au and Ag can be estimated by the Au and Ag elemental maps generated from STEM-EDS measurements (Figure 9).
The small particles are dominantly bimetallic with a significantly larger Au/Ag molar ratio (around 50/50 or even higher) than the bulk nominal value (Au/Ag = 5/95), thus a high fraction of silver must be in the large, low surface area, and are practically monometallic Ag particles. On these bigger particles, smaller Au nanoparticles have grown (Figure 9c). The largest nanoparticles can be described as island-like silver nanoparticles deposited by impregnation, while the smallest grown above are those of gold, deposited in a second step by sol-immobilization. This picture is in agreement with the polydispersity of Ag particles deposited in the monometallic sample (Figure 8).
A large number of small bimetallic particles with quite even distribution of Ag and Au in them was observed beside a few large Ag particles with small Au ones on their surface. The co-presence of these two structures might be explained as follows: when the Au sol was deposited on the Ag-TiO2, the small Au NPs may locate both on the large and small Ag particles. In the small bimetallic NPs, the Au and Ag seem to mix even at the drying temperature, while on the large Ag particles, the contacting Au remains rather monometallic—does not alloy in Ag.
This overlap may create a junction between the two metal species, increasing the possibility of synergistic effects. It can be supposed that this particular conformation of Ag and Au nanoparticles is at the basis of the different photocatalytic mechanisms shown by mono- and bimetallic samples during photocatalytic degradation reactions.
The interaction between the two metal species firstly revealed by TEM-EDS analyses was further investigated by XPS analyses and DRS measurements.

2.2.3. XPS Analyses

Table 2 reports the elemental composition determined by XPS survey analyses of bare TiO2, 3%Ag-TiO2, 0.5%Au-TiO2 and 0.5%Au/3%Ag-TiO2.
XPS survey analysis of the bare TiO2 used as support showed P and K impurities (not reported in Table 2) beside Ti and O, while the signal of C is to be referred to adventitious carbon [27], usually found on the surface of most air-exposed samples. The amount of C increased in the metal-promoted samples compared to bare TiO2 due to the presence of the surfactants (PVP or PVA) used in the synthesis. After impregnation with the Ag NPs sol, XPS survey analysis showed additional trace impurities, i.e., N, F, Cu and Na (not reported) which could be related to the starting wastewater composition, and in particular, copper was the only metal species detected in addition to silver. Such impurities are not appreciable in the sample 0.5%Au-TiO2, which is in fact prepared by sol-immobilization from the pure salt precursor.
The atomic % of the surface metals changed when comparing the monometallic samples with the bimetallic one. The surface metal atomic amount in the monometallic samples was equal to 0.21% of Ag and 0.37% of Au in the Ag-TiO2 and in the Au-TiO2, respectively. Differently, in the bimetallic sample, the amount of surface metal species increased, having 1.77% of Ag and 0.98% of Au, closer to the nominal loading. Indeed, ICP revealed a total Ag metal loading of 3 wt.% and confirmed the loading of 0.5 wt.% of Au. The increase of the amount of surface silver can be due to the washing of the sample after the Au NPs deposition, which removed most of the impurities. In the case of Au, instead, the increase of its surface amount compared with the one shown in the monometallic sample can be ascribed to the presence of the pre-deposited silver, which helps the more exposed deposition of gold nanoparticles.
The binding energies (B.E.) values of Ag and Au were then observed looking at the high-resolution spectra (Figures S1–S3). The relative fitting results of XPS high-resolution analyses are reported in Table 3.
The high-resolution spectra of Ag 3d and Au 4f showed notable differences, in terms of peaks width and position, when comparing the monometallic samples with the bimetallic one. In particular, in the bimetallic sample, silver was partially present as Ag0 (14.3%, B.E. of 368.7 eV), different from the monometallic 3%Ag-TiO2 where Ag is entirely present as Ag+ (B.E. of 367.0 eV). On the other hand, the amount of Au0 (B.E. of 83.5 ± 0.1 eV) decreased from 91.5% to 83.4% and the amount of Au+ (B.E. of 85.7 eV) increased from 8.5% to 14.3%, accordingly (Table 3). The appearance of different metal species in terms of oxidation state supports the hypothesis of a charge transfer between Ag and Au, or even an interaction between metals and the support, as also reported in [28].
The interaction between Ag and Au could have a direct effect on the photocatalytic activity and behavior, given as the final result of different ethanol degradation pathways.

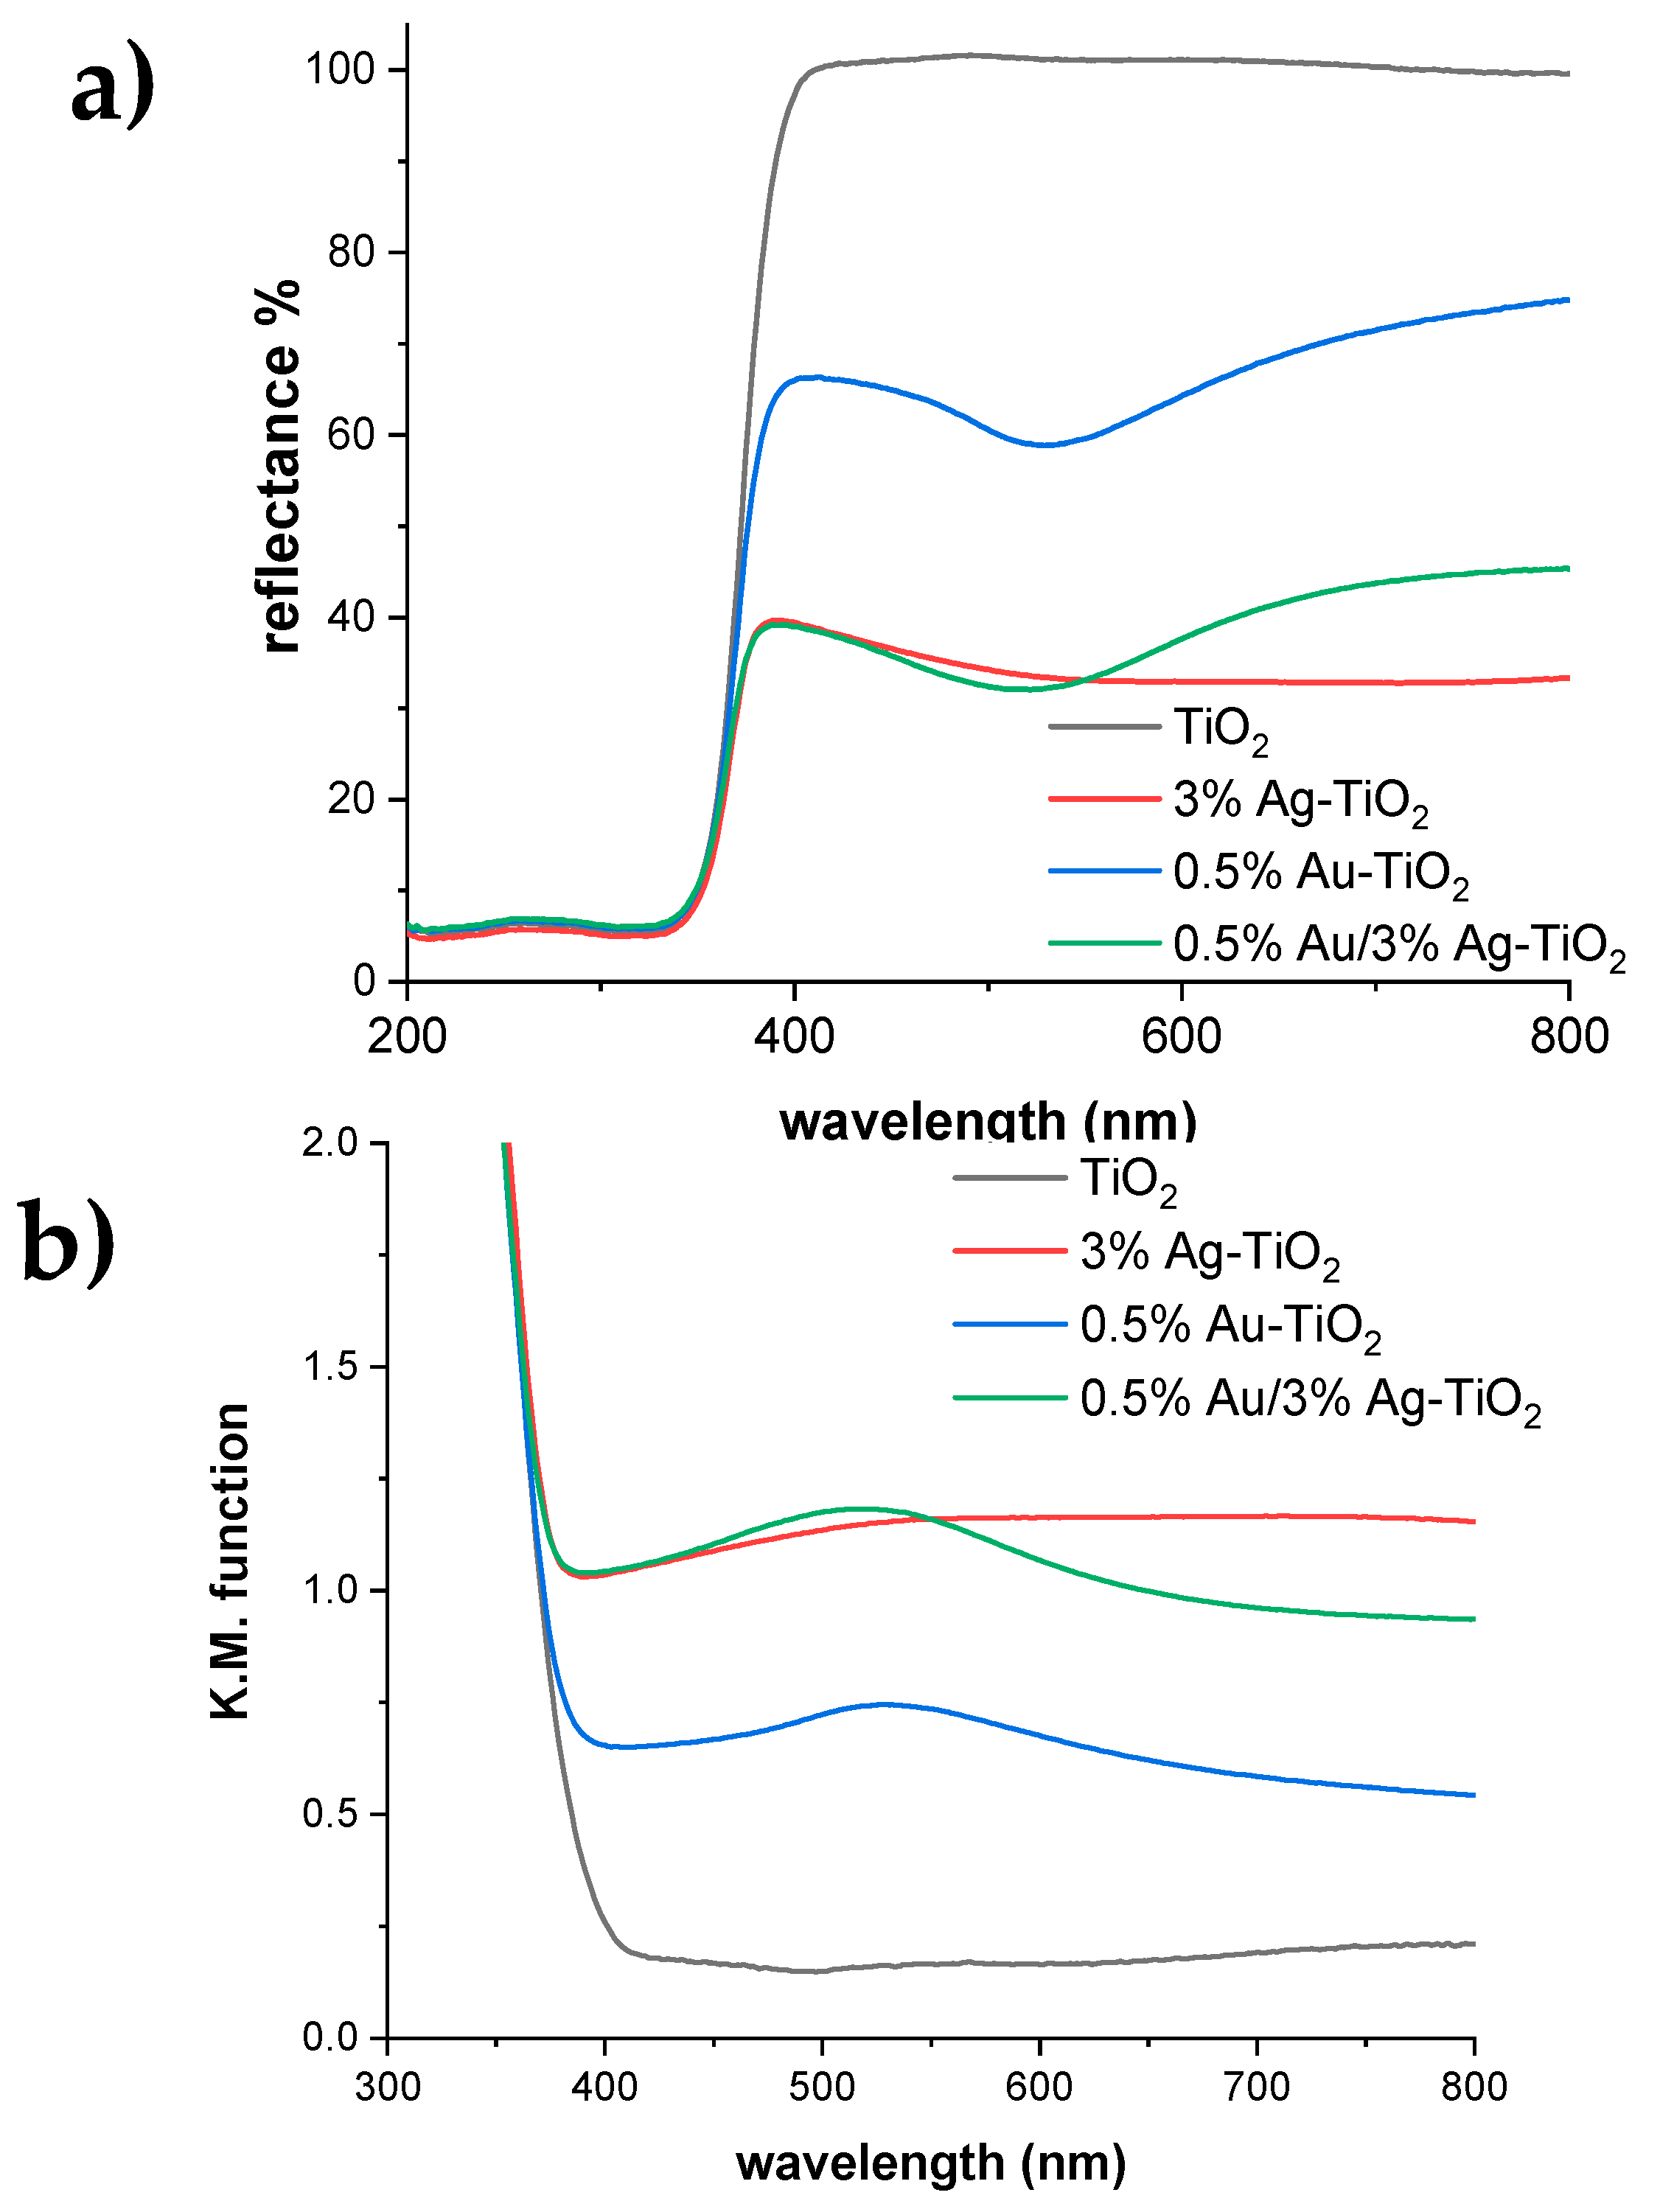
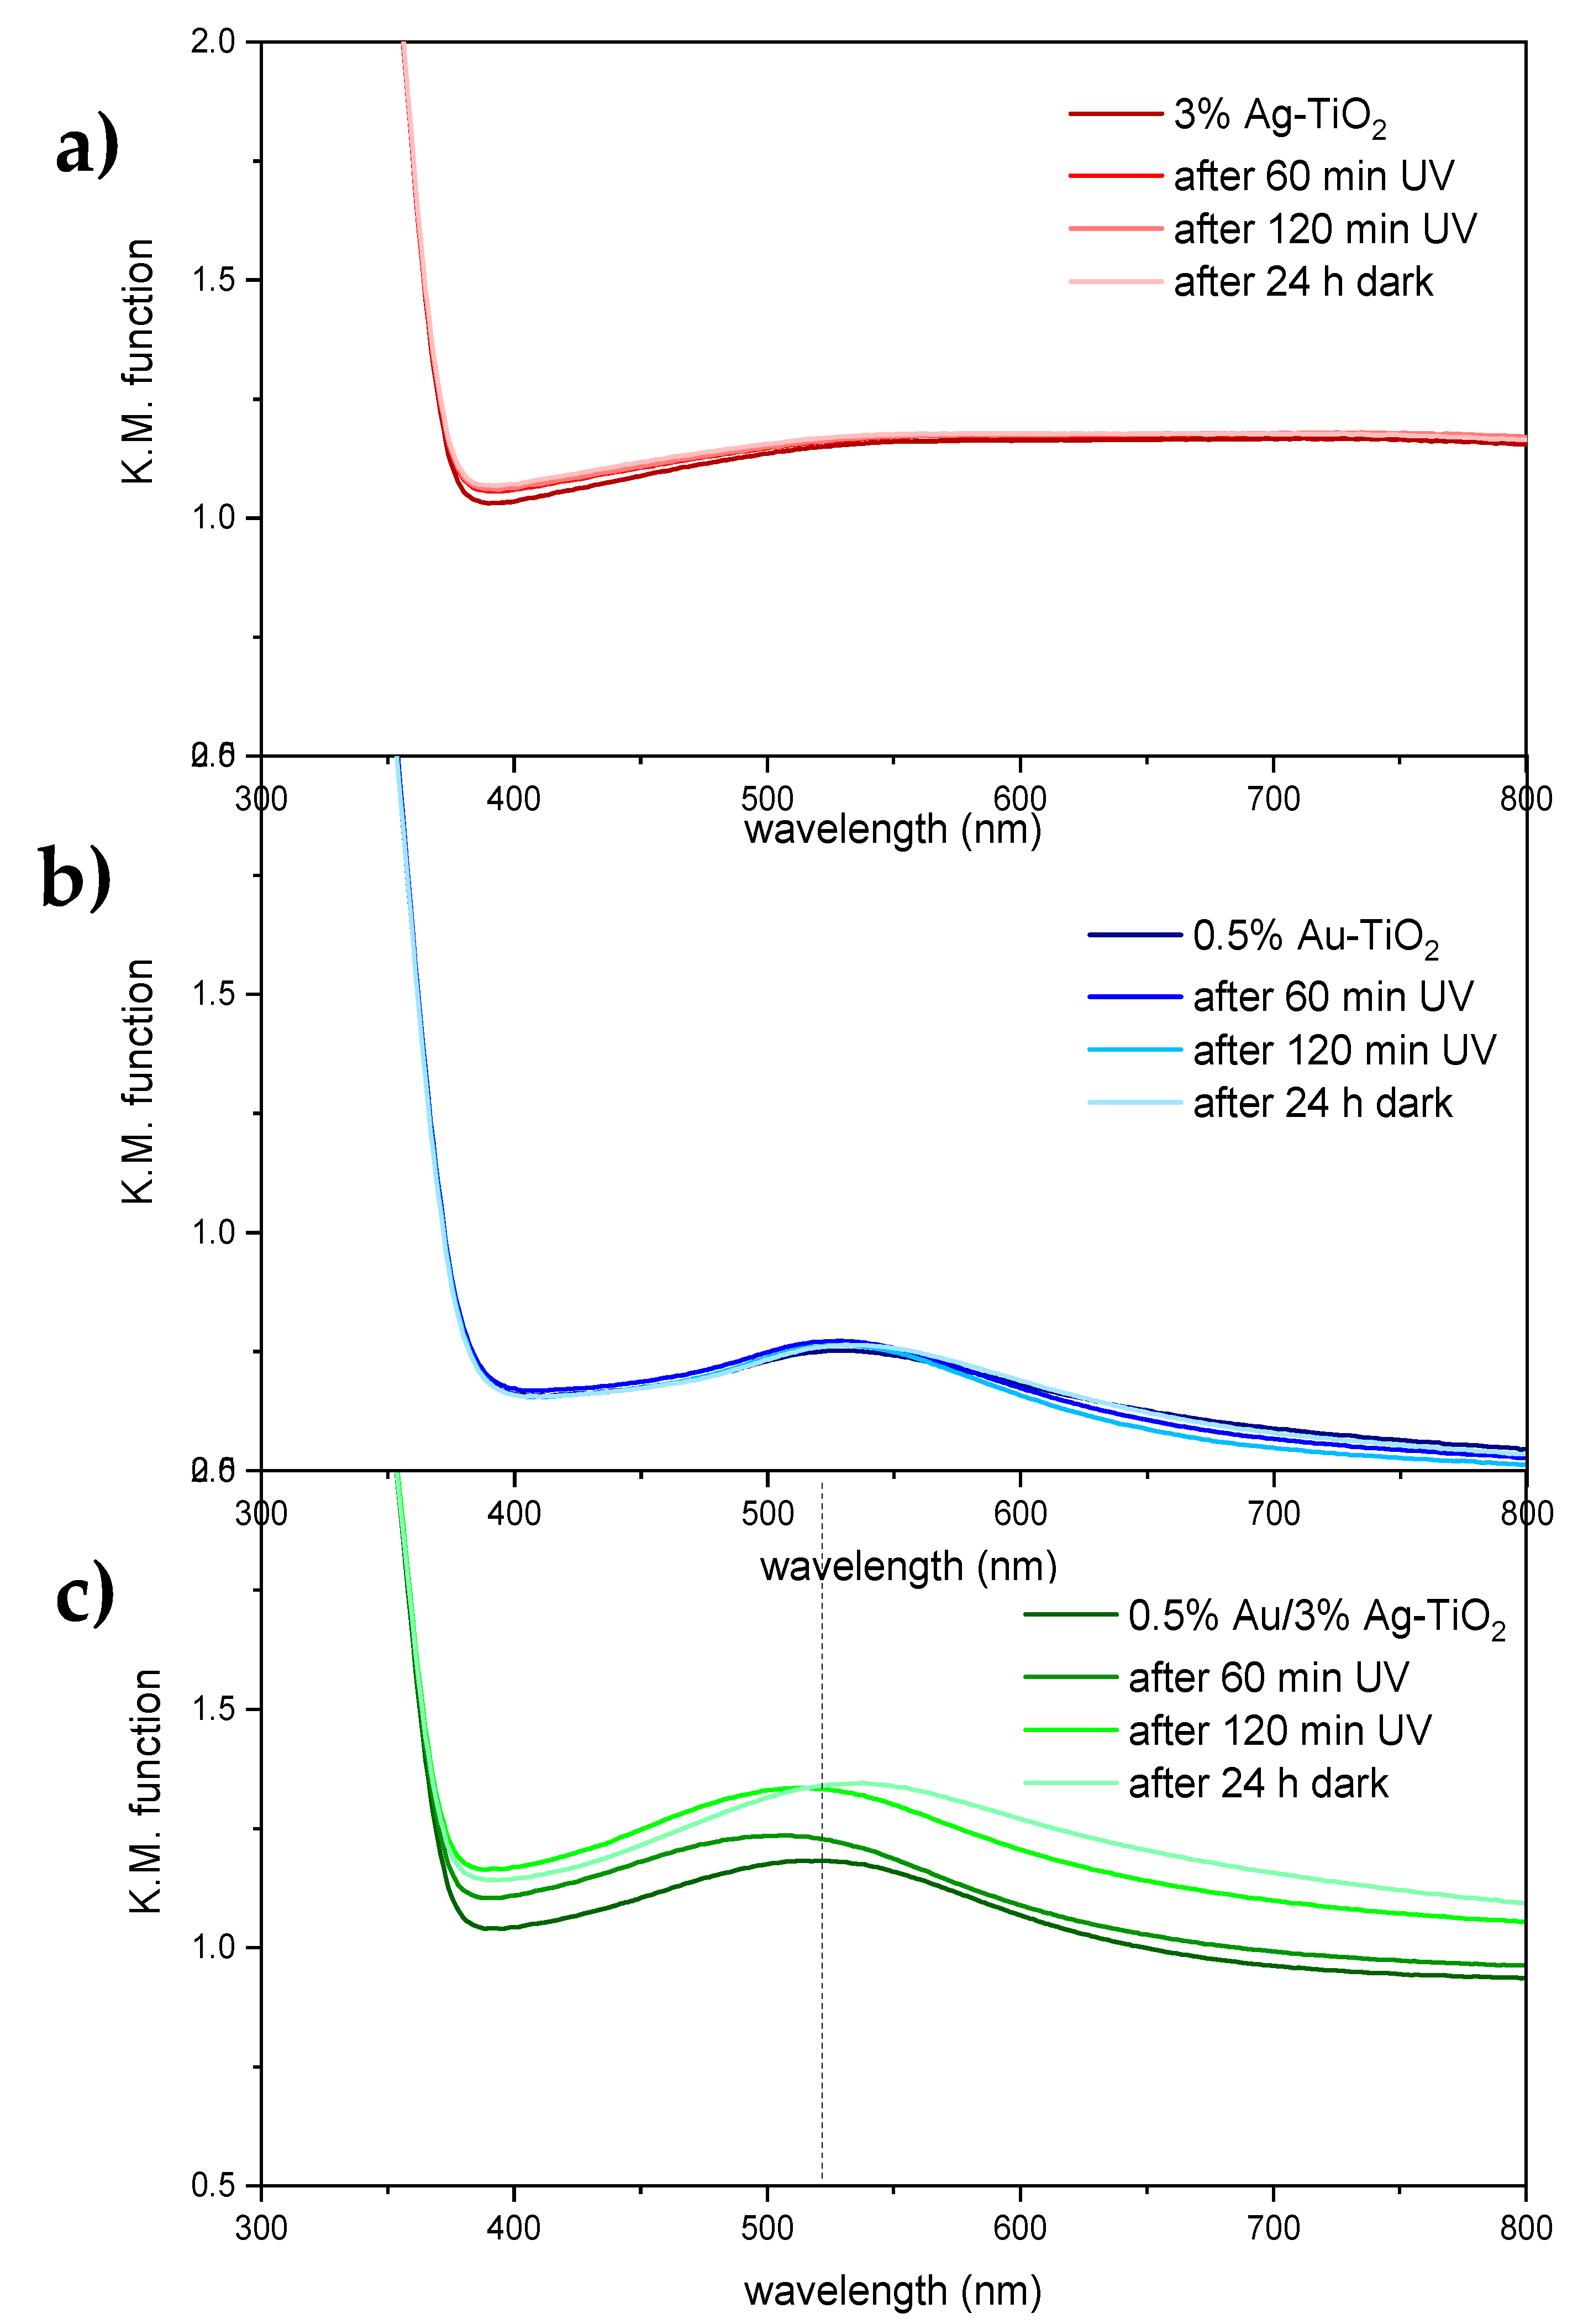
2.2.4. Diffuse Reflectance Spectroscopy (DRS)

The optical properties of the synthesized samples and their response to UV light absorption were investigated by diffuse reflectance spectroscopy (DRS) measurements.
Figure 10a reports the DR spectra of the pristine and metal-promoted samples. The bandgap of the reference TiO2 is 3.29 eV is in good agreement with previous studies [29]. The position of the absorption edge remains constant in all the metal-promoted samples, but the metal addition induces visible light absorption. However, modification with either Ag or Au gives rise to different optical properties: the 3%Ag-TiO2 sample presents a broad absorption in the whole visible range, as indicated by its grayish color. This extended absorption can be attributed to the presence of Ag2O, which is a narrow bandgap semiconductor (1.65 eV) [30,31], in agreement with XPS results (see Table 3). Conversely, the monometallic 0.5%Au-TiO2 shows a localized light absorption at around 530 nm (Figure 10b), which supports the formation of Au nanoparticles smaller than 5 nm diameter, in accordance with TEM images showing 2–3 nm Au NPs. The 0.5%Au/3%Ag-TiO2 sample presents a very slight shift in the position of the Au nanoparticles absorption (523 vs. 529 nm for 0.5%Au/3%Ag-TiO2 and 0.5%Au-TiO2, respectively). With respect to 0.5%Au-TiO2, the bimetallic sample exhibits an enhanced absorption in the whole visible range, mirroring the light absorption of the monometallic 3%Ag-TiO2 sample. Similar features are displayed by the bimetallic sample with a higher Au content (Figure S4). These findings support the concomitant formation of very small Au nanoparticles and Ag2O nuclei in the bimetallic samples, in good agreement with TEM and XPS results.
The effect of light irradiation on the samples’ optical properties was investigated by irradiating the photocatalysts with UV light for up to 120 min. The resulting spectra are reported in Figure 11 and Figures S5 and S6.
No variations in the optical properties of the pristine TiO2 sample were observed upon light irradiation and subsequent dark storage (Figure S5). Similarly, monometallic samples modified with either Ag or Au showed no significant changes in light absorption upon irradiation with UV light or dark storage (Figure 11a,b). Conversely, the bimetallic 0.5%Au/3%Ag-TiO2 sample presents appreciable variations in the visible light portion of the spectrum (Figure 11c): in particular, upon UV irradiation, the broad absorption in the visible range is slightly enhanced, whereas the localized absorption attributed to Au nanoparticles is notably blue-shifted (ca. 10 nm). The latter effect appears reversible upon storage in the dark. A similar trend in terms of plasmonic band shift was observed in the bimetallic sample modified with 2% Au (Figure S6). While the photochromic effect of Ag NPs supported on TiO2 are well-documented [32,33], with UV favoring the reduction of Ag+ to metallic Ag by photo-excited electrons and visible light inducing photo-bleaching by positive charges generated by plasmonic excitation [34]; the higher redox potential of Au (+1.52 V vs. NHE and +0.80 V vs. NHE for Au+/Au and Ag+/Ag, respectively) prevents its oxidation by the separated positive charges. As a result, photochromic effects involving Au nanoparticles have been less reported. It is noteworthy that photochromic effects are here observed only in the case of bimetallic samples and might be indicative of light-activated charge transfer effects occurring at the metal-metal interface, as also suggested by XPS findings.

3. Materials and Methods

3.1. Materials

TiO2 used as support was Kronos 1077 from Kronos Worldwide, Inc. (Dallas, TX, USA) It consists of pure anatase and it has been previously fully characterized [35]. The main features are reported in Table 4.
The Ag+ enriched solution was obtained from Argor-Heraeus SA (Mendrisio, Switzerland) as a service provider in the precious metals sector. The composition in terms of metal ion content is reported in Table 5.
As reported in Table 5, the solution contains mainly silver cations. The most abundant impurity consists of Cu2+ ions, and traces of other metals are present as well. The solution is characterized by an acidic pH value (pH ca. 2).
KNO3 (Sigma-Aldrich, Saint Louis, MO, USA, ReagentPlus®, ≥99.0%), polyvinylpyrrolidone (PVP) (Sigma-Aldrich, average mol wt 40,000), HAuCl4 · 3H2O (99% Sigma-Aldrich/Merck, Saint Louis, MO, USA), NaBH4 (powder, ≥98.0%, Sigma-Aldrich) and Poly(vinyl alcohol) (PVA, Mw 13,000–23,000, 87–89% hydrolysed, Sigma-Aldrich) were used without further purification.

3.2. Synthesis of the Catalysts

3.2.1. Synthesis of Ag-TiO2

Silver nanoparticles in the aqueous phase were synthesized starting from the Ag+ enriched wastewater, following the electrochemical method developed by Chen et al. [11]. In this method poly(N-vinylpyrrolidone) (PVP) is used as stabilizer for silver clusters. PVP was found to greatly promote silver particle formation rate and significantly reduce silver deposition rate, thereby making it very convenient to synthesize monodispersed Ag NPs by electroreduction of the bulk silver ions.
The starting solution was diluted in order to have an Ag+ concentration of 30 g L−1. In 500 mL of Ag+ solution, 11 g of PVP, 5 g KNO3 and 0.5 mL of HNO3 were added. The solution was vigorously stirred for 10 min.
The counter and working electrodes were two platinum foils, while the reference electrode was a saturated calomel electrode (SCE). To protect SCE from AgCl precipitation, we used a double bridge filled with a saturated KNO3 solution, which acted as a second electrolyte. The chronoamperometry was performed under vigorous stirring. The color of the solution changed at the end of the electrolysis, proving that nanoparticles were formed.
In the end, NH3 was added until pH 12 in order to stabilize the colloid and avoid the formation of an Ag2O precipitate, according to the Tollens’ reaction [36]:
Ag 2 O ( s ) + 4   NH 3 + 2   NO 3 +   H 2 O     2   [ Ag ( NH 3 ) 2 ] NO 3 + 2   OH
The second step of the synthesis was the deposition of the Ag nanoparticles over TiO2, by a classical impregnation method.
The proper amount of TiO2 was previously dispersed in acetone (Sigma Aldrich, HPLC grade, ≥99.9%). Afterwards, the Ag sol was added. The solution was maintained under stirring for 24 h at a constant temperature of 50 °C. Then the temperature was raised up to 120 °C, maintaining the solution under stirring for another 2 h. The remaining aqueous solvent was removed by drying the sample at 100 °C overnight. The dried powder was then calcined adopting the following heating ramp: 100 °C for 30 min, 200 °C for other 30 min and finally at 400 °C for 2 h.
The amount of Ag loading was evaluated by ICP after having mineralized the catalyst, and it turned out to be 3 wt.%.

3.2.2. Synthesis of Au/Ag-TiO2

The Au/Ag-TiO2 catalyst was synthesized following a sol-immobilization procedure [37]. To an aqueous solution of HAuCl4 of the desired concentration (total metal concentrations of 1 mmol L−1), a 1 wt.% PVA solution was added (PVA/Au (w/w) = 0.5) under constant stirring. A freshly prepared aqueous solution of NaBH4 (0.1 M, NaBH4/Au (mol/mol) = 8) was then added to form Au0 NPs. The reduction of Au was confirmed by the appearance of a dark red color. After 30 min, the colloid was immobilized by adding the support, i.e., either TiO2 or the previously synthesized Ag-TiO2. The amount of support material required was calculated to have a total final metal loading of either 0.5 wt.% or 2 wt.%, respectively. After 2 h of stirring, the slurry was filtered, and the catalyst was washed thoroughly with 1 L of distilled water and dried at 80 °C for 4 h.
Table 6 reports the list of the samples studied in this work.

3.3. Catalysts Characterization

The metal content of each sample was measured by ICP-OES (Inductively Coupled Plasma Emission Spectroscopy) using a Perkin Elmer Optima 5300 DV instrument (PerkinElmer, Waltham, MA, USA). The synthesis of Ag-TiO2 using the silver-rich wastewater resulted in an Ag loading of 3 wt.%, while the Au content (0.5% or 2 wt.%) was confirmed.
Miniflex 600-Rigaku X-ray diffraction (XRD) equipment (Panalytical S.R.L., Milan, Italy), using monochromatic Cu Kα radiation (λ = 1.5405 Å) and operating at 40 kV and 15 mA recorded the diffractograms (2θ range of 5–80° at 0.02° intervals and with a scan step time of 1.0° min−1). The crystalline phases and structures were analysed by the Match! Program (Crystal impact, Bonn, Germany).
Transmission electron microscopy (TEM) analysis of the supported Ag and Au species was carried out with an FEI Tecnai F20 Field Emission Gun (FEG) microscope (Thermofischer, Waltham, MA, USA), working at an accelerating voltage of 200 kV. An S-Twin system lens guarantees a point resolution of 0.24 nm. Further TEM measurements were performed by means of an FEI Titan Themis 200 kV spherical aberration (Cs)-corrected TEM with 0.09 nm HRTEM and 0.16 nm STEM resolution. For particle size distributions, 200–300 Ag and Au containing particles were counted. The composition of the samples was measured in several selected areas by STEM-EDS with four Thermofischer “Super X G1” EDS detectors built in the microscope and visualized as Ag and Au elemental maps presenting the net (background corrected and fit) intensities of Au L and Ag L lines, respectively.
X-ray photoelectron spectra (XPS) were acquired in an M-probe apparatus (Surface Science Instruments) (Thermofischer, Waltham, MA, USA) equipped with an atmospheric reaction chamber. The XPS lines were recorded by applying an Al Kα characteristic X-ray line, hν = 1486.6 eV. All data were analysed using ESCA Hawk software (Service physics Inc., Bend, OR, USA). The XPS lines of C 1s, O 1s, Ti 2p, Ag 3d and Au 4f were recorded.
Diffuse reflectance spectroscopy (DRS) measurements were carried out with a Shimadzu UV-2600 UV-vis spectrophotometer (Shimadzu, Kyoto, Japan) equipped with an integrating sphere, in the range of wavelengths from 200 to 1000 nm. BaSO4 was used as a standard total white reference. Energy gap determinations were performed by applying the Kubelka–Munk (K.M.) equation. The photochromic effects were evaluated by DRS spectra measured before and after UV light irradiation at set time intervals (up to 120 min). Light irradiation was performed using a halogen lamp (Jelosil HG 500 W, Milan, Italy) emitting in the 320–400 nm range, with an effective irradiation power of 30 mW cm−2. In order to check the reversibility of any photochromic effect, the irradiated samples were then stored for 24 h in the dark and then their spectra were measured again.

3.4. Photocatalytic Tests

The catalyst powder was first deposited as a thin film on a glass slide (10 cm2). To obtain this, 0.050 (±0.001) g of each catalyst was dispersed in 15 mL of 2-propanol and then sonicated in an ultrasonic bath for about 5 min in order to obtain a homogeneous dispersion, which was deposited on the glass by a Pasteur pipette. The catalyst was ready to be used in the reactor after the complete evaporation of the solvent. The reaction was carried out in a 5 L Pyrex glass batch reactor. A certain amount of ethanol was injected inside the reactor in order to have a starting VOC gas-phase concentration of about 200 ppm. After the injection, about 40 min are required to have a stabilized initial concentration.
When the ethanol starting concentration was constant (sampled as t0), the photocatalytic reaction started by switching on the UV light (Jelosil HG 500, 10 W/m2, 315–400 nm). The photodegradation test occurred at room temperature and lasted 3 h. The ethanol conversion and by-product formation were monitored by gas chromatography (GC) using a GC 2025 Shimadzu instrument (Shimadzu, Kyoto, Japan) with LabSolution Lite software (Shimadzu, Kyoto, Japan).

4. Conclusions

Silver nanoparticles can be electrochemically synthesized from wastewaters enriched in silver ions and can be used to decorate the surface of a pigmentary TiO2 in order to obtain an active metal-modified photocatalyst. The present procedure for the electrochemical deposition of noble metal NPs from wastewaters by precious metal industries could be extended to other species, such as gold, by tuning the chronoamperometry conditions using wastewaters with a suitable enrichment of the chosen metal ion. Further promotion of the photocatalytic activity towards ethanol photodegradation was achieved by adding 0.5% of Au. Indeed, the bimetallic sample led to the complete degradation of ethanol in 1 h and to the further complete degradation of acetaldehyde. Moreover, ethylene was formed by parallel mechanisms of dehydration, which can be related to reduction pathways in the bimetallic samples. TEM-EDS analyses proved that Au NPs were grown on Ag or AgOx islands and NPs creating a junction between the two different metal species, increasing the possibility of having synergistic effects. The charge transfer effect, which can result from the contact between the two metal-containing NPs, was verified by XPS and DRS analyses: The shift of binding energies revealed by XPS supports the hypothesis of a direct contact between gold and silver nanoparticles, where electronic and charge transfer can take place. Additionally, the DRS measurements showed that the bimetallic samples present a blue-shift in the position of the Au nanoparticles absorption under UV light irradiation, which is reversible under dark storage. This behavior can be considered as further proof of the light-activated charge transfer effects occurring at the metal-metal interface. Starting from waste and hardly recyclable products, we were able to obtain an active photocatalyst that also shows very interesting optical properties. The very small amount of gold required maintains the characteristics of sustainability and the low cost of the product. Considering the availability and heterogeneity of the waste aqueous solutions enriched with metals coming from industries, this finding opens the way to research with other metals, not only for photocatalytic applications but also in the whole field of catalysis. A possible enhancement of these materials could be obtained, improving the metals’ particle size distribution, for example, using other promising synthesis methodologies already reported [38].

Supplementary Materials

The following supporting information can be downloaded at: https://0-www-mdpi-com.brum.beds.ac.uk/article/10.3390/catal12020235/s1, Figure S1: Ag 3d XPS high-resolution spectra of 3%Ag-TiO2, Figure S2: Au 4f XPS high-resolution spectrum of 0.5%Au-TiO2, Figure S3: Ag 3d and Au 4f XPS high-resolution spectra of 0.5%Au/3%Ag-TiO2, Figure S4: Reflectance spectrum of 2%Au/3%Ag-TiO2, Figure S5: Absorbance spectra of pristine TiO2 as obtained, after irradiation with UV light for 60 and 120 min, and after 24 h storage in the dark, Figure S6: Absorbance spectra of 2%Au/3%Ag-TiO2 as obtained, after irradiation with UV light for 60 and 120 min, and after 24 h storage in the dark.

Author Contributions

Conceptualization, M.S. and D.M.; methodology, M.S., D.M., G.S.; validation, L.P., A.V. and M.S.; formal analysis, G.S.; investigation, M.S. and D.M.; resources, L.P.; data curation, M.S.; writing—original draft preparation, M.S.; writing—review and editing, M.S. and D.M; supervision, L.P.; project administration, L.P. and C.L.B. All authors have read and agreed to the published version of the manuscript.

Funding

This research received no external funding.

Data Availability Statement

Not applicable.

Acknowledgments

The authors recognize the support of Argor-Heraeus SA for providing the waste solution enriched with noble metals used for this research. We also acknowledge the support of the project VEKOP-2.3.3-15-2016-00002 that provided the purchase of the FEI Titan Themis transmission electron microscope. Finally, we thank Andrea Beck for her support in TEM and XPS data elaboration. Authors acknowledge support from the University of Milan through the APC initiative.

Conflicts of Interest

The authors declare no conflict of interest.

References

  1. Sreeprasad, T.S.; Pradeep, T. Noble Metal Nanoparticles BT—Springer Handbook of Nanomaterials; Vajtai, R., Ed.; Springer: Berlin/Heidelberg, Germany, 2013; pp. 303–388. ISBN 978-3-642-20595-8. [Google Scholar]
  2. Jin, S.; Li, Y.; Xie, H.; Chen, X.; Tian, T.; Zhao, X. Highly selective photocatalytic and sensing properties of 2D-ordered dome films of nano titania and nano Ag2+ doped titania. J. Mater. Chem. 2012, 22, 1469–1476. [Google Scholar] [CrossRef]
  3. Hou, W.; Cronin, S.B. A Review of Surface Plasmon Resonance-Enhanced Photocatalysis. Adv. Funct. Mater. 2013, 23, 1612–1619. [Google Scholar] [CrossRef]
  4. Tobaldi, D.M.; Piccirillo, C.; Pullar, R.C.; Gualtieri, A.F.; Seabra, M.P.; Castro, P.M.L.; Labrincha, J.A. Silver-Modified Nano-titania as an Antibacterial Agent and Photocatalyst. J. Phys. Chem. C 2014, 118, 4751–4766. [Google Scholar] [CrossRef]
  5. Cushing, S.K.; Wu, N. Progress and Perspectives of Plasmon-Enhanced Solar Energy Conversion. J. Phys. Chem. Lett. 2016, 7, 666–675. [Google Scholar] [CrossRef] [PubMed]
  6. Endo-Kimura, M.; Janczarek, M.; Bielan, Z.; Zhang, D.; Wang, K.; Markowska-Szczupak, A.; Kowalska, E. Photocatalytic and antimicrobial properties of Ag2O/TiO2 heterojunction. ChemEngineering 2019, 3, 3. [Google Scholar] [CrossRef] [Green Version]
  7. Zou, X.; Goswami, A.; Asefa, T. Efficient noble metal-free (electro)catalysis of water and alcohol oxidations by zinc-cobalt layered double hydroxide. J. Am. Chem. Soc. 2013, 135, 17242–17245. [Google Scholar] [CrossRef] [PubMed]
  8. Sun, Y.; Xia, Y. Shape-controlled synthesis of gold and silver nanoparticles. Science 2002, 298, 2176–2179. [Google Scholar] [CrossRef] [PubMed] [Green Version]
  9. Zoval, J.V.; Lee, J.; Gorer, S.; Penner, R.M. Electrochemical Preparation of Platinum Nanocrystallites with Size Selectivity on Basal Plane Oriented Graphite Surfaces. J. Phys. Chem. B 1998, 102, 1166–1175. [Google Scholar] [CrossRef]
  10. Rodríguez-Sánchez, L.; Blanco, M.C.; López-Quintela, M.A. Electrochemical Synthesis of Silver Nanoparticles. J. Phys. Chem. B 2000, 104, 9683–9688. [Google Scholar] [CrossRef]
  11. Yin, B.; Ma, H.; Wang, S.; Chen, S. Electrochemical synthesis of silver nanoparticles under protection of poly(N-vinylpyrrolidone). J. Phys. Chem. B 2003, 107, 8898–8904. [Google Scholar] [CrossRef]
  12. Fujishima, A.; Honda, K. Electrochemical Photolysis of Water at a Semiconductor Electrode. Nature 1972, 238, 37–38. [Google Scholar] [CrossRef]
  13. Herrmann, J.-M. Photocatalysis. In Kirk-Othmer Encyclopedia of Chemical Technology; John Wiley & Sons, Inc.: Hoboken, NJ, USA, 2017; pp. 1–44. [Google Scholar] [CrossRef]
  14. Stucchi, M.; Bianchi, C.L.; Pirola, C.; Vitali, S.; Cerrato, G.; Morandi, S.; Argirusis, C.; Sourkouni, G.; Sakkas, P.M.; Capucci, V. Surface decoration of commercial micro-sized TiO2 by means of high energy ultrasound: A way to enhance its photocatalytic activity under visible light. Appl. Catal. B Environ. 2014, 178, 124–132. [Google Scholar] [CrossRef]
  15. Liu, J.; Wu, Z.; He, Q.; Tian, Q.; Wu, W.; Xiao, X.; Jiang, C. Catalytic Application and Mechanism Studies of Argentic Chloride Coupled Ag/Au Hollow Heterostructures: Considering the Interface Between Ag/Au Bimetals. Nanoscale Res. Lett. 2019, 14, 35. [Google Scholar] [CrossRef] [PubMed] [Green Version]
  16. Yang, Y.; Zhang, Q.; Fu, Z.W.; Qin, D. Transformation of Ag nanocubes into Ag-Au hollow nanostructures with enriched Ag contents to improve SERS activity and chemical stability. ACS Appl. Mater. Interfaces 2014, 6, 3750–3757. [Google Scholar] [CrossRef] [PubMed]
  17. Slater, T.J.A.; Macedo, A.; Schroeder, S.L.M.; Burke, M.G.; O’Brien, P.; Camargo, P.H.C.; Haigh, S.J. Correlating Catalytic Activity of Ag–Au Nanoparticles with 3D Compositional Variations. Nano Lett. 2014, 14, 1921–1926. [Google Scholar] [CrossRef] [PubMed]
  18. Jin, Z.; Wang, Q.; Zheng, W.; Cui, X. Highly Ordered Periodic Au/TiO2 Hetero-Nanostructures for Plasmon-Induced Enhancement of the Activity and Stability for Ethanol Electro-oxidation. ACS Appl. Mater. Interfaces 2016, 8, 5273–5279. [Google Scholar] [CrossRef]
  19. Tahir, M.; Tahir, B.; Amin, N.A.S. Synergistic effect in plasmonic Au/Ag alloy NPs co-coated TiO2 NWs toward visible-light enhanced CO2 photoreduction to fuels. Appl. Catal. B Environ. 2017, 204, 548–560. [Google Scholar] [CrossRef]
  20. Nadeem, A.M.; Muir, J.M.R.; Connelly, K.A.; Adamson, B.T.; Metson, B.J.; Idriss, H. Ethanol photo-oxidation on a rutile TiO2(110) single crystal surface. Phys. Chem. Chem. Phys. 2011, 13, 7637–7643. [Google Scholar] [CrossRef]
  21. Lewis, A.C.; Hopkins, J.R.; Carslaw, D.C.; Hamilton, J.F.; Nelson, B.S.; Stewart, G.; Dernie, J.; Passant, N.; Murrells, T. An increasing role for solvent emissions and implications for future measurements of volatile organic compounds: Solvent emissions of VOCs. Philos. Trans. R. Soc. A Math. Phys. Eng. Sci. 2020, 378, 20190328. [Google Scholar] [CrossRef]
  22. Stucchi, M.; Boffito, D.C.; Pargoletti, E.; Cerrato, G.; Bianchi, C.L.; Cappelletti, G. Nano-MnO2 decoration of TiO2 microparticles to promote gaseous ethanol visible photoremoval. Nanomaterials 2018, 8, 686. [Google Scholar] [CrossRef] [Green Version]
  23. Bianchi, C.L.; Pirola, C.; Galli, F.; Stucchi, M.; Morandi, S.; Cerrato, G.; Capucci, V. Nano and micro-TiO2 for the photodegradation of ethanol: Experimental data and kinetic modelling. RSC Adv. 2015, 5, 53419–53425. [Google Scholar] [CrossRef] [Green Version]
  24. Pargoletti, E.; Daniela, M.; Cappelletti, G. Photocatalytic removal of gaseous ethanol, acetaldehyde and acetic acid: From a fundamental approach to real cases. Int. Mater. Rev. 2022, 1–34. [Google Scholar] [CrossRef]
  25. Farfan-Arribas, E.; Madix, R.J. Role of Defects in the Adsorption of Aliphatic Alcohols on the TiO2(110) Surface. J. Phys. Chem. B 2002, 106, 10680–10692. [Google Scholar] [CrossRef]
  26. Stucchi, M.; Bianchi, C.L.; Argirusis, C.; Pifferi, V.; Neppolian, B.; Cerrato, G.; Boffito, D.C. Ultrasound assisted synthesis of Ag-decorated TiO2 active in visible light. Ultrason. Sonochemistry 2018, 40, 282–288. [Google Scholar] [CrossRef] [PubMed]
  27. Barr, T.L.; Seal, S. Nature of the use of adventitious carbon as a binding energy standard. J. Vac. Sci. Technol. A Vac. Surf. Film. 1995, 13, 1239–1246. [Google Scholar] [CrossRef]
  28. Bukhtiyarov, A.V.; Prosvirin, I.P.; Bukhtiyarov, V.I. XPS/STM study of model bimetallic Pd–Au/HOPG catalysts. Appl. Surf. Sci. 2016, 367, 214–221. [Google Scholar] [CrossRef]
  29. Meroni, D.; Bianchi, C.L.; Boffito, D.C.; Cerrato, G.; Bruni, A.; Sartirana, M.; Falletta, E. Piezo-enhanced photocatalytic diclofenac mineralization over ZnO. Ultrason. Sonochemistry 2021, 75, 105615. [Google Scholar] [CrossRef]
  30. El-Ghmari, B.; Farah, H.; Ech-Chahad, A. A new approach for the green biosynthesis of Silver Oxide nanoparticles Ag2O, characterization and catalytic application. Bull. Chem. React. Eng. Catal. 2021, 16, 651–660. [Google Scholar] [CrossRef]
  31. Panpa, W.; Jinawath, S.; Kashima, D.P. Ag2O-Ag/CAC/SiO2 composite for visible light photocatalytic degradation of cumene hydroperoxide in water. J. Mater. Res. Technol. 2019, 8, 5180–5193. [Google Scholar] [CrossRef]
  32. Ohko, Y.; Tatsuma, T.; Fujii, T.; Naoi, K.; Niwa, C.; Kubota, Y.; Fujishima, A. Multicolour photochromism of TiO2 films loaded with silver nanoparticles. Nat. Mater. 2003, 2, 29–31. [Google Scholar] [CrossRef]
  33. Kawahara, K.; Suzuki, K.; Ohko, Y.; Tatsuma, T. Electron transport in silver-semiconductor nanocomposite films exhibiting multicolor photochromism. Phys. Chem. Chem. Phys. 2005, 7, 3851–3855. [Google Scholar] [CrossRef] [PubMed]
  34. Tatsuma, T. Plasmonic photoelectrochemistry: Functional materials based on photoinduced reversible redox reactions of metal nanoparticles. Bull. Chem. Soc. Jpn. 2013, 9, 1–9. [Google Scholar] [CrossRef] [Green Version]
  35. Bianchi, C.L.; Pirola, C.; Galli, F.; Cerrato, G.; Morandi, S.; Capucci, V. Pigmentary TiO2: A challenge for its use as photocatalyst in NOx air purification. Chem. Eng. J. 2015, 261, 76–82. [Google Scholar] [CrossRef]
  36. Dondi, R.; Su, W.; Griffith, G.A.; Clark, G.; Burley, G.A. Highly size- and shape-controlled synthesis of silver nanoparticles via a templated tollens reaction. Small 2012, 8, 770–776. [Google Scholar] [CrossRef] [PubMed] [Green Version]
  37. Villa, A.; Wang, D.; Veith, G.M.; Vindigni, F.; Prati, L. Sol immobilization technique: A delicate balance between activity, selectivity and stability of gold catalysts. Catal. Sci. Technol. 2013, 3, 3036–3041. [Google Scholar] [CrossRef] [Green Version]
  38. Jia, Z.; Ben Amar, M.; Yang, D.; Brinza, O.; Kanaev, A.; Duten, X.; Vega-González, A. Plasma catalysis application of gold nanoparticles for acetaldehyde decomposition. Chem. Eng. J. 2018, 347, 913–922. [Google Scholar] [CrossRef]
Figure 1. Ethanol photocatalytic degradation by 3%Ag-TiO2 (a), 0.5%Au-TiO2 (b), 0.5%Au/3%Ag-TiO2 (c) and 2%Au/3%Ag-TiO2 (d).
Catalysts 12 00235 g001
Figure 2. Possible ethanol photocatalytic degradation pathways on the bimetallic catalyst.
Catalysts 12 00235 g002
Figure 3. XRD patterns of the 3%Ag-TiO2 (black line),0.5%Au/3%Ag-TiO2 (blue line), and 2%Au/3%Ag-TiO2 (pink line). The phase attributions of the main peaks are also reported.
Catalysts 12 00235 g003
Figure 4. TEM micrographs recorded at a 43 K magnification and 145 K magnification of the 3%Ag-TiO2 catalyst.
Catalysts 12 00235 g004
Figure 5. TEM micrographs recorded at a 71 K magnification and 145 K magnification of the 0.5%Au-TiO2 catalyst.
Catalysts 12 00235 g005
Figure 6. TEM micrographs recorded at a 38 K magnification and 97 K magnification of the 0.5%Au/3%Ag-TiO2 catalyst.
Catalysts 12 00235 g006
Figure 7. TEM micrographs of the 0.5%Au/3%Ag-TiO2 catalyst at higher magnification.
Catalysts 12 00235 g007
Figure 8. Representative TEM and HAADF images of the 0.5%Au/3%Ag-TiO2 sample and particle size distribution.
Catalysts 12 00235 g008
Figure 9. (a) HAADF and EDS elemental maps of the 0.5%Au/3%Ag-TiO2 sample: Au is represented in green and Ag in red. (b,c) HAADF and elemental mapping of individual metal nanoparticles.
Catalysts 12 00235 g009
Figure 10. (a) DR spectra and (b) relative absorbance spectra for pristine and metal-promoted TiO2 samples.
Catalysts 12 00235 g010
Figure 11. Absorbance spectra of 3%Ag-TiO2 (a), 0.5%Au-TiO2 (b) and 0.5%Au/3%Ag-TiO2 samples (c) as obtained, after irradiation with UV light for 60 and 120 min, and after 24 h storage in the dark.
Catalysts 12 00235 g011
Table 1. Ethanol conversion and acetaldehyde conversion after 3 h of UV irradiation.
SampleCH3CH2OH Conv. %CH3CHO Conv. %
3%Ag-TiO287.00.0
0.5%Au-TiO298.081.7
0.5%Au/3%Ag-TiO2100.0100.0
2%Au/3%Ag-TiO298.098.0
Table 2. XPS survey analyses of bare TiO2, monometallic 3%Ag-TiO2 and 0.5%Au-TiO2, and bimetallic 0.5%Au/3%Ag-TiO2 samples.
SampleC 1sTi 2p3/2O 1sAg 3d5/2Au 4f7/2
B.E.
(eV)
At. %B.E.
(eV)
At. %B.E.
(eV)
At.
%
B.E.
(eV)
At.
%
B.E.
(eV)
At.
%
TiO2284.620.0458.518.8529.556.8----
3%Ag-TiO2284.622.1458.112.3529.549.3367.30.21--
0.5%Au-TiO2284.628.9458.517.4529.850.9--83.00.37
0.5%Au/3%Ag-TiO2284.636.6458.615.3529.944.6 1.77 0.98
Table 3. Fitting results of high-resolution XPS spectra of Ag 3d and Au 4f regions for 3%Ag-TiO2, 0.5%Au-TiO2, and 0.5%Au/3%Ag-TiO2.
Catalyst Ag 3dAu 4f
Ag0Ag+Au0Au+
3%Ag-TiO2B.E. (eV)n.d.367.0--
%-100--
0.5%Au-TiO2B.E. (eV)--83.685.0
%--91.58.5
0.5%Au/3%Ag-TiO2B.E. (eV)368.7367.583.484.7
%14.385.785.714.3
Table 4. Features of the TiO2 used as support.
Specific Surface Area
(m2 g−1)
Particle Size Range (nm)OH/Otot (XPS)Band Gap
(eV)
12 ± 2110–1300.323.15
Table 5. Ag+ enriched solution composition.
AgAsCuFeNiPbZnSO42−Others
mg/L327,76012.24087.229.936.419.034.375.0<2
Table 6. List of the synthesized photocatalysts with main features.
n.Sample NameMetal PrecursorsSupport
13%Ag-TiO2Ag-enriched wastewaterPristine TiO2
20.5%Au-TiO2HAuCl4 (by sol-PVA)Pristine TiO2
30.5%Au/3%Ag-TiO2HAuCl4 (by sol-PVA)3%Ag-TiO2
42%Au/3%Ag-TiO2HAuCl4 (by sol-PVA)3%Ag-TiO2
Publisher’s Note: MDPI stays neutral with regard to jurisdictional claims in published maps and institutional affiliations.

