Article

Preparation and Characterization of Supported Molybdenum Doped TiO2 on α-Al2O3 Ceramic Substrate for the Photocatalytic Degradation of Ibuprofen (IBU) under UV Irradiation

by
Chukwuka Bethel Anucha
1,*,
Emin Bacaksiz
1,
Vassilis N. Stathopoulos
2,
Pavlos K. Pandis
2,3,
Christos Argirusis
3,
Constantina-Dia Andreouli
4,
Zoi Tatoudi
4 and
Ilknur Altin
1
1
Department of Chemistry/Physics, Faculty of Science, Karadeniz Technical University, Trabzon 61080, Turkey
2
Laboratory of Chemistry and Materials Technology, Department of Agricultural Development, Agrofood and Management of Natural Resources, Psachna Campus, National and Kapodistrian University of Athens, 34400 Evia, Greece
3
Laboratory of Inorganic Materials Technology, School of Chemical Engineering, National Technical University of Athens, 9 Iroon Polytechniou Str., Zografou Campus, 15780 Athens, Greece
4
Materials Industrial Research and Technology Center S.A., Anthion-Lamias National Road (76th km), P.O. Box 18646, 34100 Chalkida, Greece
*
Author to whom correspondence should be addressed.
Catalysts 2022, 12(5), 562; https://doi.org/10.3390/catal12050562
Submission received: 31 March 2022 / Revised: 26 April 2022 / Accepted: 9 May 2022 / Published: 19 May 2022
(This article belongs to the Special Issue Photocatalytic Activity of TiO2 and Its Applications)

Abstract

:
TiO2-based photocatalyst materials have been widely studied for the abatement of contaminants of emerging concerns (CECs) in water sources. In this study, 1.5 wt% Mo-doped HRTiO2 was obtained by the sonochemical method. The material was analyzed and characterized for thermal, structural/textural, morphological, and optical properties using TGA-DSC, XRD, TEM, FTIR, XPS, SEM-EDS, BET (N2 adsorption-desorption measurement and BJH application method), and UV-Vis/DRS measurement. By the dip-coating technique, ~5 mg of Mo/HRTiO2 as an active topcoat was deposited on ceramic. In suspension and for photocatalyst activity performance evaluation, 1 g/L of 1.5 wt% (Mo)/HRTiO2 degraded ~98% of initial 50 mg/L IBU concentration after 80 min of 365 nm UV light irradiation and under natural (unmodified) pH conditions. Effects of initial pH condition, catalyst dosage, and initial pollutant concentration were also investigated in the photocatalyst activity performance in suspension. The photocatalyst test on the supported catalyst removed ~60% of initial 5mg/L IBU concentration, while showing an improved performance with ~90% IBU removal employing double and triple numbers of coated disk tablets. After three successive cycle test runs, XRD phase reflections of base TiO2 component of the active photocatalyst supported layer remained unchanged: An indication of surface coat stability after 360 min of exposure under 365 nm UV irradiation.

1. Introduction

The water environment has faced unprecedented pressure from the inflow of organic chemical pollutants [1]. Global water quality issues are now a major challenge confronting humanity in the twenty-first century [1]. This development has led the United Nations Organization (UNO) to recognize access to clean water and sanitation as a fundamental human right, while establishing it as one of its 17 sustainable development goals (SDGs) [2,3]. Considering that the majority of more than 100,000 globally registered chemicals are in daily use for several purposes, only leaves one to imagine the several routes through which these chemicals enter the aquatic environment [1]. A group of these chemicals that continue to be of environmental concern are referred to as “contaminants of emerging concern” (CECs) [4,5,6,7,8,9,10,11,12,13,14]. These are compounds that have existed for a long time, but not detected until recently: Thanks to the advanced analytical instruments that have now made their monitoring significantly easier, despite their occurrence at a low concentration range of ng/L–µg/L [4,5,6,7,8,9,10,11,12,13,14]. They spread over a wide range of organic compounds, including and not limited to pharmaceuticals and personal care products (PPCPs), pesticides, flame retardants, endocrine-disrupting substances (EDSs), artificial sweeteners (ASWs) and flavors, organic solvents, industrial chemicals, and engineered nanomaterials. In addition, more than 100,000 chemicals have been reported and documented [15]. Different types of pharmaceutical and personal care product (PPCP) compounds have been detected on a global scale in several effluents receiving aquatic sources, such as rivers, lakes, seas, surface and ground waters, sediments, as well as tap water [16,17,18,19,20,21,22]. The unregulated disposal system of these compounds allows for their continuous pathway into the aquatic environment [23]. Wastewater treatment plants (WWTPs) receiving pharmaceutical industry waste streams as well excretory metabolites of medically treated humans and animals have been identified as the main source of these PPCP pollutants in the aquatic environment [23,24]. These compounds are susceptible to incomplete removal by conventional treatment technologies [25,26]. A group of the most frequently detected PPCPs at the end of pipe treatment effluents that finally make their way into the water environment are the non-steroidal anti-inflammatory drugs (NSAIDs) [12,27,28]. The NSAIDs group possesses a characteristic feature, the carboxylic aryl acid moiety, which provides the acidic property [27,28]. Ibuprofen (IBU), 2-4-isobutylphenyl propanoic acid, belongs to the NSAIDs family [27,28]. Since its approval in 1984 as an over-the-counter drug (i.e., drugs that can be used without formal prescription by a qualified medical professional), it has been widely used as an anti-inflammatory drug, antipyretic, analgesic drug, and more specifically for the treatment of rheumatoid arthritis [29]. Due to the widespread use, detection of up to 10 µg/L has been reported in Europe and the US [30].
To this effect, upgrading of conventional methods that operate WWTPs have been seen as inefficient for the removal of these compounds, such as IBU, and many others have become pertinent. Research over the last decades has focused on strategic and innovative key enabling technologies for clean water and wastewater treatment [31,32,33]. These technologies include and are not limited to heterogeneous forms of solar-driven advanced oxidation processes (AOPs) that are applied to organic pollutant abatement from water sources [34,35,36]. In addition, semiconductor materials are prominent in the application of solar AOPs for water remediation purposes, and chief among them is titania (TiO2), which has been extensively studied as a photocatalyst material for organic pollutant removal from water [37,38]. Although TiO2 is readily available, cheap, non-toxic, chemically and thermally stable, easy to handle with attractive mechanical properties, possesses limited UV-Vis spectrum range light response, fast recombination of the photogenerated hole (h⁺) and electron (e) charge carriers, wide energy bandgap, as well as reduced quantum yield, etc., these factors remain as challenges in the potential application of TiO2 photocatalyst material for environmental remediation and particular water purification [37,38,39,40].
Addressing these setbacks, research efforts have adopted several strategies to realize the efficient performance of TiO2-based photocatalyst/new materials and processes in the removal of organic pollutants from water sources as well as for extensive environmental remediation applications [37,38,39]. Modification strategies, such as heteroatom doping, semiconductor oxide coupling, heterojunction fabrications, dye/metal loading sensitizations, surface modifications, and carbon-based nanomaterial hybrids, etc. have been studied and reported [37,38,39,40,41,42,43,44]. Adopting one of these modification strategies or even more than one in a combination of mixed-methods approach resulted in TiO2/other semiconductor-based modified composite materials with high photocatalyst performance efficiency for environmental remediation and other related energy sustainable applications [10,11,12,13,14,45,46,47,48,49,50,51,52,53,54,55,56].
In light of this, molybdenum (Mo) as a dopant modifier has been incorporated with TiO2 and reported with impressive photocatalytic performance over organic compound degradation in comparison with the unmodified TiO2.
For instance, Huang et al. reported that ≈100% methylene blue (MB) degradation efficiency can be reached after 300 min of solar light irradiation with a sol-gel synthesized 2 wt% Mo-doped TiO2 [57]. Yang et al. reported a 38% methylene blue (MB) conversion under visible light after 150 min using the photocatalyst obtained via wet impregnation, with an optimum MoO3/TiO2 mass ratio of 0.25. In this study, the authors attributed the enhanced activity of the modified TiO2 in comparison with the unmodified TiO2 to the bandgap shrinkage and added a suitable amount of the crystalline MoO3 [58]. Aviles-Garcia et al. reported the highest degradation and mineralization of 97% and 74%, respectively over 4-chloropenol oxidation by the photocatalyst after 100 min of UV irradiation. This was synthesized by evaporation-induced self-assembly (EISA) of 1 wt% W and Mo co-doped TiO2 [59]. Furthermore, the photocatalytic degradation of 4-chlorophenol has been reported. CuMoO₄-doped TiO2 has been achieved via a chemical synthesis route that delivers a high-efficiency degradation of 96.9% of the pollutant at an optimized 0.05 wt% of the dopant contents under visible light irradiation, for 3 h and at pH 9 condition [60]. In a related study, Zhang et al. carried out the degradation of Mo and N co-doped TiO2 through the anodizing associated hydrothermal method. After 180 min, methylene blue (MB) was achieved under a remarkable visible light photocatalytic degradation activity by the photocatalyst composite of 1% dopant content each over 10 mg/L of initial methylene blue (MB) [61].
More specifically and concerning ibuprofen (IBU) as a classified CEC compound of the non-steroidal anti-inflammatory drugs (NSAIDs) group, modified TiO2-based photocatalyst materials have been employed for their degradation. The 0.5 g/L hydrothermally grown graphene oxide-based heterojunction TiO2-ZnO (RGO/TiO2/ZnO) at pH 6 has been reported with an impressive photocatalytic activity performance over 10 mg/L of initial IBU concentration, removing respectively 98.5% and about 80% of the pollutant under 120 min of UV-A irradiation and 180 min of visible light irradiation [62]. TiO2 surface-functionalized NH2 group nanoparticles polyacrylonitrile (PAN) grafted-multiwalled carbon nanotube composite (PAN-MWCNT/TiO2-NH2) nanofibers have been reported as an efficient performance photocatalyst for an almost 100% degradation of 50 mg/L initial ibuprofen concentration at pH 2 after 140 min of UV irradiation [27].
Apart from the various modification strategies aimed at improving the performance efficiency of TiO2/other semiconductor-based photocatalyst materials, the feasibility in the use of the anchored catalyst for the photocatalytic degradation of organic pollutants has been heralded as an important technique for the elimination of in-treatment aggregation and post-treatment separation, while facilitating the recovery and reuse of nanoparticles from effluent bulk streams [63]. These are the challenges of water purification technologies that operate on the suspension TiO2 process.
In this context, efforts have been channeled by several research groups to close through the development of sustainable and integrated water depuration systems [63]. For instance, Luo et al. prepared direct current (DC) reactive magnetron sputtering TiO2 thin films of different at % Mo dopant amounts on a glass substrate and achieved over 70% methylene blue (MB) degradation with the 0.9 at % Mo dopant photocatalyst after 120 min under solar irradiation [64]. In a recent study, we reported the photocatalytic degradation of ibuprofen under UV-A irradiation by a three-layered TiO2/ZnO/CuPc photocatalyst coated on stainless steel substrate via subsequent dip coating, spray pyrolysis, and spin coating methods [12]. The photocatalyst achieved about 80% degradation of initial 50 mg/L ibuprofen concentration after 4 h and sustained activity over a successive 5th cycle test run with 77% ibuprofen degradation [12].
In the present work, semiconductor metal doping as a modification strategy was demonstrated. Throughout the paper, doping of the commercial titania powder sold under the portfolio name as Huntsman tioxide (referred to as “HRTiO2”) is reported for the first time to the best of our knowledge and as a technical grade titania for photocatalytic studies aimed at organic pollutant removal. Following the heat treatment, the as-prepared 1.5 wt% Mo-modified HRTiO2 was tested both in suspension and immobilized (supported) form for photocatalytic activity evaluation towards ibuprofen (IBU), a contaminant of emerging concern (CEC), under UV irradiation.
Hereafter, the 1.5 wt% Mo/HRTiO2 will now be referred to as Mo/HRTiO2 for the remainder of the paper.

2. Results and Discussion

2.1. Characterization of Synthesized and Prepared Materials

2.1.1. Characterization of Modified Mo/HRTiO2

The HRTiO2 and Mo/HRTiO2 samples were analyzed using thermogravimetric analysis-differential scanning calorimetry (TGA-DSC) to evaluate mass changes due to the evaporation, decomposition, and interaction with atmospheric conditions [65,66], while associating the thermal effect outcome of the samples from the physical and chemical processes involving phase transitions, specific heat, etc. As can be seen from Figure 1a, in the mass-loss diagram, there is about 3.3% mass-loss of HRTiO2 up to 700 °C due to the organic nature of additives in the HRTiO2 commercial powder. Similar mass-losses are reported in the literature, e.g., P25 with Ru nanoparticles, attributing this mass-loss to the oxidation of carbonated species (Figure 1a) [67]. Moreover, this mass-loss phenomenon has been reported and attributed to external surface water molecule physisorption (Figure 1a) [59,68,69]. The exothermic heat processes of the sample materials are obvious up to 700 °C (Figure 1b). Upon the addition of Mo onto HRTiO2, the modified Mo/HRTiO2 sample exhibited a faster sample stability outcome at an earlier time, concerning the highlighted stages involved during the heat treatment of the unmodified TiO2 sample (Figure 1a,b). This further stability may be attributed to the oxidation of carbonated species of Mo/HRTiO2 during its preparation process [68,69,70].
The crystal phase composition/crystallinity and average particle size of Mo/HRTiO2 and the unmodified HRTiO2 were respectively measured and analyzed by X-ray diffraction (XRD) and transmission electron microscope (TEM). The identified crystal phase structures known for the pristine TiO2 material were similar and matched in the modified sample material (Figure 2a). Mixed anatase and rutile pristine TiO2 peak phases of {101}, {103}, {004}, {112}, {200}, {105}, {211}, {204}, and {116} corresponding with respective angle reflections of 2θ = 25.39°, 36.9°, 37.79°, 38.57°, 48.07°, 53.89°, 55.07°, 62.69°, and 68.76°, and indexed according to JCPDS card no. 01-071-168 were identified and matched in both the unmodified and modified samples. The intensities of these peaks and their positions agreed with the reported literature data [59,64,71,72,73]. The prominence of the {101} crystal phase at 2θ = 25.39° is an indication of the ordered crystalline structure of Mo/HRTiO2 and can further be confirmed through the estimated crystallite sizes of the materials, according to the Dybe-Scherrer function in Equation (1), where λ = 1.54059 Å is the wavelength of the CuKα source, β is the integral breadth of XRD peaks depending on the width of the particular hkl plane obtained at full width at half height maximum (FWHM) in degrees, θ is the diffraction angle obtained from XRD data of the most intense reflected phase, and K is the shape factor constant with an assigned value of 0.9.
D hkl = K λ β h k l cos θ
Crystallite sizes of the materials were estimated according to Equation (1) and found to be 16.47 nm for the unmodified TiO2 and 29.99 nm for the Mo/HRTiO2 sample material (Table 1). The presence of the Mo dopant on the TiO2 translated to an improved crystallite size of the modified material over the unmodified one. This can further be confirmed from Figure 2a, where the crystal peak phases in the modified material sample and, in particular, the {101} exhibited a narrower, intense, and sharper peak in comparison with the unmodified peak phases. Above all, the presence and recognition of the familiar TiO2 peak phases after Mo addition establish the fact that despite the exercised doping modification strategy, the pristine base TiO2 state is maintained. The TEM images in Figure 2b,c show a type of non-perfectly spherical, but ellipsoidal-shaped nanoparticle in a disjointed matrix network in the unmodified TiO2 sample material (Figure 2b). Upon the addition of the Mo dopant, a more interconnected network of the TiO2 developed, while maintaining the non-perfect spherical ellipsoidal shape; however, in a bulgier appearance with surface deposited spots linked to the Mo particles (Figure 2c) [11,51,52,59]. The particle size estimate from the TEM measurement showed an improved value from 27.52 nm for the unmodified HRTiO2 to 58.66 nm for the modified Mo/HRTiO2 material (Table 1). These values correlated with the estimated value outcome of the average crystallite sizes of the material samples by XRD estimation (Figure 2a, Table 1).
Comparatively and on a general note, the microstructural outlook of the modified material for the unmodified did not present a shift from the pristine TiO2 state (Figure 2b,c).
The bonding interactions of the make-up functional groups in the sample materials were measured by Fourier transform infrared (FTIR) spectroscopy measurement.
As can be seen from Figure 3, the FTIR spectra showed the key functional groups known for pristine TiO2 within the 400–4000 cm¹ range, as expected. The characteristic absorption band peaks around 640.11, 751.06, and 802.73 cm¹ are attributes of Ti–O stretching and Ti–O–Ti network linkages, which are both in the unmodified and Mo modified HRTiO2 sample materials [11,12,13]. Absorption bands at 958.75, 1062.59, and 1173.54 cm¹ are attributes of Ti–OH vibrations and have been also reported to be linked to carbonates or carboxylic (C=O) stretching mode and the unsaturated C=C stretching mode, originating from organic precursors used in the preparation of the sample materials [11,12,59]. Respective peaks at around 1400 and 1625.18 cm¹ are characteristic attributes of the surface hydroxyl (–OH) group and the bending and stretching of the hydrogen bond of surface absorbed physical water (H–O–H) [10,11,12,13]. While peak vibrations at 2003.56, 2210.53, and 2507.11 cm¹ have been reported for the –CH2 functional group, peak signals at 2958.75 and 3470.13 cm¹ are attributes of –CH vibrational bond, possibly due to the organic additives of the HRTiO2 and the broad stretching mode for the –OH functional group affiliated with the surface adsorbed water molecule, respectively [10,11,12,13,59]. Apart from the presence of key signal attributes of pristine TiO2 in the sample materials, the identified peak signals around 802.73 and 958.75 cm¹ also coincided respectively with the characteristic symmetric and asymmetric vibrations of cis MoO2 and Mo–O–Mo bridging bonds of the modified Mo/HRTiO2 material [64,73,74,75]. Remarkably still, the peak signal of around 580 cm¹ is a key indicator, confirming the presence of Mo in Mo/HRTiO2 and attributed to the characteristic vibrational Mo2O2 entity (Figure 3) [58,73,74,75].
The binding interactions and chemical make-up environment of the sample materials were elucidated by the XPS analysis. Figure 4a shows the XPS survey spectrum of the sample materials. As expected, the constituent elemental compositions of the materials revealed the same element components of Ti and O in the unmodified HRTiO2 sample, while Mo in addition to the Ti and O atoms were found in the Mo/HRTiO2 modified sample. Core C 1s, which is seen in the spectrum at ~285 eV, has been reported and attributed to carbon with possible affiliation to C–H and or C–C, C=C, C–O–H, C=O bond functionalities [11,14,73,75]. Figure 4b–d displays the XPS spectral images, showing the elemental compositional peaks of the Mo/HRTiO2 material. The 2p energy level distinguished Ti 2p3/2 and Ti 2p1/2 at respective binding energies of 458.7 and 464. 4 eV, as expected (Figure 4b). These binding energies agree with the reported literature data, confirming the presence of Ti⁴⁺ state in the material sample. The non-significant shift to high BE of the Ti 2p degenerate energy levels conforms to what has already been reported of their respective data values, with respect to the Ti 2p in the unmodified base TiO2 [11,12,59,73]. This is a further confirmation of the non-alteration state of the pristine HRTiO2 material after Mo addition. The O 1s resolved at binding energies of 530 and 531.4 eV (Figure 4c). These O 1s spectral resolutions respectively belong to the Ti–O bond and the surface hydroxyl (−OH) group, which is enhanced by the addition of the Mo dopant onto the surface of the HRTiO2 base material [10,11,13,14,59,73,74,75]. Assigned Mo 3d spectral peaks were resolved at binding energies of 232.5 and 235.7 eV for Mo 3d5/2 and Mo 3d3/2 states, respectively (Figure 4d). These assigned BE values for Mo 3d states have been reported as attributes of Mo⁶⁺ and Mo⁵⁺ excited spin state contributions for the respective Mo 3d5/2 and Mo 3d3/2 energy states [59,73,74]. The surface residence of the added Mo in its readiness for an established Mo⁶⁺/Mo⁵⁺ redox system alongside surface modification addition effects is suggested to have created the existence of weakly bound surface oxygen species in the modified Mo/HRTiO2 material [11,42,50,51,52,53]. Therefore, the catalytic activity enhancement of the modified material over the unmodified is facilitated and promoted by efficient charge transfer mechanism with the reactive species becoming more accessible.
The surface morphology and textural properties of the sample materials were measured and analyzed by scanning electron microscope coupled energy dispersive spectroscopy (SEM-EDS) and Brunauer-Emmett-Teller (BET) N2 adsorption-desorption isotherm measurements, respectively. In addition, the Barett-Joyner-Halenda (BJH) application method was used to achieve insight into the pore size distribution (PSD) of the sample materials [50].
As can be seen from Figure 5a, the surface morphology outlook of the unmodified HRTiO2 shows a type of loosely agglomerated and a small amount of disjointed particle sizes from bulk matrix dense particles. The associated EDS of the SEM image revealed the presence of O and Ti as the major contents in the HRTiO2 sample, as expected (Figure 5a,c). The presence of the C atom in the EDS map is linked to the carbon origin [12]. Correspondingly, upon the addition of Mo to HRTiO2, the surface morphology outlook of the Mo/HRTiO2 showed a more closely packed agglomerated and distinctly improved individual particle sizes within the HRTiO2 matrix network (Figure 5b). Likewise, the EDS map revealed the component atomic elemental make-up of the modified Mo/HRTiO2 with an indicated presence of O, Ti, and Mo in the sample, as expected (Figure 5b,d). The revealed C in the EDS map of Mo/HRTiO2 is of adventitious origin [12]. The 2.8 wt% Mo content obtained in the EDS map measurement analysis of Mo/HRTiO2 (Figure 5d) dropped to a 1.5 wt% content in the finally obtained sample material of the coated and calcinated ceramic substrate. In addition, it was preliminarily tested in powder with the supported material sample after calcination and further heat treatment for the two photocatalytic test scenarios.
The BET surface area of the unmodified HRTiO2 sample was estimated as 9.87 m2/g, while the modified Mo/HRTiO2 material sample was 8.40 m2/g (Table 1). The non-significant relative reduction rather increases in the surface area of the modified sample material in comparison with the unmodified. This is attributed to the surface anchorage of the Mo dopants onto the HRTiO2, which led to a proportional increase in surface population density with a consequent reduction in the surface area [72]. The dense nature of HRTiO2 as a technical grade commercial titania is also a contribution to the overall diminution of its surface area and the base forms, which provides them with tailormade suitability for coating applications [76]. The BET isotherm curve shape showed almost complete absence of hysteresis loop, which is an indication of the non-porous solid nature of the material samples (Figure 6a,b) [59,75,77]. Therefore, the measured specific surface area (SSA) can be attributed to the external area and large pore formation as intra-particle voids, indicating an easily accessible area of both materials. Evidently, this can be confirmed from the measured pore size distribution (PSD) network pattern of the sample materials (Figure 6a,b) (inset). The total pore volume of sample materials was estimated at 0.02 cm³/g of each average pore size of 7.06 and 9.11 nm, respectively for HRTiO2 and Mo/HRTiO2 (Table 1).
According to Equation (2) and the well-known Kubelka-Munk function theory, the energy bandgap (Eg) estimate from Tauc’s plot was obtained as 3.23 eV for both sample materials (Figure 7, Table 1), where F(R) is absorbance, R is reflectively, S is the scattering factor that is assumed to be a unit value, and n = ½ denotes the indirect bandgap energy transition:
F ( R ) = S ( 1 R ) n 2 R
The modified Mo/HRTiO2 did not show any difference in its estimated Eg value in comparison with the unmodified HRTiO2 (Figure 7a,b). Surface residence of the Mo dopant on the HRTiO2, which created a lesser cooperative intra-active effect towards the Eg reduction, an appreciable amount (1.5 wt%) of the Mo dopant covering the TiO2 surface rather than entry into the TiO2 lattice network structure, as well as variation in the material preparation/synthesis protocol all contribute to the lack of change in the Eg values of the material samples and, in particular, the modified [58,59,60].
Table 1 displays a summarized data presentation estimate of the characterized and measured properties of HRTiO2 and Mo/HRTiO2 materials.
Based on the characterization measurement and data estimation outcome of the prepared materials, the expected photocatalytic enhancement activity effect of the modified Mo/HRTiO2, which is achieved by the Mo addition modification strategy of the base HRTiO2 material, is envisaged to not have been or even completely not dependent on the increase in the surface area nor the shrinkage of energy bandgap [58,59]. However, the enhancement effect is suggested to have been due to some surface modification alterations (e.g., surface defects) that enriched the catalyst material with surface reactive oxygen species (e.g., OH, O², etc.) in combination with the ones generated by photoinduction charge mechanism/photogeneration, including the photocatalytic promotional effect of efficient surface charge separation phenomenon [11,40,51]. This deduction can be supported as previously explained by the surface resident Mo dopant on the HRTiO2 material base with a reflected appreciation of average particle size (Figure 2c) as well the presence of active surface oxygen species by the identified hydroxyl ion formation peak in the modified Mo/HRTiO2 XPS spectral analysis measurement (Figure 4c).

2.1.2. Development and Characterization of α-Al2O3 Ceramic Material Support

An inert ceramic support was selected as α-Al2O3. The ceramic substrate was prepared by extrusion, drying, and subsequent sintering at 1500 °C. The as-obtained α-Al2O3 disk-shaped ceramic support (40 mm diameter and 2 mm thickness) was employed without further treatment or processing as the photocatalyst support in this study (Figure 8). These alumina porous disks are super hydrophilic and readily wetted throughout when in aqueous media, as previously reported [78,79].
In summary, the technical features of the α-Al2O3 ceramic substrate for its potential application is displayed in Table 2, including the respective information on the particle size distribution (PSD) of the α-Al2O3 powder used, wt% by mass ingredient contents in the ceramic material, as well as the geometrical characteristics of the final disk-shaped ceramic support product.
The porosity and density of the ceramic support material sintered at 1500 °C as part of the characterization measurements were determined to be 43% and 2.4 g/cm³, respectively.

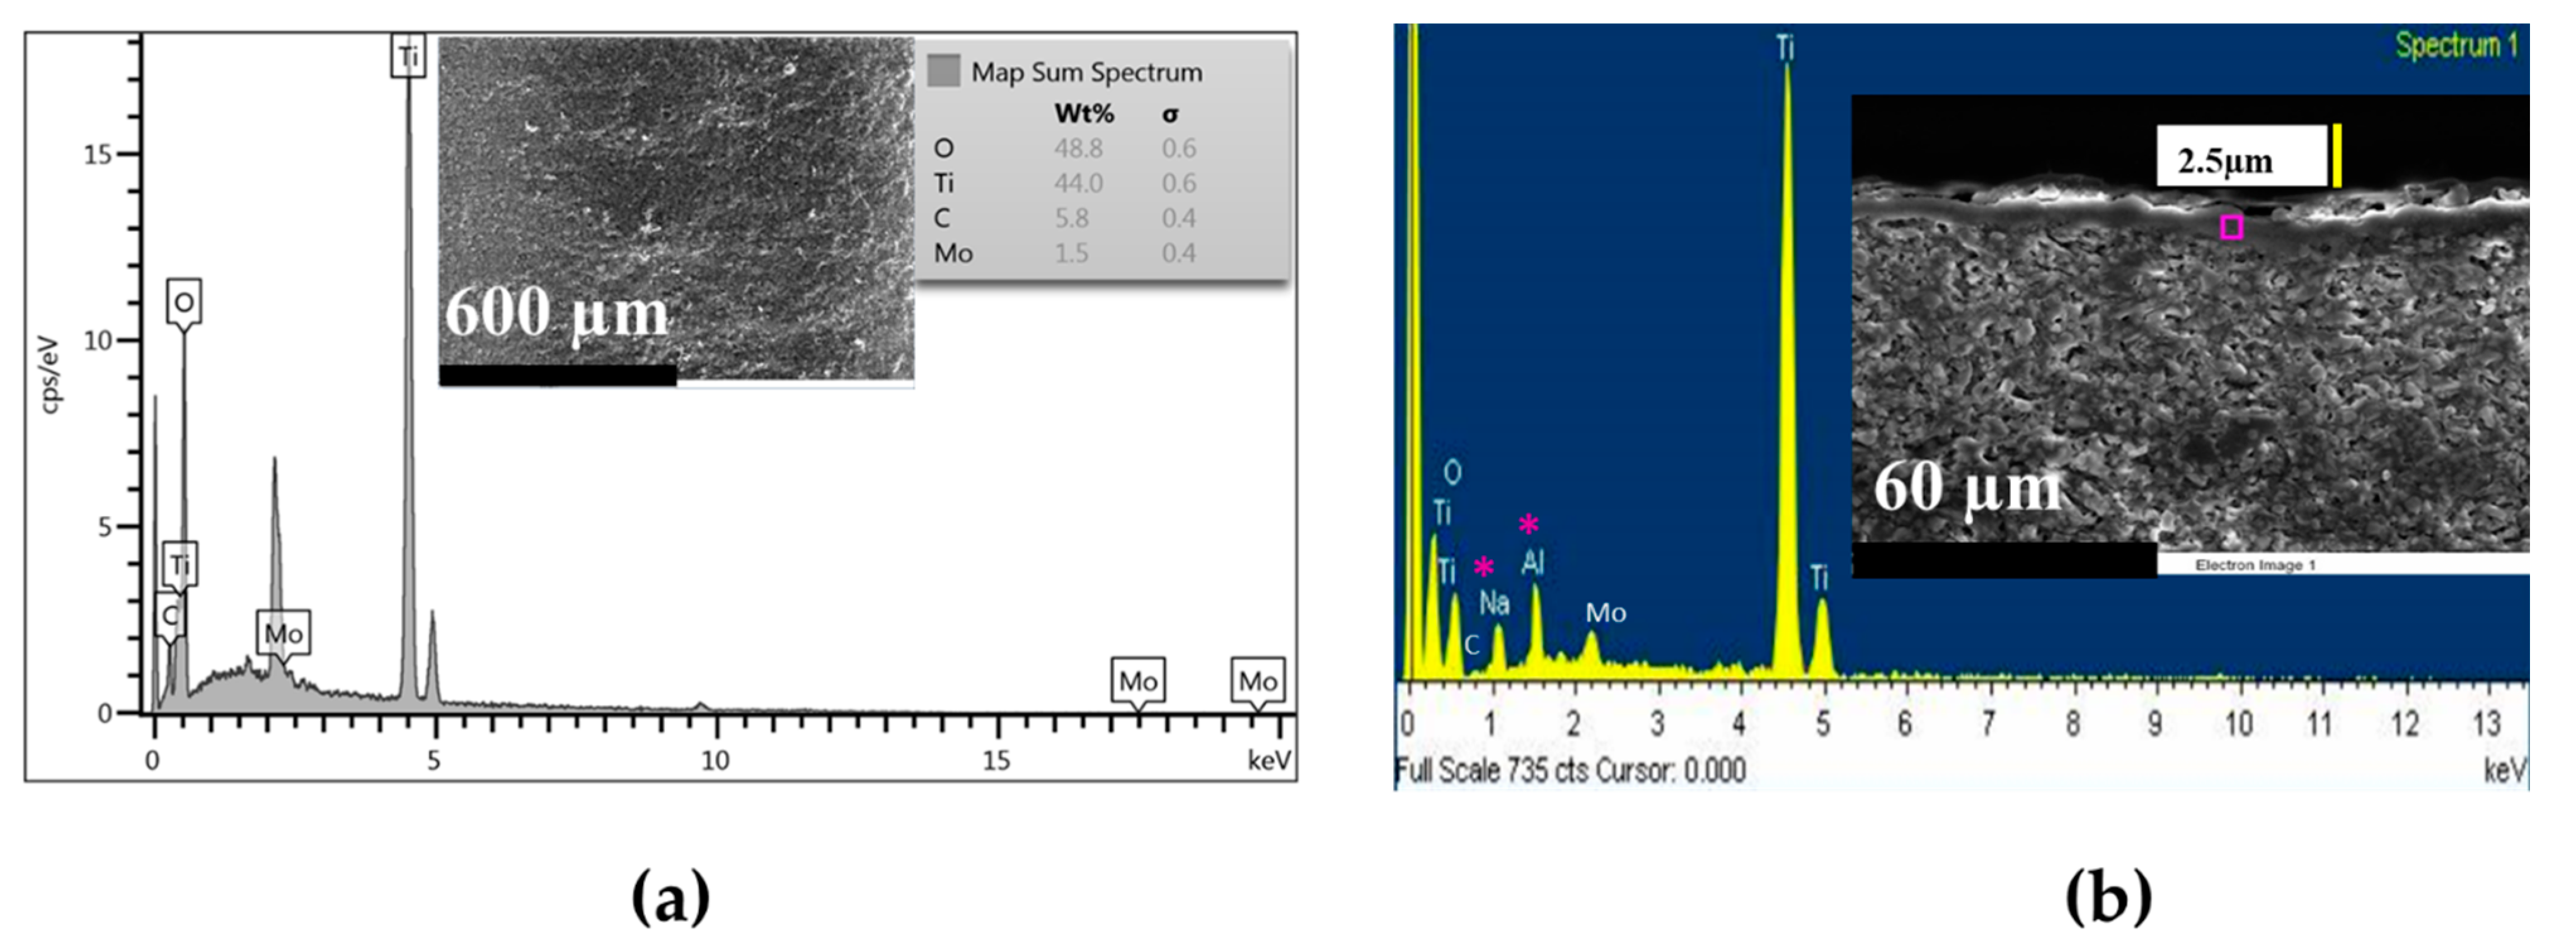
2.1.3. Preparation of Active Photocatalyst Surface Topcoat

Prior to the achievement of a functional surface topcoat, a series of titania powder suspensions and successive dilutions (results not shown) were prepared and controlled by surface morphology. Finally, a 1 wt% coat suspension content of the modified 1.5 wt% Mo/HRTiO2 was employed and delivered a better surface top layer on the ceramic support. Following support deposition, which involves the procedural steps of natural healing, drying, and further calcination heat treatment to ensure adequate coat adherence to the support material, ~5 mg of active titania (Mo/HRTiO2) was achieved. The surface morphological control of the topcoat at this amount and by the SEM-EDS measurement revealed a smooth coated ceramic surface devoid of crack and correspondingly the associated elemental compositions of the coated (ceramic) and (Mo/HRTiO2) from the EDS map (Figure 9a). In the same vein, the cross-sectional SEM revealed a micro thickness layer of the active topcoat on the support alongside the EDS spectrum, showing the constituent elemental composition of the active layer on the support material, as expected. Both SEM-EDS and the cross-sectional SEM-EDS images showed the presence of carbon in their maps as an attribute of adventitious origin (Figure 9a,b). The α-Al2O3 material, which sometimes exists in a mixed compositional phase with traces of other atomic elements, such as Si, Na, etc., revealed Na due to the transfection phenomenon effect during the final heat treatment of the active topcoat layer, while the presence of Al is of the base α-Al2O3 support material (Figure 9b).

2.2. Photocatalyst Tests Evaluation

Following the characterization of the unmodified HRTiO2 and modified Mo/HRTiO2, as well as the ceramic support active layer (Mo/HRTiO2) preparation and characterization, the obtained materials were evaluated for their photocatalytic performance towards the degradation of ibuprofen.
  • Physicochemical Properties of Ibuprofen (IBU)
Ibuprofen (IBU) belongs to the non-steroidal anti-inflammatory drugs (NSAIDs) group and is commonly administered as an over-the-counter medication for the alleviation of inflammatory pains. Table 3 presents a summarized outlook of the physicochemical properties of IBU.

2.2.1. Suspension Test
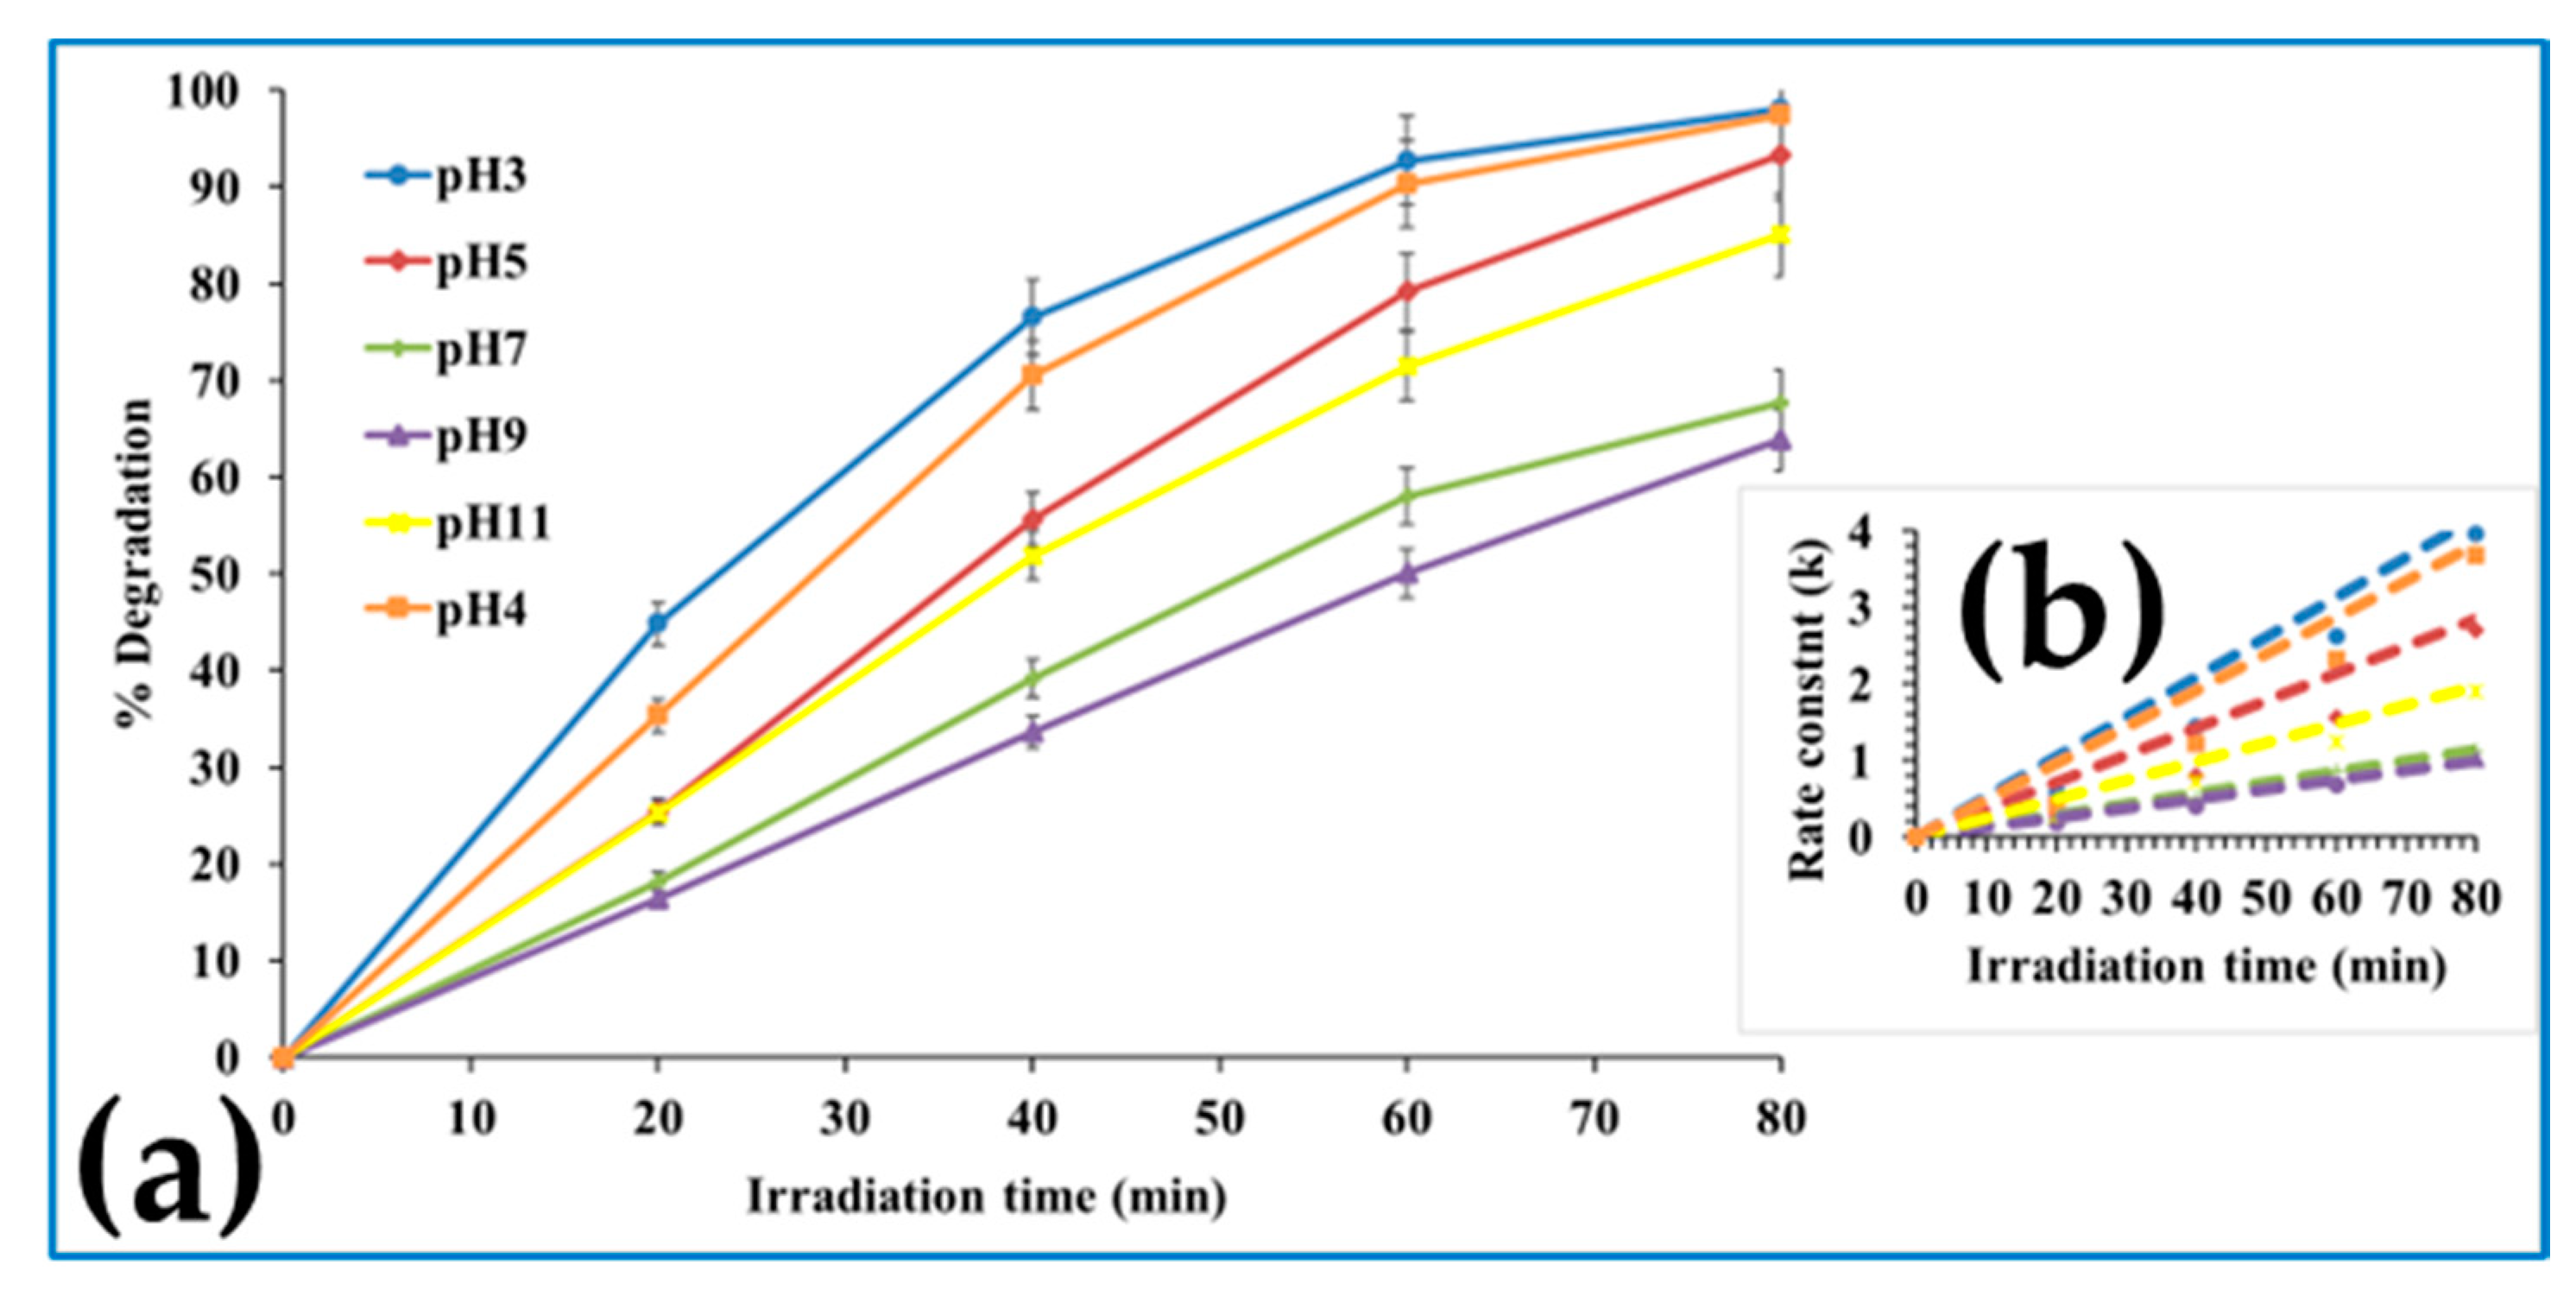
In a preliminary test, the photocatalytic activity performance of the HRTiO2 and Mo/HRTiO2 materials towards ibuprofen degradation was evaluated. Here, 1 g/L catalyst dose for each of HRTiO2 and Mo/HRTiO2 were tested against 50 mg/L of initial IBU concentration under 365 nm UV irradiation and natural (unmodified) initial pH 4 condition. As can be seen from Figure 10, while Mo/HRTiO2 degraded over 98% of the initial 50 mg/L IBU concentration, HRTiO2 achieved about 89% degradation of the same initial IBU concentration after 80 min of irradiation.
Based on the outcome in Figure 10, the Mo/HRTiO2 photocatalyst showed a higher photocatalytic activity performance towards IBU in comparison with the unmodified HRTiO2. This is due to the availability of more surface reactive species following the modification of the HRTiO2 base material with Mo dopant, as already deduced from the material characterization that facilitated the photoactivity performance of the modified material. Therefore, the Mo/HRTiO2 has shown better performance than the unmodified HRTiO2, and as a result, was employed for further photocatalytic test performance evaluations.

2.2.2. Effect of pH

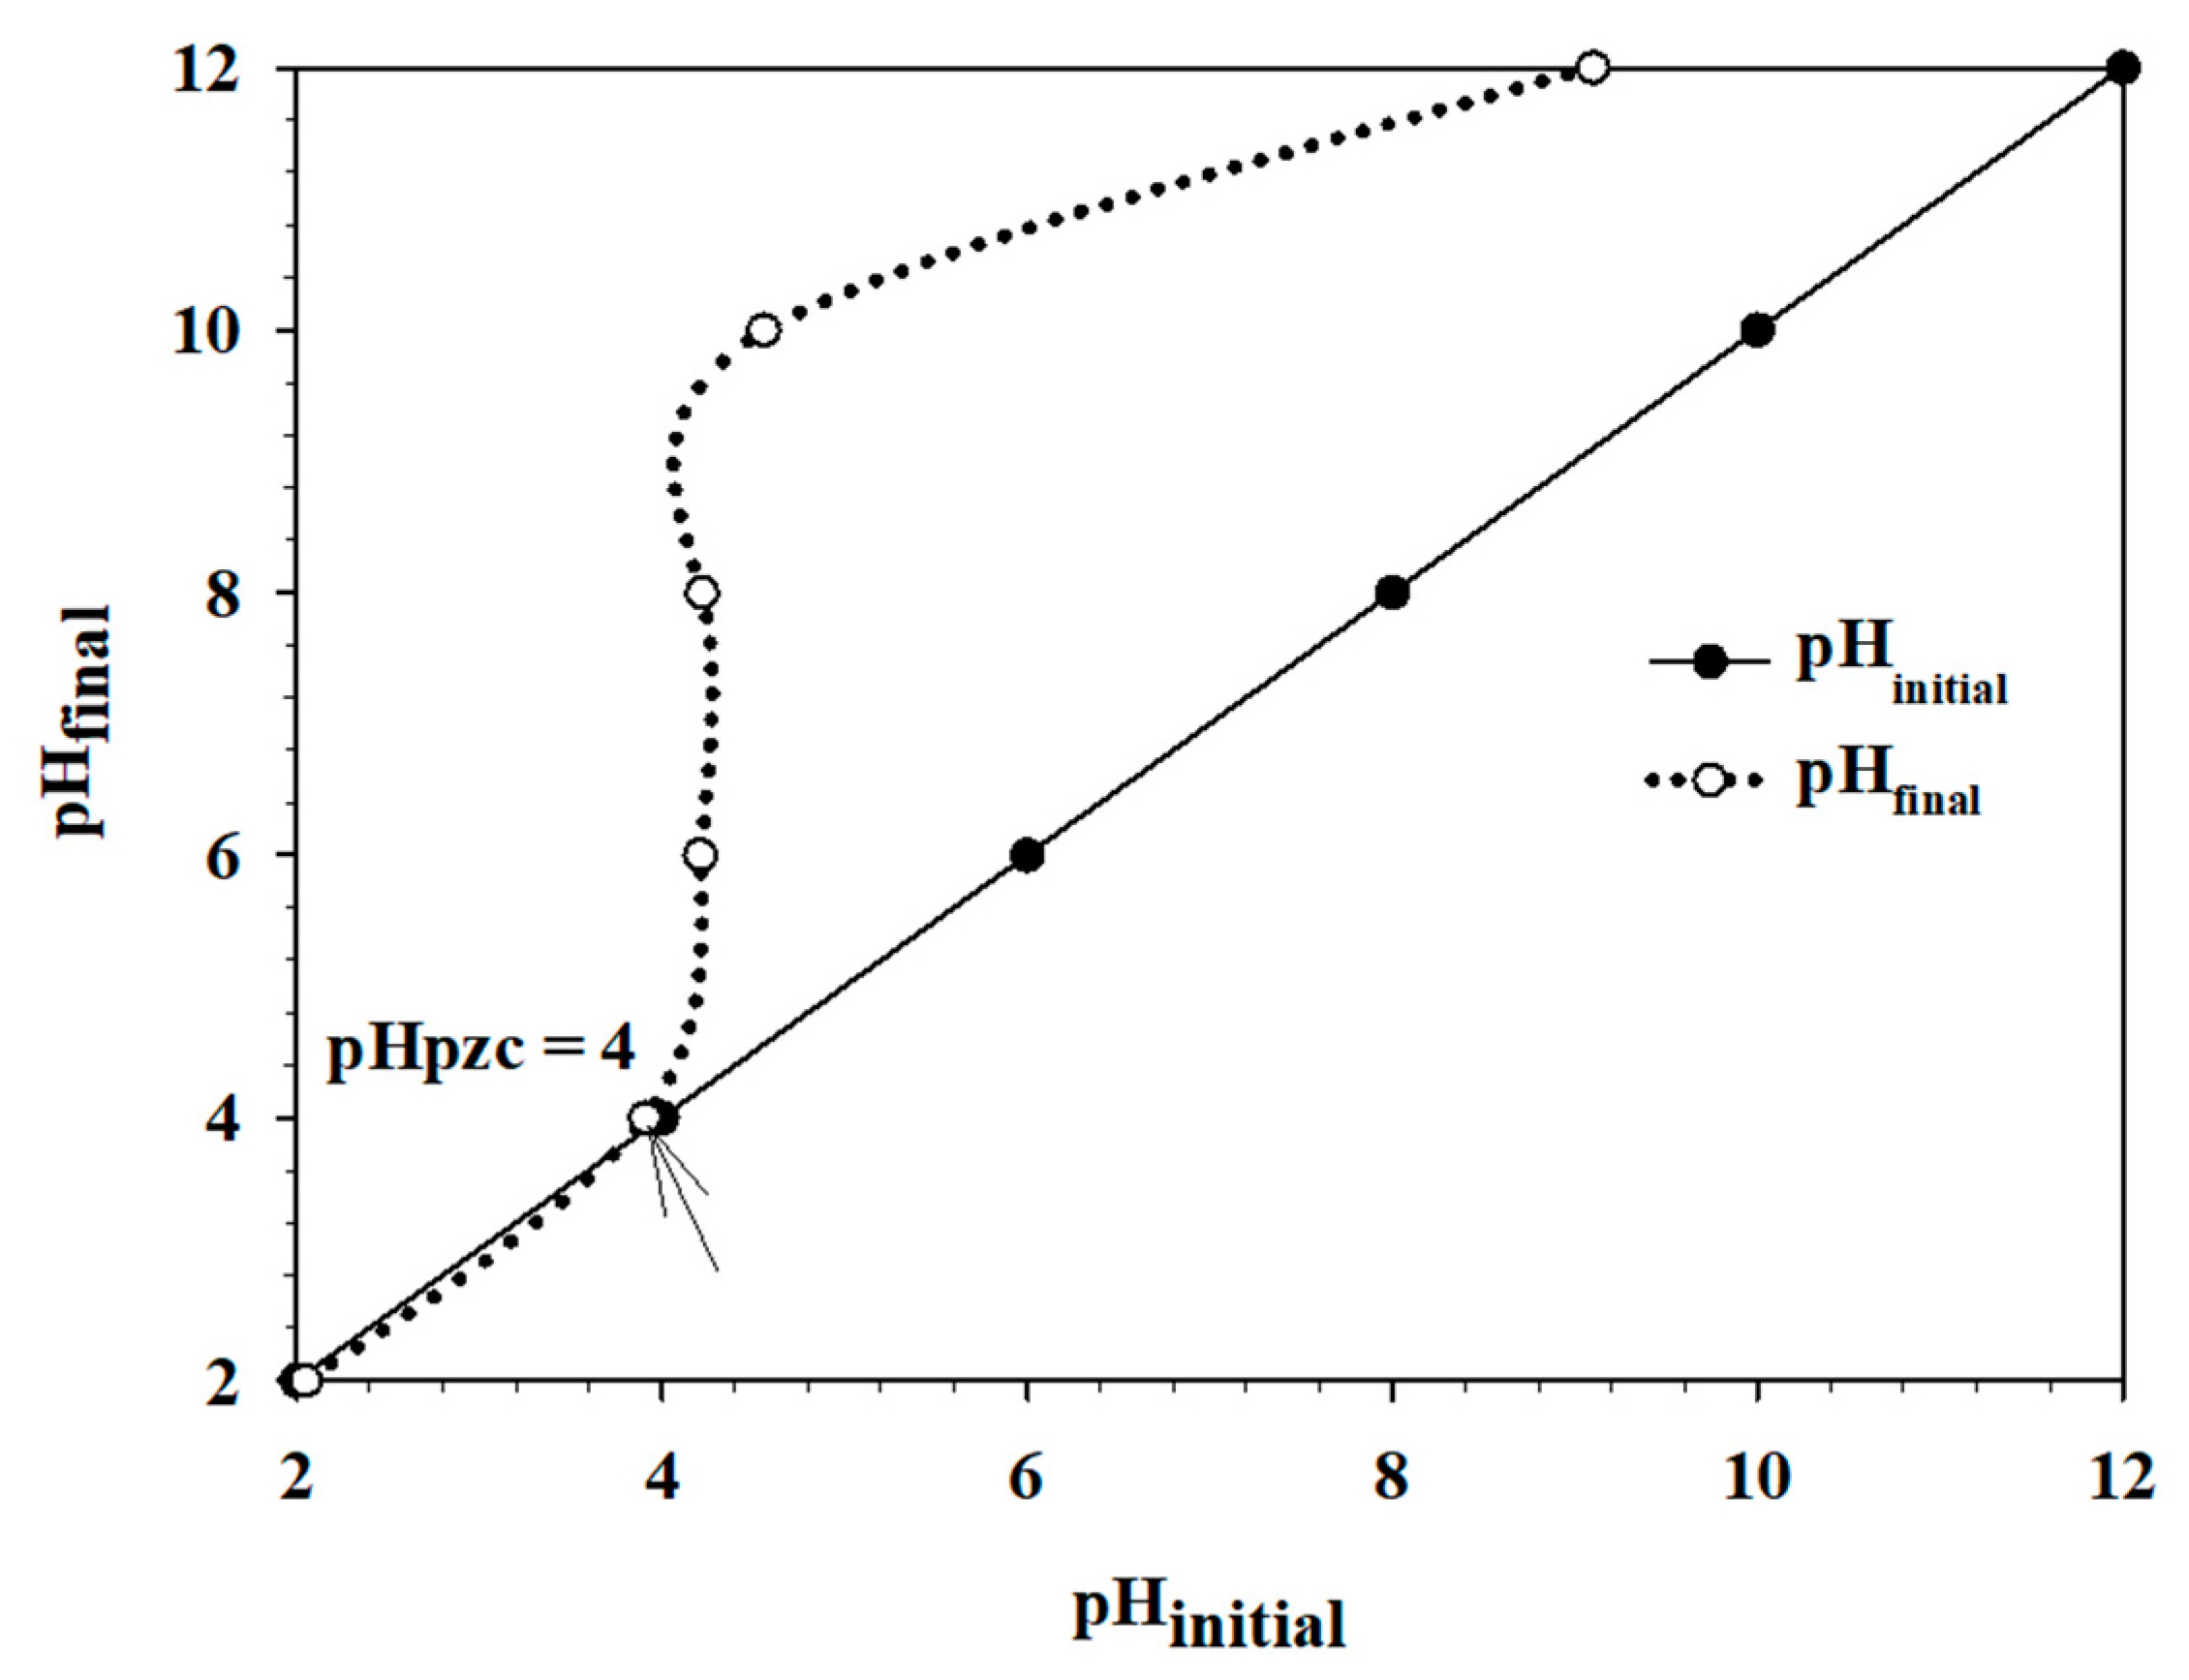
  • The pH Point of Zero Charge (pHpzc) Value
The pH plays a vital role in the degradation of organic compound molecules in aqueous media [10,12,13,14]. As part of the pH effect evaluation on the photocatalytic degradation efficiency of Mo/HRTiO2, its pHpzc was determined with a value of 4 (Figure 11). Although the pHpzc of pristine TiO2 lies between 5.5–6.5 [13], the shift to a low-end pH value in the pHpzc of the Mo/HRTiO2 is due to the presence of the acidic Mo semiconductor [58]. In addition to the initial natural (unmodified) pH 4, other pH values of 3, 5, 7, 9, and 11 were further evaluated for their effects on the photocatalytic degradation of IBU, based on the pHpzc of Mo/HRTiO2 and pKa value of IBU (Figure 11, Table 3).
As can be seen from Figure 12, under the low-end acidic initial pH values of 3 and 4, 1 g/L of the photocatalyst degraded ~98% of the initial 50 mg/L IBU concentration after 80 min of 365 nm UV irradiation exposure. The initial pH values of 3 and 4 are below and about the same value as the measured pHpzc charge of the photocatalyst (pHpzc 4) and the pKa value of IBU (pKa 4.52–4.9). Therefore, by indication, they should result in poor or no enhancement in the degradation of IBU by the photocatalyst under these initial pH conditions. However, the enhanced activity performance of the photocatalyst material under these initial pH conditions is attributed to the acidic H⁺ ion presence, which promotes an environment that facilitated the generation of reactive species, such as hydroxyl radical (OH, etc.) that is responsible for organic compound degradation [12,13,80]. In addition, the maintained final pH values of these initial pH conditions were around the same starting values to the end of the test, and thus, guaranteed the low-end pH hydrogen ion (H⁺) acidic proton enabling degradation environment (Table 4). The photocatalyst material under the tested moderate initial pH 5 condition degraded about 93% IBU after 80 min of irradiation (Figure 12). This type of high activity performance by the photocatalyst at this initial pH value can well be linked partly to the acidic proton promoting the photodegradation environment established at this point [12,13,80]. The reported IBU carboxylic functional group ionization state at pH values higher than its pKa value, which in turn promotes IBU molecule hydrophilicity and solubility in aqueous media to be able to reach the active photocatalyst sites for subsequent degradation, is also responsible for this improved photocatalyst activity at initial pH 5 [12,80,81,82]. The mixed outcome seen of the photocatalyst material, where at initial pH 11 about 85% IBU (Figure 12) was degraded, is attributed to a higher level of anionic species of IBU at these advanced pH values, promoting the hydrophilicity and solubility of the molecules for improved active photocatalyst surface interaction with the organic ionic compound substrate [12,80,81,82]. The photocatalyst achieved the least performance activity in IBU degradation at initial pH values of 7 and 9, at which points 68% and 64% of 50 mg/L initial IBU concentration were respectively removed (Figure 12). At these initial pH values, both the photocatalyst surface and the IBU substrate molecule in aqueous media will be negatively charged. Therefore, an induced electrostatic force of attraction will not be responsible for the rather lower degradation rate seen at this point in comparison with the other evaluated initial pH values. This is due to the lack of ability of the facilitative charge attraction environment neither by the photocatalyst pHpzc point of view nor the pKa value of IBU, with respect to those tested initial pH values (Figure 11, Table 3).
However, the aqueous media ionization of the IBU carboxylic functional group at pH values higher than its pKa (4.5–4.9) contributed to the photodegradation removal rates of IBU seen at these initial pH conditions of 7 and 9. The enabling interactions between the active photocatalyst surface and the solvated substrates in aqueous media also promoted this outcome [12,80,81,82]. Comparatively, between the initial pH 7 and 9, the degradation rate was higher under pH 7 as the shift to the final pH condition (Table 4) showed a pH point of an acidic proton (H⁺) photocatalytic degradation process, enabling an environment that was not the case with the initial pH 9 that rather maintained a final neutral pH ~7 (Table 4) [12,13,82]. Relatively, the outcome of the initial pH 11 in connection with its final pH 8.64 (Table 4), is that the already higher advanced initial pH condition that favored the degradation removal rate seen from the onset at this pH point, maintained a lesser fluctuated final pH value that still upheld and promoted IBU aqueous media ionization: A strong contributory factor for IBU degradation [12,80,81,82].
Generally, the connectivity of the obtained pHpzc 4 of the Mo/HRTiO2 photocatalyst and IBU pKa 4.5–4.9 with respect to the evaluated initial pH conditions did not single-handedly explain the IBU photocatalytic degradation outcome. However, in a more concerted way, other aqueous media pH-dependent phenomenal effects, such as acidic proton (H⁺) generation, aqueous media ionization, suspension dispersion interactions, catalyst surface charge electron donor interactions, etc., in response to the tested initial pH conditions were in consonance with the measured final pH test outcome and supported the understanding of the evaluated pH effect outcome, with respect to the pHpzc of the photocatalyst and pKa value of IBU (Figure 11 and Figure 12, Table 3 and Table 4).
The outcome in photocatalytic activity performance of Mo/HRTiO2 over IBU degradation was impressive at both low-end initial pH values of 3 and 4 (Figure 12). However, to keep conditions as natural (unmodified) as possible, pH ~ 4 condition was finally adopted as the initial natural (unmodified) pH condition and employed for the remainder of the photocatalytic test evaluation measurements, while measuring the final pH value after every performed test.

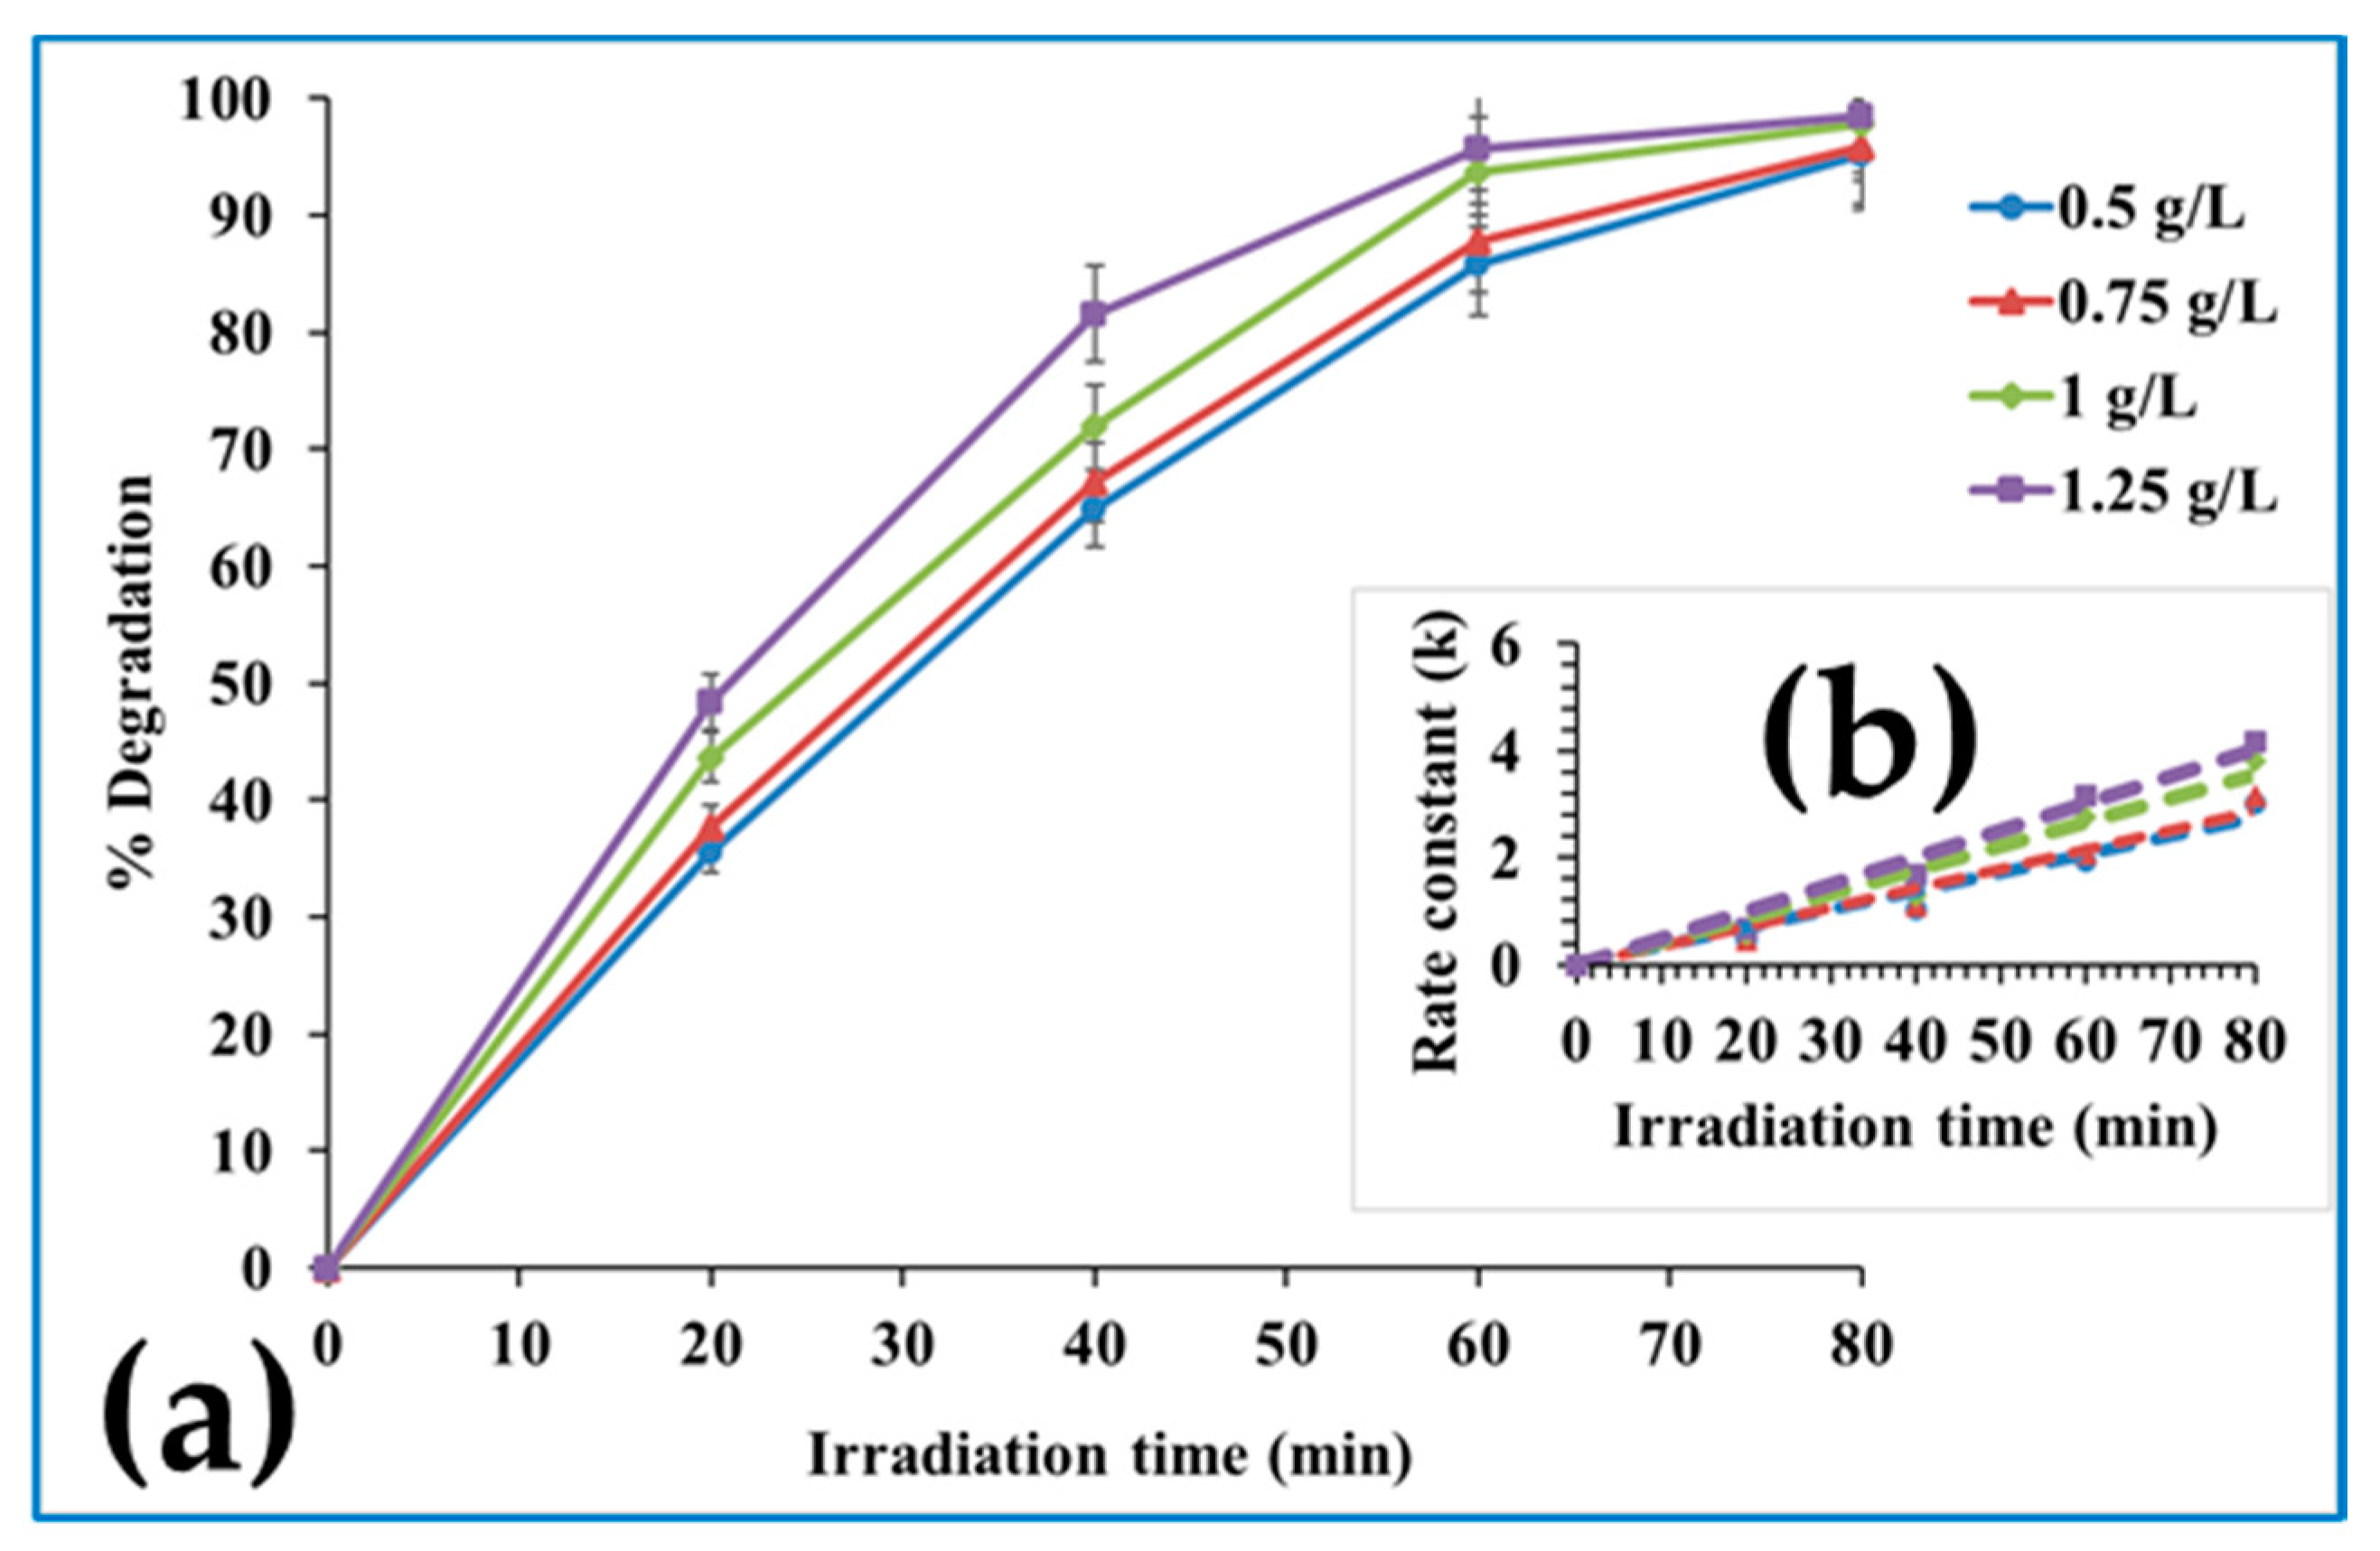
2.2.3. Effect of Catalyst Dosage

The effect of catalyst dosage was evaluated over the photocatalytic degradation of IBU. In addition to the already tested 1 g/L catalyst dosage, other dosages of 0.5, 0.75, and 1.25 g/L were tested for IBU photocatalytic degradation. As can be seen from Figure 13, an increment in catalyst dosage resulted in improved photocatalytic degradation removal of IBU. This outcome has been reported and attributed to the participation of more photocatalyst surface active sites at certain catalyst dosage concentrations, favoring and facilitating the photocatalytic degradation of organic compounds [10,14]. The first 40 min of irradiation showed the removal of ~80% IBU at 1.25 g/L catalyst dosage with a faster degradation rate kinetics in comparison with the other tested dosages (Figure 13). However, within a short time, photocatalytic degradation rate kinetics of the other tested catalyst dosages appreciated as more photocatalyst surface active sites are fully activated and participate in the photocatalytic degradation process of IBU. After 80 min of irradiation, the tested photocatalyst dosages degraded an average of 97% IBU and showed no significant difference in their individual activity performances at this point (Figure 13).
All of the tested photocatalyst dosages showed an impressive IBU degradation rate of removal at 80 min irradiation. However, for the catalyst dosage to remain balanced, the next test evaluating the effect of initial pollutant concentration on photocatalyst activity performance was performed at 1 g/L dosage.

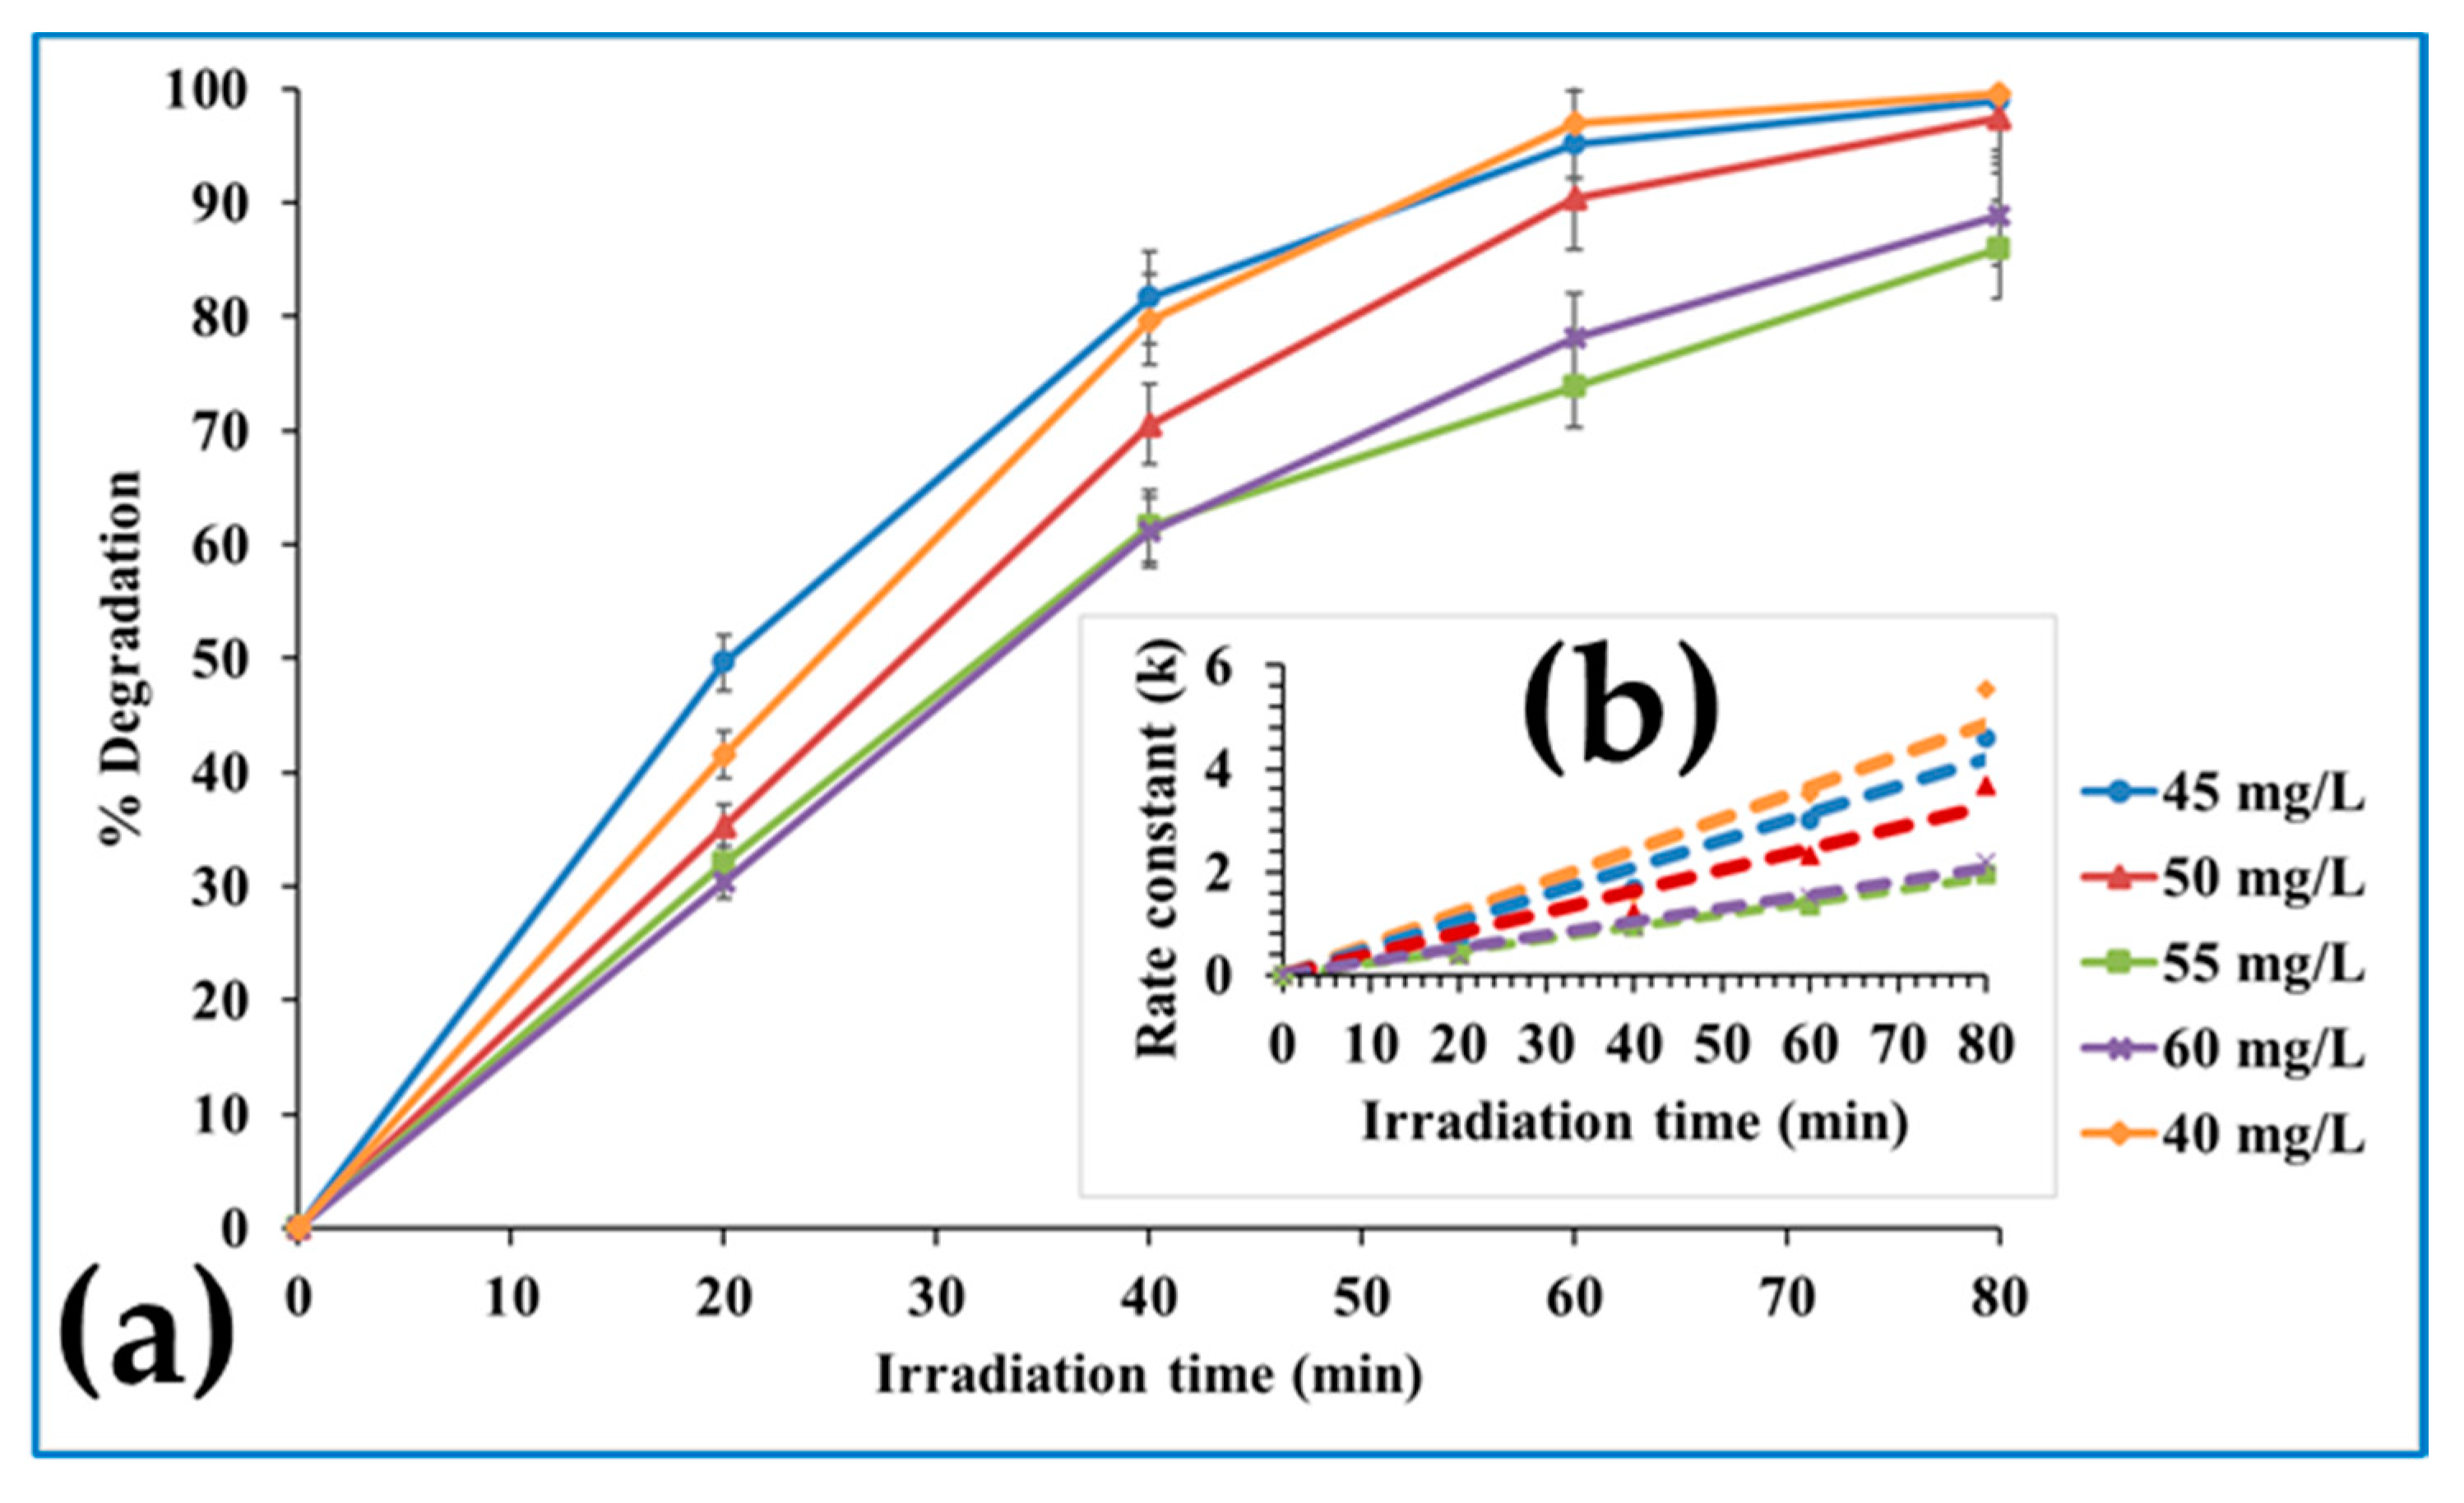
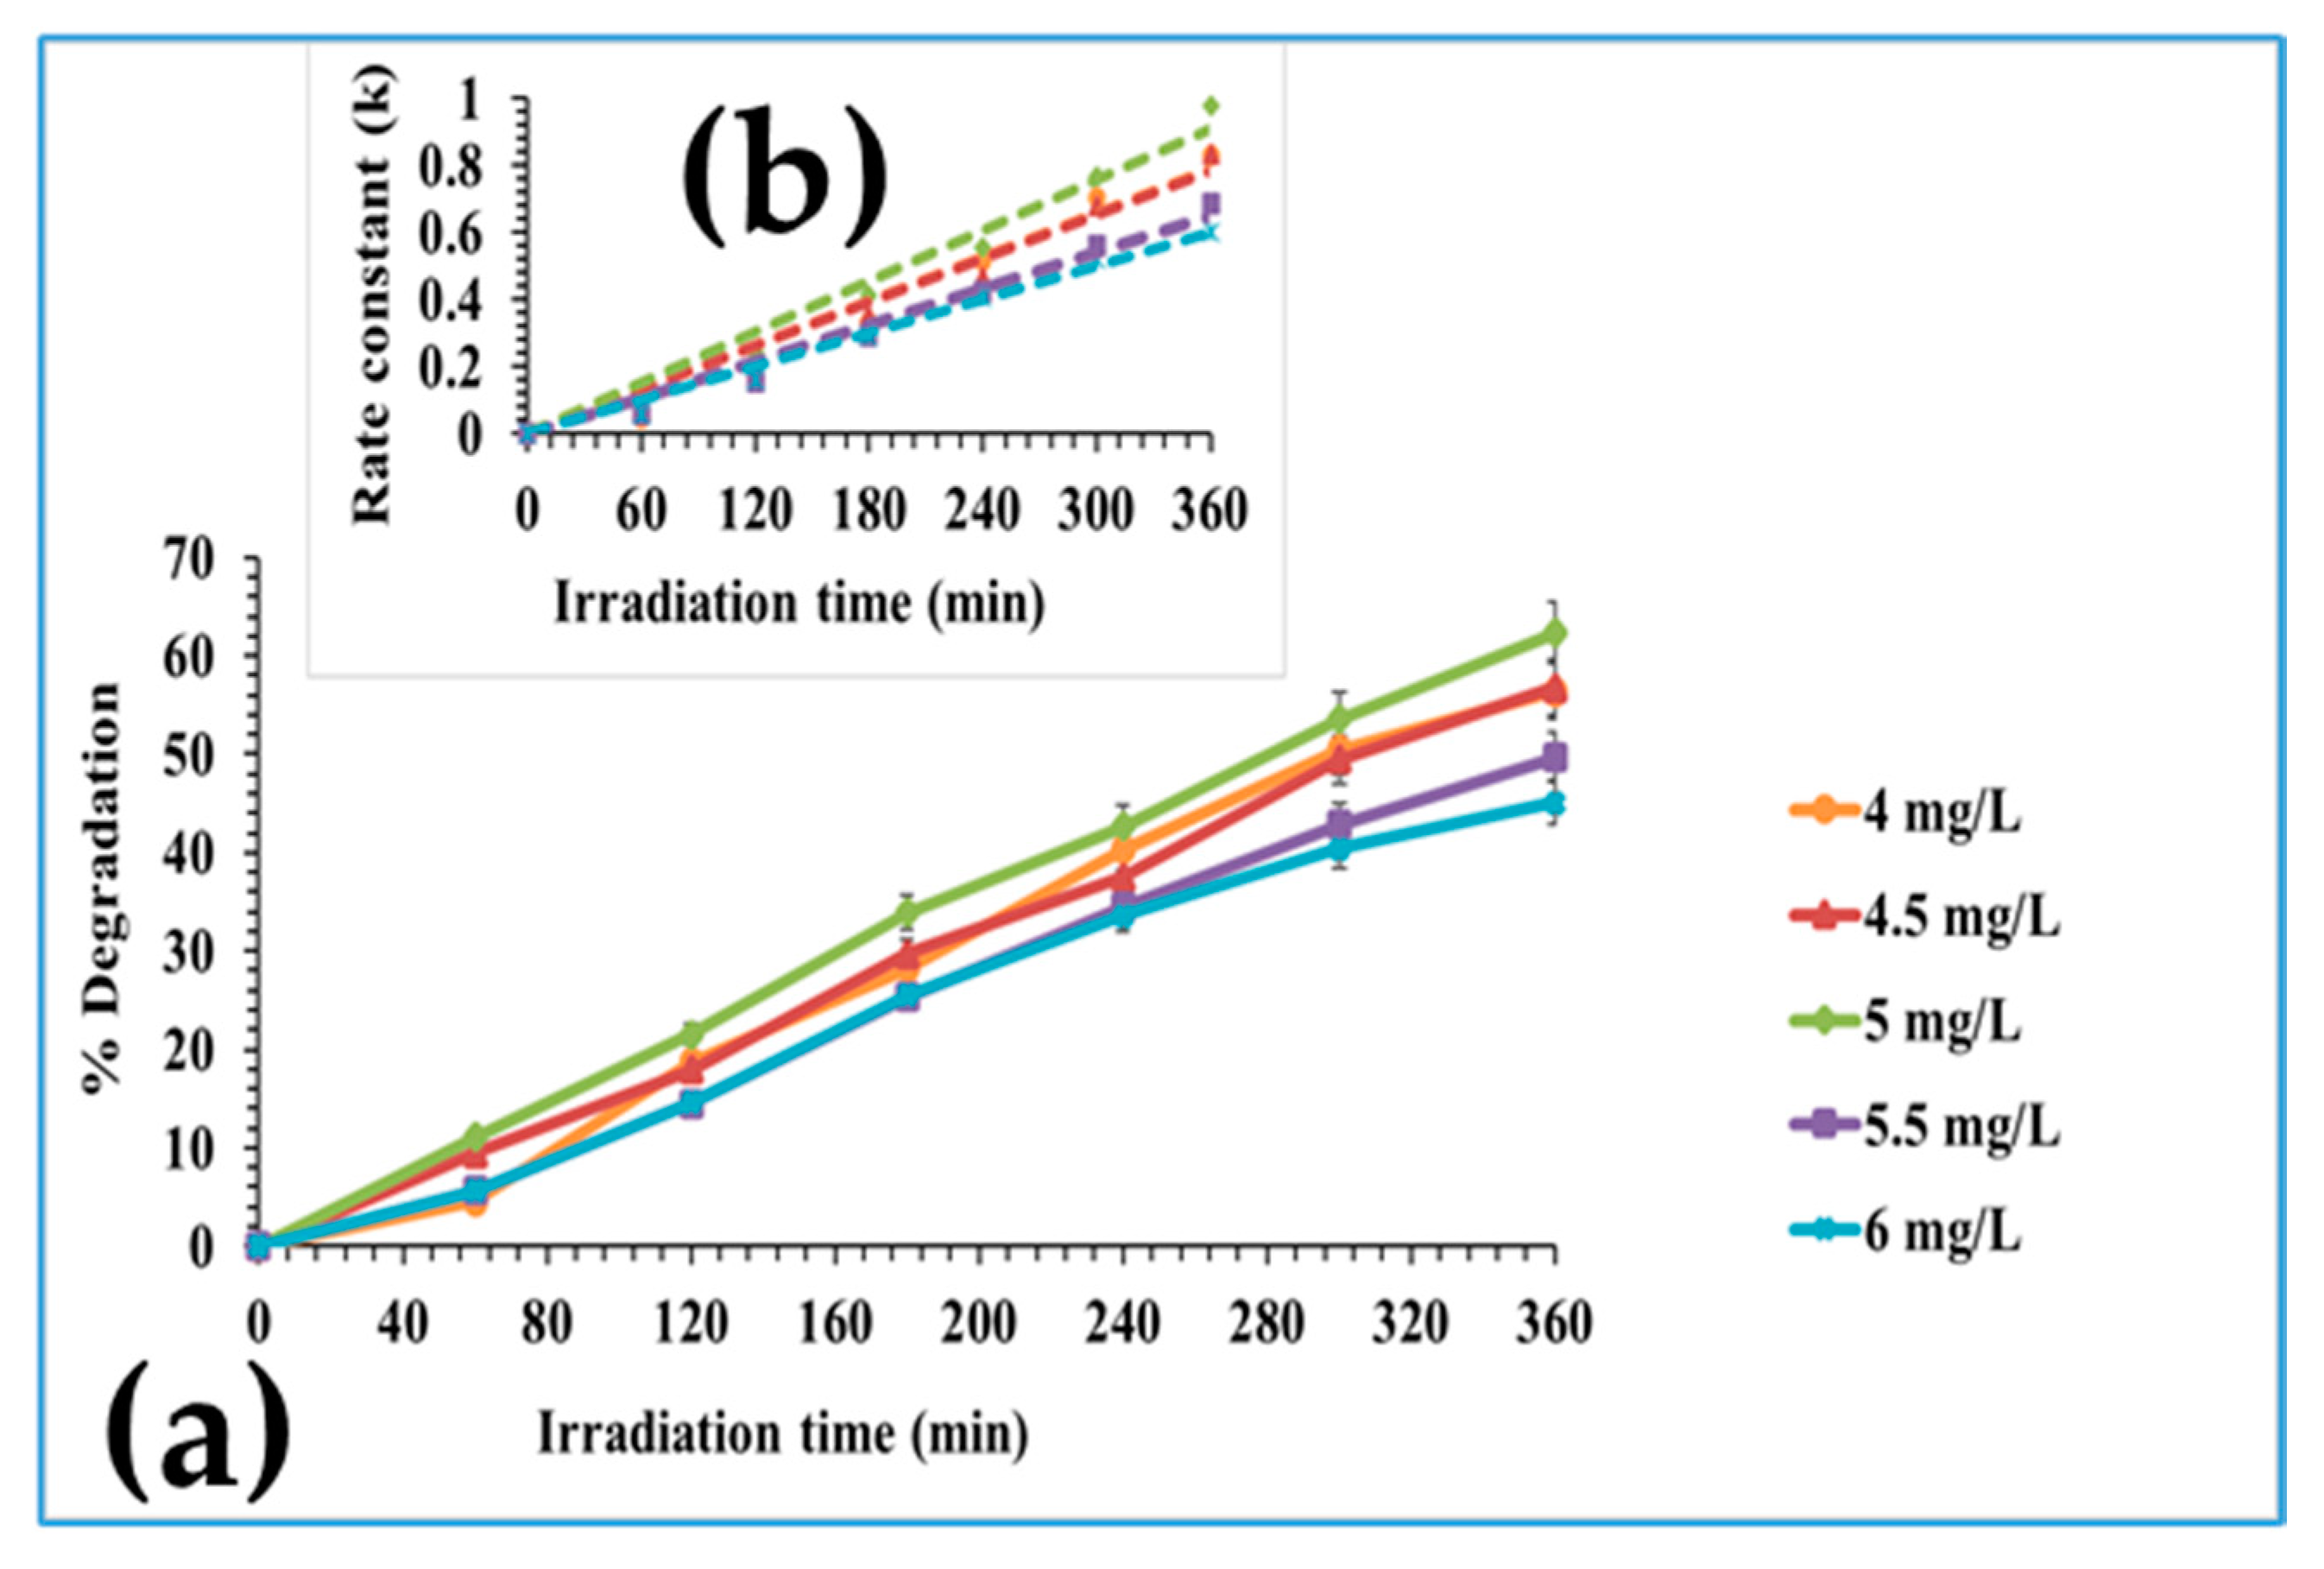
2.2.4. Effect of Initial Pollutant Concentration

In addition to the already tested 50 mg/L initial IBU concentration, initial concentrations of 40, 45, 55, and 60 mg/L were also tested for their effect on the photocatalyst activity performance over IBU degradation. As can be seen from Figure 14, in response to an increase in initial IBU concentration, the photocatalyst activity performance decreased in accordance. This effect has been reported and attributed to the overwhelming saturation of the available photocatalyst surface active sites at high initial pollutant concentrations [10,14]. Upon irradiation, a more facilitated photocatalytic degradation rate occurred at the lower initial IBU concentrations of 40 and 45 mg/L (Figure 14). At 80 min of irradiation, the photocatalyst achieved a ~99% degradation of 40, 45, and 50 mg/L initial IBU concentrations (Figure 14). Advanced initial IBU concentrations of 55 and 60 mg/L showed a retarded photocatalytic degradation rate at 80 min of irradiation [10,14]. The anomaly in the outcome, where the photocatalyst material showed more activity against 60 mg/L initial IBU concentration rather than in the presence of 50 mg/L initial IBU concentration, is attributed to the surface adsorption mechanism inhibition effect at certain initial pollutant and catalyst dosage concentrations [14].
Tests performed in the dark (not the usual adsorption-desorption equilibrium state prior to irradiation) in the presence of the Mo/HRTiO2 photocatalyst powder as well as the photolysis test of IBU in the absence of Mo/HRTiO2 showed negligible adsorption and photodegradation of IBU under the related test conditions of 50 mg/L initial IBU concentration, 1 g/L catalyst dosage, natural (unmodified) pH ~ 4, and 80 min of 365 nm UV irradiation (Figure 15). Likewise, the heat effect with catalyst and heat effect without catalyst, where the photocell reactors were adequately wrapped with thin aluminum foils to ward off light penetration interferences, did not result in any significant IBU degradation (Figure 15).

2.2.5. Test over Supported Mo/HRTiO2 Photocatalyst

The ~5 mg Mo/HRTiO2 supported photocatalyst was tested for its activity performance over IBU degradation under UV irradiation. The photocatalyst amount tested on support is about 12 times less than the 0.06 g in a 60 mL working volume, which is used to realize the 1 g/L dosage concentration employed for the suspension test evaluation. As part of the protocol during the support photocatalytic test evaluation, the same 60 mL working volume was adopted to ensure that the disk-shaped photocatalyst support was fully submerged to make proper contact with the IBU pollutant in the photoreactor cell. Compensation of the limited mass transfer effect, which is usually witnessed in physical/chemical processes with confined reactants, was to an extent offset during the irradiation test by extending the exposure time window to several minutes of sampling (Figure 16 and Figure 17) [83]. In a preliminary test, the supported photocatalyst was tested over initial IBU concentrations of 4, 4.5, 5, 5.5, and 6 mg/L. These initial IBU concentrations are 10 times less than the initial IBU concentrations tested in suspension with 1 g/L of Mo/HRTiO2 photocatalyst, in order not to saturate the supported photocatalyst and facilitate mass transfer [83].
As can be seen from Figure 16, the photocatalyst degraded ~62%, 57%, 57%, 49%, and 45% of respective initial IBU concentrations of 5, 4, 4.5, 5.5, and 6 mg/L after 360 min of 365 nm UV irradiation under initial natural (unmodified) pH ~ 4. The mixed outcome, where the photocatalyst achieved a higher degradation % efficiency over 50 mg/L initial IBU concentration, is attributed to the favored surface adsorption mechanism at this IBU initial concentration [14]. Apart from this outcome, the photocatalytic degradation efficiency decreased with an increase in initial IBU concentration as the photocatalyst surface active sites tend to be more saturated at higher initial pollutant concentration, thereby inhibiting degradation efficiency [10,14].
As better photocatalyst activity performance was seen over 50 mg/L initial IBU concentration degradation (Figure 16), further tests were performed at this initial IBU concentration.

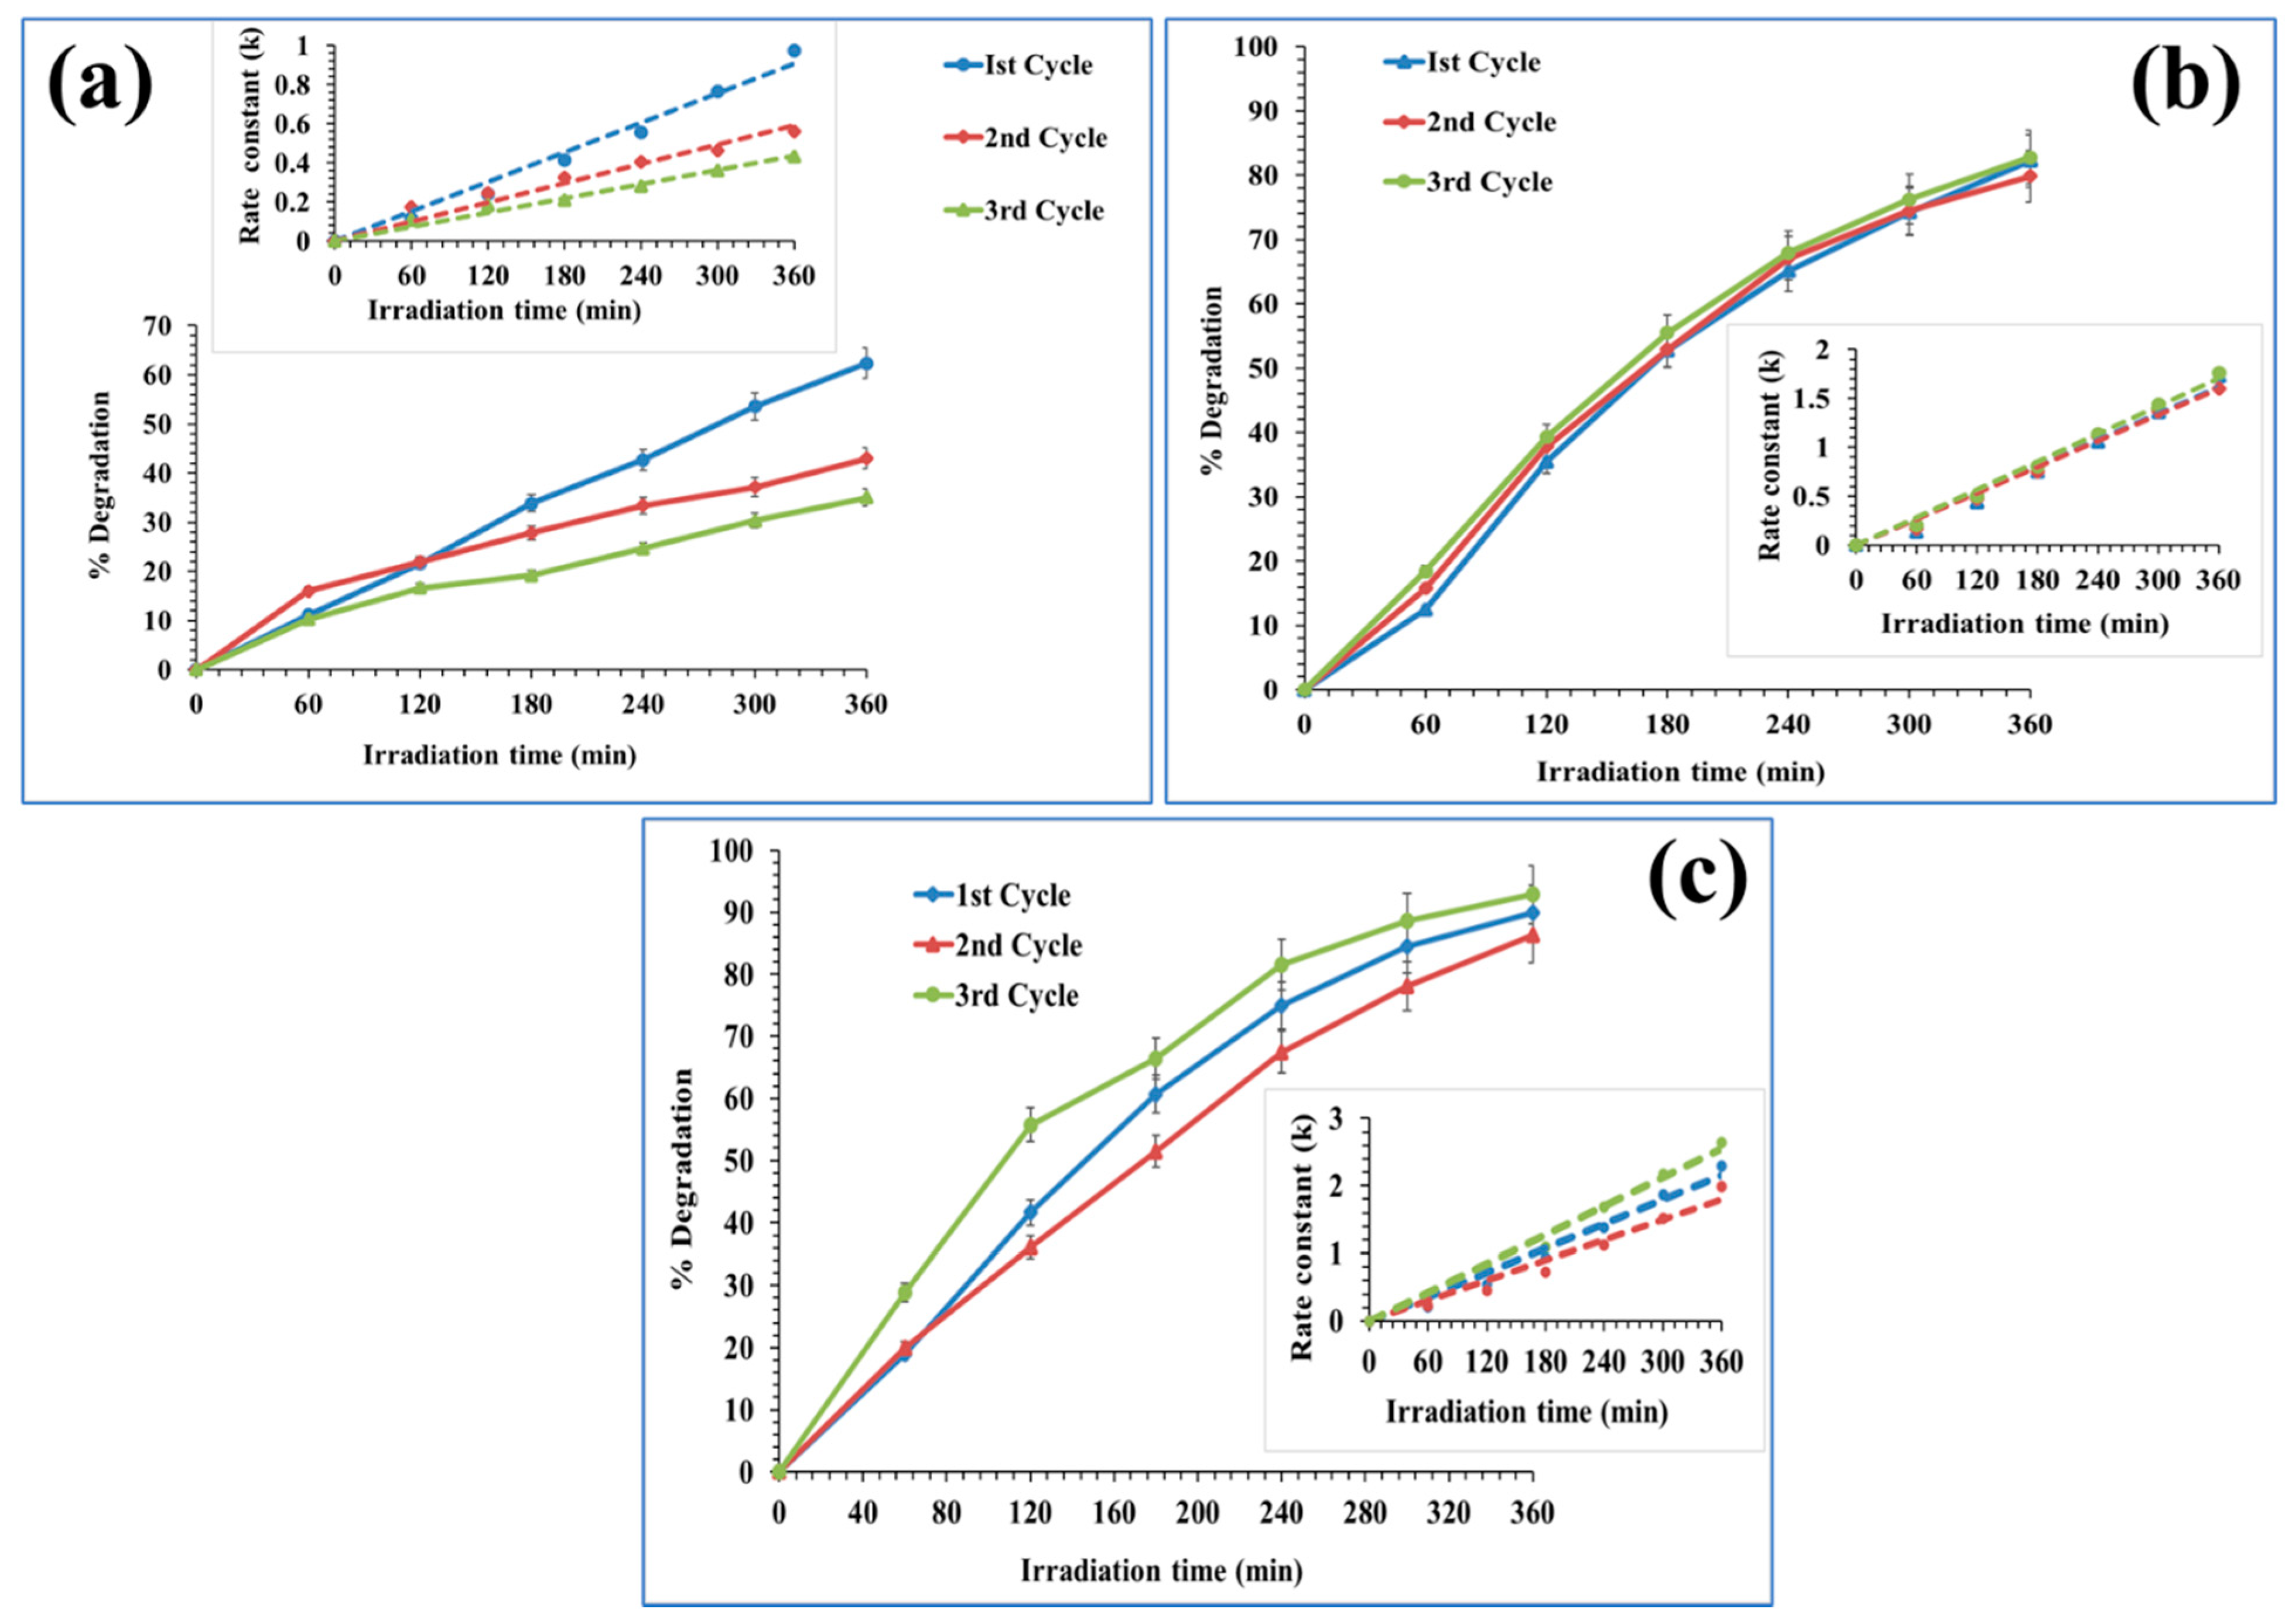
2.2.6. Reusability/Photostability Test of the Supported Mo/HRTiO2 Photocatalyst

In a three-cycle successive test run, the photocatalyst was tested for its reusability as well as the evaluation of its photostability. In terms of the number of immobilized photocatalyst disks, single (one disk tablet), double (two disk tablets), and triple (three disk tablets) coated photocatalysts were used to evaluate the reusability/photostability. As can be seen from Figure 17a, after the first test run involving a single disk tablet, the photocatalyst achieved over 60% degradation of 50 mg/L initial IBU concentration after 360 min UV irradiation. The second and third test runs achieved a reduction of IBU photocatalytic degradation with respective degradation of about 40% and 35% recorded by the photocatalyst after 360 min UV irradiation. Comparing the photocatalytic degradation outcome amongst the single photocatalyst disk test runs, the photocatalyst activity performance depreciated as the number of subsequent test runs increased (Figure 17a). This outcome can be attributed to some spallation issues of the active photocatalyst top layer, which is even reflected in a more noticeable decrease in photoactivity due to the minute deposited catalyst amount on support [12]. Double and triple disk tablets enhanced the photocatalytic degradation of IBU (Figure 17a,b). The double disk photocatalyst tablet achieved approximately 83%, 80%, and 83% IBU degradation for the respective 1st, 2nd, and 3rd successive cycle test runs (Figure 17b). In the presence of a triple disk tablet, the photocatalyst removed approximately 90%, 86%, and 93% IBU degradation for the respective 1st, 2nd, and 3rd successive cycle test runs (Figure 17c). From the obtained results, increasing the number of coated disk tablets improved and sustained the photocatalytic degradation activity over IBU by the photocatalyst in a three-successive cycle test run and within the irradiation time window. The addition of extra coated photocatalyst disks (double/triple tablets) reinforced and enhanced IBU photocatalytic degradation in a synergistic way with an overall confirmation of the photostability of the material, while still maintaining an impressive activity performance upon their reuse after three-cycle test runs.
The XRD measurement of tested photocatalyst supported material was performed and compared with the material state status before the test measurement to evaluate the structural alteration of the supported photocatalyst material. As can be seen from Figure 18, the XRD image shows no alterations of the pristine TiO2 crystallographic phases in all of the tested samples and related ones. Identified phases in the HRTiO2 base of the modified Mo/HRTiO2 photocatalyst material matched the pristine TiO2 crystalline phase peaks. Phase reflections from the uncoated α-Al2O3 substrate in the ceramic support were also identified and in line with the expressed crystallographic planes of the unmodified HRTiO2 and modified Mo/HRTiO2 (Figure 18). Considering that within the one disk tablet set runs and between the three disk tablet set runs and the two disk tablet set runs the activity performance of the photocatalyst was not significantly different, these supported photocatalyst materials were selected for XRD measurement after exposure. The XRD control of these representative 1st and 3rd cycle test runs from the respective one disk tablet and three disk tablet tests of the Mo/HRTiO2 photocatalyst material, showed no alteration in their identified crystalline peak phases. This implies that despite the usage of the supported photocatalyst material in a three-cycle successive test run, the pristine crystalline structural property was maintained.
The dark test with the supported photocatalyst on ceramic as well as the test involving bare (uncoated) ceramic support under irradiation were performed over the initial 5 mg/L IBU concentration. As can be seen from Figure 19, the dark effect in the presence of photocatalyst as well the photolysis effect performed with the uncoated support did not result in a significant photocatalytic/degradation outcome in the removal of IBU. Likewise, about 12% initial 5mg/L IBU was removed by adsorption and adsorption/photolysis, respectively in the dark and by irradiation in the presence of uncoated ceramic support after 360 min exposure test window (Figure 19). This confirms that the percentage of IBU removal in the dark and by irradiation tests with/without the photocatalyst supported on ceramic, respectively exhibited the same not significant effect on IBU photocatalytic degradation. Therefore, the Mo/HRTiO2 material on ceramic support was the most active ingredient in the support material to have driven the photocatalytic degradation of IBU under UV irradiation. Photolysis of IBU alone under UV irradiation did not have any effect on the outcome of the photocatalytic degradation and has already been performed in the suspension test (Figure 15).
Table 4 depicts parametric indicators for performed tests evaluating the photocatalytic degradation of IBU by Mo/HRTiO2 in suspension and on ceramic support based on degradation rate constant (k), correlation constant (R²), half-life (t1/2), as well initial and final pH condition.

3. Materials and Methods

3.1. Chemical Reagents and Material

All the chemicals used in the present study were of analytical grade and deployed as purchased without further purification. The analytical grade chemicals from different suppliers included titania (HRTiO2: Huntsman tioxide, Scarlino, Italy) as the coating powder, ammonium molybdate tetrahydrate [(NH4)6Mo7O24·4H2O] (99.98%) (Sigma-Aldrich, Baden-Württemberg, Germany) was employed as the precursor for Mo, ibuprofen sodium salt (α-methyl-4-(isobutyl) phenyl acetic acid) [C13H17O2Na] (≥98%) (Sigma-Aldrich, Baden-Württemberg, Germany) as the model CEC for photocatalytic degradation test, Sodium hydroxide [NaOH] (≥98%), hydrochloric acid [HCl] (37% wt/v) (Sigma-Aldrich, Darmstadt, Germany) were employed for aqueous media pH control.
The α-Al2O3 ceramic material as developed and fabricated by Materials Industrial Research and Technology Centre (MIRTEC, Chalkida, Greece) has been used as the supporting material for the photocatalyst without any further treatment. The only treatment performed was on the deposited active layer, which involved some drying, heating, and calcination of the topcoat layer as conditioning treatments. A summarized result outcome of the technical specifications of the α-Al2O3 ceramic material as obtained from MIRTEC has already been provided in Section 2.1.2 (Table 2) of the results and discussion. The development process involved fabrication via the extrusion method with INSTON L 1477 -1003 extrusion device from the coarse particle size substrate. The α-alumina coarse particle size determination was carried out through granulometric analysis of large particle (coarse) with D90 value of 14.1 µm, while with the same granulometric approach, the particle size distribution (PSD) of worked powder topcoat suspensions was obtained with the laser diffraction particle size analyzer MASTER Sizer 3000G (Malvern Instruments, United Kingdom). The porosity and density properties of the alumina substrate were determined using the Archimedes method, while the mechanical strength evaluation through a change in flexion resistance of the 4-point bending test of the coarse α-alumina (α-Al2O3) as a function of the sintering temperature was measured with the INSTON L 1477-1003 at a final sintering temperature of 1500 °C.

3.2. Synthesis of Mo/HRTiO2 Material

The modification of HRTiO2 with Mo was achieved by means of a sonochemical preparation route. Specifically, ammonium molybdate tetrahydrate [(NH4)6Mo7O24·4H2O] was used as the precursor of Mo.
The precursor material was diluted in an aqueous solution of 200 mg of the pristine titania powder (HRTiO2), calculating 1.5 wt% for the Mo-doped HRTiO2 in the final solution prior to sonication. Sonication was performed by an UIP 500HD transducer (Hielscher) as the ultrasound generator in a double-walled glass container cooled externally under 25 °C during the whole process.
The sonication process involved a continuous U/S generation of 100 W/cm² lasting 3 h. After the sonochemical experiment, the solution was centrifuged and the substrate was collected and left overnight at 80 °C to dry. A thermal treatment under ambient temperature up to 150 °C for 2 h with further calcination thermal treatment at 600 °C for 2 h was performed over the powder material. The obtained 1.5 wt% Mo/HRTiO2 was finally employed for photocatalytic activity evaluation measurements.

3.3. Supported Photocatalyst Material Preparation

From the worked and optimized 1 wt% (Mo/HRTiO2) powder suspension as already highlighted in Section 2.1.3 of the results and discussion, ~5 mg of Mo/HRTiO2 active top layer was deposited on ceramic support by the dip-coating technique (manually executed). Coated samples were left to dry and heal naturally over 24 h under ambient conditions. Then, they were subjected to 1 h of heating at 60 °C in an electric oven and a further 2 h calcination at 600 °C with a ramp rate of 1 °C/min in an electric furnace. Finally, the prepared coated samples remained under dry ambient conditions and were employed for photocatalytic test evaluation measurement.

3.4. Material Characterization Instruments

Adopted techniques for the characterization of obtained photocatalyst material were the simultaneous thermal analysis (STA) technique, involving thermal gravimetric analysis-differential scanning calorimetry (TGA-DSC, Setram STA unit) to elucidate the extent of mass change of samples in connection with their enthalpy of heat change under ambient measurement conditions. Samples for the TGA-DSC analysis were placed in Al2O3 crucibles, treated under oil-free air with 20 mL/min flow. The selected heating temperature rate was fixed at 10 K/min with the final temperature set at 800 °C. Result elaboration has been performed by Calisto Processing Computer Software, while the enthalpy of the various phenomena was calculated integrating the appropriate relative peaks. X-ray diffraction (XRD) measurement for the crystallographic phase analysis of the materials was carried out using a Rigaku D/Max-IIIC diffractometer (RIGAKU, Corp., Tokyo, Japan) with operational functions of CuKα radiation (λ = 0.1541 nm) over the range 2θ = 20–70° at ambient temperature and 35 kV at 25 mA at the rate of 3°/min scan speed [10,11,12,13,14]. Transmission electron microscopy (TEM) measurement was performed with FEITecnaiG2 Spirit (FEI, Hillsboro, OR, USA) for the particle size analysis of material samples, while Fourier transform infrared (FTIR) spectroscopy measurement was carried out with a Perkin-Elmer Spectrum one FTIR spectrometer (Thermo-Fischer Scientific, Leicestershire, UK) employing the attenuated total reflection (ATR) method to understand the chemical functional groups present in the synthesized photocatalyst materials. X-ray photoelectron spectroscopy (XPS) measurement was performed with a PHI 5000 VersaProbe spectrometer (ULVAC PHI, Inc., Kanagawa, Japan) with an AlKα radiation source for the elucidation of the elemental compositions within the chemical environment of the synthesized materials [10,11,12,13,14]. Scanning electron microscopy (SEM) measurement for the surface morphological analysis was conducted with Zeiss EVO LS10 (Carl Zeiss Microscopy, Hamburg, Germany), of 0.2–30 kV acceleration voltage and 0.5 pA-5 µA probe current, attached with energy dispersive X-ray spectroscopy (EDS) detector (Carl Zeiss SmartEDX, Hamburg, Germany), with samples attached to the sample holder and prepared with Au using sputter-coating (SEM coating system machine). The surface area of materials and other related parameters of pore size distribution was measured by the Brunauer-Emmett-Teller (BET) technique recorded on the nitrogen adsorption-desorption isotherm at 76 K employing a Micromeritics 3 Flex version 5.00 (Micromeritics, Norcross, GA, USA) after [10,11,12,13,14]. The optical properties of the synthesized materials were measured with UV-Vis diffuse reflectance spectroscopy (UV-Vis/DRS) in absolute measurement employing BaSO₄ as the reference plate on a Shimadzu UV-2550 (Scintek Instruments LLC., Manassas, VA, USA) [13,14].

3.5. Determination of pH Point of Zero Charge (pHpzc) of Mo/HRTiO2 Photocatalyst Material

To determine the pH point of zero charge (pHpzc) of the catalyst materials, the reported drift method was employed [10,14]. In brief and accordingly, 50 mL of 0.01 M NaCl solution was measured in conical flasks. The initial pH values of these solutions were adjusted and maintained at room temperature between 2 and 12 using 1 M each of HCl or NaOH. Once the stability of the initial pH values was achieved, 0.05 g of the catalyst powder was added to each of the measured flask solutions, stirred for 48 h, and the final pH value of each flask solution containing the investigated catalyst was measured by HANNA, edge pH meter (Woonsocket, RI, USA).

3.6. Photocatalytic Test Measurement

Photocatalytic activity measurement of the sample material was performed under 365 nm irradiation wavelength cut-off. An inhouse fabricated 200° internal reflector for optimal efficiency (99.9%), UV-A and visible blue wavelength range of 300–475 nm spectral power distribution with five Philips Mercury (Hg) lamps-TL-K 40W/10R ACTINIC BL REFLECTOR, (Hamburg, Germany) was employed as an irradiation light source for the photocatalytic tests of the materials [10,11,12,13,14]. The irradiation light source intensity was measured with Lafayette SPM-7, (Milano, Italy) at 1.2 mW/cm² for the UV-A 365 nm cut-off filter irradiation light source.
For both the suspension and supported photocatalyst tests, 60 mL working powder suspension volume content of 1 g/L catalyst and 50 mg/L initial ibuprofen and 60 mL working volume content of 50 mg/L initial ibuprofen and ~5 mg Mo/HRTiO2 coated on ceramic support disk, respectively and under 365 nm irradiation and at initial natural (unmodified) pH conditions were employed.
In a procedure of the photocatalytic tests evaluation, the working suspension media in each test set (suspension and catalyst on support), containing the relevant catalyst dosage and initial pollutant concentration of the tested IBU were first of all introduced into a 100 mL volume capacity cylindrically shaped quartz glass sleeve reactor cells for the suspension test and a 100 mL volume capacity bowl dish glass reactor, that remained under mechanical agitation for 30 min to establish the adsorption-desorption equilibrium state of the media prior to irradiation. Thereafter, the aqueous media content is maintained under continuous mechanical agitation during light irradiation with a 30-cm distance between the sample and light source maintained throughout with sample aliquots withdrawn at a determined time interval of irradiation. At pre-set time intervals, about 1 mL sample aliquot of the tested IBU under their various reaction test conditions in suspension or catalyst on support mode, is drawn from the reactor cells, cooled, and filtered through 0.45 µm CA filter for the high performance liquid chromatography (HPLC) analysis monitoring of the photocatalytic process degradation of IBU.
With an ~12 min retention time of a 15-min runtime, IBU photocatalytic degradation was monitored on a Kinetex 5 µm EVO C 18, column 150 × 4.6 mm (Phenomenex, CA, USA), 70% acetonitrile (A)/30% acetic acid (B) mobile phase composition, 0.4 mL/min flow rate, and 223 nm wavelength quantification.
The IBU photocatalytic degradation process is assumed to have followed a pseudo first-order reaction kinetics with an IBU degradation reaction rate estimate performed as a linear regression slope, according to Equation (3):
ln C C 0 = K a p p t
where K a p p ,   C 0 , and C are apparent degradation rate constant, initial concentration, and concentration after time t, respectively.

4. Conclusions

The Mo/HRTiO2 produced by means of a sonochemical method was characterized by its thermal, structural, textural/morphological, elemental composition, and optical properties. The characterization data measurement and estimation results were of a mixed outcome. The BET surface area of 9.78 m²/g for the HRTiO2 material to 8.4 m²/g for the Mo/HRTiO2 material was registered. Total pore volume (Vp) and energy bandgap (Eg) estimates were respectively the same for both HRTiO2 and Mo/HRTiO2 materials at 0.02 cm³/g and 3.23 eV. While the average crystallite size was 16.47 nm for HRTiO2 and 29.99 nm for Mo/HRTiO2, the particle sizes of 27.52 and 58.66 nm were respectively estimated for HRTiO2 and Mo/HRTiO2 materials. An average pore size (Dp) of 7.06 nm was estimated for HRTiO2, while 9.11 nm was derived for the Mo/HRTiO2 material. Deductively and by virtue of the characterization data outcome, the photocatalytic activity performance evaluation was envisaged as reliant on surface structural modification of the Mo/HRTiO2 material rather than surface area increment or energy bandgap reduction, which was performed over ibuprofen (IBU) degradation as a model contaminant of emerging concern (CEC). The photocatalytic activity performance evaluation took place in two different modes: In suspension and on support.
For the in-suspension mode test evaluation, 1 g/L Mo/HRTiO2 photocatalyst showed an enhanced activity performance degrading over 98% initial 50 mg/L IBU concentration in comparison with 89% achieved by the unmodified HRTiO2 in 80 min of 365 nm UV irradiation and under natural (unmodified) pH condition. Effects of pH, catalyst dosage, and initial pollutant concentration on the photocatalytic degradation performance of the photocatalyst material over IBU were all investigated and discussed accordingly.
By the manual dip-coating technique, ~5 mg Mo/HRTiO2 was realized and supported on α-Al2O3-based ceramic material, developed, fabricated, and characterized by MIRTEC. SEM-EDS and cross-sectional SEM measurements confirmed the elemental/material composition and active coat layer thickness of 2.5 µm, respectively, as expected.
The photocatalyst on-support mode test evaluation achieved about 60% degradation of initial 5 mg/L IBU concentration in the 1st cycle of a three successive cycle test run in the presence of one coated disk tablet. Photocatalyst activity performance was enhanced and sustained with appreciated 83%, 80%, and 83% IBU degradation, respectively for 1st, 2nd, and 3rd cycles in a three successive test run and in the presence of two coated disk tablets. Higher photocatalytic activity performance was significantly clear in the presence of three coated disk tablets, where the photocatalyst degraded 90%, 86%, and 93% of 5 mg/L initial IBU concentration for respective 1st, 2nd, and 3rd cycle tests in three successive test runs. As part of the reusability and photostability test confirmation, XRD measurement showed non-pristine alteration in the crystallographic phase reflections of the tested photocatalyst material in comparison with the non-tested reference sample material.
The impressive performance of the Mo-doped HRTiO2 demonstrated in this study and in comparison, with the already reported studies involving the same atom as a modifier for TiO2-based photocatalyst, confirms a highly potential efficient photocatalyst material for the abatement of CECs from aqueous systems.
In the future, the promising performance of Mo/HRTiO2 especially on support will be extended for a full study in the visible or near infrared (NIR) region for the photocatalytic abatement of other classified CEC compounds. As a surface-decorated photocatalyst, it will be exciting to investigate the involved charge transfer mechanism in this material and explore perhaps its potential application in energy harvesting systems. Although the Mo/HRTiO2 material showed excellent photoactivity towards IBU degradation, further studies are required in the identification and ecotoxicity evaluation of the resultant IBU degraded products. As in many cases, the transformation products (TPs) are more toxic and of concern than the parent compound to the environment.

Author Contributions

Conceptualization, C.B.A., V.N.S., E.B. and P.K.P.; methodology, C.B.A., V.N.S., I.A., E.B., P.K.P., C.A., Z.T. and C.-D.A.; software, C.B.A., E.B., P.K.P., Z.T. and C.-D.A.; validation, C.B.A., E.B., V.N.S., I.A. and P.K.P.; formal analysis, C.B.A., E.B., V.N.S., I.A. and P.K.P.; investigation, C.B.A.; resources, C.B.A., E.B., V.N.S., I.A., P.K.P., C.A., Z.T. and C.-D.A.; data curation, C.B.A., E.B., P.K.P., Z.T. and C.-D.A.; writing—original draft, C.B.A.; writing—review and editing, V.N.S., P.K.P., E.B. and I.A.; visualization, C.B.A., E.B., V.N.S., I.A., P.K.P., Z.T. and C.-D.A.; supervision, E.B., V.N.S. and I.A.; project administration, I.A. and E.B.; funding acquisition, E.B. and I.A. All authors have read and agreed to the published version of the manuscript.

Funding

This research was funded by the European Union’s Horizon Research and Innovation Programme under the Marie Sklowdowska-Curie, grant no.: 765860 (Aquality).

Data Availability Statement

The data presented in this study are available in [Preparation and Characterization of Supported Molybdenum Doped TiO2 on α-Al2O3 Ceramic Substrate for the Photocatalytic Degradation of Ibuprofen (IBU) Under UV Irradiation].

Conflicts of Interest

The authors declare no conflict of interest.

References

  1. Schwarzenbach, R.P.; Egli, T.; Hofstetter, T.B.; von Gunten, U.; Wehrli, B. Global Water Pollution and Human Health. Annu. Rev. Environ. Resour. 2010, 35, 109–136. [Google Scholar] [CrossRef]
  2. United Nations General Assembly (UNGA). The Human Right to Water and Sanitation; Resolution 64/292; United Nations: New York, NY, USA, 2010.
  3. Clean Water and Sanitation. Available online: https://www.un.org/sustainabledevelopment/water-and-sanitation/ (accessed on 2 February 2022).
  4. Geissen, V.; Mol, H.; Klumpp, E.; Umlauf, G.; Nadal, M.; van der Ploeg, M.; van de Zee, S.E.A.T.M.; Ritsema, C.J. Emerging Pollutants in the Environment: A Challenge for Water Resource Management. Int. Soil Water Conserv. Res. 2015, 3, 57–65. [Google Scholar] [CrossRef]
  5. Petrovic, M.; Barcelo, D. Application of Liquid Chromatography/Quadruple Time-of-Flight Mass Spectrometry (LC-QqTOF-MS) in the Environmental Analysis. J. Mass Spectrom. 2006, 41, 1259–1267. [Google Scholar] [CrossRef] [PubMed]
  6. Richardson, S.D.; Ternes, T.A. Water analysis: Emerging contaminants and current issues. Anal. Chem. 2011, 83, 4614–4648. [Google Scholar] [CrossRef]
  7. Pal, A.; Gin, K.Y.-H.; Lin, A.Y.-C.; Reinhard, M. Impacts of Emerging Organic Contaminants on Freshwater Resources: Review of Recent Occurrences, Sources, Fates, and Effects. Sci. Total Environ. 2010, 408, 6062–6069. [Google Scholar] [CrossRef]
  8. Lindsey, M.E.; Meyer, M.; Thurman, E.M. Analysis of Trace Levels of Sulfinamide and Tetracycline Antimicrobials in Groundwater and Surface Water Using Solid-Phase Extraction and Liquid Chromatography/Mass Spectroscopy. Anal. Chem. 2001, 73, 4640–4646. [Google Scholar] [CrossRef]
  9. Jimenez-Holgado, C.; Chrimatopoulos, C.; Stathopoulos, V.N.; Sakkas, V. Investigating the Utility of Fabric Phase Sorptive Extraction and HPLC-UV-Vis/DAD to Determine Antidepressant Drugs in Environmental Aqueous Samples. Separations 2020, 7, 39. [Google Scholar] [CrossRef]
  10. Anucha, C.B.; Altin, I.; Biyiklioglu, Z.; Bacaksiz, E.; Polat, I.; Stathopoulos, V.N. Synthesis, Characterization, and Photocatalytic Evaluation of Manganese (III) Phthalocyanine Sensitized ZnWO4 (ZnWO4MnPc) for Bisphenol A Degradation Under UV Irradiation. Nanomaterials 2020, 10, 2139. [Google Scholar] [CrossRef]
  11. Anucha, C.B.; Altin, I.; Fabbri, D.; Degirmencioglu, I.; Calza, P.; Magnacca, G.; Stathopoulos, V.N.; Bacaksiz, E. Synthesis, and Characterization of B/NaF and Silicon Phthalocyanine-Modified TiO2 and an Evaluation of Their Photocatalytic Removal of Carbamazepine. Separations 2020, 7, 71. [Google Scholar] [CrossRef]
  12. Anucha, C.B.; Altin, I.; Bacaksiz, E.; Degirmencioglu, I.; Kucukomeroglu, T.; Yilmaz, S.; Stathopoulos, V.N. Immobilized TiO2/ZnO Sensitized Copper (II) Phthalocyanine Heterostructure for the Degradation of Ibuprofen Under UV Irradiation. Separations 2021, 8, 24. [Google Scholar]
  13. Anucha, C.B.; Altin, I.; Bacaksiz, E.; Kucukomeroglu, T.; Belay, M.H.; Stathopoulos, V.N. Enhanced Photocatalytic Activity of CuWO4 Doped TiO2 Photocatalyst Towards Carbamazepine Under UV Irradiation. Separations 2021, 8, 25. [Google Scholar] [CrossRef]
  14. Anucha, C.B.; Altin, I.; Bacaksiz, E.; Stathopoulos, V.N.; Polat, I.; Yasar, A.; Yuksel, O.F. Silver Doped Zinc Stannate (Ag-ZnSnO3) for The Photocatalytic Degradation of Caffeine Under UV Irradiation. Water 2021, 13, 1290. [Google Scholar] [CrossRef]
  15. Emerging Substances. Available online: https://www.norman-network.net (accessed on 7 February 2022).
  16. Ternes, T.A. Occurrence of Drugs in German Sewage Treatment Plants and Rivers. Water Res. 1998, 32, 3245–3260. [Google Scholar] [CrossRef]
  17. Putschew, A.; Wischnack, S.; Jekel, M. Occurrence of Triiodinated X-Ray Contrast Agents in the Aquatic Environment. Sci. Total Environ. 2000, 255, 129–134. [Google Scholar] [CrossRef]
  18. Sacher, F.; Lange, F.T.; Brauch, H.J.; Blankenhorn, I. Pharmaceuticals in Groundwaters: Analytical Methods and Results of a Monitoring Program in Baden-Wurttemberg, Germany. J. Chromatogr. A 2001, 938, 199–210. [Google Scholar] [CrossRef]
  19. Anderson, P.D.; D’ Aco, V.J.; Shanahan, P.; Chapra, S.C.; Buzby, M.E.; Cunningham, V.L.; Duplessie, B.M.; Hayes, E.P.; Mastracco, F.J.; Parke, N.J.; et al. Screening Analysis of Human Pharmaceutical Compounds in US Surface Waters. Environ. Sci. Technol. 2004, 38, 838–859. [Google Scholar] [CrossRef]
  20. Heberer, T. Tracking Persistent Pharmaceutical Residues from Municipal Sewage to Drinking Water. J. Hydrol. 2002, 266, 175–189. [Google Scholar] [CrossRef]
  21. Heberer, T.; Dunnbier, U.; Relich, C.; Stan, H.J. Detection of Drugs and Drug Metabolites in Groundwater Samples of Drinking Water Treatment Plant. Fresenius Environ. Bull. 1997, 6, 438–859. [Google Scholar]
  22. Carballa, M.; Omil, F.; Lema, J.; Llompart, M.; Garcia-Jares, C.; Rodriquez, I.; Gomez, M.; Ternes, T. Behaviour of Pharmaceuticals, Cosmetics and Hormones in a Sewage Treatment Plants. Water Res. 2004, 38, 2918–2926. [Google Scholar] [CrossRef]
  23. Madhavan, J.; Grieser, F.; Ashokkumar, M. Combined Advanced Oxidation Processes for The Synergistic Degradation of Ibuprofen in aqueous Environments. J. Hazard. Mater. 2010, 178, 202–208. [Google Scholar] [CrossRef]
  24. Daughton, C.; Ternes, T.A. Pharmaceuticals and Personal Care Products in the Environment: Agents of Subtle Change? Environ. Health Perspect. 1999, 107, 907–938. [Google Scholar] [CrossRef] [PubMed]
  25. Lin, L.; Wang, H.; Xu, P. Immobilized TiO2-reduced Graphene Oxide Nanocomposites on Optical Fibres as High Performance Photocatalysts for Degradation of Pharmaceuticals. Chem. Eng. J. 2017, 310, 389–398. [Google Scholar] [CrossRef] [Green Version]
  26. He, Y.; Sutton, N.B.; Riijnaarts, H.H.H.; Langenhoff, A.A.M. Degradation of Pharmaceuticals in Wastewater Using Immobilized TiO2 Photocatalysis Under Simulated Solar Irradiation. Appl. Catal. B Environ. 2016, 182, 132–141. [Google Scholar] [CrossRef]
  27. Mohamed, A.; Salama, A.; Naseer, W.S.; Uheida, A. Photodegradation of Ibuprofen, Cetirizine, and Naproxen by PAN-MWCNT/TiO2-NH2 Nanofiber Membrane Under UV Light Irradiation. Environ. Sci. Eur. 2018, 30, 47. [Google Scholar] [CrossRef] [PubMed]
  28. Georgaki, I.; Vasilaki, E.; Katsarakis, N. A Study on the Degradation of Carbamazepine and Ibuprofen by TiO2 and ZnO Photocatalysis Upon UV/Visible-Light Irradiation. Am. J. Anal. Chem. 2014, 5, 518–534. [Google Scholar] [CrossRef] [Green Version]
  29. Achilleos, A.; Hapeshi, E.; Xekoukoulotakis, N.P.; Mantzavinos, D.; Fatta-Kassinos, D. UV-A and Solar Photodegradation of Ibuprofen and Carbamazepine Catalyzed by TiO2. Sep. Sci. Technol. 2010, 45, 1564–1570. [Google Scholar] [CrossRef]
  30. Caviglioli, G.; Valeria, P.; Brunella, P.; Sergio, C.; Attilia, A.; Gaetano, B. Identification of Degradation Products of Ibuprofen Arising from Oxidative and Thermal Treatments. J. Pharm. Biomed. Anal. 2002, 30, 499–509. [Google Scholar] [CrossRef]
  31. Water JPI. Available online: http://waterjpi.eu (accessed on 9 February 2022).
  32. European Commission. Directive 2000/60/EC of the European Parliament and of the Council, of 23 October 2000. Off. J. Eur. Communities 2000, 327, 1–72. [Google Scholar]
  33. European Commission. Energy Strategy. Available online: https://energy.ec.europa.eu (accessed on 9 February 2022).
  34. Naldoni, A.; Riboni, F.; Guler, U.; Boltasseva, A.; Shalaev, V.M.; Kildishev, A.V. Solar-Powered Plasmon-Enhanced Heterogenous Catalysis. Nanophotonics 2016, 5, 112–133. [Google Scholar] [CrossRef]
  35. Salimi, M.; Esrafili, A.; Gholami, M.; Jafari, A.J.; Kalantary, R.R.; Farzadkia, M.; Kermani, M.; Sobhi, H.R. Contaminants of emerging Concern: A Review of New Approach in AOP Technologies. Environ. Monit. Assess. 2017, 189, 414. [Google Scholar] [CrossRef]
  36. Poyatos, J.M.; Munio, M.M.; Almecija, M.C.; Torres, J.C.; Hontoria, E.; Osorio, F. Advanced Oxidation Processes for Wastewater Treatment: State of the Art. Water Air Soil Pollut. 2010, 205, 187–204. [Google Scholar] [CrossRef]
  37. Dal Santo, V.; Naldoni, A. Titanium Dioxide Photocatalysis. Catalysts 2018, 8, 591. [Google Scholar] [CrossRef] [Green Version]
  38. Pandis, P.K.; Kalogirou, C.; Kanellou, E.; Vaitsis, C.; Savvidou, M.G.; Sourkouni, G.; Zorpas, A.; Argirusis, C. Key Points of Advanced Oxidation Processes (AOPs) for Wastewater, Organic Pollutants and Pharmaceutical Waste Treatment: A Mini Review. ChemEngineering 2022, 6, 8. [Google Scholar] [CrossRef]
  39. Perovic, K.; dela Rosa, F.M.; Kovacic, M.; Kusic, H.; Stangar, U.L.; Fresno, F.; Dionysiou, D.D.; Bozic, A.L. Recent Achievements in Development of TiO2-Based Composite Photocatalytic Materials for Solar Driven Water Purification and Water Splitting. Materials 2020, 13, 1338. [Google Scholar] [CrossRef] [Green Version]
  40. Park, H.; Park, Y.; Kim, W.; Choi, W. Surface Modification of TiO2 Photocatalyst for Environmental Applications. J. Photochem. Photobiol. C Photochem. Rev. 2013, 15, 1–20. [Google Scholar] [CrossRef]
  41. Jiang, D.; Otitoju, T.A.; Ouyang, Y.; Shoparwe, N.F.; Wang, S.; Zhang, A.; Li, S. A Review on Metal Ions Modified TiO2 for Photocatalytic Degradation of Organic Pollutants. Catalysts 2011, 11, 1039. [Google Scholar] [CrossRef]
  42. Kumar, S.G.; Rao, K.S.R.K. Comparison of Modification Strategies Towards Enhanced Charge Carrier Separation and Photocatalytic Degradation Activity of Metal Oxide Semiconductors (TiO2, WO3, ZnO). Appl. Surf. Sci. 2017, 391, 124–148. [Google Scholar] [CrossRef]
  43. Mittal, A.; Mari, B.; Sharma, S.; Kumari, V.; Maken, S.; Kumari, K.; Kumar, N. Non-Metal Modified TiO2: A Step Towards Visible Light Photocatalysis. J. Mater. Sci. Mater. Electron. 2019, 30, 3186–3207. [Google Scholar] [CrossRef]
  44. Zouraris, D.; Karnaouri, A.; Pandis, P.K.; Argirusis, C.; Topaka, E.; Karantonis, A. On the Integration of Lytic Polysaccharide MonoOxygenases (LPMOs) with Phosphoric Acid Swollen Cellulose (PASC). J. Electroanal. Chem. 2021, 897, 115540. [Google Scholar] [CrossRef]
  45. McFarland, E.W.; Metiu, H. Catalysis by Doped Oxides. Chem. Rev. 2013, 113, 4391–4427. [Google Scholar] [CrossRef]
  46. Stathopoulos, V.N.; Belessi, V.C.; Costa, C.N.; Neophytides, S.; Falaras, P.; Efstathiou, A.M.; Pomonis, P.J. Catalytic Activity of High Surface Area Mesoporous Mn-Based Mixed Oxides for the Deep Oxidation of Methane and Lean-NOx Reduction. Stud. Surf. Sci. Catal. 2000, 130, 1529–1534. [Google Scholar]
  47. Pandis, P.K.; Perros, D.E.; Stathopoulos, V.N. Doped Apatite-type Lanthanum Silicates in CO Oxidation Reaction. Catal. Commun. 2018, 114, 98–103. [Google Scholar] [CrossRef]
  48. Damaskinos, C.M.; Vasiliades, M.A.; Stathopoulos, V.N.; Efstathiou, A.M. The Effect of CeO2 Preparation Method on the Carbon Pathways in Dry Reforming of Methane on Ni/CeO2 Studied by Transient Techniques. Catalysts 2019, 9, 621. [Google Scholar] [CrossRef] [Green Version]
  49. Goula, M.A.; Charisiou, N.D.; Pandis, P.K.; Stathopoulos, V.N. A Ni/Apatite-type Lanthanum Silicate Supported Catalyst in Glycerol Steam Reforming Reaction. RSC Adv. 2016, 6, 78954–78958. [Google Scholar] [CrossRef]
  50. Salmas, C.E.; Stathopoulos, V.N.; Pomonis, P.J.; Androutsopoulos, G.P. Pore Structure-Chemical Composition Interactions of New High Surface Area Manganese Based Mesoporous Materials. Materials Preparation, Characterization, and Catalytic Activity. Langmuir 2002, 18, 423–432. [Google Scholar] [CrossRef]
  51. Stefa, S.; Lykaki, M.; Fragkoulis, D.; Binas, V.; Pandis, P.K.; Stathopoulos, V.N.; Konsolakis, M. Effect of the Preparation Method on the Physicochemical Properties and the CO Oxidation Performance of Nanostructured CeO2/TiO2 Oxides. Processes 2020, 8, 847. [Google Scholar] [CrossRef]
  52. Lykaki, M.; Stefa, S.; Carabiniero, S.A.S.; Pandis, P.K.; Stathopoulos, V.N.; Konsolakis, M. Facet Dependent Reactivity of Fe2O3/CeO2 Nanocompsoites: Effects of Ceria Morphology on CO Oxidation. Catalysts 2019, 9, 371. [Google Scholar] [CrossRef] [Green Version]
  53. Corberan, V.C.; Rives, V.; Sthatopoulos, V.N. Recent Applications of Nanometal Oxide Catalyst in Oxidation Reactions. In Advanced Nanomaterials for Catalysis and Energy, Synthesis, Characterizations and Applications; Elsevier: Amsterdam, The Netherlands, 2019; pp. 227–293. [Google Scholar]
  54. Bespalko, Y.; Kuznetsova, T.; Kriger, T.; Chesalov, Y.; Lapina, O.; Ischenko, A.; Larina, T.; Sadykov, V.; Stathopoulos, V. La2Zr2O7/LaAlO3 Composite Prepared by Mixing Precipitated Precursors: Evolution of its Structure Under Sintering. Mater. Chem. Phys. 2020, 251, 123093. [Google Scholar] [CrossRef]
  55. Trens, P.; Stathopoulos, V.N.; Hudson, M.J.; Pomonis, P. Synthesis and Characterization of Packed Mesoporous Tungstenosilicates: Application to the Catalytic Dehydrogenation of 2-Propanol. Appl. Catal. A Gen. 2004, 263, 103–108. [Google Scholar] [CrossRef]
  56. Vaitsis, C.; Mechili, M.; Argirusis, N.; Kanellou, E.; Pandis, P.K.; Sourkouni, G.; Zorpas, A.; Argirusis, C. Ultra-Assisted Preparation Methods of Nanoparticles for Energy-Related Applications. In Nantotechnology and the Environment, 1st ed.; Sen, M., Ed.; IntechOpen: London, UK, 2020; Volume 1, 170p. [Google Scholar]
  57. Huang, J.-G.; Guo, X.-T.; Wang, B.; Li, L.-Y.; Zhao, M.-X.; Dong, L.-L.; Liu, X.-J.; Huang, Y.-T. Synthesis and Photocatalytic Activity of Mo-Doped TiO2 Nanoparticles. J. Spectrosc. 2015, 2015, 681850. [Google Scholar] [CrossRef] [Green Version]
  58. Yang, H.; Li, X.; Wang, A.; Wang, Y.; Chen, Y. Photocatalytic Degradation of Methylene Blue by MoO3 Modified TiO2 under Visible Light. Chin. J. Catal. 2014, 35, 140–147. [Google Scholar] [CrossRef]
  59. Aviles-Garcia, O.; Espino-Valencia, J.; Romero-Romero, R.; Rico-Cerda, J.L.; Arroyo-Albiter, M.; Solis-Casados, D.A.; Natividad-Rangel, R. Enhanced Photocatalytic Activity of Titania by Co-Doping with Mo, and W. Catalysts 2018, 8, 631. [Google Scholar] [CrossRef] [Green Version]
  60. Ghorai, T.K. Photocatalytic Degradation of 4-Chlorophenol by CuMoO4-Doped TiO2 Nanoparticles Synthesized by Chemical Route. Open J. Phys. Chem. 2011, 1, 28–36. [Google Scholar] [CrossRef] [Green Version]
  61. Zhang, M.; Wu, J.; Hou, J.; Yang, J. Molybdenum and Nitrogen Co-Doped Titanium Dioxide Nanotube Arrays with Enhanced Visible Light Photocatalytic Activity. Sci. Adv. Mater. 2013, 5, 535–541. [Google Scholar] [CrossRef] [Green Version]
  62. Simsek, E.B.; Kilic, B.; Asgin, M.; Akan, A. Graphene Oxide Based Heterojunction TiO2-ZnO Catalysts with Outstanding Photocatalytic Performance for Bisphenol-A, Ibuprofen, and Flurbiprofen. J. Ind. Eng. Chem. 2018, 59, 115–126. [Google Scholar] [CrossRef]
  63. Srikanth, B.; Goutham, R.; Badri, N.; Ramprasath, A.; Gopinath, K.P.; Sankaranarayanan, A.R. Recent Advancements in Supporting Materials for Immobilized Photocatalytic Applications in Wastewater Treatment. J. Environ. Manag. 2017, 200, 60–78. [Google Scholar] [CrossRef]
  64. Luo, S.-Y.; Yan, B.-X.; Shen, J. Enhancement of Photoelectric and Photocatalytic Activities: Mo Doped TiO2 Thin Films Deposited by Sputtering. Thin Solid Films 2012, 522, 361–365. [Google Scholar] [CrossRef]
  65. Chalkia, V.; Tachos, N.; Pandis, P.K.; Giannakas, A.; Koukou, M.K.; Vrachopoulos, M.G.; Coelho, L.; Ladavos, A.; Stathopoulos, V.N. Influence of Organic Phase change Materials on the Physical and Mechanical Properties of HDPE and PP Polymers. RSC Adv. 2018, 8, 27438–27447. [Google Scholar] [CrossRef] [Green Version]
  66. Pandis, P.K.; Papaioannou, S.; Koukou, M.K.; Vrachopoulos, M.G.; Stathopoulos, V.N. Differential Scanning Calorimetry Based Evaluation of 3D Printed PLA for Phase Change Materials Encapsulated or as Container Material of Heat Storage Tanks. Energy Procedia 2019, 161, 429–437. [Google Scholar] [CrossRef]
  67. Wojciechowska, J.; Gitzhofer, E.; Grams, J.; Rupert, A.M.; Keller, N. Solar Light Induced Photo-Assisted Synthesis of TiO2 Supported Highly Dispersed Ru Nanoparticle Catalyst. Materials 2018, 11, 2329. [Google Scholar] [CrossRef] [Green Version]
  68. Zener, B.; Matoh, L.; Carraro, G.; Miljevc, B.; Korsec, R.C. Sulfur-Nitrogen and Platinum-Doped Titania Thin Films with High Catalytic Efficiency Under Visible-Light Illumination. Beilstein J. Nanotechnol. 2018, 9, 1629–1640. [Google Scholar] [CrossRef] [PubMed] [Green Version]
  69. Elhalil, A.; Elmoubarki, R.; Machrouhi, A.; Sadiq, M.; Abdennouri, S.; Qourzal, S.; Barka, N. Photocatalytic Degradation of Caffeine by ZnO-ZnAl2O4 Nanoparticles Derived from LDH Structure. J. Environ. Chem. Eng. 2017, 5, 3719–3726. [Google Scholar] [CrossRef]
  70. Hussain, S.T.; Siddiqa, A.; Siddiq, M.; Ali, S. Iron-Doped Titanium Dioxide Nanotubes: A Study of Electrical, Optical, and Magnetic Properties. J. Nanopart. Res. 2013, 13, 6517–6525. [Google Scholar] [CrossRef]
  71. Li, S.; Jena, P. Origin of the Anatase to Rutile Conversion of Metal-Doped TiO2. Phys. Rev. B 2009, 79, 201–204. [Google Scholar] [CrossRef] [Green Version]
  72. Inturi, S.N.R.; Boningari, T.; Suidan, M.; Smirniotis, P.G. Visible-Light Induced Photodegradation of Gas Phase Acetonitrile Using Aerosol-Made Transition Metal (V, Cr, Fe, Mn, Mo, Ni, Cu, Y, Ce, and Zr) Doped TiO2. Appl. Catal. B Environ. 2014, 144, 333–342. [Google Scholar] [CrossRef]
  73. Chaudri, S.M.; Gawal, P.M.; Sane, P.K.; Sontakke, S.M.; Nemade, P.R. Solar Light-Assisted Photocatalytic Degrdation of Methylene Blue with Mo/TiO2: A Comparison with Cr- and Ni-Doped TiO2. Res. Chem. Intermed. 2018, 44, 3115–3134. [Google Scholar] [CrossRef]
  74. Tavallaei, H.; Jafarpour, M.; Feizpour, F.; Rezaeifard, A.; Farrokhi, A.A. Cooperative Effect in a Novel Bimetallic Mo-V Nanocomplex Catalyzed Selective Aerobic C-H Oxidation. ACS Omega 2019, 4, 3601–3610. [Google Scholar] [CrossRef]
  75. Meng, L.; Zhang, X.; Tang, Y.; Su, K.; Kong, J. Hierarchically Porous-Silicon Carbon Nitrogen Hybrid Materials Towards Highly Efficient and Selective Adsorption of Organic Dyes. Sci. Rep. 2015, 5, 7910. [Google Scholar] [CrossRef] [Green Version]
  76. Huntsman TiO2. Available online: www.huntsman.com/materials/coatings (accessed on 14 February 2022).
  77. Thommes, M.; Kaneko, K.; Neimark, A.V.; Olivier, J.P.; Rodriguez-Reinoso, F.; Rouquerol, J.; Sing, K.S.W. Physisorption of Gases with Special Reference to The Evaluation of Surface Area and Pore Size Distribution (IUPAC Technical Report). Pure Appl. Chem. 2015, 87, 1051–1069. [Google Scholar] [CrossRef] [Green Version]
  78. Vourdas, N.; Tserepi, A.; Stathopoulos, V.N. Reversible Pressure-Induced Switching of Droplet Mobility After Impingement on Porous Surface Media. Appl. Phys. Lett. 2013, 103, 111602. [Google Scholar] [CrossRef]
  79. Vourdas, N.; Ranos, C.; Stathopoulos, V.N. Reversible and Dynamic Transitions Between Sticky and Slippery States on Porous Surfaces with Ultra-low Back Pressure. RSC Adv. 2015, 5, 33666–33673. [Google Scholar] [CrossRef]
  80. Illes, E.; Takacs, E.; Dombi, A.; Gajda-Schrantz, K.; Racz, G.; Gonter, K.; Wojnarovits, L. Hydroxyl Radical Induced Degradation of Ibuprofen. Sci. Total Environ. 2013, 447, 286–292. [Google Scholar] [CrossRef] [PubMed]
  81. Vergili, I. Application of Nanofiltration for The Removal of Carbamazepine, Diclofenac, and Ibuprofen from Drinking Water Sources. J. Environ. Manag. 2013, 127, 177–187. [Google Scholar] [CrossRef] [PubMed]
  82. Mendez-Arriaga, F.; Maldonado, M.I.; Gimenez, J.; Esplugas, S.; Malato, S. Abatement of Ibuprofen by Solar Photocatalysis Process: Enhancement and Scale Up. Catal. Today 2009, 144, 112–116. [Google Scholar] [CrossRef]
  83. Miranda-Garcia, N.; Maldonado, M.I.; Coronado, J.M.; Malato, S. Degradation Study of 15 Emerging Contaminants at Low Concentration by Immobilized TiO2 in a Pilot Plant. Catal. Today 2010, 151, 107–113. [Google Scholar] [CrossRef]
Figure 1. Thermogravimetric analysis shows respective: (a) Mass-loss (%), and (b) heat flow content of unmodified HRTiO2 (black line) and Mo/HRTiO2 (red line) for sample materials.
Catalysts 12 00562 g001
Figure 2. (a) XRD measurement for unmodified HRTiO2 (black line) and Mo/HRTiO2 (green line), TEM measurement for (b) unmodified HRTiO2, and (c) Mo/HRTiO2 sample materials.
Catalysts 12 00562 g002
Figure 3. FTIR measurement for the unmodified HRTiO2 (black line) and modified Mo/HRTiO2 (green line).
Catalysts 12 00562 g003
Figure 4. XPS measurement. (a) Survey spectrum of unmodified HRTiO2 (black line), and modified Mo/HRTiO2 (red line) and deconvoluted elemental spectra of (b) Ti 2p, (c) O 1s, and (d) Mo 3d for the modified Mo/HRTiO2 sample only.
Catalysts 12 00562 g004
Figure 5. SEM measurement images for (a) unmodified HRTiO2, and (b) Mo/HRTiO2, and and their corresponding EDS maps for (c) unmodified HRTiO2, and (d) Mo/HRTiO2.
Catalysts 12 00562 g005
Figure 6. N2 adsorption-desorption isotherm curve and their respective particle size distribution (PSD) (inset) of (a) unmodified HRTiO2, and (b) modified Mo/HRTiO2.
Catalysts 12 00562 g006
Figure 7. Energy band gap (Eg) estimates for (a) unmodified HRTiO2, and (b) modified Mo/HRTiO2.
Catalysts 12 00562 g007
Figure 8. Photo image of disk-shaped α-Al2O3 ceramic substrate (courtesy of MIRTEC, Greece).
Catalysts 12 00562 g008
Figure 9. (a) SEM-EDS and (b) cross-sectional SEM-EDS of active modified Mo/HRTiO2 topcoat on the α-Al2O3 ceramic support.
Catalysts 12 00562 g009
Figure 10. (a) Preliminary photocatalytic test performance of HRTiO2 (blue line) and Mo/HRTiO2 (red line), and (b) their corresponding photocatalytic degradation rate constant (k) under test conditions of 1 g/L catalyst dosage, 50 mg/L initial IBU concentration, initial natural (unmodified) pH 4, and 365 nm UV irradiation.
Catalysts 12 00562 g010
Figure 11. The pH point of zero charge (pHpzc) plot of Mo/HRTiO2 material.
Catalysts 12 00562 g011
Figure 12. (a) Effect of pH on the photocatalytic degradation performance of 1 g/L Mo/HRTiO2 over 50 mg/L initial IBU concentration under 365 nm irradiation, and (b) their corresponding photocatalytic degradation rate constant (k).
Catalysts 12 00562 g012
Figure 13. (a) Effect of catalyst dosage on the photocatalytic degradation performance of Mo/HRTiO2 over 50 mg/L initial IBU concentration under natural (unmodified) pH ~ 4 and 365 nm irradiation, and (b) their corresponding photocatalytic degradation rate constant (k).
Catalysts 12 00562 g013
Figure 14. (a) Effect of initial IBU concentration on the photocatalytic degradation performance of 1 g/L Mo/HRTiO2 under natural (unmodified) pH ~ 4 and 365 nm irradiation, and (b) their corresponding photocatalytic degradation rate constant (k).
Catalysts 12 00562 g014
Figure 15. Dark effect (with 1 g/L Mo/HRTiO2), photolysis, heat effect with 1 g/L Mo/HRTiO2, and heat effect without photocatalyst over the degradation of 50 mg/L initial IBU concentration under natural (unmodified) pH ~ 4, and 365 nm UV irradiation.
Catalysts 12 00562 g015
Figure 16. (a) Photocatalytic degradation performance efficiency of ~5 mg Mo/HRTiO2 ceramic supported photocatalyst over the degradation of 4, 4.5, 5, 5.5, and 6 mg/L initial IBU concentration under natural (unmodified) pH ~ 4 and 365 nm UV irradiation, and (b) their corresponding photocatalytic degradation rate constant (k).
Catalysts 12 00562 g016
Figure 17. Photocatalytic degradation performance efficiency and inset photocatalytic degradation rate constant (k) of ~5 mg Mo/HRTiO2 ceramic supported photocatalyst over 50 mg/L initial IBU concentration under natural (unmodified) pH ~ 4 and 365 nm UV irradiation with (a) single disk tablet, (b) double disk tablet, and (c) triple disk tablet numbers.
Catalysts 12 00562 g017
Figure 18. XRD measurement of 1st and 3rd cycle reused supported ~5 mg of Mo/HRTiO2 on ceramic for IBU degradation in comparison with related control sample materials.
Catalysts 12 00562 g018
Figure 19. Dark effect with ~5 mg Mo/HRTiO2 on ceramic, and test effect with uncoated ceramic under UV irradiation over initial 5 mg/L IBU removal.
Catalysts 12 00562 g019
Table 1. Properties of unmodified and Mo modified HRTiO2 materials.
Estimated/Measured Characterization Data
MaterialsdXRD (nm)dTEM (nm)SBET (m²/g)Vp (cm³/g)Dp (nm)Eg (eV)
HRTiO216.4727.529.780.027.063.23
Mo/HRTiO229.9958.668.40.029.113.23
dXRD: Average crystallite size estimated by XRD; dTEM: Average particle size estimated by TEM; SBET: Surface area; Vp: Total pore volume; dp: Average pore size; Eg: Energy band gap.
Table 2. Technical features of α-Al2O3 ceramic support material.
Particle Size Distribution (PSD) Properties of α-Al2O3 Powder
D90 (µm)D50 (µm)D10 (µm)Specific surface area (m²/g)
14.14.72.61.38
Content ingredients of ceramic substrate by % weight in mass of α-Al2O3 powder
Ingredientwt%/mass
Al2O3100 g
Cellulose MHPC 20004
Sodium stearate 2
Water 20–23
Geometrical characteristics of disk-shaped ceramic material
ShapeImposed load (KN)Geometric characteristics (mm)
DiskCoarseFine grainDiameter dThickness W
77.5402
Table 3. Physicochemical properties of ibuprofen (IBU).
Chemical Property/NameIbuprofen Sodium Salt
Chemical structure Catalysts 12 00562 i001
Molecular formulaC13H17O2Na
CAS no.31121-93-4
Molecular weight, g/mol228.26
Solubility in water, g/L100
pKa4.52–4.9
Table 4. Parametric indicators for the photocatalytic activity performance evaluation of Mo/HRTiO2. In suspension and on support tests over ibuprofen showing investigated parametric effects and their estimated degradation rate constant k (min¹), correlation coefficient R², half-life t1/2 (min), and measured initial and final pH values.
Test Degradation Rate Constant k (min−1)R2Half-Life t1/2 (min)pHinitialpHfinal
Preliminary test for photocatalyst material #, *, [IBU]0 = 50 mg/L
HRTiO2 0.02940.993423.546.355.11
Mo/HRTiO20.04140.988616.724.324.33
Mo/HRTiO2
pH effect #, *, [IBU]0 = 50 mg/L
pH natural = ~40.04790.966814.454.283.98
pH = 30.05230.973813.233.193.27
pH = 50.03560.949519.445.124.02
pH = 70.01430.996348.397.064.55
pH = 90.01250.993855.369.177.04
pH = 110.02470.979428.0210.808.64
Catalyst dosage effect #, *, [IBU]0 = 50 mg/L
0.5 g/L0.03420.981920.234.313.92
0.75 g/L 0.03610.983719.174.333.84
1 g/L 0.04440.98215.594.313.82
1.25 g/L 0.05040.991313.734.333.75
Pollutant concentration effect #, *
40 mg/L0.06070.963911.404.343.78
45 mg/L0.05240.986213.214.293.78
50 mg/L0.04110.975616.844.313.79
55 mg/L0.02360.997329.324.333.9
60 mg/L0.0260.993926.624.323.99
Pollutant concentration effect #, ¤
4 mg/L0.00220.9887314.554.348.5
4.5 mg/L0.00220.9916314.554.298.91
5 mg/L0.00250.9936276.804.318.48
5.5 mg/L0.00180.9916384.444.339.08
6 mg/L0.00170.9957407.064.328.2
Single disk tablet reusability/photostability test #, ¤, [IBU]0 = 5 mg/L
1st cycle0.00250.9936276.804.339.34
2nd cycle0.00160.9878432.504.338.62
3rd cycle0.00120.9944576.674.38.55
Double disk tablet reusability/photostability test #, ¤, [IBU]0 = 5 mg/L
1st cycle0.00450.9933153.784.337.42
2nd cycle0.00440.9973157.274.337.31
3rd cycle0.00480.9978144.174.316.99
Triple disk tablet reusability/photostability test #, ¤, [IBU]0 = 5 mg/L
1st cycle0.0060.9915115.334.38.09
2nd cycle0.0050.9878138.404.337.88
3rd cycle0.0070.996898.864.317.58
# Tests performed under 365 nm near UV-Vis irradiation, under pH natural, and at 1 g/L catalyst dosage conditions unless indicated otherwise, and * in powder suspension test, ¤ on support test.
Publisher’s Note: MDPI stays neutral with regard to jurisdictional claims in published maps and institutional affiliations.

