Hydrogen Oxidation on Ni-Based Electrocatalysts: The Effect of Metal Doping
by

Elena S. Davydova
1,2,*, 
Jérémie Zaffran
2,3,
Kapil Dhaka
3,
Maytal Caspary Toroker
2,3,* and
Dario R. Dekel
1,2,* 1
The Wolfson Chemical Engineering Department, Technion—Israel Institute of Technology, 3200003 Haifa, Israel
2
The Nancy and Stephen Grand Technion Energy Program (GTEP), Technion—Israel Institute of Technology, 3200003 Haifa, Israel
3
Department of Material Science and Engineering, Technion—Israel Institute of Technology, 3200003 Haifa, Israel
*
Authors to whom correspondence should be addressed.
Catalysts 2018, 8(10), 454; https://0-doi-org.brum.beds.ac.uk/10.3390/catal8100454
Submission received: 27 September 2018
/
Revised: 9 October 2018
/
Accepted: 11 October 2018
/
Published: 15 October 2018
(This article belongs to the Special Issue Catalysts for Polymer Membrane Fuel Cells)
Abstract
:Carbon supported nanoparticles of monometallic Ni catalyst and binary Ni-Transition Metal (Ni-TM/C) electrocatalytic composites were synthesized via the chemical reduction method, where TM stands for the doping elements Fe, Co, and Cu. The chemical composition, structure and morphology of the Ni-TM/C materials were characterized by X-ray photoelectron spectroscopy (XPS), X-ray diffraction (XRD), transmission electron microscopy (TEM), scanning transmission electron microscopy (STEM) and energy-dispersive X-ray spectroscopy (EDS). The electrochemical properties towards hydrogen oxidation reaction in alkaline medium were studied using the rotating disc electrode and cycling voltammetry methods. A significant role of the TM dopants in the promotion of the hydrogen electrooxidation kinetics of the binary Ni-TM/C materials was revealed. A record-high in exchange current density value of 0.060 mA cm2Ni was measured for Ni3Fe1/C, whereas the monometallic Ni/C counterpart has only shown 0.039 mA cm2Ni. In order to predict the feasibility of the electrocatalysts for hydrogen chemisorption, density functional theory was applied to calculate the hydrogen binding energy and hydroxide binding energy values for bare Ni and Ni3TM1.
1. Introduction
Anion exchange membrane fuel cells (AEMFCs) have seen a rapid increase in interest in recent years [1,2], as they promise to overcome the existing cost barriers inherent to low temperature acidic polymer electrolyte membrane fuel cells. In the past 3 years, extensive research in AEMFCs, mainly in polymer performance stability [3,4,5,6,7,8,9,10,11,12], carbonation effects [13,14,15] and modelling [16,17,18,19], led to significant progress in this technology. However, in spite of this progress, in order to fulfill the optimistic potential of AEMFCs in the near future, catalysts should be completely free of expensive noble metals, and eventually free of critical raw materials. Although great progress has been done in the development of Pt-free catalysts for oxygen reduction reaction in base medium [20,21], significantly less attention has been paid to the catalysis for the hydrogen oxidation reaction (HOR). The lack of fundamental understanding of the HOR mechanism in basic media and of the main energy barriers needs to be firmly established to overcome this challenge. In a recent comprehensive study, challenges of HOR catalysis in alkaline electrolytes were reviewed [22]. The review presents the most updated understanding of the HOR electrocatalysis in basic media and outlines promising future research directions for the development of better HOR electrocatalysts for alkaline electrolytes, mainly to be used for advanced AEMFC devices.
High-performance AEMFCs have been recently reported, showing peak power values that well exceed 1.0 W cm−2; predicting performance stability in anion exchange membrane fuel cells [7,23] however, all of these state-of-the-art AEMFCs exclusively rely on Pt-based HOR catalysts [24]. Very few studies reporting AEMFC performance with zero-platinum loading can be found [24]. Among them, the highest performing Pt-free AEMFCs consist of palladium-based catalysts for the HOR, showing performance close to that of platinum, with peak power densities of 0.4–1.4 W cm−2 [25,26,27]. However, complete removal of platinum group metals (PGMs) in AEMFC anodes is still widely recognized as a major challenge [22,24].
Nickel exhibits the most promising HOR activity of any of the 3d transition metals (TM) [22]. However, until now, undoped Ni electrocatalysts demonstrate about two orders of magnitude lower activity than Pt or Pd [22]. Calculations predicted that doping of Ni by TMs decreases Ni-H bond strength [28,29], thus, allowing to optimize hydrogen binding energy (HBE) values via positively shifting them close to those of PGMs [30]. Nickel doping was also reported to suppress nickel oxophilicity, and hence, to impede surface (electro)oxidation [31]. It was reported that alloying Ni with other 3d TM helps to prevent the formation of Ni-hydride and increases the durability of the electrodes in hydrogen evolution reaction (HER) [32,33], strengthening the understanding that Ni doping is a powerful tool in modifying and tailoring Ni (electro)catalytic properties.
Several studies have examined the doping effect of TM for some binary [29,34,35,36,37,38] and ternary [29] Ni-based alloys for HOR in base media. Sheng et al. [29] showed that ternary metallic CoNiMo layers electrodeposited on the surface of Au substrate exhibit a significant increase of exchange current density (0.015 mA cm−2), as compared to bulk Ni (0.002 mA cm−2). The authors suggested that the formation of multi-metallic bonds modified the HBE value of Ni and likely contributed to the enhanced HOR activity [29]. However, thick layers of the electrodeposited CoNiMo layers might be of low practical interest for real AEMFC devices. Kabir et al. [34] developed 50% Ni9Mo1/Ketjenblack via thermal reduction method under H2 flow at 550 °C, with oxidative treatment in 2% O2/He mixture for 8 h at room temperature. The resultant Ni-Mo catalyst was shown to comprise only ca. 2% NiMo4 alloy, however the authors assumed that the enhanced activity of Ni-Mo catalyst could be ascribed to the decrease in HBE value by ca. 0.14 eV, as compared to that of unmodified Ni. The authors showed that an AEMFC based on this Ni-Mo/C anode catalyst and Pd/C cathode catalyst, can reach a peak power density value of 0.12 W cm−2 [34].
In another study, binary Ni-Ag bulk alloys across a range of compositions were deposited on glassy carbon substrate using electron beam evaporation [36]. X-ray diffraction (XRD) data showed that e-beam evaporation results only in partial alloying of Ni and Ag, while the rotating disk electrode (RDE) measurements revealed a negligible effect of silver doping on the catalytic activity of Ni towards hydrogen electrooxidation. Zhuang et al. [28] showed that by developing nickel nanoparticles supported on nitrogen-doped carbon nanotubes (CNTs) via hydrothermal treatment at 150 °C in the presence of ammonia and hydrazine, the catalytic activity of bare Ni can be significantly improved (0.028 for Ni/N-CNT vs. 0.0014 mA cm−2Ni for bare Ni in 0.1 M KOH). The authors attributed the promoted HOR activity to the synergetic effect of the optimal HBE resulting both from geometric and electronic interaction of Ni atoms with the edge N atoms in CNT. Although the authors achieved a high mass activity (ca. 9 A gcat−1), the elegant but still single data point does not anticipate the future directions for improving the catalytic activity of Ni. Cherstiouk et al. [37] have proposed a series of NixCu1−x/Vulcan XC72 electrocatalysts obtained via successive wet impregnation, calcination and reduction in H2 at 250 °C for 1 h. The authors assume that the enlargement of the lattice parameter for Ni9.5Cu0.5/Vulcan XC72 suggests the formation of Ni-Cu alloy with ca. 5 at.% Cu content. The enhancement of the HOR activity of Ni-Cu samples (0.014 mA cm−2) compared to Ni (0.004 mA cm−2) was tentatively explained by the electronic effect of Cu resulting in the decrease of the energy of adsorption of the hydrogen intermediate.
In summary, certain moderate progress was done in understanding the role of the TM dopant nature and doping level on the catalytic properties of Ni towards HOR in alkaline. However, there is still an enormous gap between systematic understanding of the dopant role in the HOR electrocatalysis and the random results of the experimental data.
In this work, we undertake a systematic scanning of the first row TMs, from Sc to Zn, to predict by density functional theory (DFT) calculations the HBE and OH binding energy (OHBE) values for three different facets—(111), (200) and (220)—of bimetallic face-centered cubic (FCC) Ni3TM1 alloys. To reveal the effect of TM doping on the electrocatalytic properties of nanosized Ni3TM1electrocatalysts, the HOR kinetics of monometallic Ni/C and bimetallic Ni3TM1/C composites in 1 M KOH was also systematically measured for selected TMs that were found to be potentially interesting based on the DFT calculations.
2. Results and Discussion
2.1. Theoretical Prediction
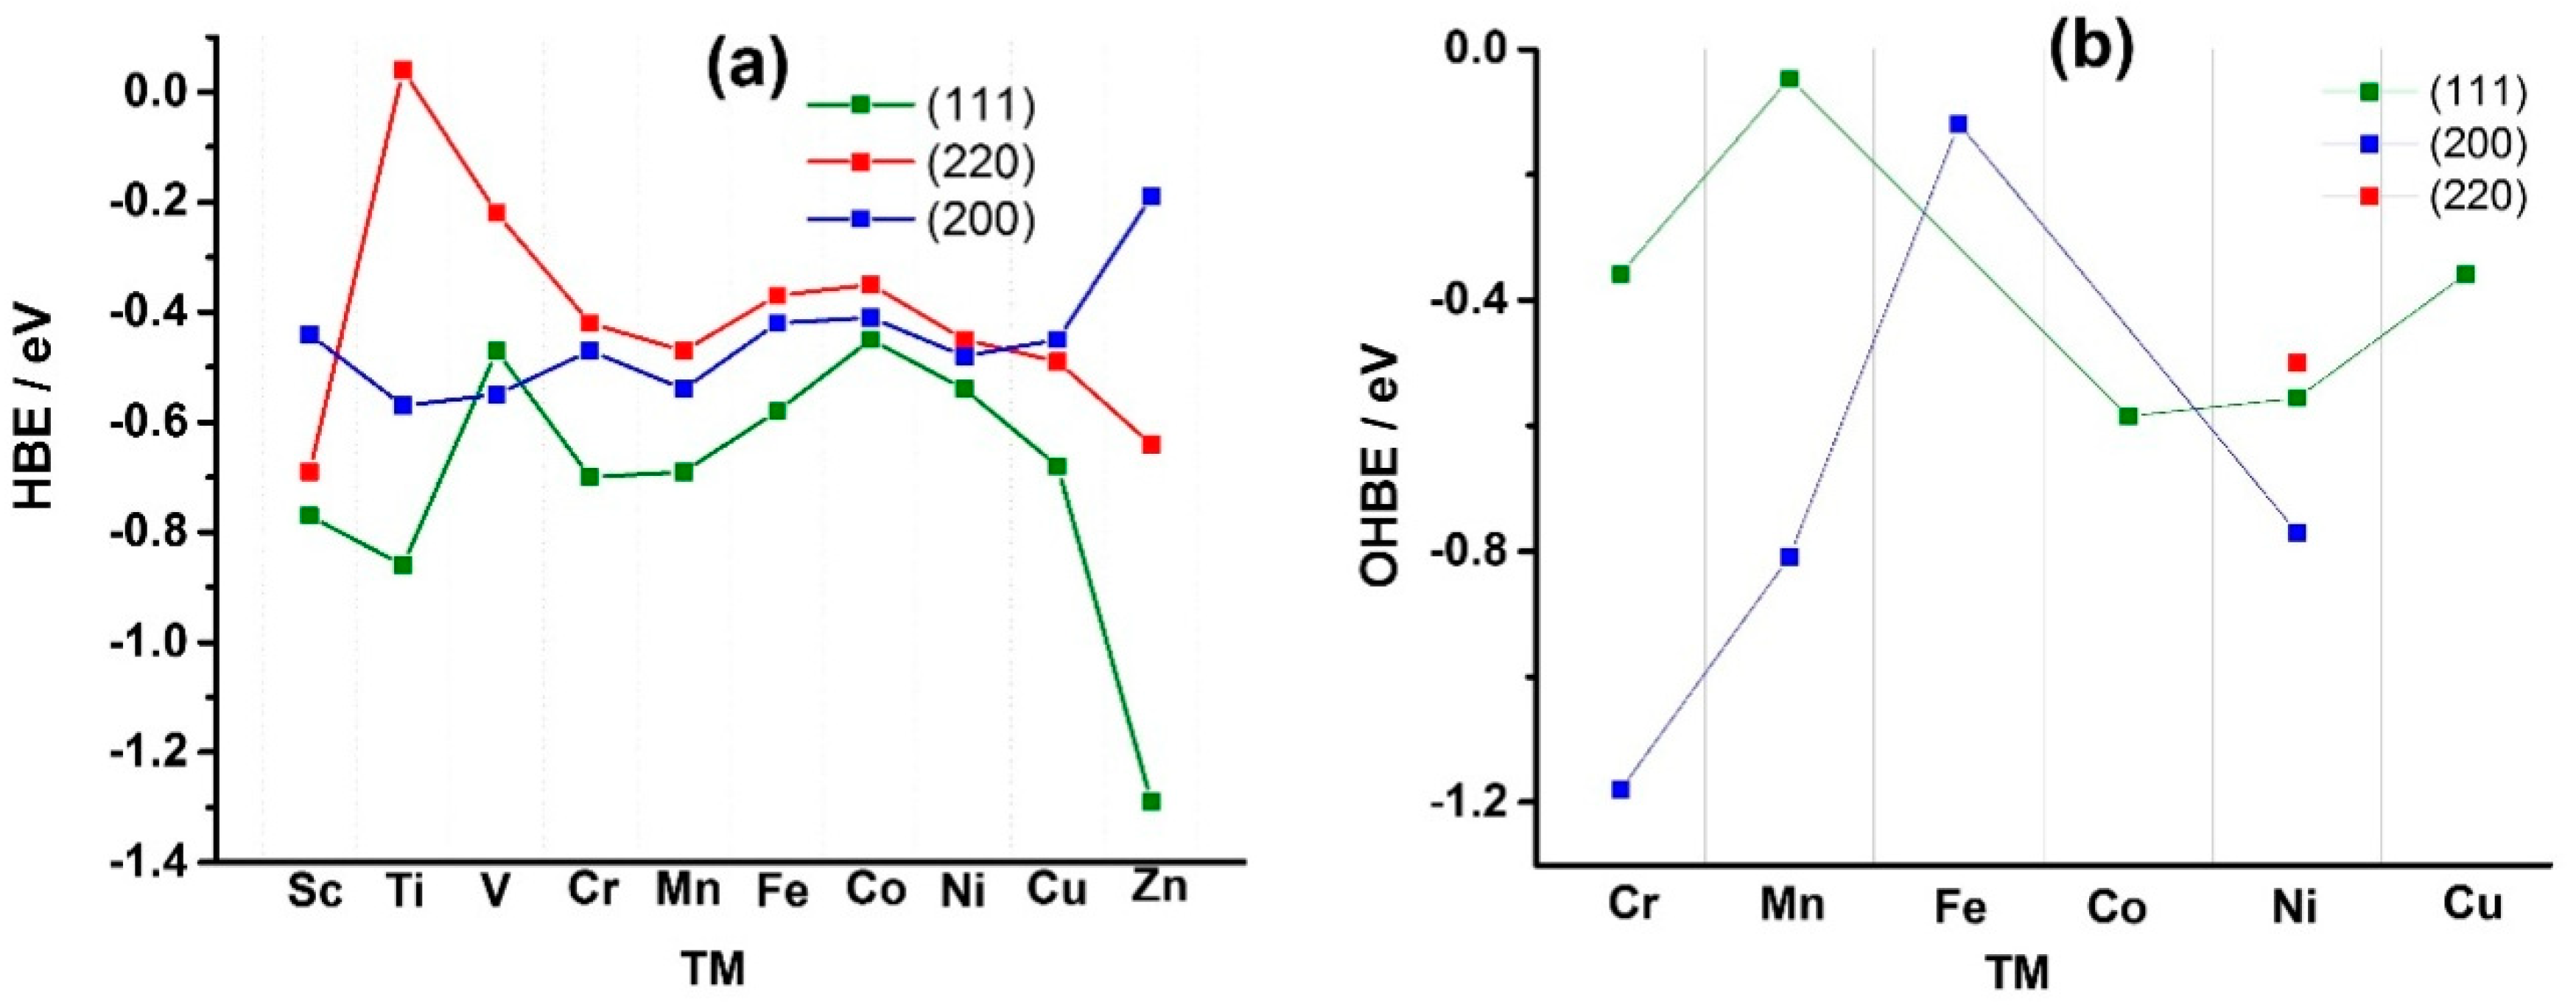
DFT method was used to calculate the HBE and OHBE values on (111), (200), and (220) facets of Ni3TM1 alloys. The HBE and OHBE values are presented in Table A1, Table A2, Table A3, Table A4, Table A5 and Table A6 (Appendix A). To the best of our knowledge, this is the first time the OHBE values were calculated for the electrocatalysts. Figure 1 shows the calculated HBE values (Figure 1a) and OHBE values (Figure 1b) for the case of pure Ni and different Ni3TM1 alloys. As seen in Figure 1 and Table A1, Table A2 and Table A3 (Appendix A), hydrogen atom has the lowest HBE for the (111) facet, compared to the (220) and (200) facets. For example, HBE value for bare Ni (111) is −0.54 eV, while is −0.48 and −0.45 eV for Ni (200) and Ni (220), respectively (see also Tables S1–S3, Supplementary Materials). The reason for the stability of the (111) facet is that H atoms can establish more bonds on the (111) facet, which is more atomically dense than other facets. The facet Ni (200) of the bare Ni shows the highest affinity to OH chemisorption and the facet (220) is characterized by the weakest OH bonding (OHBE: (200) ˂˂ (111) < (220)) (Figure 1b). The comparison of OHBE and HBE values (HBE and OHBE are −0.54 eV for (111), and HBE is −0.45 and OHBE is −0.49 eV for (220)) shows that the co-adsorption of the both H and OH species is thermodynamically favorable.
Some authors assume that the kinetics of HOR directly follows the thermodynamics of the reaction [39,40], and therefore it is explicitly related to the HBE values according to the so-called volcano plot [41], where HOR/HER exchange current densities are plotted versus HBE, with the PGMs normally at the top of the graph. The optimal HBE value was predicted to be ca. −0.24 eV, which corresponds to the HOR ΔG~0 [41]. HBE might be considered as the main factor influencing the HOR kinetics solely in case the rate-determining step (rds) of the reaction is either Volmer [42], or Heyrovsky reactions [43], namely the removal of the adsorbed H atom from the catalyst surface. Studies of the HOR mechanism in alkaline for Pt electrocatalysts have revealed a controversy in the experimental data interpretation [22]: while some of the authors experimentally proved that Tafel reaction is the HOR rds [44,45,46,47,48], others provided experimental evidence for the HOR kinetics limited by the Volmer reaction [49,50].
The mechanism of HOR on Ni-based materials has been hardly explored [22,51]. The analysis below is done provided that Volmer or Heyrosky reactions are rds of HOR in alkaline media—the speculative assumption based on the nonlinear dependence of the HOR kinetics on the surface coverage [34,52]. The HBE value calculated for the facet Ni (111), −0.54 eV (Figure 1), is more negative than those calculated for Pt (111), Rh (111) and Ir (111), −0.37, −0.33 and −0.24 eV [30], respectively. In turn, Pt, Rh and Ir show the highest catalytic activity in HOR in alkaline media, which is more than two orders of magnitude higher than that of Ni electrocatalysts [22]. Thus, based on the predicted optimal HBE value [41] and on the calculated HBE values for the most active catalytic materials [22], the recommended HBE values for the newly designed electrocatalysts should fall into the range between ca. −0.33 to −0.24 eV. In case of Ni-based materials, higher catalytic activity would be expected at the HBE values which are less negative than those for the bare Ni surfaces.
Among the facets, Pt (100) surpasses the activity of (110) by an order of magnitude, while (111) shows the lowest activity: (110) ≫ (100) > (111) [44,53]. This sequence could be correlated with the HBE values estimated from the peak potential values for the desorption of the underpotentially deposited hydrogen atom in 0.1 M KOH: −0.48 eV for Pt (110) is much less negative compared to −0.60 eV for Pt (100) [39,49]. The exchange current density values, i0, of carbon supported polycrystalline Pt nanoparticles, Pt/C, and bulk polycrystalline Pt, Pt(pc), are close to each other [54,55] and to i0 for Pt (110) [44]. Thus, the catalytic activity in HOR might be mainly determined by the presence of the facet Pt (110). The calculations of the HBE values done for Pt(pc) show a span within the range of −0.46 [29] and −0.33 [41] eV, while the value of −0.48 eV is reported for Pt/C [56]. Similar order of activity (Ni (110) > Ni (100) > Ni (111)) is observed in the study of Floner et al. [51]: Ni (100) and above all (110) are more active than polycrystalline Ni, whereas the behavior of the latter is close to (111), particularly at low pH where dissolution of Ni occurs. Based on the results of Floner et al. [51], we assume that i0 of the polycrystalline Ni3TM1/C electrocatalysts might be dominated by the facet Ni (110) or Ni (220). Interestingly, our calculated HBE values for the bare Ni facets is mostly ordered according to Ni (220) > Ni (200) > Ni (111) (see Figure 1), in good agreement with the activity order experimentally shown by Floner et al. [51]. Furthermore, as seen in Figure 1, it follows that solely alloying Ni with Co results in a positive shift of the HBE value compared to the bare Ni (111) facet, −0.45 vs. −0.54 eV. For the facet (200), the alloying with Sc, Cr, Fe, Co, Cu and Zn were shown to have a positive effect on the HBE values, with only Ni3Zn1 (−0.19 eV) close to the aimed range of −0.33–−0.24 eV. Ni3Fe1, Ni3Co1 and Ni3Cu1 demonstrate the HBE values close to the earlier reported Ni3Ag1 [36], CoNi/Mo (110) [29], and Ni/N-CNT [28], the last two materials showing the highest mass specific/surface specific activity values published till now. As regarding the facet (220), the HBE value of Ni3V1 falls into the recommended range, and the catalyst might be of interest of the HOR. Ni3Fe1 (−0.37 eV) and Ni3Co1 (−0.35 eV) of the facet (220) could also result in better HOR than bare Ni catalyst, and therefore, they are included in our experimental work for further study. Thus, based on the theoretical predictions (Figure 1), a series of carbon supported binary electrocatalysts (Ni3Fe1, Ni3Co1 and Ni3Cu1) and monometallic Ni (as reference material) were synthesized by the chemical reduction method. Fe, Co and Cu were chosen as the TM dopants due to their promising HBE and OHBE values (Table A4, Table A5 and Table A6, Appendix A).
2.2. Physical and Chemical Characterization
The TEM image (Figure S1a, Supplementary Materials) shows that electrocatalysts are characterized by nanoscopically uniform distribution of near-spherical particles with the average diameter of ca. 10 nm (Figure S1b, Supplementary Materials), surrounded by amorphous carbon support. Assuming spherical particles, the calculated specific surface area of ca. 70 m2g−1Ni would be expected for a particle average diameter of 10 nm.
For binary Ni3TM1/C catalysts, element mapping revealed nanoscopically non-homogeneous co-distribution of the metallic components (Figures S2–S4, Supplementary Materials). This shows that the chemical reduction method most likely might result in the formation of composite materials (mechanical mixtures), rather than alloys. The most significant heterogeneity was observed for the Ni3Cu1/C catalyst (Figure S4, Supplementary Materials), where separate areas of Ni (red pixels) and Cu (green pixels) can be seen. Surface enrichment by Ni phase (red pixels) was revealed for all the binary Ni3TM1/C systems (Figures S2–S4, Supplementary Materials), which is in good agreement with the X-ray photoelectron spectroscopy (XPS) data (Table S1, Supplementary Materials). The opposite—bulk segregation of Ni—was observed in binary Ni9Mo1/C electrocatalyst [34]. These observations illustrate that special controlled synthetic approaches are needed in order to synthesize Ni-TM materials with the given Ni-to-TM ratio. Nevertheless, quite homogeneous metal co-distribution topography was observed for the Ni-Fe and Ni-Co couples in Ni3Fe1/C (Figure S2, Supplementary Materials) and Ni3Co1/C (Figure S3, Supplementary Materials) catalyst, respectively. This latter observation might be related to the fact that Ni co-deposits simultaneously with Co and Fe due to the reduction potential values. To compare, the standard reduction potentials of Ni ( and Co ( are close, whereas Cu has much higher potential (. Consequently, the coexistence of the composites with the alloyed phase(s) in Ni3TM1/C catalysts cannot be ruled out unambiguously. Therefore, a thorough analysis of the XRD patterns of the as-synthesized catalysts and of those after the thermal treatment at 450 °C was done (Figures S5 and S6, Supplementary Materials). On XRD patterns (Figure S5), catalysts show wide peaks at ~44.5° of low intensity, which corresponds to Ni (111) facets, the same facet as calculated by DFT (see previous section). Small particle sizes explain the broadening of the (111) peak (with extremely low crystallite sizes of ca. 0.7 nm) and the absence of (200) and (220) reflections on the XRD patterns, which does not rule out the coexistence of the high-index facets in the catalysts. The Ni (200) and Ni (220) facets are expected to appear at 51.85° and 76.37°, respectively. All the catalysts are characterized by the presence of hydrated nickel hydroxide Ni(OH)2·0.75H2O (ICDD, #00-038-0715) or nickel oxyhydroxide Ni5O(OH)9 (ICDD, #00-027-0340) phase. These phases can be ascribed to the surface oxidation of the catalysts, which potentially may block the electrochemically active surface (see the section below). According to the XPS analysis (Figure S8, Supplementary Materials), the surface of Ni is predominantly oxidized to NiO, Ni2O3 and Ni(OH)2 with the ratio of metallic Ni between 4.5 to 18 at.% (Table S3, Supplementary Materials). Copper phase in Ni3Cu1/C is partially oxidized forming Cu2O (ICDD, #00-005-0667), which is in an agreement with the XPS data (Figure S7a, Supplementary Materials). The crystallite sizes of metallic copper are ca. 22 nm, which is comparable to the catalyst particle sizes (Figure S1, Supplementary Materials). Shale-up satellites of copper for Ni3Cu1/C catalyst (Figure S7a, Supplementary Materials) are characteristic of divalent Cu, whereas monovalent Cu has no satellites [57]. The peak at 953.0 can correspond to all three components: Zerovalent Cu (Cu 2p1/2 at 952.6 eV) [58], monovalent (Cu 2p1/2 at 952.7 eV) [59] or divalent Cu (Cu 2p1/2 at 952.5 eV) [60], as well as the peak at ca. 933 eV. High resolution XPS spectrum for Ni3Fe1/C (Figure S7b, Supplementary Materials) shows three distinguishable peaks: A peak of the highest intensity at binding energy (BE) ~712–714 eV which could be ascribed to Fe3+ salts, but most probably arises from Ni LMM Auger peak (712 eV), overlapping with Fe 2p3/2. The peak of low intensity at 707.9 eV corresponds to metallic Fe [61]. The broad peak at ca. 725 eV can be ascribed to either Fe2O3 (Fe 2p1/2 at 724 eV) [62], or FeOOH (Fe 2p1/2 at 724.3 eV) [62], or Fe3O4 (Fe 2p1/2 at 723.5 eV) [62]. It is more challenging to determine the concentration and chemical shifts of cobalt for Ni3Co1/C, since Co 2p3/2 is close to Ni LMM structure and Co 3p spectrum overlaps with the one for Ni 3p.
The XRD patterns registered on the as-synthesized Ni3TM1/C catalysts cannot provide clear evidence of metal alloying. Therefore, thermal treatment at 450 °C in reducing atmosphere was used as an indirect indication of the presence of several metallic phases in the as-synthesized materials. The XRD patterns deconvolution for the heat-treated Ni3Fe1/C (Figure S6d, Supplementary Materials) and Ni3Cu1/C (Figure S6c, Supplementary Materials) have shown a splitting of the reflections into two peaks. One of them can be ascribed to the alloy phases enriched by Ni and by the other—to the second transition metal. For instance, the reflections of Ni3Cu1/C at the 2θangles of 44.16, 51.45 and 75.92 are close to those for the alloy Ni3Cu1 (ICDD, #04-004-4502), whereas the set of the facets at 43.96, 51.41 and 75.68 is shifted to the metallic Cu (ICDD, #00-004-0836) and may correspond to the Cu-rich Ni-Cu alloys.
Thus, chemical reduction of the inorganic precursors on carbon support using sodium borohydride as the reducing agent results in the formation of near-spherical nanoparticles with poor crystallinity and the average particle size of ca. 10 nm. In the binary Ni3TM1/C catalysts, heterogeneous co-distribution the metallic components was observed, with partially separated areas of Cu2O in Ni3Cu1, and segregation of Ni on the surface for all the samples. Homogeneity of the metallic components co-distribution in the bulk of the as-synthesized catalysts and the separation of the XRD reflexes after the thermal treatment at 450 °C illustrates that the binary Ni3TM1/C catalysts are predominantly composites—mechanical mixtures of either Ni with TM, or mixture of several NixTMy alloys.
2.3. Electrochemical Characterization
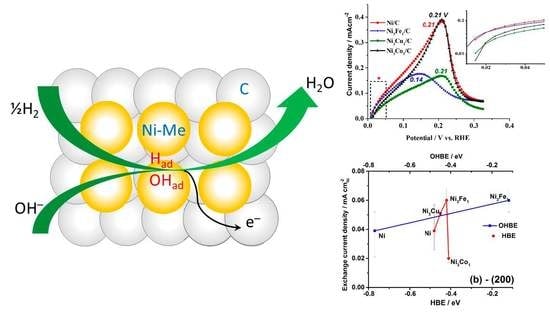
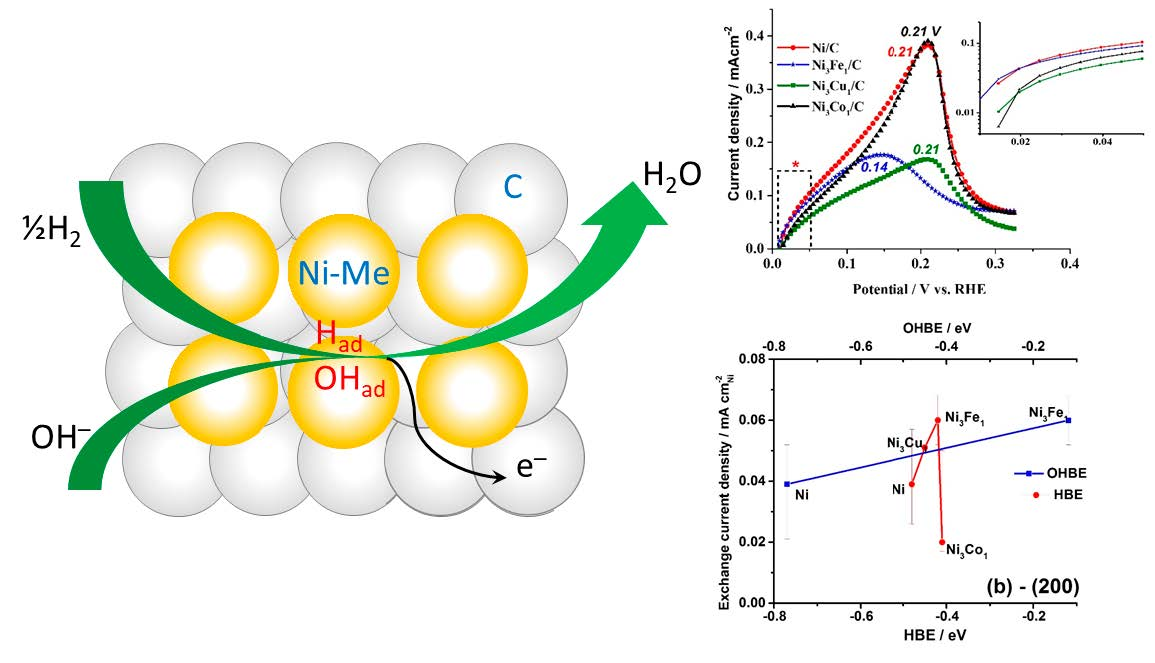
Figure 2a shows the first several cycles of the HOR polarization curves (solid lines) on the Ni/C catalyst and compares them with the corresponding cyclic voltammogram recorded in Ar atmosphere (dashed line). Opposed to the behavior of the TM-doped catalysts, bare Ni shows a significant increase of the catalytic activity after the first HOR cycle (Figure 2a), namely after the partial electrochemical oxidation of the surface. The positive effect of the surface pre-oxidation on the Ni catalytic activity in HOR was also reported previously [52,63]. This observation might serve as direct experimental evidence of the bifunctional mechanism of HOR [26,50,64,65,66,67] when OHad species, pre-chemisorbed on the adjacent active sites, are required in order to remove Had chemisorbed on the free metallic surface of Ni, and to make the hydrogen oxidation reaction proceed. Thus, presumably a certain optimal ratio of Ni(OHad)/Ni(Had) sites is needed to retain the HOR activity of bare Ni electrocatalyst. Therefore, the theoretical estimations of HBE and OHBE, provided in Figure 1a,b, might shed some light on the understanding of the competitive co-adsorption of H and OH species (see Section 2.1). Noteworthy, Ni3TM1 catalysts do not require a preliminary electrooxidation cycle, which might be related either to the fact that the presence of TMs with higher affinity to oxygen (such as Cu [68], Co [69] and Fe [69]) stabilizes the oxygenated species on the surface of Ni, or the TMs serve by themselves as the active sites for formation of OHad species. In any case, an important theoretical question arises: Would a hypothetical surface with the optimal value of HBE (discussed earlier) and no affinity to chemisorption of OH species catalyze HOR in alkaline media? Might it be the case that PGMs (e.g., Pt, Ir, Rh) show two orders of magnitude lower catalytic activity in HOR in alkaline media compared to acidic ones [45,49,56], because in the potential range of hydrogen electrooxidation the surfaces produce a negligibly low ratio PGM(Had)/PGM(OHad)? The doping of PGMs by TMs with high affinity to chemisorption of OH species was shown to result in the HOR catalysis promotion [67,70,71]. However, this subject is beyond the scope of this work.
HOR polarization curves in the potential range of 0–0.4 V, presented in Figure 3a,b, show electrocatalytic behavior of Ni/C, Ni3Fe1/C, Ni3Co1/C and Ni3Cu1/C typical for polycrystalline Ni [51], or TM doped Ni electrocatalysts [34]. For all the catalysts, during the forward scan (Figure 2a,b), a peak of HOR is observed, with the current increasing up to certain potential values (see the peak potential values in Figure 2b). Further, the surface deactivates with the increase of the potential due to the increasing surface electrooxidation, and at E > 0.4 V there is no catalytic activity in HOR. A similar effect was observed in HOR for Ru/C [72] due to the competitive adsorption of H2 and OH−. On the backward scan, the surface of the catalysts reactivates, due to the reversible electrochemical reduction of Ni (see black solid and dashed circles marking the onset of HOR and Ni electroreduction, respectively, on the backward scans).
The analysis of the HOR kinetics in the micropolarization area (0.01–0.05 V) reveals a clear effect of the dopant on the exchange current density: At the comparable values of the electrochemical surface area (ECSA), bare Ni/C shows 0.039 mA cm−2Ni (Table 1), whereas addition of Fe, for instance, results in a significant reaction promotion with 0.06 mA cm−2Ni, which in turn positively affects mass specific activity, 1.6 A g−1Ni vs. 1.87 g−1Ni (Table 1). The i0 values reported in this work exceed the highest i0 values reported earlier in the literature, for instance, 0.028 mA cm−2Ni for hydrothermally synthesized 70% Ni/N-CNT [28], or 0.027mA cm−2Ni for thermally reduced 50% Ni9Mo1/C [34] and 0.025 mA cm−2Ni for 50% Ni9.5Cu0.5/C [73], showing that chemical reduction might be a promising approach for the further development of Ni-based catalysts. However, overall catalyst mass activity of our catalysts is lower (0.35–0.55 A g−1cat) for the binary electrocatalysts compared to the bare Ni/C (0.6 A g−1cat), due to the high concentration of the catalytically inert TMs. The mass catalytic values are lower (6.5 A g−1cat for 70%Ni/N-CNT [28], 3.54 A g−1cat for the electrodeposited CoNiMo [29], 2.9 A g−1cat for 50% Ni9Mo1/C [34]) or comparable (0.94 A g−1cat for 25% Ni9.5Cu0.5/Vulcan XC72 [37]) to the published ones. In previous works, the authors have applied preliminary electrochemical reduction of the surface, which allowed increasing the surface area up to 10–20 m2 g−1Ni. In our work, we have intentionally avoided the preliminary reduction step in order to demonstrate that carbon supported nanoparticles synthesized via simple chemical reduction method at ~0 °C can be handled in ambient atmosphere, and they can still retain their electrocatalytic activity, opposed, for instance, to the thermally obtained Ni-based electrocatalysts [34].
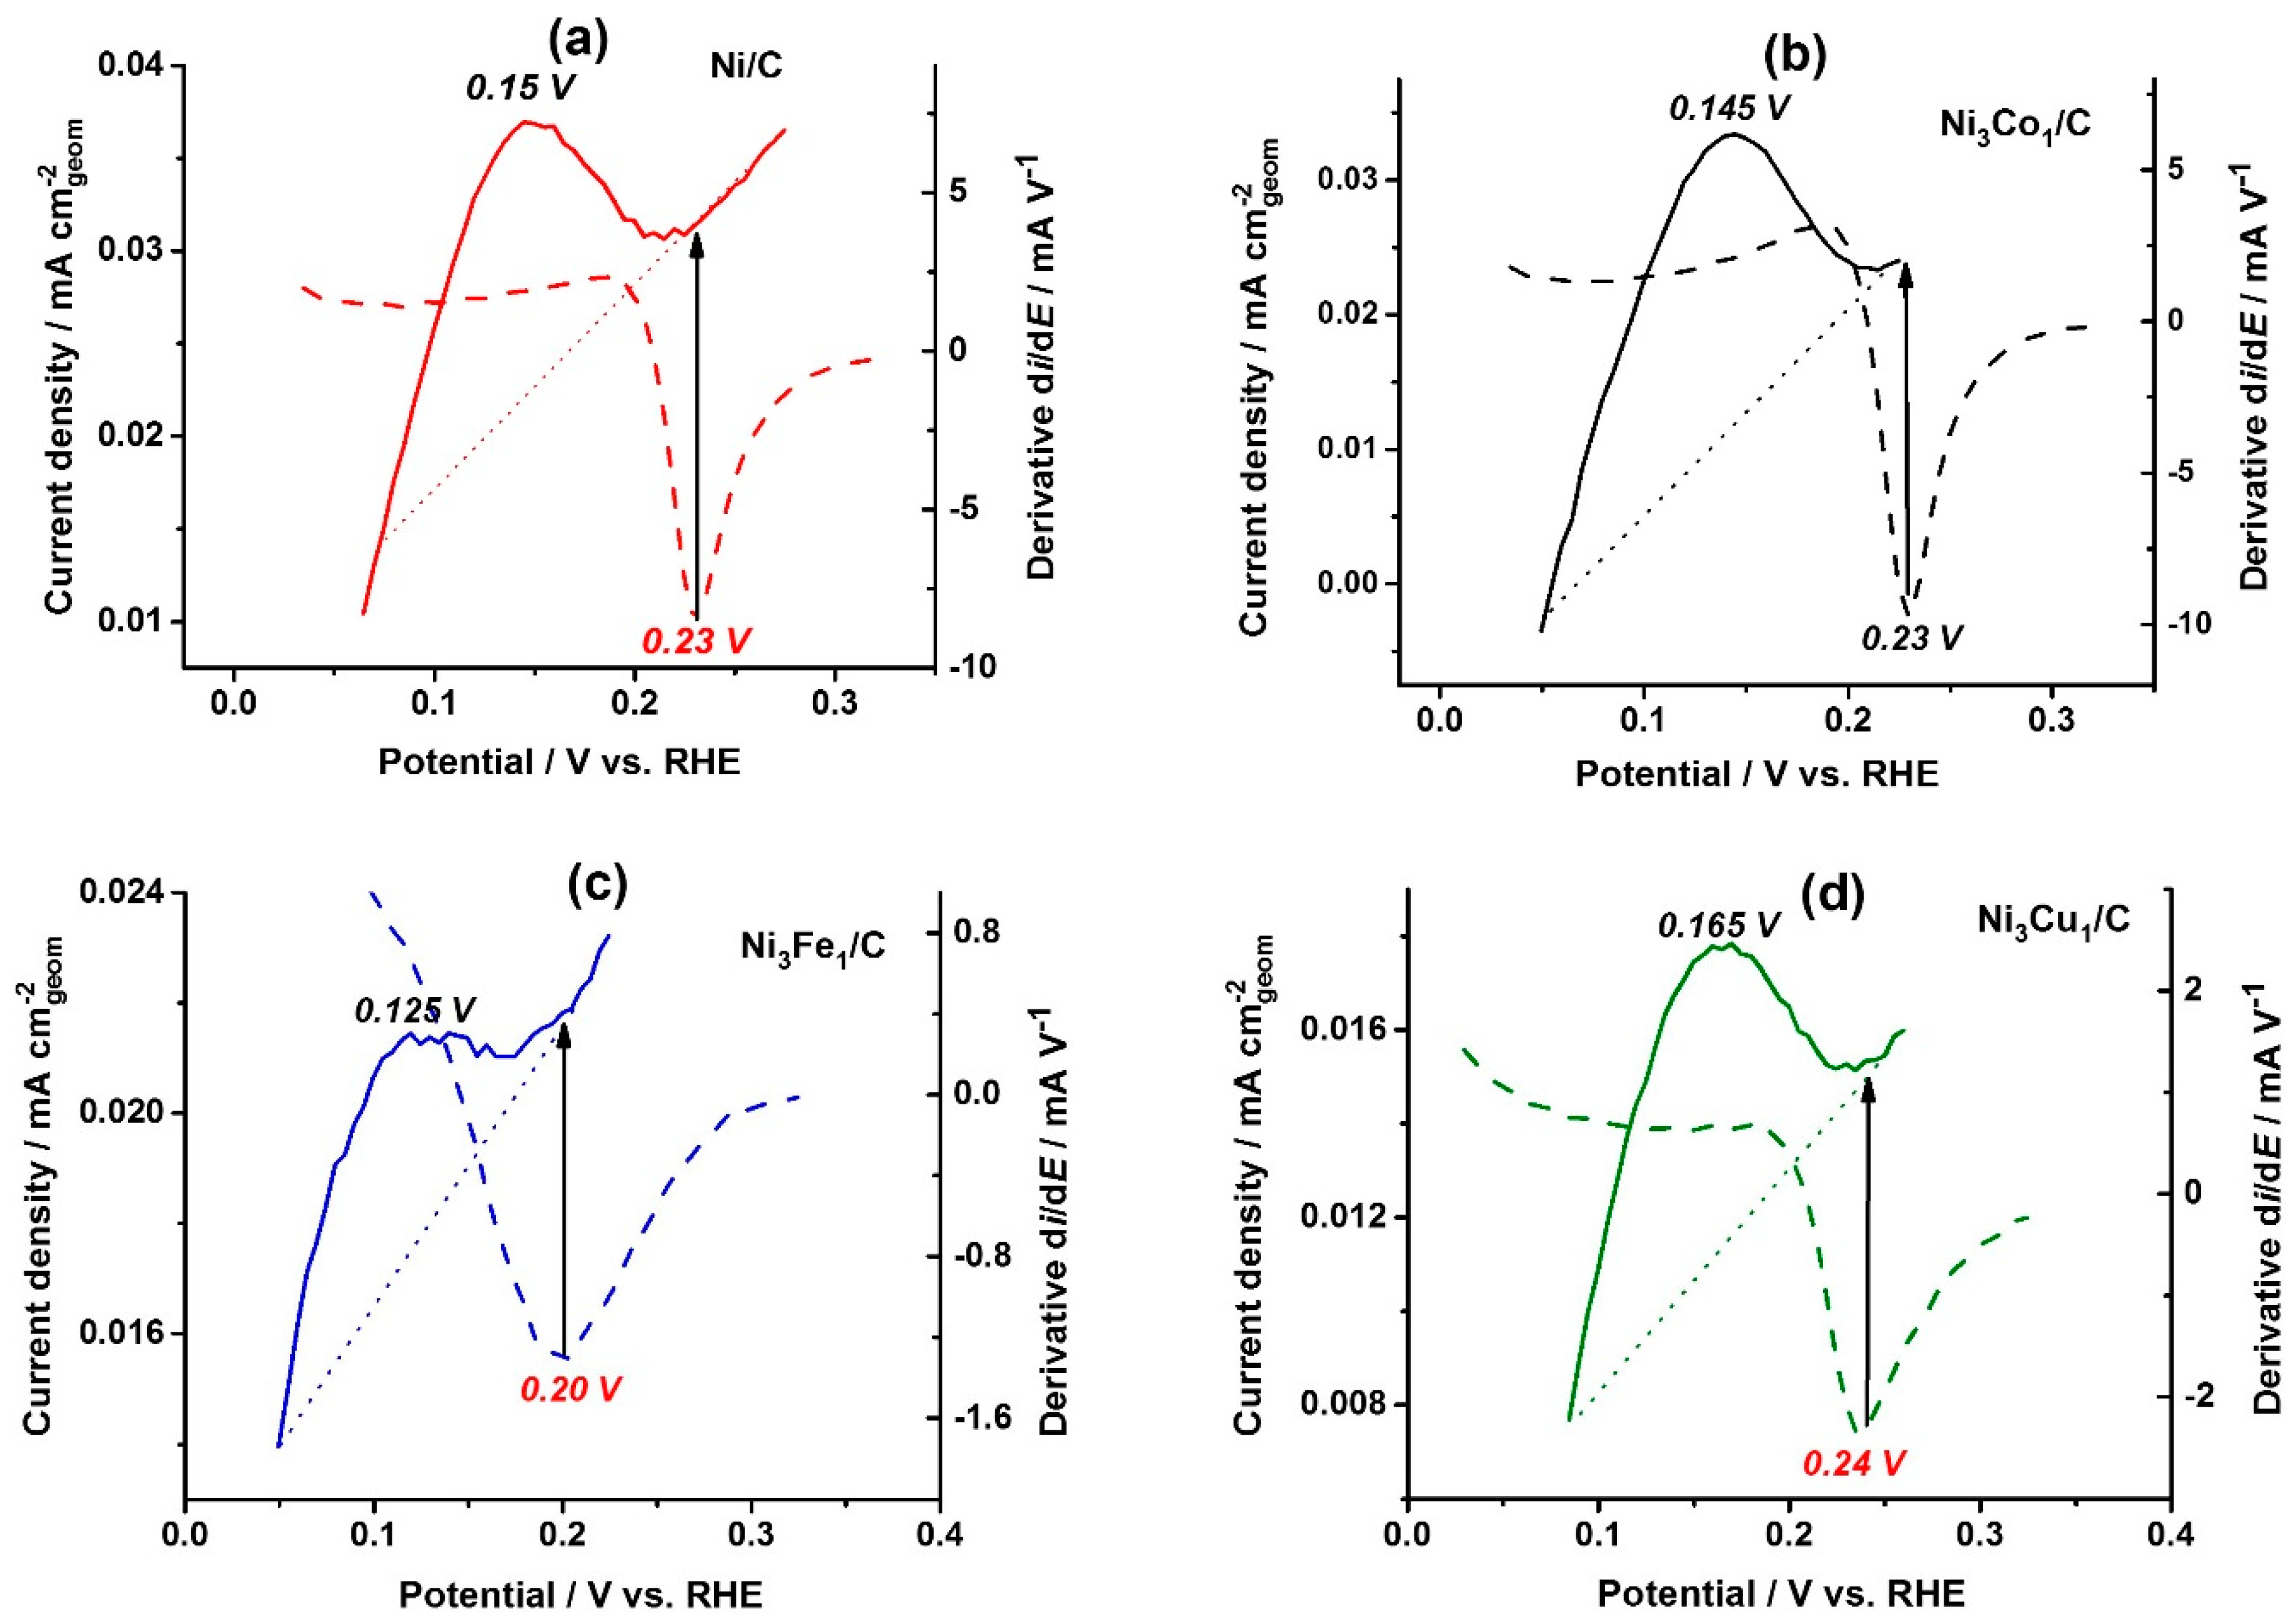
Figure 3a–d shows the linear potential stripping (solid lines) for the catalysts under Ar atmosphere at the same potential sweep rate (1 mV s−1) used to record the HOR polarization curves, and the corresponding derivatives of the HOR polarization curves (dashed lines), for all the catalysts. The charge consumed for the full surface coverage by Ni(OH)2 (the area under the solid line peaks,) was used to estimate ECSA of Ni. The ECSA values are presented in Table 1. Extremely low ECSA values were obtained in all catalysts (< 2 m2 g−1Ni compared to the expected ~ 70 m2 g−1Ni based on TEM images, Figure S1, Supplementary Materials), which are probably due to the oxidative surface passivation evidenced by EDS (Table S1, Supplementary Materials) and XPS (Tables S1 and S3, Figure S8, Supplementary Materials).
The HOR polarization curves (Figure 2b) were differentiated, and the potential values corresponding to the minimum of the derivatives (dashed lines, Figure 3a–d) were used as one of the catalyst characteristic parameters, showing the potential of the catalytic activity loss. As seen from Figure 3a–d, the potentials of the derivative minimum (marked in red: 0.23, 0.23, 0.20 and 0.24 V for on the bare Ni/C, Ni3Co1/C, Ni3Fe1/C, and Ni3Cu1/C, respectively) correspond to the full surface coverage (indicated by black arrows). Full surface coverage by monolayer of Ni(OH)2 on the bare Ni/C, Ni3Co1/C and Ni3Cu1/C takes place at more anodic potential (0.23, 0.23 and 0.24 V, respectively, Figure 3a,b,d), whereas the surface of Ni3Fe1/C is fully covered already at 0.20 V (Figure 3c). The peak potential of Ni3Fe1/C electrooxidation (solid line, Figure 3c), 0.125 V, is negatively shifted as well compared to Ni/C (Figure 3a), Ni3Co1/C (Figure 3b) and Ni3Cu1/C (Figure 4d). Thus, Ni-Fe catalysts are prone to the higher OHad coverage at lower overpotentials, which results in higher HOR catalytic activity at lower overpotential values (Figure 3b, insert).
Figure 4a shows the general trend of decrease in exchange current density values with the HBE value increase for the facet (111), whereas the opposite trend is expected (see Section 2.1. Theoretical prediction). At the same time, the expected catalytic activity increase is observed with the increase of HBE for the facets (200) and (220) (Figure 4b,c). This observation might indicate that the catalytic activity is predominantly determined by higher index surfaces, (200) and (220). Figure 5a,b also show that io increases as OHBE values increase. The latter observation might serve as indirect evidence of the bifunctional mechanism of the HOR hypothesized earlier in different studies [25,26,64] explaining the promotion effect of the dopants on the HOR kinetics. According to this bifunctional mechanism, there is a need for more than the conventional HBE indicator to describe the HOR in alkaline [22]—the OHBE indicator may bring the missing parameter to clearly understand the HOR kinetics and mechanism.
This study provides an initial thought supported with some first data on HBE and OHBE, both as important parameters to describe the electrocatalytical activity of Ni-based catalysts towards HOR in alkaline medium. Further DFT calculations and experimental studies of specifically Ni-TM facets are needed to increase this understanding.
3. Materials and Methods
3.1. Computational Details
Spin-polarized DFT calculations were performed with the Vienna Ab Initio Simulation Package (VASP) [74,75]. We use the Perdew−Burke−Ernzerhof (PBE) [76] of the general gradient approximation (GGA) exchange-correlation functional in all computational calculations. This functional describes well all the chosen transition metal alloys [77,78,79,80]. Projected augmented wave (PAW) potentials [81,82] represented frozen core electrons and nuclei for each atom. For the whole first row 3d TM, including Sc, Ti, V, Cr, Mn, Fe, Co, Ni, Cu and Zn atoms, the appropriate PAW potentials for inner shell electrons are replaced with Ar’s electronic configuration. Kohn-Sham (KS) equations were solved with a plane-wave basis. Symmetry operations were imposed for a better description of the geometry. k-space integration was performed with the tetrahedron method with Blöchl corrections [82].
We used a k-mesh of 3 × 3 × 1 in the Monkhorst−Pack scheme and an energy cutoff of 400 eV for the plane-wave basis set. These k-grids and energy cutoffs were converged to a total energy lower than 1 meV atom−1. For all of the calculations, we relaxed the cells using convergence criteria of 10−5 eV for electronic iterations and of 0.01 eV Å−1 for ionic iterations. Geometrical relaxations took place with a conjugate gradient algorithm [83]. All slabs were separated from their periodic image by a minimum of 16 Å vacuum layers, which is converged the total energy up to 0.1 meV atom−1.
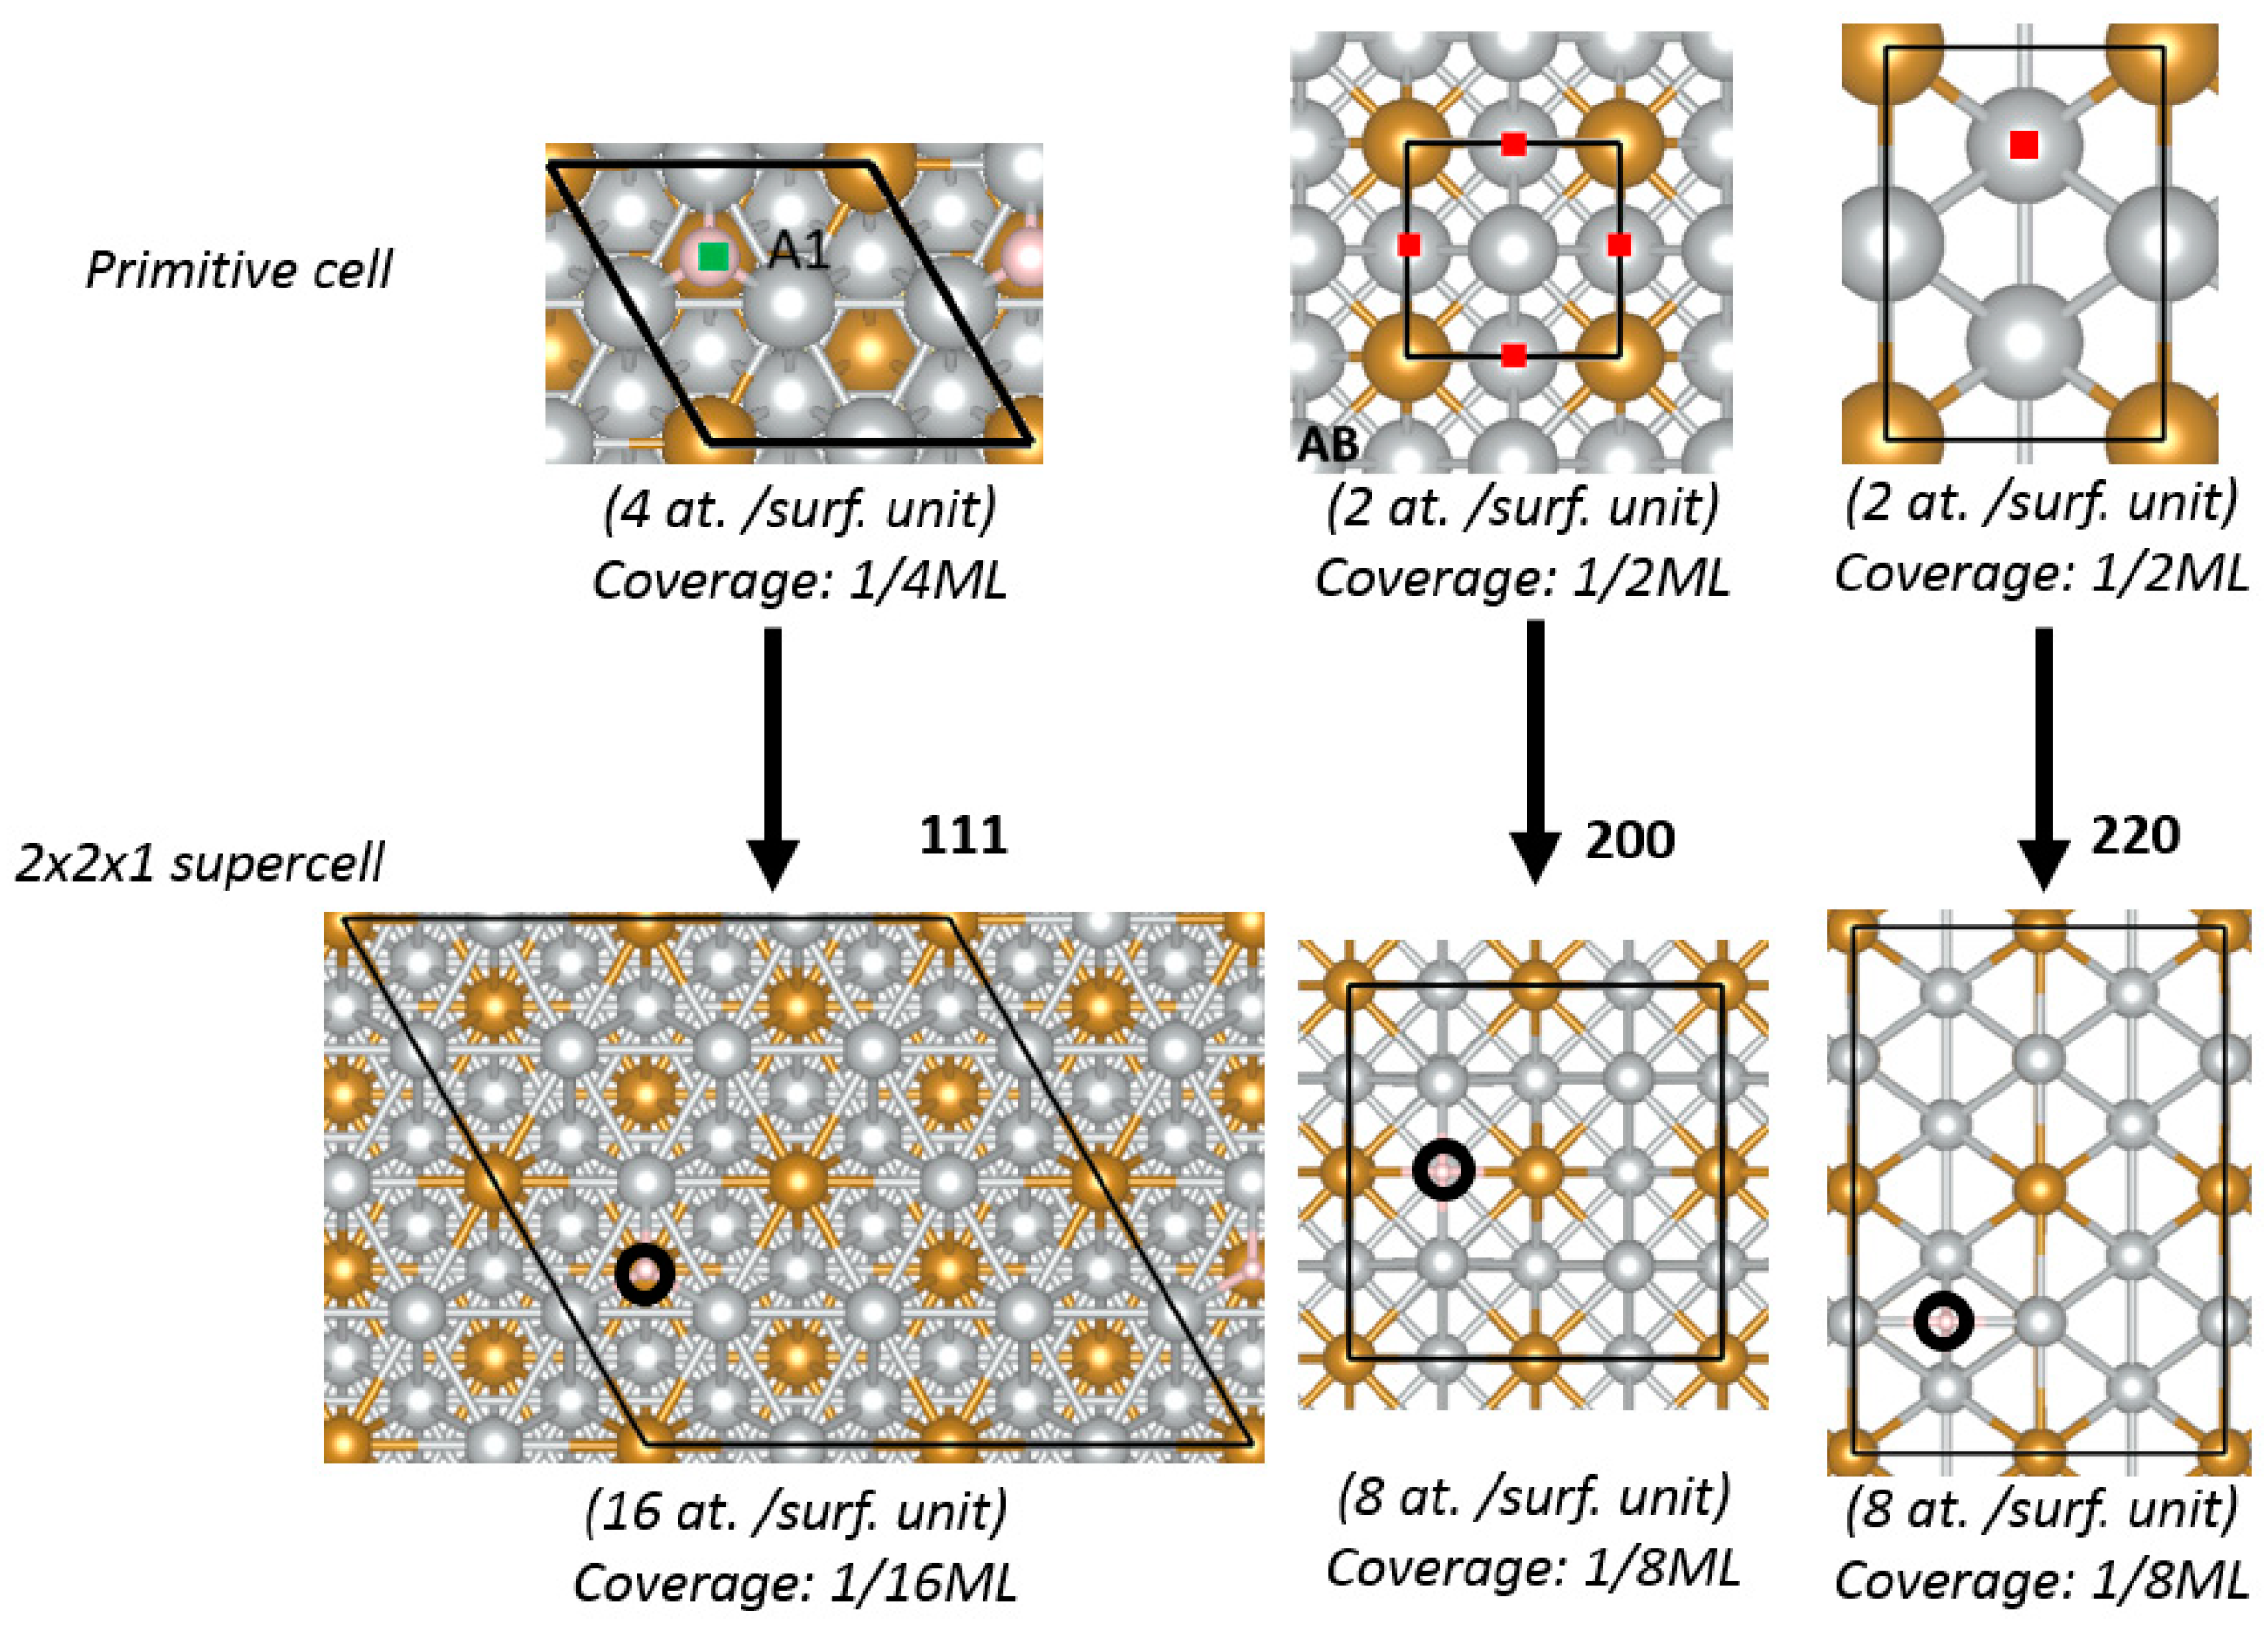
The unit cells of the catalytic materials were built with 25% of TM (i.e., atomic ratio Ni:TM = 3:1), with an FCC structure. We considered three facets that have been experimentally observed in the XRD patterns (Figures S5 and S6, Supplementary Materials) of the electrocatalysts: Ni3TM1 facets (111), (200), and (220). The (111) and (200) facets were modeled by a five-layer slab, while the (220) facet needed seven layers to converge the calculated adsorption energies. The hydrogen and OH adsorbate coverage corresponds to a low coverage of 1/16 monolayer (ML) for (111) and 1/8 ML for (200) and (220) surfaces, with supercell size of 2 × 2 × 1 (see Figure 5). The adsorbed hydrogen atoms and the top three layers of the slab were fully relaxed during energy relaxation by selecting several initial hydrogen positions and performing geometry optimization, until forces on all atoms reached the convergence threshold of 0.01 eV Å−1. The rest of the atoms in the slab were fixed on its bulk lattice configuration since adding more atoms gave the same hydrogen binding energies. The most stable H adsorption sites found for Ni3Fe1 were adopted and used for all the Ni3TM1 systems. All the optimized ground state structures of bare and adsorbed hydrogen surfaces of 1 × 1 primitive cells and 2 × 2 × 1 sized supercell are listed in the Supplementary Materials.
3.2. Catalyst Synthesis
Monometallic Ni/C and bimetallic Ni3TM1/C carbon-supported electrocatalysts were synthesized via the chemical reduction method at 0 °C, using sodium borohydride as the reducing agent. To synthesize monometallic catalyst, 100 mg of VXCMAX22 (Cabot, Boston, MA, USA) carbon black, noted as C, was suspended in 15 mL of isopropanol (HPLC Plus GC, 99.9%, Sigma Aldrich, St. Louis, MI, USA) in the ultrasound bath (XUBA3, Grant Instruments, Cambridge, UK) and then mixed with 15 mL aqueous solutions containing 1.7 mmol of NiCl2·6H2O (99.3%, Alfa Aesar, Ward Hill, MA, USA). The mixture was cooled down in the ice-bath and deaerated by flowing Ar (99.999%, Maxima, Ashdod, Israel). For the synthesis of bimetallic Ni3TM1/C catalysts, 15 mL of the solutions containing 0.567 mmol of either FeCl2·4H2O (99.95%, Sigma Aldrich), or CoCl2·6H2O (99.99%, Alfa Aesar), or CuSO4·5H2O (for analysis, Merck, Kenilworth, NJ, USA) were added to the carbon-NiCl2 mixture. The intended weight ratio of nickel to carbon in monometallic Ni/C catalyst was 0.5-to-0.5. The same Ni-to-C weight ratio was kept for the bimetallic Ni3TM1/C catalysts, where the atomic ratio of Ni-to-TM was 3-to-1. Ice-cold solution containing 3.4 mmol of NaBH4 (99.99%, Sigma Aldrich) in 25 mL of 0.1 M KOH (AR, Bio-Lab Ltd., Jerusalem, Israel) was used as the reducing agent. The reduction of the metal precursors was carried out in the ice bath by dropping NaBH4 solution into the mixture while stirring. The precipitates were separated in the centrifuge (Eppendorf 5804, Hamburg, Germany). After being rinsed by milli-Q H2O (18.2 MΩ × cm) five times at 10,000 rpm for 10 min, the samples were placed in the vacuum oven (1407-2, MRC, Holon, Israel) at r.t. and then dried at 80–90 °C for 24 h. Before removing the samples from the vacuum, the oven was cooled back to room temperature. The samples were stored in a desiccator under vacuum and handled in the ambient air.
3.3. Physical and Chemical Characterization
TEM images were obtained on FEI Tecnai T20 LaB6 microscope operated at 200 kV. Catalyst powders were dispersed in isopropanol (2 mgcat per 10 mL) in ultrasound bath for 2 h, spray-casted onto a 300 mesh Cu grid coated with holey carbon (300 mesh, Agar Scientific, Stansted, UK), and then left to dry on the TEM grids at room temperature.
EDS spectra, STEM images and elemental mapping were collected on Zeiss Ultra-Plus HRSEM. EDS spectra were measured at accelerating voltages in the range of 5–15 kV with the data collecting time 50–150 s. STEM element mapping was done at 30 kV on holey carbon 200 mesh Cu TEM grids (Agar Scientific) with the applied catalysts.
XRD data were collected using Rigaku Smartlab diffractometer with Cu X-ray source (λ = 1.5406 Å). XRD patterns were recorded in medium resolution parallel beam geometry at the tube current of 100 mA and tube voltage of 35 kV in θ/2θ scan mode with the scan rate of 1 deg. min−1 and step0.01 deg. The structural data were compared to the ICDD database. Crystallite sizes were estimated using Scherrer’s equation [84].
XPS measurements were performed in ultra-high 2.5 × 10⁻¹⁰ Torr base pressure) using a 5600 Multi-Technique System (PHI, Chanhassen, MN, USA). The samples were irradiated with an AlKα monochromated source (1486.6 eV) and the outcome electrons were analyzed by a Spherical Capacitor Analyzer using a slit aperture of 0.8 mm. Survey spectra were registered in a wide energy range (0–1400 eV) at a low resolution. Utility multiplex spectra were taken for different peaks in a low energy range window at an intermediate (utility) resolution. Atomic concentration was calculated for all the elements present. Atomic concentration calculation accuracy was ±2, ±5, ±10 and ±20% for atomic concentrations around 50%, 20%, 5% and 1%, respectively.
3.4. Electrochemical Characterization
Rotating disc electrode (RDE) method and cyclic voltammetry (CV) were applied to characterize the electrochemical properties of the catalysts using WaveDriver 20 Bipotentiostat/Galvanostat (Pine Research). For RDE tests, Nafion was used as only ionomer, to avoid surface adsorption effects of other ionomers onto the catalysts under study [85]. For these tests, 10 mg of the catalyst was suspended in 2 mL of isopropanol/water mixture (3/1 vol.). Nafion (10 wt.% in H2O, ρ = 1.05 g mL−1, Sigma Aldrich) was added to the catalyst to get a Nafion/catalyst weight ratio of 0.15/1. The suspension was then drop-casted on glassy carbon disc (5.0 mm, PTFE shroud, Pine Research) to form a catalyst layer with a loading of 200 μgcat cm−2. The electrode was dried in the air for about1 h and mounted on the rotating shaft. The experiments were conducted at 25 °C in 1 M KOH aqueous solution in a water-jacketed electrochemical cell. Pt wire (Pine Research) isolated in a glass-fritted tube was used as the counter electrode. All the potential values were registered vs. Hg/HgO/1 M KOH (RE-61AP, ALS Co., Tokyo, Japan).
Taking into account electrochemical properties of Ni, the following experimental protocol was elaborated using RDE and CV methods. Before immersing the working electrode into the electrolyte, it was purged by H2 (electrolyzer SPH-500, H2 purity 99.999%, H2 flow 0–500 mL min−1, Jinan Mao An Instrument Co., Ltd., Jinan, China) until the open circuit potential stabilized. The potential was then scanned repeatedly (up to 5 cycles) in the potential range between 0 V and 0.4 V vs. RHE, with the sweep rate of 1 mV s−1 and at a rotation speed of 1100 rpm, to register the HOR polarization curves. The values of exchange current density (i0) were calculated in the micropolarization potential range applying Equation (1) [50]:
where αa and αc are the anodic and cathodic transfer coefficients, respectively, i is catalytic activity averaged for the range of overpotential values (η) between 5 to 50 mV (in A cm−2Ni), T is the temperature of the electrolyte (K), R is the gas constant and F is the Faraday constant. Afterwards, the gas flow was changed to Ar until the open circuit potential was stabilized, and then the potential was swept in the potential range between 0 V and 0.4 V vs. RHE at the rate of 1 mV s−1. The anodic peak was integrated and used as the in situ method to determine the electrochemical active surface area of Ni with the specific charge density of 514 μC cm−2Ni [28].
4. Conclusions
Carbon supported nanoparticles of monometallic Ni catalyst and binary Ni-Transition Metal electrocatalytic composites were synthesized via chemical reduction method. Different TM dopants (Fe, Co and Cu) were studied in this work. The chemical composition, structure and morphology of the materials were characterized and related to the electrochemical properties towards HOR in alkaline medium. For the first time, both HBE and OHBE values were calculated for this kind of catalysts. DFT calculations showed the significant effect of the dopant TM onto the HBE and OHBE values of the different Ni-TM catalysts, which in turn affects their exchange current densities. It is proposed that both HBE and OHBE parameters will be used as the indicators of the electrocatalytic activity of Ni-TM catalysts towards a better understanding of these catalysts for the electrooxidation of hydrogen in alkaline medium.
A significant role of the dopant TM in the promotion of the hydrogen electrooxidation kinetics of the binary Ni-TM/C composites was revealed. A record-high in exchange current density value, 0.060 mA cm2Ni, was observed for Ni3Fe1/C. We therefore suggest that Ni-Fe/C could be a promising catalyst for HOR in alkaline media. Development of synthesis approaches and corresponding conditions to minimize surface oxidation of the metallic Ni in the Ni-TM/C materials may lead to the development of highly active HOR catalysts for PGM-free AEMFCs.
Supplementary Materials
The following are available online at https://0-www-mdpi-com.brum.beds.ac.uk/2073-4344/8/10/454/s1, Figure S1. (a) Electron microscopy images of Ni3Fe1 catalyst; (b) Particles size distribution for Ni3Fe1 catalyst; Figure S2. STEM images of Ni3Co1/C: (a) Electron image; (b) Element map overlapping: Ni: red; Co: green; Ni + Co: yellow/orange; (c) Element mapping of Ni; (d) Element mapping of Co; Figure S3. STEM images of Ni3Cu1/C: (a) Electron image; (b) Element map overlapping: Ni: red; Cu: green; Ni + Cu: yellow/orange; (c) Element mapping of Ni; (d) Element mapping of Cu; Figure S4. STEM images of Ni3Fe1/C: (a) Electron image; (b) Element map overlapping: Ni: red; Fe: green; Ni + Fe: yellow/orange; (c) Element mapping of Ni; (d) Element mapping of Fe; Figure S5. The main reflections of the XRD patterns for the as-synthesized monometallic Ni/C catalyst and bimetallic Ni3TM1/C composites; Figure S6. The main reflections of the XRD patterns for monometallic Ni/C catalyst and bimetallic Ni3TM1/C composites after the thermal treatment at 450 °C in the mixture of 10% H2/Ar; Figure S7. HR-XPS spectra for Cu of the catalyst Ni3Cu1/C (a) and Fe of the catalyst Ni3Fe1/C (b); Figure S8. Deconvolution of HR-XPS spectra of Ni 2p3/2; Table S1. Elemental composition of the catalysts (in at.%) based on the EDS and XPS data; Table S2. Elemental composition of the catalysts (in wt.%) based on the EDS data; Table S3. Elemental composition of the catalysts (in at.%) based on the HR-XPS Ni2p3/2 spectra deconvolution.
Author Contributions
Synthesis, electrochemical measurements, TEM, SEM, STEM, XRD, data analysis, writing and editing, E.S.D.; Funding acquisition, supervision, review and editing, D.R.D.; DFT HBE calculations, J.Z.; DFT OHBE calculations, K.D.; DFT supervision, DFT funding acquisition, review and editing, M.C.T.
Funding
This work was partially funded by the Nancy & Stephan Grand Technion Energy Program (GTEP); by the European Union’s Horizon 2020 research and innovation program [grant No. 721065]; by the Ministry of Science, Technology & Space of Israel through the M.Era-NET Transnational Call 2015, NEXTGAME project [grant No. 3-12940] and through grant No. 3-12948; by the Israel Science Foundation (ISF) [grant No. 1481/17]; by the Russell Berrie Nanotechnology Institute, Technion; and by the Planning & Budgeting Committee/ISRAEL Council for Higher Education (CHE) andFuel Choice Initiative (Prime Minister Office of ISRAEL), within the framework of “Israel National Research Center for Electrochemical Propulsion (INREP)”. This research was also partially carried out within the framework of the UConn-Technion Energy Collaboration initiative, supported by the Satell Family Foundation, the Maurice G. Gamze Endowed Fund (at the American Technion Society), Larry Pitt and Phillis Meloff, The Eileen and Jerry Lieberman UConn/Israel Global Partnership Fund and the Grand Technion Energy Program (GTEP).
Conflicts of Interest
The authors declare no conflict of interest.
Appendix A

Table A1.
Ground state energies of bare metal/alloy and one with hydrogen at (111) facet (1/16 ML) supercell 2 × 2 × 1 and calculated HBE (all energies are in eVs).
Table A1.
Ground state energies of bare metal/alloy and one with hydrogen at (111) facet (1/16 ML) supercell 2 × 2 × 1 and calculated HBE (all energies are in eVs).
| Material | Bare (111) Facet | Surface with Hydrogen | HBE/eV |
|---|---|---|---|
| Ni3Sc1 | −465.27 | −469.42 | −0.77 |
| Ni3Ti1 | −498.92 | −503.16 | −0.86 |
| Ni3V1 | −500.72 | −504.57 | −0.47 |
| Ni3Cr1 | −496.02 | −500.10 | −0.70 |
| Ni3Mn1 | −494.24 | −498.32 | −0.69 |
| Ni3Fe1 | −479.68 | −483.64 | −0.58 |
| Ni3Co1 | −447.09 | −450.93 | −0.45 |
| Ni bare | −414.05 | −417.97 | −0.54 |
| Ni3Cu1 | −380.83 | −384.90 | −0.68 |
| Ni3Zn1 | −344.05 | −348.73 | −1.29 |
Table A2.
Ground state energies of bare and with hydrogen at (200) facet (1/8 ML) supercell 2 × 2 × 1 and calculated HBE (all energies are in eVs).
Table A2.
Ground state energies of bare and with hydrogen at (200) facet (1/8 ML) supercell 2 × 2 × 1 and calculated HBE (all energies are in eVs).
| Material | Bare (200) Facet | Surface with Hydrogen | HBE/eV |
|---|---|---|---|
| Ni3Sc1 | −236.96 | −240.79 | −0.44 |
| Ni3Ti1 | −251.89 | −255.84 | −0.57 |
| Ni3V1 | −251.01 | −254.94 | −0.55 |
| Ni3Cr1 | −251.46 | −255.31 | −0.47 |
| Ni3Mn1 | −251.86 | −255.78 | −0.54 |
| Ni3Fe1 | −241.93 | −245.73 | −0.42 |
| Ni3Co1 | −222.10 | −225.89 | −0.41 |
| Ni bare | −203.61 | −207.47 | −0.48 |
| Ni3Cu1 | −184.70 | −188.53 | −0.45 |
| Ni3Zn1 | −164.37 | −167.95 | −0.19 |
Table A3.
Ground state energies of bare and with hydrogen at (220) facet (1/8 ML) supercell 2 × 2 × 1 and calculated HBE (all energies are in eVs).
Table A3.
Ground state energies of bare and with hydrogen at (220) facet (1/8 ML) supercell 2 × 2 × 1 and calculated HBE (all energies are in eVs).
| Material | Bare (220) Facet | Surface with Hydrogen | HBE/eV |
|---|---|---|---|
| Ni3Sc1 | −328.56 | −332.63 | −0.69 |
| Ni3Ti1 | −349.00 | −352.35 | 0.04 |
| Ni3V1 | −349.56 | −353.17 | −0.22 |
| Ni3Cr1 | −349.75 | −353.55 | −0.42 |
| Ni3Mn1 | −349.44 | −353.30 | −0.47 |
| Ni3Fe1 | −335.65 | −339.40 | −0.37 |
| Ni3Co1 | −309.08 | −312.82 | −0.35 |
| Ni bare | −283.84 | −287.67 | −0.45 |
| Ni3Cu1 | −258.57 | −262.44 | −0.49 |
| Ni3Zn1 | −230.78 | −234.80 | −0.64 |
Table A4.
Ground state energies of bare and with OH at (111) facet (1/16 ML) supercell 2 × 2 × 1 and calculated OHBE (all energies are in eVs).
Table A4.
Ground state energies of bare and with OH at (111) facet (1/16 ML) supercell 2 × 2 × 1 and calculated OHBE (all energies are in eVs).
| Material | Bare (111) Facet | Surface with OH | OHBE/eV |
|---|---|---|---|
| Ni3Cr1 | −496.02 | −506.77 | −0.35 |
| Ni3Mn1 | −494.24 | −504.68 | −0.04 |
| Ni3Co1 | −447.09 | −458.05 | −0.57 |
| Ni bare | −414.05 | −424.99 | −0.54 |
| Ni3Cu1 | −380.83 | −391.58 | −0.34 |
Table A5.
Ground state energies of bare and with OH at (200) facet (1/8 ML) supercell 2 × 2 × 1 and calculated OHBE (all energies are in eVs).
Table A5.
Ground state energies of bare and with OH at (200) facet (1/8 ML) supercell 2 × 2 × 1 and calculated OHBE (all energies are in eVs).
| Material | Bare (200) Facet | Surface with OH | OHBE/eV |
|---|---|---|---|
| Ni3Cr1 | −251.46 | −263.04 | −1.18 |
| Ni3Mn1 | −251.86 | −263.06 | −0.81 |
| Ni3Fe1 | −241.93 | −252.45 | −0.11 |
| Ni bare | −203.61 | −214.76 | −0.75 |
Table A6.
Ground state energies of bare and with OH at (220) facet (1/8 ML) supercell 2 × 2 × 1 and calculated OHBE (all energies are in eVs).
Table A6.
Ground state energies of bare and with OH at (220) facet (1/8 ML) supercell 2 × 2 × 1 and calculated OHBE (all energies are in eVs).
| Material | Bare (220) Facet | Surface with OH | OHBE/eV |
|---|---|---|---|
| Ni3Cr1 | −349.75 | −360.01 | 0.14 |
| Ni3Mn1 | −349.44 | −360.01 | −0.17 |
| Ni3Fe1 | −335.65 | −345.11 | 0.93 |
| Ni bare | −283.84 | −294.73 | −0.49 |
References
- Varcoe, J.R.; Atanassov, P.; Dekel, D.R.; Herring, A.M.; Hickner, M.A.; Kohl, P.A.; Kucernak, A.R.; Mustain, W.E.; Nijmeijer, K.; Scott, K.; et al. Anion-exchange membranes in electrochemical energy systems. Energy Environ. Sci. 2014, 7, 3135–3191. [Google Scholar] [CrossRef] [Green Version]
- Gottesfeld, S.; Dekel, D.R.; Page, M.; Bae, C.; Yan, Y.; Zelenay, P.; Kim, Y.S. Anion exchange membrane fuel cells: Current status and remaining challenges. J. Power Sources 2018, 375, 170–184. [Google Scholar] [CrossRef]
- Dekel, D.R.; Amar, M.; Willdorf, S.; Kosa, M.; Dhara, S.; Diesendruck, C.E. Effect of water on the stability of quaternary ammonium groups for anion exchange membrane fuel cell applications. Chem. Mater. 2017, 29, 4425–4431. [Google Scholar] [CrossRef]
- Yim, S.-D.; Chung, H.T.; Chlistunoff, J.; Kim, D.-S.; Fujimoto, C.; Yang, T.-H.; Kim, Y.S. A Microelectrode study of interfacial reactions at the platinum-alkaline polymer interface. J. Electrochem. Soc. 2015, 162, F499–F506. [Google Scholar] [CrossRef]
- Dekel, D.R.; Willdorf, S.; Ash, U.; Amar, M.; Pusara, S.; Dhara, S.; Srebnik, S.; Diesendruck, C.E. The critical relation between chemical stability of cations and water in anion exchange membrane fuel cells environment. J. Power Sources 2018, 375, 351–360. [Google Scholar] [CrossRef]
- Ziv, N.; Dekel, D.R. A practical method for measuring the true hydroxide conductivity of anion exchange membranes. Electrochem. Commun. 2018, 88, 109–113. [Google Scholar] [CrossRef]
- Omasta, T.J.; Wang, L.; Peng, X.; Lewis, C.A.; Varcoe, J.R.; Mustain, W.E. Importance of balancing membrane and electrode water in anion exchange membrane fuel cells. J. Power Sources 2018, 375, 205–213. [Google Scholar] [CrossRef] [Green Version]
- Diesendruck, C.E.; Dekel, D.R. Water—A key parameter in the stability of anion exchange membrane fuel cells. Curr. Opin. Electrochem. 2018, 9, 173–178. [Google Scholar] [CrossRef]
- Zheng, Y.; Ash, U.; Pandey, R.P.; Ozioko, A.G.; Ponce-González, J.; Handl, M.; Weissbach, T.; Varcoe, J.R.; Holdcroft, S.; Liberatore, M.W.; et al. Water uptake study of anion exchange membranes. Macromolecules 2018, 51, 3264–3278. [Google Scholar] [CrossRef]
- Wang, L.; Bellini, M.; Miller, H.A.; Varcoe, J.R. A high conductivity ultrathin anion-exchange membrane with 500+ h alkali stability for use in alkaline membrane fuel cells that can achieve 2 W cm−2 at 80 °C. J. Mater. Chem. A 2018, 6, 15404–15412. [Google Scholar] [CrossRef]
- Pusara, S.; Srebnik, S.; Dekel, D.R. Molecular simulation of quaternary ammonium solutions at low hydration levels. J. Phys. Chem. C 2018, 122, 11204–11213. [Google Scholar] [CrossRef]
- Willdorf-Cohen, S.; Mondal, A.; Dekel, D.R.; Diesendruck, C.E. Chemical stability of poly(phenylene oxide)-based ionomers in anion exchange-membrane fuel cell environment. J. Mater. Chem. A 2018. [Google Scholar] [CrossRef]
- Krewer, U.; Weinzierl, C.; Ziv, N.; Dekel, D.R. Impact of carbonation processes in anion exchange membrane fuel cells. Electrochim. Acta 2018, 263, 433–446. [Google Scholar] [CrossRef]
- Ziv, N.; Mustain, W.E.; Dekel, D.R. The Effect of ambient carbon dioxide on anion-exchange membrane fuel cells. ChemSusChem 2018, 11, 1136–1150. [Google Scholar] [CrossRef] [PubMed]
- Ziv, N.; Mondal, A.N.; Weissbach, T.; Holdcroft, S.; Dekel, R.D. Effect of CO2 on the properties of anion exchange membranes for fuel cell applications. Macromolecules 2018. submitted. [Google Scholar]
- Gerhardt, M.R.; Pant, L.M.; Weber, A.Z. Modeling water management and carbon dioxide contamination effects in anion-exchange membrane fuel cells. ECS Trans. 2018, 86, 15–24. [Google Scholar] [CrossRef]
- Rasin, I.G.; Page, M.; Dekel, D.R.; Brandon, S. A model based analysis of alkaline membrane fuel cells. ECS Trans. 2017, 80, 1051–1057. [Google Scholar] [CrossRef]
- Dekel, D.R.; Rasin, I.G.; Page, M.; Brandon, S. Steady state and transient simulation of anion exchange membrane fuel cells. J. Power Sources 2018, 375, 191–204. [Google Scholar] [CrossRef]
- Dario, R.; Dekel, D.R.; Rasin, I.G.; Brandon, S. Predicting performance stability in anion exchange membrane fuel cells. ACS Energy Lett. 2018. submitted. [Google Scholar]
- Lefèvre, M.; Proietti, E.; Jaouen, F.; Dodelet, J.-P. Iron-based catalysts with improved oxygen reduction activity in polymer electrolyte fuel cells. Science 2009, 324, 71–74. [Google Scholar] [CrossRef] [PubMed]
- Bashyam, R.; Zelenay, P. A class of non-precious metal composite catalysts for fuel cells. Nature 2006, 443, 63–66. [Google Scholar] [CrossRef] [PubMed]
- Davydova, E.S.; Mukerjee, S.; Jaouen, F.; Dekel, D.R. Electrocatalysts for hydrogen oxidation reaction in alkaline electrolytes. ACS Catal. 2018, 8, 6665–6690. [Google Scholar] [CrossRef]
- Wang, L.; Magliocca, E.; Cunningham, E.L.; Mustain, W.E.; Poynton, S.D.; Escudero-Cid, R.; Nasef, M.M.; Ponce-González, J.; Bance-Souahli, R.; Slade, R.C.T.; et al. An optimised synthesis of high performance radiation-grafted anion-exchange membranes. Green Chem. 2017, 19, 831–843. [Google Scholar] [CrossRef] [Green Version]
- Dekel, D.R. Review of cell performance in anion exchange membrane fuel cells. J. Power Sources 2018, 375, 158–169. [Google Scholar] [CrossRef]
- Miller, H.A.; Vizza, F.; Marelli, M.; Zadick, A.; Dubau, L.; Chatenet, M.; Geiger, S.; Cherevko, S.; Doan, H.; Pavlicek, R.K.; et al. Highly active nanostructured palladium-ceria electrocatalysts for the hydrogen oxidation reaction in alkaline medium. Nano Energy 2017, 33, 293–305. [Google Scholar] [CrossRef]
- Alesker, M.; Page, M.; Shviro, M.; Paska, Y.; Gershinsky, G.; Dekel, D.R.; Zitoun, D. Palladium/nickel bifunctional electrocatalyst for hydrogen oxidation reaction in alkaline membrane fuel cell. J. Power Sources 2016, 304, 332–339. [Google Scholar] [CrossRef]
- Omasta, T.J.; Peng, X.; Miller, H.A.; Vizza, F.; Wang, L.; Varcoe, J.R.; Dekel, D.R.; Mustain, W.E. Beyond 1.0 W cm−2 performance without platinum: The beginning of a new era in anion exchange membrane fuel cells. J. Electrochem. Soc. 2018, 165, J3039–J3044. [Google Scholar] [CrossRef]
- Zhuang, Z.; Giles, S.A.; Zheng, J.; Jenness, G.R.; Caratzoulas, S.; Vlachos, D.G.; Yan, Y. Nickel supported on nitrogen-doped carbon nanotubes as hydrogen oxidation reaction catalyst in alkaline electrolyte. Nat. Commun. 2016, 7, 1–8. [Google Scholar] [CrossRef] [PubMed]
- Sheng, W.; Bivens, A.P.; Myint, M.; Zhuang, Z.; Forest, R.V.; Fang, Q.; Chen, J.G.; Yan, Y. Non-precious metal electrocatalysts with high activity for hydrogen oxidation reaction in alkaline electrolytes. Energy Environ. Sci. 2014, 7, 1719–1724. [Google Scholar] [CrossRef]
- Kristinsdóttir, L.; Skúlason, E. A systematic DFT study of hydrogen diffusion on transition metal surfaces. Surf. Sci. 2012, 606, 1400–1404. [Google Scholar] [CrossRef]
- Lu, S.F.; Pan, J.; Huang, A.B.; Zhuang, L.; Lu, J.T. Alkaline polymer electrolyte fuel cells completely free from noble metal catalysts. Proc. Natl. Acad. Sci. USA 2008, 105, 20611–20614. [Google Scholar] [CrossRef] [Green Version]
- Mauer, A.E.; Kirk, D.W.; Thorpe, S.J. The role of iron in the prevention of nickel electrode deactivation in alkaline electrolysis. Electrochim. Acta 2007, 52, 3505–3509. [Google Scholar] [CrossRef]
- Bates, M.K.; Jia, Q.; Ramaswamy, N.; Allen, R.J.; Mukerjee, S. Composite Ni/NiO-Cr2O3 catalyst for alkaline hydrogen evolution reaction. J. Phys. Chem. C 2015, 119, 5467–5477. [Google Scholar] [CrossRef] [PubMed]
- Kabir, S.A.; Lemire, K.; Artyushkova, K.; Roy, A.; Odgaard, M.; Schlueter, D.; Oshchepkov, A.; Bonnefont, A.; Savinova, E.; Sabarirajan, D.C.; et al. Platinum group metal-free NiMo hydrogen oxidation catalysts: High performance and durability in alkaline exchange membrane fuel cells. J. Mater. Chem. A 2017, 5, 24433–24443. [Google Scholar] [CrossRef]
- Oshchepkov, A.; Simonov, P.; Cherstiouk, O.; Nazmutdinov, R.; Glukhov, D.; Zaikovskii, V.; Kardash, T.; Kvon, R.; Bonnefont, A.; Simonov, A.; et al. On the effect of Cu on the Activity of carbon supported Ni nanoparticles for hydrogen electrode reactions in alkaline medium. Top. Catal. 2015, 58, 1–12. [Google Scholar] [CrossRef]
- Tang, M.H.; Hahn, C.; Klobuchar, A.J.; Ng, J.W.D.; Wellendorff, J.; Bligaard, T.; Jaramillo, T.F. Nickel–silver alloy electrocatalysts for hydrogen evolution and oxidation in an alkaline electrolyte. Phys. Chem. Chem. Phys. 2014, 16, 19250–19257. [Google Scholar] [CrossRef] [PubMed]
- Cherstiouk, O.V.; Simonov, P.A.; Oshchepkov, A.G.; Zaikovskii, V.I.; Kardash, T.Y.; Bonnefont, A.; Parmon, V.N.; Savinova, E.R. Electrocatalysis of the hydrogen oxidation reaction on carbon-supported bimetallic NiCu particles prepared by an improved wet chemical synthesis. J. Electroanal. Chem. 2016, 783, 146–151. [Google Scholar] [CrossRef]
- Davydova, E.S.; Dekel, D.R. Ni-Based Hydrogen Oxidation reaction electrocatalysts for alkaline anion-exchange membrane fuel cells: Systematic study on the doping effect. In Meeting Abstracts; The Electrochemical Society: Pennington, NJ, USA, 2017; p. 1635. [Google Scholar]
- Sheng, W.; Zhuang, Z.; Gao, M.; Zheng, J.; Chen, J.G.; Yan, Y. Correlating hydrogen oxidation and evolution activity on platinum at different pH with measured hydrogen binding energy. Nat. Commun. 2015, 6, 1–6. [Google Scholar] [CrossRef] [PubMed]
- Zheng, J.; Zhuang, Z.; Xu, B.; Yan, Y. Correlating hydrogen oxidation/evolution reaction activity with the minority weak hydrogen-binding sites on Ir/C catalysts. ACS Catal. 2015, 5, 4449–4455. [Google Scholar] [CrossRef]
- Nørskov, J.K.; Bligaard, T.; Logadottir, A.; Kitchin, J.R.; Chen, J.G.; Pandelov, S.; Stimming, U. Trends in the exchange current for hydrogen evolution. J. Electrochem. Soc. 2005, 152, J23–J26. [Google Scholar] [CrossRef] [Green Version]
- Erdey-Gruz, T.; Volmer, M. ZurTheorie der WasserstoffÜberspannung. Z. Phys. Chem. Abteil. Chem. Thermodyn. Kinet. Electrochem. Eig. 1930, 150, 203–206. [Google Scholar]
- Heyrovsky, J. A theory of overpotential. Recl. Trav. Chim. Pays-Bas 1927, 46, 582–585. [Google Scholar] [CrossRef]
- Marković, N.M.; Sarraf, S.T.; Gasteiger, H.A.; Ross, P.N. Hydrogen electrochemistry on platinum low-index single-crystal surfaces in alkaline solution. J. Chem. Soc. Faraday Trans. 1996, 92, 3719–3725. [Google Scholar] [CrossRef]
- Sheng, W.; Gasteiger, H.A.; Shao-Horn, Y. Hydrogen oxidation and evolution reaction kinetics on platinum: Acid vs alkaline electrolytes. J. Electrochem. Soc. 2010, 157, B1529. [Google Scholar] [CrossRef]
- Ross, P.N.; Stonehart, P. Correlations between electrochemical activity and heterogeneous catalysis for hydrogen dissociation on platinum. J. Res. Inst. Catal. Hokkaido Univ. 1974, 22, 22–41. [Google Scholar]
- Bagotzky, V.S.; Osetrova, N.V. Investigations of hydrogen ionization on platinum with the help of micro-electrodes. J. Electroanal. Chem. 1973, 43, 233–249. [Google Scholar] [CrossRef]
- Stonehart, P.; Kohlmayr, G. Effect of poisons on kinetic parameters for platinum electrocatalyst sites. Electrochim. Acta 1972, 17, 369–382. [Google Scholar] [CrossRef]
- Zheng, J.; Sheng, W.; Zhuang, Z.; Xu, B.; Yan, Y. Universal dependence of hydrogen oxidation and evolution reaction activity of platinum-group metals on pH and hydrogen binding energy. Sci. Adv. 2016, 2, e1501602. [Google Scholar] [CrossRef] [PubMed]
- Durst, J.; Siebel, A.; Simon, C.; Hasche, F.; Herranz, J.; Gasteiger, H.A. New insights into the electrochemical hydrogen oxidation and evolution reaction mechanism. Energy Environ. Sci. 2014, 7, 2255–2260. [Google Scholar] [CrossRef] [Green Version]
- Floner, D.; Lamy, C.; Leger, J.M. Electrocatalytic oxidation of hydrogen on polycrystal and single-crystal nickel electrodes. Surf. Sci. 1990, 234, 87–97. [Google Scholar] [CrossRef]
- Oshchepkov, A.G.; Bonnefont, A.; Saveleva, V.A.; Papaefthimiou, V.; Zafeiratos, S.; Pronkin, S.N.; Parmon, V.N.; Savinova, E.R. Exploring the influence of the nickel oxide species on the kinetics of hydrogen electrode reactions in alkaline media. Top. Catal. 2016, 59, 1319–1331. [Google Scholar] [CrossRef]
- Schmidt, T.J.; Ross, P.N.; Markovic, N.M. Temperature dependent surface electrochemistry on Pt single crystals in alkaline electrolytes: Part 2. The hydrogen evolution/oxidation reaction. J. Electroanal. Chem. 2002, 524, 252–260. [Google Scholar] [CrossRef]
- Mahoney, E.G.; Sheng, W.; Yan, Y.; Chen, J.G. Platinum-modified gold electrocatalysts for the hydrogen oxidation reaction in alkaline electrolytes. ChemElectroChem 2014, 1, 2058–2063. [Google Scholar] [CrossRef]
- Alia, S.M.; Pivovar, B.S.; Yan, Y. Platinum coated copper nanowires with high activity for hydrogen oxidation reaction in base. J. Am. Chem. Soc. 2013, 135, 13473–13478. [Google Scholar] [CrossRef] [PubMed]
- Elbert, K.; Hu, J.; Ma, Z.; Zhang, Y.; Chen, G.; An, W.; Liu, P.; Isaacs, H.S.; Adzic, R.R.; Wang, J.X. Elucidating hydrogen oxidation/evolution kinetics in base and acid by enhanced activities at the optimized pt shell thickness on the ru core. ACS Catal. 2015, 5, 6764–6772. [Google Scholar] [CrossRef]
- Balzarotti, A.; De Crescenzi, M.; Motta, N.; Patella, F.; Sgarlata, A. Valence charge fluctuations in YBa2Cu3O7−δ from core-level spectroscopies. Phys. Rev. B 1988, 38, 6461–6469. [Google Scholar] [CrossRef]
- Mansour, A.N. Copper MgKα XPS spectra from the physical electronics model 5400 spectrometer. Surf. Sci. Spectra 1994, 3, 202–210. [Google Scholar] [CrossRef]
- Jolley, J.G.; Geesey, G.G.; Hankins, M.R.; Wright, R.B.; Wichlacz, P.L. Auger electron and X-ray photoelectron spectroscopic study of the biocorrosion of copper by alginic acid polysaccharide. Appl. Surf. Sci. 1989, 37, 469–480. [Google Scholar] [CrossRef]
- Hussain, Z.; Salim, M.A.; Khan, M.A.; Khawaja, E.E. X-ray photoelectron and auger spectroscopy study of copper-sodium-germanate glasses. J. Non-Cryst. Solids 1989, 110, 44–52. [Google Scholar] [CrossRef]
- Shabanova, I.N.; Trapeznikov, V.A. A study of the electronic structure of Fe3C, Fe3Al and Fe3Si by X-ray photoelectron spectroscopy. J. Electron Spectrosc. Relat. Phenom. 1975, 6, 297–307. [Google Scholar] [CrossRef]
- Tan, B.J.; Klabunde, K.J.; Sherwood, P.M.A. X-ray photoelectron spectroscopy studies of solvated metal atom dispersed catalysts. Monometallic iron and bimetallic iron-cobalt particles on alumina. Chem. Mater. 1990, 2, 186–191. [Google Scholar] [CrossRef]
- Oshchepkov, A.G.; Bonnefont, A.; Parmon, V.N.; Savinova, E.R. On the effect of temperature and surface oxidation on the kinetics of hydrogen electrode reactions on nickel in alkaline media. Electrochim. Acta 2018, 269, 111–118. [Google Scholar] [CrossRef]
- Miller, H.A.; Lavacchi, A.; Vizza, F.; Marelli, M.; Di Benedetto, F.; D’Acapito, F.; Paska, Y.; Page, M.; Dekel, D.R. A Pd/C-CeO2 Anode Catalyst for high-performance platinum-free anion exchange membrane fuel cells. Angew. Chem. Int. Ed. Engl. 2016, 55, 6004–6007. [Google Scholar] [CrossRef] [PubMed]
- Li, J.; Ghoshal, S.; Bates, M.K.; Miller, T.E.; Davies, V.; Stavitski, E.; Attenkofer, K.; Mukerjee, S.; Ma, Z.-F.; Jia, Q. Experimental proof of the bifunctional mechanism for the hydrogen oxidation in alkaline media. Angew. Chem. Int. Ed. 2017, 56, 15594–15598. [Google Scholar] [CrossRef] [PubMed]
- Strmcnik, D.; Uchimura, M.; Wang, C.; Subbaraman, R.; Danilovic, N.; van der Vliet, D.; Paulikas, A.P.; Stamenkovic, V.R.; Markovic, N.M. Improving the hydrogen oxidation reaction rate by promotion of hydroxyl adsorption. Nat. Chem. 2013, 5, 300–306. [Google Scholar] [CrossRef] [PubMed]
- Ramaswamy, N.; Ghoshal, S.; Bates, M.K.; Jia, Q.; Li, J.; Mukerjee, S. Hydrogen oxidation reaction in alkaline media: Relationship between electrocatalysis and electrochemical double-layer structure. Nano Energy 2017, 41, 765–771. [Google Scholar] [CrossRef]
- Koper, M.T.M.; Van Santen, R.A. Interaction of H, O and OH with metal surfaces. J. Electroanal. Chem. 1999, 472, 126–136. [Google Scholar] [CrossRef]
- Medford, A.J.; Vojvodic, A.; Hummelshøj, J.S.; Voss, J.; Abild-Pedersen, F.; Studt, F.; Bligaard, T.; Nilsson, A.; Nørskov, J.K. From the Sabatier principle to a predictive theory of transition-metal heterogeneous catalysis. J. Catal. 2015, 328, 36–42. [Google Scholar] [CrossRef] [Green Version]
- Striebel, K.A.; McLarnon, F.R.; Cairns, E.J. Oxygen reduction on Pt in aqueous K2CO3 and KOH. J. Electrochem. Soc. 1990, 137, 3351–3359. [Google Scholar] [CrossRef]
- Wang, Y.; Wang, G.; Li, G.; Huang, B.; Pan, J.; Liu, Q.; Han, J.; Xiao, L.; Lu, J.; Zhuang, L. Pt–Ru catalyzed hydrogen oxidation in alkaline media: Oxophilic effect or electronic effect? Energy Environ. Sci. 2015, 8, 177–181. [Google Scholar] [CrossRef]
- Ohyama, J.; Sato, T.; Yamamoto, Y.; Arai, S.; Satsuma, A. Size specifically high activity of Ru nanoparticles for hydrogen oxidation reaction in alkaline electrolyte. J. Am. Chem. Soc. 2013, 135, 8016–8021. [Google Scholar] [CrossRef] [PubMed]
- Roy, A.; Talarposhti, M.R.; Normile, S.J.; Zenyuk, I.V.; De Andrade, V.; Artyushkova, K.; Serov, A.; Atanassov, P. Nickel–copper supported on a carbon black hydrogen oxidation catalyst integrated into an anion-exchange membrane fuel cell. Sustain. Energy Fuels 2018. [Google Scholar] [CrossRef]
- Kresse, G.; Hafner, J. Ab initio molecular dynamics for open-shell transition metals. Phys. Rev. B 1993, 48, 13115–13118. [Google Scholar] [CrossRef]
- Kresse, G.; Furthmüller, J. Efficiency of ab-initio total energy calculations for metals and semiconductors using a plane-wave basis set. Comput. Mater. Sci. 1996, 6, 15–50. [Google Scholar] [CrossRef]
- Perdew, J.P.; Burke, K.; Ernzerhof, M. Generalized gradient approximation made simple. Phys. Rev. Lett. 1996, 77, 3865–3868. [Google Scholar] [CrossRef] [PubMed]
- Stamenkovic, V.R.; Fowler, B.; Mun, B.S.; Wang, G.; Ross, P.N.; Lucas, C.A.; Markovic, N.M. Improved oxygen reduction activity on Pt3Ni(111) via Increased surface site availability. Science 2007, 315, 493–497. [Google Scholar] [CrossRef] [PubMed]
- Studt, F.; Abild-Pedersen, F.; Bligaard, T.; Sorensen, R.Z.; Christensen, C.H.; Norskov, J.K. Identification of non-precious metal alloy catalysts for selective hydrogenation of acetylene. Science 2008, 320, 1320–1322. [Google Scholar] [CrossRef] [PubMed]
- Nikolla, E.; Schwank, J.; Linic, S. Comparative study of the kinetics of methane steam reforming on supported Ni and Sn/Ni alloy catalysts: The impact of the formation of Ni alloy on chemistry. J. Catal. 2009, 263, 220–227. [Google Scholar] [CrossRef]
- Sitthisa, S.; An, W.; Resasco, D.E. Selective conversion of furfural to methylfuran over silica-supported NiFe bimetallic catalysts. J. Catal. 2011, 284, 90–101. [Google Scholar] [CrossRef]
- Kresse, G. From ultrasoft pseudopotentials to the projector augmented-wave method. Phys. Rev. B 1999, 59, 1758–1775. [Google Scholar] [CrossRef]
- Blöchl, P.E. Projector augmented-wave method. Phys. Rev. B 1994, 50, 17953–17979. [Google Scholar] [CrossRef] [Green Version]
- Ziegel, E.; Press, W.; Flannery, B.; Teukolsky, S.; Vetterling, W. Numerical recipes: The art of scientific computing. Technometrics 1987. [Google Scholar] [CrossRef]
- Patterson, A.L. The Scherrer formula for X-ray particle size determination. Phys. Rev. 1939, 56, 978–982. [Google Scholar] [CrossRef]
- Maurya, S.; Dumont, J.; Narvaez Villarrubia, C.; Matanovic, I.; Li, D.; Kim, Y.S.; Noh, S.; Han, J.; Bae, C.; Miller, H.A.; et al. Surface adsorption affects the performance of alkaline anion-exchange membrane fuel cells. ACS Catal. 2018, 8, 9429–9439. [Google Scholar] [CrossRef]
Figure 1.
HBE (a) and OHBE (b) values on different facets for Ni3TM1 alloys presented in the same order as the 3d TMs in the Periodic Table.
Figure 1.
HBE (a) and OHBE (b) values on different facets for Ni3TM1 alloys presented in the same order as the 3d TMs in the Periodic Table.

Figure 2.
(a) Hydrogen oxidation reaction (HOR) polarization curves (solid lines) and cyclic voltammogram (dashed line) for the Ni/C catalyst. The arrows show the potential sweep direction. (b) Comparison of the HOR polarization curves (forward scans) for monometallic Ni/C and bimetallic Ni3TM1/C catalysts for TM = Fe, Co and Cu. The numbers correspond to the peak potential values. * Potential range of 0.01–0.05 V used for the kinetic analysis.
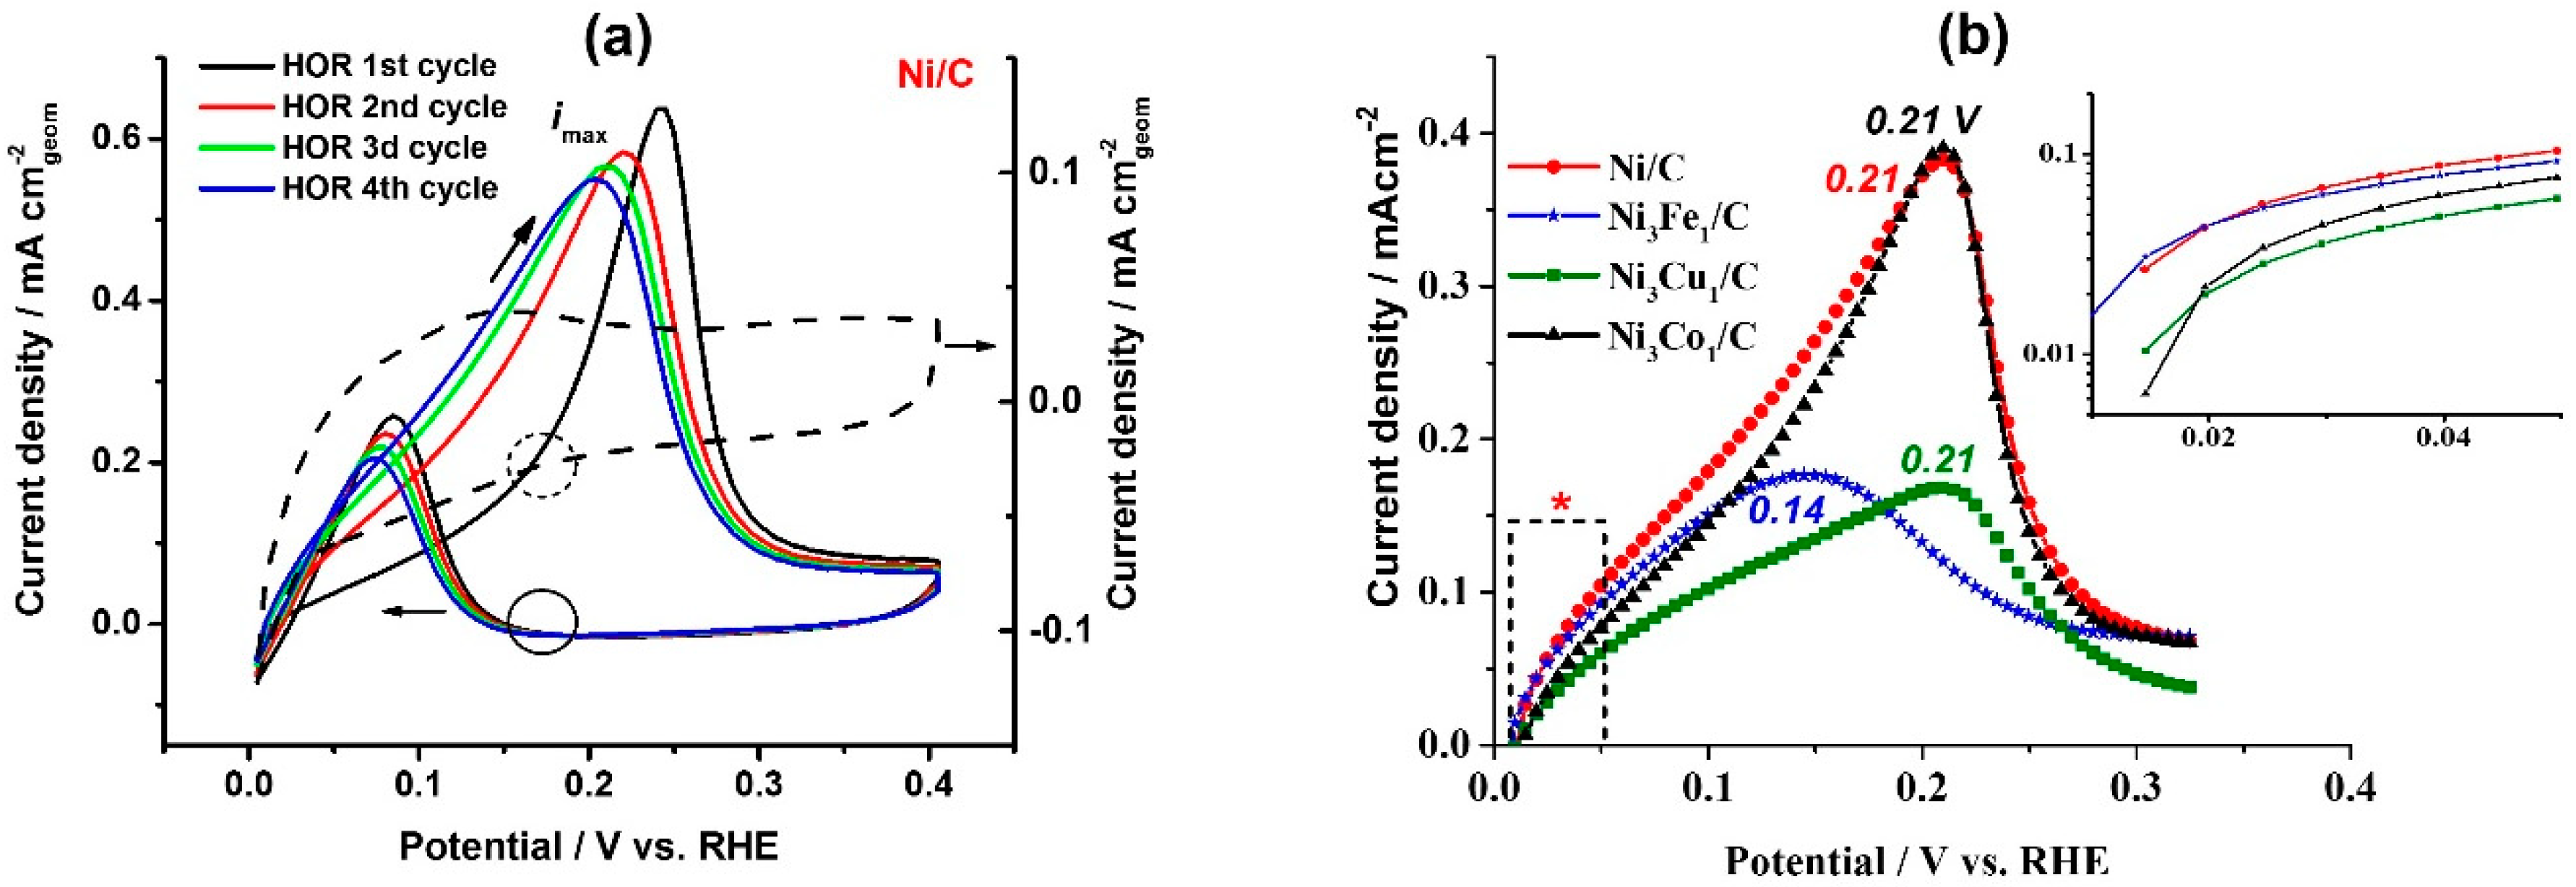
Figure 3.
Linear potential stripping (solid lines) for the Ni/C (a), Ni3Co1/C (b), Ni3Fe1/C (c) and Ni3Cu1/C (d) catalysts under Ar atmosphere and the corresponding derivatives (dashed lines) of the HOR polarization curves. Numbers indicate the peak potential values.
Figure 3.
Linear potential stripping (solid lines) for the Ni/C (a), Ni3Co1/C (b), Ni3Fe1/C (c) and Ni3Cu1/C (d) catalysts under Ar atmosphere and the corresponding derivatives (dashed lines) of the HOR polarization curves. Numbers indicate the peak potential values.

Figure 4.
Correlation between the experimentally determined exchange current density values of the catalysts with the theoretically predicated HBE and OHBE values: (a) (111) facet, (b) (200) facet, and (c) (220) facet.
Figure 4.
Correlation between the experimentally determined exchange current density values of the catalysts with the theoretically predicated HBE and OHBE values: (a) (111) facet, (b) (200) facet, and (c) (220) facet.
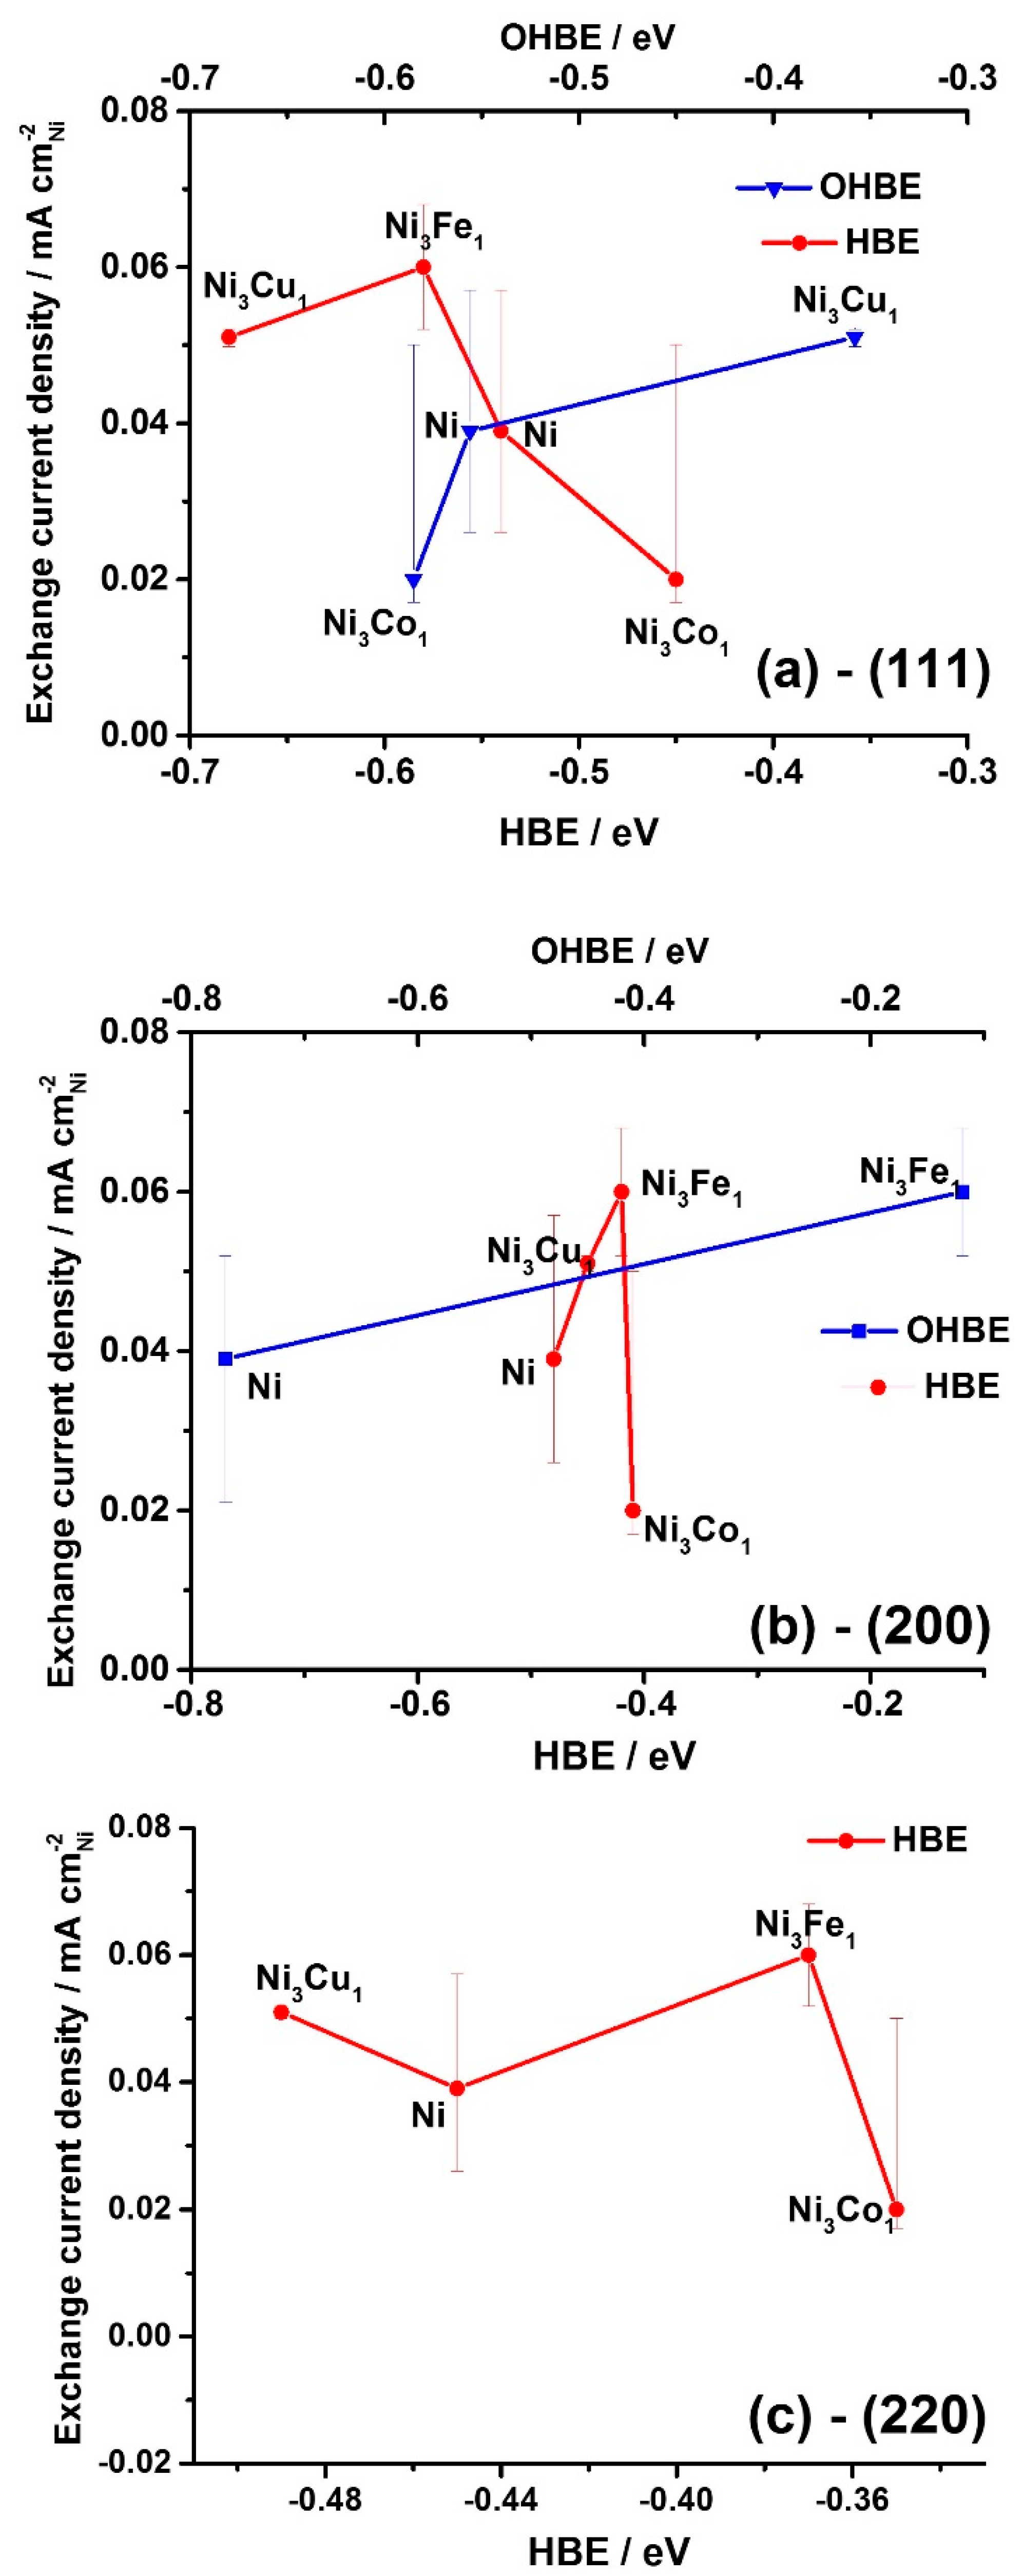
Figure 5.
Slab models for all three Ni3TM1 (111), (200) and (220) facets constructed from the primitive cell. The locations marked by black circles indicate the H adsorption sites with the lowest energy.
Figure 5.
Slab models for all three Ni3TM1 (111), (200) and (220) facets constructed from the primitive cell. The locations marked by black circles indicate the H adsorption sites with the lowest energy.

Table 1.
Comparison of surface area values and the HOR electrocatalytic properties for different catalysts.
Table 1.
Comparison of surface area values and the HOR electrocatalytic properties for different catalysts.
| Catalyst | ESCA/m2 g−1Ni | i at η = 0.05 V | io | |||||
|---|---|---|---|---|---|---|---|---|
| mA cm−2geom | A g−1cat | A g−1Ni | A m−2Ni | A g−1Ni | mA cm−2Ni | |||
| Ni/C | 1.3 ±0.2 | 0.12 | 0.6 | 1.60 | 0.347 | 0.83 | 0.039 | +0.018 |
| −0.013 | ||||||||
| Ni3Fe1/C | 1.2 ± 0.6 | 0.11 | 0.55 | 1.87 | 0.858 | 0.96 | 0.060 | +0.008 |
| −0.008 | ||||||||
| Ni3Cu1/C | 1.2 ± 0.2 | 0.09 | 0.45 | 2.01 | 0.510 | 0.98 | 0.051 | +0.001 |
| −0.0012 | ||||||||
| Ni3Co1/C | 1.5 ± 0.3 | 0.07 | 0.35 | 1.28 | 0.290 | 0.66 | 0.020 | +0.030 |
| −0.003 | ||||||||
© 2018 by the authors. Licensee MDPI, Basel, Switzerland. This article is an open access article distributed under the terms and conditions of the Creative Commons Attribution (CC BY) license (http://creativecommons.org/licenses/by/4.0/).
Share and Cite
MDPI and ACS Style
Davydova, E.S.; Zaffran, J.; Dhaka, K.; Toroker, M.C.; Dekel, D.R. Hydrogen Oxidation on Ni-Based Electrocatalysts: The Effect of Metal Doping. Catalysts 2018, 8, 454. https://0-doi-org.brum.beds.ac.uk/10.3390/catal8100454
AMA Style
Davydova ES, Zaffran J, Dhaka K, Toroker MC, Dekel DR. Hydrogen Oxidation on Ni-Based Electrocatalysts: The Effect of Metal Doping. Catalysts. 2018; 8(10):454. https://0-doi-org.brum.beds.ac.uk/10.3390/catal8100454
Chicago/Turabian StyleDavydova, Elena S., Jérémie Zaffran, Kapil Dhaka, Maytal Caspary Toroker, and Dario R. Dekel. 2018. "Hydrogen Oxidation on Ni-Based Electrocatalysts: The Effect of Metal Doping" Catalysts 8, no. 10: 454. https://0-doi-org.brum.beds.ac.uk/10.3390/catal8100454
Note that from the first issue of 2016, this journal uses article numbers instead of page numbers. See further details here.