In situ Decolorization Monitoring of Textile Dyes for an Optimized UV-LED/TiO2 Reactor


1
Motion Control and Industrial Applications (MCIA) Research Center, Department of Electronic Engineering, Universitat Politècnica de Catalunya, Rambla Sant Nebridi, 22, 08222 Terrassa, Spain
2
Nonlinear Dynamics, Nonlinear Optics and Lasers (DONLL), Department of Physics, Universitat Politècnica de Catalunya, Colom 11, 08222 Terrassa, Spain
*
Author to whom correspondence should be addressed.
Catalysts 2019, 9(8), 669; https://0-doi-org.brum.beds.ac.uk/10.3390/catal9080669
Submission received: 5 July 2019
/
Revised: 31 July 2019
/
Accepted: 1 August 2019
/
Published: 6 August 2019
(This article belongs to the Special Issue Environmental Applications of Photocatalytic Processes)
Abstract
:Heterogeneous photocatalysis, using photocatalysts in suspension to eliminate diverse contaminants, including textile wastewater, has several advantages. Nevertheless, current absorbance and decolorization measurements imply sample acquisition by extraction at a fixed rate with consequent photocatalyst removal. This study presents online monitoring for the decolorization of six azo dyes, Orange PX-2R (OP2), Remazol Black B133 (RB), Procion Crimson H-EXL (PC), Procion Navy H-EXL (PN), Procion Blue H-EXL (PB), and Procion Yellow H-EXL (PY), analyzing the spectrum measured in situ by using the light scattering provided by the photocatalyst in suspension. The results obtained have corroborated the feasibility of obtaining absorbance and decolorization measurements, avoiding disturbances in the process due to a decrease in the volume in the reactor.

1. Introduction
Water pollution is presently one of the most worrying health problems, influencing the life of all living beings. It also influences, among sectors with a large influence in the production of wastewater, the textile industry [1,2,3], which uses more than 100,000 different dyes, with roughly 280,000 tons lost in textile effluents every year [4,5]. Textile wastewater is commonly contaminated with high concentrations of organic substances derived from various residues of dyes and different chemical additives [3,5]. Synthetic azo dyes account for approximately 800,000 tons, widely used because of their high reactivity and color resilience [6,7,8]. For their mineralization and degradation, advanced oxidation processes (AOPs) are commonly used [8,9,10]. Among the AOPs, photocatalytic processes are highlighted due to their high efficiency in the removal of contaminants, including synthetic dyes [11,12].
Current photocatalytic processes in aqueous solutions involve different types of reactors [13,14,15,16,17,18,19,20,21,22], which can be classified in different groups according to their geometry (e.g., tubular or cylindrical, rectangular or square reactors, etc.), liquid agitation techniques (e.g., continuous flow reactors, e.g., stirrer rotation) and lighting source including mainly low or medium pressure ultraviolet lamps [23,24,25,26,27], currently being replaced by LED lighting [28,29,30,31,32,33,34], which can reduce the size of the reactors, allowing the making of compact photo reactors known as mini reactors or micro reactors [35,36,37]. These reactors usually work with less than one liter of water [33,34,35,36,37,38,39,40,41,42], using photocatalysts either in suspension [41,42,43,44,45] or immobilized [46,47,48]. Reactors with photocatalysts in suspension are the most used, since it is not necessary to obtain any previous treatment of the photocatalyst. On the other hand, reactors with immobilized photocatalysts, used for diverse applications such as continuous flow processes, need careful preparation to avoid low reaction rates [47].
Monitoring of the degree of oxidation achieved in AOPs is a crucial parameter to determine when the process is completed (i.e., measurement Chemical Oxygen Demand (COD), Total Organic Carbon (TOC), Biochemical Oxygen Demand (BOD)) [24,25,39,41]. In particular, for dyed solutions, the principal measurement of the degree of decolorization is used [49,50,51,52,53]. This analysis frequently involves a measurement of the absorbance at different times, obtained by extracting samples periodically, generating a decrease in the water volume (non-negligible in such mini reactors) and altering the photocatalysts concentration [41,42]. An improvement of the existing monitoring techniques should result in a more efficient control of the oxidation process. In particular, online monitoring could offer a solution, conserving the volume and catalyst concentration of the treated water. This possibility was recently proposed for monitoring in reactors with immobilized photocatalyst [30,35,54,55], but not for photocatalyst in suspension due to its intrinsic large scattering [56,57,58,59,60,61,62].
In this study, we propose a novel implementation for the online monitoring of dye decolorization in photocatalytic in suspension reactors, which can be adapted to different reactor geometries, profiting from the natural process of scattering to measure the color removal. The frequency spectrum of the scattered radiation when the solution is illuminated by a white light source is continuously monitored by a fiber-coupled spectrometer, measuring the degree of decolorization in real-time.
2. Results
2.1. Online Monitoring
In the experiments, a photocatalytic microreactor with suspended TiO2 photocatalyst was used (see details about the methodology in Section 4). The titanium dioxide spherical nanoparticles, with diameter of 21 nm, surface area of 35−65 m2/g, molecular weight 78.87 g/mol and index of refraction close to 2.8 in the visible region of the spectrum, are suspended in water and continuously stirred to avoid precipitation of the suspension. As a consequence, the averaged particle density and hence the averaged index of refraction at each microscopic volume element of the suspension will show temporal fluctuations, leading to a quite uniform scattering distribution in all directions when illuminated by a light beam. The size of the scattering centers, much smaller than the wavelength, leads to Rayleigh-type scattering with omnidirectional dispersion acting quite effectively in the visible part of the spectrum.
The conventional method to determine the decolorization degree requires filtering the suspended photocatalyst to measure the absorbance using a spectrophotometer. The degree of decolorization is directly related to the amount of oxidation achieved in the sample.
Online monitoring of the decolorization process would allow following the kinetics of the process in real-time. In a first attempt to achieve this goal, the geometry of the photoreactor was modified, including a pump to circulate the dye solution into an external circuit and using a 1 mm thick cuvette to measure the degree of decolorization of the sample; nevertheless, this configuration presented some problems: in the circulation process part of the catalyst was adsorbed at the circuit walls and a direct measure through the cuvette in transmission was not possible due to the high scattering present. Using immobilized TiO2 geometries can palliate the effect of the scattering but can introduce other problems such as how to obtain a uniform illumination of the sample (this is a crucial aspect in photocatalytic processes).
We propose a new solution, profiting from the natural scattering emitted over broad spectral regions with the aim to perform an online monitoring of the spectrum directly from the reactor body. We will also demonstrate its performance in the monitoring of the decolorization of azo dyes.
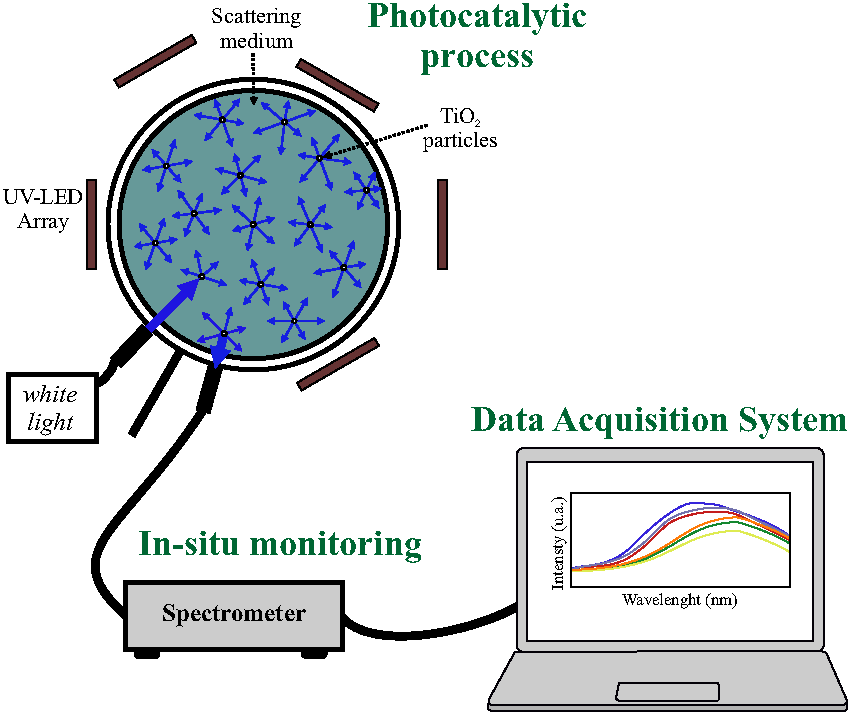
Figure 1 shows the implemented photoreactor with the elements required to perform online monitoring. This reactor uses 86 LEDs, distributed in different arrays for the photocatalytic process and was implemented according to the description in Figure 15 in Section 4.
For the monitoring, we used a white light source coupled to a fiber bundle and placed close to the reactor wall, illuminating the dye solution. In the figure, the strong scattering present in the illuminated solution can be seen. The scattered radiation is captured by a second fiber bundle and coupled to a spectrometer to record its frequency spectrum. Since the scattering of radiation is omnidirectional, the detection fiber bundle can be placed in any location adequate to the geometry of the reactor. In the experiments, the fiber bundle was placed close to the source using a screen in order to eliminate direct coupling from the source to the detector. The acquisition process can be automatized allowing the recording of the spectrum of the dye at selected times. In each experiment measures were taken every 5 min automatically.
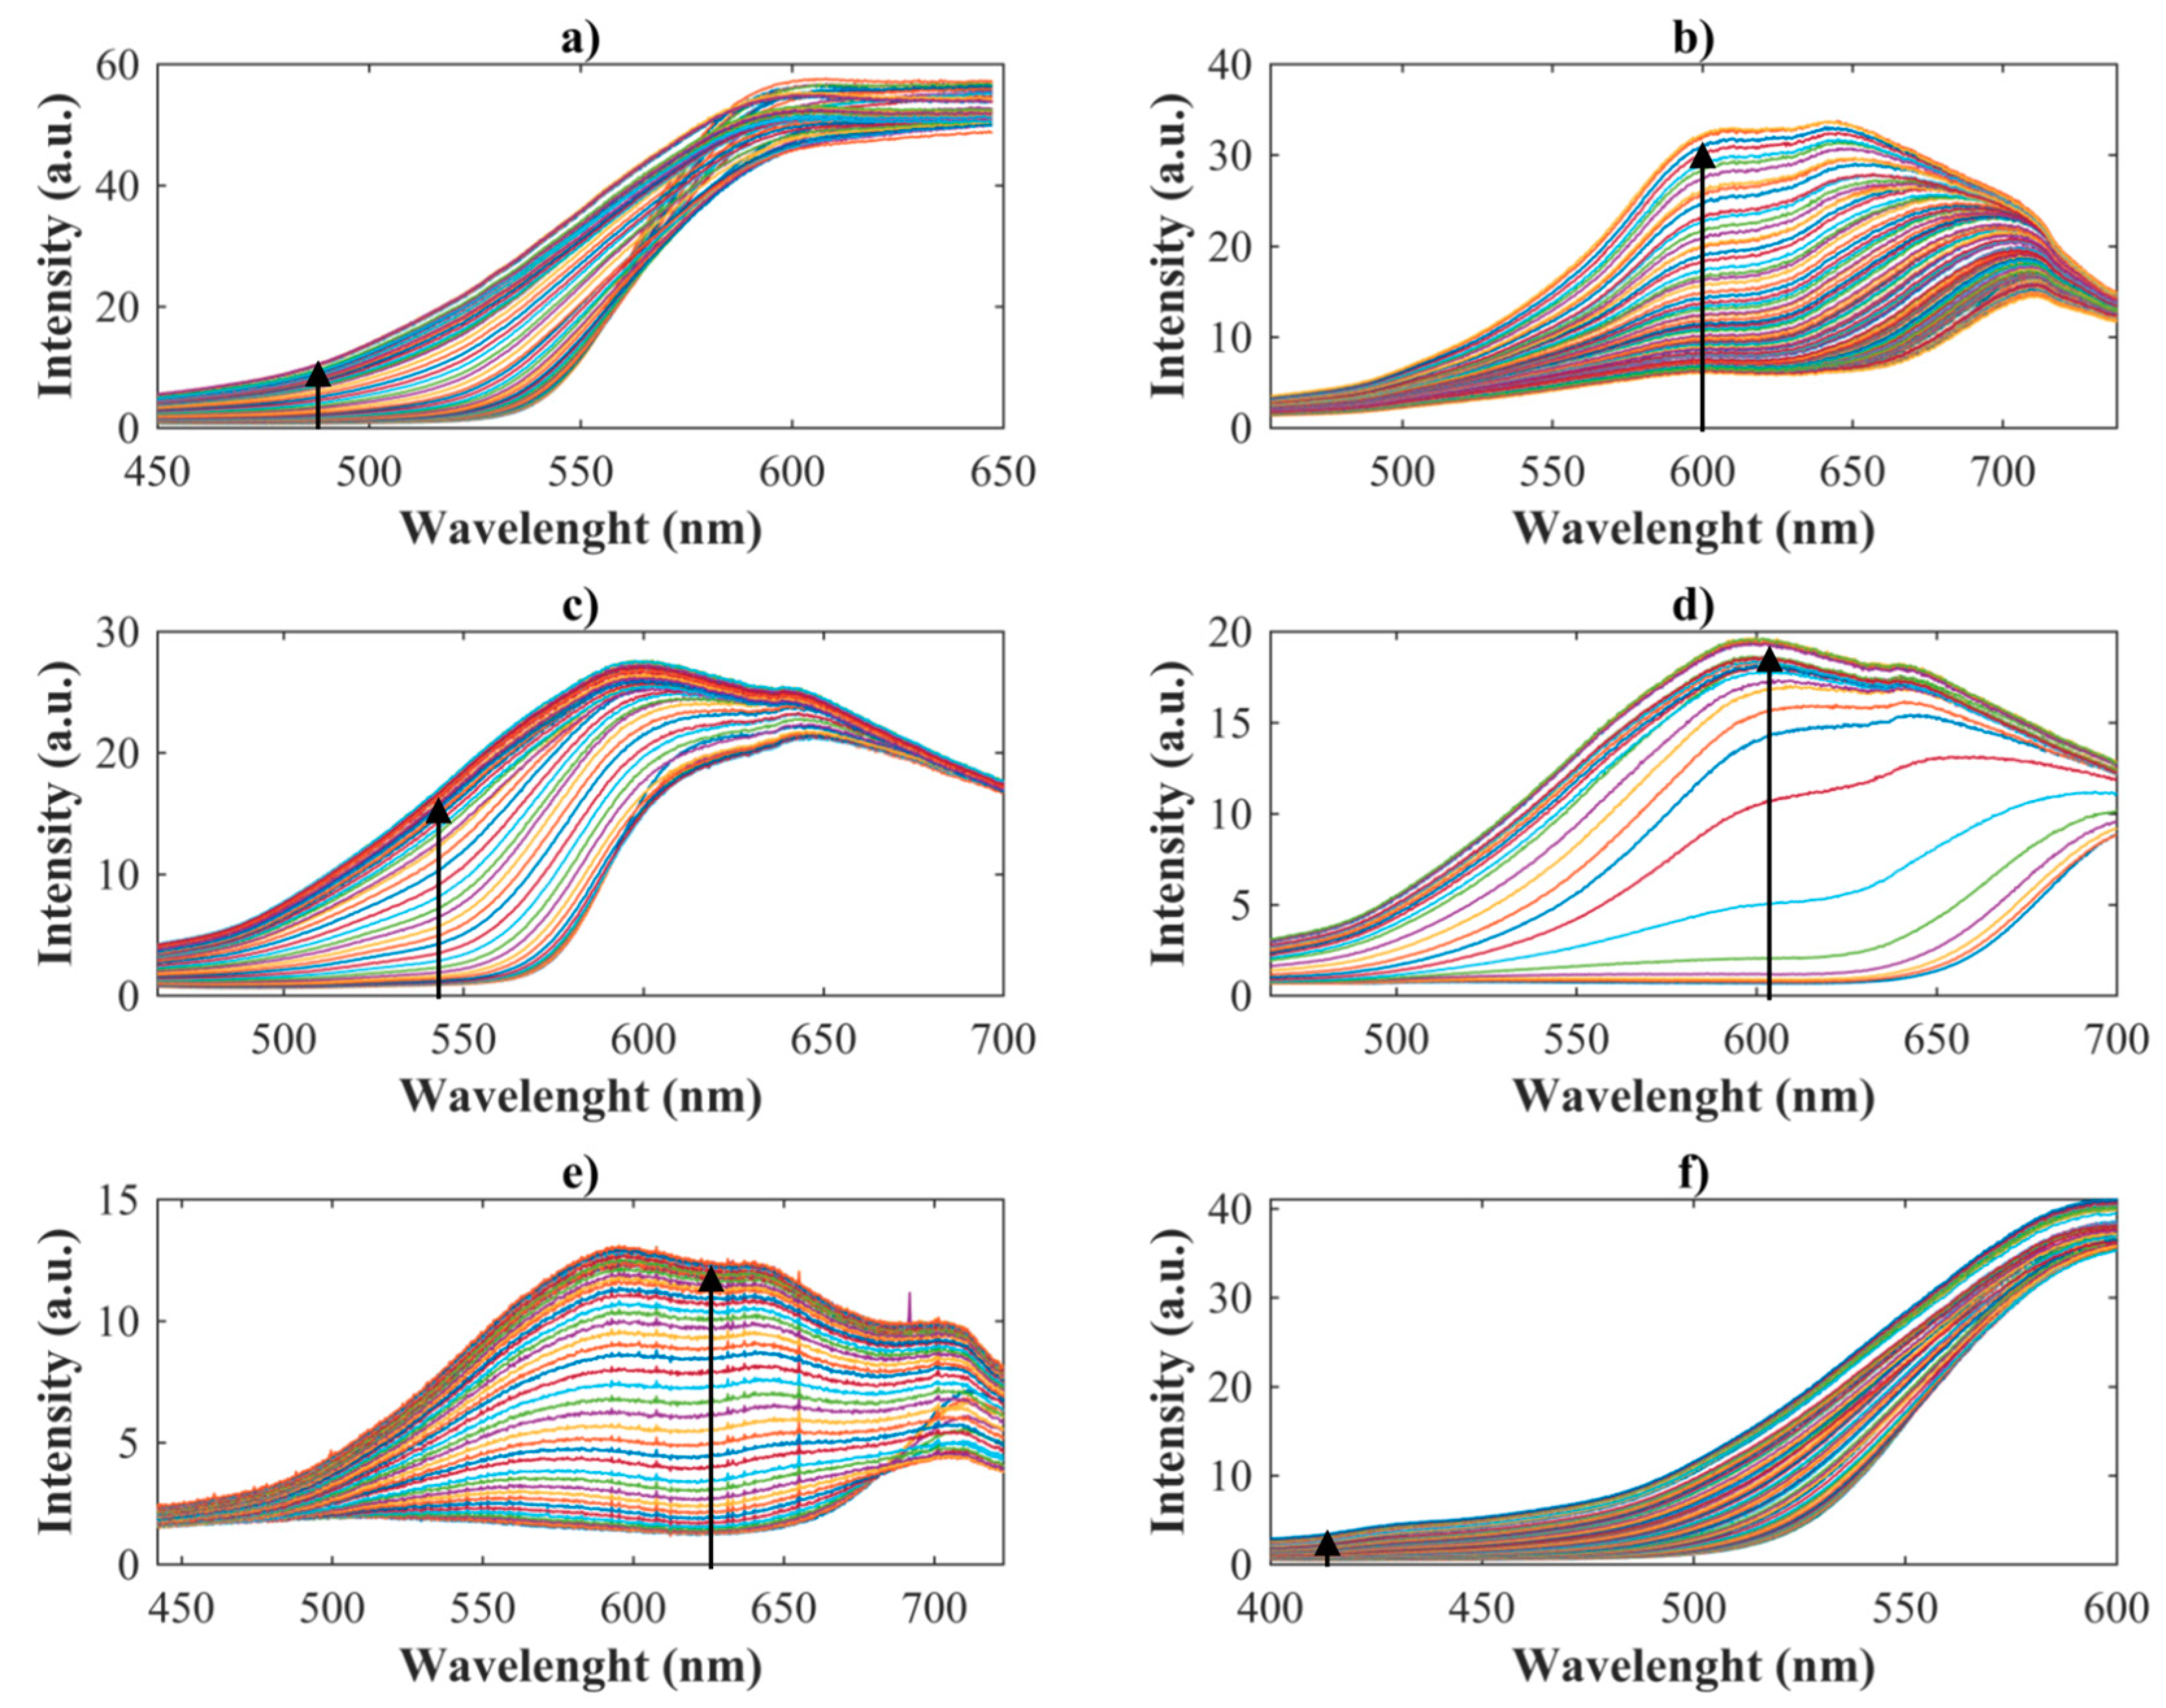
As an initial reference, the spectrum of clean deionized water with an amount of photocatalyst in suspension, identical to that used in the dye samples and with identical magnetic stirring conditions, was recorded. The capabilities of this system were tested by monitoring the decolorization process of six different dyes with colors varying along the visible spectrum (details of the dyes used are presented in Section 4). Figure 2 shows the intensity spectral curves, recorded for each sample. The arrows indicate the direction of change of the spectra as a function of time, indicating that the intensity of the spectrum signal recorded increases with time as the decolorization process takes place. For these measurements, a calibrated optical illumination to obtain absolute values of irradiance is not needed, since merely the relative variations of the spectrum are considered. From these curves, an increase of the transparency of the samples, given by the increase of the overall spectrum intensity, can be inferred.
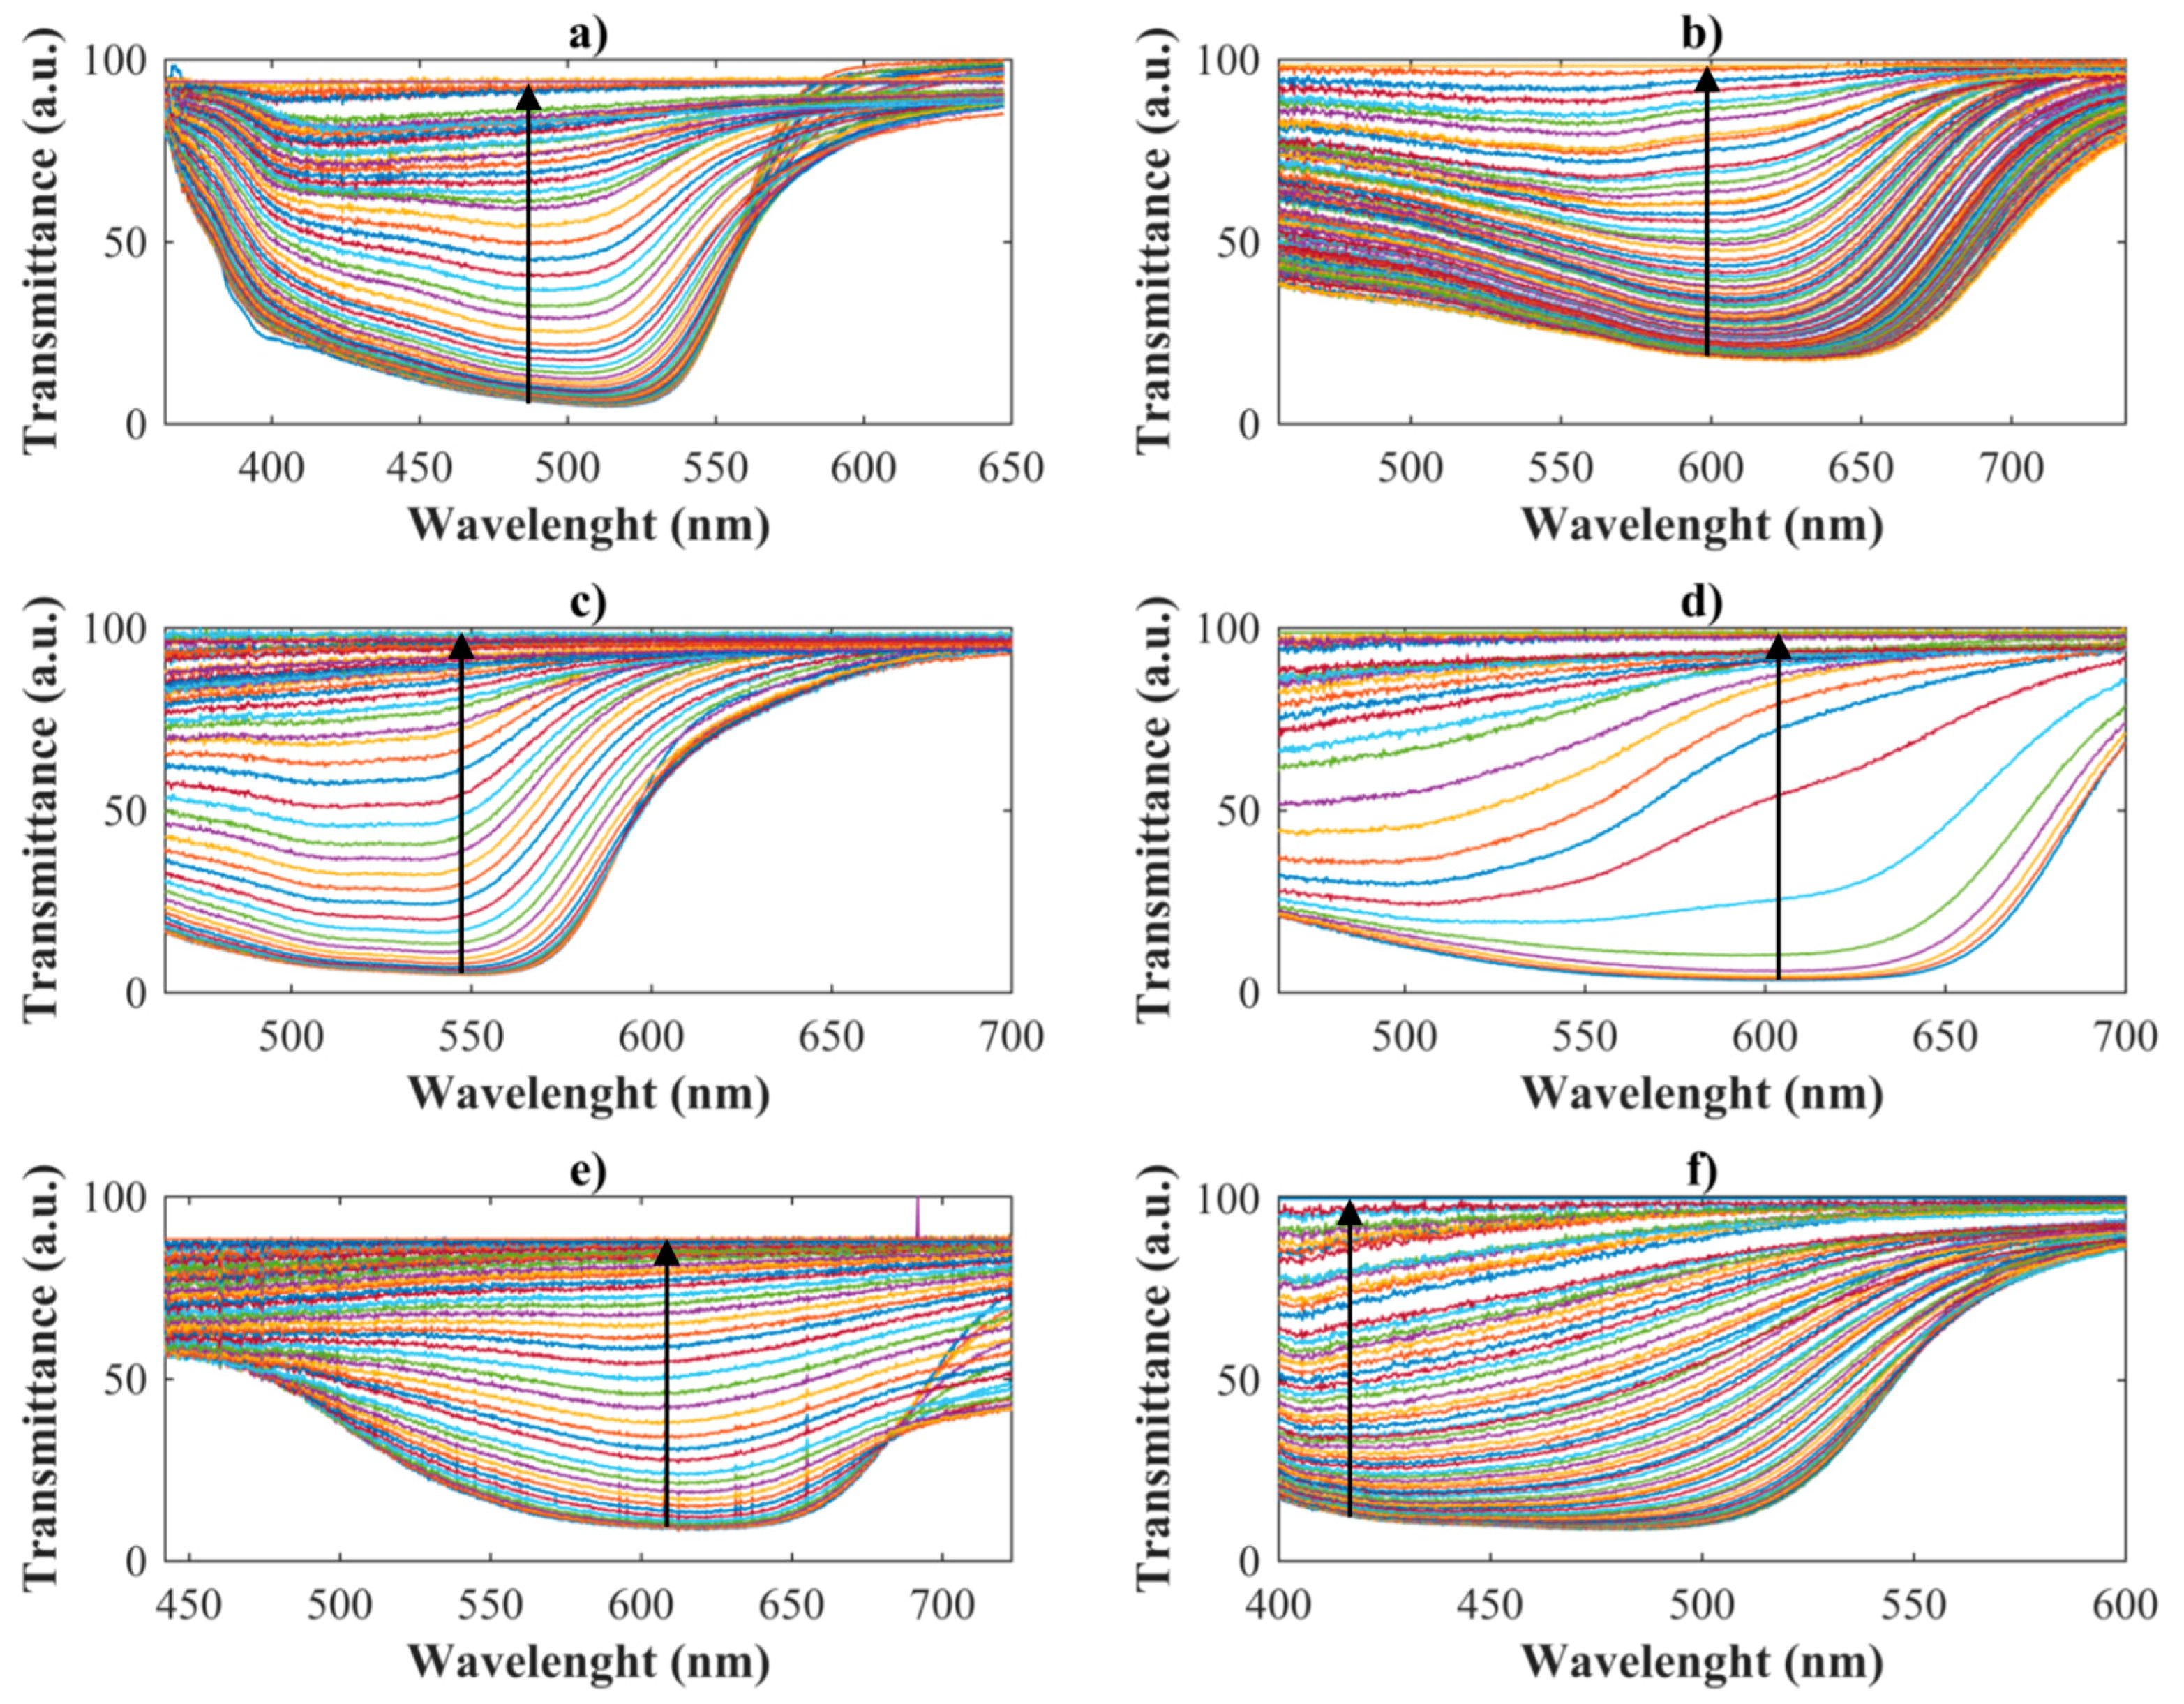
Taking as a reference the spectrum of the TiO2 suspension in deionized water, normalized values of the transmittance of the dye during the oxidation process are shown in Figure 3. These curves also allow determining which wavelengths are more sensitive to the decolorization process according to the characteristics of the dye.
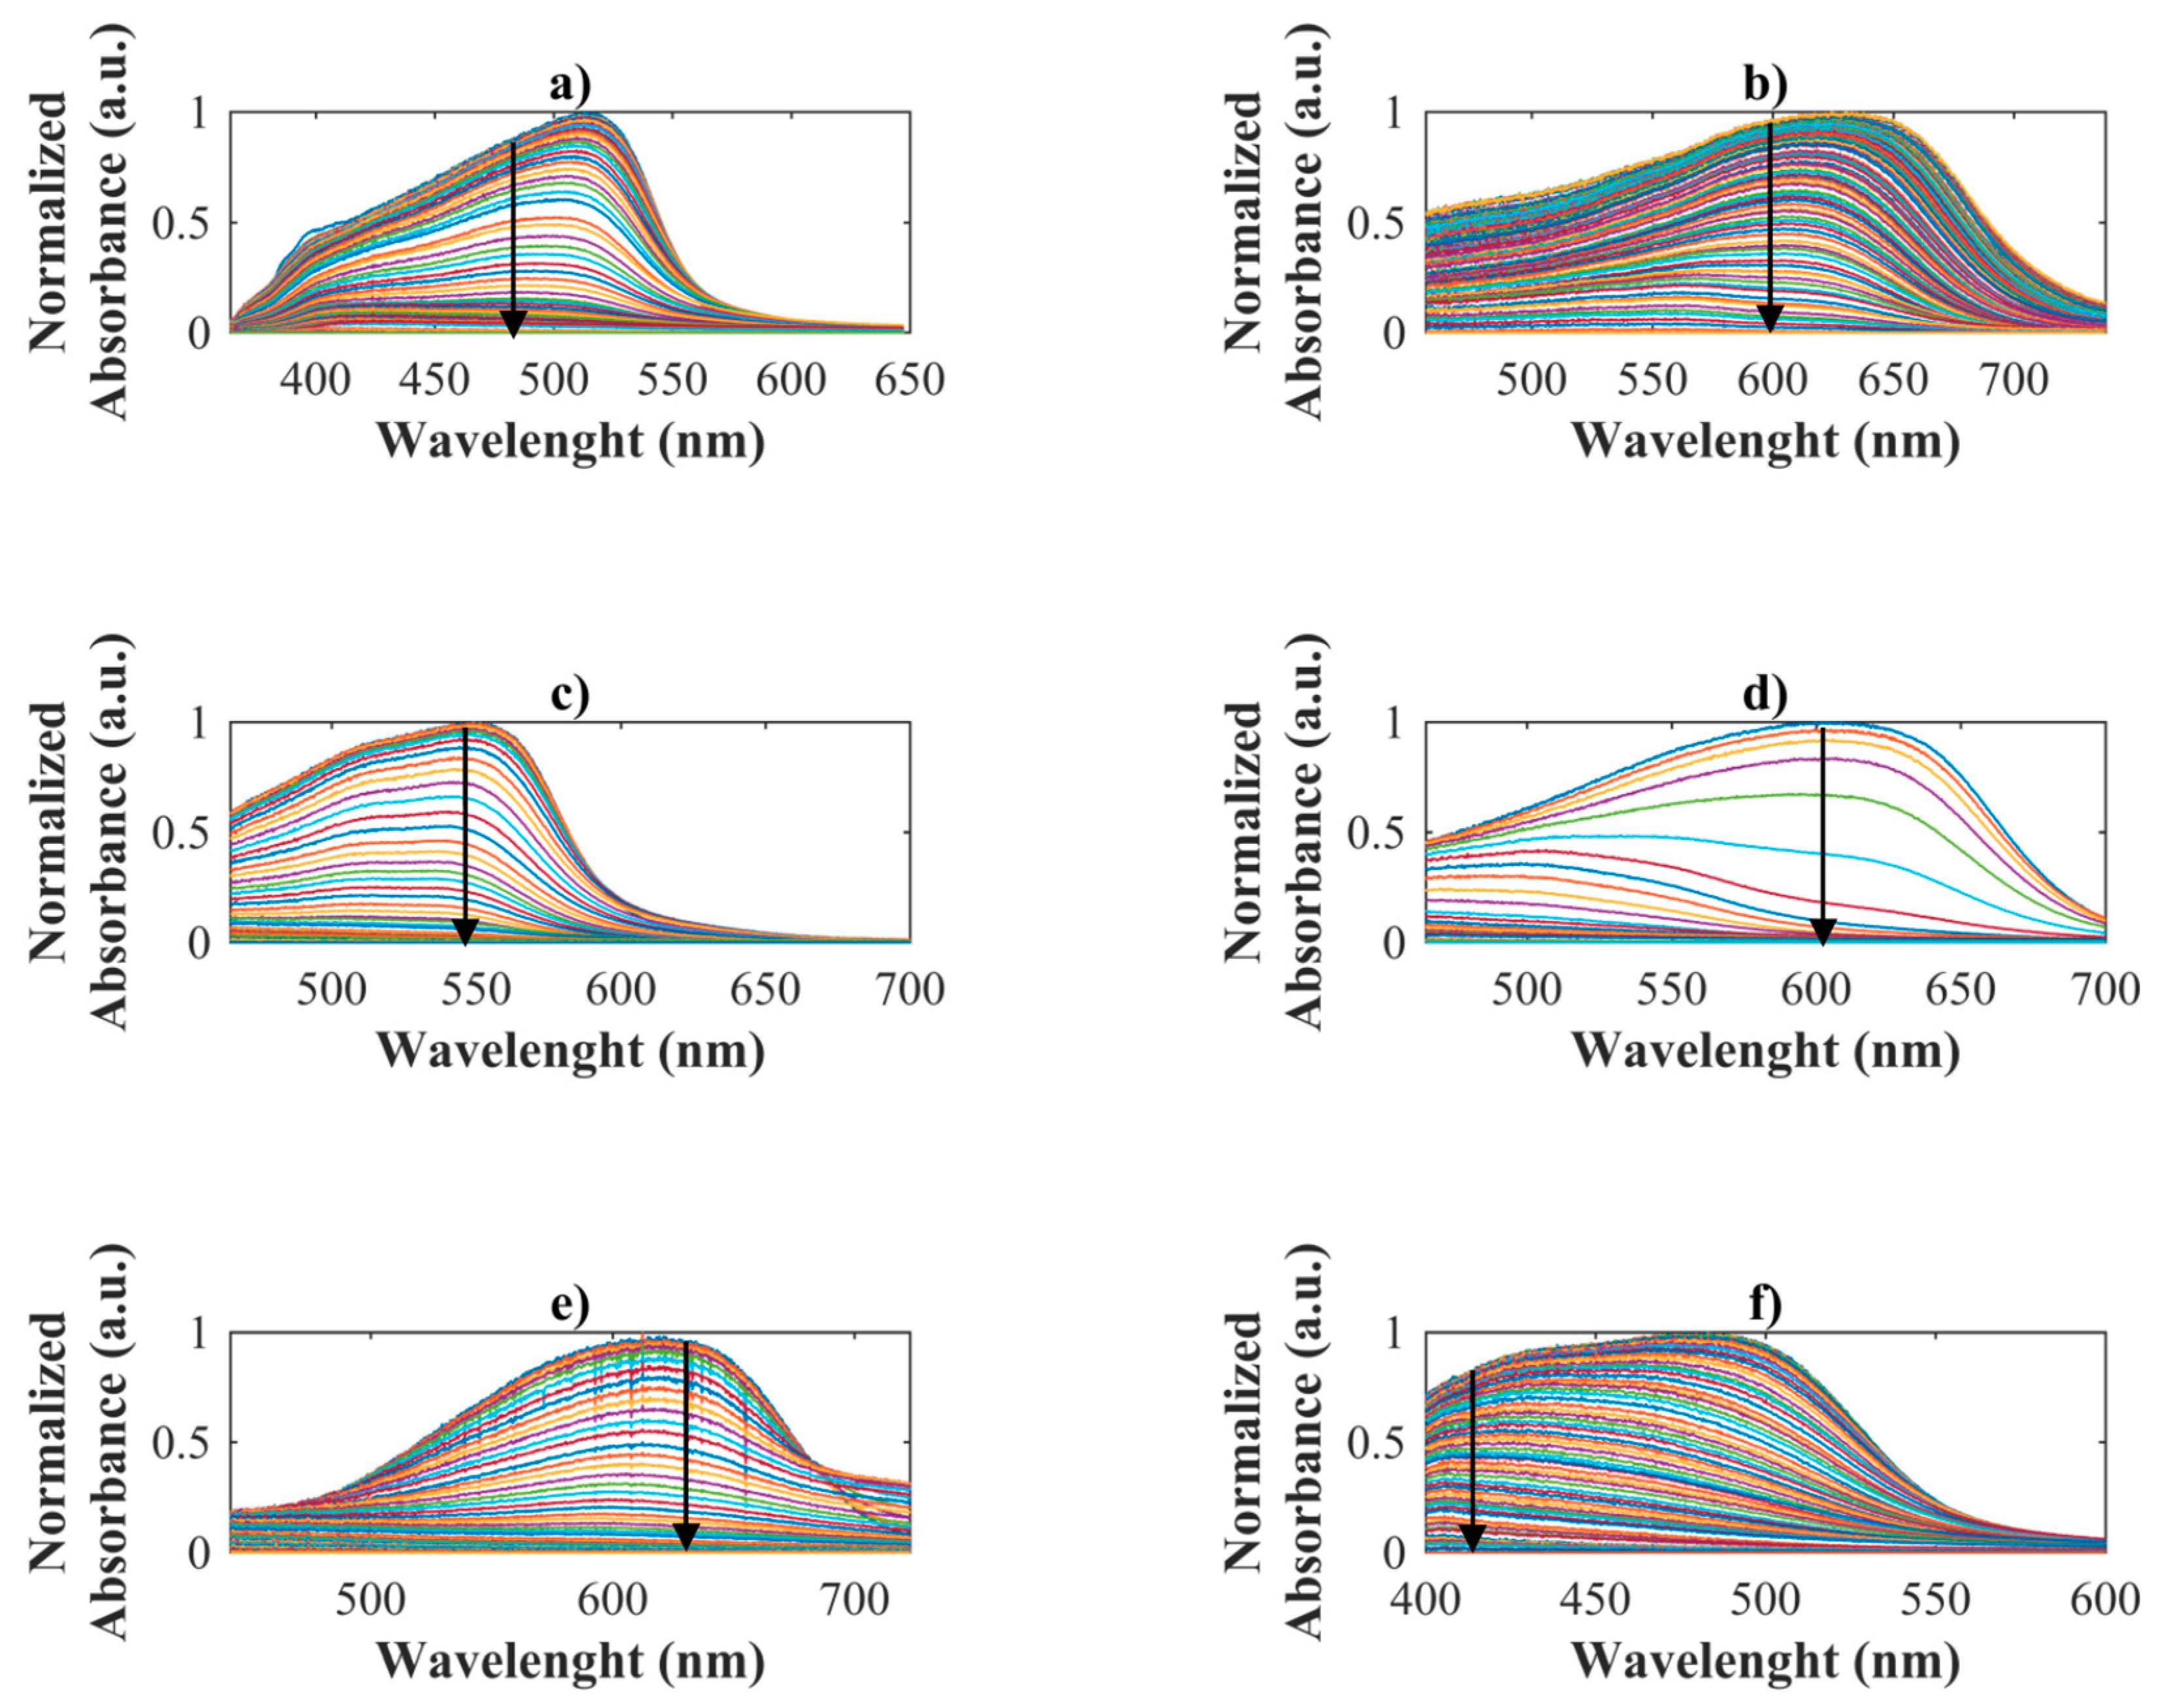
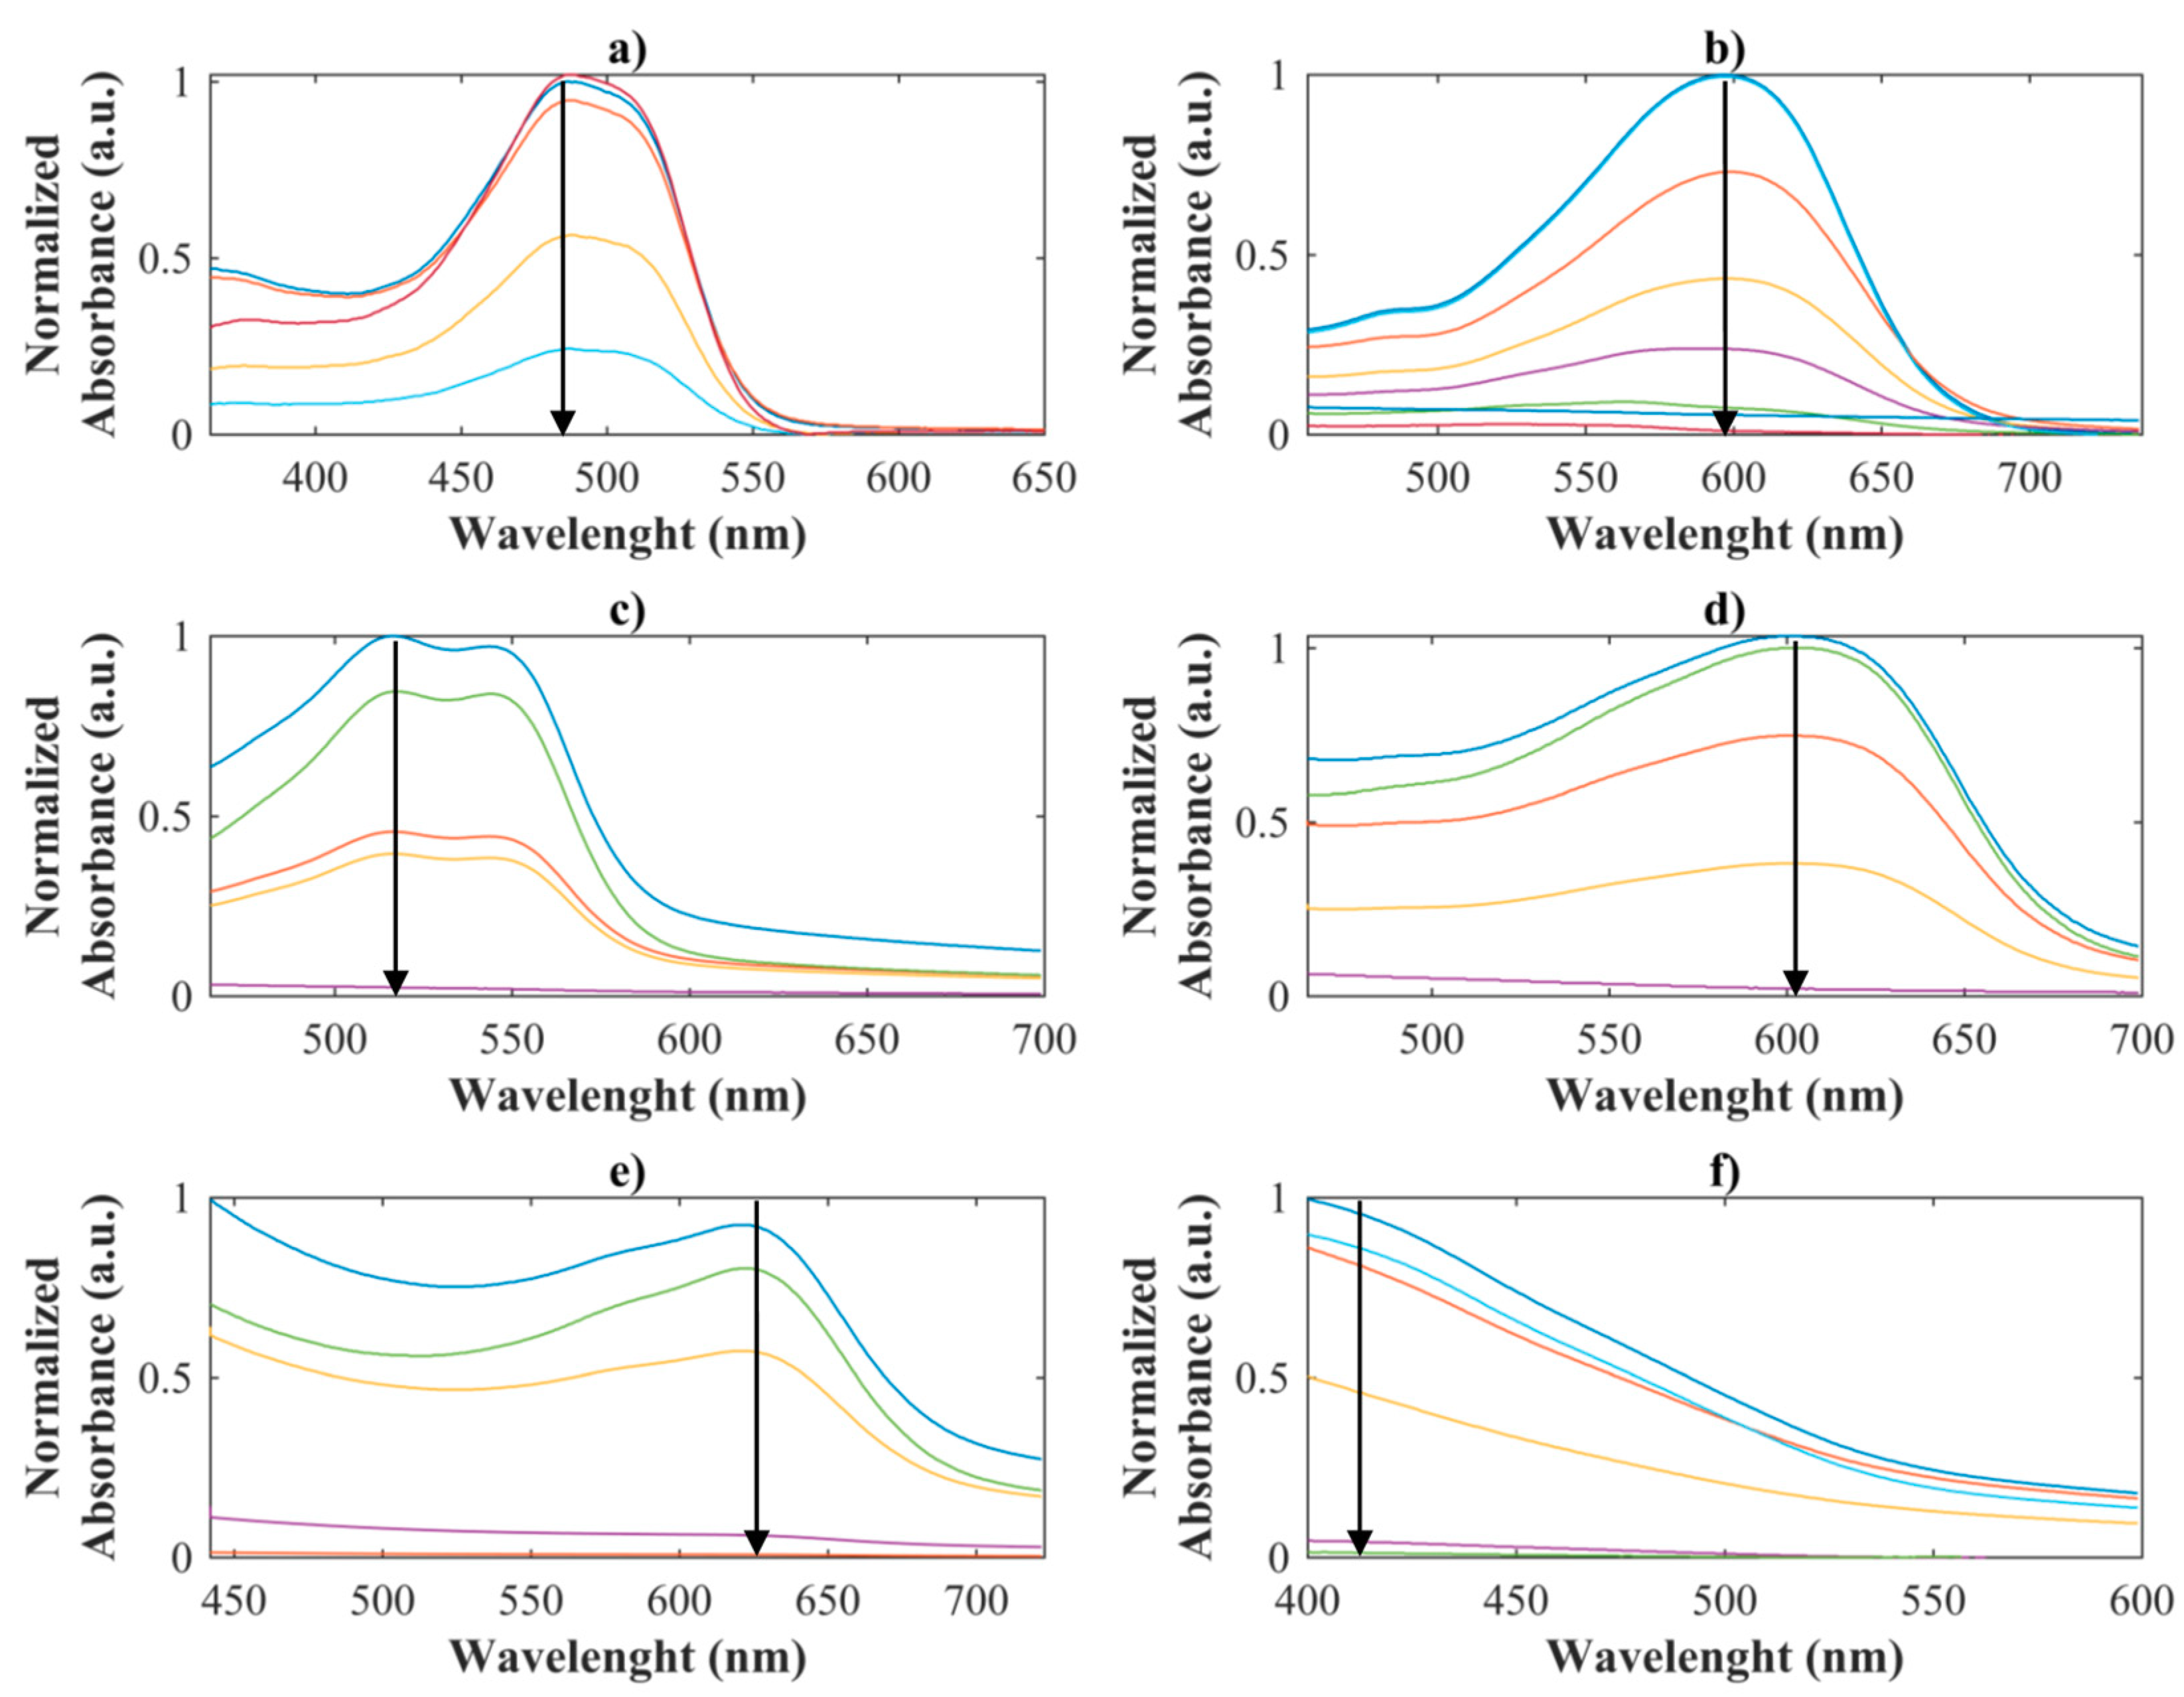
Figure 4 shows a measure of the normalized absorbance of the sample, obtained from the recorded spectra using Equation (2). The absorbance values decrease when the color is removed from the dyed water.
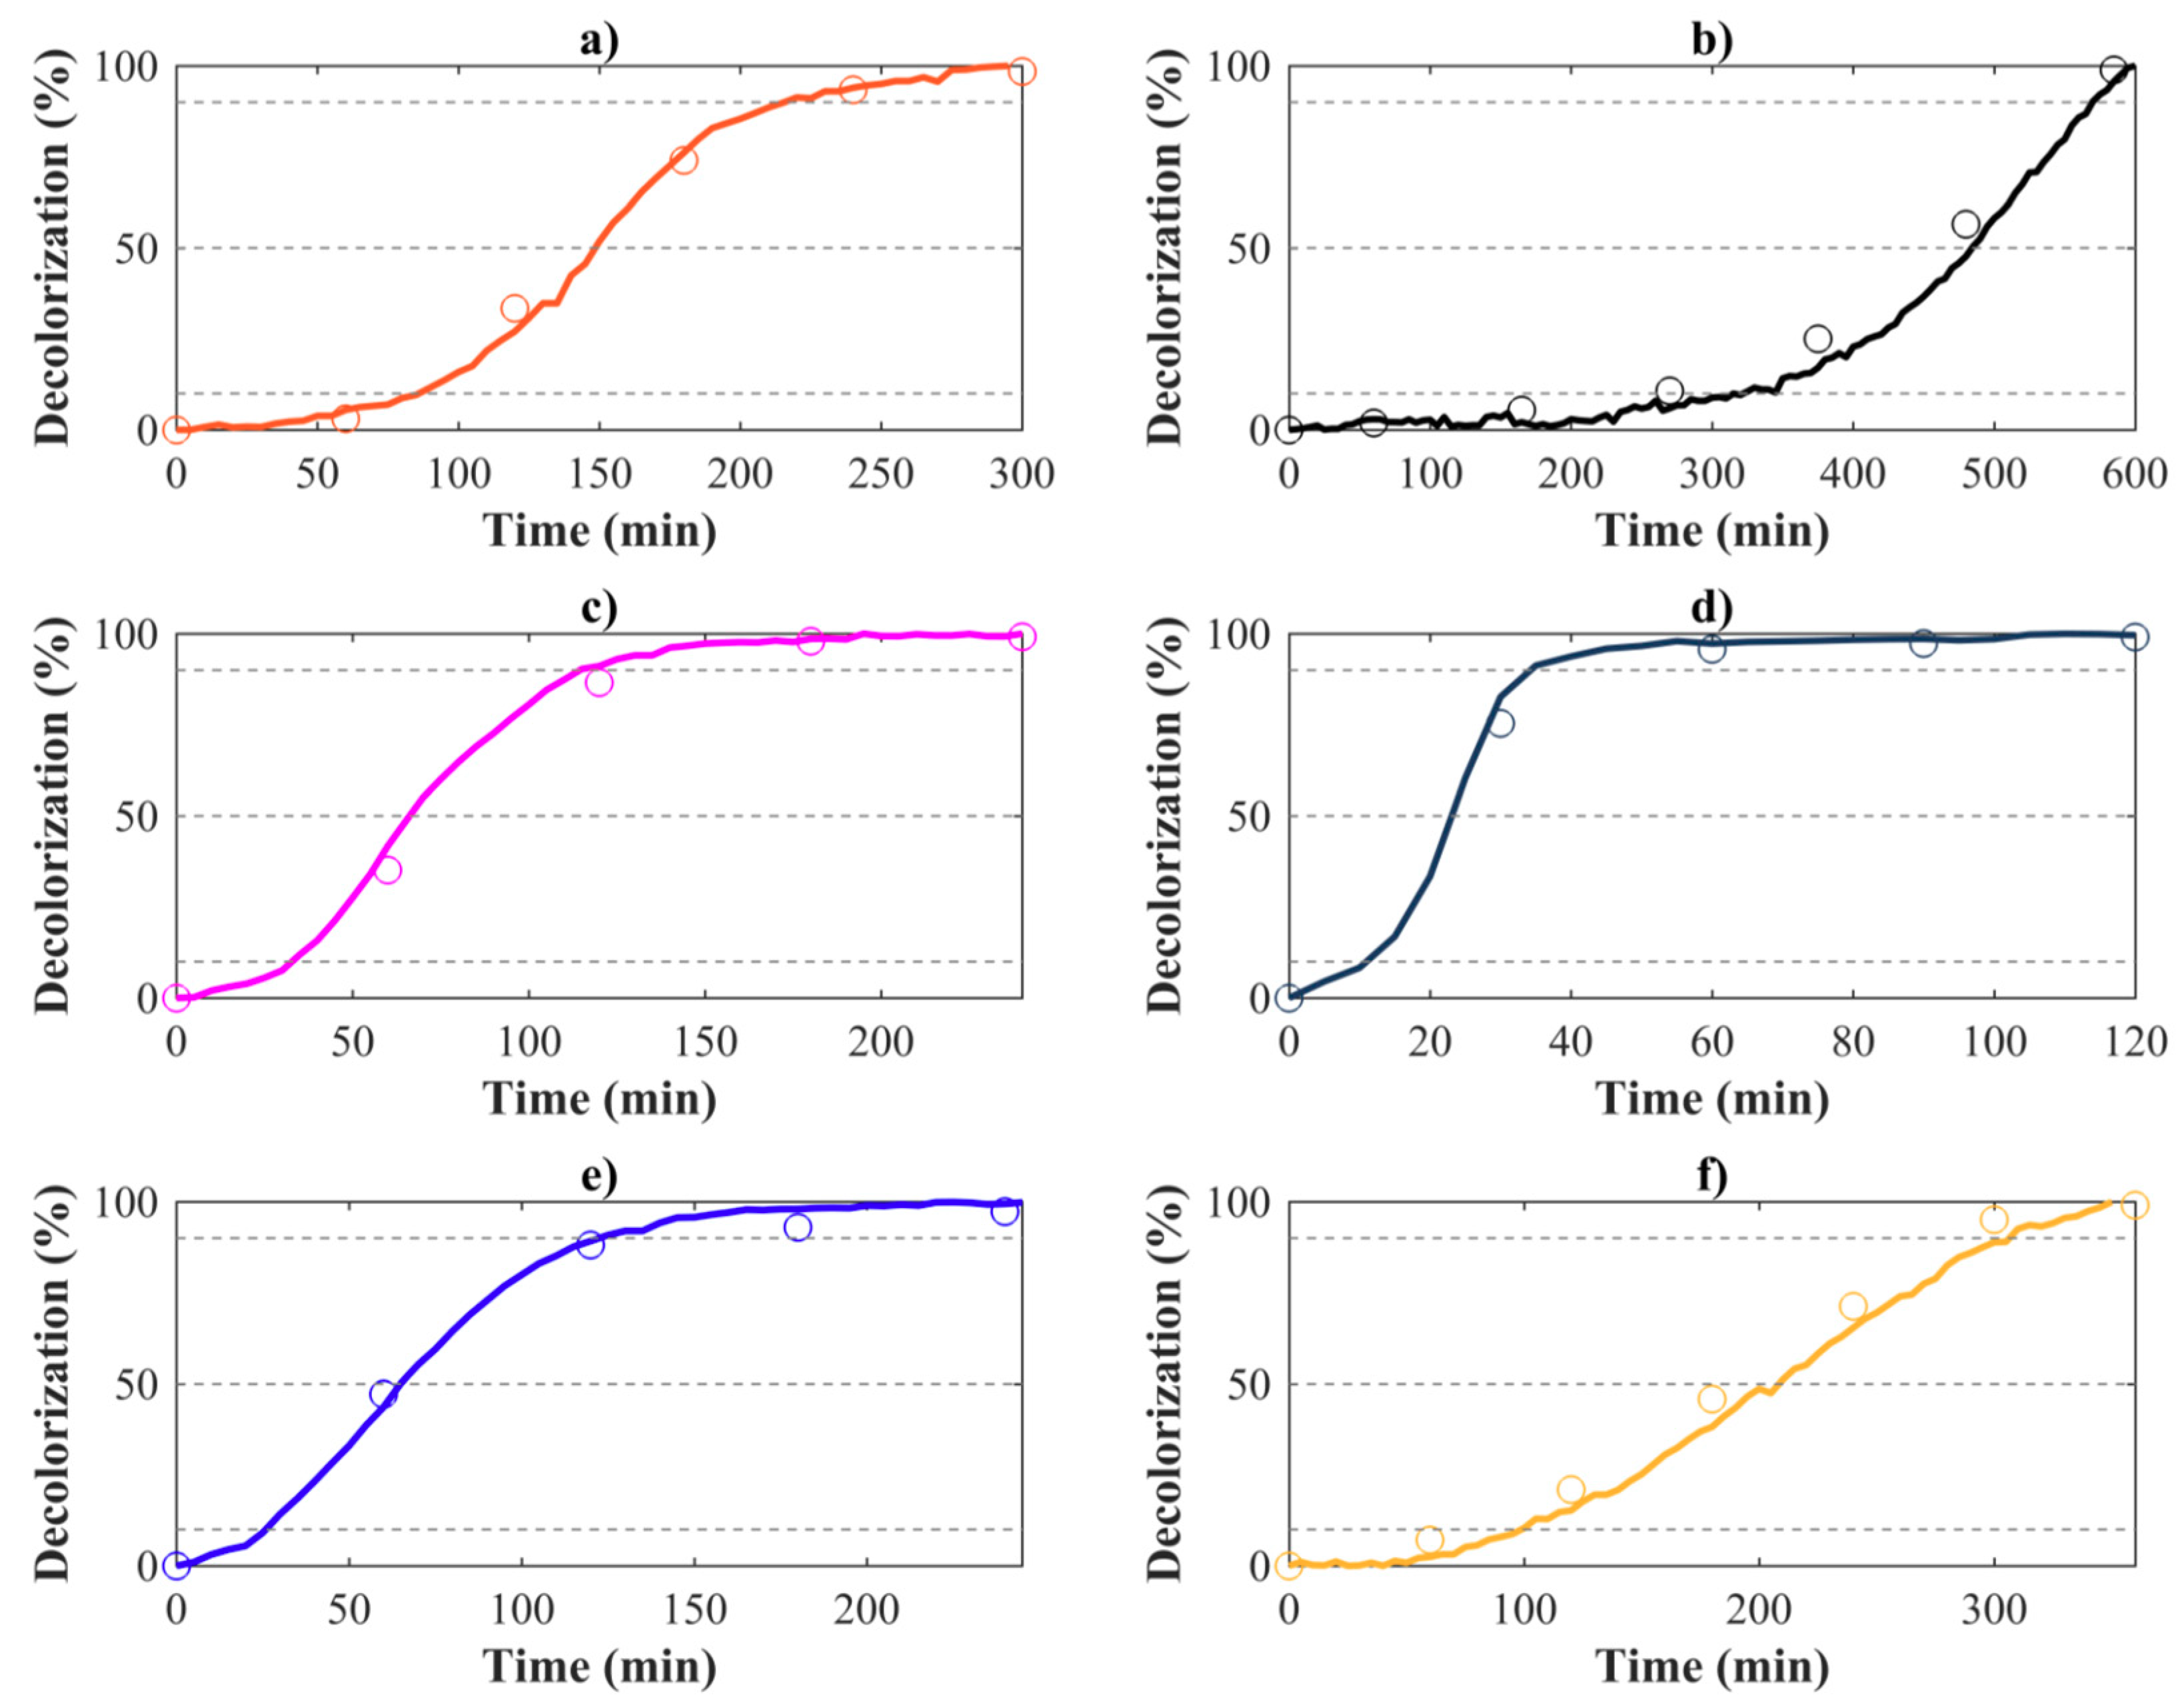
The decolorization percentages, calculated using Equation (3) using the maximum absorbance of each dye (information in Table 2) allow extracting kinetic information from the oxidation process as shown in Figure 5 (continuous line). These figures show that in all cases, 100% of the decolorization was reached with varying oxidation velocities depending of the nature of each dye.
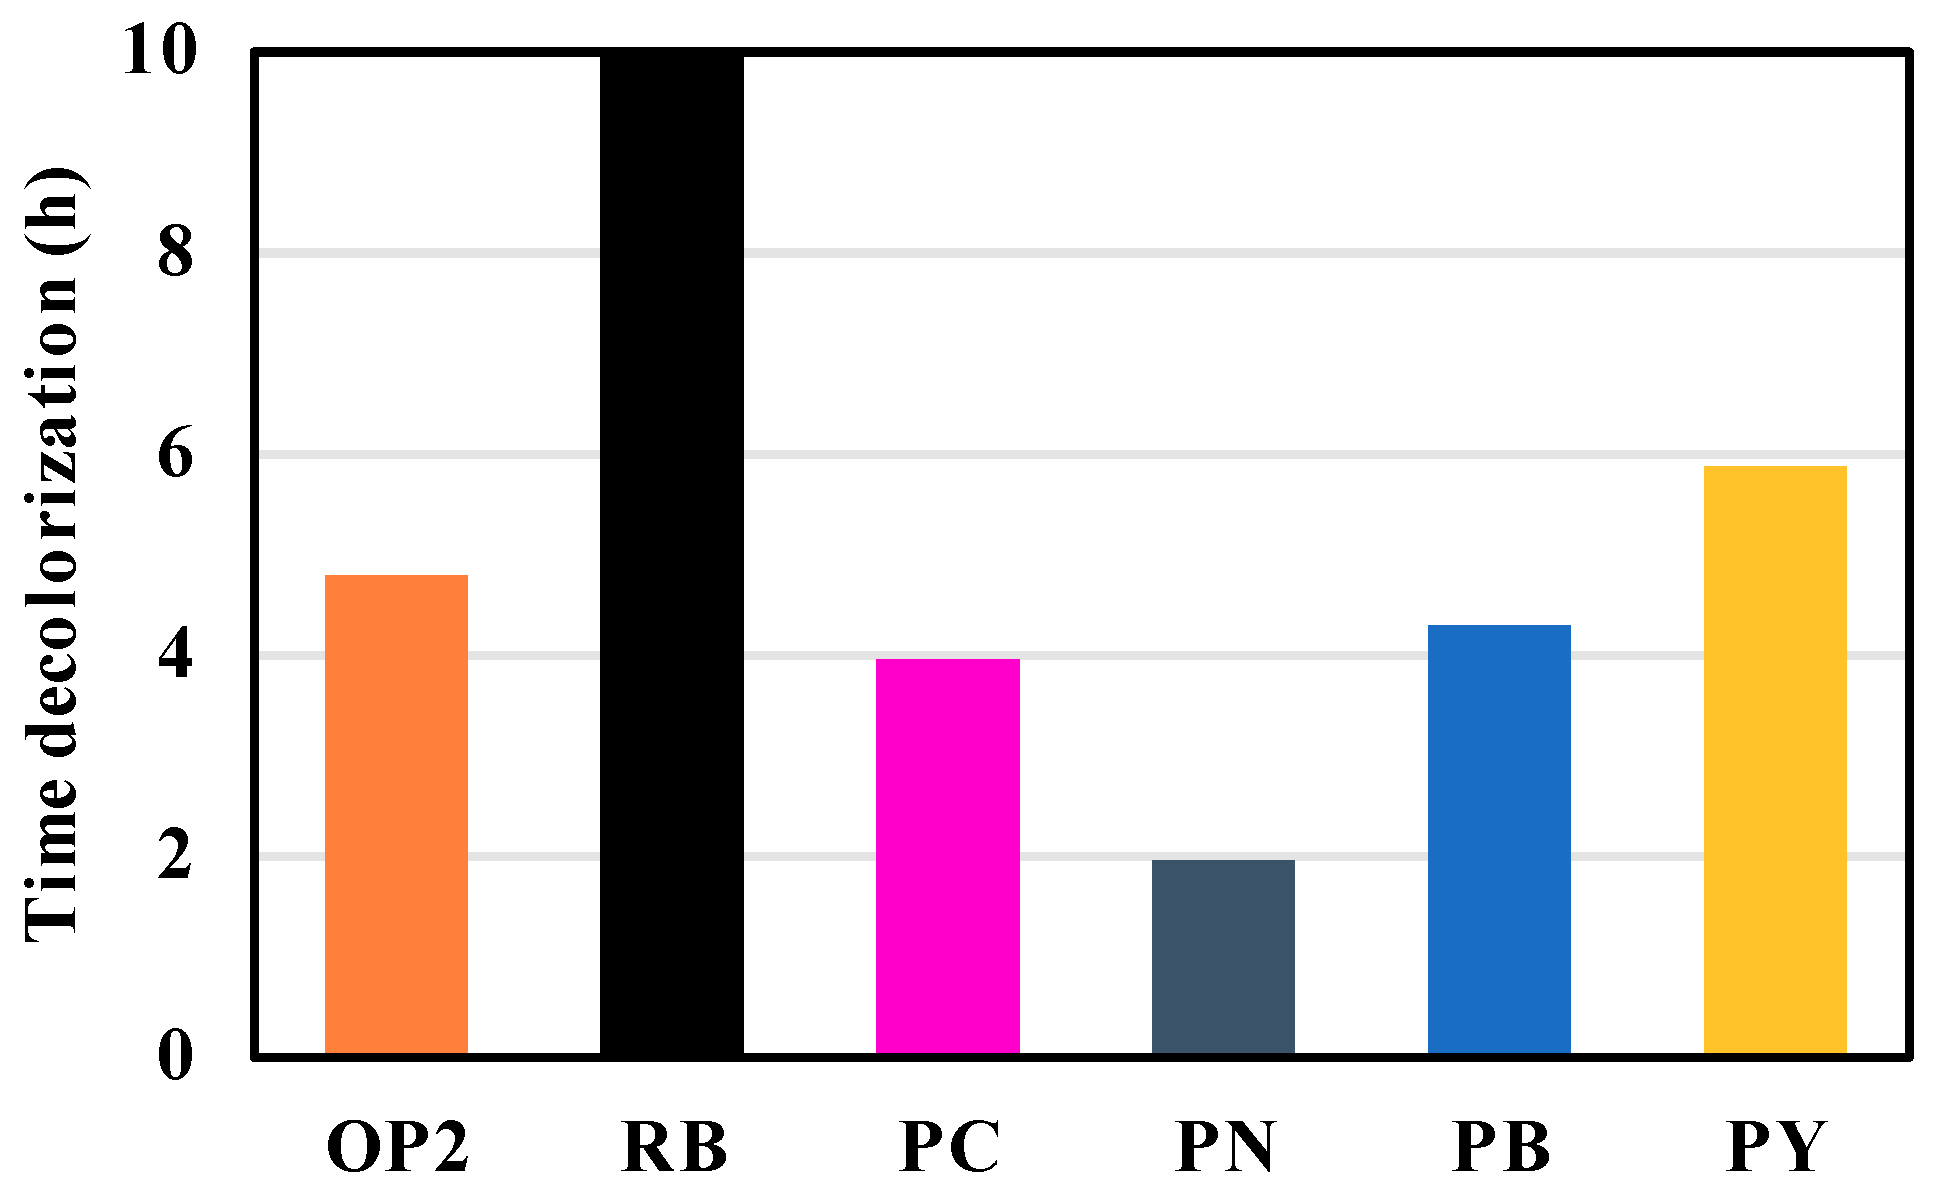
The total decolorization time for each one of the tested dyes is shown in Figure 6, ranging from between 2 h and 10 h. The online measurement allowed making a completely automatized recording.
2.2. Measured Absorbance with Traditional Method
With the aim of comparing the results obtained in this in situ monitoring with the traditional method employed, initial and final samples of each of the photocatalytic processes (each dye) were analyzed. The absorbance values were measured using a 1/20 dilution after centrifugation to remove the titanium dioxide in suspension. Figure 7 shows the absorbance curves obtained by the traditional method; as can be seen, the curves show trends equivalent to those obtained by the in situ method in Figure 4. The absorbance values obtained with the traditional method were used to calculate the decolorization using Equation (3), and were plotted with circular marks in Figure 5.
2.3. Kinetic Values and Energy Consumption
The dyes degradation rate at each experiment follows a first-order kinetic model by Langmuir–Hinshelwood; this model provides the kinetic values (K), calculated from the slope of logarithmic absorbance values versus time of treatment, and the regression coefficients (R2).
In Table 1, the values for both methods corresponding to the regression coefficients (R2), and the kinetic degradation rate (K) are listed. Moreover, since each decolorization process had a different duration, the calculation of the energy consumption are also listed in the table.
3. Discussion
The implementation of this online monitoring technique was developed as an alternative method to the traditional decolorization analysis schemes based on photocatalytic processes.
In this work, it was proved that the scattering produced by suspended titanium dioxide, can be exploited in order to perform the online monitoring of color removal of azo dyes in photocatalytic processes. Thus avoiding alterations or interruptions during the process by maintaining unaltered the photocatalyst concentration, as well as the volume of the contaminant (a crucial condition in minireactors and microreactors).
Since the scattering is present due to the fluctuations in the suspended particles density, this technique could be extended to other semiconductor photocatalysts with different index of refraction or particle dimensions.
In addition, since this technique allows arbitrarily selecting the sampling frequency of the acquired spectra, the precision in the determination of the degradation curve could be improved by taking more samples. Furthermore, with more samples, we can know the exact moment at which the process has reached the total decolorization, or the desired percentage. Moreover, it allows the determination of the degradation to control the dynamics of the process.
4. Materials and Methods
4.1. Reagents
The photocatalyst used was commercial titanium dioxide powder (TiO2) from Sigma-Aldrich, St. Louis, MO, USA (CAS number 13463-67-7, and Product Number 718467), with surface area of 35–65 m2/g, a molecular weight 78.87 g/mol, an average particle diameter of 21 nm, refractive index of 2.6–2.8, pH of 3.5–4.5 and a density of 4.26 g/mL.
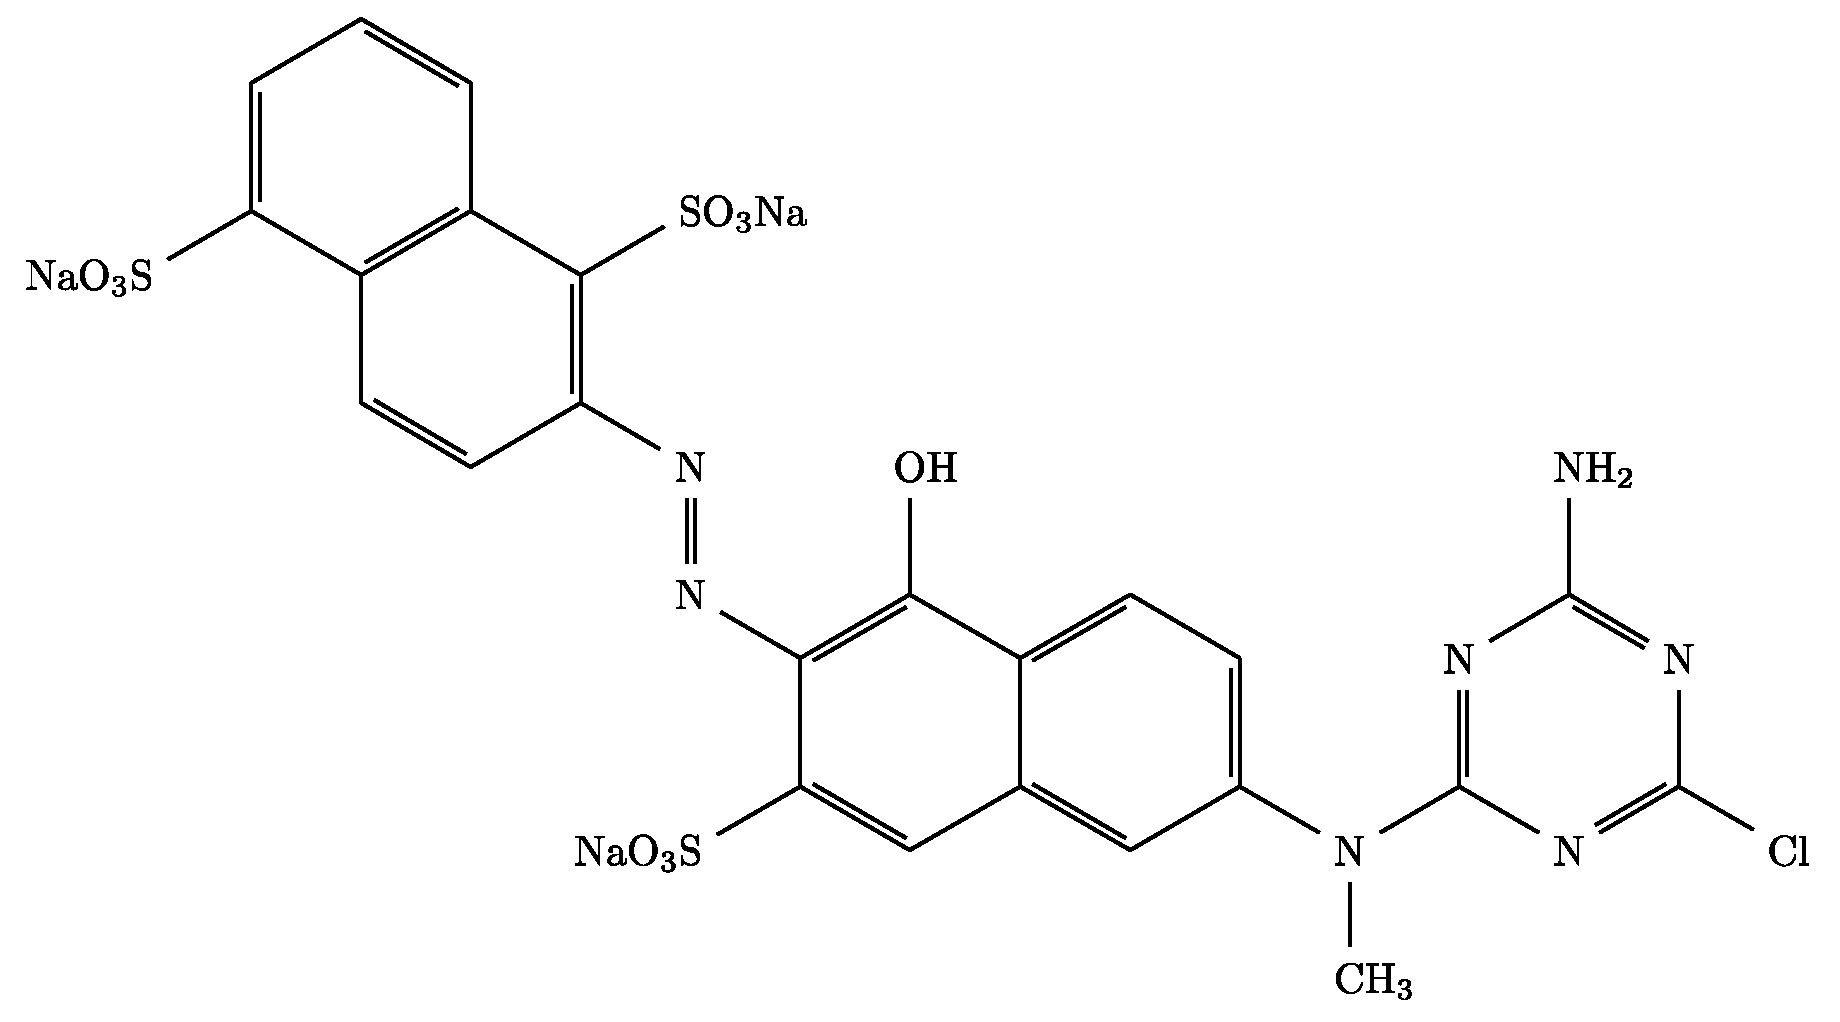
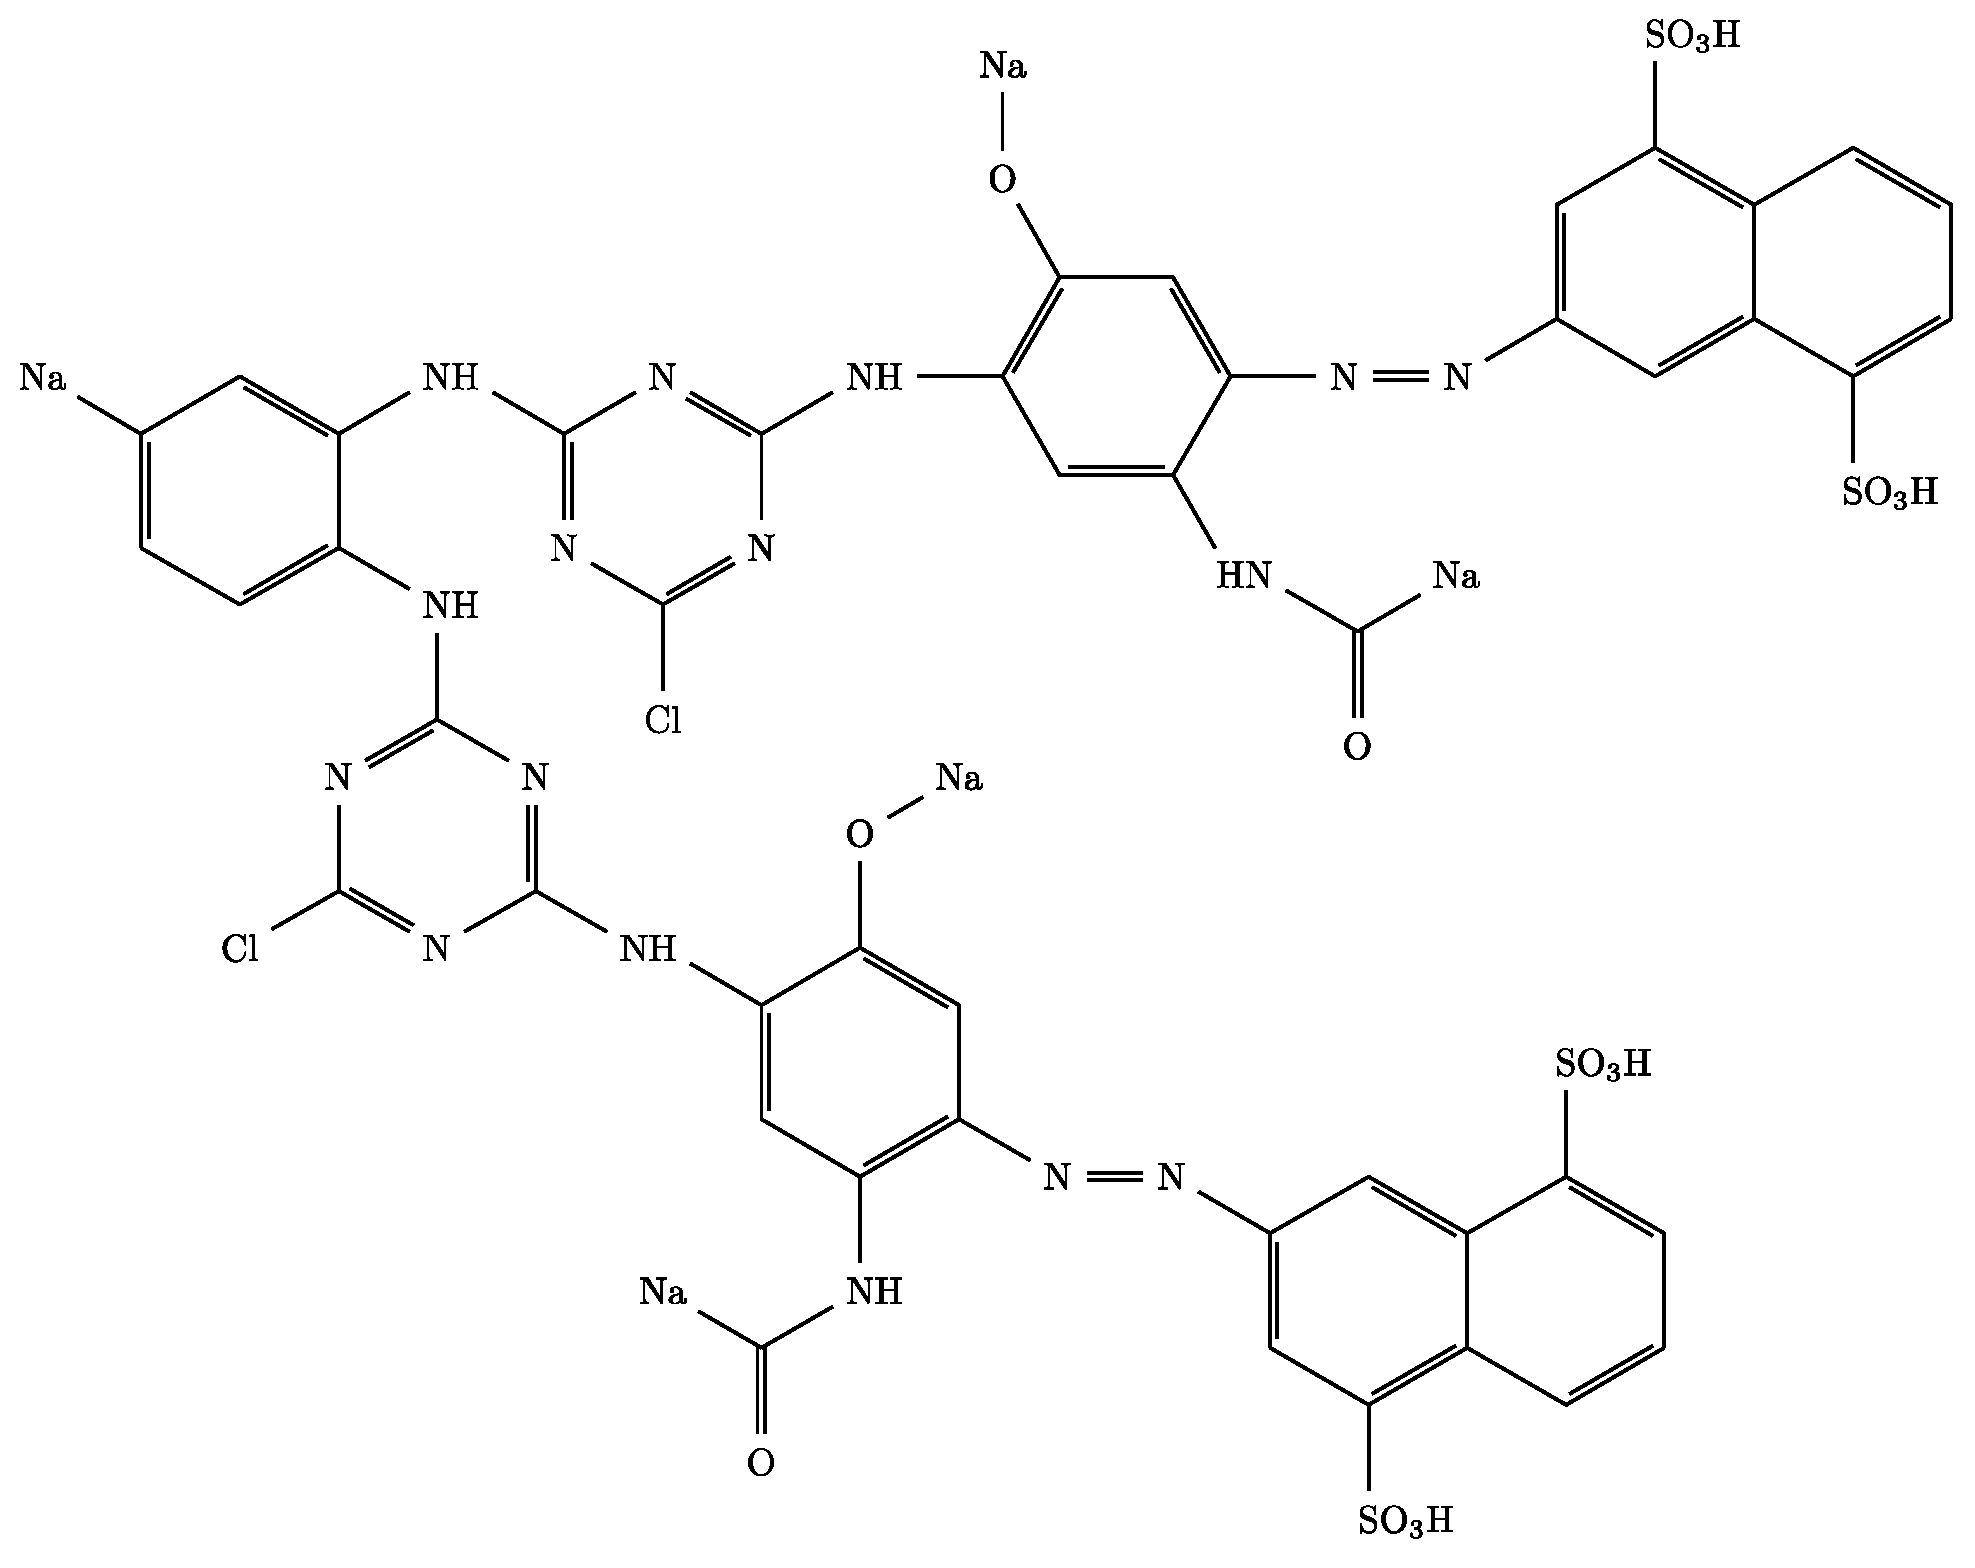
The textile dyes used for this study were six different textile dyes from the azo chromophore group (Table 2), Orange PX-2R dye (CAS No. 12225-85-3, Figure 8), Remazol Black B133 (CAS No. 17095-24-8, Figure 9), Procion Crimson H-EXL (CAS No. 186554-26-7, Figure 10), Procion Navy H-EXL (mixed of CAS No. 186554-26-7, Figure 10 and CAS No. 186554-27-8, Figure 11), Procion Blue H-EXL (CAS No. 124448-55-1, Figure 12), and Procion Yellow H-EXL (mixed of CAS No. 72906-24-2, Figure 13 and CAS No. 72906-25-3, Figure 14).
4.2. Photocatalytic Reactor
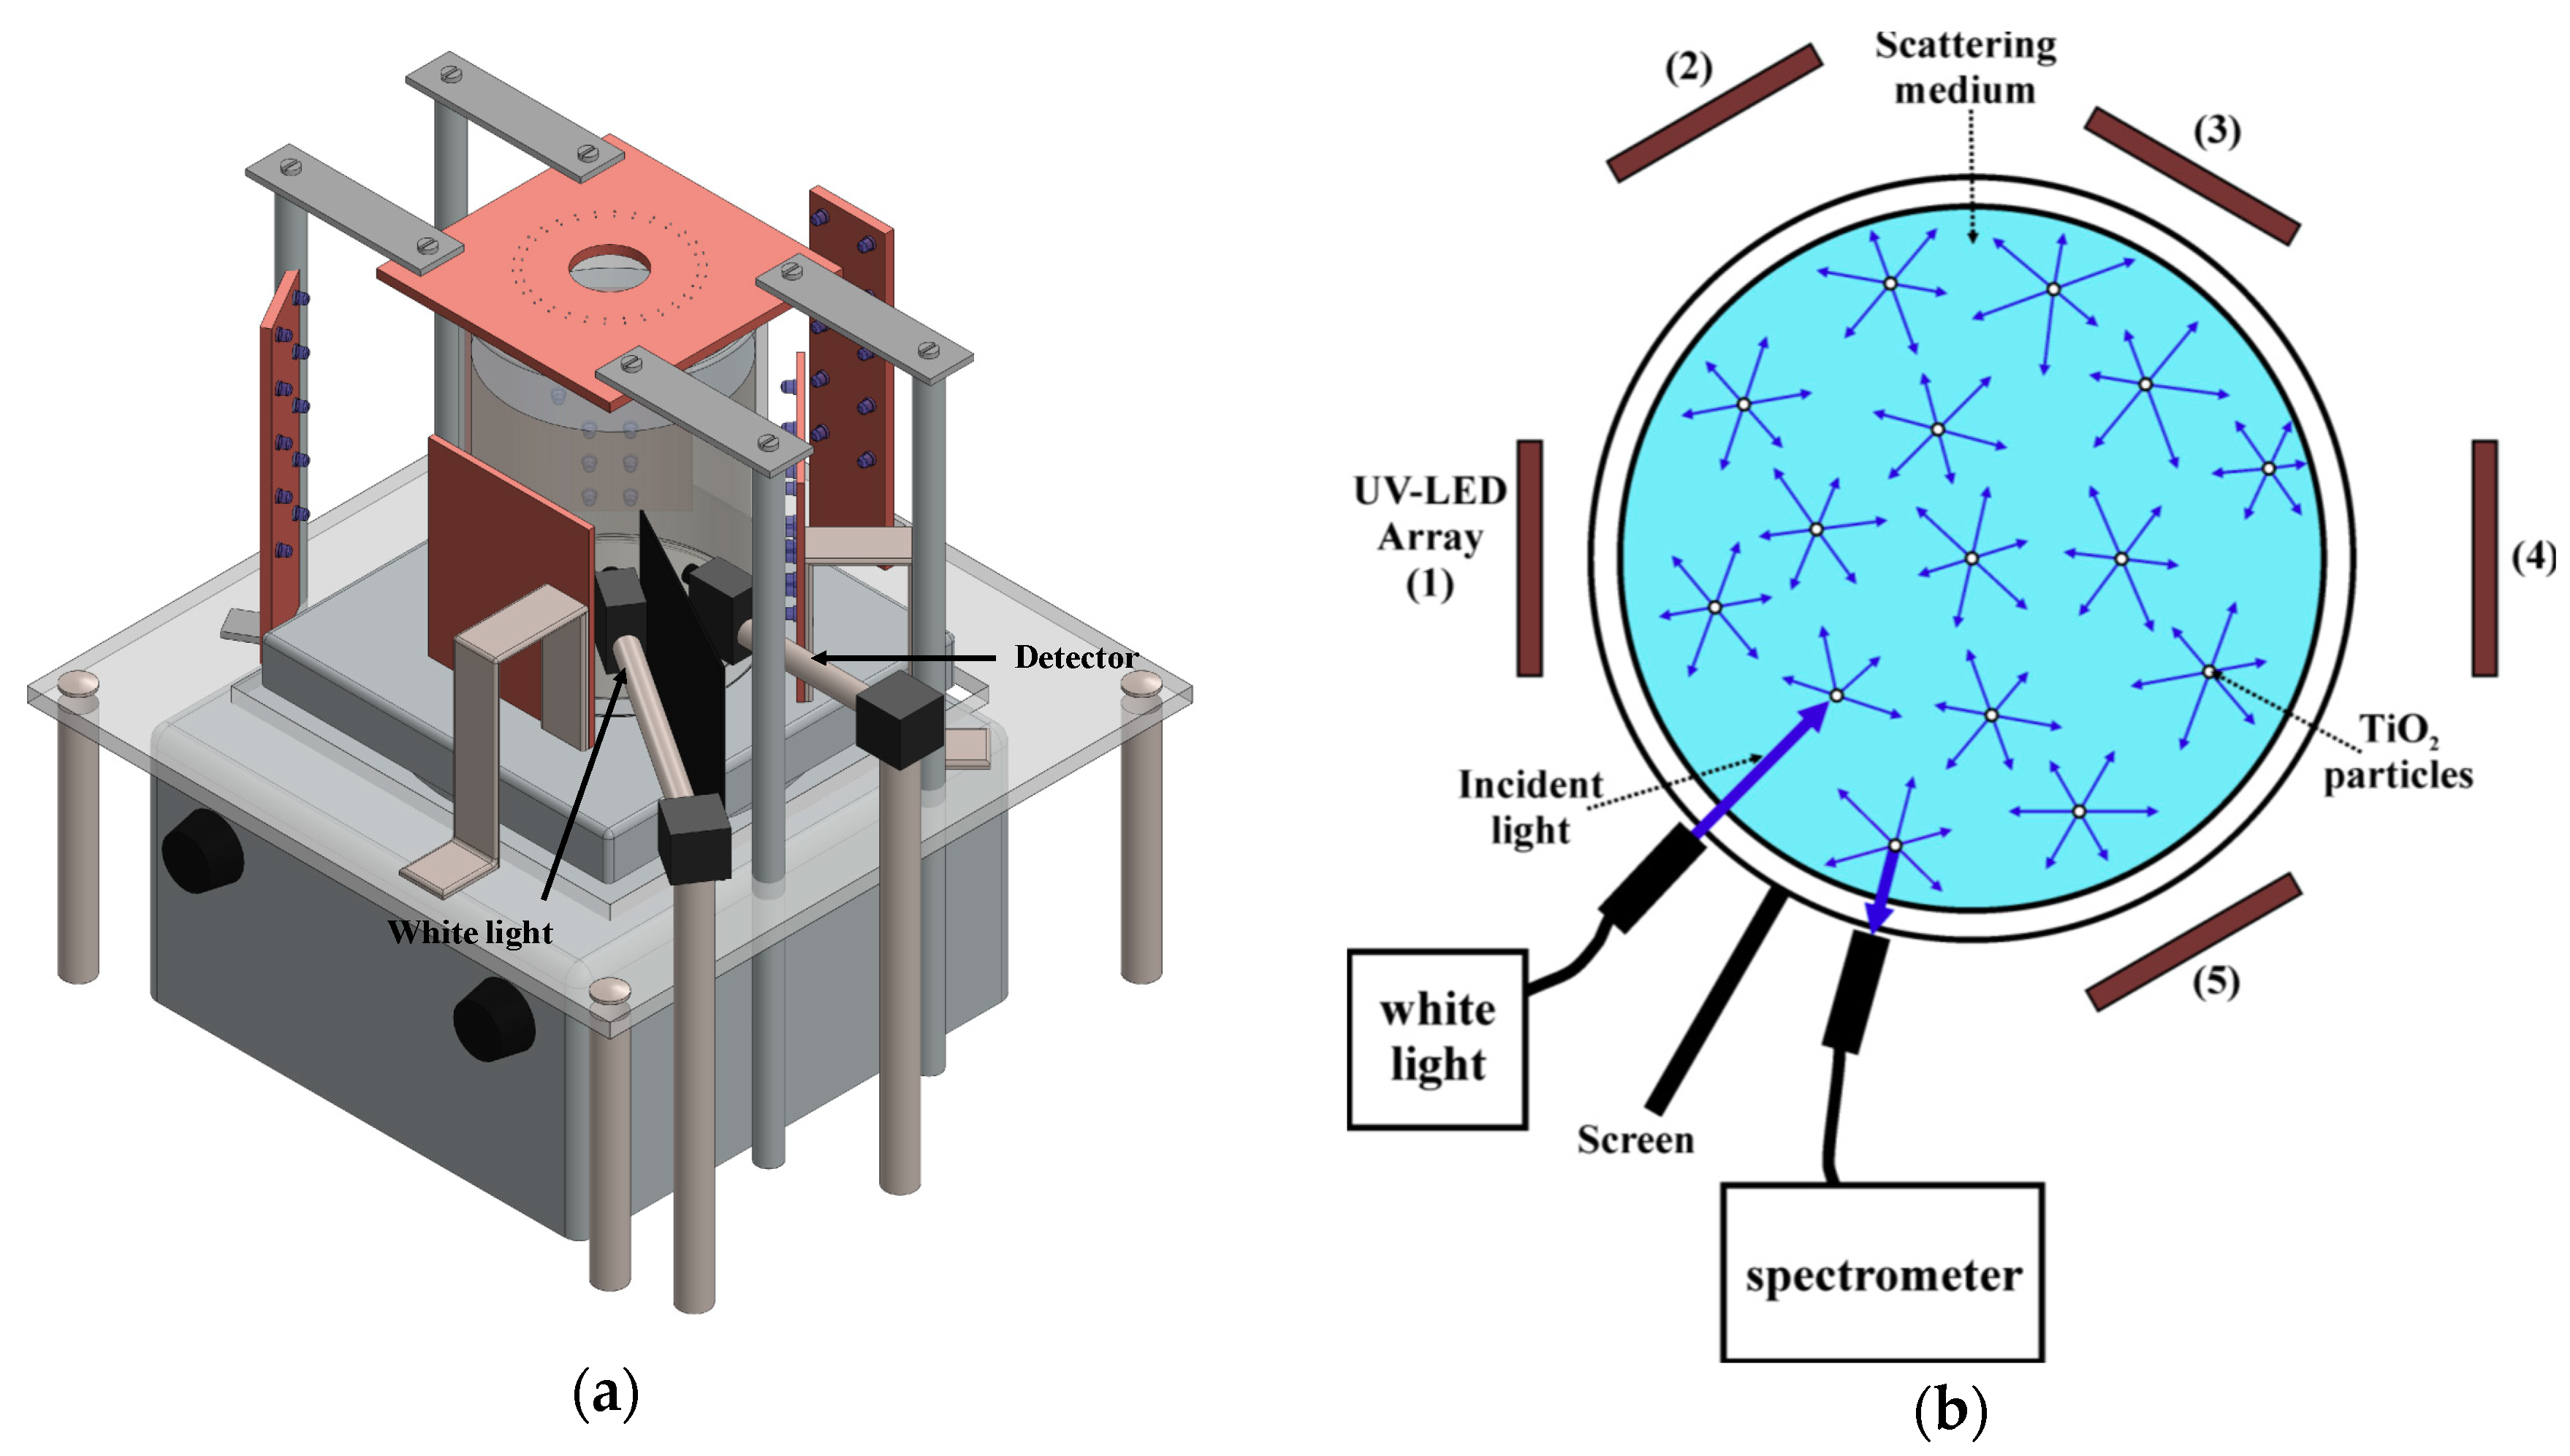
For the measurements of the decolorization, a photocatalytic reactor was built using a 250 mL borosilicate vessel and a magnetic stirrer. Figure 15a shows schematic diagram of the photoreactor with the in situ monitoring configuration, Figure 15b shows the schematic diagram of the effect of the scattering in a photoreactor with suspended catalyst, the reactor has two square UV-LED arrays (UV-LED array (2) and(4)), placed at 120° around the container, at a distance of 8 cm from the center of the reactor, and another three UV-LED arrays placed at 120° around the vessel (UV-LED array (1), (3) and (5)), at a distance of 4 cm from the center of the reactor, and UV-LED radial array, placed in the upper part of the photoreactor, at a distance of 10 cm with respect to the bottom of the vessel.
The geometric configuration and the separation between UV-LEDs was selected with the aim to obtain an illumination as uniform as possible in the reactor using uniform irradiance models [33]. The UV-LEDs were manufactured by Roithner LaserTechnik GmbH, Wien, Austria LED385-33 UVA, with peak wavelength at 385 nm, radiated power of 11 mW and power dissipation of 200 mW.
4.3. Online Monitoring
The online monitoring configuration used a white light lamp (OSL1-EC from Thorlabs GmbH, Munich, Germany), whose irradiance is emitted in a spectral range different from the photocatalyst activation zone (<380 nm) to avoid the alteration of the photocatalytic process, this lamp was placed normal to the reactor’s surface, illuminating in the radial direction to induce the scattering from the catalyst in suspension. Also, a fiber bundle connected to an spectrometer (Andor Shamrock 303i by Andor Technology Ltd., Belfast, UK) was oriented in order to collect the scattered radiation from the reactor, but avoiding direct ultraviolet light from the UV sources of the photocatalytic process, in addition between the reference lamp and the spectrometer a barrier was placed to avoid erroneous readings.
The spectrometer was configured to take a sample every five minutes until the total decolorization of each dye was reached.
The transmittance was calculated by:
where I is the transmitted light intensity, and I0 is the original light intensity.
Absorbance can be calculated given its relation to transmittance by:
where %T is the transmittance as a percentage.
The percentage of decolorization was calculated by:
where Abs0 is the initial absorbance, and Abs is the absorbance at time t of the taken sample.
4.4. Measurements with Traditional Method
To measure the absorbance value by the traditional method it is necessary to take a sample, and to remove the titanium dioxide (e.g., filtration, centrifugation), to be able to use the spectrophotometer (UV-2401 from Shimadzu Europa GmbH, Duisburg, Germany) at the maximum wavelength of the visible spectrum of each dye (Table 2). Subsequently, the percentage of decolorization can be calculated using Equation (3).
4.5. Photocatalytic Decolorization Experiments
To simulate the effluents after the dyeing process, 250 mL of distilled water was mixed with 0.1 g/L of each dye. Before photodegradation, the solution was mixed with 1 g/L of photocatalyst in suspension and then the mixture was put on magnetic stirrer in complete darkness for 30 min to ensure the adsorption of the dye on the surface of the catalyst. After 30 min, the UV-LED source was turned on with the mixture in constant agitation. The catalytic process was carried out until the total color removal of each dye was reached. Initial and final traditional samples of each dye were taken to verify the decolorization values obtained with online monitoring against the traditional method.
5. Conclusions
In this study, we developed a simple non-invasive online monitoring technique for photocatalytic reactors based on the detection of the variations in the decolorization of textile dyes by exploiting the light scattering produced by the photocatalyst in suspension.
The presented online monitoring technique operates regardless of the geometry or dimensions of the reactor. For the conducted experimental scenarios, the lighting source remained external; nevertheless, this technique also can be applied in photoreactors with traditional immersive lighting.
By exploiting the light scattering physical process, it can be achieved the online monitoring of laboratory scale photoreactors (mini and micro reactors), while avoiding the use of supplementary procedures during the photocatalytic process, as is the case of reactors with optical modified characteristics (that permit lighting filtering techniques), or the use of immobilized photocatalysts.
Although for the experimental scenarios presented in this study a white light lamp was used, it is also possible to use other types of lighting sources (e.g., laser or LED). Thus, since the degradation assessment in the ultraviolet zone is also possible, the online monitoring is not only restricted to the decolorization processes, allowing online degradation monitoring for different applications (e.g., organic matter monitoring).
For this line of research, future work can be focused on developing and implementing automatic control systems that enable the deactivation of the lighting source when the sample reaches the desired degradation percentage, avoiding unnecessary energy consumption, as well as using in situ monitoring to analyze different types of contaminants.
Author Contributions
Conceptualization, J.T. and L.R.; Formal analysis, T.T.-T.; Investigation, T.T.-T.; Validation, J.T. and L.R.; Writing – original draft, T.T.-T.; Writing – review and editing, J.T. and L.R. All authors approved the final version of the manuscript.
Funding
This research received no external funding.
Acknowledgments
The authors are grateful for the scholarship grant for the author Tecilli Tapia (417993) from National Council of Science and Technology of Mexico (CONACyT), and the Laboratory of Environmental Pollution Control of INTEXTER, for the material provided.
Conflicts of Interest
The authors declare no conflict of interest.
References
- Maučec, D.; Šuligoj, A.; Ristić, A.; Dražić, G.; Pintar, A.; Tušar, N.N. Titania versus zinc oxide nanoparticles on mesoporous silica supports as photocatalysts for removal of dyes from wastewater at neutral pH. Catal. Today 2017, 310, 32–41. [Google Scholar] [CrossRef]
- Chiu, Y.-H.; Chang, T.-F.M.; Chen, C.-Y.; Sone, M.; Hsu, Y.-J. Mechanistic Insights into Photodegradation of Organic Dyes Using Heterostructure Photocatalysts. Catalysts 2019, 9, 430. [Google Scholar] [CrossRef]
- Rahman, A.; Urabe, T.; Kishimoto, N. Color Removal of Reactive Procion Dyes by Clay Adsorbents. Procedia Environ. Sci. 2013, 17, 270–278. [Google Scholar] [CrossRef] [Green Version]
- Jo, W.K.; Tayade, R.J. Recent developments in photocatalytic dye degradation upon irradiation with energy efficient light emitting diodes. Chin. J. Catal. 2014, 35, 1781–1792. [Google Scholar] [CrossRef]
- Meerbergen, K.; Crauwels, S.; Willems, K.A.; Dewil, R.; Van Impe, J.; Appels, L.; Lievens, B. Decolorization of reactive azo dyes using a sequential chemical and activated sludge treatment. J. Biosci. Bioeng. 2017, 124, 668–673. [Google Scholar] [CrossRef] [PubMed]
- Mendoza-Basilio, C.A.; Yee-Madeira, H.; Ramirez-Rodriguez, T.; Colindres, P. Oxidation of textile dye reactive yellow 84 in aqueous solution in order to reuse treated water. Rev. Mex. Ing. Química 2017, 16, 581–589. [Google Scholar]
- Gümüş, D.; Akbal, F. Photocatalytic Degradation of Textile Dye and Wastewater. Water, Air, Soil Pollut. 2011, 216, 117–124. [Google Scholar] [CrossRef]
- Bilińska, L.; Gmurek, M.; Ledakowicz, S. Textile wastewater treatment by AOPs for brine reuse. Process Saf. Environ. Prot. 2017, 109, 420–428. [Google Scholar] [CrossRef]
- Bethi, B.; Sonawane, S.H.; Rohit, G.S.; Holkar, C.R.; Pinjari, D.V.; Bhanvase, B.A.; Pandit, A.B. Investigation of TiO2 photocatalyst performance for decolorization in the presence of hydrodynamic cavitation as hybrid AOP. Ultrason. Sonochem. 2016, 28, 150–160. [Google Scholar] [CrossRef]
- Herrmann, J.M. Fundamentals and misconceptions in photocatalysis. J. Photochem. Photobiol. A Chem. 2010, 216, 85–93. [Google Scholar] [CrossRef]
- Gągol, M.; Przyjazny, A.; Boczkaj, G. Wastewater treatment by means of advanced oxidation processes based on cavitation—A review. Chem. Eng. J. 2018, 338, 599–627. [Google Scholar] [CrossRef]
- Ibhadon, A.; Fitzpatrick, P. Heterogeneous Photocatalysis: Recent Advances and Applications. Catalysts 2013, 3, 189–218. [Google Scholar] [CrossRef] [Green Version]
- Van Walsem, J.; Roegiers, J.; Modde, B.; Lenaerts, S.; Denys, S. Determination of intrinsic kinetic parameters in photocatalytic multi-tube reactors by combining the NTUm-method with radiation field modelling. Chem. Eng. J. 2018, 354, 1042–1049. [Google Scholar] [CrossRef]
- Dougna, A.A.; Gombert, B.; Kodom, T.; Djaneye-Boundjou, G.; Boukari, S.O.B.; Leitner, N.K.V.; Bawa, L.M. Photocatalytic removal of phenol using titanium dioxide deposited on different substrates: Effect of inorganic oxidants. J. Photochem. Photobiol. A Chem. 2015, 305, 67–77. [Google Scholar] [CrossRef]
- Bukman, L.; de Freitas, C.F.; Caetano, W.; Fernandes, N.R.C.; Hioka, N.; Batistela, V.R. Kinetic spectrophotometric method for real-time monitoring of ultraviolet photoreactions: A mini-photoreactor. Spectrochim. Acta - Part A Mol. Biomol. Spectrosc. 2019, 211, 330–335. [Google Scholar] [CrossRef] [PubMed]
- Leblebici, M.E.; Stefanidis, G.D.; Van Gerven, T. Comparison of photocatalytic space-time yields of 12 reactor designs for wastewater treatment. Chem. Eng. Process. Process Intensif. 2015, 97, 106–111. [Google Scholar] [CrossRef]
- Ren, Y.; Jing, D. Study on particle and photonic flux distributions in a magnetically stirred photocatalytic reactor. J. Photonics Energy 2015, 5, 052097. [Google Scholar] [CrossRef]
- Ung-Medina, F.; Villicaña-Méndez, M.; Huirache-Acuña, R.; Cortés, J.A. Experimental methodology to calculate the local relative light intensity in heterogeneous TiO2/UV-A photocatalytic reactors. Chem. Eng. Res. Des. 2015, 97, 28–35. [Google Scholar] [CrossRef]
- Davididou, K.; McRitchie, C.; Antonopoulou, M.; Konstantinou, I.; Chatzisymeon, E. Photocatalytic degradation of saccharin under UV-LED and blacklight irradiation. J. Chem. Technol. Biotechnol. 2017, 93, 269–276. [Google Scholar] [CrossRef] [Green Version]
- Casado, C.; Marugán, J.; Timmers, R.; Muñoz, M.; van Grieken, R. Comprehensive multiphysics modeling of photocatalytic processes by computational fluid dynamics based on intrinsic kinetic parameters determined in a differential photoreactor. Chem. Eng. J. 2017, 310, 368–380. [Google Scholar] [CrossRef] [Green Version]
- Martín-Sómer, M.; Pablos, C.; van Grieken, R.; Marugán, J. Influence of light distribution on the performance of photocatalytic reactors: LED vs mercury lamps. Appl. Catal. B Environ. 2017, 215, 1–7. [Google Scholar] [CrossRef]
- Jo, W.K.; Eun, S.S.; Shin, S.H. Feasibility of light-emitting diode uses for annular reactor inner-coated with TiO2 or nitrogen-doped TiO2 for control of dimethyl sulfide. Photochem. Photobiol. 2011, 87, 1016–1023. [Google Scholar] [CrossRef] [PubMed]
- Long, T.; Xu, Y.; Lv, X.; Ran, J.; Yang, S.; Xu, L. Fabrication of the annular photocatalytic reactor using large-sized freestanding titania-silica monolithic aerogel as the catalyst for degradation of glyphosate. Mater. Des. 2018, 159, 195–200. [Google Scholar] [CrossRef]
- Ranjbar, P.Z.; Ayati, B.; Ganjidoust, H. Kinetic study on photocatalytic degradation of Acid Orange 52 in a baffled reactor using TiO2 nanoparticles. J. Environ. Sci. (China) 2019, 79, 213–224. [Google Scholar] [CrossRef] [PubMed]
- Bilal, M.; Rasheed, T.; Iqbal, H.M.N.; Li, C.; Wang, H.; Hu, H.; Wang, W.; Zhang, X. Photocatalytic degradation, toxicological assessment and degradation pathway of C.I. Reactive Blue 19 dye. Chem. Eng. Res. Des. 2018, 129, 384–390. [Google Scholar] [CrossRef]
- Boyjoo, Y.; Ang, M.; Pareek, V. CFD simulation of a pilot scale slurry photocatalytic reactor and design of multiple-lamp reactors. Chem. Eng. Sci. 2014, 111, 266–277. [Google Scholar] [CrossRef]
- Athanasiou, D.A.; Romanos, G.E.; Falaras, P. Design and optimization of a photocatalytic reactor for water purification combining optical fiber and membrane technologies. Chem. Eng. J. 2016, 305, 92–103. [Google Scholar] [CrossRef]
- Khodadadian, F.; de la Garza, F.G.; van Ommen, J.R.; Stankiewicz, A.I.; Lakerveld, R. The application of automated feedback and feedforward control to a LED-based photocatalytic reactor. Chem. Eng. J. 2019, 362, 375–382. [Google Scholar] [CrossRef]
- Tokode, O.; Prabhu, R.; Lawton, L.A.; Robertson, P.K.J. Controlled periodic illumination in semiconductor photocatalysis. J. Photochem. Photobiol. A Chem. 2016, 319–320, 96–106. [Google Scholar] [CrossRef]
- Li, Y.; Lin, B.; Ge, L.; Guo, H.; Chen, X.; Lu, M. Real-time spectroscopic monitoring of photocatalytic activity promoted by graphene in a microfluidic reactor. Sci. Rep. 2016, 6, 28803. [Google Scholar] [CrossRef] [Green Version]
- Jamali, A.; Vanraes, R.; Hanselaer, P.; Van Gerven, T. A batch LED reactor for the photocatalytic degradation of phenol. Chem. Eng. Process. Process Intensif. 2013, 71, 43–50. [Google Scholar] [CrossRef]
- Natarajan, K.; Natarajan, T.S.; Bajaj, H.C.; Tayade, R.J. Photocatalytic reactor based on UV-LED/TiO2 coated quartz tube for degradation of dyes. Chem. Eng. J. 2011, 178, 40–49. [Google Scholar] [CrossRef]
- Tapia-Tlatelpa, T.; Trull, J.; Sala, V.; Romeral, L. Methodology for lighting optimization applied to photocatalytic reactors. In Proceedings of the Numerical Simulation of Optoelectronic Devices (NUSOD), Ottawa, Canada, 8–12 July 2019; pp. 31–32. [Google Scholar]
- Schneider, O.; Liang, R.; Bragg, L.; Jaciw-Zurakowsky, I.; Fattahi, A.; Rathod, S.; Peng, P.; Servos, M.; Zhou, Y. Photocatalytic Degradation of Microcystins by TiO2 Using UV-LED Controlled Periodic Illumination. Catalysts 2019, 9, 181. [Google Scholar] [CrossRef]
- Nickels, P.; Zhou, H.; Basahel, S.N.; Obaid, A.Y.; Ali, T.T.; Al-Ghamdi, A.A.; El-Mossalamy, E.S.H.; Alyoubi, A.O.; Lynch, S.A. Laboratory scale water circuit including a photocatalytic reactor and a portable in-stream sensor to monitor pollutant degradation. Ind. Eng. Chem. Res. 2012, 51, 3301–3308. [Google Scholar] [CrossRef]
- Jo, W.K.; Park, G.T.; Tayade, R.J. Synergetic effect of adsorption on degradation of malachite green dye under blue LED irradiation using spiral-shaped photocatalytic reactor. J. Chem. Technol. Biotechnol. 2015, 90, 2280–2289. [Google Scholar] [CrossRef]
- Natarajan, T.S.; Natarajan, K.; Bajaj, H.C.; Tayade, R.J. Energy efficient UV-LED source and TiO2 nanotube array-based reactor for photocatalytic application. Ind. Eng. Chem. Res. 2011, 50, 7753–7762. [Google Scholar] [CrossRef]
- Repo, E.; Rengaraj, S.; Pulkka, S.; Castangnoli, E.; Suihkonen, S.; Sopanen, M.; Sillanpaa, M. Photocatalytic degradation of dyes by CdS microspheres under near UV and blue LED radiation. Sep. Purif. Technol. 2013, 120, 206–214. [Google Scholar] [CrossRef]
- Natarajan, T.S.; Thomas, M.; Natarajan, K.; Bajaj, H.C.; Tayade, R.J. Study on UV-LED/TiO2 process for degradation of Rhodamine B dye. Chem. Eng. J. 2011, 169, 126–134. [Google Scholar] [CrossRef]
- Ferreira, L.C.; Lucas, M.S.; Fernandes, J.R.; Tavares, P.B. Photocatalytic oxidation of Reactive Black 5 with UV-A LEDs. J. Environ. Chem. Eng. 2016, 4, 109–114. [Google Scholar] [CrossRef] [Green Version]
- Damodar, R.A.; You, S.J. Performance of an integrated membrane photocatalytic reactor for the removal of Reactive Black 5. Sep. Purif. Technol. 2010, 71, 44–49. [Google Scholar] [CrossRef]
- McCullagh, C.; Robertson, P.K.J.; Adams, M.; Pollard, P.M.; Mohammed, A. Development of a slurry continuous flow reactor for photocatalytic treatment of industrial waste water. J. Photochem. Photobiol. A Chem. 2010, 211, 42–46. [Google Scholar] [CrossRef]
- Reddy, P.A.K.; Reddy, P.V.L.; Kwon, E.; Kim, K.-H.; Akter, T.; Kalagara, S. Recent advances in photocatalytic treatment of pollutants in aqueous media. Environ. Int. 2016, 91, 94–103. [Google Scholar] [CrossRef] [PubMed]
- Jo, W.K.; Tayade, R.J. New generation energy-efficient light source for photocatalysis: LEDs for environmental applications. Ind. Eng. Chem. Res. 2014, 53, 2073–2084. [Google Scholar] [CrossRef]
- Mortazavian, S.; Saber, A.; James, D.E. Optimization of Photocatalytic Degradation of Acid Blue 113 and Acid Red 88 Textile Dyes in a UV-C/TiO2 Suspension System: Application of Response Surface Methodology (RSM). Catalysts 2019, 9, 360. [Google Scholar] [CrossRef]
- Claes, T.; Dilissen, A.; Leblebici, M.E.; Van Gerven, T. Translucent packed bed structures for high throughput photocatalytic reactors. Chem. Eng. J. 2019, 361, 725–735. [Google Scholar] [CrossRef]
- Manassero, A.; Satuf, M.L.; Alfano, O.M. Photocatalytic reactors with suspended and immobilized TiO2: Comparative efficiency evaluation. Chem. Eng. J. 2017, 326, 29–36. [Google Scholar] [CrossRef]
- Xiong, P.; Hu, J. Inactivation/reactivation of antibiotic-resistant bacteria by a novel UVA/LED/TiO2 system. Water Res. 2013, 47, 4547–4555. [Google Scholar] [CrossRef] [PubMed]
- Bilińska, L.; Gmurek, M.; Ledakowicz, S. Comparison between industrial and simulated textile wastewater treatment by AOPs – Biodegradability, toxicity and cost assessment. Chem. Eng. J. 2016, 306, 550–559. [Google Scholar] [CrossRef]
- Ertugay, N.; Acar, F.N. Removal of COD and color from Direct Blue 71 azo dye wastewater by Fenton’s oxidation: Kinetic study. Arab. J. Chem. 2017, 10, S1158–S1163. [Google Scholar] [CrossRef]
- Buscio, V.; Brosillon, S.; Mendret, J.; Crespi, M.; Gutiérrez-Bouzán, C. Photocatalytic Membrane Reactor for the Removal of C.I. Disperse Red 73. Materials 2015, 8, 3633–3647. [Google Scholar] [CrossRef] [Green Version]
- Tuncì, S.; Duman, O.; Gürkan, T. Monitoring the decolorization of acid orange 8 and acid red 44 from aqueous solution using Fenton’s reagents by online spectrophotometric method: Effect of operation parameters and kinetic study. Ind. Eng. Chem. Res. 2013, 52, 1414–1425. [Google Scholar] [CrossRef]
- Sala, M.; López-Grimau, V.; Gutiérrez-Bouzán, C. Photo-electrochemical treatment of reactive dyes in wastewater and reuse of the effluent: Method optimization. Materials 2014, 7, 7349–7365. [Google Scholar] [CrossRef] [PubMed]
- Namour, P.; Jaffrezic-Renault, N.; Namour, P. Sensors for measuring biodegradable and total organic matter in water. TrAC - Trends Anal. Chem. 2010, 29, 848–857. [Google Scholar] [CrossRef] [Green Version]
- Zheng, X.; Shen, Z.-P.; Shi, L.; Cheng, R.; Yuan, D.-H. Photocatalytic Membrane Reactors (PMRs) in Water Treatment: Configurations and Influencing Factors. Catalysts 2017, 7, 224. [Google Scholar] [CrossRef]
- Cao, F.; Li, H.; Chao, H.; Zhao, L.; Guo, L. Optimization of the concentration field in a suspended photocatalytic reactor. Energy 2014, 74, 140–146. [Google Scholar] [CrossRef]
- Romero, R.L.; Alfano, O.M.; Cassano, A.E. Cylindrical Photocatalytic Reactors. Radiation Absorption and Scattering Effects Produced by Suspended Fine Particles in an Annular Space. Ind. Eng. Chem. Res. 1997, 3094–3109. [Google Scholar] [CrossRef]
- Chong, M.N.; Jin, B.; Chow, C.W.K.; Saint, C. Recent developments in photocatalytic water treatment technology: A review. Water Res. 2010, 44, 2997–3027. [Google Scholar] [CrossRef]
- Manassero, A.; Satuf, M.L.; Alfano, O.M. Evaluation of UV and visible light activity of TiO2 catalysts for water remediation. Chem. Eng. J. 2013, 225, 378–386. [Google Scholar] [CrossRef]
- Ohno, T.; Sarukawa, K.; Tokieda, K.; Matsumura, M. Morphology of a TiO2 Photocatalyst (Degussa, P-25) Consisting of Anatase and Rutile Crystalline Phases. J. Catal. 2001, 203, 82–86. [Google Scholar] [CrossRef]
- Cabrera, M.I.; Alfano, O.M.; Cassano, A.E. Absorption and Scattering Coefficients of Titanium Dioxide Particulate Suspensions in Water. J. Phys. Chem. 1996, 100, 20043–20050. [Google Scholar] [CrossRef]
- Li Puma, G.; Brucato, A. Dimensionless analysis of slurry photocatalytic reactors using two-flux and six-flux radiation absorption-scattering models. Catal. Today 2007, 122, 78–90. [Google Scholar] [CrossRef]
Figure 1.
Implemented photocatalytic reactor with decolorization monitoring.

Figure 2.
Spectrum recorded of each dye as a function of time. (a) OP2, (b) RB, (c) PC, (d) PN, (e) PB, (f) PY.
Figure 2.
Spectrum recorded of each dye as a function of time. (a) OP2, (b) RB, (c) PC, (d) PN, (e) PB, (f) PY.

Figure 3.
Transmittance of each dye. (a) OP2, (b) RB, (c) PC, (d) PN, (e) PB, (f) PY.

Figure 4.
Absorbance of each dye. (a) OP2, (b) RB, (c) PC, (d) PN, (e) PB, (f) PY.

Figure 5.
Decolorization of dyes, in situ and traditional method. (a) OP2, (b) RB, (c) PC, (d) PN, (e) PB, (f) PY.
Figure 5.
Decolorization of dyes, in situ and traditional method. (a) OP2, (b) RB, (c) PC, (d) PN, (e) PB, (f) PY.

Figure 6.
Time of decolorization of each dye.

Figure 7.
Absorbance of each dye by traditional method. (a) OP2, (b) RB, (c) PC, (d) PN, (e) PB, (f) PY.
Figure 7.
Absorbance of each dye by traditional method. (a) OP2, (b) RB, (c) PC, (d) PN, (e) PB, (f) PY.

Figure 8.
Chemical structure CAS No. 12225-85-3.

Figure 9.
Chemical structure CAS No. 17095-24-8.

Figure 10.
Chemical structure CAS No. 186554-26-7.

Figure 11.
Chemical structure CAS No. 186554-27-8.

Figure 12.
Chemical structure CAS No. 124448-55-1.

Figure 13.
Chemical structure CAS No. 72916-24-2.

Figure 14.
Chemical structure CAS No. 72906-25-3.

Figure 15.
Schematic diagrams. (a) Reactor with decolorization monitoring configuration. (b) Sample scattering and monitoring system (top view).
Figure 15.
Schematic diagrams. (a) Reactor with decolorization monitoring configuration. (b) Sample scattering and monitoring system (top view).


Table 1.
First-order degradation rate constant, and Energy Consumption for the decolorization of azo dyes.
Table 1.
First-order degradation rate constant, and Energy Consumption for the decolorization of azo dyes.
| Dye | R2 | K (min−1) | Energy Consumption (kWh/m3) |
|---|---|---|---|
| In situ monitoring | |||
| Orange PX-2R | 0.9232 | 0.0159 | 332.53 |
| Remazol Black B133 | 0.7218 | 0.0101 | 688.00 |
| Procion Crimson H-EXL | 0.9060 | 0.0281 | 269.47 |
| Procion Navy H-EXL | 0.9861 | 0.0232 | 131.87 |
| Procion Blue H-EXL | 0.7610 | 0.0131 | 292.40 |
| Procion Yellow H-EXL | 0.7870 | 0.0219 | 407.07 |
| Traditional method | |||
| Orange PX-2R | 0.9341 | 0.0132 | 344.00 |
| Remazol Black B133 | 0.8022 | 0.0074 | 670.80 |
| Procion Crimson H-EXL | 0.9263 | 0.0285 | 275.20 |
| Procion Navy H-EXL | 0.9246 | 0.0271 | 137.60 |
| Procion Blue H-EXL | 0.8441 | 0.0118 | 275.20 |
| Procion Yellow H-EXL | 0.8618 | 0.0184 | 412.80 |
Table 2.
Description of the selected dyes.
| Abbr. Name | Commercial Name | C. I. Name | Num. Reactive Groups | Figure | |
|---|---|---|---|---|---|
| OP2 | Orange PX-2R | Reactive Orange 13 | 1 | 487 nm | 8 |
| RB | Remazol Black B133 | Reactive Black 5 | 2 | 598 nm | 9 |
| PC | Procion Crimson H-EXL | Reactive Red 231 | 2 | 545 nm | 10 |
| PN | Procion Navy H-EXL | Not registered | 2 | 606 nm | 11 |
| PB | Procion Blue H-EXL | Reactive Blue 198 | 2 | 624 nm | 12 |
| PY | Procion Yellow H-EXL | Reactive Yellow 138:1 | 2 | 416 nm | 13, 14 |
© 2019 by the authors. Licensee MDPI, Basel, Switzerland. This article is an open access article distributed under the terms and conditions of the Creative Commons Attribution (CC BY) license (http://creativecommons.org/licenses/by/4.0/).
Share and Cite
MDPI and ACS Style
Tapia-Tlatelpa, T.; Trull, J.; Romeral, L. In situ Decolorization Monitoring of Textile Dyes for an Optimized UV-LED/TiO2 Reactor. Catalysts 2019, 9, 669. https://0-doi-org.brum.beds.ac.uk/10.3390/catal9080669
AMA Style
Tapia-Tlatelpa T, Trull J, Romeral L. In situ Decolorization Monitoring of Textile Dyes for an Optimized UV-LED/TiO2 Reactor. Catalysts. 2019; 9(8):669. https://0-doi-org.brum.beds.ac.uk/10.3390/catal9080669
Chicago/Turabian StyleTapia-Tlatelpa, Tecilli, Jose Trull, and Luis Romeral. 2019. "In situ Decolorization Monitoring of Textile Dyes for an Optimized UV-LED/TiO2 Reactor" Catalysts 9, no. 8: 669. https://0-doi-org.brum.beds.ac.uk/10.3390/catal9080669
Note that from the first issue of 2016, this journal uses article numbers instead of page numbers. See further details here.