Shear Deformation Helps Phase Transition in Pure Iron Thin Films with “Inactive” Surfaces: A Molecular Dynamics Study

School of Material Science and Engineering, Shanghai Institute of Technology, Haiquan Road 100, Shanghai 201418, China
*
Authors to whom correspondence should be addressed.
Crystals 2020, 10(10), 855; https://0-doi-org.brum.beds.ac.uk/10.3390/cryst10100855
Submission received: 10 August 2020
/
Revised: 19 September 2020
/
Accepted: 22 September 2020
/
Published: 23 September 2020
(This article belongs to the Special Issue Crystallography of Structural Phase Transformations)
Abstract
:In a previous study, it was shown that the (111)fcc, (110)fcc and (111)bcc free surfaces do not assist the phase transitions as nucleation sites upon heating/cooling in iron (Fe) thin slabs. In the present work, the three surfaces are denoted as “inactive” free surfaces. The phase transitions in Fe thin films with these “inactive” free surfaces have been studied using a classical molecular dynamics simulation and the Meyer–Entel potential. Our results show that shear deformation helps to activate the free surface as nucleation sites. The transition mechanisms are different in dependence on the surface orientation. In film with the (111)fcc free surface, two body-centered cubic (bcc) phases with different crystalline orientations nucleate at the free surface. In film with the (110)fcc surface, the nucleation sites are the intersections between the surfaces and stacking faults. In film with the (111)bcc surface, both heterogeneous nucleation at the free surface and homogeneous nucleation in the bulk material are observed. In addition, the transition pathways are analyzed. In all cases studied, the unstrained system is stable and no phase transition takes place. This work may be helpful to understand the mechanism of phase transition in nanoscale systems under external deformation.
1. Introduction
In recent years, solid–solid phase transitions in nanoscale or surface-dominated systems have received much attention [1,2,3,4]. Such systems exhibit dramatically changed material properties compared with the bulk system due to their extremely high surface–volume ratio, in particular the mechanical [5,6] or magnetic properties [7,8]. Additionally, the phase transition behavior in nanoscale systems may also be different from that in the bulk. Nanowires and ultrathin films provide two typical examples where the surface controls the transition behavior. Compared with nanowires, thin films exhibit relatively low surface–volume ratio, which makes the transition behavior more complicated [3,4]. For instance, Dmitriev et al. [9] studied the effect of dislocations on the phase transition in a two-dimensional model and found that the dislocations help the martensitic phase transition as nucleation centers. They also found that dislocation structure is changed during the reverse martensitic phase transition. Recently, Wang et al. [10] investigated the phase transition in Fe thin films containing coherent twin boundaries and discussed the dependence of austenitic and martensitic transition temperatures on the film thickness and twin boundary (TB) fraction.
Solid–solid phase transition of Fe has been intensively studied for many years [11,12], since Fe is the basic material of steel, which has wide technical and industrial applications. However, most of the studies were carried out in bulk systems. In nanoscale systems, phase transition in Fe thin film has been studied by both experiment and simulation. Teodorescu et al. [13,14] investigated the laser induced body-centered cubic (bcc) to face-centered cubic (fcc) phase transitions in Fe thin films and found that the transition is incomplete, i.e., they observed a mixture of fcc and bcc phases as the transition product. The authors attributed this incomplete phase transition to the insufficient superheating in the mixed phase areas of the irradiated films. Cuenya et al. [15] observed fcc to bcc phase transitions in ultrathin Fe films on Cu3Au (001) substrates and reported that the transition obeys the classical Bain pathway [16]. The dependence of transition temperature on the film thickness was also discussed in their work. The Pitsch [17] orientation relationship, where the (001)fcc plane is parallel to the (110)bcc plane, was reported by Memmel et al. [18] in their study of Fe thin film growth on a Cu (001) substrate. However, in-situ experiments at the atomic scale are not often feasible because the non-diffusional phase transition, for instance, the martensitic phase transition, is an extremely fast process which cannot be easily captured. In this context, atomistic simulation becomes a powerful tool to investigate the phase transition. Urbassek and his coworkers [3,4] studied the strain induced solid–solid phase transition in bcc-Fe thin films and reported a rich variety of phenomena such as back transition to the bcc phase and grain reorientation at high strains. Recently, Meiser and Urbassek [19] investigated thermally induced phase transition in Fe thin slabs with different orientated surfaces using the Meyer–Entel potential [20], which is widely used in studies of the phase transition, both in bulk-dominant and surface-dominant systems. The authors discussed the results from the aspects of the surface energy and transition pathway. The results and discussions were interesting and compelling. Most surfaces studied, for instance the (100)bcc surface, assist the phase transition as nucleation sites. However, it has been also reported that three common surfaces with low Miller indices, namely the (111)fcc, (110)fcc and (111)bcc surfaces, show different transition behaviors. For the thin slab with the (111) fcc surface, no phase transition could be observed within a cooling range from 400 K to a temperature lower than 100 K; for the thin slab with the (110)fcc surface, the fcc to bcc transition started in the bulk material rather than at the free surface at a very low transition temperature of 81 K; lastly, for the thin slab with the (111)bcc surface, no bcc to fcc transition could be achieved within a heating range from 10 K to 2000 K. The authors contributed this to the fact that these surfaces are not included in any orientation relationships, i.e., the common transition pathways, such as the Bain [16] and Pitsch [17] paths, are not available for these surfaces. We denote such surfaces as “inactive” surfaces in the present work.
While much interest in studying the solid–solid phase transition has been focused on its dependence on temperature or heating/cooling rate [21], its dependence on external stress should also be a major factor. Such stresses exist in realistic situations, either artificially exerted or transition induced. A new class of steels, TRIP (transformation-induced plasticity) steels, have been introduced. Compared with the traditional ones, they exhibit not only higher strength and hardness, but also enhanced ductility due to the transformation induced strain [22,23,24]. Therefore, it is interesting to investigate whether phase transitions could be induced in Fe thin films with the inactive free surfaces and their mechanisms.
In the present work, the phase transition in Fe thin films with three inactive free surfaces under shear deformation will be studied based on the results of [19]. We aim to check whether the applied shear deformation will induce the austenitic/martensitic phase transition. In particular, we focus on the role of such inactive surfaces as nucleation sites. In addition, the transition pathway will be analyzed. This work may be helpful to understand the mechanism of phase transition in nanoscale systems under external shear deformation.
2. Simulation Method
The interatomic potential plays a critical role in molecular dynamics (MD) simulation. For Fe, Engin et al. [25] calculated the free energy curves of the fcc and bcc phases at temperatures up to 2000 K using six available interatomic potentials in the embedded atom method (EAM) class. The authors reported that the free energy curves of the fcc and bcc phases intersect at a temperature of around 550 K using the Meyer–Entel potential [20], while the free energy of the fcc phase is always higher than that of the bcc phase using other potentials, such as Finnis–Sinclair (F–S) [26] or Johnson-Oh [27] potential. Thus, it could be concluded that the Meyer–Entel potential might be the only one in the EAM class, which can describe both the austenitic and martensitic phase transitions. Here, we should mention that the equilibrium transition temperature of 550 ± 50 K predicted by the Meyer–Entel potential [20] differs from the experimental value of 1184 K. This is due to the fact that this potential does not include the magnetic entropy, which stabilizes the bcc phase at low temperatures [10,28]. However, it has been confirmed that the transition mechanism will not be affected by this inexact transition temperature [2,3,4,19,21,28]. More recently, Müller et al. [29] developed an analytic bond-order (BO) potential, which predicts an equilibrium transition temperature of 1030 K. In the present study, the Meyer–Entel potential is chosen to describe the interaction between Fe atoms as in [19]. We also performed simulations using the Müller potential to examine the reliability of the results, for details see Appendix A.
We study three Fe thin films with the (111)fcc, (110)fcc and (111)bcc free surfaces. The dimensions of these films are roughly equivalent to the films simulated in [19] to verify the effect of shear deformation on phase transition under a certain surface–volume ratio. Here we should note that the film thickness (surface–volume ratio) has a significant influence on the transition behavior. It has been confirmed that a higher surface–volume ratio is conducive to the phase transition [3,10,19]. The effect of film thickness on the transition will be discussed in Section 3.4.
We chose film 1 as an example to clarify the modelling process. A simulation box with the dimensions of 80.80 × 81.26 × 40.43 Å is constructed and filled with Fe atoms in fcc structure. We note that the length of the fcc (bcc) lattice constant in the Meyer–Entel potential is 3.686 (2.866) Å [19,30]. The boundary conditions in the x and y directions are set as periodic, while the z direction is set as free to produce the free surface. Films 2 and 3 are modelled in an analogous way. The specifications of the three films are listed in Table 1.
The films are equilibrated in isobaric-isothermal NPT ensembles. For the equilibration, the integration time step is 0.001 ps. For films 1 and 2 with the fcc structure, the equilibration temperature is set as 300 K. During the equilibration, the temperature is adjusted to this value every 0.002 ps via a Nosè–Hoover thermostat. Although our equilibration temperature is 250 K lower than the equilibrium transition temperature predicted by the Meyer–Entel potential, the fcc to bcc phase transition does not take place, which accords with the results in [19]. It is hard to induce a phase transition by pure thermal effect in a perfect crystal, since such systems lack the pre-existing defects as nucleation sites and the free volume for the atom movement during the phase transition [19,28,31]. For film 3 with the bcc structure, the relaxation temperature is set as 800 K and the setup of the thermostat is equivalent to that of films 1 and 2. As the similar reason for films 1 and 2, no bcc to fcc phase transition occurs at this temperature. Note that the austenitic phase transition does not take place up to a temperature of 2000 K in [19]. For all the films, the pressures in the x and y directions are set as 0. Via a Nosè–Hoover barostate, the pressures in the x and y directions are relaxed to 0 every 0.01 ps during the whole equilibration. No pressure control is employed in the z direction (surface normal). Due to the existence of the free surface, the pressure in the z direction automatically relaxes to 0. The equilibration time amounts to 50 ps for all the films.
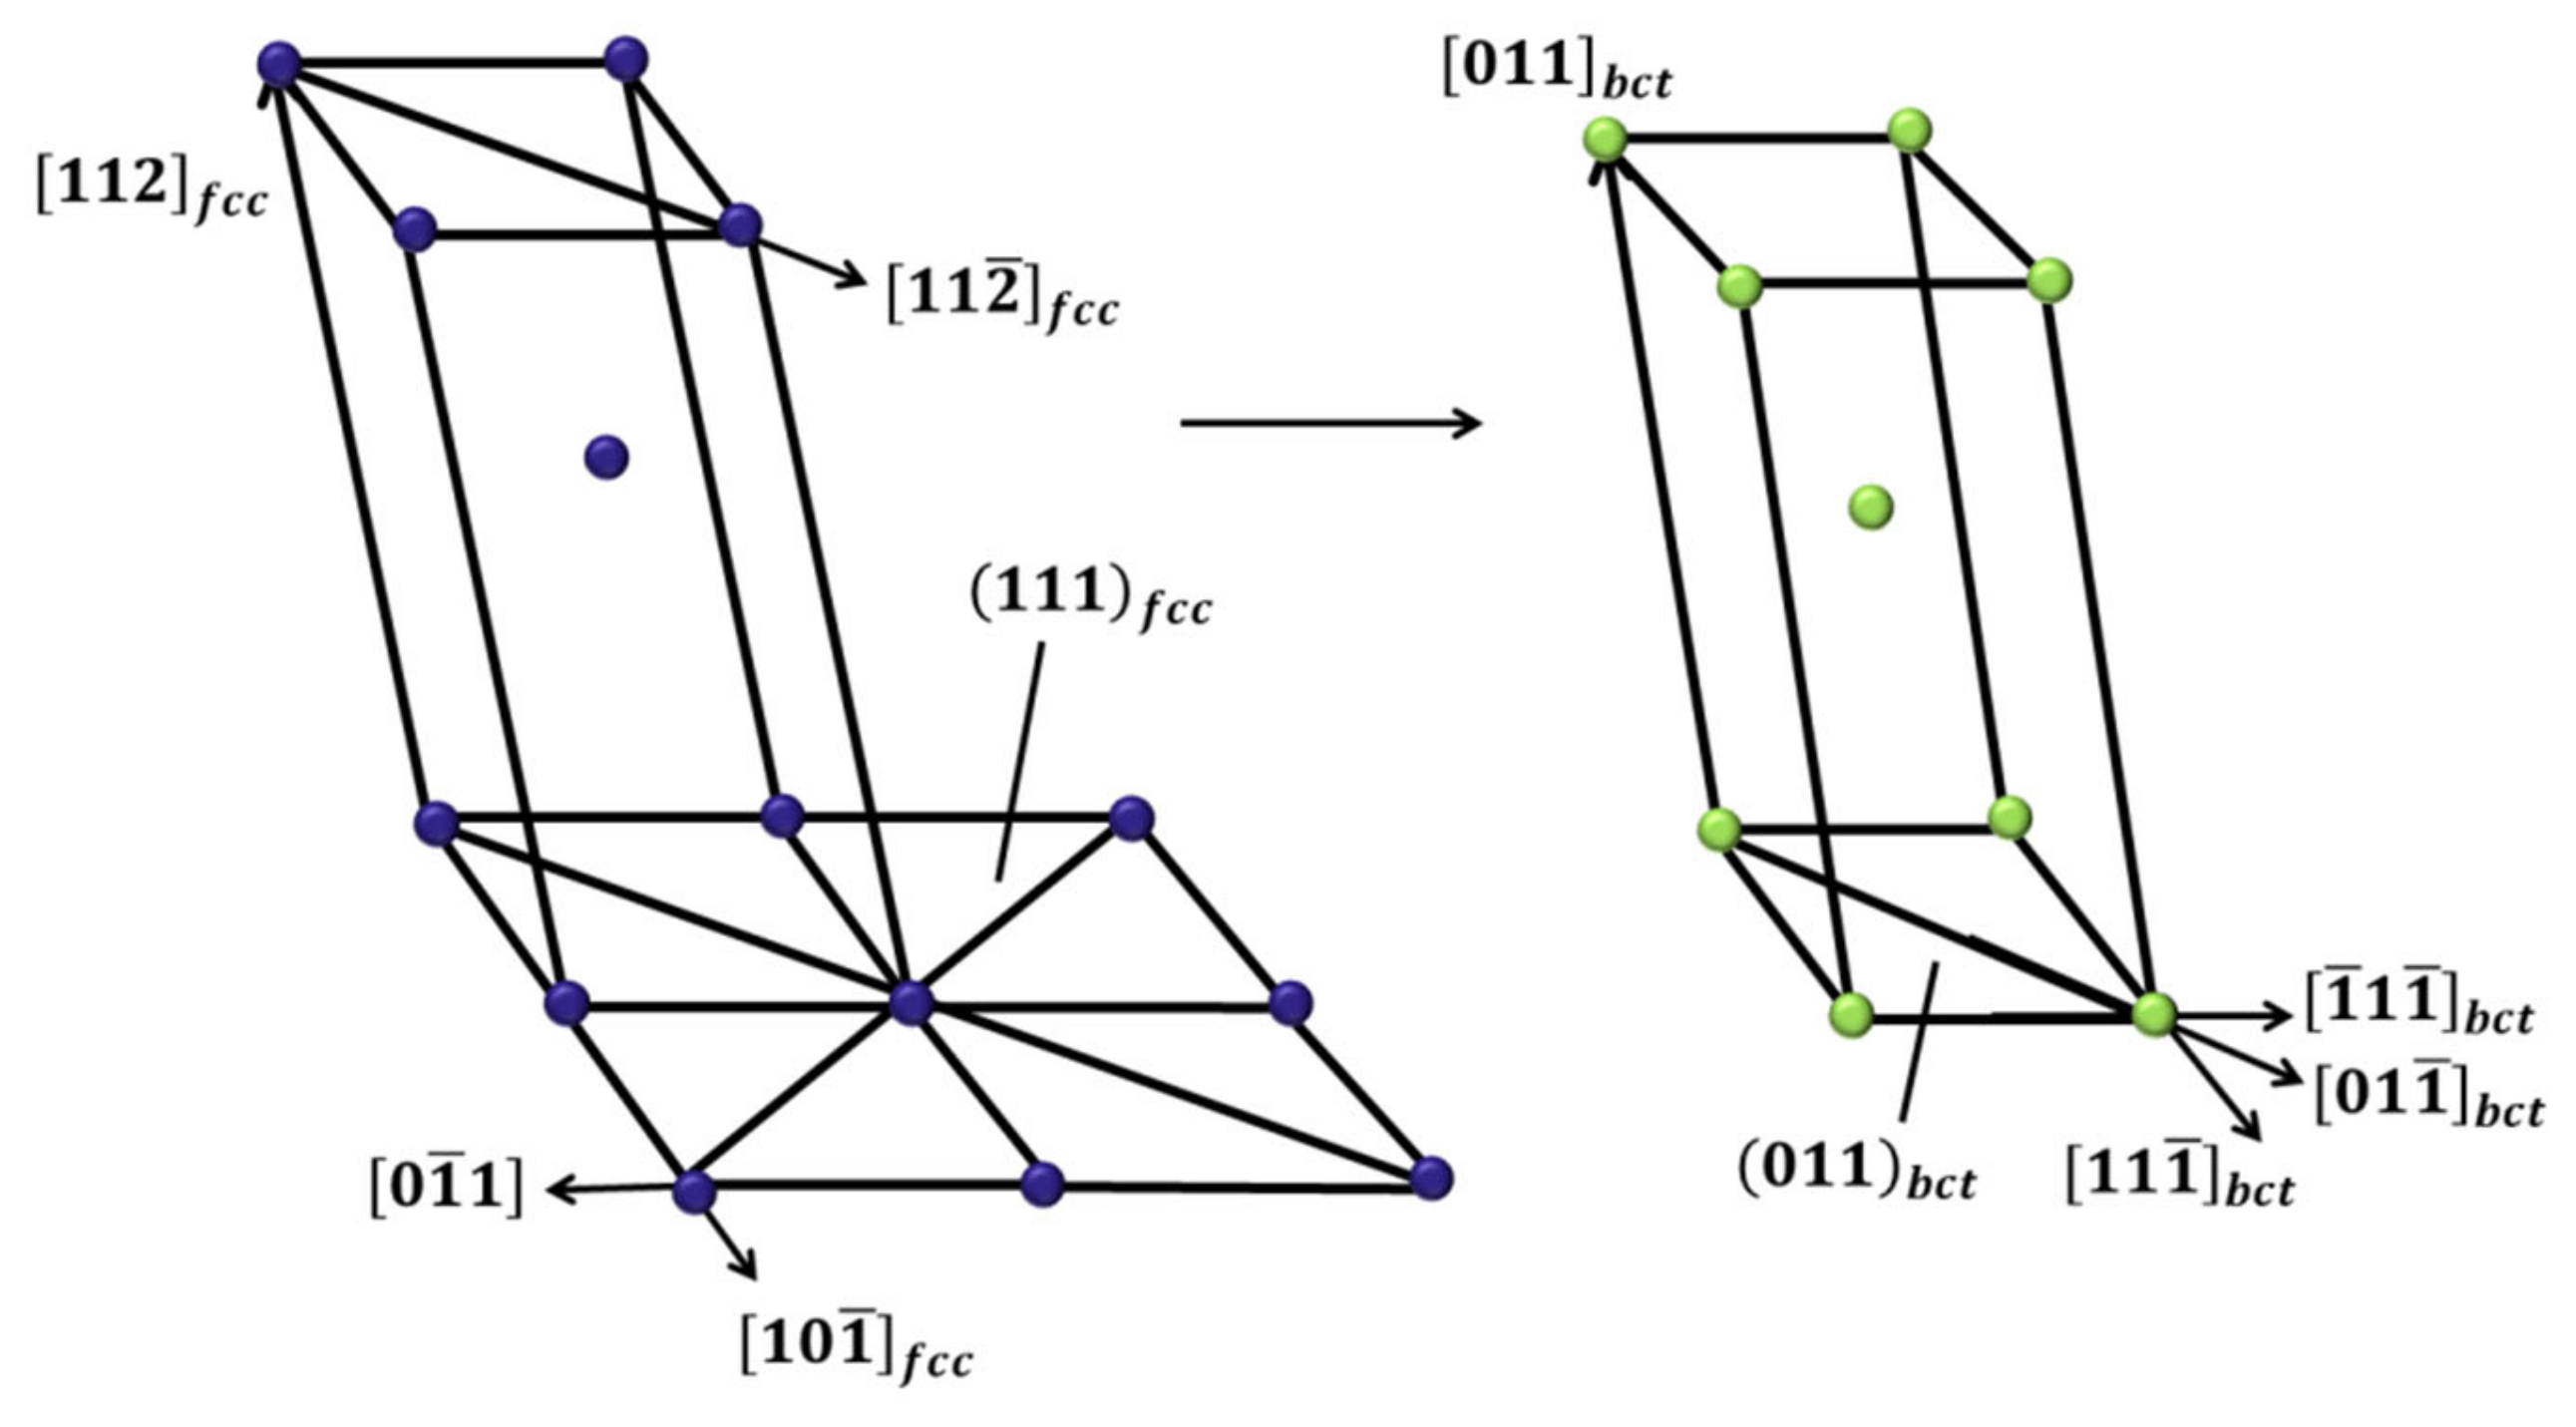
After equilibration, shear stresses should be applied to the films to induce phase transitions. Starting with the fcc lattice, the Kurdjumov–Sachs (K–S) model [32] describes a three-step process to obtain the final bcc lattice. (i) One (111)fcc plane is taken as the shear plane and a large shear deformation is carried out along the [11]fcc direction to produce a body centered tetragonal (bct) structure, as shown in Figure 1. The shear strain here corresponds to a shear angle of 19.5°. Note that in the Nishiyama–Wassermann (N–W) orientation relationship [33], the first step of the shear deformation is exactly equivalent to the K–S relationship. (ii) Taking the (bct plane as the shear plane, a second shear deformation is performed along the []bct direction. (iii) Orthogonal expansions or contractions are applied in order to obtain the final bcc structure.
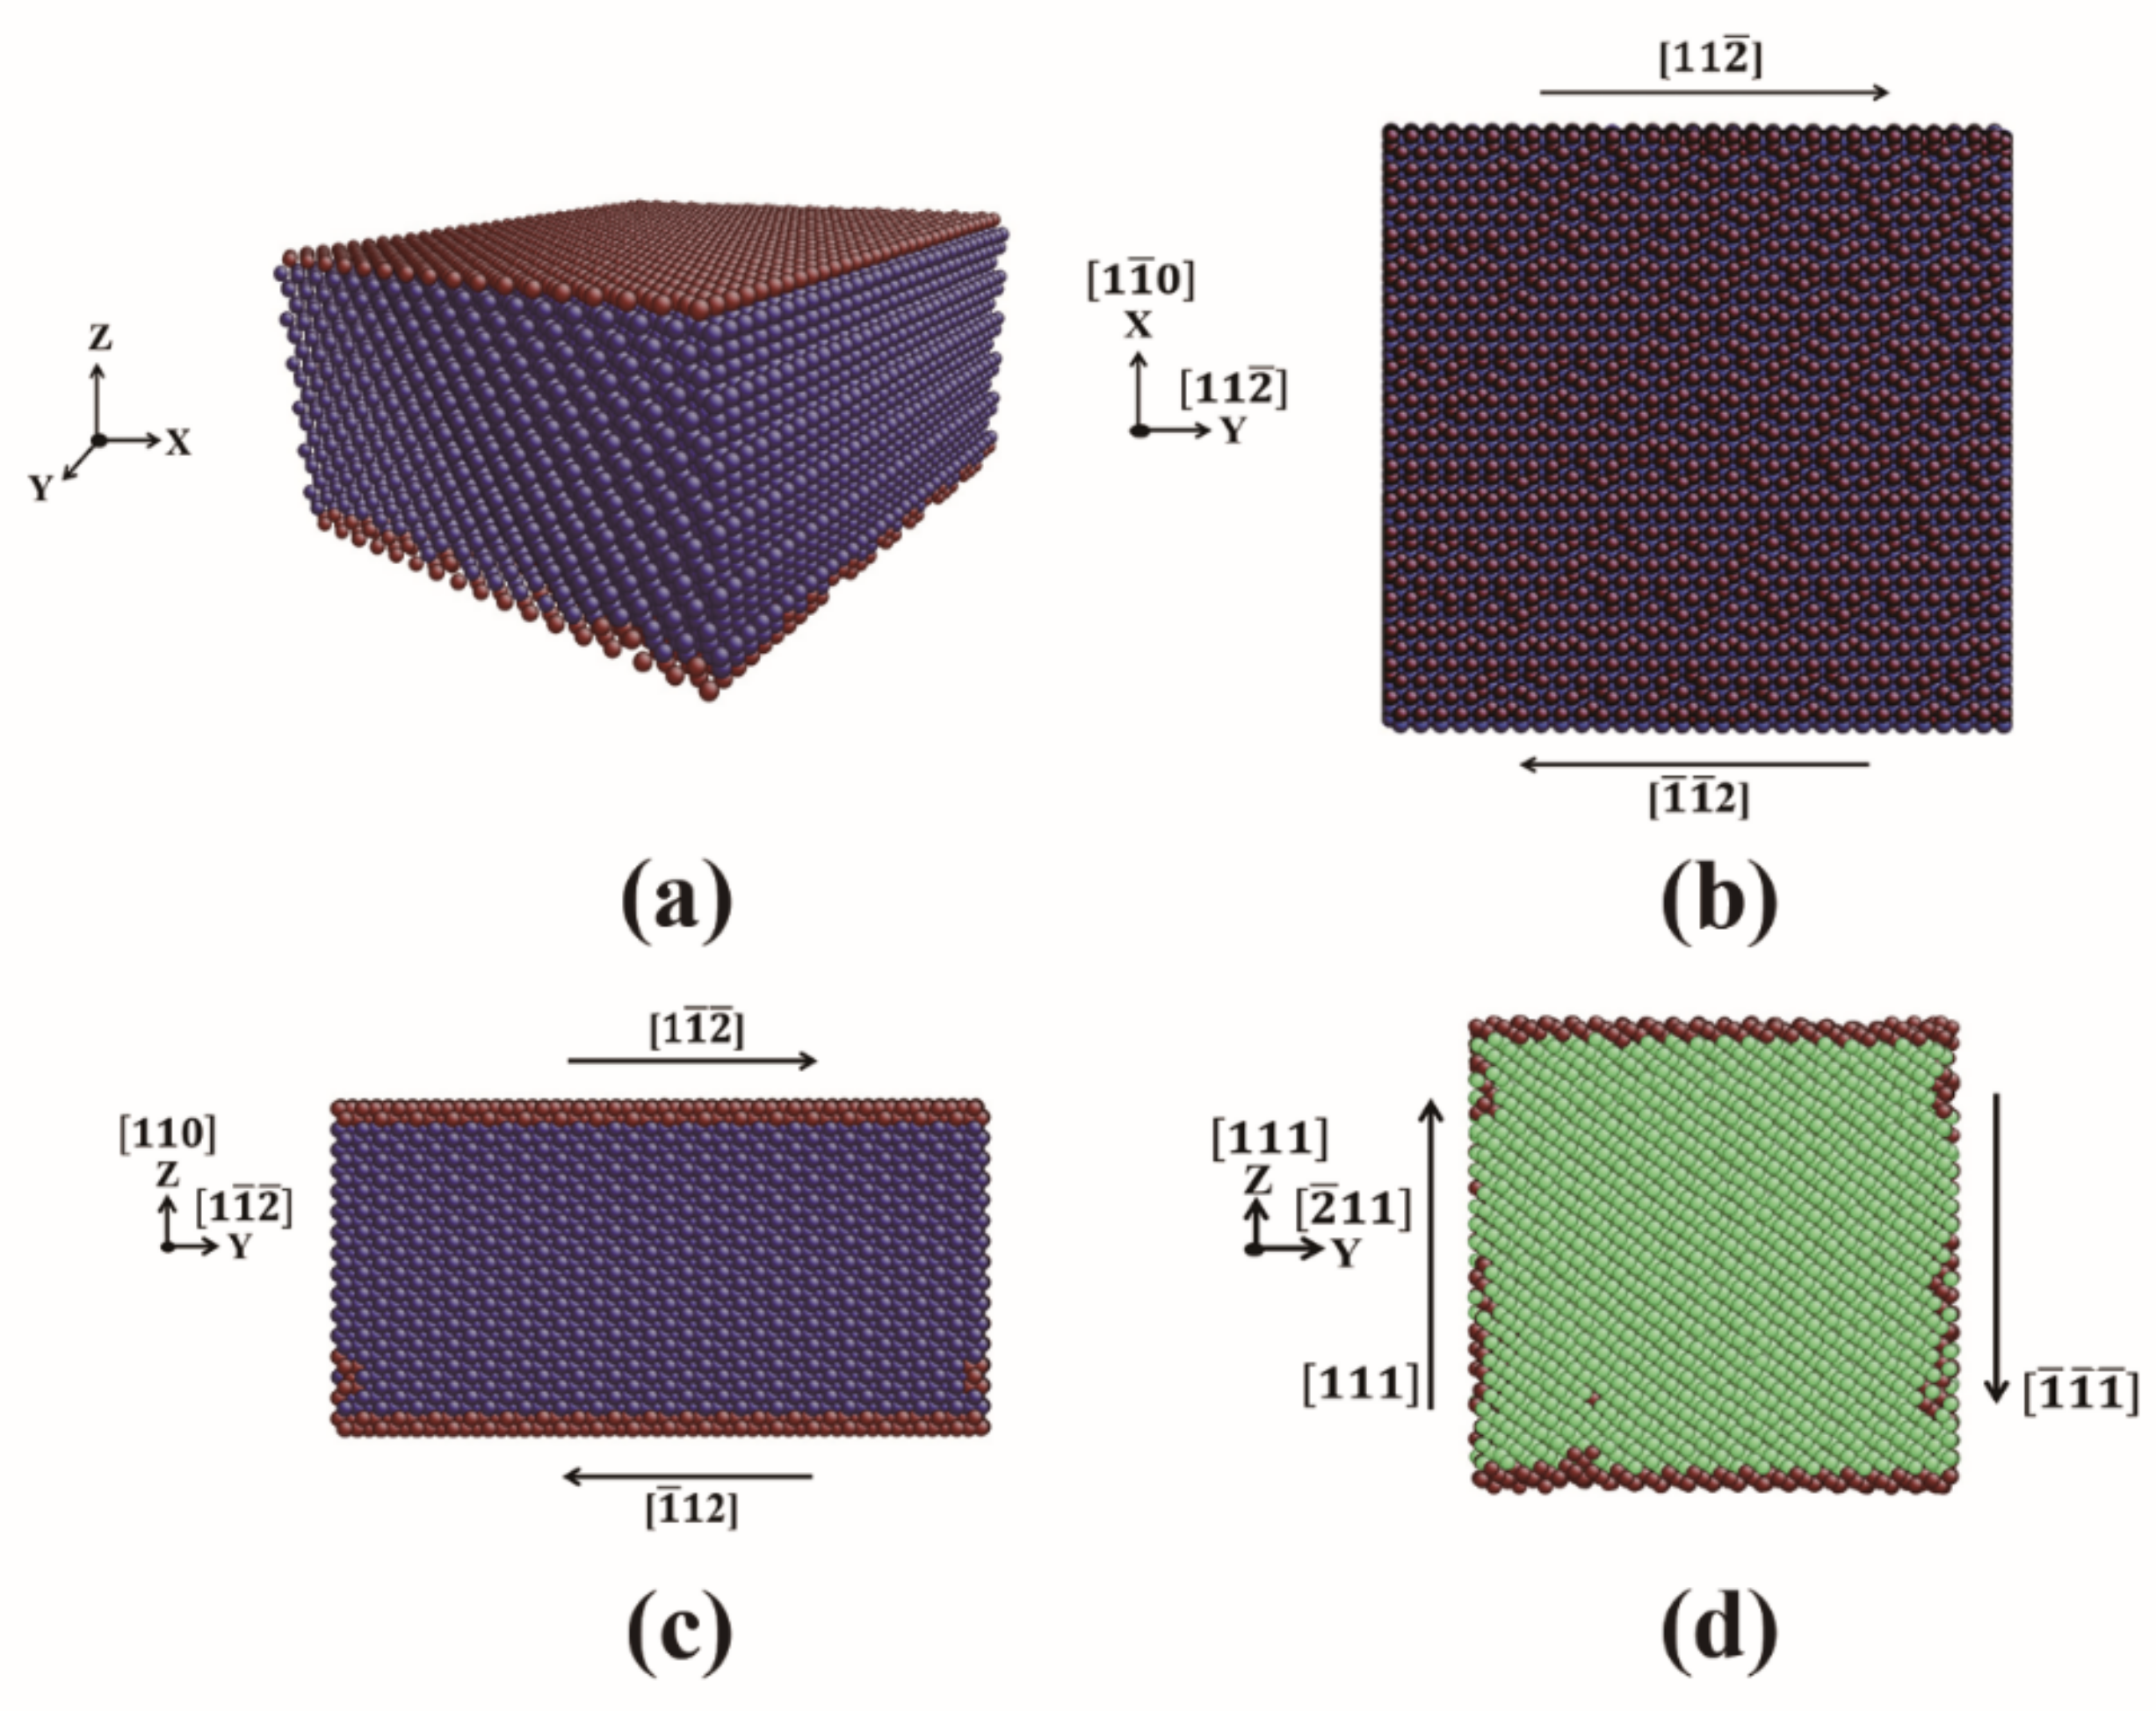
In our simulation, shear deformations are applied according to the step (i) described above on the films 1 and 2 with the fcc structure to trigger martensitic transitions. We apply shear deformation on film 3 with the bcc structure according to the step (ii) to facilitate the austenitic transition. Figure 2a shows film 1 as an example for the setup of the simulation system and b–d show the shear deformations applied. The shear deformation is connected to the shear angle via
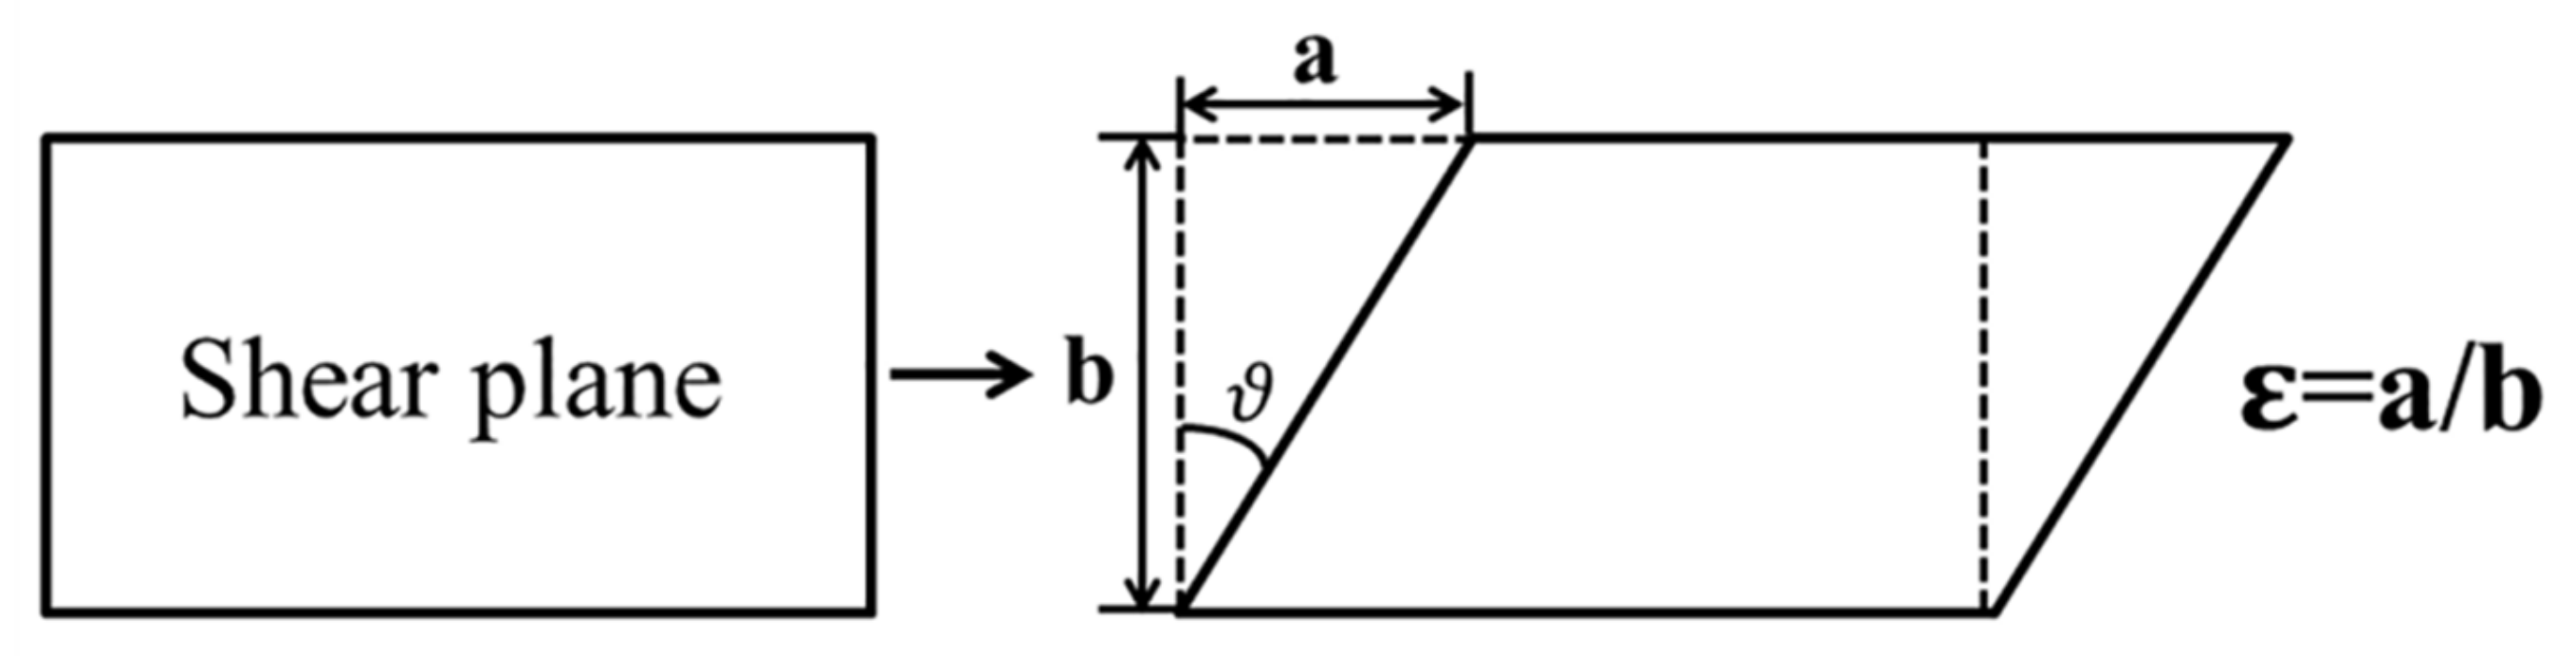
where the subscripts xy, yz and xz indicate the shear planes of films 1–3, respectively. Figure 3 shows schematically the relationship between ε and .
For films 1 and 3 (2), we vary in steps of 0.435% (0.218%) up to a maximum of 50%, which corresponds to the maximal shear angle of 26.6°. Note that the angle of 19.5° needed for the fcc to bcc transition in the K–S path is below the maximal angle. The value of for each step should be selected with care. Wang and Urbassek [34] applied shear deformation with a value of 1.74% on a biphasic fcc–bcc system with periodic boundary conditions in all three directions and observed both the martensitic and austenitic phase transitions at various temperatures. We have also attempted to shear our films using this value. Once the shear deformation was applied, many atoms escaped from the film surface and the simulations could not be continued. Thus, the value should be decreased to provide more time for the atoms to relax. In addition, the value of 0.435% has also been performed on film 2 and the observation was similar to the cases using the value of 1.74%. After each step, the films are equilibrated for 20 ps. Thus, the total deformation requires a simulation time of 2.3 ns for films 1 and 3 and 4.6 ns for film 2. For all the films simulated, the integration time step is 0.001 ps. The temperature is controlled by a Nóse–Hoover thermostat and no pressure control is performed on the films. For the films 1 and 3 (2) with the fcc (bcc) structure, the temperature is set as 300 K (800 K), which is lower (higher) than the equilibrium transition temperature of 550 ± 50 K predicted by the Meyer–Entel potential.
All the simulations are performed by using the open source MD simulator LAMMPS [35]. The common neighbor analysis (CNA) [36] is used to determine the local atomic structure. For a single atom, the topology of the bonds that connect the surrounding neighbor atoms is analyzed to identify the crystal structure. Note that the CNA calculation is sensitive to the specified cutoff distance. Stukowski [37] suggested the cutoff distances for the fcc and bcc lattices. In our case, the cutoff distances of the fcc and bcc are specified as 3.30 and 3.46 Å, respectively. The detailed working mechanism of the CNA is described in [36]. The software ATOMEYE [38] is used for the visualization.
3. Results
We firstly note that the films 1 and 2 (3) are simulated at 300 K (800K) for 5 ns and no phase transitions take place. This indicates that at 300 K (800 K), the free surfaces are “inactive” and do not assist the martensitic (austenitic) phase transition as nucleation sites.
3.1. Fcc Film 1 with the (111) Free Surface
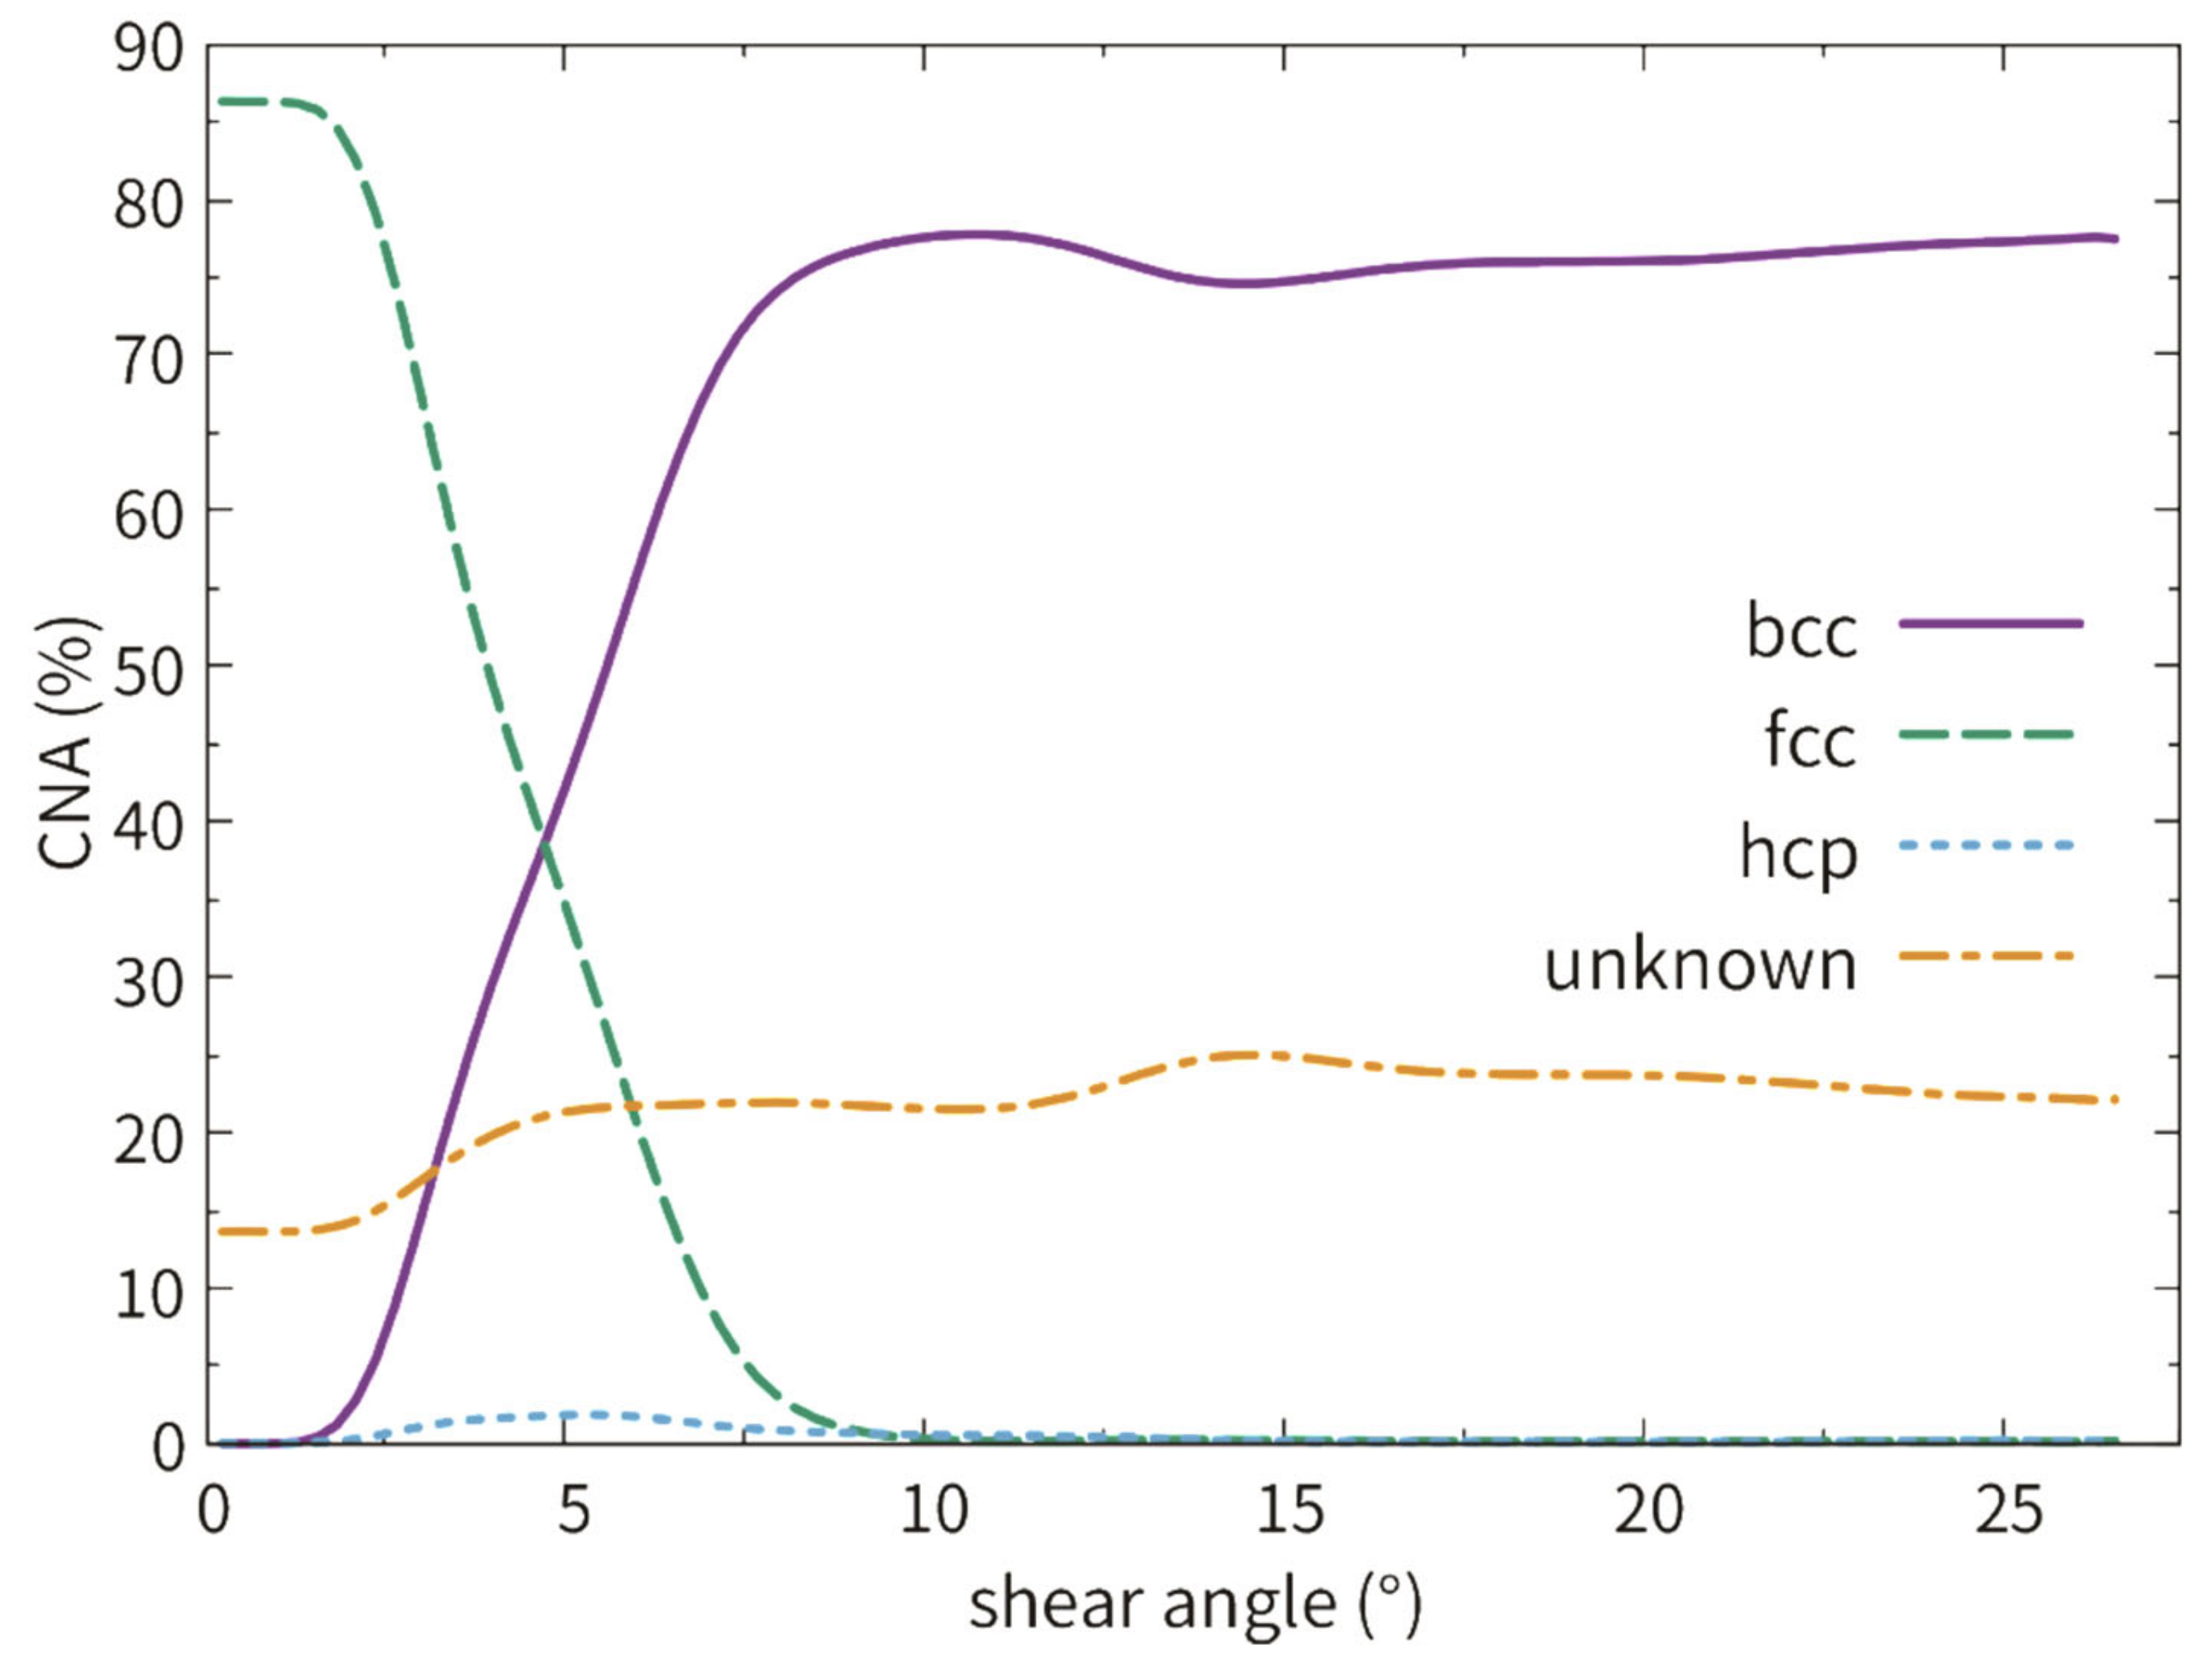
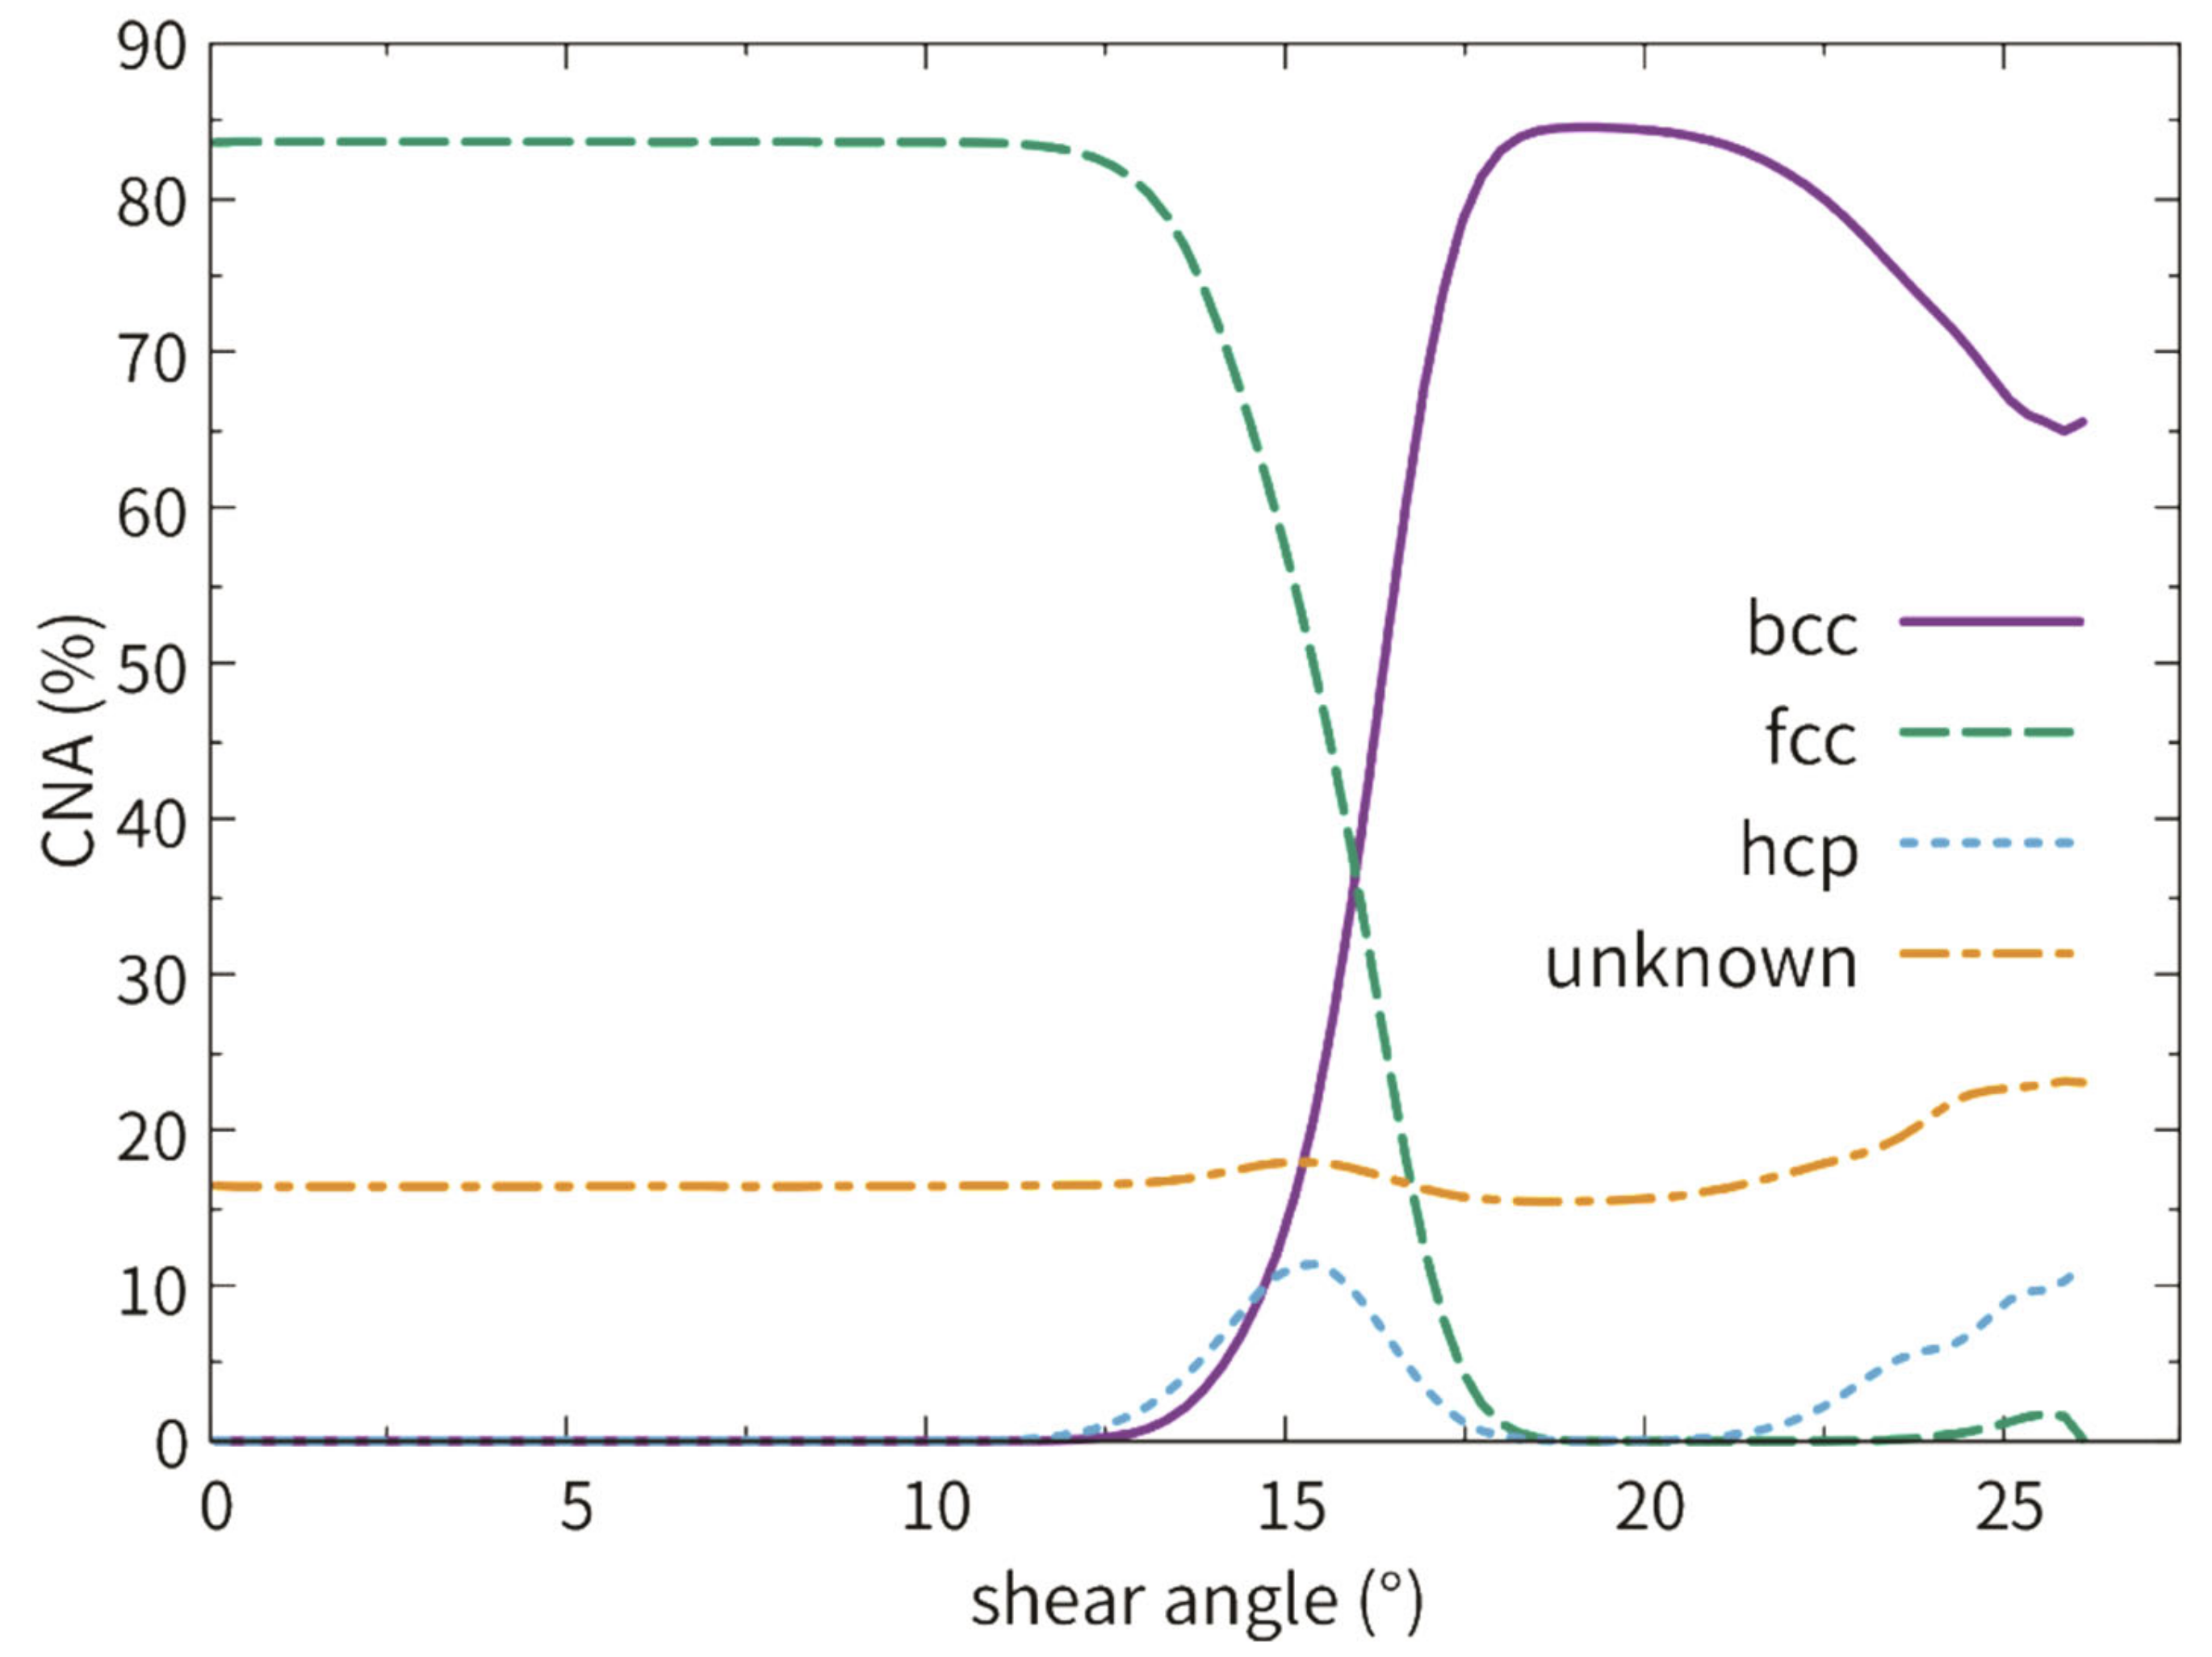
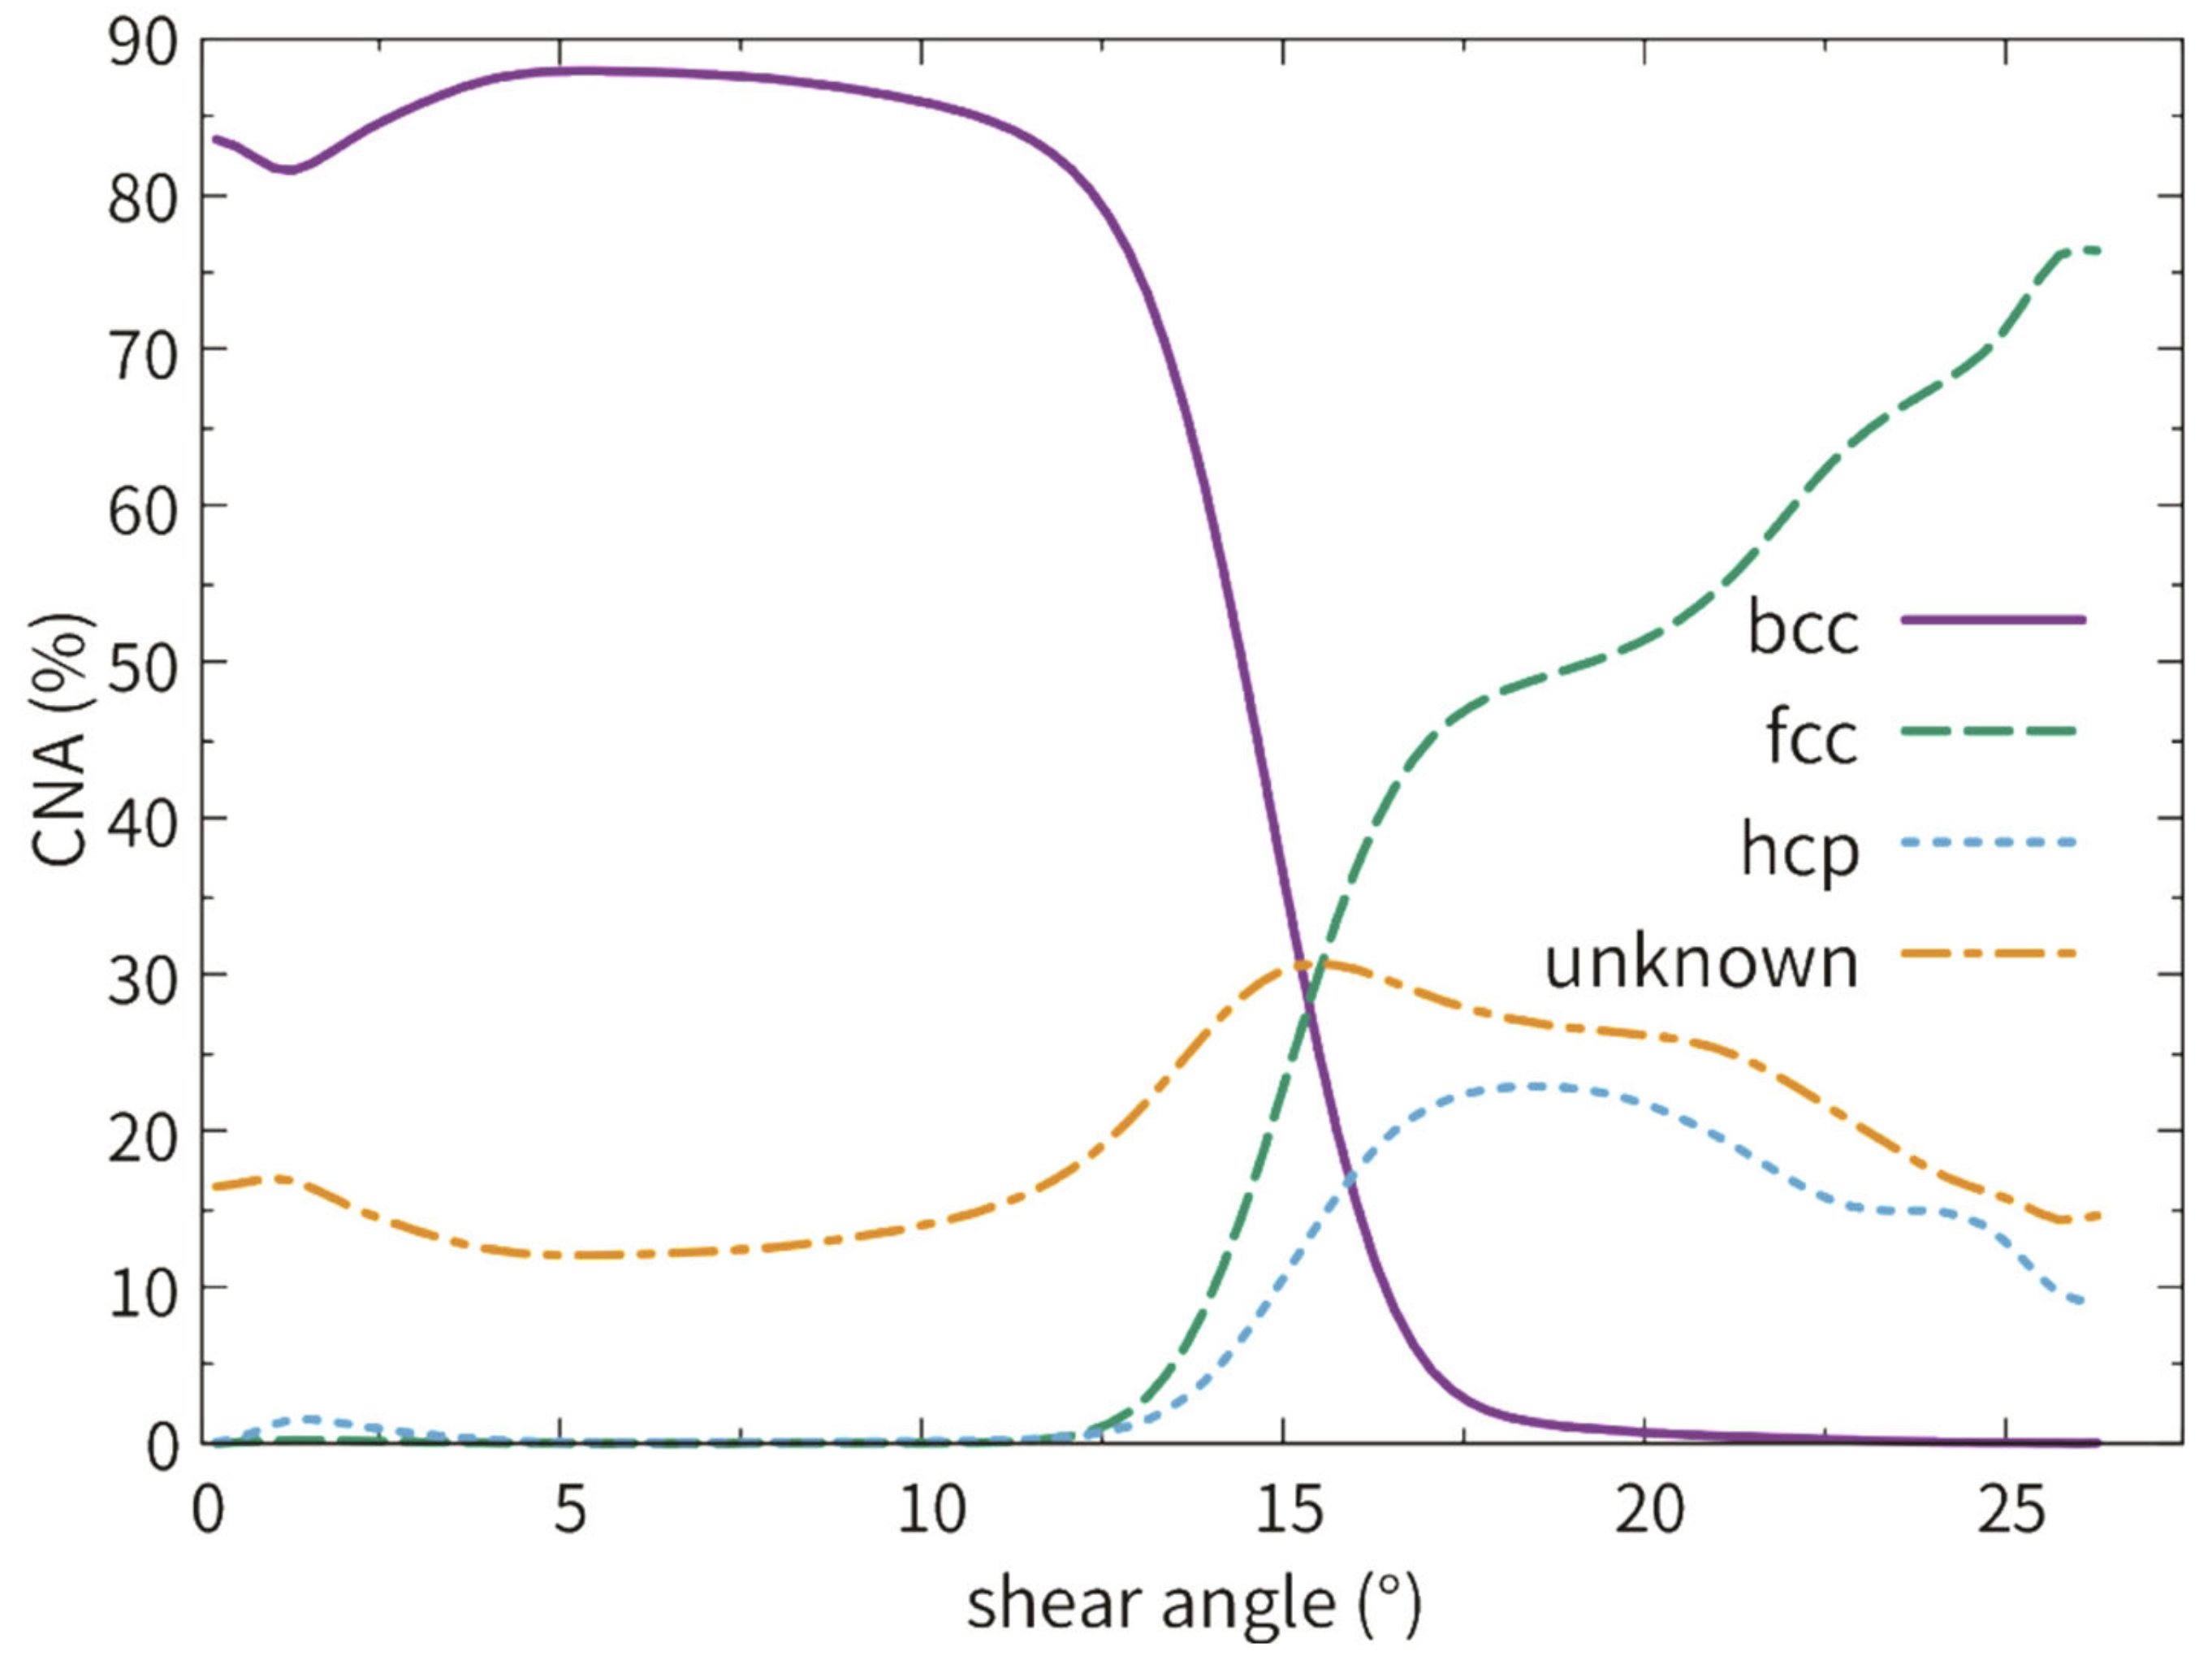
Figure 4 shows the fractional phase contents in film 1 with (111)fcc free surface as a function of shear angle. The fraction of the unidentified atoms amounts to around 13% at the simulation beginning. This is due to the fact that the surface atoms cannot be identified by the CNA. The fcc phase fraction begins to drop at a shear angle of 1.5°, while the bcc phase content increases. The whole transition completes at a shear angle of 10°. The fraction of the unidentified atoms shows a slight increase during/after the martensitic phase transition, indicating that the surface morphology could be changed, or certain defects were generated. The fraction of the hexagonal close packed (hcp) atoms shows its maximum at a shear angle of around 5°. The hcp phase is unstable and its fraction decreases to 0 with the shear angle increase.
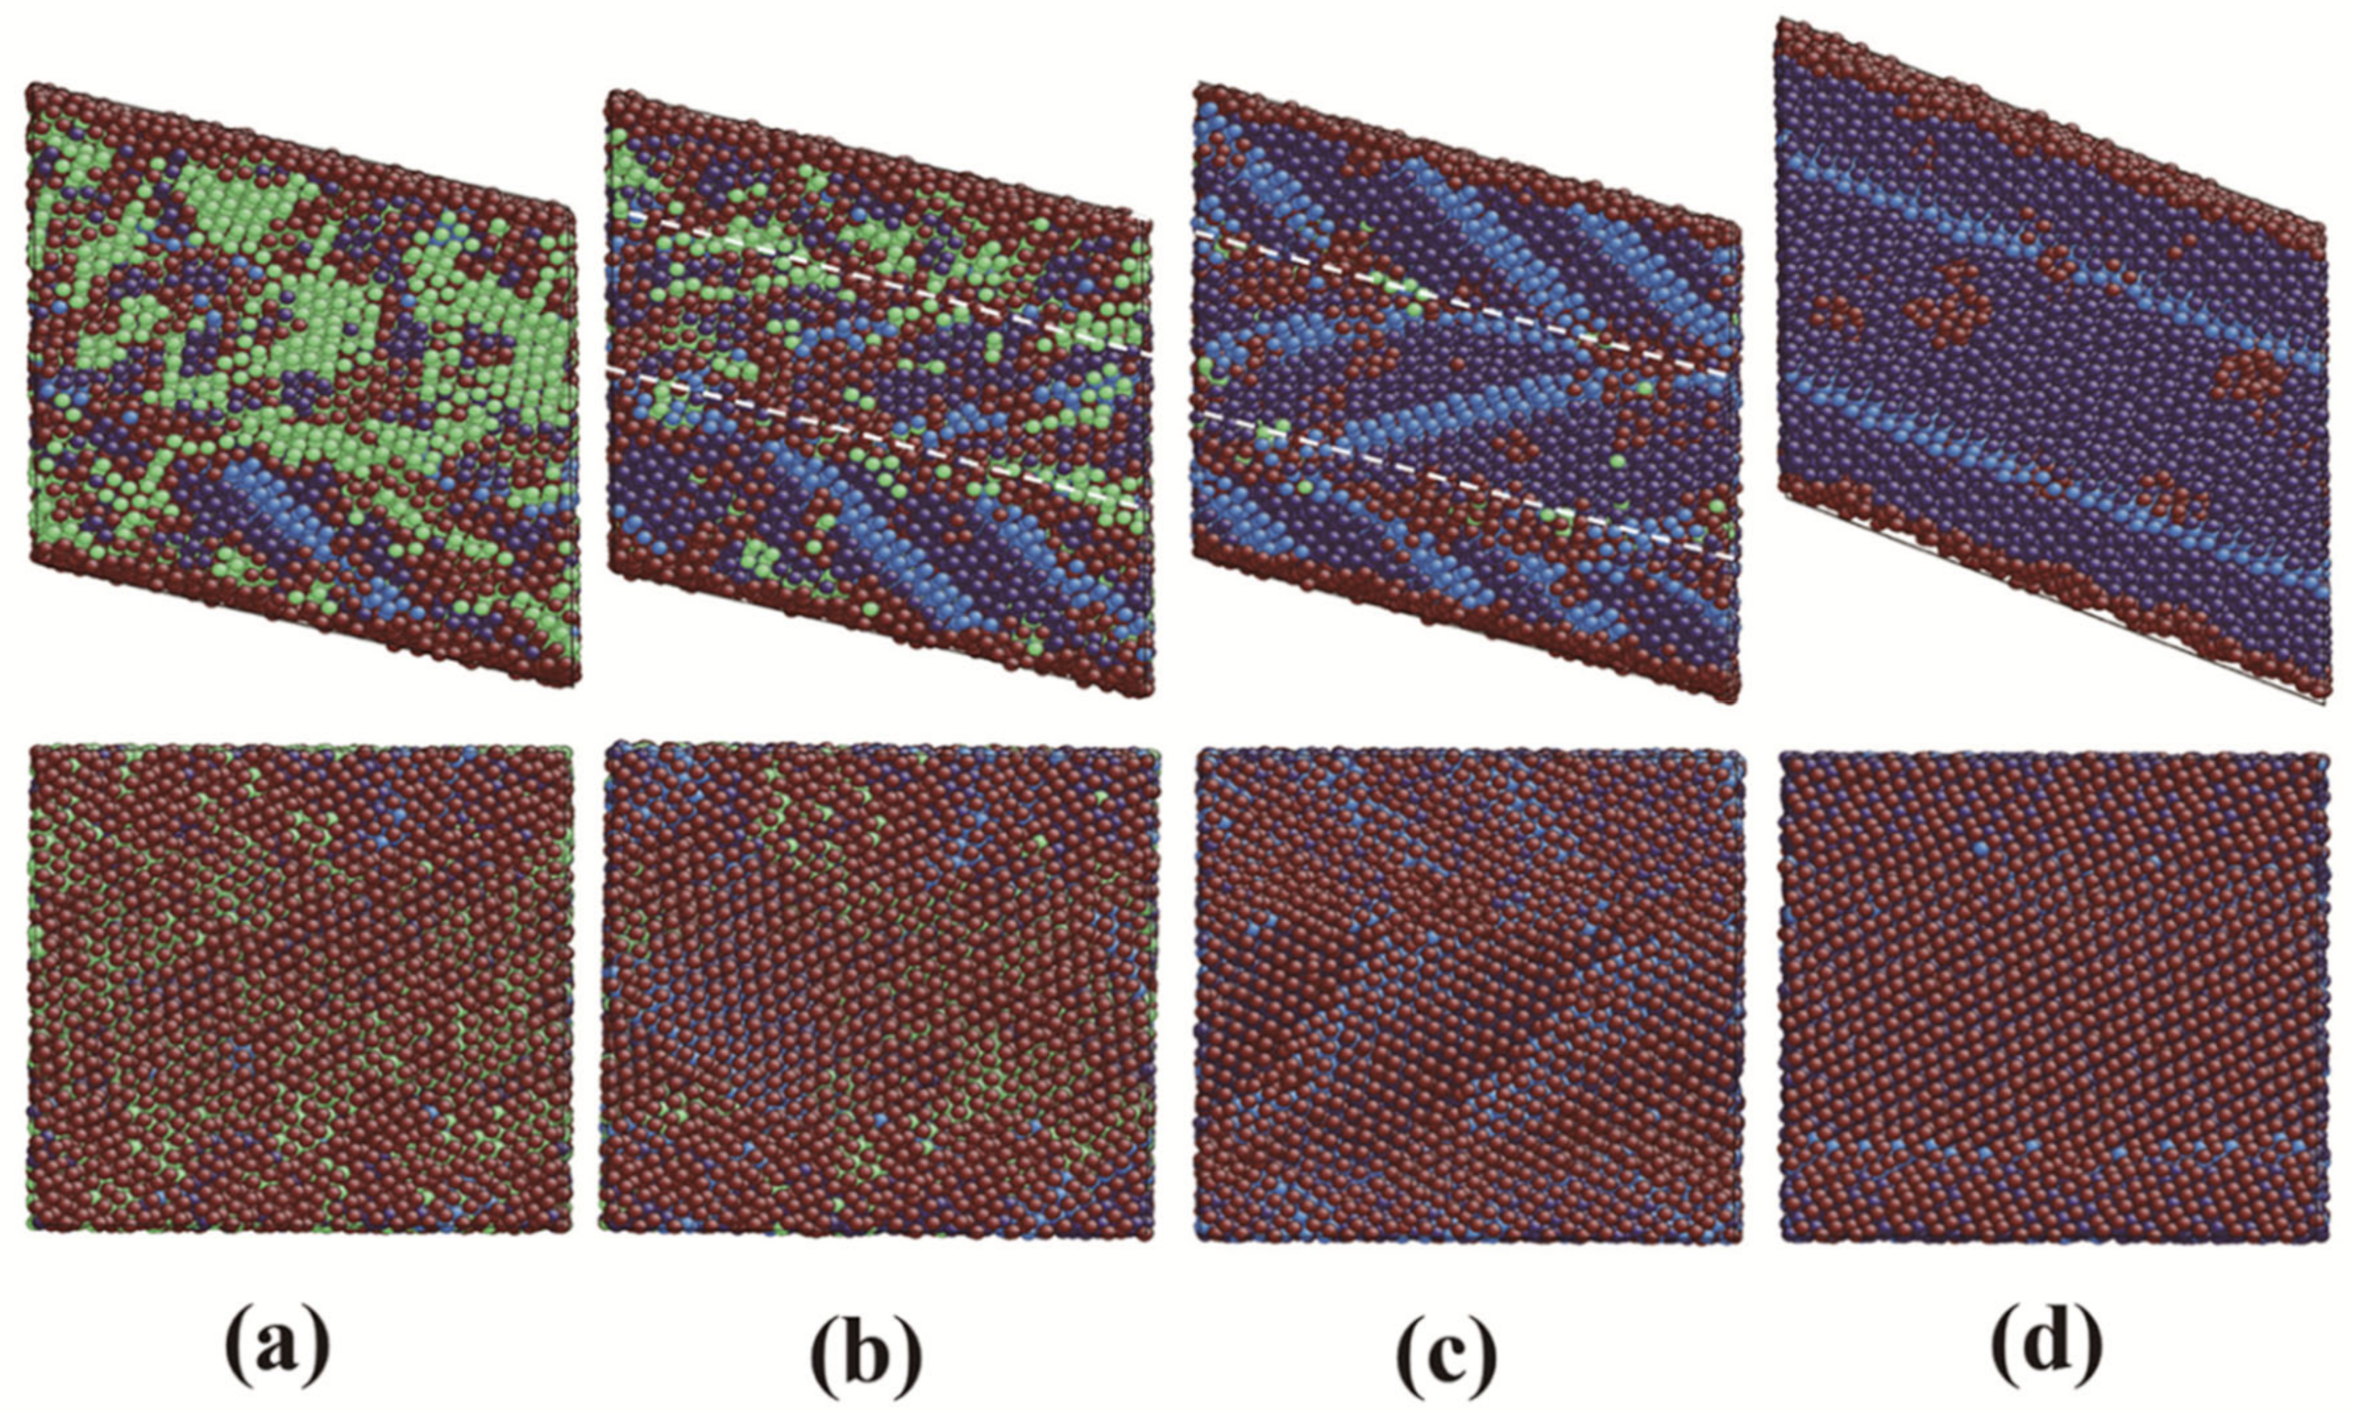
Figure 5 displays some representative snapshots of the martensitic phase transition in film 1. The first nucleation of bcc phase takes place at the upper (111)fcc free surface, as shown in Figure 5a. At 300 K, the bulk atoms exhibit a potential energy of around −4.2 eV/atom, while the potential energy of the surface atoms is approximately −3.7 eV/atom. On the other hand, the crystalline structure of the surface atoms differs from that of the bulk atoms. Thus, the free surface provides the necessary energetic and structural fluctuations for the new phase nucleation. Such surface nucleation has been often reported in studies of the phase transitions in surface dominant systems such as thin films or nanowires [2,3,4,19]. Note that the first nucleation corresponds to a low shear angle of 1.5°, which indicates that the (111)fcc free surface is rapidly activated by the shear deformation. The nucleated bcc phase (denoted as bcc1 in Figure 5b) grows in the [001]bcc direction until it has contact with the lower surface, while the bcc phase (denoted as bcc2 in Figure 5b) with the same crystalline orientation, nucleates at the lower free surface and grows in the []bcc direction. The growth directions of bcc1 and bcc2 are indicated by the white arrows in Figure 5b. Interestingly, the nucleation and growth of bcc2 cause a kink at the free surface, which is indicated by the white circle in the upper Figure 5b. We note that the normal stress in the surface normal direction (z) is approximately 0 during the martensitic phase transition, while the normal stresses in the x and y directions exhibit remarkable values up to 2 GPa. This indicates that the stresses in the surface normal direction are efficiently relaxed by the free surface, which causes the changing of the surface morphology, such as the observed kink. On the right side of this kink, or more exactly, at the site where the bcc2/fcc phase boundary and the free surface intersect, a new bcc phase (denoted as bcc3 in Figure 5b) nucleates and grows into the film. Here we should mention three points. Firstly, it is not unexpected that new phase nucleates at the intersection site between two types of defects, in our case the free surface and the phase boundary. This area provides the largest energetic and structural fluctuations for the new phase nucleation [10]. Here, two values should be given: The phase boundary energy with the N–W geometry amounts to 3.84 J/m2 (0.96 J/m2) with (without) considering the misfit dislocations [31] and the surface energy of the (111)fcc surface is 1.40 J/m2 [19]. Thus, a considerable energy increase is expected at the intersection site between the phase boundary and the free surface. Karewar et al. [28] reported that the TB/stacking fault (SF) or the SF/SF intersection areas are the preferred nucleation sites for the martensitic phase. Secondly, the crystalline orientation of bcc3 differs from that of bcc1 and bcc2. This is due to the morphology change of the surface. The detailed orientation relationship will be discussed in Figure 6. Lastly, bcc3, on the left and right sides in Figure 5b, belongs to the same crystallite due to the periodic boundary condition. However, bcc2 and bcc3 are unstable. They disappear with increasing shear deformation. Simultaneously, the stable bcc1 propagates in the transverse directions. The growth of bcc1 causes another kink at the upper surface, indicated by the white circle in Figure 5c. The new bcc phase (denoted as bcc4 in Figure 5c) nucleates similarly to bcc3 at the intersection site between the bcc1/fcc phase boundary and the free surface with further growth along the [001]bcc and [010]bcc directions, indicated by the white arrows in Figure 5c. The orientation of bcc4 is different from that of bcc1, forming a grain boundary between the two crystallites. The growth of bcc1 and bcc4 interferes with the stacking sequence of the parent fcc phase (ABCABCABC). When one atom layer (A) is transformed, the stacking sequence of the fcc phase converts into BCABCABC as SF. These SFs consisting of two atom layers are identified as hcp phase by the CNA [28], see the light blue colored atoms in Figure 5c. This is the reason for the slightly increased fraction of the hcp phase, see the hcp curve in Figure 4. After full growth, the single crystalline fcc film 1 transforms to a polycrystalline film with two bcc crystallites with different crystalline orientations and kinks at the free surface. The increase in the unidentified atoms in Figure 4 is due to the phase boundaries, which cannot be identified by the CNA, between the bcc crystallites.
We discuss here the stability of the observed nuclei. It is well known that only the nuclei, whose radii are bigger than the critical nucleation radius, can grow further. However, it is difficult to use the critical radius as the criterion to determine the stability of the nuclei in the practice, since most of the nuclei are non-spherical. In addition, the Meyer–Entel potential gives a small free energy difference of 0.038 eV/atom between the fcc and the bcc phase [25]. Small temperature/pressure fluctuation at the transition point may induce transition between the two phases, causing the temporary unstable nuclei. Thus, a more practical way to determine the stability of a nucleus is to observe whether it grows further or transforms back to the original phase.
Finally, the growth velocity, i.e., the velocity of the grain boundary motion, has been discussed elsewhere [39]. In [39], the straight fcc/bcc phase boundary with the N–W geometry propagates towards the bcc side in an fcc–bcc biphasic system at a temperature of 100 K. The propagation velocities vary from 13 to 85 m/s depending on the system size. The tendency is that the smaller the system, the higher the velocity. By tracing the phase boundary between bcc1 and the fcc phase, c.f., Figure 5b,c, the grain boundary propagates a distance of five atom layers within 105 ps along the [010]bcc direction, corresponding to an average interface velocity of 14 m/s. We obtain a similar interface velocity of 13.1 m/s by tracing the bcc4/fcc phase boundary. However, we should note that these interface velocities should be used with care. Firstly, the evaluation of the interface velocity is only performed on one crystal plane, corresponding to the upper part of Figure 5. Indeed, the interface is located in a three-dimensional environment and might be uneven in all directions. In such a nanoscale system, even a small variation may cause a large change in the calculated interface velocity. Secondly, there exists a competition between the growth of bcc1 and bcc4 with different orientations. Interface motion may be hindered by the growth of another crystallite, which has been formed nearby to the interface.
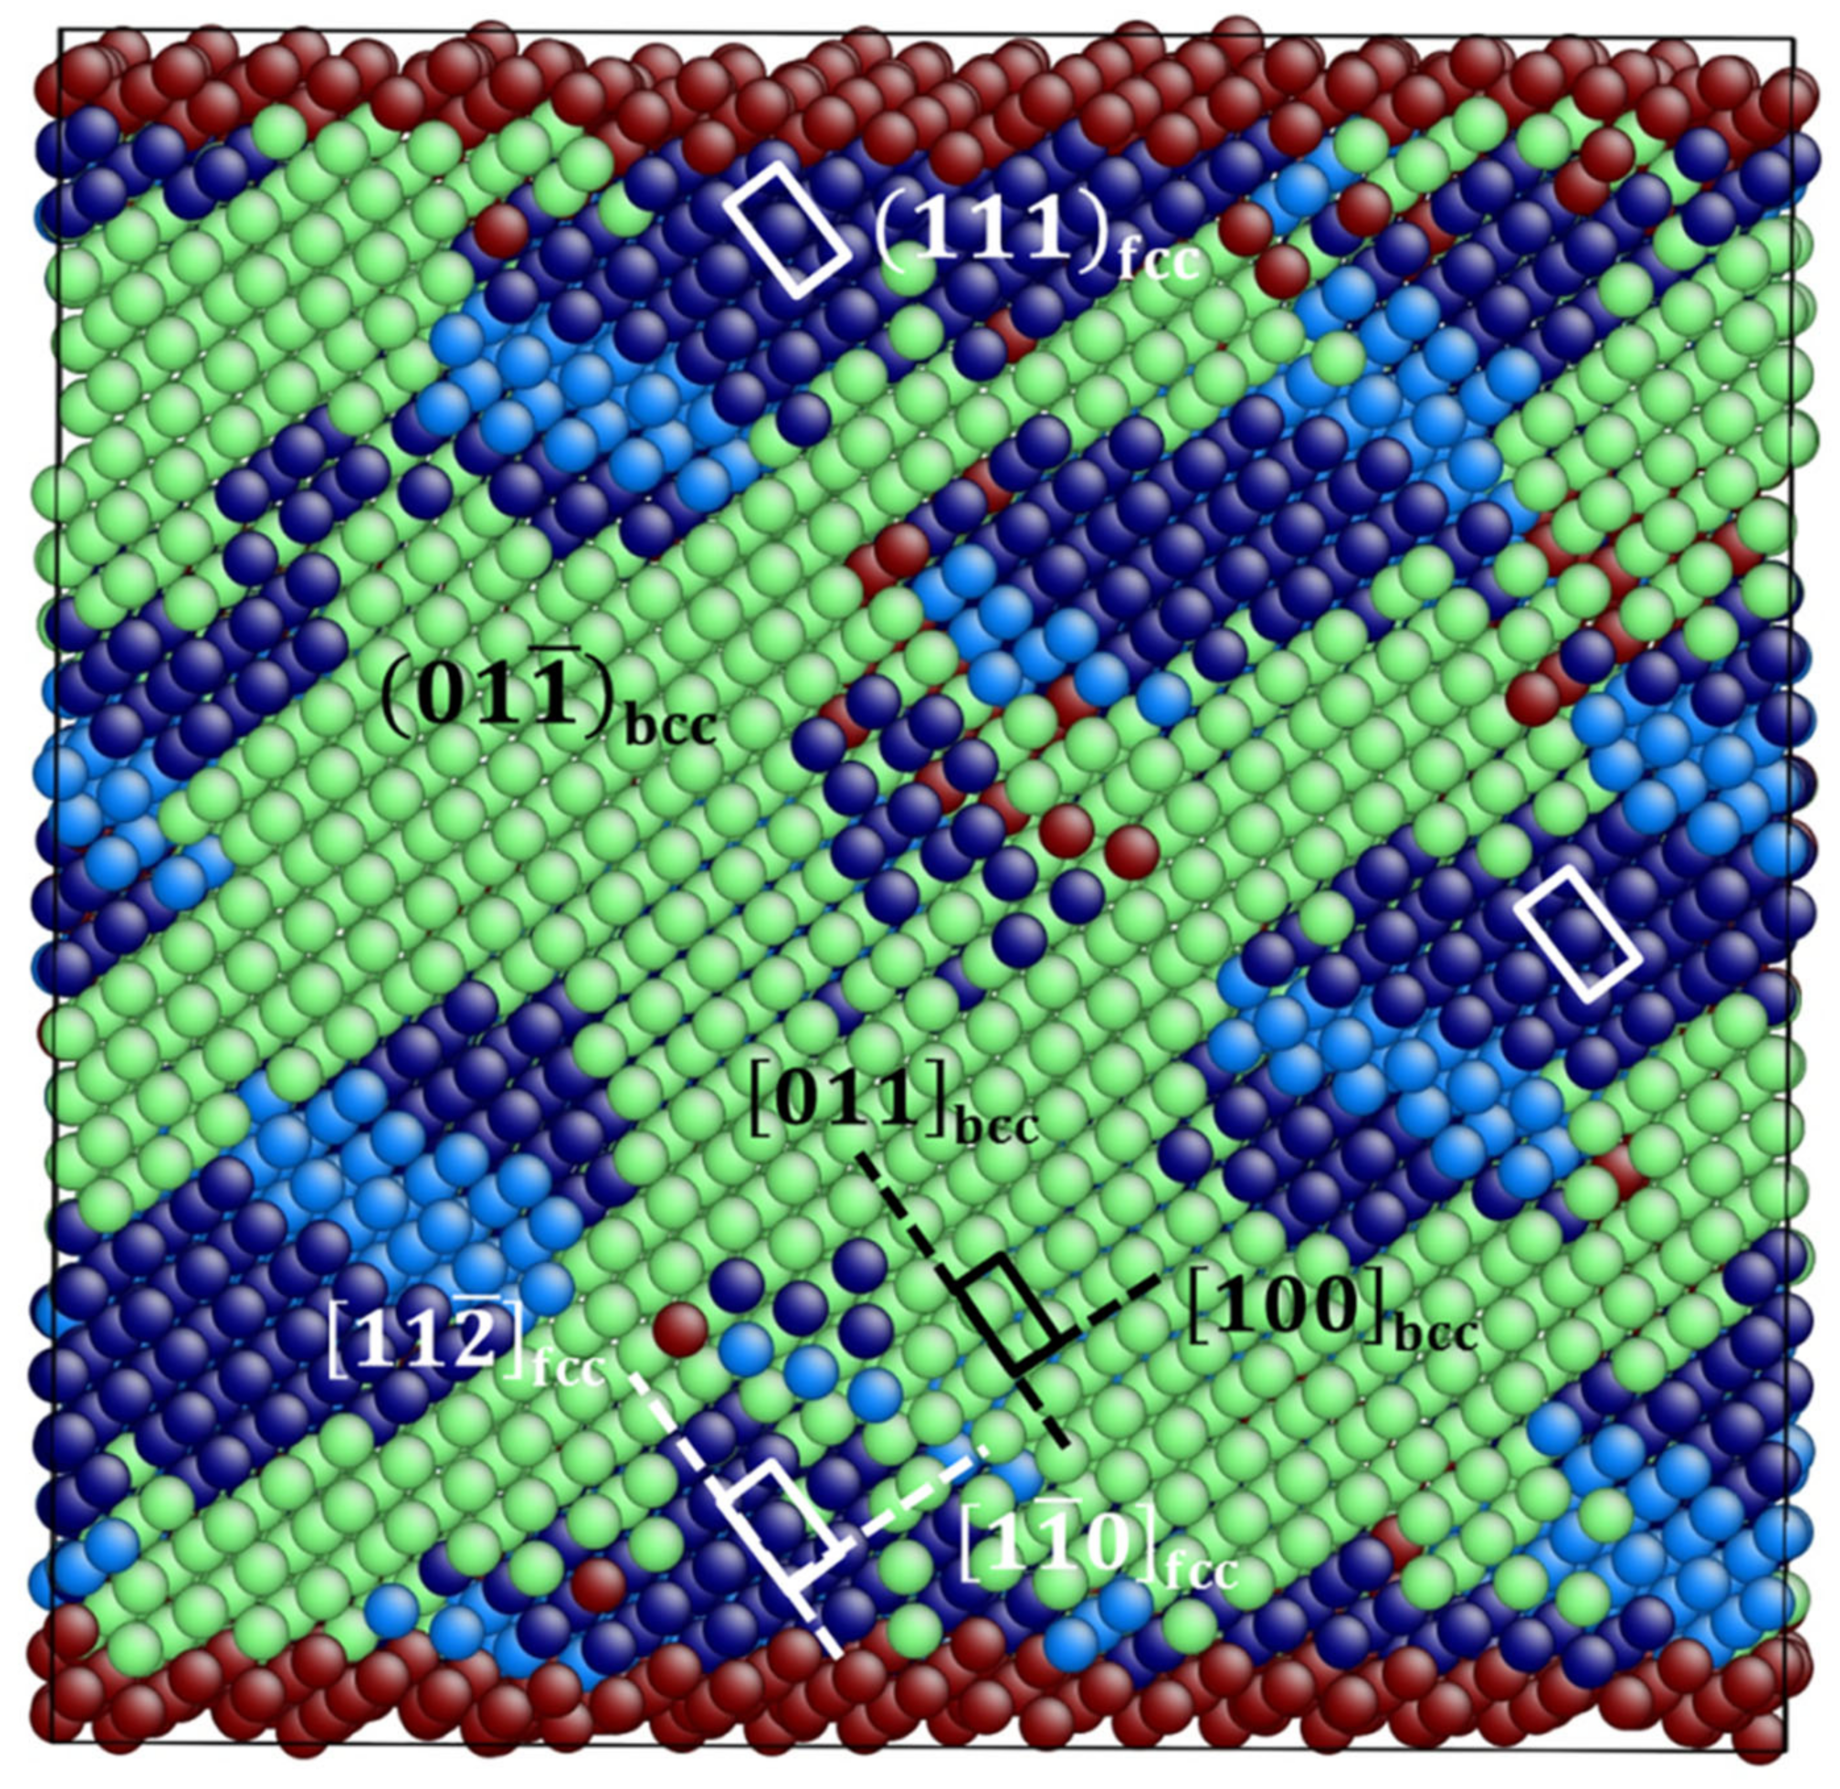
Now we discuss the orientation relationship between the parent fcc phase and the two differently orientated bcc1 and bcc4 phases. Figure 6 displays a zoomed snapshot of the transforming film 1, where the parent fcc phase, bcc1 and bcc4 coexist. The left bcc phase is bcc4 and the right bcc phase is bcc1. The (111)fcc plane transforms to ()bcc plane, which indicates that the close packed plane in the fcc phase is parallel to that in the bcc phase. Over 90% of the phase transitions in Fe or steel obey this orientation relationship [40]. Note that the crystalline planes shown in Figure 6 are parallel to the free surface, i.e., the (111)fcc free surface transforms to the ()bcc surface with a small surface energy reduction from 1.40 J/m2 to 1.35 J/m2 [19]. The small difference in surface energies is compatible with the fact that the martensitic phase transition can be induced at a low shear angle of 1.5° at 300 K. For bcc1, the []fcc direction transforms to the []bcc direction. This is the signature of the K–S relationship [32]:
For bcc4, the []fcc direction transforms to the [110]bcc direction, which corresponds to the N–W [33] relationship:
It has been shown that two transition pathways, namely K–S and N–W, coexist in film 1. Barcelo et al. [41] pointed out that it may be possible to mix several theoretical orientation relationships taking place at different locations of the material, which has been supported by our observations. Johnson et al. [42] experimentally investigated the pure Fe thin film with the (111)fcc surface on the Ni/W(110) substrate and found an fcc to bcc structural change during the growth of the film. In a 12-monolayer thick sample, the authors found both the N–W and K–S relationships, which is in satisfactory agreement with our results. Wang and Urbassek [39] reported the competitive growth of the homogeneously and heterogeneously nucleated bcc phases with different crystalline orientations. Both N–W and K–S relationships are found in a transforming system.
3.2. Fcc Film 2 with the (110) Free Surface
Figure 7 shows the fractional phase content of film 2 with the (110)fcc free surface as a function of shear angle at 300 K. The phase transition starts at a shear angle of around 13°. The decrease in fcc phase content is accompanied with the increase in bcc and hcp phase contents. However, the curve of the hcp phase content decreases to almost zero after it reaches its maximum of around 11%. At high shear angles (over 20°), the hcp content increases again, accompanied by the decrease in bcc phase content.
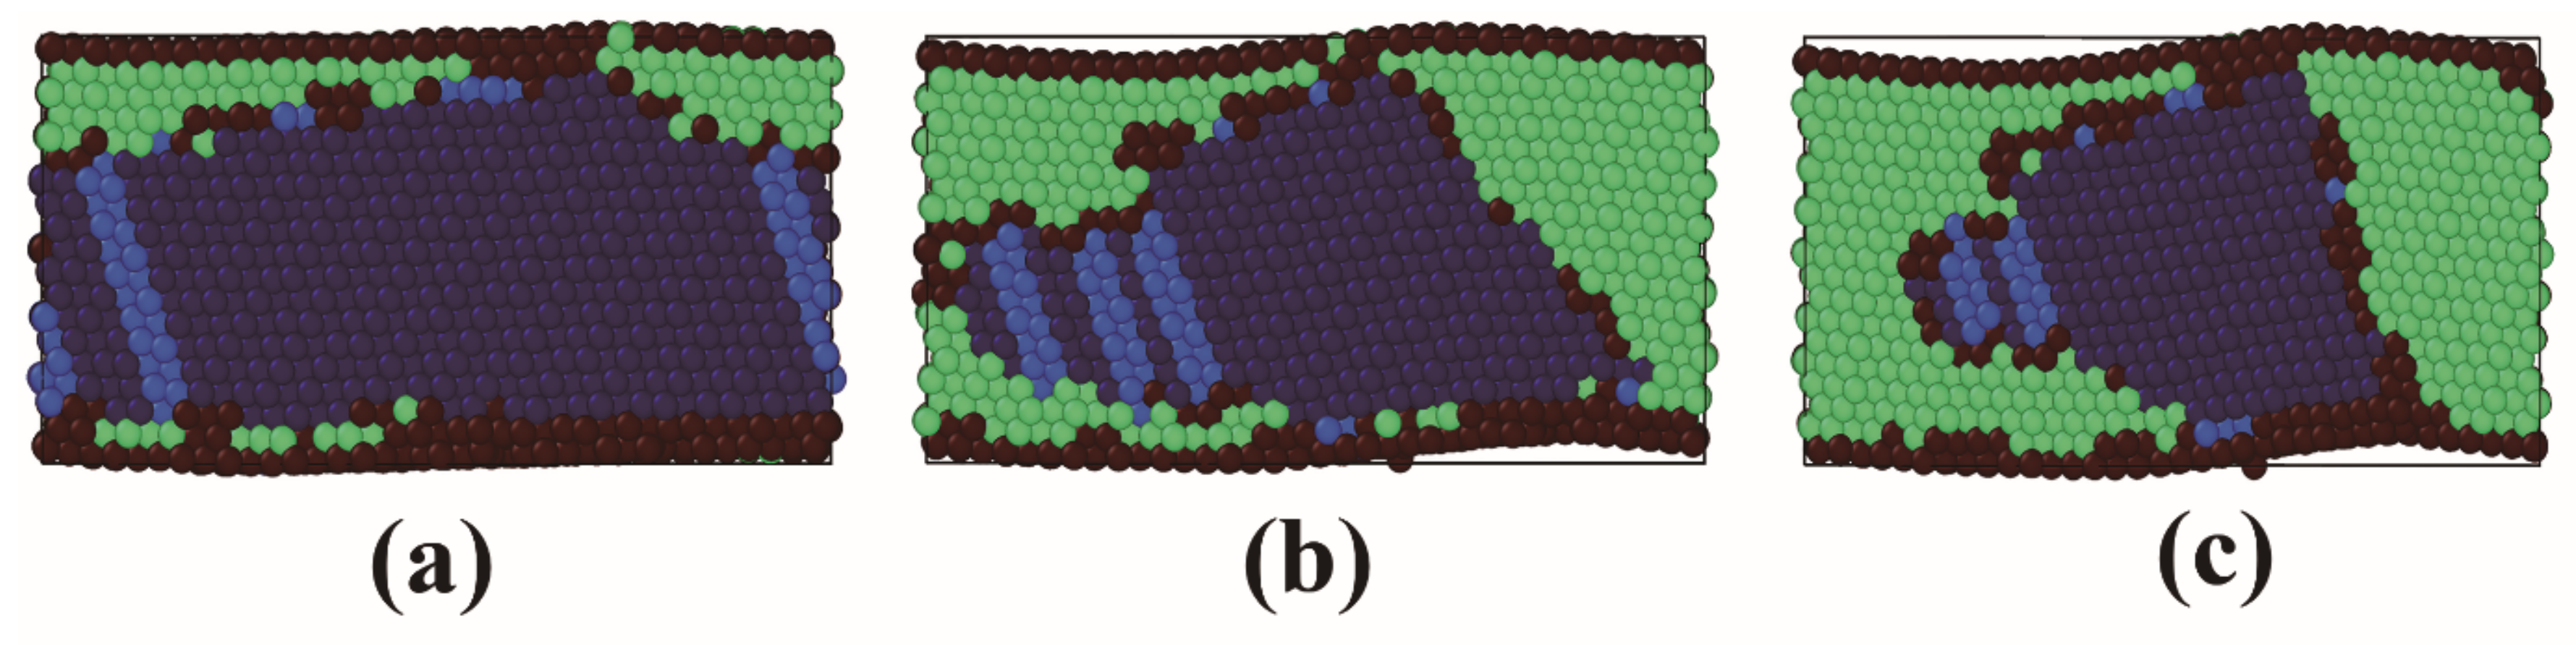
Figure 8 shows some representative snapshots of film 2 with increased shear angle. Before the transition, remarkable amount of hcp phases from stripes are formed in the film, corresponding to the increase in the hcp content at shear angle range from 12° to 15° in Figure 7. These hcp phases consist of two atom layers and should be regarded as SFs in the parent fcc phase [28], as shown in Figure 8a. The fcc and hcp are closely related due to their close packed nature and they differ only in the stacking sequence. In previous simulation works [2,3,10,19], the mixture of the fcc and hcp phases is denoted as the close packed (cp) phase. The shear deformation acts exactly as the necessary shear to shift the fcc atom layers to build SFs. Once the SFs are formed, the bcc phase nucleates simultaneously at the intersection between the SFs and free surfaces, as shown in Figure 8b. The reason for the nucleation at intersection sites between two planar defects (regarding the free surface as a special form of planar defect) has been discussed, c.f., Figure 5c and d. We mention here again the (110)fcc surface energy and the SF energy, which are 1.73 J/m2 [19] and −54 mJ/m2 [28], respectively.
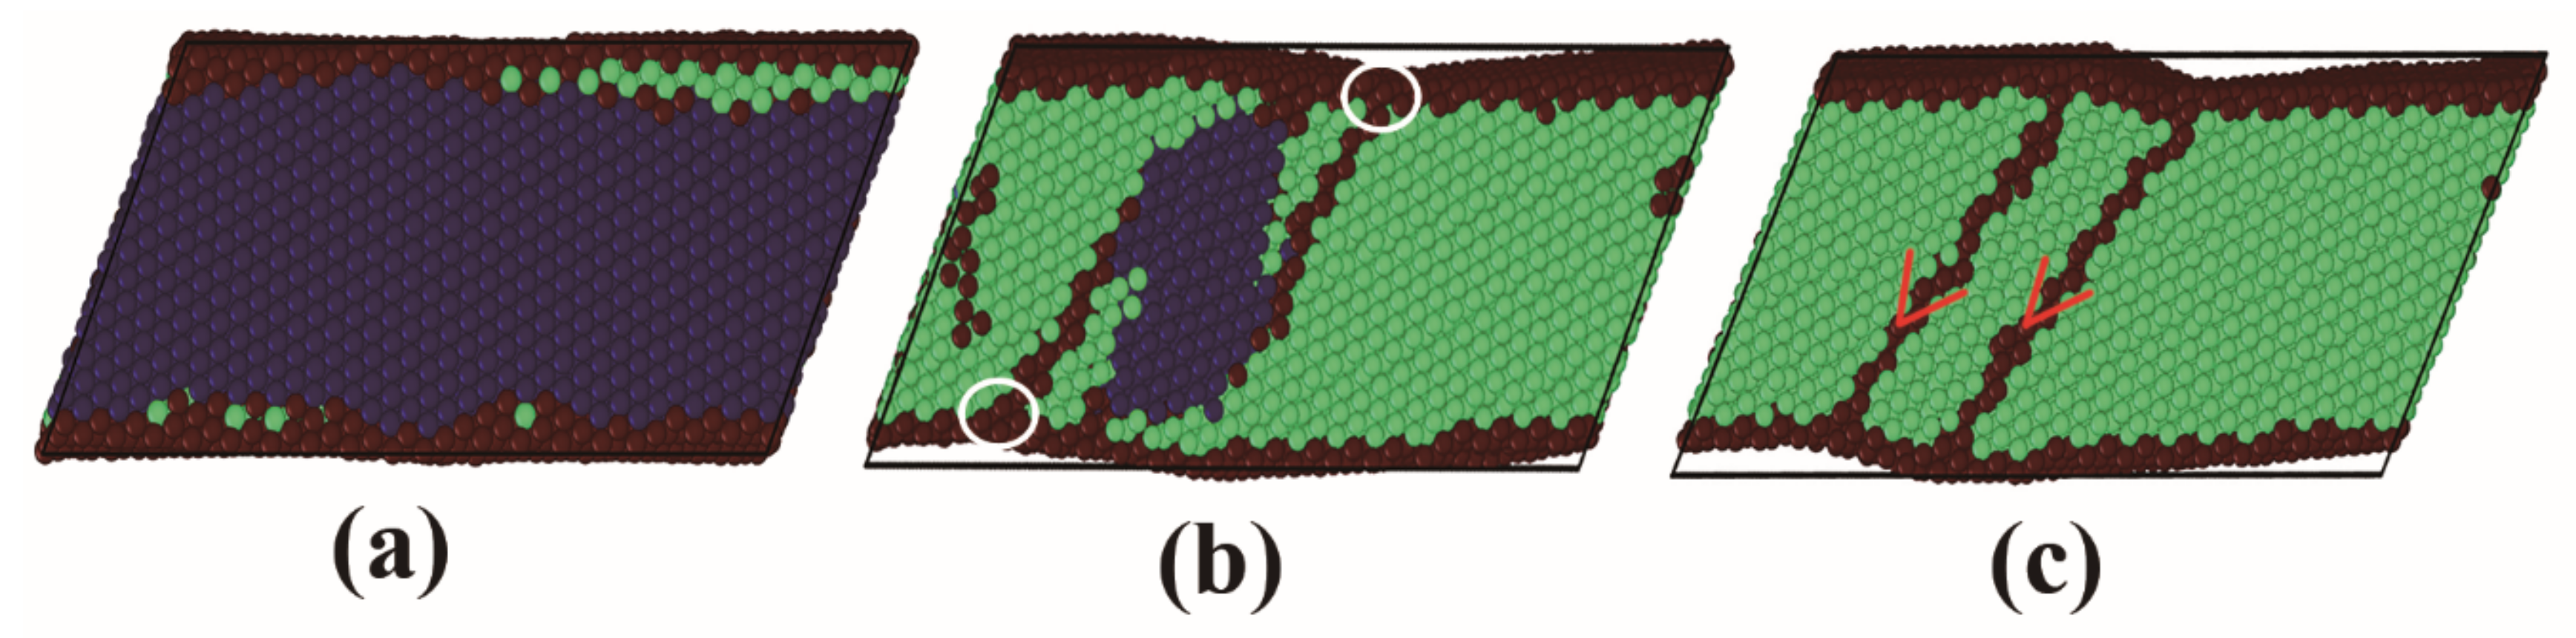
Shen et al. [43] performed tensile tests on a 304 austenitic steel and found that the α’ martensite nucleates preferentially at the intersections of ε martensites (hcp) or deformation TBs at high strains. The new bcc phases grow not along the SFs, but in all three directions. The bcc crystallites nucleated at different sites exhibit the same crystalline orientation, so that a single crystalline bcc film is formed after the full growth, as shown in Figure 8c and d. The SFs are resolved, corresponding to the decrease in the hcp curve at shear angles bigger than 15° in Figure 7. Such resolving of the TBs by the martensitic phase has been reported in a previous simulation work [21]. After the complete phase transition, the (110)fcc surface transforms to the ()bcc surface. Details will be discussed in the next paragraph. Interestingly, the hcp phases nucleate both at the upper and lower ()bcc surfaces at a high shear angle around 23°, as shown in Figure 8e. Besides fcc/bcc phase transition, there exists another allotropic bcc/hcp transition in element Fe, which is induced by the stress [44,45]. The hcp nuclei cover the whole upper and lower free surfaces. This is because the ()bcc surface exhibits a high surface energy of 1.76 J/m2 [19], which makes the nucleation possibility at each position at the free surfaces extremely high. The hcp phases grow into the film and combine to each other, as shown in Figure 8f. However, they cannot grow further with the shear angle increase until the maximal shear of 26.5° is reached. Sandoval et al. [2] reported analogous bcc→cp→bcc (partly) transitions in a nanowire system under tensile uniaxial stress. The considerable shear deformations in our case may cause a coherent shift of the lattice planes. Note that the free energy difference between the bcc phase and the hcp phase in the Meyer–Entel potential is tiny, which amounts to around 3.1 meV/atom under a pressure of 1.7 GPa [46] measured at a shear angle of 23°, corresponding to the first nucleation of the hcp phase, see Figure 8e. Such a coherent shift of the lattice planes may lead to a phase transition.
Figure 9 shows the zoomed ongoing martensitic phase transition in film 2. We note that the bcc phases nucleated at different intersections between the SFs and free surfaces have the equivalent crystalline orientation. The plane shown in Figure 9 is the original ()fcc plane, which transforms to the (110)bcc surface. The [110]fcc direction indicated by the white dashed line is parallel to the transformed []bcc direction, indicated by the black dashed line. This is the signature of the K–S orientation relationship. We note that the [110]fcc and ]bcc directions correspond to the original fcc surface normal and transformed bcc surface normal, respectively. The directions indicated are not perfectly perpendicular to the free surface. This is because the lattices are distorted by the shear deformation. The (110)fcc surface transforms to the ()bcc surface with a tiny surface energy increase from 1.73 J/m2 to 1.76 J/m2 [19], indicating that a spontaneous transition is not possible. Thus, a large shear deformation is necessary to activate the (110)fcc surface as nucleation site, corresponding to the fact that the first phase transition starts at a large shear angle of 13°.
3.3. Bcc Film 3 with the (111) Free Surface
Figure 10 shows the fractional phase contents of film 3 with shear angle increase. The bcc phase content decreases at a shear angle of around 12°, while the fcc and hcp contents increase correspondingly. In shear angle range from 18° to 26.5°, the hcp phase curve shows a decreasing tendency, while the fcc curve rises continuously. The fraction of the unidentified atoms increases during the phase transition and then decreases with shear angle increase, indicating a violent change of the microstructure.
Figure 11 shows some representative snapshots characterizing the austenitic transformation in film 2. The first nucleation takes place at a big shear angle of around 12°. This is not unexpected since the (111)bcc surface is not easy to activate. As mentioned in the introduction, Meiser and Urbassek [19] simulated the Fe thin slabs with the (111)bcc surface and no austenitic phase transition could be observed up to 2000 K. The authors also simulated the bulk bcc and an austenitic transition temperature of 1485 K was reported. They concluded that the (111)bcc surface works as an obstacle to the phase transition, since this surface is not conserved in any reported transformation pathways. In our case, the heterogeneous nucleation at the free surfaces and the homogeneous nucleation in the bulk material take place simultaneously, as shown in Figure 11a. The homogeneously nucleated phases distribute statistically in the film, coinciding with the observation in the simulation of the tensile strain induced phase transition in an Fe thin film with the (111)bcc surface [3]. The authors of [3] argued that this statistical nucleation might be related to the inhomogeneous distribution of the stress in the film. The heterogeneously and homogeneously nucleated fcc phases are separated by the white dashed lines in Figure 11b and c. Such competition of homogeneous and heterogeneous phase growth has been also reported in previous simulation works [31,39]. We note that the heterogeneously and homogeneously nucleated fcc phases have the equivalent crystalline orientation, which should be the result of the uniformly applied shear deformation. The detailed orientation relationship will be discussed later. The hcp phases that form in stripes mostly consist of two atom layers and should be regarded as SFs in the fcc matrix [28]. The formation of these SFs is the reason of the increase in hcp phase content in the shear angle range from 12° to 17°, see the hcp curve in Figure 10. With further increases in the shear angle, the SFs migrate in the opposite directions. When two SFs meet, they counteract each other, corresponding to the hcp phase content decreasing at high shear angles, as shown in Figure 10. In the meantime, new SFs parallel to the surface are generated, which separate the fcc phases nucleated at the free surfaces and in the bulk material, as shown in Figure 11d.
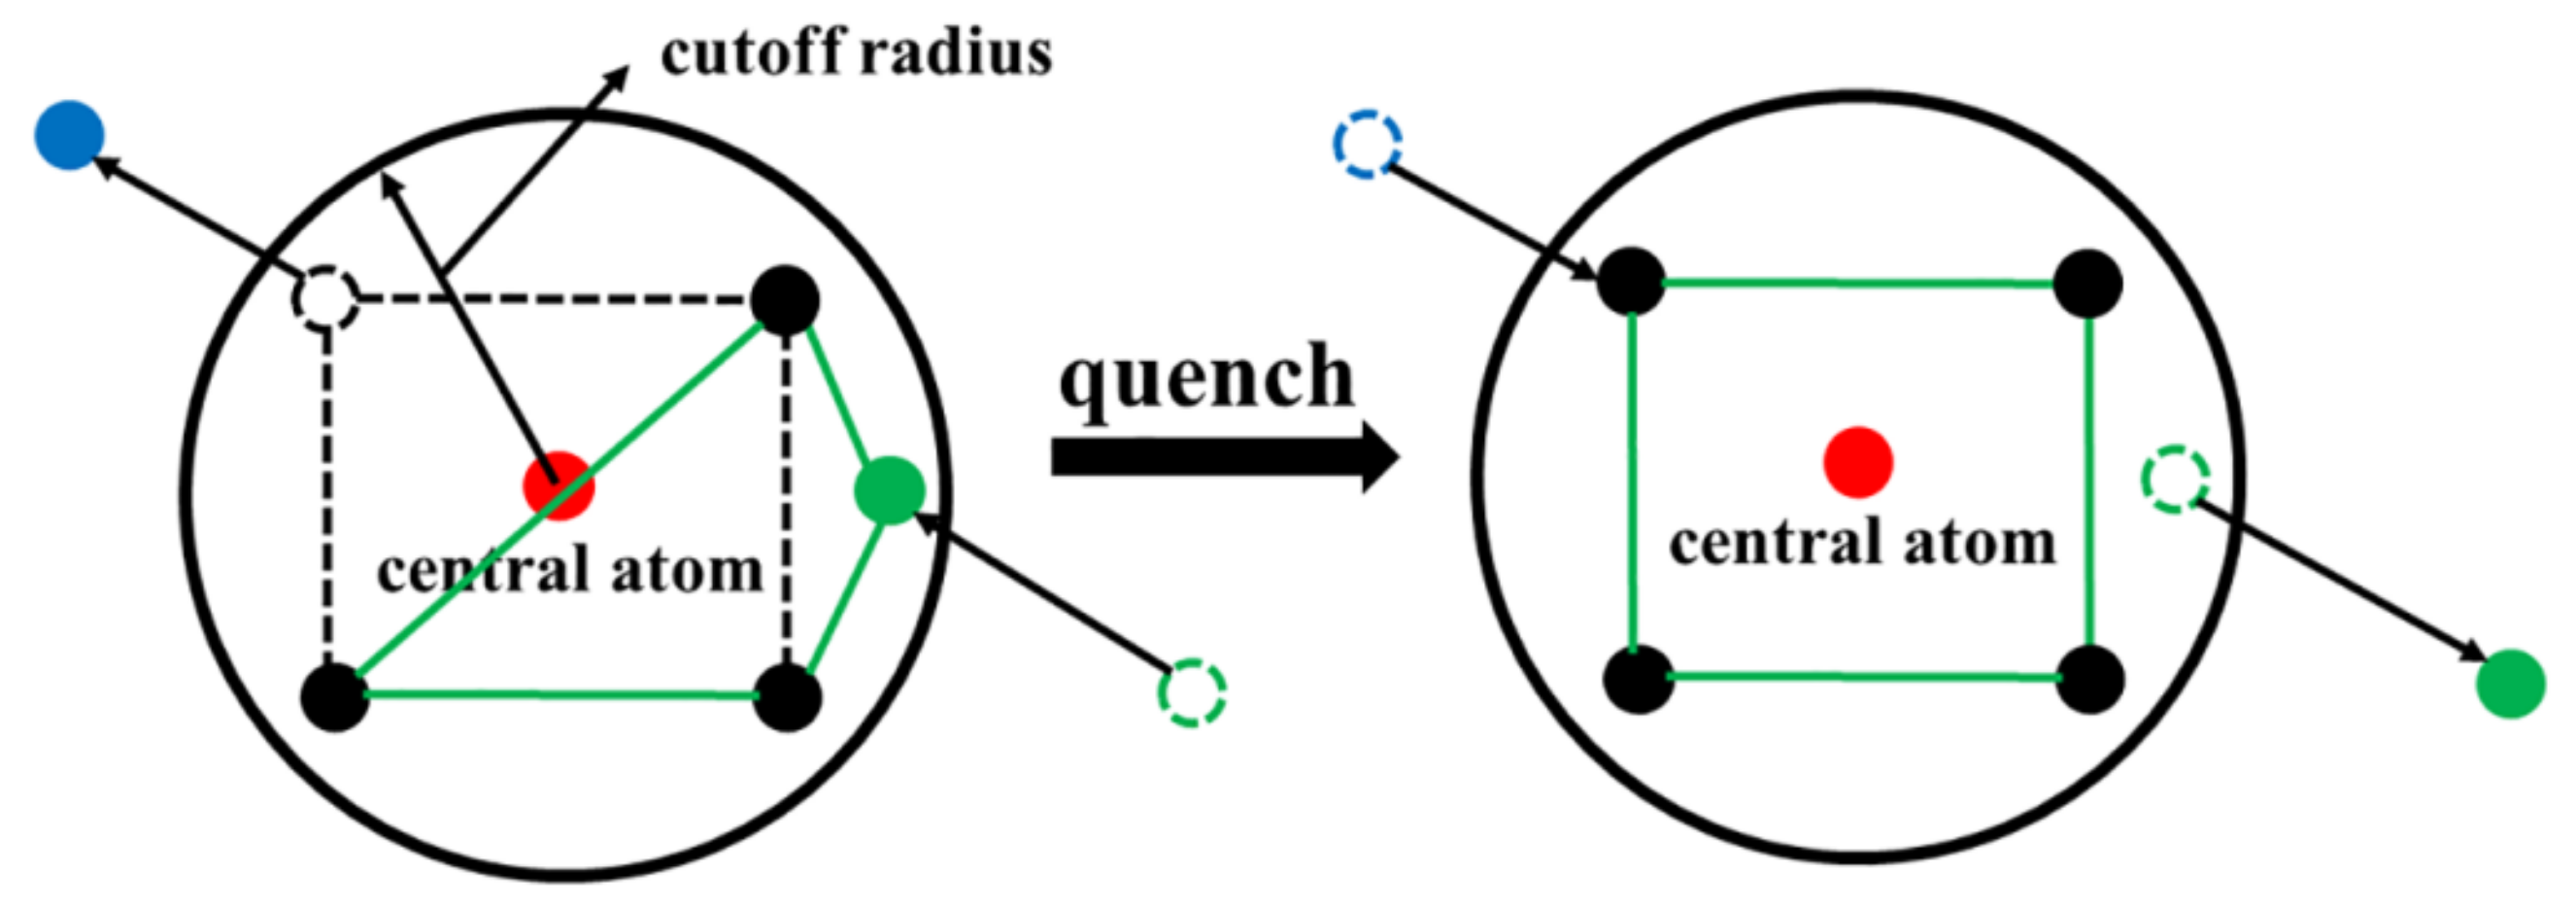
At a temperature of 800 K, a large amount of atoms cannot be identified efficiently by the CNA, see the red dots in the upper part of Figure 11. During the phase transition, the atoms leave their original positions, they may be located at the intermedia positions between the fcc and bcc sites. On the other hand, it is well known that the atoms vibrate more strongly at higher temperatures. Regarding a central atom (the red atom in Figure 12), one neighbor atom (the blue atom in Figure 12) might leave its equilibrium position and be at a position out of the cutoff range due to the strong thermal vibration caused by the high temperature. For the same reason, another atom from the neighbor lattice (the green atom in Figure 12) could enter the cutoff range of the central atom. This process could also happen among several atoms. In this manner, the topology of the bonds that connect the surrounding neighbor atoms has been changed so that the CNA cannot correctly identify the crystal type of the central atom. Note that once the temperature is fixed, the thermal vibrations of the atoms are not controllable during the simulation. This severely disturbs the analysis of the transition pathway. A strategy to overcome this problem is quenching the system from the high temperature. The quenching velocity should be selected with care. If the quenching velocity is too high, the atoms do not have enough time to migrate back to their equilibrium positons. In contrast, too low a quenching velocity causes phase transition. In this context, film 3 at a shear angle of 15.6° is quenched from 800 K to 1 K within 1 ps to eliminate the effect of thermal vibration.
Figure 13 shows a zoomed snapshot of the ongoing austenitic phase transition. It can be clearly observed that the fcc phases nucleate heterogeneously at the upper and lower surfaces and homogeneously in the bulk material, see the identical unit cells indicated by the white rectangles in Figure 13. The original ()bcc plane transforms to the (111)fcc plane, while the [011]bcc direction transforms to the ]fcc direction. This corresponds to the N–W orientation relationship. Such “kinks” at the surfaces as in film 1 are not observed here, so the phase transition only obeys a unique transition pathway. The (111)bcc surface transforms to the ()fcc surface with a tiny surface energy decrease from 1.76 J/m2 to 1.73 J/m2 [19]. This tiny energy difference indicates that the phase transition is not easily activated, at least by pure thermal effect [19]. Large shear deformation, in this case a shear angle around 12°, is necessary to activate the austenitic phase transition in a thin bcc film with the (111) bcc surface.
3.4. Dependence on Film Thickness
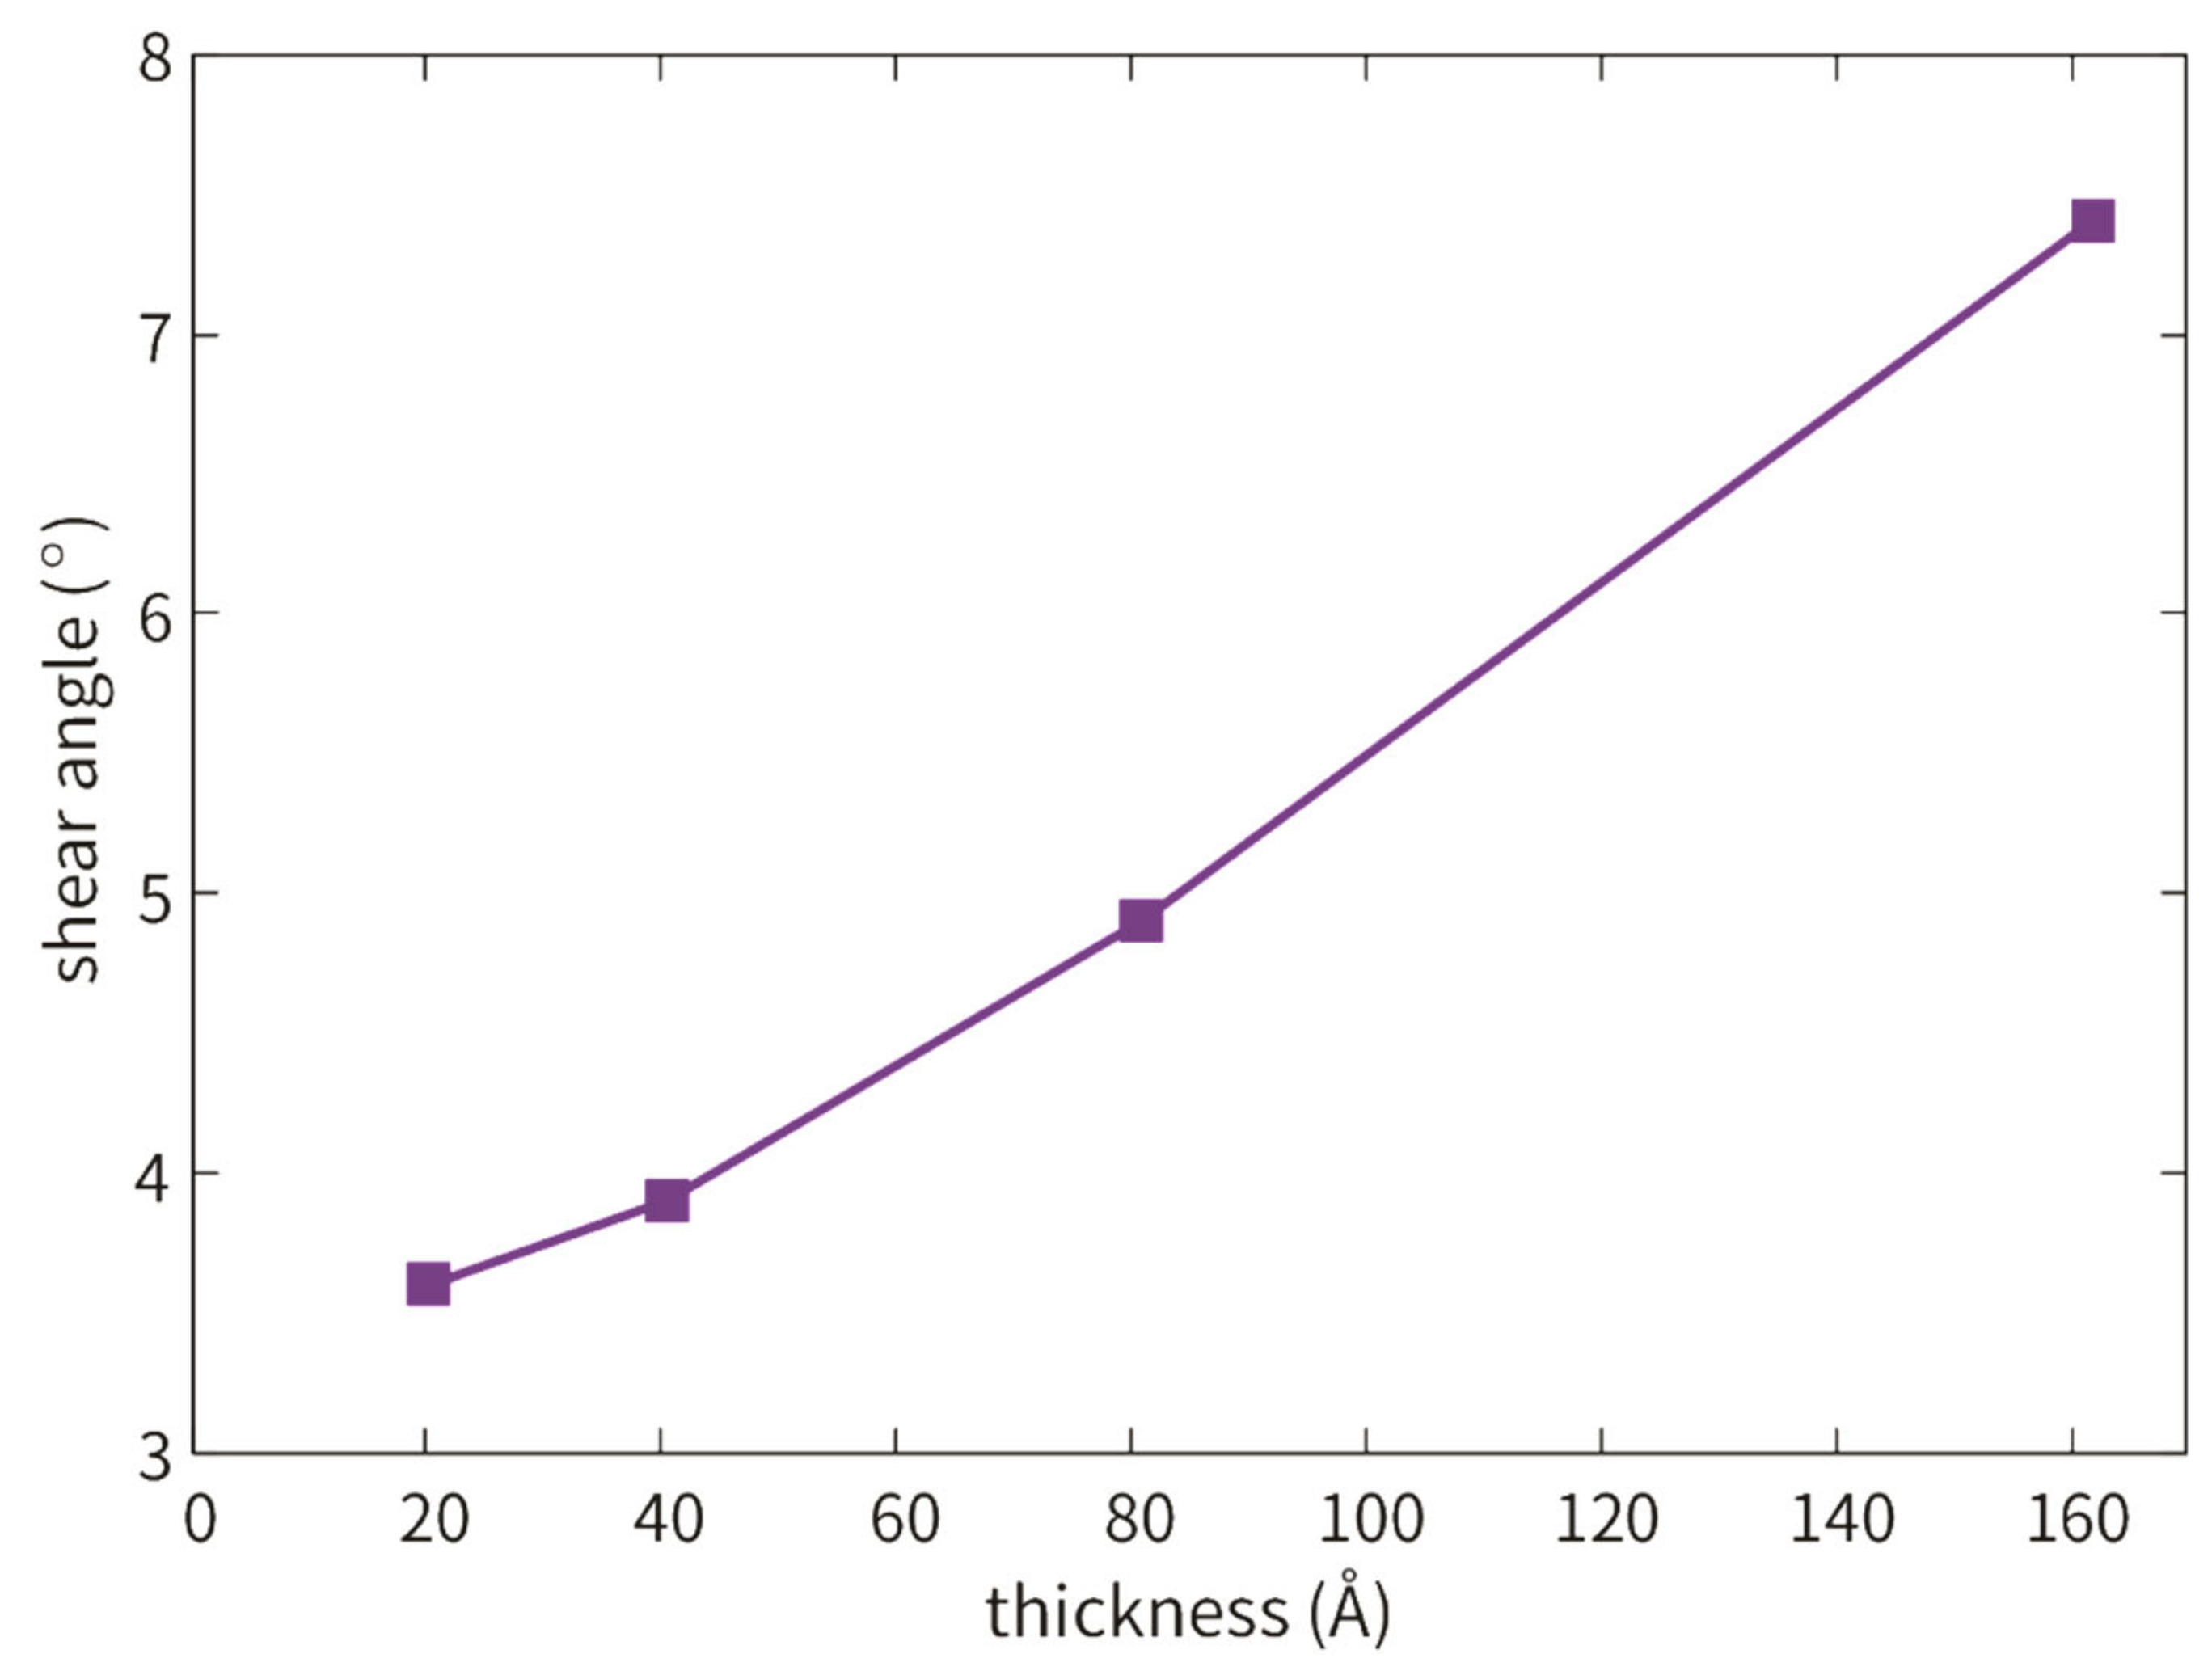
We choose film 1 with a thickness around 80 Å as a standard to investigate the thickness (surface–volume ratio) effect on the phase transition. Another three films with the same crystalline orientations as film 1 and various thicknesses are simulated. These three films are as 0.5, two and four times as thick as film 1. The simulation setups are identical with film 1. Figure 14 shows the shear angles, at which 50% of the fcc phase have been transformed, in dependence on film thickness. It can be observed that the shear angle increases with the thickness increase. This can be explained by noting that thinner films exhibit a higher surface–volume ratio than thicker ones. The surface benefits the phase transition since it provides more sites for the nucleation of the new phase compared to the bulk, and hence the new phase can be formed at lower shear angles in thinner films. In addition, the atoms at the surface are not so close packed compared with the bulk atoms. This provides free volume for coordinated atom movement, which is essential for the phase transition.
4. Conclusions
In the present work, we studied shear deformation assisted phase transitions in three Fe thin films with the “inactive” (111)fcc, (110)fcc and (111)bcc free surfaces. With pure temperature changing, film 1 with the (111)fcc surface and film 3 with the (111)bcc surface do not transform, while film 2 with the (110)fcc surface transforms at a very low temperature of 81 K with pure homogeneous nucleation in the bulk [19]. Based on the K–S orientation relationship, we applied shear deformation on these thin films to activate the free surfaces. Note that without shear deformation, the fcc films (films 1 and 2) and bcc film (film 3) do not transform at a temperature of 300 K and 800 K within a simulation time of 5 ns. The main results can be concluded as follows.
1. In film 1 with the (111)fcc free surface, the martensitic phase transition starts at a low shear angle of 1.5°. The surface is easy to activate. This is due to the fact that the martensitic phase transition is associated with a surface energy decrease. With the help of the shear deformation, the (111)fcc surfaces assist the phase transition as nucleation sites. The phase transition induced stress in the surface normal direction is efficiently relaxed by the free surface, which causes a kinked surface structure. This kinked structure induces nucleation of the bcc phase with different crystalline orientation from the initial one. Both N–W and K–S orientation relationships are observed during the martensitic phase transition.
2. In film 2 with the (110)fcc free surface, the martensitic phase transition begins at a high shear angle of 13°, which should be the result of the surface energy increase after the phase transition. Remarkable SFs are formed before the phase transition takes place. The new bcc phase nucleates preferentially at the intersections between the SFs and free surfaces. After the martensitic phase transition, a single crystalline bcc film is formed. At higher shear angles, hcp phases nucleate in thin layer form at the upper and lower bcc surfaces and grow into the film. In film 2, the martensitic phase transition uniquely obeys the K–S pathway.
3. In film 3 with the (111)bcc free surface, the new fcc phases with remarkable SFs nucleate both homogeneously in the bulk material and heterogeneously at the free surface. The fcc phases nucleated from different sources grow competitively. At higher shear angles, the SFs that the fcc phases contained migrate and counteract each other. New SFs are formed to separate the homogeneously and heterogeneously nucleated fcc phases. The austenitic phase transition is associated with a tiny surface energy decrease and obeys the N–W transition pathway.
These results might be helpful to understand the effect of shear deformation on the transition mechanism in nanoscale systems.
Author Contributions
T.R. performed the M.D. simulation. T.R., B.W. and Y.J. analyzed the results. B.W. and C.X. designed the work. All the authors discussed the results and T.R. wrote the manuscript. All authors have read and agreed to the published version of the manuscript.
Funding
This research was funded by Shanghai Pujiang Program, grant number 17PJ1408600 and Collaborative Innovation Program of Shanghai Institute of Technology, grant number XTCX2019-8.
Conflicts of Interest
The authors declare no conflict of interest.
Appendix A
Simulation Using the Müller Potential
Although the Meyer–Entel potential [20] has been widely used in simulations of phase transitions in bulk [21,28,31,34,39] and nanoscale systems [2,3,4,10,19], it is still essential to examine the repeatability of our results using another potential. A bond-order (BO) potential developed by Müller et al. [29] is used to simulate the films. This potential predicts an equilibrium transition temperature of 1030 K [29], which roughly corresponds to the experimental value of 1184 K. The simulation setups are equivalent to the simulations using the Meyer–Entel potential. It should be mentioned that the Müller potential formulates a cutoff radius of 3.15 Å, which is smaller than the suggested cutoff of the CNA [37], while the cutoff radius of the Meyer–Entel potential is 8.33 Å. Thus, the CNA is not suitable to identify the local crystalline structure by using the Müller potential. The adaptive-CNA [37], which computes the cutoff radius for each atom, is used to identify the local lattice structure. The free software tool OVITO [47] was used for visualization. As references, the fcc films are simulated at 300 K (800 K for the bcc film 3) in absence of any shear deformations and no phase transition can be observed.
Figure A1 shows some representative snapshots of the ongoing martensitic phase transition in film 1. The SFs, which are identified as hcp atoms, can be observed in the film. The reason for formation of the SF has been discussed in Section 3.2. Similar to the simulation using the Meyer–Entel potential, the first nucleation of the bcc phase preferentially starts at the free surfaces, which provide the essential energetically and structural fluctuations for the nucleation, as shown in Figure A1a. With shear angle increase, the bcc phase grows into the film, as shown in Figure A1b. A complete phase transition is not achieved till the largest shear deformation. Only around 40% fcc atoms have been transformed. The martensitic phase transition obeys the K–S orientation relationship. However, the surface “kink” that initiates new nucleation with the N–W orientation relationship in the case using the Meyer–Entel potential is not found. In summary, the observed surface nucleation-growth mode corresponds approximately to the case using the Meyer–Entel potential.
Figure A1.
Snapshots of the ongoing martensitic phase transition in film 1 with the (111)fcc surface at 300 K. The simulation is performed using the Müller potential. The colors denote the local crystal structure as in Figure 5. The plane shown is the original (0)fcc plane. (a) Status at a shear angle of 10.9°. The new bcc phase nucleates preferentially at the free surface; (b) Status at a shear angle of 13.1°. The bcc phase grows; (c) Status at the largest shear angle of 26.5°.

An atomistic view (Figure A2) shows how the martensitic transition occurs in film 2 with the (110)fcc free surface. Analogous to the simulation using the Meyer–Entel potential, the first nucleation begins at the free surface, as shown in Figure A2a. Interestingly, “kinks”, which are indicated by the white circles in Figure A2b, are formed at the free surface. Similar to the simulation of film 1 using the Meyer–Entel potential, differently orientated bcc phases nucleate at the intersection sites of the phase boundaries and the free surfaces. After full growth, the single crystalline fcc film transforms to a polycrystalline bcc film with two crystallites, separated by the TBs. In accordance with the simulation of film 2 using the Meyer–Entel potential, the martensitic phase transition obeys the K–S path, in which such twinning structure is often observed [19].
Figure A2.
Snapshots of the ongoing martensitic phase transition in film 2 with the (110)fcc surface at 300 K. The simulation is performed using the Müller potential. The colors denote the local crystal structure as in Figure 5. The plane shown is the original ()fcc plane. (a) First nucleation at the free surface at a shear angle of 23.1°; (b) Growth of the bcc phase at a shear angle of 23.3°. “Kinks” at the free surface, indicated by the white circles, initiate new nucleation with different orientation. (c) Status at the largest shear angle of 26.5°. The twin structure is indicated by the red lines.

For the austenitic phase transition, we note first that the Müller potential predicts an equilibrium transition temperature of 1030 K [29], which is above the simulated temperature of 800 K. Film 3 does not transform at this temperature without the help of shear deformation. Using the Müller potential, the new phase nucleates both homogeneously at the free surface and heterogeneously in the bulk material, as shown in Figure A3a. This observation is entirely consistent with the case simulated by using the Meyer–Entel potential. However, the dominant phase is hcp rather than fcc. This is due to energetic reason. The energy difference between the fcc and hcp phases in the Müller potential is tiny, i.e., 3 meV/atom [29]. Very small temperature or pressure fluctuation during the simulation may cause the transition between the two phases. The hcp phases grow further into the film, as shown in Figure A3b. The grains that homogeneously and heterogeneously nucleated are separated by fcc atom layers. The fcc layers in the hcp matrix consist of two atom layers, which should be interpreted as SFs. Note that the fcc and hcp phases only differ in stacking sequence. The shear deformation applied may act as the necessary shear to shift the fcc atom layers to build SFs. In simulation studies of the austenitic phase transition in Fe, it is typical that both close packed phases, fcc and hcp, are created [3,4,19,31]. With further increases in the shear deformation, more SFs are formed, as shown in Figure A3c. The single crystalline bcc film transforms to a polycrystalline hcp film with a sandwich structure.
Figure A3.
Snapshots of the ongoing austenitic phase transition in film 3 with the (111)bcc surface at 800 K. The simulation is performed using the Müller potential. The colors denote the local crystal structure as in Figure 5. The plane shown is the original ()bcc plane. (a) Simultaneous nucleation of the new hcp phase at the free surface and in the bulk at a shear angle of 17.6°; (b) Growth of the hcp phases nucleated at the surface and in the bulk material at shear angle of 23.3°. (c) Status at the largest shear angle of 26.5°. More SFs are formed due to the increasing shear deformation.

References
- Tian, F.; Zhu, J.; Wei, D. Phase transition and magnetism of Ni nanowire arrays. J. Phys. Chem. C 2007, 111, 6994–6997. [Google Scholar] [CrossRef]
- Sandoval, L.; Urbassek, H.M. Finite-size effects in Fe-nanowire solid-solid phase transitions: A molecular dynamics approach. Nano Lett. 2009, 9, 2290–2294. [Google Scholar] [CrossRef] [PubMed]
- Wang, B.; Urbassek, H.M. Computer simulation of strain-induced phase transformations in thin Fe films. Model. Simul. Mater. Sci. Eng. 2013, 24, 5007. [Google Scholar] [CrossRef]
- Sak-Saracino, E.; Urbassek, H.M. Effect of uni- and biaxial strain on phase transformations in Fe thin films. Int. J. Comput. Mater. Sci. Eng. 2016, 5, 1650001. [Google Scholar] [CrossRef]
- Ma, F.; Xu, K.W. Size-dependent theoretical tensile strength and other mechanical properties of [001] oriented Au, Ag, and Cu nanowires. J. Mater. Res. 2006, 21, 2810–2816. [Google Scholar] [CrossRef]
- Vazinishayan, A.; Yang, S.; Duongthipthewa, A.; Wang, L.M. Effects of cross-section on mechanical properties of Au nanowire. AIP Adv. 2016, 6, 113–2005. [Google Scholar] [CrossRef]
- Tripathi, J.; Sharma, A.; Bisen, R.; Kumar, D.; Gupta, M.; Gupta, P.; Tripathi, S. Thickness dependent structural and magnetic properties of Au/Co/Si (100) ultra-thin wedge film. DAE Solid State Phys. Symp. 2018 2019, 2115, 030305. [Google Scholar]
- Vaz, C.A.F.; Bland, J.A.C.; Lauhoff, G. Magnetism in ultrathin film structures. Rep. Prog. Phys. 2008, 71, 863–882. [Google Scholar] [CrossRef]
- Dmitriev, S.V.; Kashchenko, M.P.; Baimova, J.A.; Babicheva, R.I.; Pushin, V.G. Molecular dynamics simulation of the effect of dislocations on the martensitic transformations in a two-dimensional model. Lett. Mater. 2017, 7, 442–446. [Google Scholar] [CrossRef]
- Wang, B.J.; Jiang, Y.Q.; Xu, C. Phase transition in iron thin films containing coherent twin boundaries: A molecular dynamics approach. Materials 2020, 13, 3631. [Google Scholar] [CrossRef]
- Griesser, S.; Bernhard, C.; Dippenaar, R. Effect of nucleation undercooling on the kinetics and mechanism of the peritectic phase transition in steel. Acta Mater. 2014, 81, 111–120. [Google Scholar] [CrossRef]
- Porter, D.A.; Easterling, K.E.; Sherif, M. Phase transformations in metals and alloys, 2nd edition. Ref. User Ser. Q. 1992, 1, 245. [Google Scholar]
- Teodorescu, V.S.; Mihailescu, I.N.; Dinescu, M.; Chitica, N.; Nistor, L.C.; Landuyt, J.V.; Barborica, A. Laser induced phase transition in iron thin films. J. Phys. IV 1994, 4, C4-127–C4-130. [Google Scholar] [CrossRef]
- Teodorescu, V.S.; Nistor, L.C.; Landuyt, J.V.; Dinescu, M. TEM study of laser induced phase transition in iron thin films. Mater. Res. Bull. 1994, 29, 63–71. [Google Scholar] [CrossRef]
- Cuenya, B.R.; Doi, M.; Löbus, S.; Courths, R.; Keune, W. Observation of the fcc-to-bcc Bain transformation in epitaxial Fe ultrathin films on Cu3Au. Surf. Sci. 2001, 493, 338–360. [Google Scholar] [CrossRef]
- Bain, E.C.; Dunkirk, N.Y. The nature of martensite. Trans. AIME 1924, 70, 25. [Google Scholar]
- Pitsch, W. The martensite transformation in thin foils of iron-nitrogen alloys. Philos. Mag. 1959, 4, 577–584. [Google Scholar] [CrossRef]
- Memmel, N.; Detzel, T. Growth, structure and stability of ultrathin iron films on Cu(001). Surf. Sci. 1994, 307–309, 490–495. [Google Scholar] [CrossRef]
- Meiser, J.; Urbassek, H.M. Influence of the crystal surface on the austenitic and martensitic phase transition in pure iron. Crystals 2018, 8, 469. [Google Scholar] [CrossRef] [Green Version]
- Meyer, R.; Entel, P. Martensite-austenite transition and phonon dispersion curves of Fe1–xNix studied by molecular-dynamics simulations. Phys. Rev. B 1998, 57, 5140. [Google Scholar] [CrossRef]
- Wang, B.; Sak-Saracino, E.; Gunkelmann, N.; Urbassek, H.M. Molecular-dynamics study of the α↔γ phase transition in Fe–C. Comput. Mater. Sci. 2014, 82, 399–404. [Google Scholar]
- Cai, M.; Li, Z.; Chao, Q.; Hodgson, P.D. A novel Mo and Nb microalloyed medium Mn TRIP steel with maximal ultimate strength and moderate ductility. Metall. Mater. Trans. A 2014, 45, 5624–5634. [Google Scholar]
- Wu, X.L.; Yang, M.X.; Yuan, F.P.; Chen, L.; Zhu, Y.T. Combining gradient structure and TRIP effect to produce austenite stainless steel with high strength and ductility. Acta Mater. 2016, 112, 337–346. [Google Scholar]
- Han, X.; Zhang, H.; Li, Y.; Tang, J.J.; Wang, C.; Chen, J. Investigation of the hot stamping process for TRIP steel with high strength and high ductility. J. Mater. Eng. Perform. 2019, 28, 6125–6134. [Google Scholar]
- Engin, C.; Sandoval, L.; Urbassek, H.M. Characterization of Fe potentials with respect to the stability of the bcc and fcc phase. Model. Simul. Mater. Sci. Eng. 2008, 16, 035005. [Google Scholar] [CrossRef]
- Finnis, M.W.; Sinclair, J.E. A simple empirical N-body potential for transition metals. Philos. Mag. A 1984, 50, 45–55. [Google Scholar]
- Johnson, R.A.; Oh, D.J. Analytic embedded atom method model for bcc metals. J. Mater. Res. 1989, 4, 1195–1201. [Google Scholar]
- Karewar, S.; Sietsma, J.; Santofimia, M.J. Effect of pre-existing defects in the parent fcc phase on atomistic mechanisms during the martensitic transformation in pure Fe: A molecular dynamics study. Acta Mater. 2018, 142, 71–81. [Google Scholar]
- Müller, M.; Erhart, P.; Albe, K. Analytic bond-order potential for bcc and fcc iron—Comparison with established embedded-atom method potentials. J. Phys. Condens. Matter. 2007, 19, 326220. [Google Scholar] [CrossRef]
- Sak-Saracino, E.; Urbassek, H.M. Temperature-induced phase transformation of Fe1–xNix alloys: Molecular-dynamics approach. Eur. Phys. J. B 2015, 88, 169. [Google Scholar] [CrossRef]
- Wang, B.; Urbassek, H.M. Phase transitions in an Fe system containing a bcc/fcc phase boundary: An atomistic study. Phys. Rev. B 2013, 87, 104108. [Google Scholar]
- Kurdjumov, G.V.; Sachs, G. Über den mechanismus der stahlhärtung. Z. Phys. 1930, 64, 325–343. [Google Scholar]
- Nishiyama, Z. Mechanism of transformation from face-centred to body-centred cubic lattice. Sci. Rep. Tohoku Imp. Univ. 1934, 23, 637. [Google Scholar]
- Wang, B.; Urbassek, H.M. Molecular dynamics study of the α−γ phase transition in Fe induced by shear deformation. Acta Mater. 2013, 61, 5979–5987. [Google Scholar]
- LAMMPS. Available online: http://lammps.sandia.gov/ (accessed on 15 September 2020).
- Faken, D.; Jónsson, H. Systematic analysis of local atomic structure combined with 3D computer graphics. Comput. Mater. Sci. 1994, 2, 279–286. [Google Scholar]
- Stukowski, A. Structure identification methods for atomistic simulations of crystalline materials. Model. Simul. Mater. Sci. Eng. 2012, 20, 045021. [Google Scholar]
- Li, J. AtomEye: An efficient atomistic configuration viewer. Model. Simul. Mater. Sci. Eng. 2003, 11, 173–177. [Google Scholar]
- Wang, B.; Urbassek, H.M. Atomistic dynamics of the bcc↔fcc phase transition in iron: Competition of homo- and heterogeneous phase growth. Comput. Mater. Sci. 2014, 81, 170–177. [Google Scholar]
- Fukino, T.; Tsurekawa, S. In-situ SEM/EBSD observation of α/γ phase transformation in Fe-Ni alloy. Mater. Trans. 2008, 49, 2770–2775. [Google Scholar]
- Barcelo, F.; Bechade, J.L.; Fournier, B. Orientation relationship in various 9%Cr ferritic/martensitic steels–EBSD comparison between Nishiyama–Wassermann, Kurdjumov–Sachs and Greninger–Troiano. Phase Transit. 2010, 83, 601–614. [Google Scholar]
- Johnston, H.L.; Arnold, C.S.; Venus, D. Thickness-dependent fcc to bcc structural change in iron films: Use of a 2-ML Ni/W(110) substrate. Phys. Rev. B 1997, 55, 13221–13229. [Google Scholar]
- Shen, Y.F.; Li, X.X.; Sun, X.; Wang, Y.D.; Zuo, L. Twinning and martensite in a 304 austenitic stainless steel. Mater. Sci. Eng. A 2012, 552, 514–522. [Google Scholar]
- Dupé, B.; Amadon, B.; Pellegrini, Y.P.; Denoual, C. Mechanism for the α→ε phase transition in iron. Phys. Rev. B 2013, 87, 024103. [Google Scholar]
- Pang, W.W.; Zhang, P.; Zhang, G.C.; Xu, A.G.; Zhao, X.G. Morphology and growth speed of hcp domains during shock-induced phase transition in iron. Sci. Rep. 2014, 4, 3628. [Google Scholar] [PubMed] [Green Version]
- Sandoval, L.; Urbassek, H.M.; Entel, P. Solid-solid phase transition and phonon softening in an embedded-atom method model for iron. Phys. Rev. B 2009, 80, 214108. [Google Scholar]
- Stukowski, A.; Albe, K. Extracting dislocations and non-dislocation crystal defects from atomistic simulation data. Model. Simul. Mater. Sci. Eng. 2010, 18, 085001. [Google Scholar]
Figure 1.
Schematic description of the first shear deformation in the Kurdjumov–Sachs (K–S) relationship. The shear deformation is on the (111)fcc plane along the [11]fcc direction.
Figure 1.
Schematic description of the first shear deformation in the Kurdjumov–Sachs (K–S) relationship. The shear deformation is on the (111)fcc plane along the [11]fcc direction.

Figure 2.
Shear deformations applied on the films. The colors denote the local crystal structure: green, body-centered cubic (bcc); dark blue, face-centered cubic (fcc); red, unknown. (a) Sketch of film 1 as an example for the modelling; (b) (111)fcc plane (surface) of film 1, the shear deformation is applied in this plane along the [11]fcc direction; (c) ()fcc plane of film 2, the shear deformation is applied in this plane along the [1]fcc direction; (d) (bcc plane of film 3. The shear deformation is applied in the ()bcc plane along the [111]bcc direction.

Figure 3.
Schematic presentation of the relationship between shear deformation ε and shear angle .

Figure 4.
Fractional phase contents of film 1 with (111)fcc free surface as a function of shear angle at a temperature of 300 K. Hcp: hexagonal close packed.
Figure 4.
Fractional phase contents of film 1 with (111)fcc free surface as a function of shear angle at a temperature of 300 K. Hcp: hexagonal close packed.

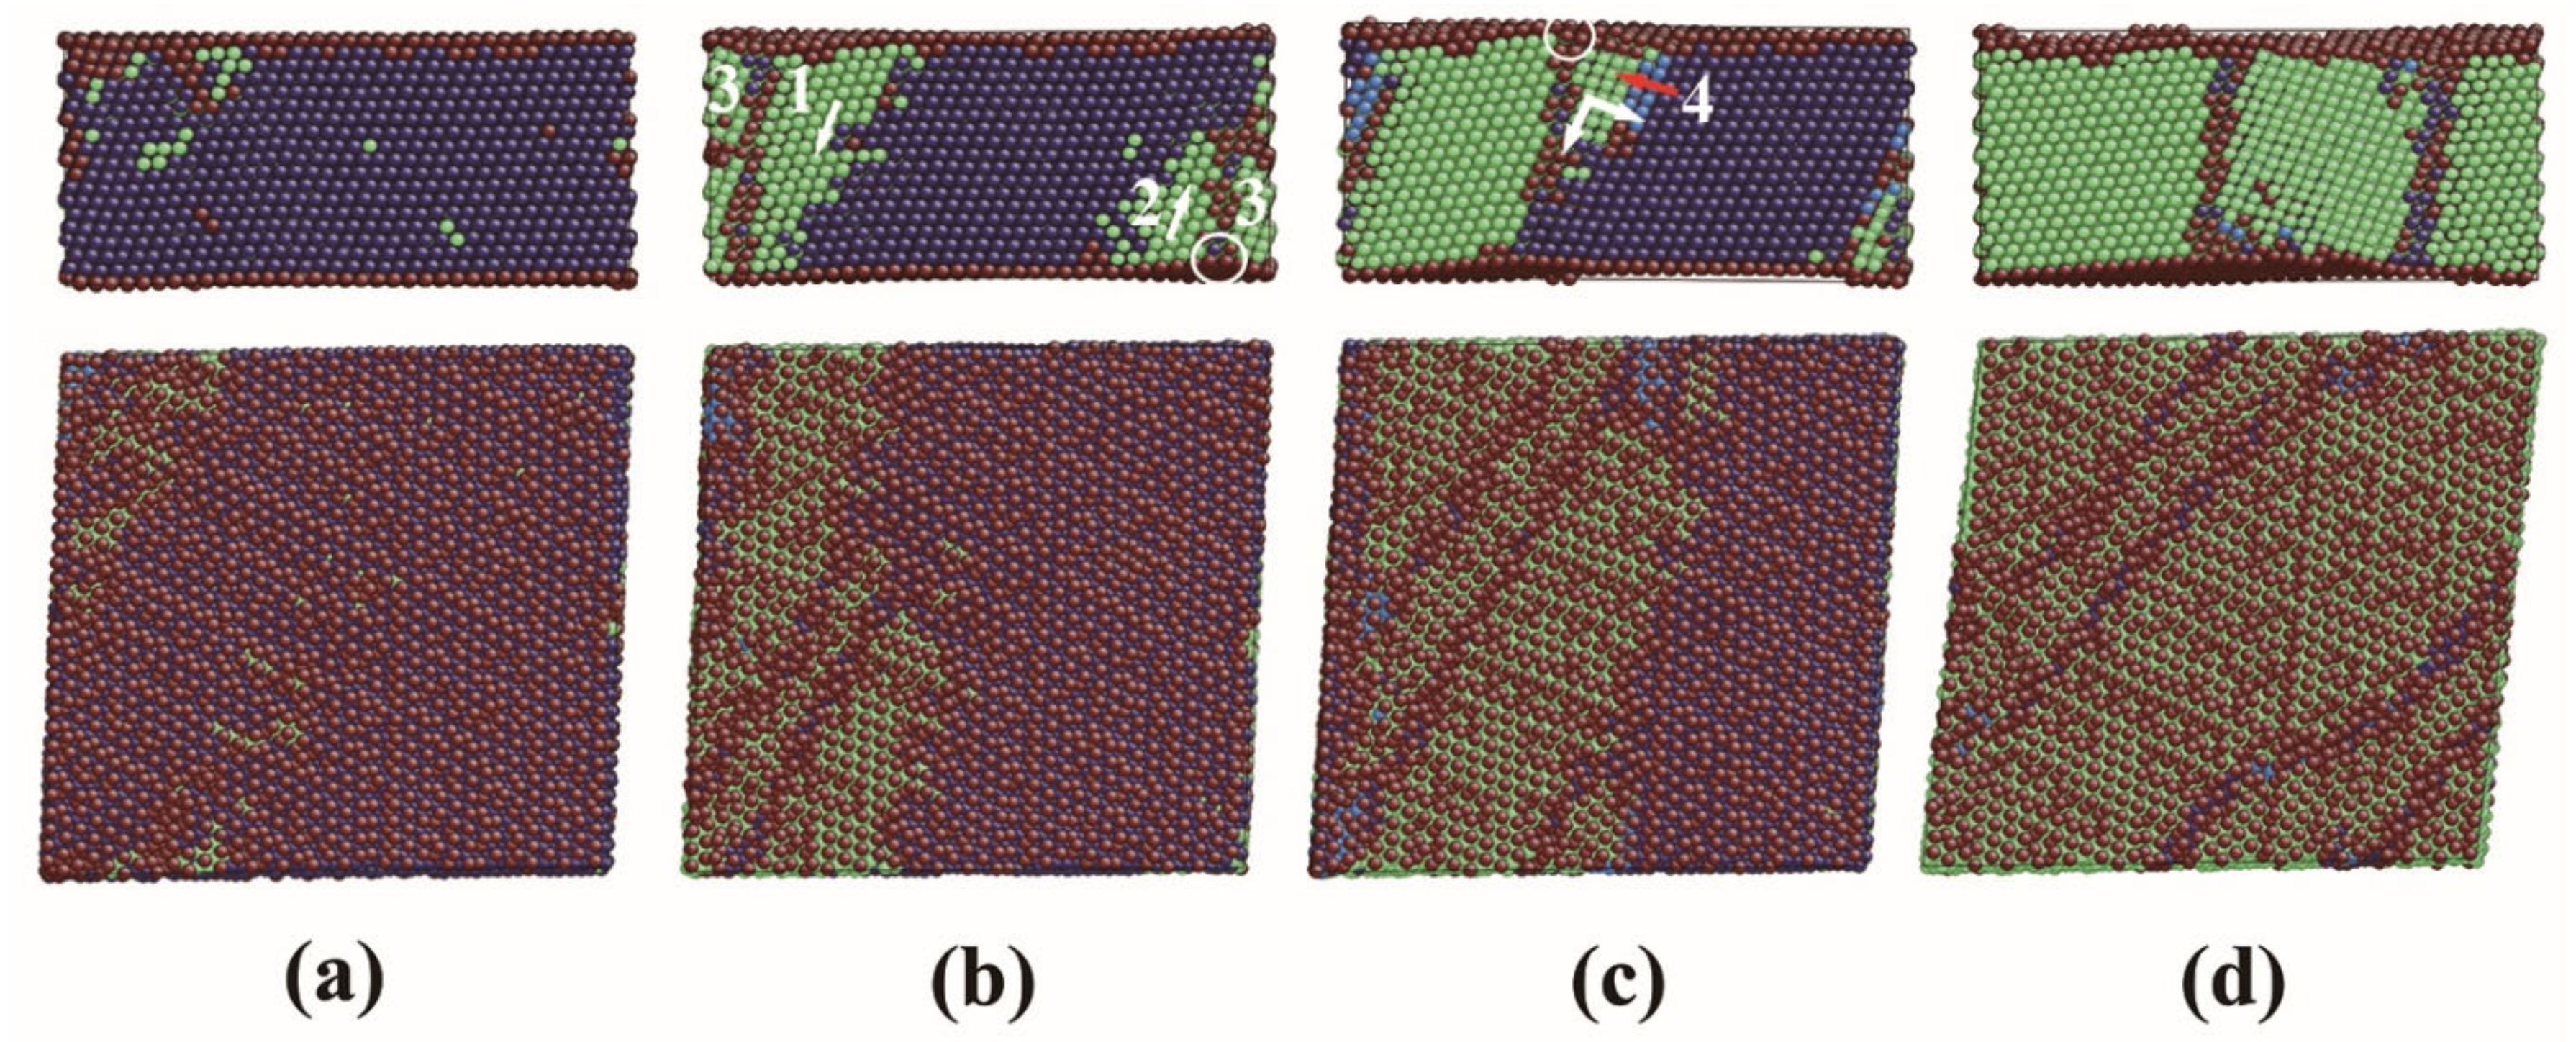
Figure 5.
Snapshots of the ongoing martensitic phase transition in film 1 at 300 K. The colors denote Table 1. 0)fcc plane and the lower figures demonstrate the upper original (111)fcc surface. The numbers indicate the bcc phases nucleated at different positions. (a) Status at a shear angle of 1.5°. Bcc1 nucleates at the upper free surface; (b) Status at a shear angle of 2.8°. Bcc3 is differently orientated compared with bcc1 and bcc2. The white arrows indicate the growth directions of bcc1 and bcc2; the white circle indicates a kink at the free surface; (c) Status at a shear angle of 4°. Bcc1 nucleated at the upper surface grows, while bcc4 with different crystalline orientation nucleates at the intersection between the phase boundary and free surface. The white arrow indicates the growth direction of bcc4; (d) Status at a shear angle of 10°. The martensitic phase transition finishes.

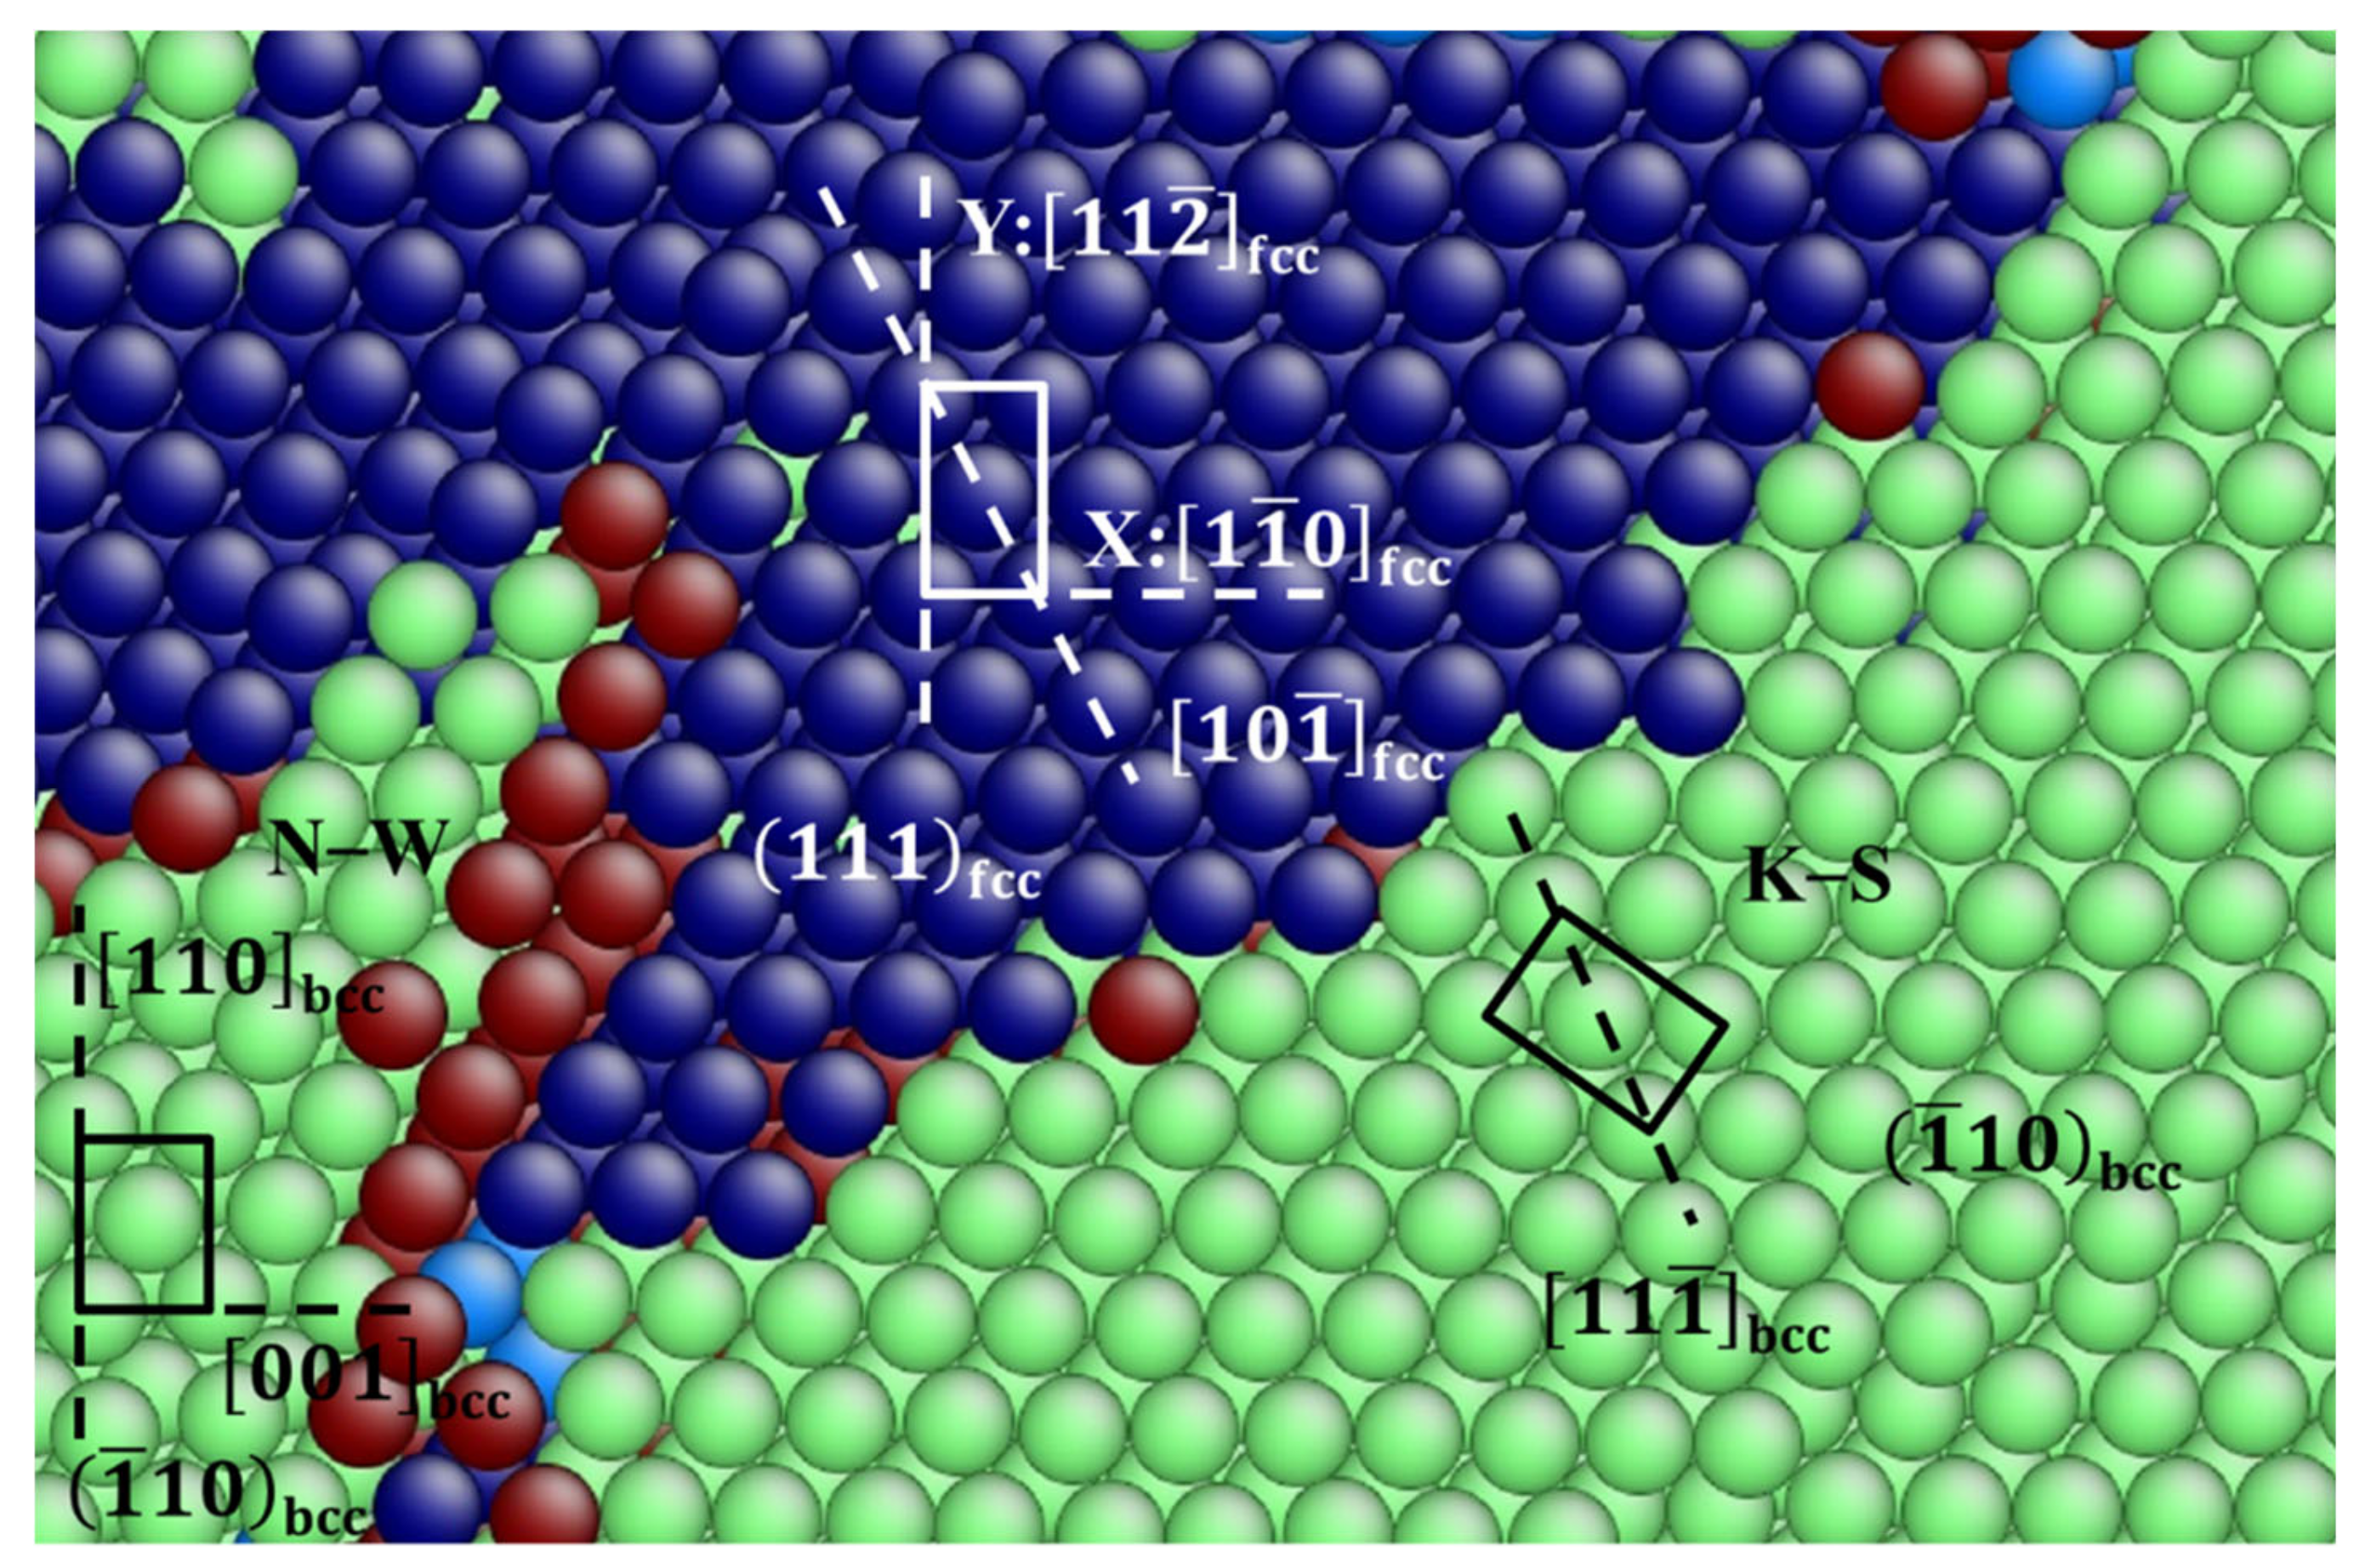
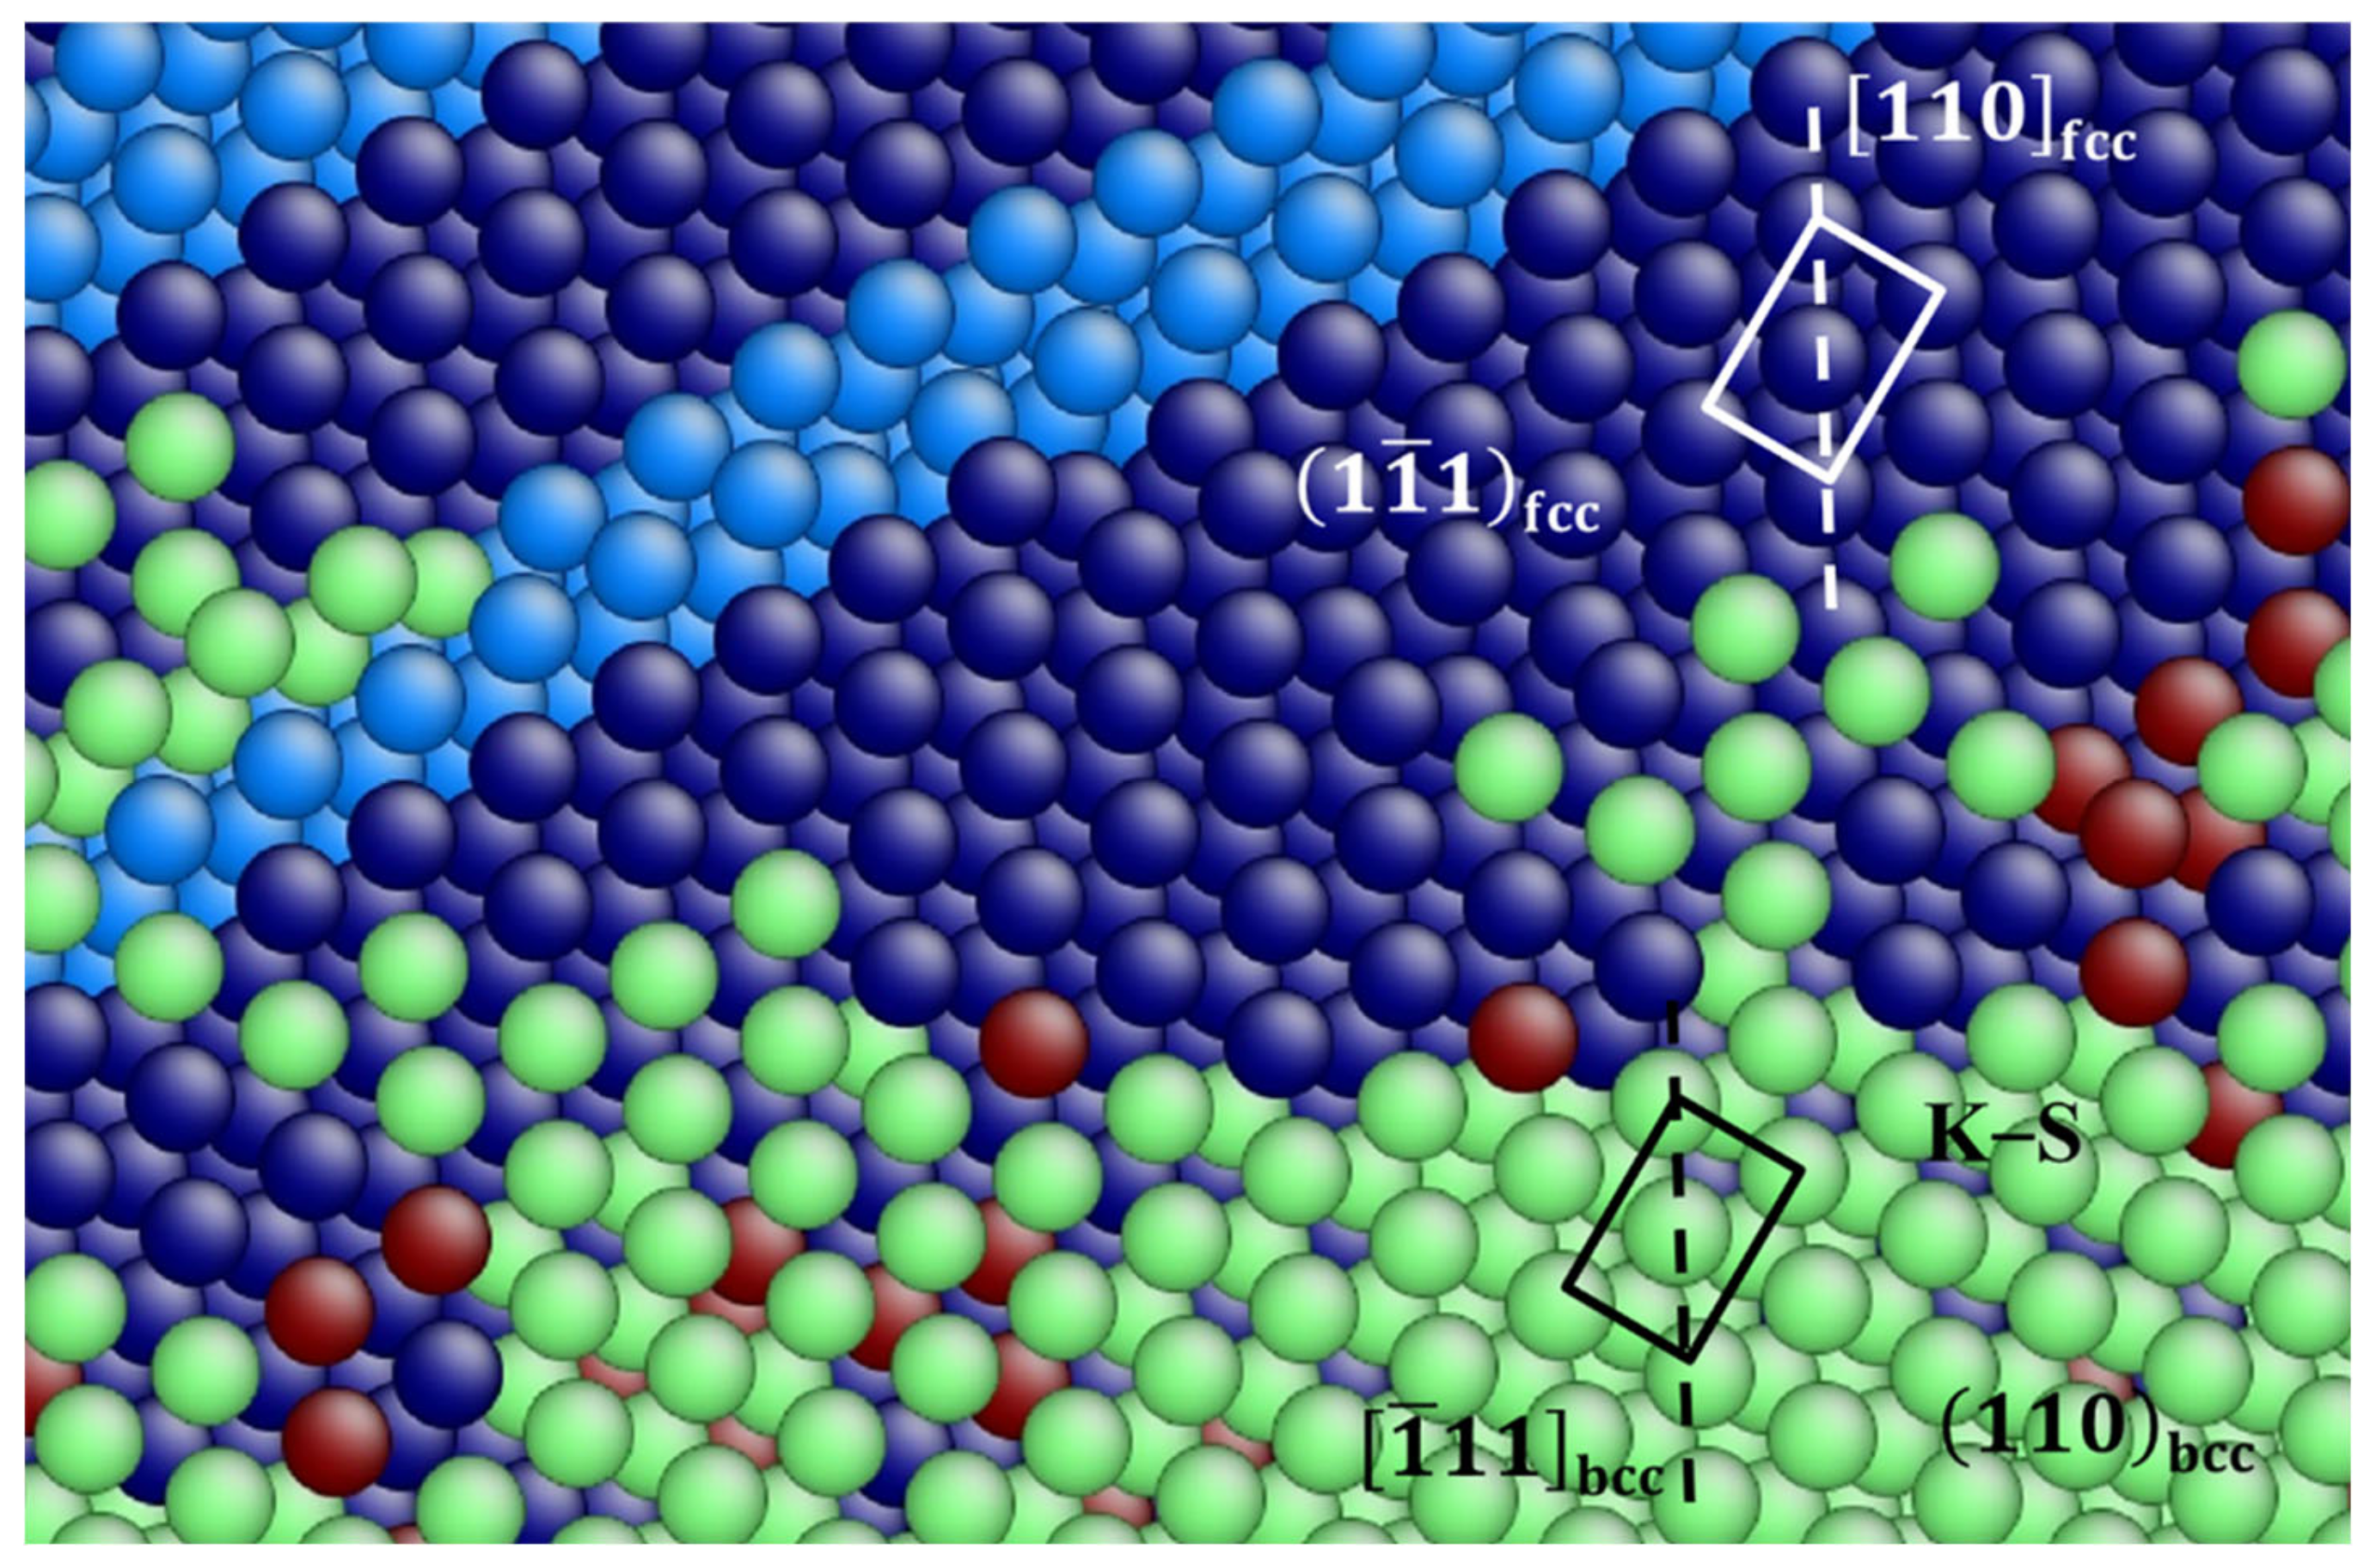
Figure 6.
A zoomed snapshot of the ongoing martensitic phase transition in film 1 at 300 K, where the parent fcc phase and two types of bcc phases with different crystalline orientations coexist. The colors denote the local crystal structure as in Figure 5. The black rectangles indicate two different orientated bcc unit cells on the ()bcc plane and the white rectangle shows a unit cell of fcc phase on the (111)fcc plane.

Figure 7.
Fractional phase contents of film 2 with (110)fcc free surface as a function of shear angle at a temperature of 300 K.
Figure 7.
Fractional phase contents of film 2 with (110)fcc free surface as a function of shear angle at a temperature of 300 K.

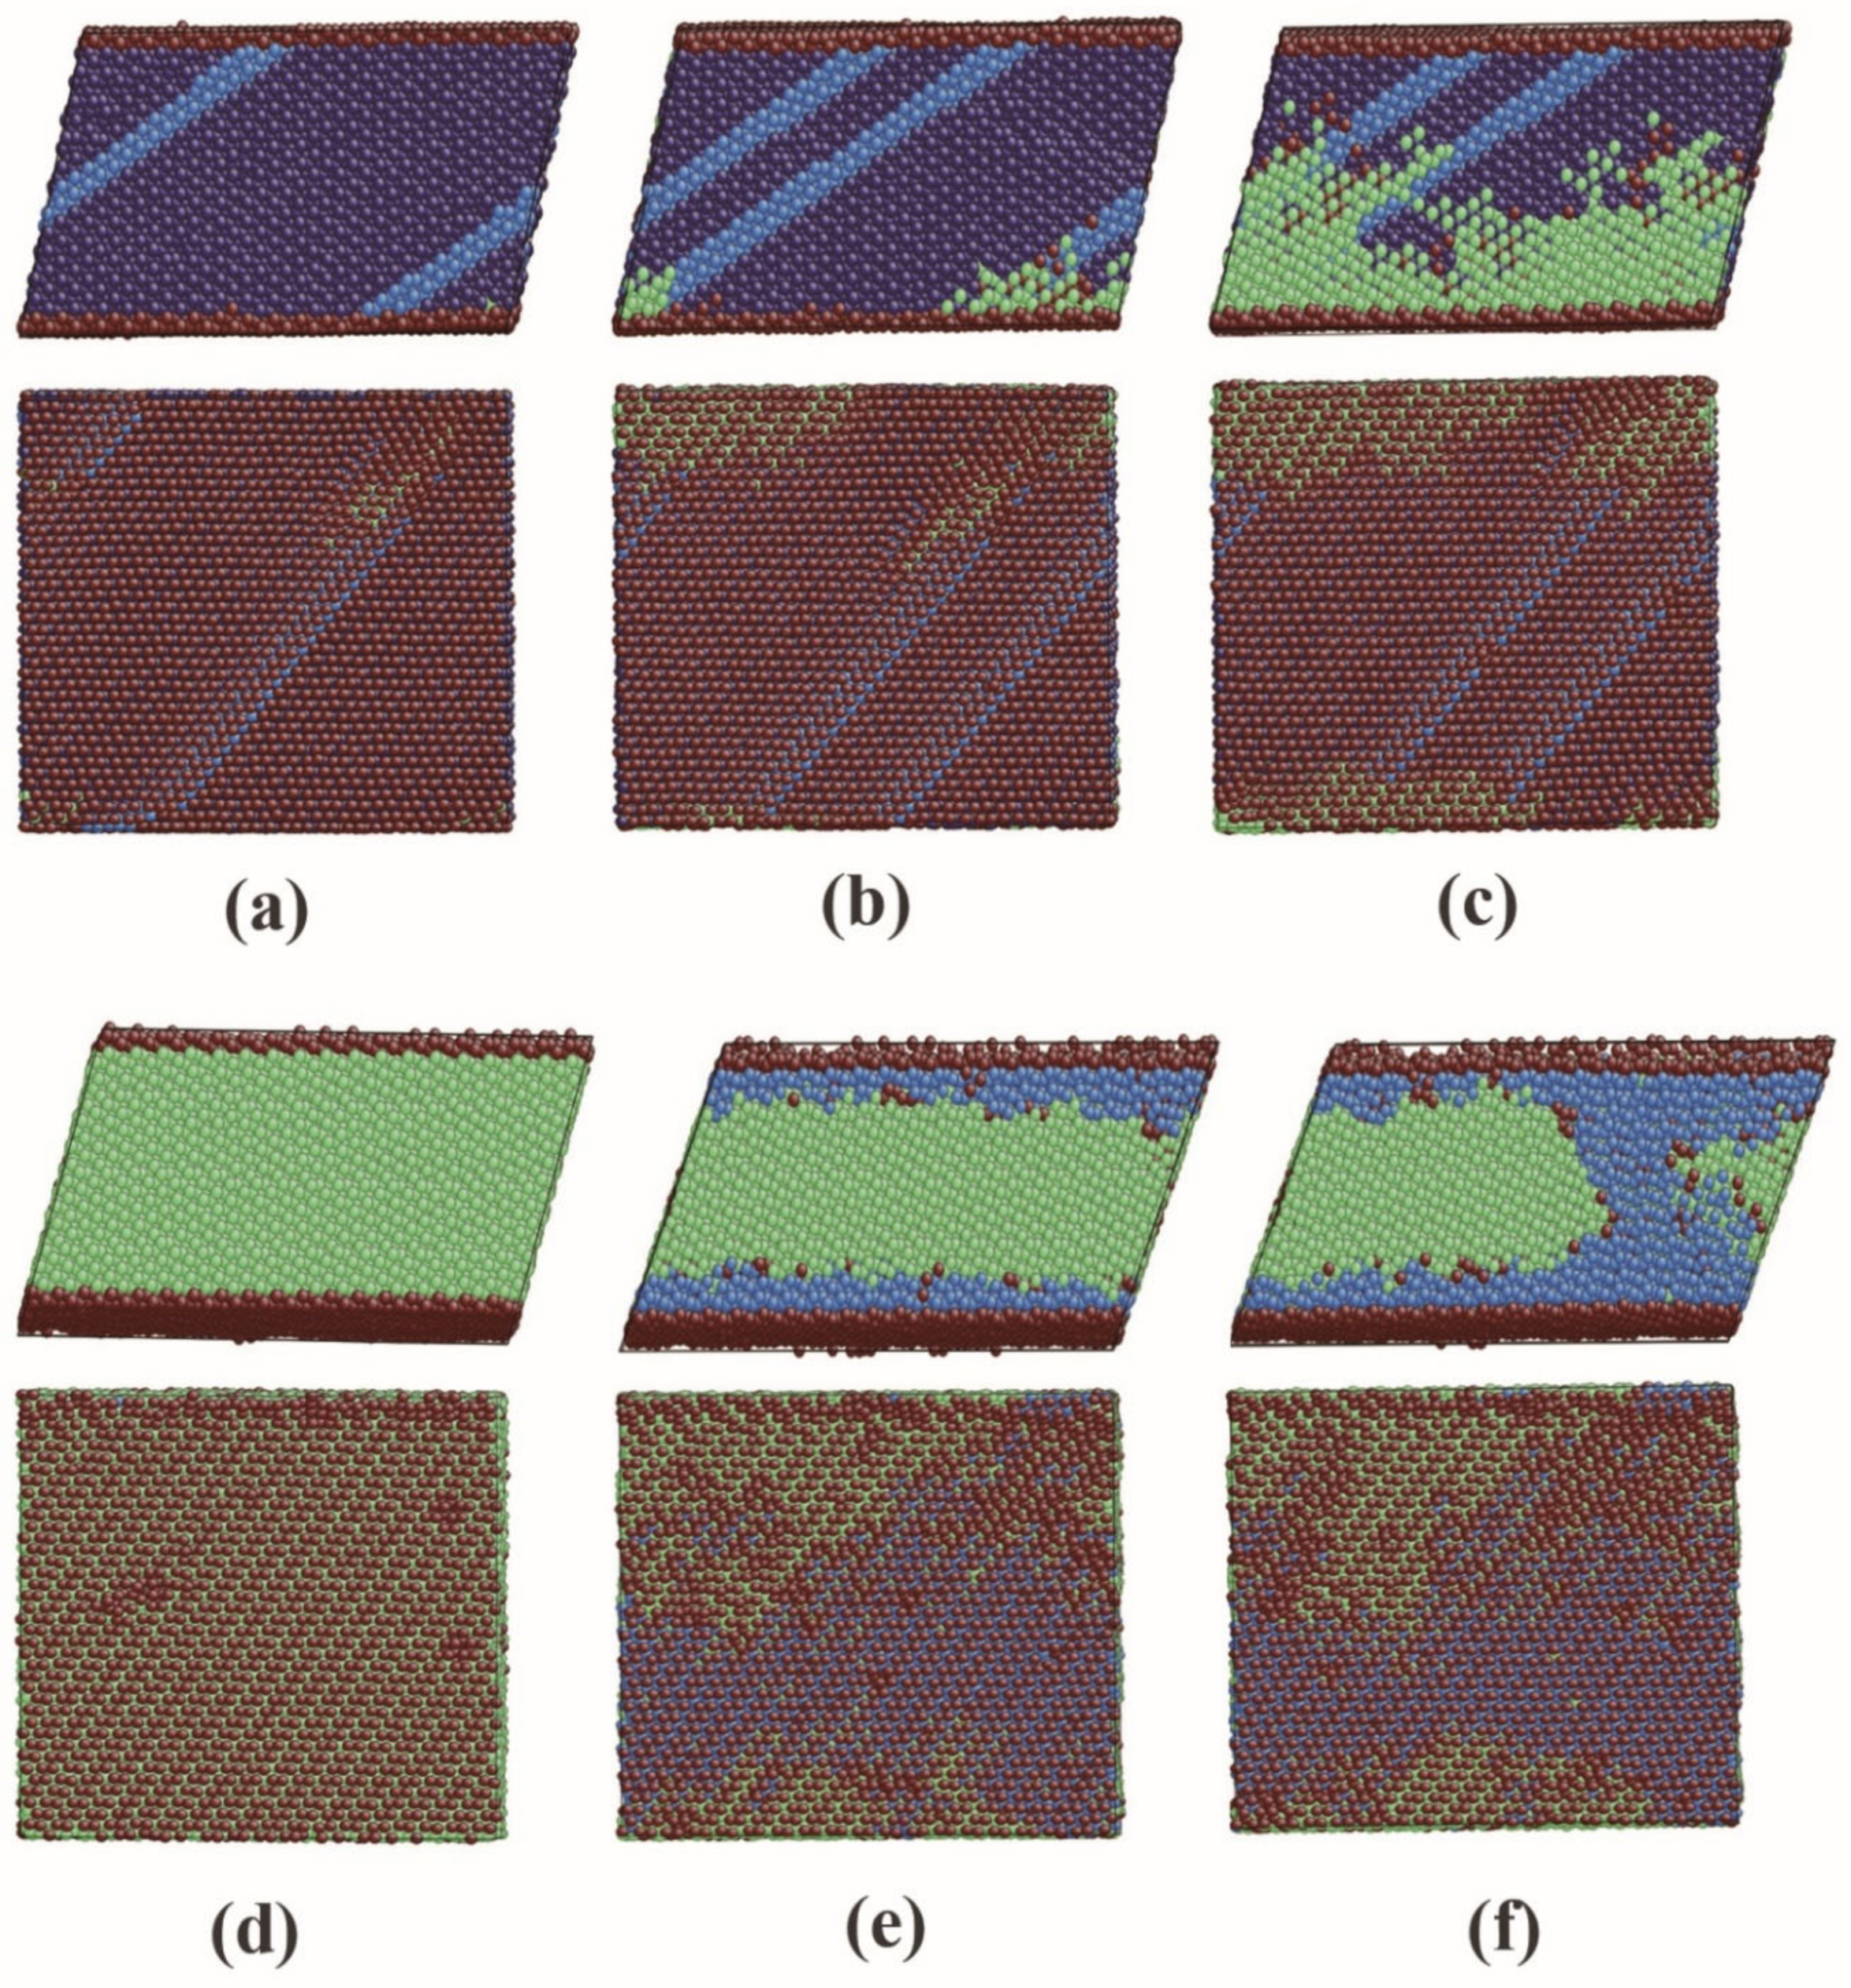
Figure 8.
Snapshots of the ongoing martensitic phase transition in film 2 at 300 K. The colors denote the local crystal structure as in Figure 5. In a–d, the upper figures show the original ()fcc plane and the lower figures demonstrate the original (110)fcc surface. (a) Status at a shear angle of 14.7°. Remarkable SFs are formed in the fcc phase; (b) Status at a shear angle of 14.9°. New bcc phases nucleate at the intersections between the SFs and the free surfaces; (c) Status at a shear angle of 16.4°. The bcc phases grow in all three directions; (d) Status at a shear angle of 17°. The whole film transforms from its original fcc structure to bcc structure; (e) Status at a shear angle of 23°. The hcp phases nucleate both at the upper and lower free surfaces; (f) Status at a shear angle 24.2°. The hcp phases grow into the film.

Figure 9.
A zoomed snapshot of the ongoing martensitic phase transition in film 2 at 300 K. The colors denote the local crystal structure as in Figure 5. The black rectangle indicates a bcc unit cell on the (bcc plane and the white rectangle shows a unit cell of the parent fcc phase on the ()fcc plane.

Figure 10.
Fractional phase contents of film 3 with (111)bcc free surface as a function of shear angle at a temperature of 800 K.
Figure 10.
Fractional phase contents of film 3 with (111)bcc free surface as a function of shear angle at a temperature of 800 K.

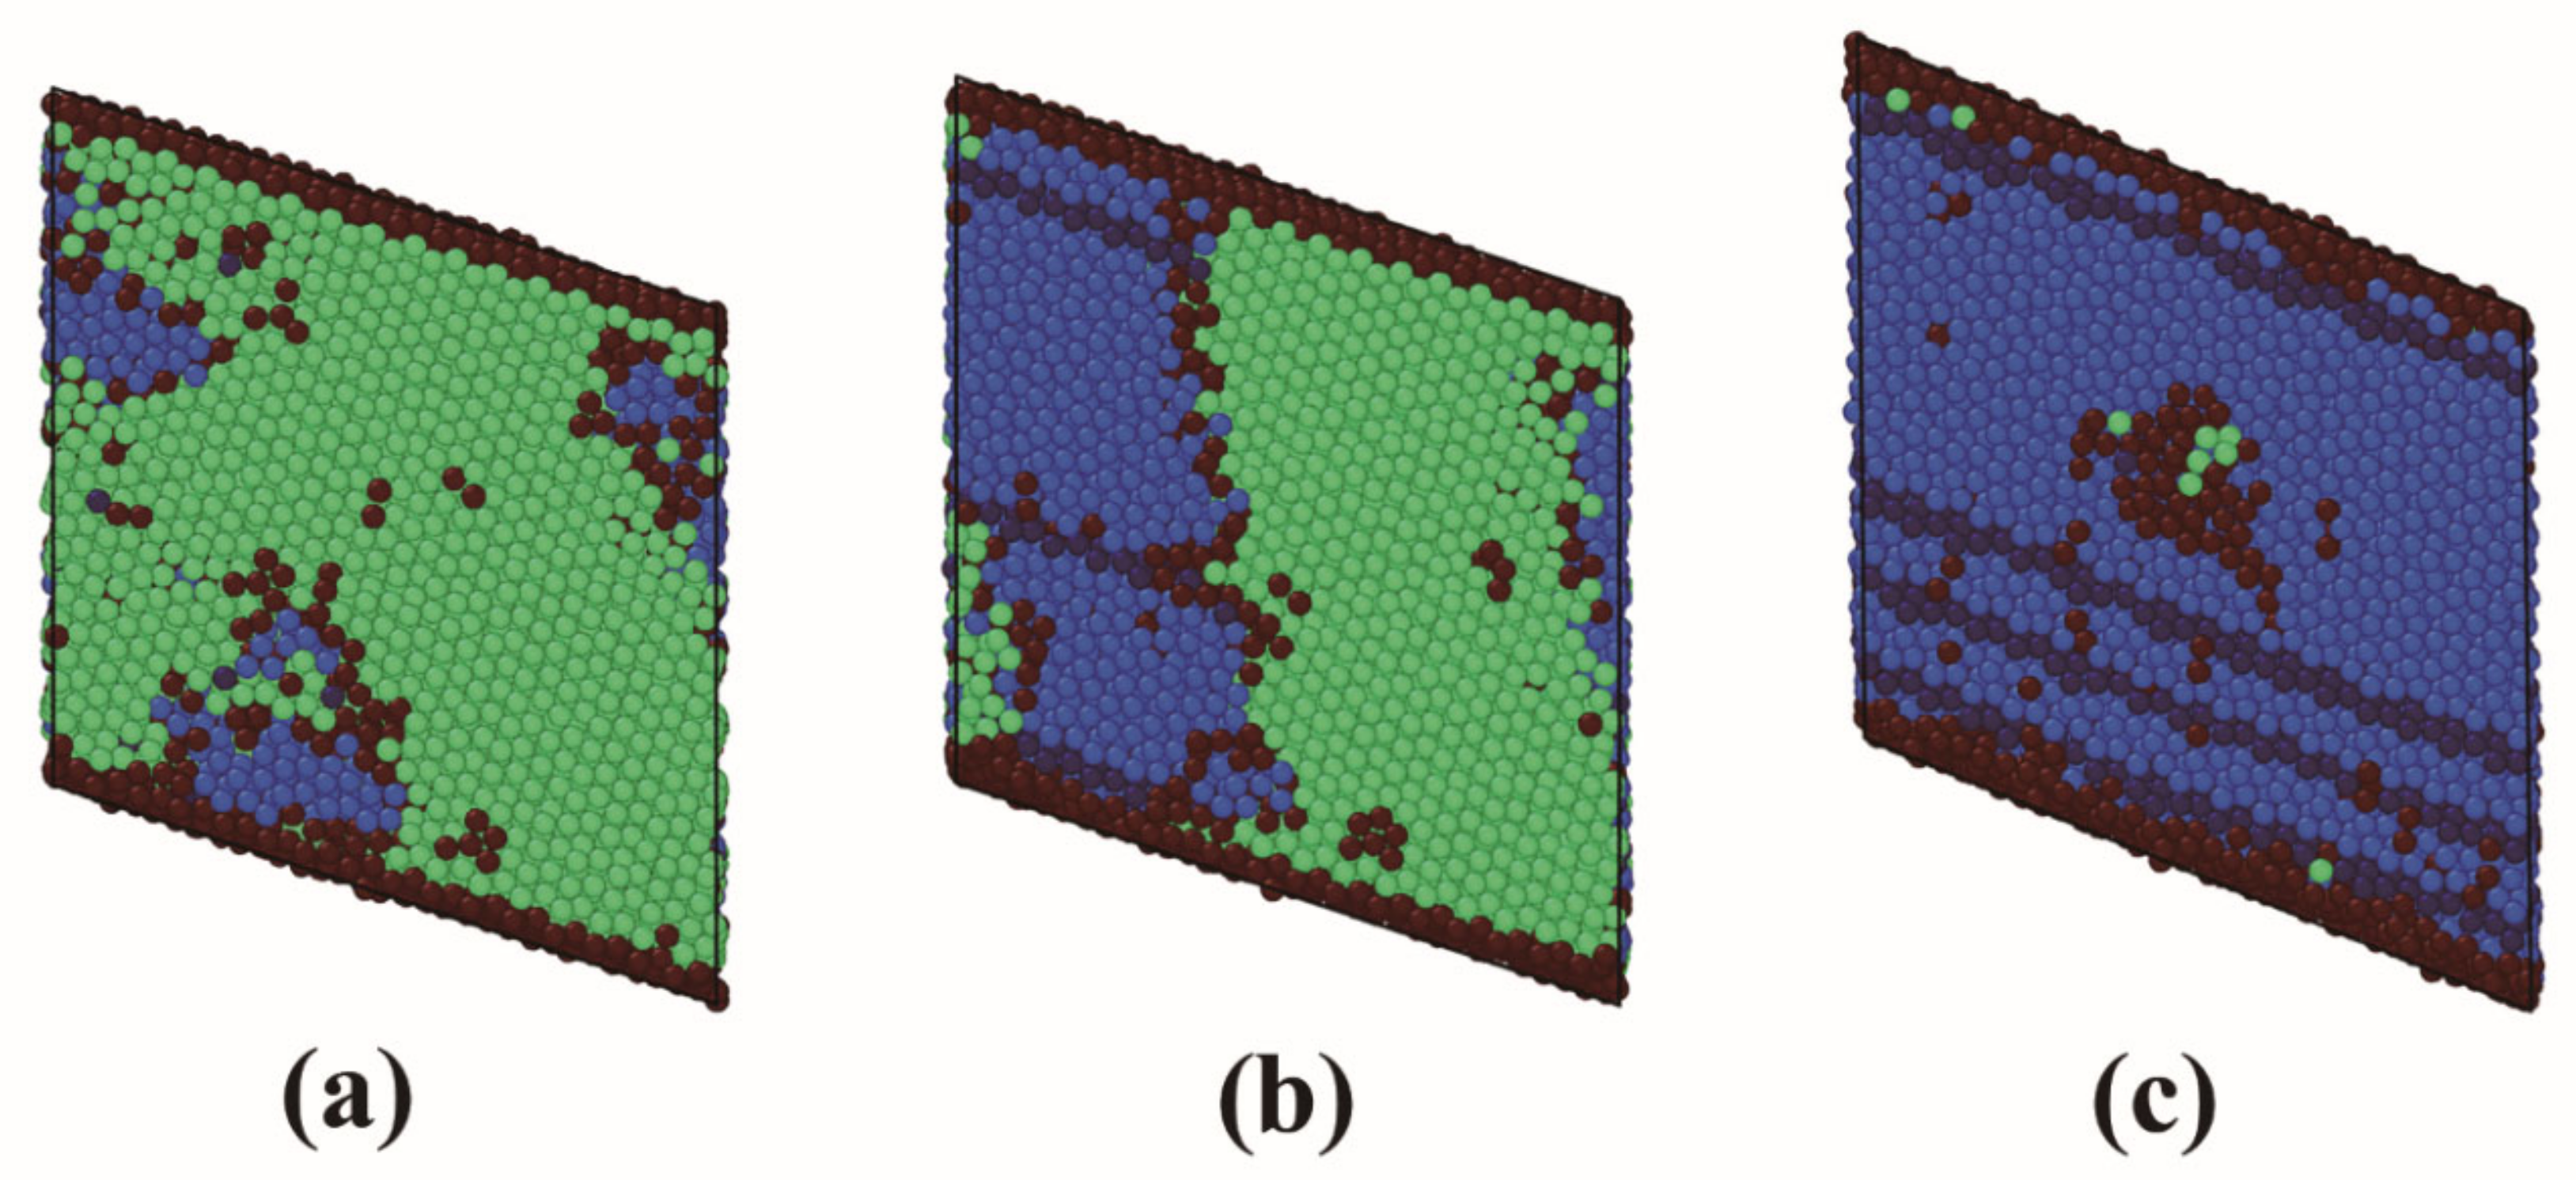
Figure 11.
Snapshots of the ongoing austenitic phase transition in film 3 at 800 K. The colors denote the local crystal structure as in Figure 5. In a–d, the upper figures show the original ()bcc plane and the lower figures demonstrate the original (111)bcc surface. The white dashed lines in b and c separate the fcc phases nucleated at the free surfaces and in the bulk material. (a) Status at a shear angle of 14°. New fcc phases nucleate at the free surface and in the bulk material; (b) Status at a shear angle of 15°; Growths of the fcc phases; (c) Status at a shear angle of 16.5°. The phase transition is almost finished; (d) Status at the largest shear angle of 26.5°.

Figure 12.
Two-dimensional illustration to clarify the inefficiency of the CNA at high temperature and the strategy to overcome this problem.
Figure 12.
Two-dimensional illustration to clarify the inefficiency of the CNA at high temperature and the strategy to overcome this problem.

Figure 13.
A zoomed snapshot of the ongoing austenitic phase transition in film 3 at 800 K, where the parent bcc phase, the fcc phases nucleated at the upper and lower surfaces and in the bulk material coexist. This figure corresponds to the status at a shear angle of 15.6°. The colors denote the local crystal structure as in Figure 5. The plane as shown in this figure is the original ()bcc plane, which transforms to the (111)fcc plane. The black rectangle indicates a unit cell on the ()bcc plane and the white rectangles display three units cells on the (111)fcc planes. The fcc phases indicated by the white rectangles are nucleated at the upper and lower free surfaces and in the bulk material, respectively.

Figure 14.
Dependence of shear angle, for which a fraction of 50% has been transformed from fcc to bcc, on film thickness.
Figure 14.
Dependence of shear angle, for which a fraction of 50% has been transformed from fcc to bcc, on film thickness.


Table 1.
Detailed information of the simulated thin films. The coordinate directions are indicated by x, y and z (surface normal). Δx, Δy and Δz are the thicknesses in each direction. N denotes the total number of atoms.
Table 1.
Detailed information of the simulated thin films. The coordinate directions are indicated by x, y and z (surface normal). Δx, Δy and Δz are the thicknesses in each direction. N denotes the total number of atoms.
| Film | x | y | z | Δx (Å) | Δy (Å) | Δz (Å) | Crystal Structure | N |
|---|---|---|---|---|---|---|---|---|
| 1 | [0] | [11] | [] | 80.80 | 81.26 | 40.43 | fcc | 20,896 |
| 2 | [] | [] | [] | 83.00 | 81.26 | 40.40 | fcc | 22,326 |
| 3 | [] | [] | [] | 64.62 | 64.94 | 65.61 | bcc | 23,081 |
© 2020 by the authors. Licensee MDPI, Basel, Switzerland. This article is an open access article distributed under the terms and conditions of the Creative Commons Attribution (CC BY) license (http://creativecommons.org/licenses/by/4.0/).
Share and Cite
MDPI and ACS Style
Ruan, T.; Wang, B.; Xu, C.; Jiang, Y. Shear Deformation Helps Phase Transition in Pure Iron Thin Films with “Inactive” Surfaces: A Molecular Dynamics Study. Crystals 2020, 10, 855. https://0-doi-org.brum.beds.ac.uk/10.3390/cryst10100855
AMA Style
Ruan T, Wang B, Xu C, Jiang Y. Shear Deformation Helps Phase Transition in Pure Iron Thin Films with “Inactive” Surfaces: A Molecular Dynamics Study. Crystals. 2020; 10(10):855. https://0-doi-org.brum.beds.ac.uk/10.3390/cryst10100855
Chicago/Turabian StyleRuan, Ting, Binjun Wang, Chun Xu, and Yunqiang Jiang. 2020. "Shear Deformation Helps Phase Transition in Pure Iron Thin Films with “Inactive” Surfaces: A Molecular Dynamics Study" Crystals 10, no. 10: 855. https://0-doi-org.brum.beds.ac.uk/10.3390/cryst10100855
Note that from the first issue of 2016, this journal uses article numbers instead of page numbers. See further details here.