Electric Transport of Nodal Line Semimetals in Single-Component Molecular Conductors


1
Department of Physics, Nagoya University, Nagoya 464-8602, Japan
2
RIKEN, 2-1 Hirosawa, Wako-shi, Saitama 351-0198, Japan
3
Department of Physics, University of Tokyo, Bunkyo, Tokyo 113-0033, Japan
*
Author to whom correspondence should be addressed.
Crystals 2020, 10(10), 862; https://0-doi-org.brum.beds.ac.uk/10.3390/cryst10100862
Submission received: 31 August 2020
/
Revised: 19 September 2020
/
Accepted: 21 September 2020
/
Published: 24 September 2020
(This article belongs to the Special Issue Organic Conductors)
Abstract
:We examine an effect of acoustic phonon scattering on the electric conductivity of a single-component molecular conductor [Pd(dddt)] (dddt = 5,6-dihydro-1,4-dithiin-2,3-dithiolate) with a half-filled band by applying the previous calculation in a two-dimensional model with Dirac cone [Phys. Rev. B. 98, 161205 (2018)], wherethe electric transport by the impurity scattering exhibits a noticeable interplay of the Dirac cone and the phonon scattering, resulting in maximum of the conductivity with increasing temperature. The conductor shows a nodal line semimetal, where the band crossing of HOMO (Highest Occupied Molecular Orbital) and LUMO (Lowest Unoccupied Molecular Orbital) provides a loop of Dirac points located close to the Fermi energy followed by the density of states (DOS) similar to that of a two-dimensional Dirac cone. Using a tight-binding (TB) model [arXiv:2008.09277], which was obtained using the crystal structure observed from a recent X ray diffraction experiment under pressure, it is shown that the obtained conductivity explains reasonably the anomalous behavior in [Pd(dddt)] exhibiting temperature-independent resistivity at finite temperatures. This paper demonstrates a crucial role of the acoustic phonon scattering at finite temperatures in the electric conductivity of Dirac electrons. The present theoretical results of conductivity are compared with those of the experiments.
1. Introduction
In molecular solids, various electronic properties from metallic to insulating states have been examined due to the interplay of transfer energies and mutual interactions between molecules [1]. However, there is another electronic state, where the temperature dependence of the resistivity does not show metallic or insulating behavior. It originates from a band structure of a Dirac electron [2,3], where the conduction and valence bands cross at a certain momentum in the Brillouin zone. Such a state has been discovered in the two-dimensional materials of graphene [4] and organic conductors [5,6]. This state has been extensively studied in three-dimensional systems to show a nodal line semimetal i.e., a loop of Dirac points in inorganic conductors [7,8,9] and in molecular conductor [10].
The Dirac electron in organic conductors with a zero-gap state was found in two-dimensional -(BEDT-TTF)I(BEDT-TTF = bis(ethylenedithio)tetrathiafulvalene) [5,6], using a tight-binding (TB) model with transfer energies estimated by the extended Hückel method [11]. It should be noted that the TB model [12,13] describes the electronic states of molecular conductors. These Dirac electrons are studied experimentally and theoretically to comprehend physical properties in the bulk system. Noticeable temperature dependence of Hall coefficient [14,15] NMR [16,17,18], anisotropic conductivity [19] and the Nernst coefficient [20] have been obtained since the Dirac point is located close to the chemical potential.
Another molecular Dirac electron system was found in a single-component molecular conductor, [Pd(dddt)] (dddt = 5,6-dihydro-1,4-dithiin-2,3-dithiolate) [10]. The application of pressure is useful for the modification of conducting properties in single-component molecular crystals with soft lattices [21,22,23,24,25]. [Pd(dddt)] under high pressure exhibits almost temperature independent resistivity [26]. First-principles calculations indicate that this material belongs to the three-dimensional Dirac electron system [27] consisting of HOMO (Highest Occupied Molecular Orbital) and LUMO (Lowest Unoccupied Molecular Orbital) bands, and that a TB model exhibits a loop of Dirac points called a nodal line semimetal [28]. There are several studies on the effective Hamiltonian, where a general two-band model is introduced [29] and the explicit calculation is performed for the nodal line semimetal [30].
However, the conductivity is not yet clearly understood although the temperature-independent conductivity is believed to be an evidence of Dirac electrons. From the theoretical point of view, the conductivity at the zero doping shows a universal conductance at absolute temperature [4] but increases linearly with increasing temperature due to the linear increase of the density of states [14,31], when the temperature is larger than the energy of the damping by the impurity scattering. Such an increase is incompatible with the experiment of the almost constant resistivity in two-dimensions [32]. The problem comes from the fact that the constant behavior can be obtained only when the damping energy being larger than the temperature, which is not the case of the molecular conductors. Recently, to comprehend the almost constant conductivity, a possible mechanism has been proposed for two-dimensional Dirac electrons, where the scattering by an acoustic phonon plays a crucial role [33].
The conductivity of [Pd(dddt)] showing almost temperature-independent behavior [10] was examined theoretically [34,35] using a TB model of the Hückel calculation for a crystal structure obtained by first-principles calculations under pressure. The DOS exhibits a linear dependence close to the chemical potential but the region for the relevant energy is narrow compared with that for the constant resistivity. The conductivity in terms of the above TB model shows a large anisotropy and the almost constant behavior at high temperature, since the reduction of the DOS for larger energy suppresses the increase of the conductivity. In this case, the TB model suggests the almost constant resistivity in [Pd(dddt)] due to the decrease of the DOS, but not by the property relevant to the Dirac cone. Recently, a TB model was re-examined using the crystal structure, which was obtained under high pressure [36]. Surprisingly, this band calculation shows the DOS, which depends linearly on a wide region of the energy being compatible with temperature of almost constant conductivity. Thus, we re-examine the almost constant resistivity in [Pd(dddt)] using such a newly found TB model and by taking acoustic phonon scattering. The present paper demonstrates that such a mechanism does exist as the evidence of Dirac electrons for single-component molecular conductors. Note that a three-dimensional system with nodal line of Dirac points is important compared with two-dimensional systems with a Dirac point, since the almost constant conductivity is obtained by the combined effect of the nodal line and the acoustic phonon.
In Section 2, based on the recently obtained TB model under pressure, the nodal line and the DOS are calculated to find a wide region for the linear dependence of the DOS. A formulation for the conductivity is given by taking account of both the impurity and electron–phonon (e–p) scatterings. In Section 3, by calculating the chemical potential for the half-filled band, we examine the temperature dependence of the anisotropic conductivity and show the almost constant conductivity for reasonable choices of the e–p coupling constant. The corresponding resistivity is compared with that of the experiment. In Section 4, a summary and discussion are given.
2. Model and Formulation
2.1. TB Model
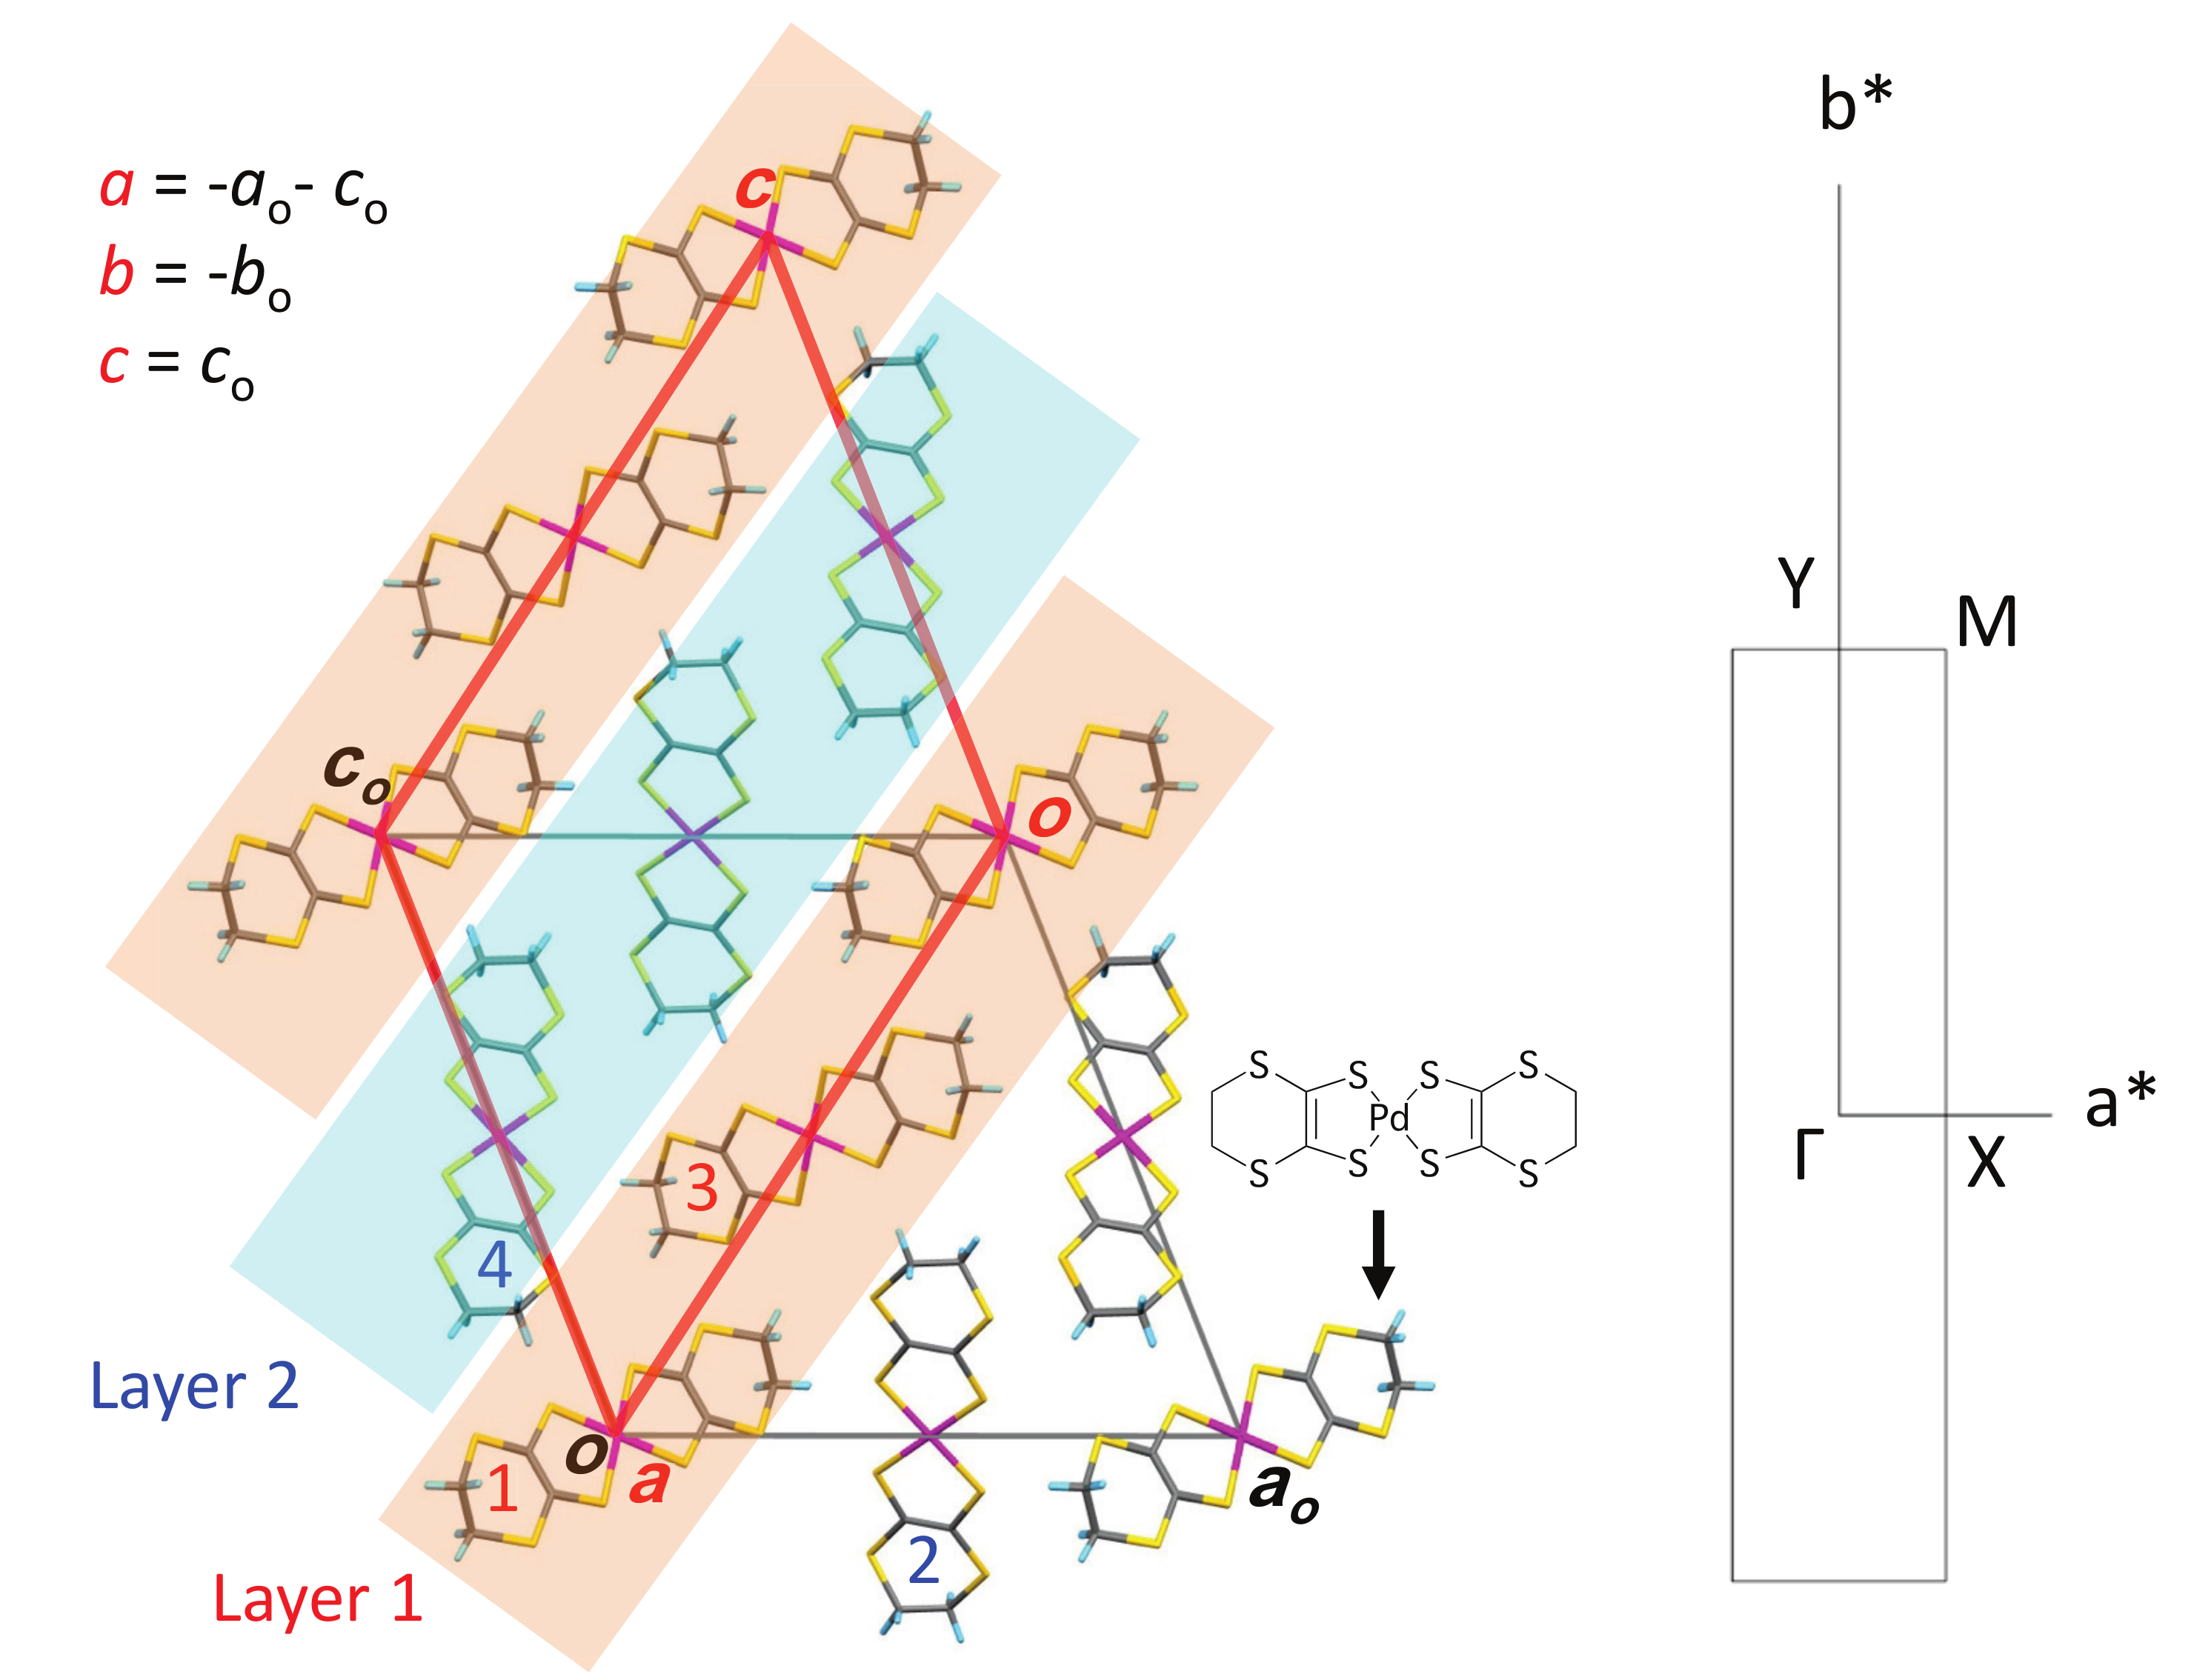
Figure 1 displays the crystal structure of [Pd(dddt)] of a three-dimensional system with eight molecular orbitals, which consist of four molecules (1, 2, 3, and 4) with HOMO and LUMO per unit cell. These molecules are located on two kinds of layers, where the layer 1 includes molecules 1 and 3, and the layer 2 includes molecules 2 and 4, respectively. The original unit cell is given by lattice vectors, , , and , while a new unit cell is introduced by a transformation, , , and in the present band calculation. Thus, the a axis becomes parallel to layer 1 and layer 2.
A TB model corresponding to Figure 1 has been recently obtained using the crystal structure observed under pressure [36]. There are several kinds of transfer energies between two molecular orbitals, which are listed in Table 1. The inter-layer energies in the z direction are given by a (1 and 2 molecules, and 3 and 4 molecules), and c (1 and 4 molecules, and 2 and 3 molecules). The intra-layer energies in the a-b plane are given by p (1 and 3 molecules) and q (2 and 4 molecules) and b (perpendicular to the a-c plane). Further, these energies are classified by three kinds of transfer energies given by HOMO-HOMO (H), LUMO-LUMO (L), and HOMO-LUMO (HL).
The TB model Hamiltonian is expressed as
where are transfer energies between nearest-neighbor sites and is a state vector. i and j are the lattice sites of the unit cell with N being the total number of the unit cells, and denote the 8 molecular orbitals given by HOMO and LUMO . These energies in the unit of eV are listed in Table 1 where the gap between the energy of HOMO and that of LUMO is taken as = 0.696 eV to reproduce the energy band of the first principle calculation [28].
Using a Fourier transform with a wave vector , Equation (1) is rewritten as
where , . We take the lattice constant as unity and then in the first Brillouin zone.
The matrix Hamiltonian is given in Appendix A. The nodal line has been found using [28] where the Dirac point is supported by the existence of the inversion center [2]. The energy band and the wave function , are calculated from
where and
with = H1, H2, H3, H4, L1, L2, L3, and L4.
Since the electron close to the chemical potential is relevant for the electron-hole excitation, we consider only and , i.e., the valence and conduction bands for the calculation of the conductivity. Thus, and are replaced by and for the calculation of the conductivity, while represents not only the Dirac cone but also full dispersion of and in the first Brillouin zone. The present energy bands provide a nodal line, i.e., a loop of the Dirac point , which is obtained from
The chemical potential is determined self-consistently in the clean limit from
where with T being temperature in the unit of eV and . Equation (6) is the condition of the half-filled band due to the HOMO and LUMO bands.
denotes a density of states (DOS) per spin and per unit cell, which is given by
where .
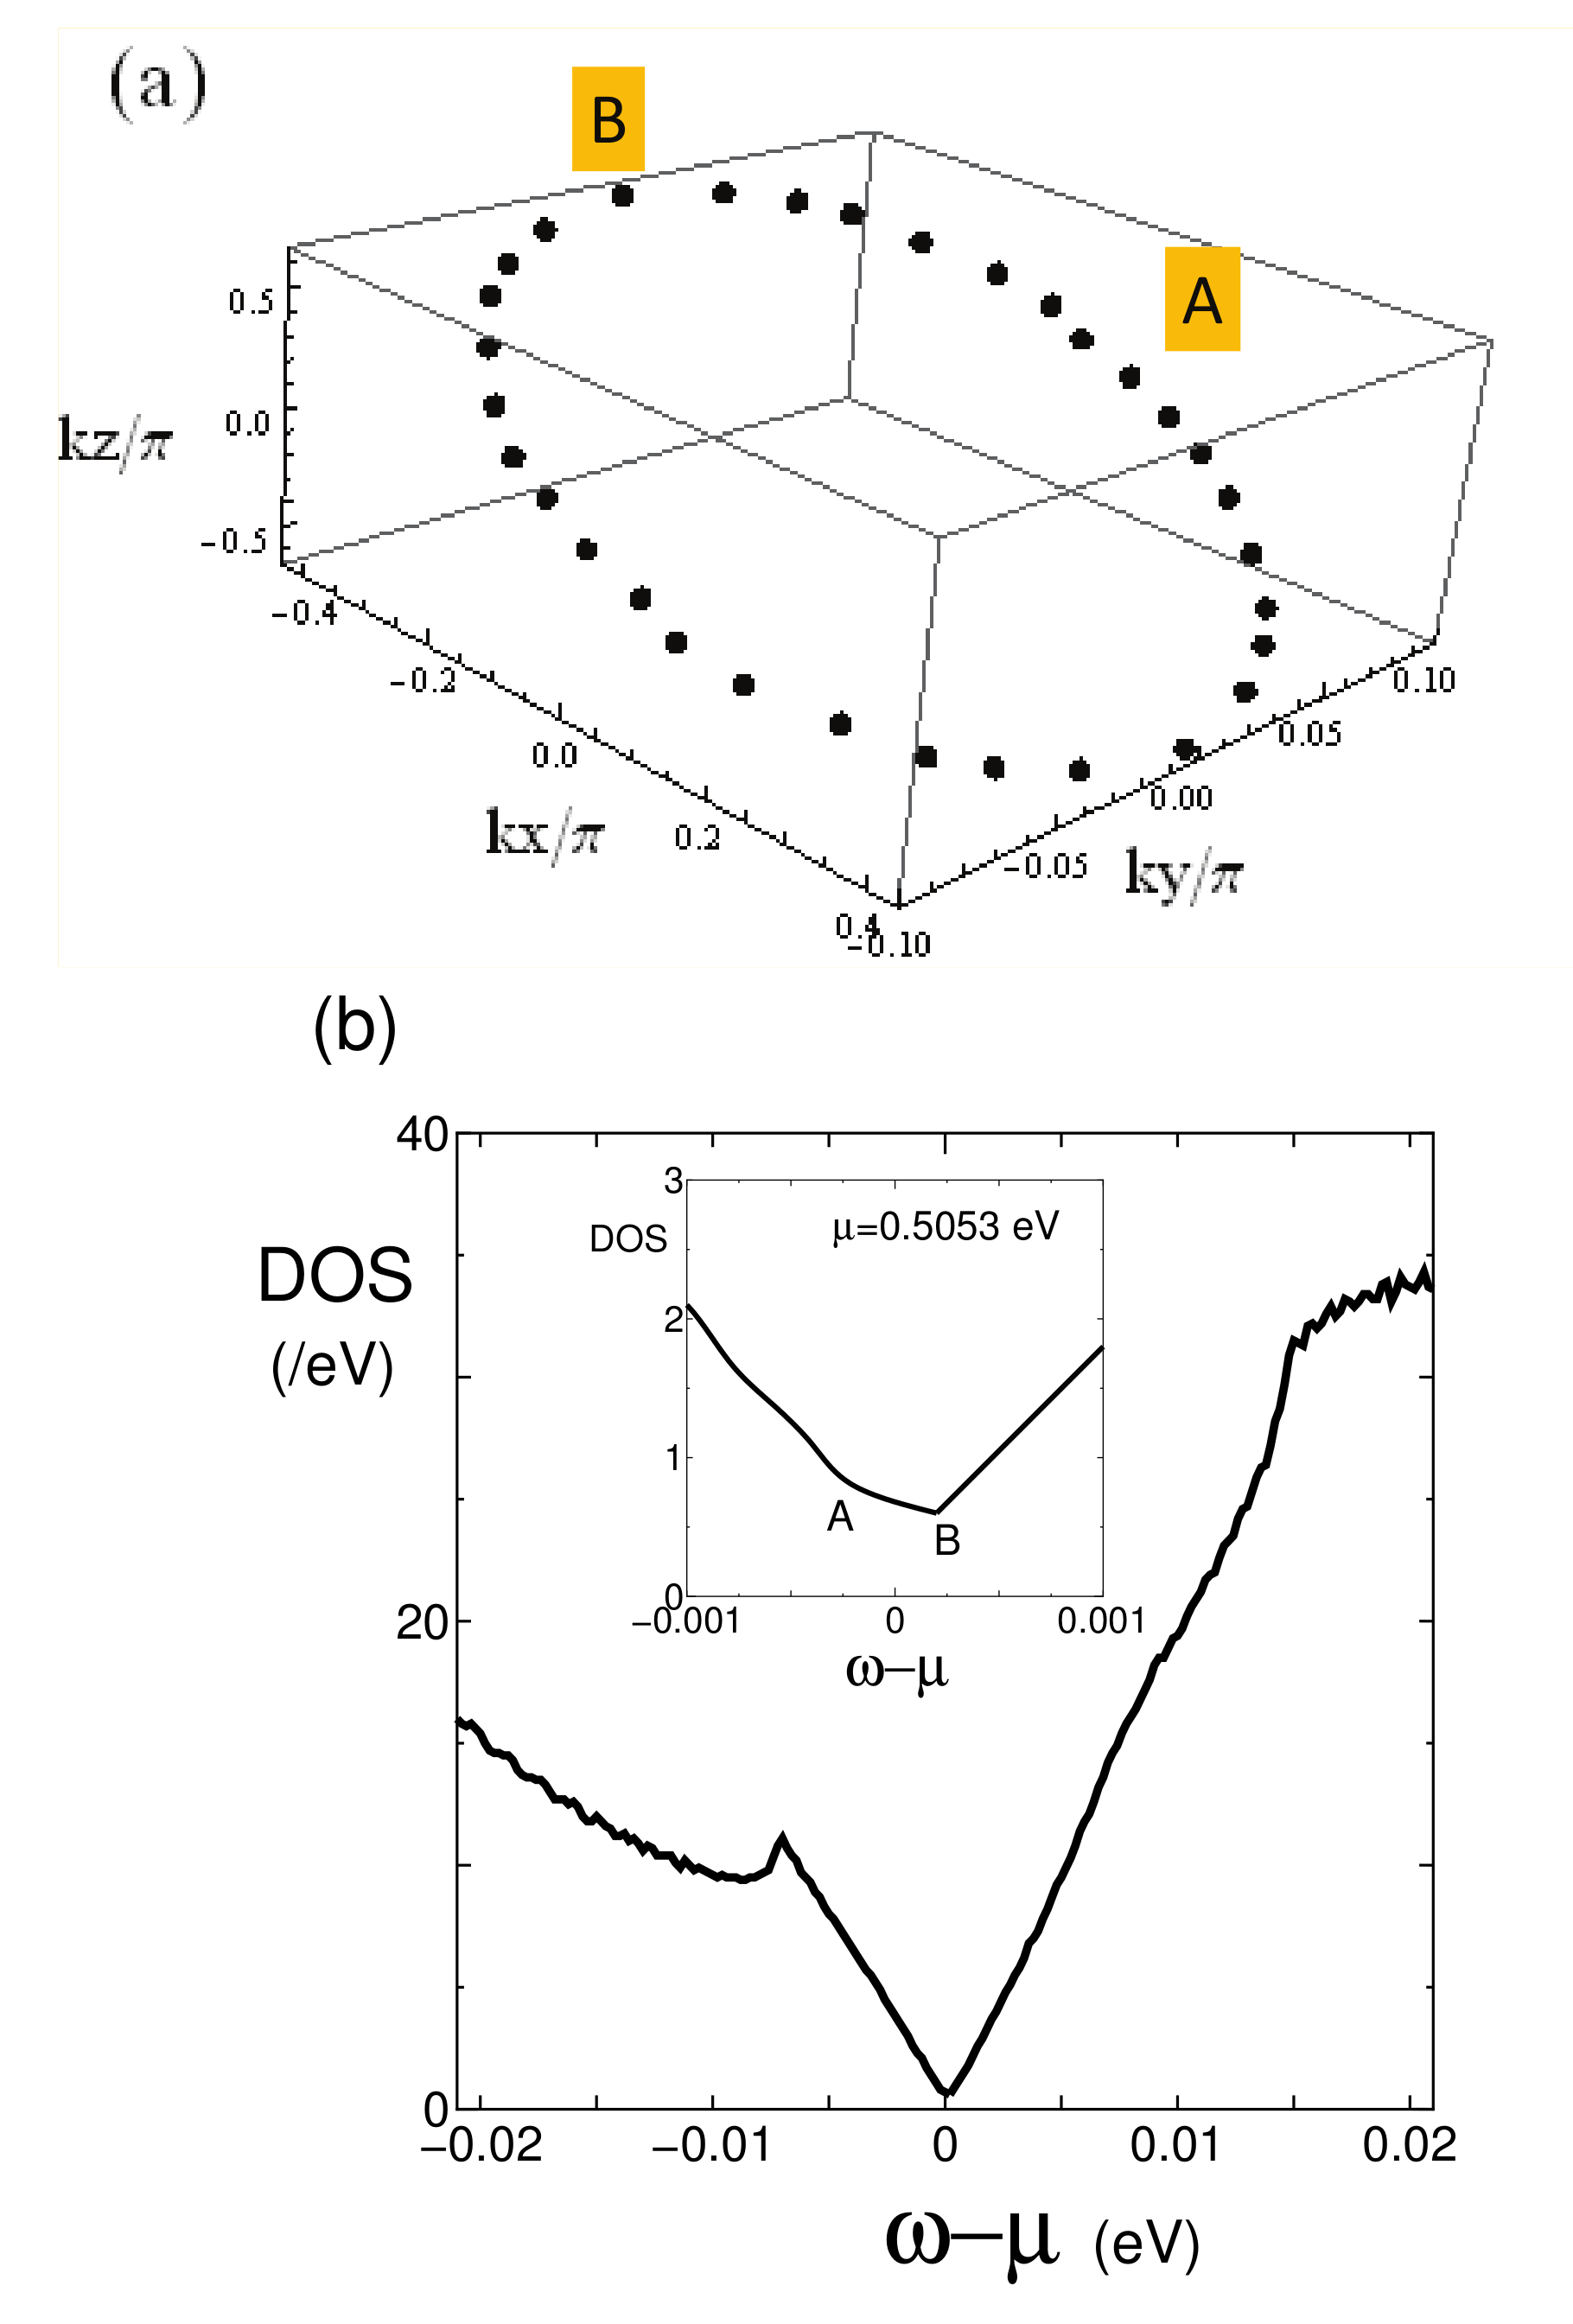
Figure 2a shows a nodal line, a loop of Dirac point , which is obtained from Equation (5). The Dirac point is symmetric with respect to the point, . There is a mirror symmetry with respect to , which gives two typical Dirac points given by (0, 0.096, 0) (A), and (−0.42, 0, 0.64) (B). The energy increases from 0.5052 to 0.5056 as the Dirac point moves from (A) to (B) and the chemical potential = 0.5053 is found on the line between (A) and (B) suggesting the nodal line semi-metal close to a zero-gap state.
Figure 2b shows the DOS, , for , where the origin of is taken at the chemical potential , i.e., . The peak for corresponds to the maximum of HOMO while that of also exists due to the minimum of LUMO, where both peaks are located at (not shown in the Figure). We note that there is a sufficient region of , where . Such a behavior comes from two-dimensional character of the Dirac cone, which gives with v being the averaged velocity of the cone along the nodal line. From the comparison, we obtain , which is about a half of -(BEDT-TTF)I [16]. The inset denotes close to the chemical potential, which is not symmetric with respect to = 0 and the minimum is located in the region of . Compared with the previous model [28] these behaviors are similar but of the present case is much smaller suggesting a robust Dirac cone with the almost zero-gap state.
2.2. Total Hamiltonian
We consider a total Hamiltonian consisting of the electron and phonon systems:
where the first three terms denote the Fröhlich Hamiltonian [37] applied to the Dirac electron system. The first term represents the energy band of single-component molecular conductor [Pd(dddt)] [10] and is given by Equation (1),
where and correspond to and , respectively in Equation (3). The spin is ignored for simplicity. is the creation operator of the electron with a wave vector and the band. The second term describes the acoustic phonon with a spectrum of and a creation of operator , where with v being the velocity of the Dirac cone. The wave vector is defined by the Fourier transform on the square lattice with the lattice constant taken as unity. ve vector of the band and acoustic phonon with a vector . = + (-) denotes a conduction (valence) band. The third term represents an electron-phonon (e–p) interaction expressed as
where . Later, we introduce a coupling constant , which becomes independent of for small . The scattering by the phonon is considered within the same band (i.e., intraband) due to the energy conservation with . The fourth term denotes a normal impurity scattering, which is introduced to avoid the large conductivity in the presence of only the e–p interaction [38]. We take = 1.
2.3. Conductivity
The damping of the electron of the band, which is obtained from the Green function expressed as,
where , and the real part can be neglected for small doping [33]. The quantity , which is the damping by the impurity scattering, is taken as a parameter to scale the energy. Note that does not depend on , and that the ratio is crucial to determine the T dependence of the conductivity. The quantity with denotes a self-energy of the electron Green function estimated as [39]
which is a product of electron and phonon Green functions. , with n and m being integers. where is a chemical potential.
Here we note that there is a following Dirac point on the nodal line. When contributes to a linear dispersion of DOS in Figure 2b, the energy dispersion and are given by the Dirac cone as a function of , which gives a plane perpendicular to a tangent of the nodal line at [30]. In this case, the damping by the acoustic phonon scattering can be estimated based on the previous calculation of two-dimensional Dirac cone [33] which is given by with . Such a result is extended to the present case by taking account of the variation of due to finite temperatures and the three-dimensional spectrum, . In fact, we obtain:
where C = 12.5 (eV) and . The quantity denotes the coupling constant of the e–p interaction, where and is treated as a parameter. The quantity R denotes a normalization of by , where a typical value of = 0.03 corresponding to a weak coupling is taken and is compared with the energy of the Dirac cone .
Using in Equation (4), the electric conductivity per spin and per unit cell is calculated. The conductivity is given by [31,34]
where and z, and . h and e denote a Plank’s constant and electric charge, respectively. and denotes a chemical potential.
The previous calculation of the conductivity was performed by taking account of the impurity scattering of the damping only [35], while the damping by phonon scattering [33] is added to the new TB model [36] in the present calculation. The total number of the lattice site is given by , where is the number of the intralayer sites and is the number of the layer. Note that the calculation of Equation (14) with the summation of in the end, i.e., a two-dimensional conductivity for the fixed is utilized to calculate the nodal line semimetal as shown previously [34]. It is noted that Equation (14) can be understood using DOS when the intraband contribution () is dominant and dependence of is small.
3. Electric Transport
The conductor of [Pd(dddt)] under pressure exhibits a Dirac electron system in three-dimension. The purpose of this section is to explain the almost temperature independent conductivity of such a system by taking account of the acoustic phonon scattering. The conductivity Equation (14) per spin is calculated, which is normalized by , i.e., . The unit of energy is taken as eV,
We examine the temperature T dependence of the conductivity ( = x, y, and z), which is determined by the combined effect of impurity and phonon scatterings. Both scattering decrease but the combined effect is complicated at finite T. With increasing temperature, increases due to the DOS of the Dirac cone but is suppressed by the phonon scattering, which increases with increasing T. We first show the T dependence of in the presence of only impurity scattering, i.e., R = 0. Next, T dependence of in the presence of both impurity and phonon scatterings are shown in detail by varying parameters and R to compare with the T dependence found in the experiment. The numerical calculation of the conductivity is performed by choosing = 0.0005 and 0.0003, which are smaller than the previous one [35]. Hereafter, we use .
3.1. Conductivity by Impurity Scattering
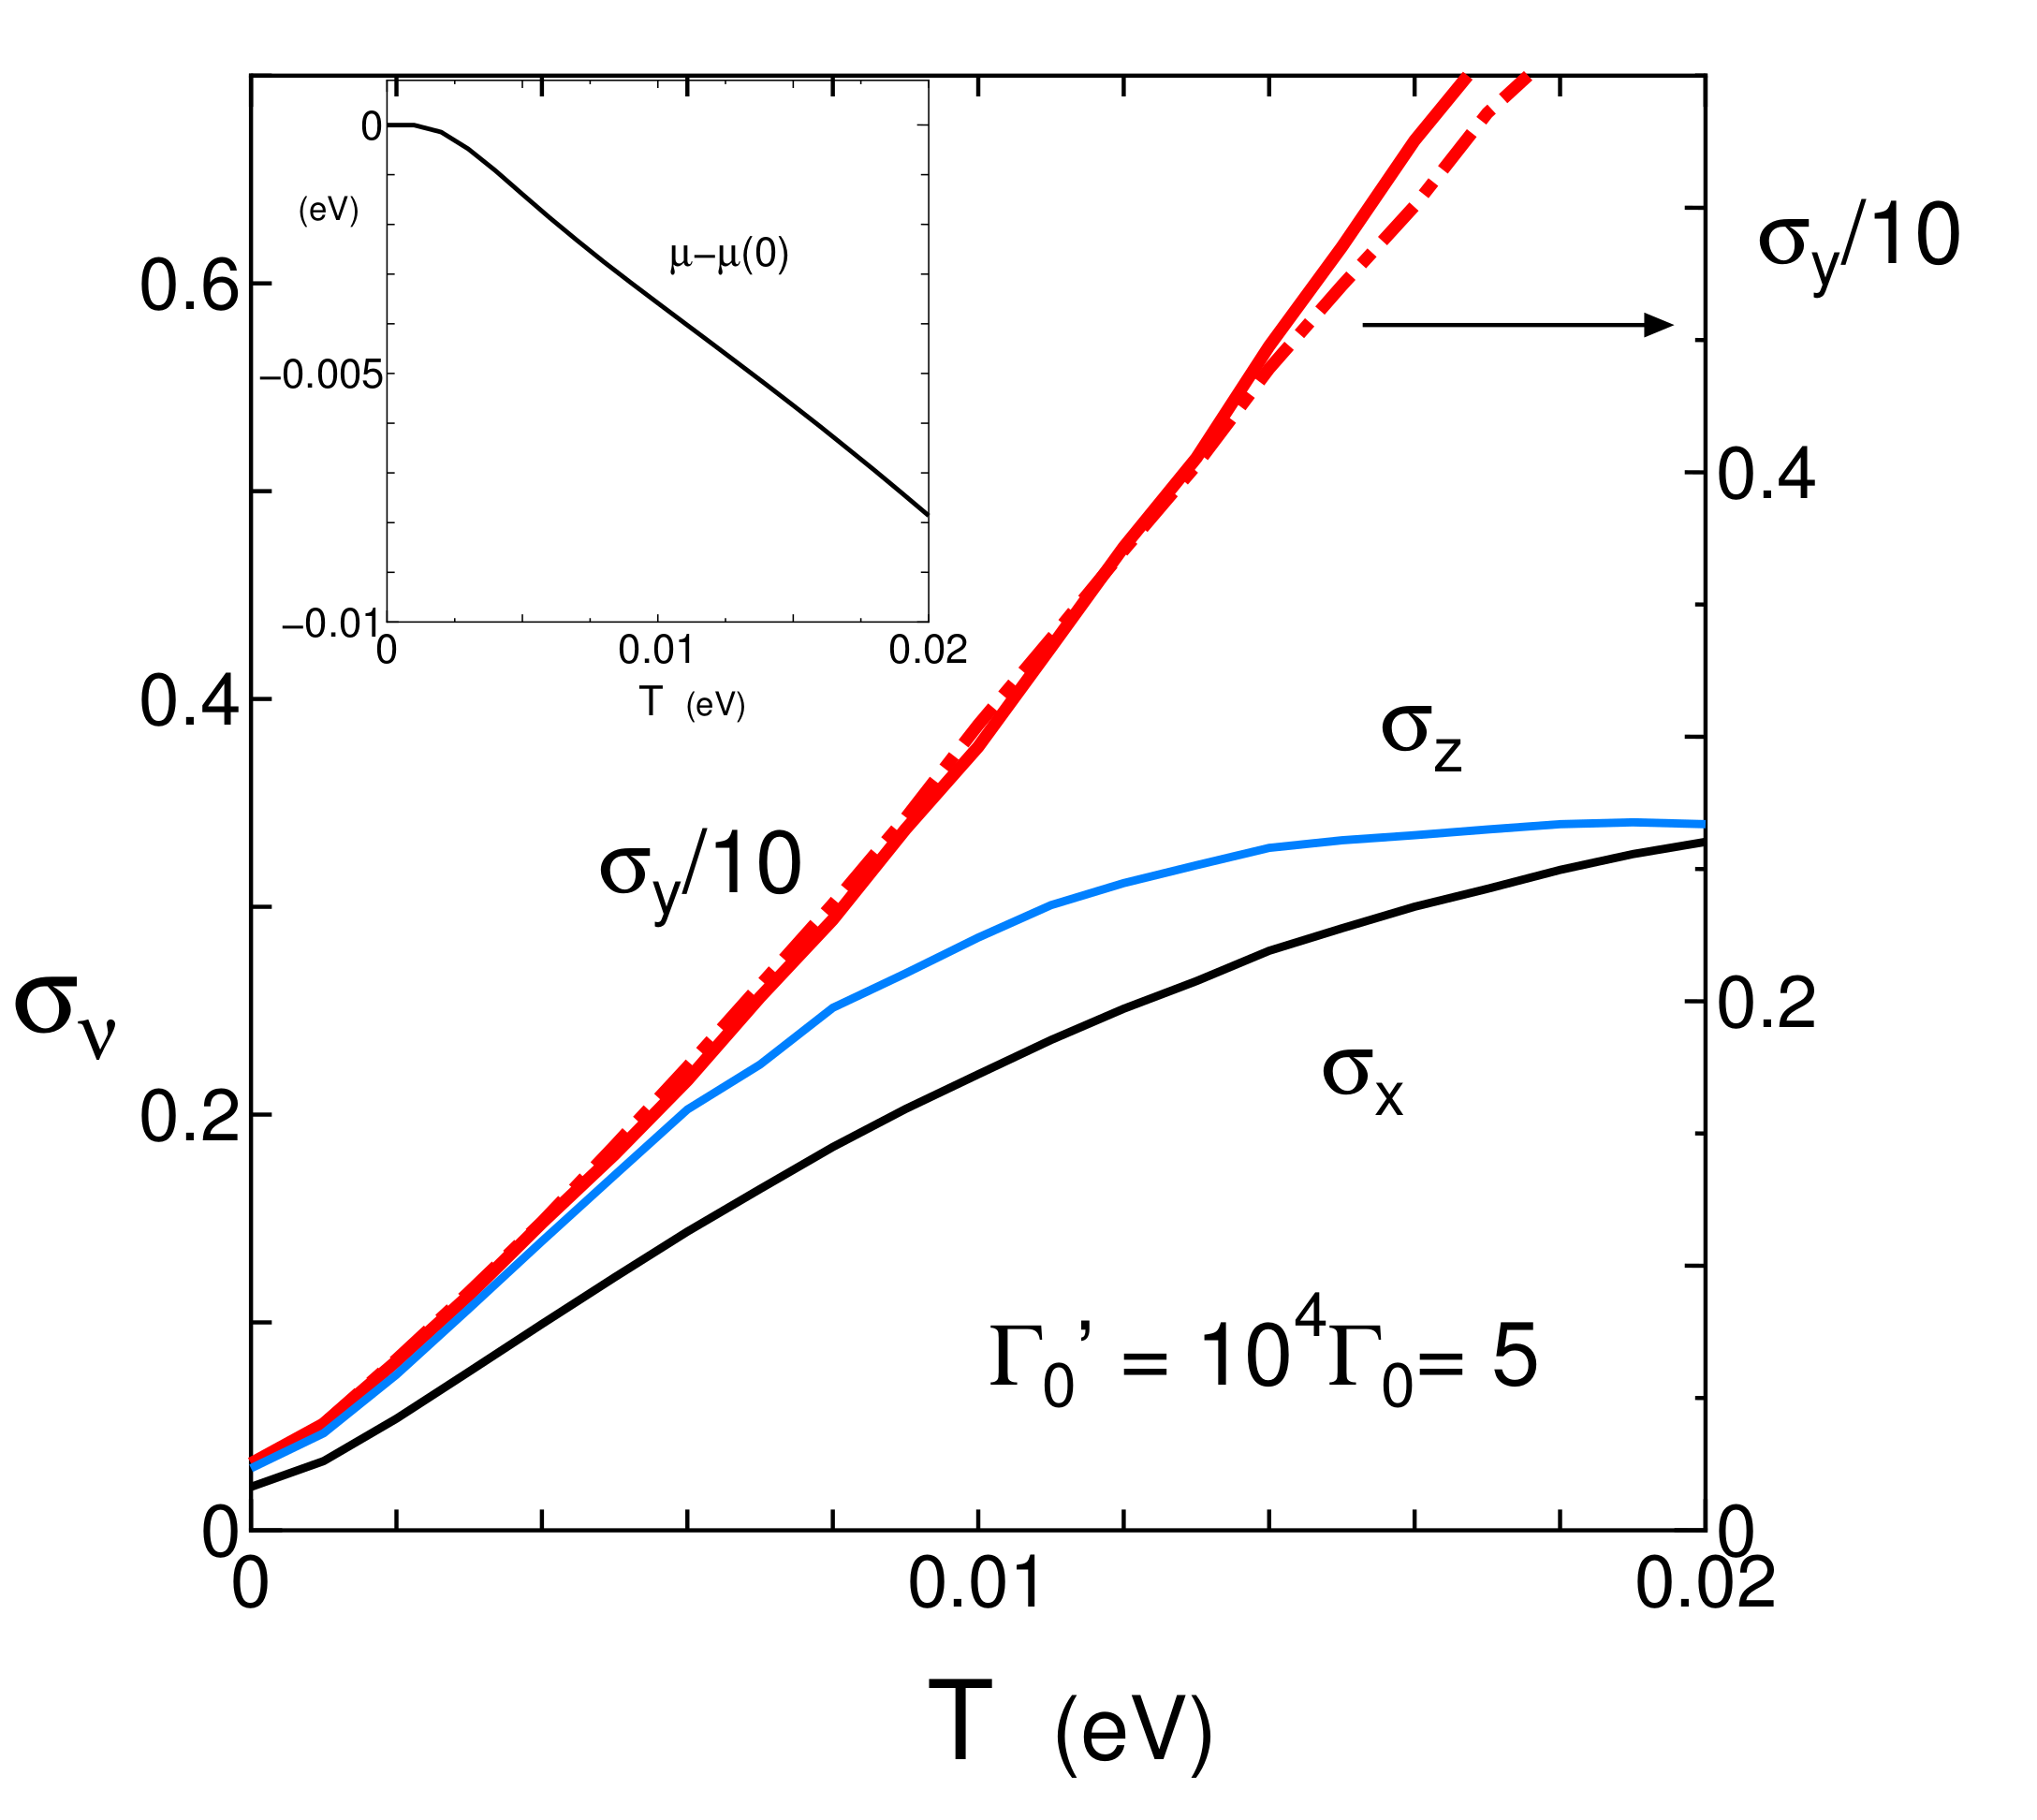
In Figure 3, the anisotropic conductivity with only impurity scattering is shown by the solid line. Compared with the result obtained by the previous TB model [35], a noticeable result is an existence of T-linear dependence of , which is seen in a wide region of temperature due to the robust Dirac cone. As seen from Figure 1 and Table 1, the large magnitude of is obtained since the molecules are stacked along the y-axis. Further is smaller than the previous one due to smaller . Such a linear increase is also found for both and , in which the linear increase begins to deviate at lower temperatures. There is a large anisotropy, where is much larger than and . We note that the anisotropy of comes mainly from that of the velocity. In fact, = 0.0094, = 0.058, and = 0.0072, where and denotes an average by summation of , and of Equation (16). Note that the velocity obtained from DOS in Figure 2b is an average of these velocities. However the ratio of is different from that of velocities and is more complicated, since Equation (14) is calculated as a combined effect of the velocity and a quantity associated with the electron Green function. The inset denotes the T dependence of the chemical potential , which decreases monotonously, suggesting the increase of hole close to the nodal line. A fitting formula of is given by . The dot-dashed line in the main figure denotes , which is calculated with the fixed . The difference between the solid and dot-dashed lines is negligibly small even at finite temperature. However such a difference becomes noticeable for a moderate strength of the e–p interaction as shown in the next subsection.
3.2. Effect of Phonon Scattering on the Conductivity
Since is the largest one and the direction is the same as that of measured one [26] we examine in detail with some choices of R. Before the numerical result, we examine semi-analytically.
We show can be written as,
where . Parameters , and c in Equation (17) are determined by fitting in Figure 4 and Figure 5. Equation (17), which describes well for both low and high temperatures, is obtained as follows. Noting that with only impurity scattering is written as with [31]. In the presence of , may be written in the same form, where is replaced by , i.e.,
where = . Using Equation (13a) and a relation,
which is shown numerically in the inset of Figure 4, may be written as
where . Thus Equation (17) is derived from Equations (18a)–(18c). As shown later, Equation (18b) can be verified by calculating a quantity
where F is calculated from Equation (14) with replaced by in Equation (15). Since denotes an average of energy close to the nodal line, we may write , and . This gives a simpler expression compared with Equation (17), i.e., , with .
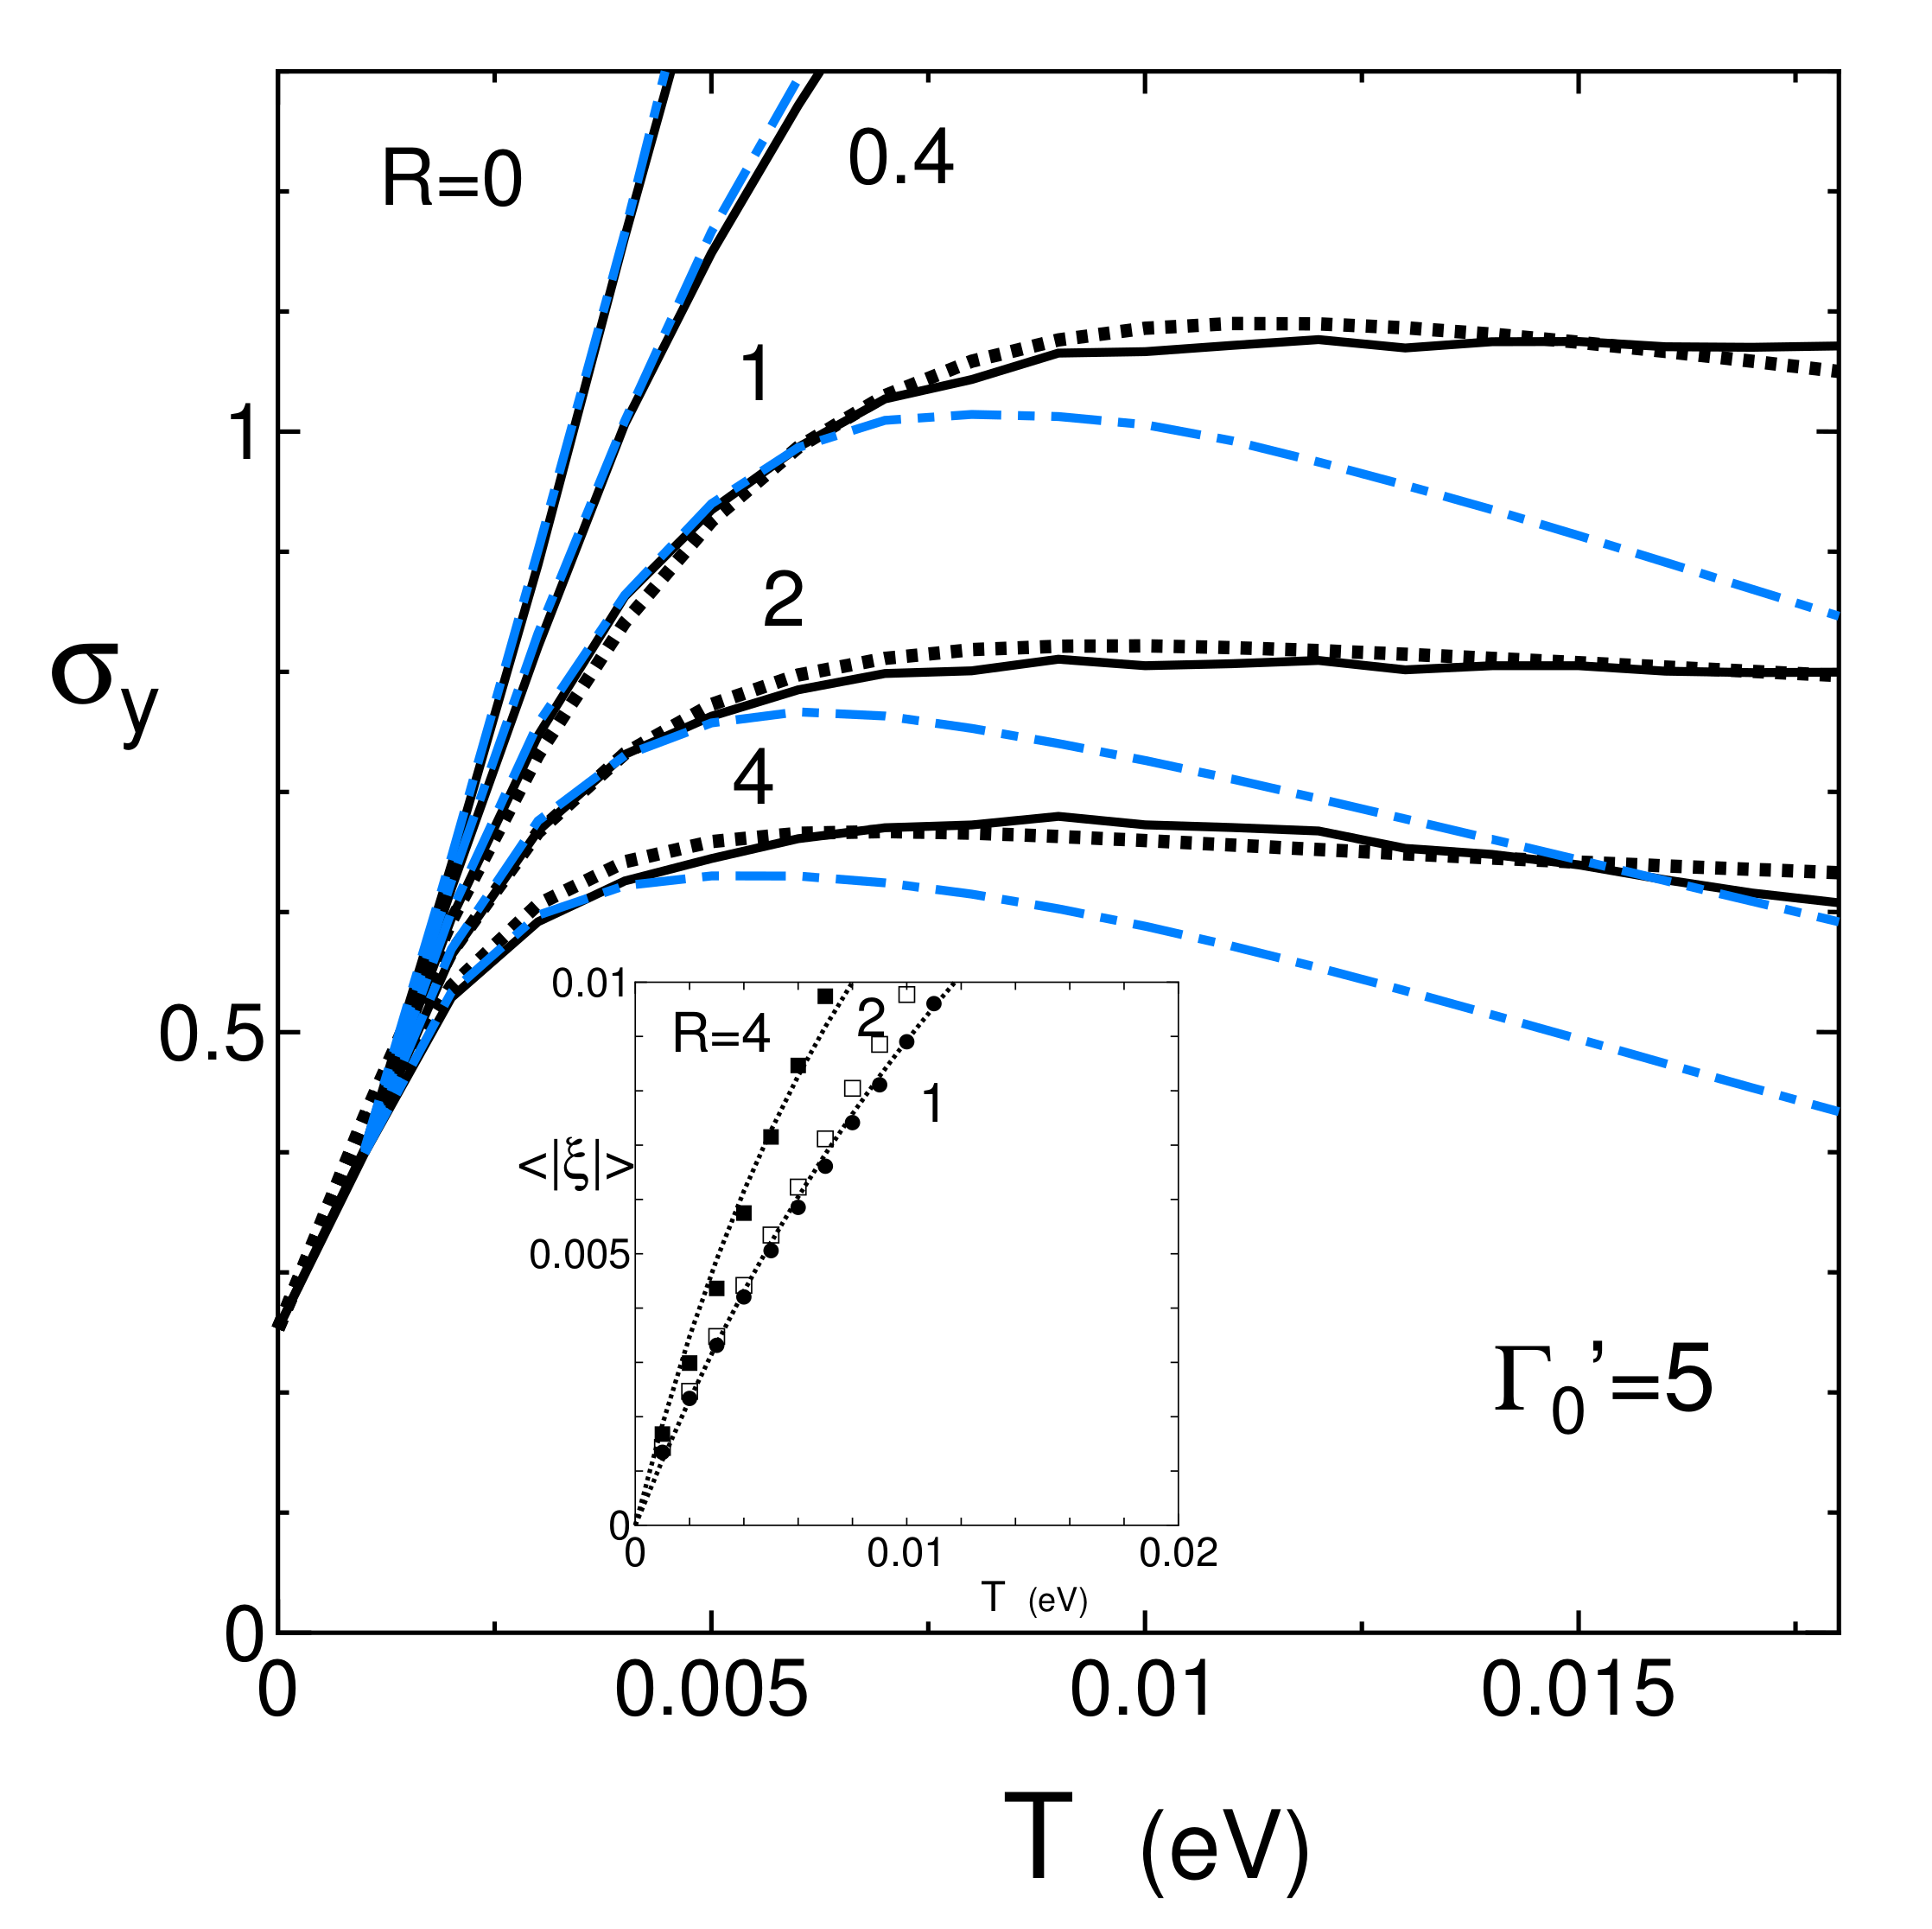
Now we examine using Equation (17) as a fitting line. Figure 4 shows T dependence of (solid line) for = 5 with the fixed R= 0, 0.4, 1, 2, and 4 (solid line). It is found that is reduced and takes a maximum in the presence of R, while with R = 0 increases monotonously. It is the main purpose of the present work to demonstrate that for R = 1 and 2 exhibit almost T independent behavior in a wide temperature region of . This exotic T dependence exists for some choices of and R, as shown later. From the dot line corresponding to Equation (17), we obtain = 0.0055, a = 0.25, and = (0.5,0.22), (1.39,0.6), and (2.6,0.81) for R = 1, 2, and 4 respectively. It is verified that b increases and decreases with increasing R. Note that the almost temperature indepednent comes from the existence of the c term, which weakens the effect of the b term. This corresponds to the suppression of as shown in the inset. In Figure 4, with the fixed is also shown by the dot-dashed line. At high temperatures, is reduced noticeably due to the deviation of from the energy of the Dirac point. For the solid line, the T dependence of in Equation (13a) is small due to , which comes from the electron-hole excitation in the conductivity. However, for the dot-dashed line, becomes large due to the fixed , resulting in the large suppression of , where the maximum is broadened. With increasing R, corresponding to a maximum of decreases, while the reduction at high temperatures is almost parallel. The inset denotes obtained from Equation (17), for R = 0.5, 1, and 2, where the symbols are fitted by the dot lines given by with for R = 4 (1), which corresponds well to that of the fitting of .
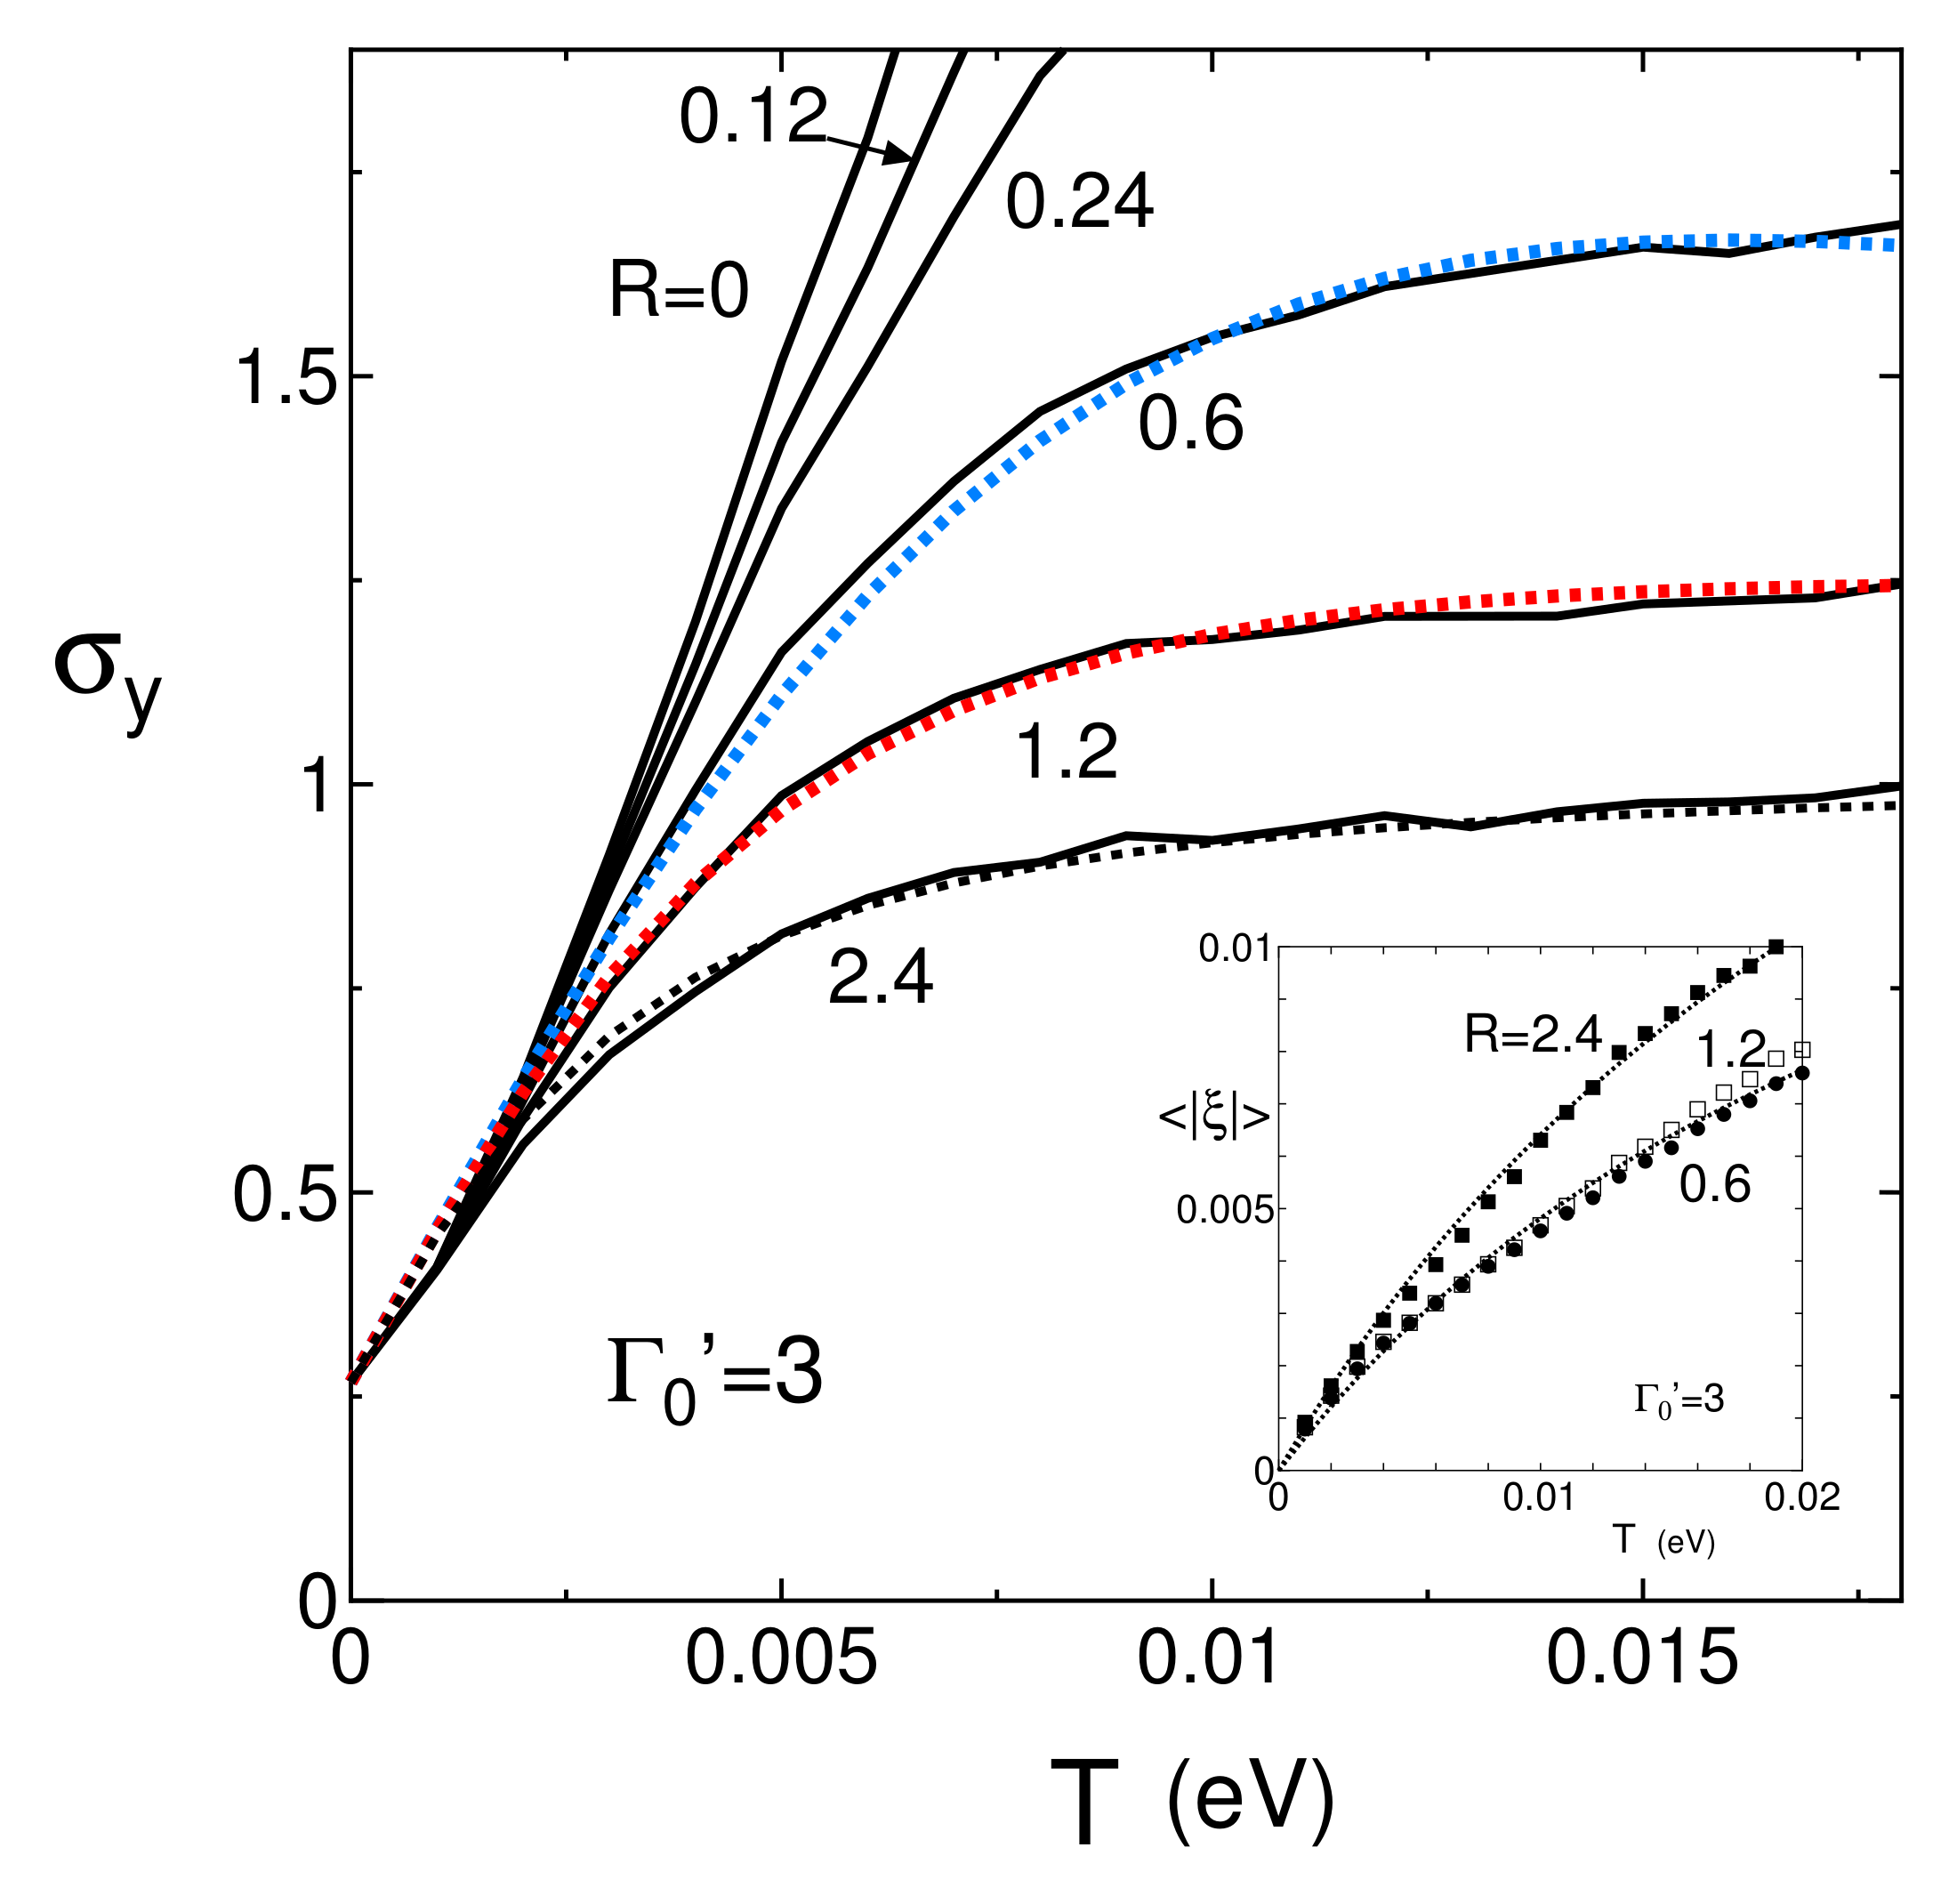
Figure 5 shows T dependence of for smaller with the fixed R = 0, 0.12, 0.24, 0.6, 1.2 and 2.4 (solid line). The dot line denotes a fitting one obtained from Equation (17), where parameters are estimated as = 0.0053, a = 0.27, and = (0.15,0.06) (0.58,0.50), and (1.9,1.4) for R = 0.6, 1.2, and 2.4, respectively. Compared with Figure 4, we find as follows. A ratio of to increases with decreasing , e.g., 10 and 16 for = 5 and 3, respectively. Although still increases, it is expected that the almost constant behavior occurs at higher temperature due to the increase of the phonon scattering. There is a quantitative difference between R = 0.12 and R = 0.36. With decreasing , increases followed by the increase of the crossover temperature from T linear behavior to that being almost constant. In the inset, obtained from Equation (18b) is shown by the symbols, where the dot line denotes the fitting line given by with for R = 2.4 (0.6).
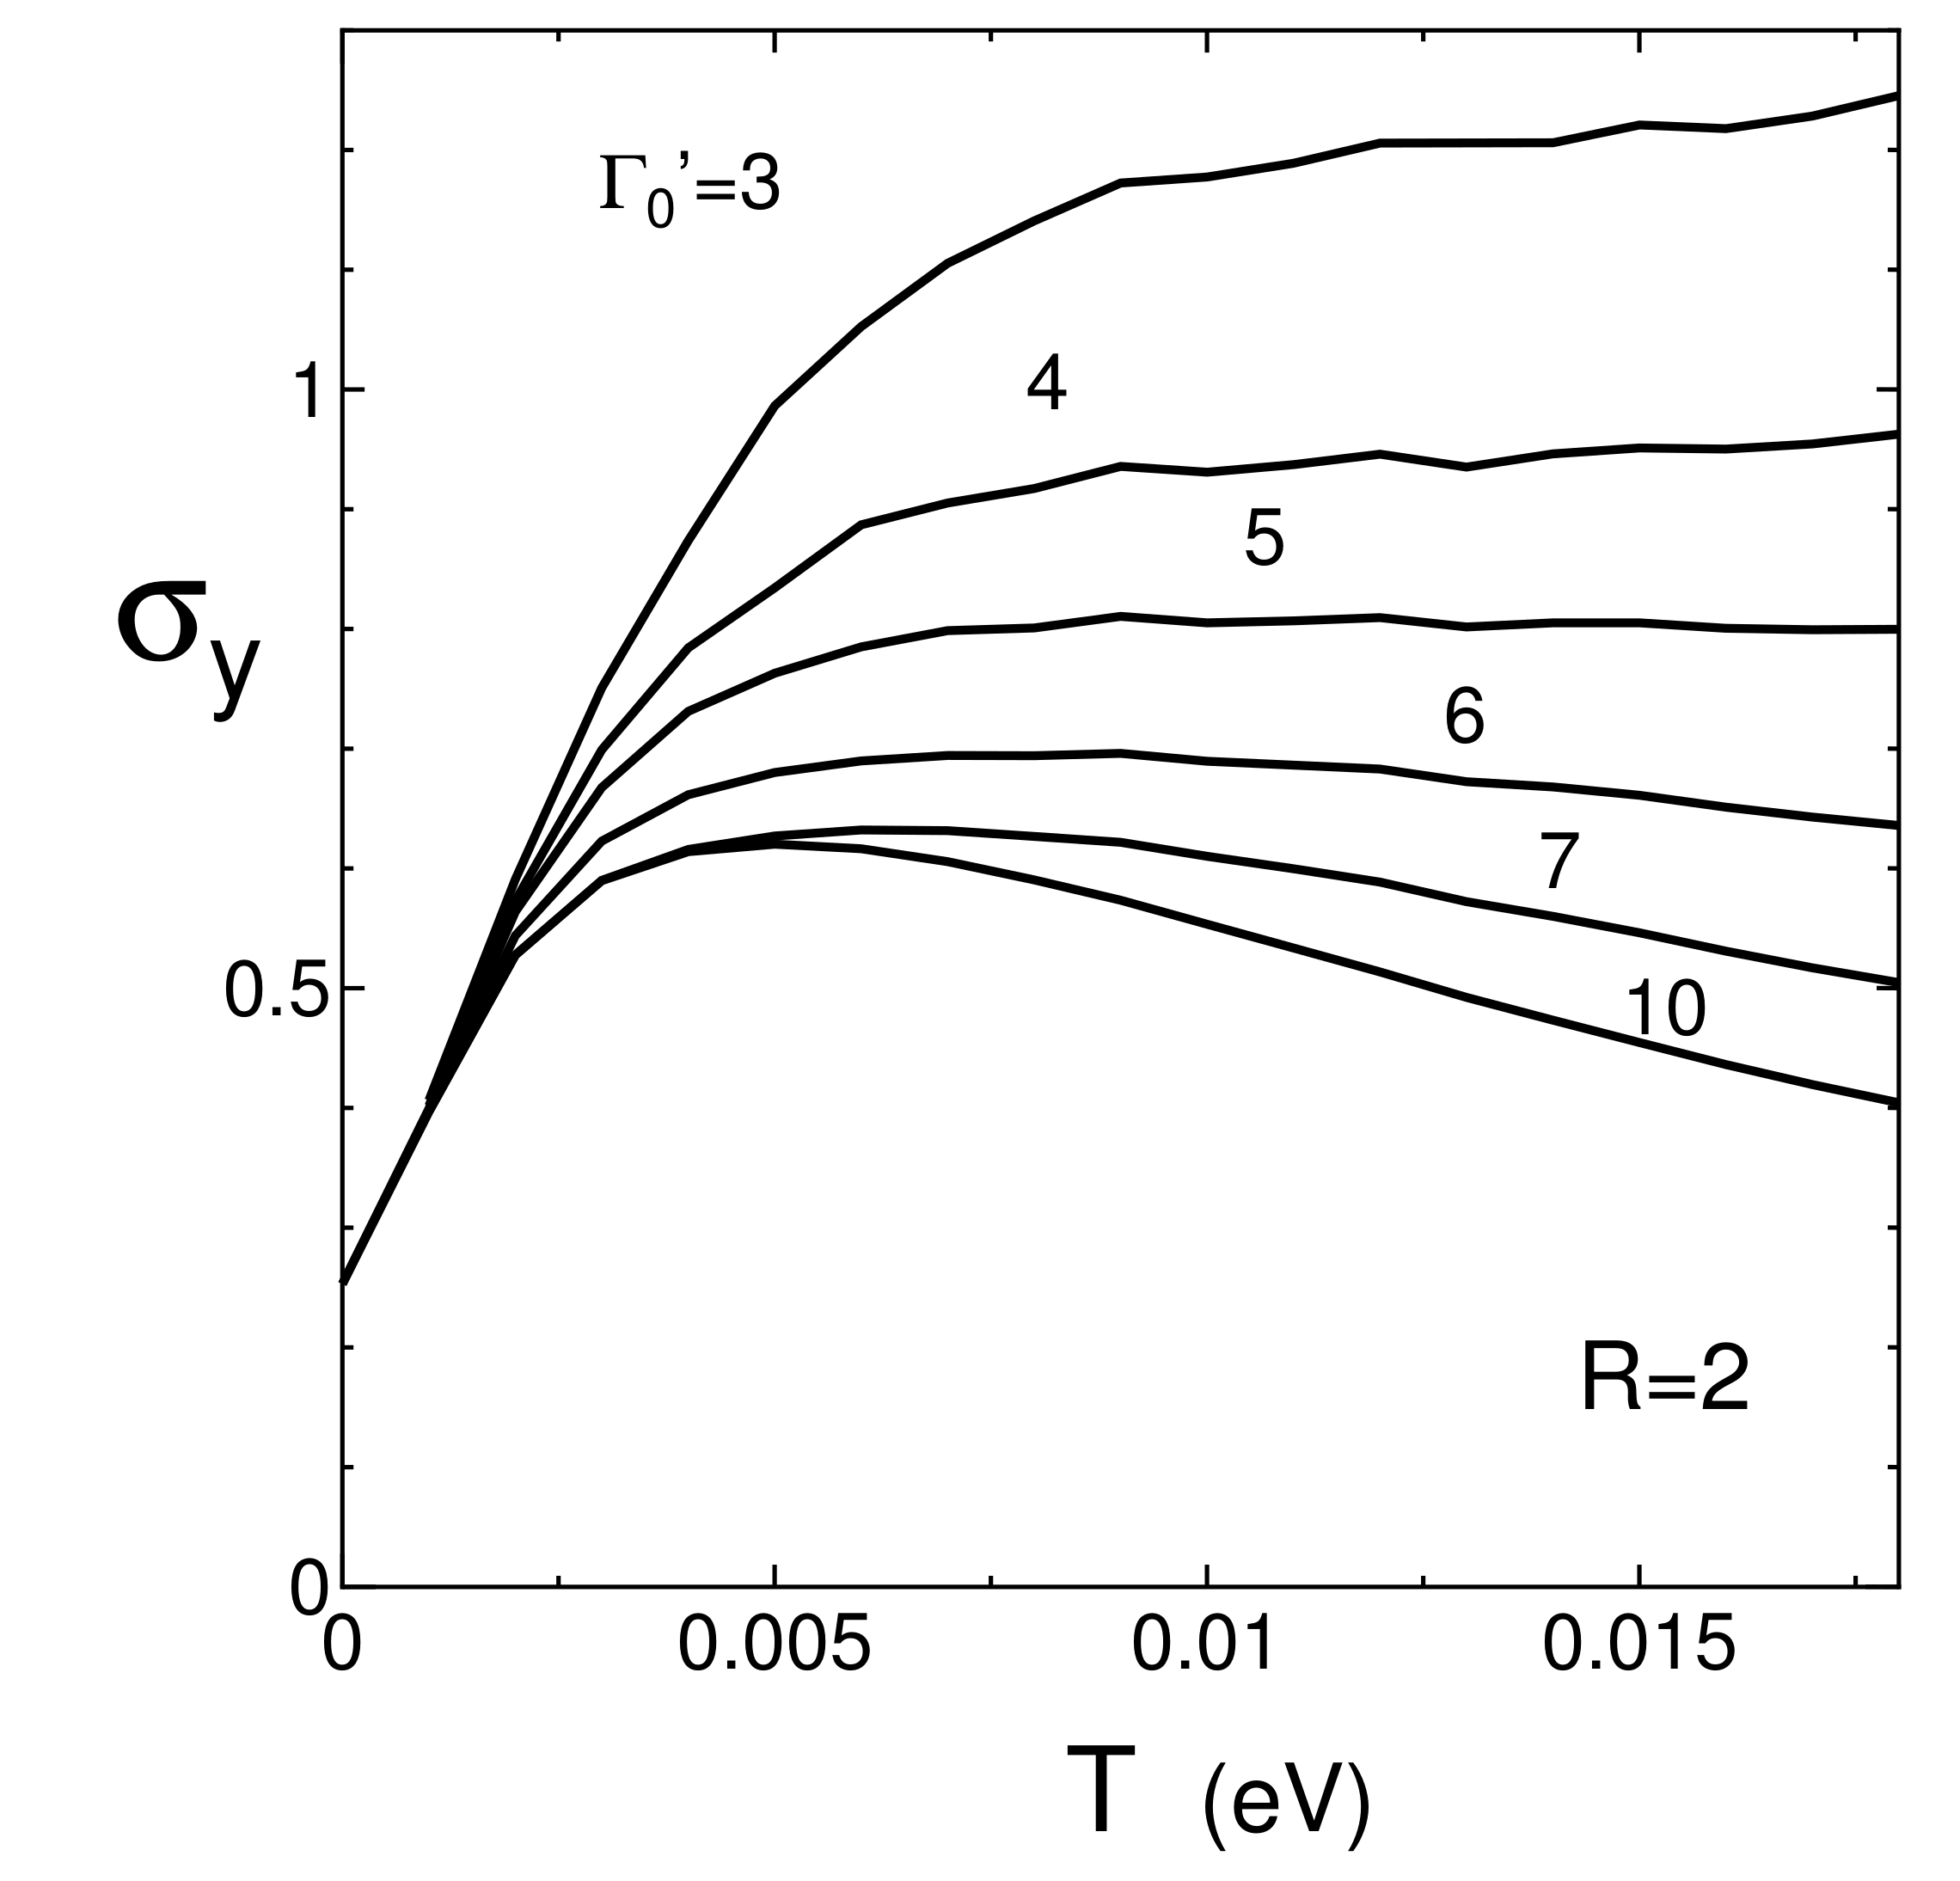
Figure 6 shows for some choices of with the fixed R = 2, where the lines with = 3 and 5 are the same as those in Figure 4 and Figure 5. With increasing R, the T dependence changes from the monotonous increase to the constant behavior and a maximum is followed for . This suggests the constant behavior is obtained for the moderate strength of in contrast to Figure 4 and Figure 5, which are examined for the fixed . The fitting by Equation (17) is also valid, since = 3 and 5 are already shown in Figure 4 and Figure 5. The line with = 10 shows a noticeable decrease of suggesting the dominant effect by the large e–p scattering at high temperatures. From Equation (17), it turns out that b suppresses but c enhances . The role of c is crucial to obtain the almost constant conductivity, since a relation at high T gives almost T independent in Equation (17). We found the almost T independent . for = (4, 0.8), (4, 1.2), (4, 2). (5, 0.5), (5, 1), (5, 2), (6, 1), (6, 1.2), and (6, 2). It turns out that the almost T independent in the interval region of is realized for and .
Here we discuss the result of almost temperature independent conductivity in Dirac electrons, which is obtained by taking account of both impurity scattering () and the acoustic phonon scattering (). In the presence of only , the conductivity increases linearly with increasing T due to the increase of the relevant DOS being linear in ( Figure 2b). Such behavior is found in both the 2D Dirac cone at zero doping and the half-filled [Pd(dddt)] with a nodal line, where the chemical potential is located close to the nodal line and the energy variation along the nodal line is very small as seen from the inset of Figure 2b. However such an increase of the conductivity is suppressed by a moderate strength of the acoustic phonon scattering. The conductivity of the 2D Dirac cone shows a broad maximum as a function of T, while that of the nodal line further exhibits the wide temperature region followed by the almost temperature independent conductivity. Such a result is obtained by treating the damping of phonon scattering as (Equation (13a)), with (the inset of Figure 3) due to asymmetry of DOS, where a peak around is much larger than that of . The suppression of the conductivity is understood by in the inset of Figure 4, which results in due to the e–p excitation in the conductivity Equation (14). However Equation (18c) suggests a constant conductivity by the c-term in the denominator. The wide temperature region for the relevant c-term could be attributable to a nodal line with a half-filled band.
3.3. Comparison with Experiment
Finally, in Figure 7, we compare the present theoretical results with those of the experiment [10,40]. The conductivity of a single crystal under quasi hydrostatic pressure was measured by the four-probe method using the DAC (Diamond Anvil Cell) technique. For the convenience of comparison, we show the resistivity . Since the comparison of the absolute value is complicated both theoretically and experimentally, we use a simple method that the quantity is normalized at a temperature of T = 0.015. In Figure 7, the experimental result is shown by and corresponding to P = 12.6 GPa, and P = 13 GPa, respectively, which increase about 1.8 and 3.4 (0.015), respectively, with decreasing temperature. The results of the present calculation are shown for = (4,1.6), (3,0.6), and (3,0.12). The line of (3,0.6) reproduces well for , and the line of (4,1.6) shows almost constant resistivity for . The rapid increase of is compared with that of (3,0.12) for , where the weaker e–p coupling is taken. Such behavior could be expected for higher pressures due to the increase of the velocity. The larger damping (not shown in the Figure) gives a minimum for a moderate choice of R with increasing T. Such a minimum, which could be relevant to that of -(BEDT-TTF)I [32] is obtained for a slightly large .
4. Summary and Discussion
Using a TB model, which has been recently obtained, we examined the temperature dependence of the conductivity of [Pd(dddt)] with a nodal line semimetal. The main finding is the almost constant resistivity obtained by the acoustic phonon scattering, which plays an exotic role in the presence of the Dirac cone and nearly the half-filled band. The DOS shows linear behavior in the sufficient energy region, which suggests a robust Dirac cone even for the nodal line.
The conductivity is the largest one since the transfer energy is large along the stacking direction of y-axis. The phonon scattering, which occurs in the half-filled Dirac electron system, has an effect of reducing the linear increase of the conductivity and shows almost temperature independent behavior at high temperatures. With increasing temperature, the conductivity increases linearly in the presence of only the impurity scattering, but the presence of acoustic phonon gives the strong suppression of the conductivity. The mechanism of damping by the phonon scattering is noticeable. The damping by phonon, i.e., the imaginary part of the self-energy is proportional to T with is the energy of the electron measured from the chemical potential.
This is in contrast to the conventional case with a Fermi surface corresponding to a large doping. For , becomes large but as a function of T decreases rapidly [33] due to the large effect of the phonon scattering with a damping being proportional to T [41].
Thus it is concluded that the present conductivity being almost temperature independent is an evidence of the Dirac electron system with a half-filled band.
Finally, we comment on the validity of the present TB model. In the previous work [10,28], transfer energies of the TB model have been estimated for both 0 GPa and 8 GPa (corresponding to 12.6 GPa of the experiment), where the former (latter) provides the insulating gap (Dirac points) in accordance with the experiment. Thus, the present TB model may be justified at lower pressures, but the state at higher pressure given by P = 13 GPa in Figure 7 shows a rapid increse of the normalized being opposite to the conventional pressure-resistance relation suggesting a possible modification of the model. Actually, it is known that higher pressure induces disorder in the molecular structure [40].
Author Contributions
Investigation, Y.S., R.K. and M.O. All authors have read and agreed to the published version of the manuscript.
Funding
This work was supported by JSPS KAKENHI Grant Number JP16H06346.
Acknowledgments
One of the authors (Y.S.) thanks T. Tsumuraya for useful discussions on the nodal line semimetal.
Conflicts of Interest
The authors declare no conflict of interest.
Appendix A. TB Model
As shown in Table A1, the Hamiltonian is divided into the 4 × 4 matrix, , ( and ), corresponding to H-H, H-L and L-L components. In terms of , , , , and , , matrix elements for HOMO-HOMO (H-H) are evaluated [36]. Here we show the real matrix Hamiltonian from , where a 8 × 8 matrix U has only the diagonal element given by Using , , and , Matrix elements are calculated as
for HOMO-HOMO elements,
for HOMO-LUMO elements,
for LUMO-LUMO elements, and . Note that matrix elements of HOMO-HOMO and LUMO-LUMO are the even function of while those of of HOMO-LUMO is the odd function due to the difference in the symmetry of HOMO and LUMO around the Pd atom. These parities are used for constructing 2 × 2 effective Hamiltonian, where the diagonal element show the even function and the off-diagonal element shows the odd function with respect to . These relations provide ingredients for obtaining a nodal line and Dirac points.

Table A1.
Matrix elements of Hamiltonian: .
References
- Seo, H.; Hotta, C.; Fukuyama, H. Toward Systematic Understanding of Diversity of Electronic Properties in Low-Dimensional Molecular Solids. Chem. Rev. 2004, 104, 5005–5035. [Google Scholar] [CrossRef] [PubMed]
- Herring, C. Accidental Degeneracy in the Energy Bands of Crystal. Phys. Rev. 1937, 52, 365–373. [Google Scholar] [CrossRef]
- Fu, L.; Kane, C.L. Topological insulators with inversion symmetry. Phys. Rev. B 2007, 76, 045302. [Google Scholar] [CrossRef] [Green Version]
- Novoselov, K.S.; Geim, A.K.; Morozov, S.V.; Jiang, D.; Katsnelson, M.I.; Grigorieva, I.V.; Dubonos, S.V.; Firsov, A.A. Two-dimensional gas of massless Dirac fermions in graphene. Nature 2005, 438, 197–200. [Google Scholar] [CrossRef] [PubMed]
- Katayama, S.; Kobayashi, A.; Suzumura, Y. Pressure-Induced Zero-Gap Semiconducting State in Organic Conductor α-(BEDT-TTF)2I3. J. Phys. Soc. Jpn. 2006, 75, 054705. [Google Scholar] [CrossRef] [Green Version]
- Kajita, K.; Nishio, Y.; Tajima, N.; Suzumura, Y.; Kobayashi, A. Molecular Dirac Fermion Systems—Theoretical and Experimental Approaches. J. Phys. Soc. Jpn. 2014, 83, 072002. [Google Scholar] [CrossRef]
- Murakami, S. Phase transition between the quantum spin Hall and insulator phases in 3D: Emergence of a topological gapless phase. N. J. Phys. 2007, 9, 356. [Google Scholar] [CrossRef]
- Hirayama, M.; Okugawa, R.; Murakami, S. Topological Semimetals Studied by Ab Initio Calculations. J. Phys. Soc. Jpn. 2018, 87, 041002. [Google Scholar] [CrossRef] [Green Version]
- Bernevig, A.; Weng, H.; Fang, Z.; Dai, X. Recent Progress in the Study of Topological Semimetals. J. Phys. Soc. Jpn. 2018, 87, 041001. [Google Scholar] [CrossRef]
- Kato, R.; Cui, H.B.; Tsumuraya, T.; Miyazaki, T.; Suzumura, Y. Emergence of the Dirac Electron System in a Single-Component Molecular Conductor under High Pressure. J. Am. Chem. Soc. 2017, 139, 1770–1773. [Google Scholar] [CrossRef]
- Kondo, R.; Kagoshima, S.; Harada, J. Crystal structure analysis under uniaxial strain at low temperature using a unique design of four-axis X-ray diffractometer with a fixed sample. Rev. Sci. Instrum. 2005, 76, 093902. [Google Scholar] [CrossRef]
- Mori, T.; Kobayashi, A.; Sasaki, Y.; Koybayashi, H.; Saito, G.; Inokuchi, H. The Intermolecular Interaction of Tetrathiafulvalene and Bis(ethylenedithio)-tetrathiafulvalene in Organic Metals. Calculation of Orbital Overlaps and Model of Energy-band Structures. Bull. Chem. Soc. Jpn. 1984, 57, 627. [Google Scholar] [CrossRef]
- Kino, H.; Fukuyama, H. Phase Diagram of Two-Dimensional Organic Conductors: (BEDT-TTF)2X. J. Phys. Soc. Jpn. 1996, 65, 2158–2169. [Google Scholar] [CrossRef]
- Kobayashi, A.; Suzumura, Y.; Fukuyama, H. Hall Effect and Orbital Diamagnetism in Zerogap State of Molecular Conductor α-(BEDT-TTF)2I3. J. Phys. Soc. Jpn. 2008, 77, 064718. [Google Scholar] [CrossRef]
- Tajima, N.; Kato, R.; Sugawara, S.; Nishio, Y.; Kajita, K. Interband effects of magnetic field on Hall conductivity in the multilayered massless Dirac fermion system α-(BEDT-TTF)2I3. Phys. Rev. B 2012, 85, 033401. [Google Scholar] [CrossRef] [Green Version]
- Katayama, S.; Kobayashi, A.; Suzumura, Y. Electronic properties close to Dirac cone in two-dimensional organic conductor α-(BEDT-TTF)2I3. Eur. Phys. J. B 2009, 67, 139–148. [Google Scholar] [CrossRef]
- Takano, Y.; Hiraki, K.; Takada, Y.; Yamamoto, H.M.; Takahashi, T. Local Spin Susceptibility Characteristic of Zero-Gap State of α-(BEDT-TTF)2I3 under Pressure. J. Phys. Soc. Jpn. 2010, 79, 104704. [Google Scholar] [CrossRef]
- Hirata, M.; Ishikawa1, K.; Miyagawa1, K.; Tamura, M.; Berthier, C.; Basko, D.; Kobayashi, A.; Matsuno, G.; Kanoda, K. Observation of an anisotropic Dirac cone reshaping and ferrimagnetic spin polarization in an organic conductor. Nat. Commun. 2016, 7, 12666. [Google Scholar] [CrossRef] [Green Version]
- Suzumura, Y.; Proskurin, I.; Ogata, M. Effect of Tilting on the In-Plane Conductivity of Dirac Electrons in Organic Conductor. J. Phys. Soc. Jpn. 2014, 83, 023701. [Google Scholar] [CrossRef]
- Proskurin, I.; Ogata, M. Thermoelectric Transport Coefficients for Massless Dirac Electrons in Quantum Limit. J. Phys. Soc. Jpn. 2013, 82, 063712. [Google Scholar] [CrossRef] [Green Version]
- Cui, H.; Brooks, J.S.; Kobayashi, A.; Kobayashi, H. Metallization of the single component molecular semiconductor [Ni(ptdt)2] under very high pressure. J. Am. Chem. Soc. 2009, 131, 6358–6359. [Google Scholar]
- Souto, M.; Cui, H.B.; Pena-Alvarez, M.; Baonza, V.G.; Jeschke, H.O.; Tomic, M.; Valenti, R.; Blasi, D.; Ratera, I.; Rovira, C.; et al. Pressure-Induced Conductivity in a Neutral Nonplanar Spin-Localized Radical. J. Am. Chem. Soc. 2016, 138, 11517–11525. [Google Scholar] [PubMed] [Green Version]
- Souto, M.; Gullo, M.C.; Cui, H.B.; Casati, N.; Montisci, F.; Jeschke, H.O.; Valenti, R.; Ratera, I.; Rovira, C.; Veciana, J. Role of the Open-Shell Character on the Pressure-Induced Conductivity of an Organic Donor-Acceptor Radical Dyad. Chem. Eur. J. 2018, 24, 5500–5505. [Google Scholar] [PubMed]
- Mailman, A.; Wong, J.W.L.; Winter, S.M.; Claridge, R.C.M.; Robertson, C.M.; Assoud, A.; Yong, W.; Steven, E.; Dube, P.A.; Tse, J.S.; et al. Fine Tuning the Performance of Multiorbital Radical Conductors by Substituent Effects. J. Am. Chem. Soc. 2017, 139, 1625–1635. [Google Scholar]
- Tian, D.; Winter, S.M.; Mailman, A.; Wong, J.W.L.; Yong, W.; Yamaguchi, H.; Jia, Y.; Tse, J.S.; Desgreniers, S.; Secco, R.A.; et al. The Metallic State in Neutral Radical Conductors: Dimensionality, Pressure and Multiple Orbital Effects. J. Am. Chem. Soc. 2015, 137, 14136–14148. [Google Scholar] [PubMed] [Green Version]
- Cui, H.B.; Tsumuraya, T.; Kawasugi, Y.; Kato, R. Pressure Induced Superconductivity and Dirac Cone Formation in Single-Component Molecular Conductors. In Proceedings of the 17th International Conference on High Pressure in Semiconductor Physics (HPSP-17), Tokyo, Japan, 7–11 August 2016. [Google Scholar]
- Tsumuraya, T.; Cui, H.B.; Miyazaki, T.; Okano, Y.; Kato, R. Pressure-Induced Metallic Conductivity in the Single-Component Molecular Crystal [Ni(dmit)2]. Eur. J. Inorg. Chem. 2014, 24, 3837–3840. [Google Scholar]
- Kato, R.; Suzumura, Y. Novel Dirac Electron in Single-Component Molecular Conductor [Pd(dddt)2] (dddt = 5,6-dihydro-1,4-dithiin-2,3-dithiolate). J. Phys. Soc. Jpn. 2017, 86, 064705. [Google Scholar]
- Liu, Z.; Wang, H.; Wang, Z.F.; Yang, J.; Liu, F. Pressure-induced organic topological nodal-line semimetal in the three-dimensional molecular crystal Pd(dddt)2. Phys. Rev. B 2018, 97, 155138. [Google Scholar]
- Tsumuraya, T.; Kato, R.; Suzumura, Y. Effective Hamiltonian of Topological Nodal Line Semimetal in Single-Component Molecular Conductor [Pd(dddt)2] from First-Principles. J. Phys. Soc. Jpn. 2018, 87, 113701. [Google Scholar]
- Katayama, S.; Kobayashi, A.; Suzumura, Y. Electric Conductivity of the Zero-Gap Semiconducting State in α-(BEDT-TTF)2I3 Salt. J. Phys. Soc. Jpn. 2006, 75, 023708. [Google Scholar]
- Tajima, N.; Sugawara, S.; Tamura, M.; Kato, R.; Nishio, Y.; Kajita, K. Transport properties of massless Dirac fermions in an organic conductor α-(BEDT-TTF)2I3 under pressure. EPL 2007, 80, 47002. [Google Scholar] [CrossRef]
- Suzumura, Y.; Oagata, M. Role of acoustic phonons in exotic conductivity of two-dimensional Dirac electrons. Phys. Rev. B 2018, 98, 161205. [Google Scholar] [CrossRef] [Green Version]
- Suzumura, Y. Anisotropic Conductivity of Nodal Line Semimetal in Single-Component Molecular Conductor [Pd(dddt)2]. J. Phys. Soc. Jpn. 2017, 86, 124710. [Google Scholar] [CrossRef] [Green Version]
- Suzumura, Y.; Cui, H.B.; Kato, R. Conductivity and Resistivity of Dirac Electrons in Single-Component Molecular Conductor [Pd(dddt)2]. J. Phys. Soc. Jpn. 2018, 87, 084702. [Google Scholar] [CrossRef] [Green Version]
- Kato, R.; Yeung, H.H.-M.; Cui, H.B.; Minamidate, T.; Suzumura, Y. Electronic Structure of a Single-Component Molecular Conductor [Pd(dddt)2] (dddt = 5,6-dihydro-1,4-dithiin-2,3-dithiolate) under High Pressure. arXiv 2020, arXiv:2008.09277. [Google Scholar]
- Fröhlich, H. On the theory of superconductivity: The one-dimensional case. Proc. Phys. Soc. A 1954, 223, 296–305. [Google Scholar]
- Holstein, T. Theory of Transport Phenomena in an Electron-Phonon Gas. Ann. Phys. 1964, 29, 410–535. [Google Scholar] [CrossRef]
- Abrikosov, A.A.; Gorkov, L.P.; Dzyaloshinskii, I.E. Methods of Quantum Field Theory in Statistical Physics; Prentice-Hall: Englewood Cliffs, NJ, USA, 1963. [Google Scholar]
- Cui, H.B.; Yeung, H.H.-M.; Kawasugi, Y.; Minamidate, T.; Warren, M.R.; Kato, R. High Pressure Crystal Structure and Unusual Magnetoresistance of a Single-component Molecular conductor [Pd(dddt)2] (dddt = 5,6-dihydro-1,4-dithiin-2,3-dithiolate). 2020, submitted. 2020. submitted. [Google Scholar]
- Sarma, S.D.; Adam, S.; Hwang, E.H.; Rossi, E. Electronic transport in two-dimensional graphene. Rev. Mod. Phys. 2011, 83, 407–470. [Google Scholar] [CrossRef] [Green Version]
Figure 1.
(Color online) Crystal structure of [Pd(dddt)] shown in the plane, where the molecule is stacked along the b direction perpendicular to the plane. Layer 1 (molecules 1 and 3) and Layer 2 (molecules 2 and 4) are parallel to the plane and alternated along the c direction. Lattice vectors , , and form a new unit cell, where is introduced for the simple representation of the energy band (see the main body). The location of the Pd atom in the unit cell is given by (x,y,z) = (0,0,0), (1/2,1/2,1/2),(1/2,1/2,0) and (1/2,0,1/2) for molecules 1, 2, 3, and 4, respectively. The right figure denotes the Fourier space, where and are reciprocal lattice vectors and , X, Y, and M are TRIM (time reversal invariant momentum).

Figure 2.
(Color online) (a) Nodal line in the three-dimensional momentum space, which connects Dirac points (symbols). (b) Density of states (DOS), as a function of with = = 0.5053 eV. The inset denotes the behavior close to , where A (B) corresponds to = 0 ( the maximum of in the loop.
Figure 2.
(Color online) (a) Nodal line in the three-dimensional momentum space, which connects Dirac points (symbols). (b) Density of states (DOS), as a function of with = = 0.5053 eV. The inset denotes the behavior close to , where A (B) corresponds to = 0 ( the maximum of in the loop.

Figure 3.
(Color online) Temperature dependence of conductivity of (, and z) with , where R = 0. The dot-dashed line denotes , which is calculated with the fixed = 0.5053 eV. The inset denotes temperature dependence of .
Figure 3.
(Color online) Temperature dependence of conductivity of (, and z) with , where R = 0. The dot-dashed line denotes , which is calculated with the fixed = 0.5053 eV. The inset denotes temperature dependence of .

Figure 4.
(Color online) T dependence of with for R = 0, 0.4, 1, 2, and 4 (solid line). The dot line denotes a fitting one obtained from Equation (17). The dot-dashed line denotes obtained for the fixed , where the deviation from the solid line starts at lower T for the larger R. The inset denotes T dependence of obtained from Equation (19) with a fitted line for R = 0.5, 1, and 4.

Figure 5.
(Color online) T dependence of with for R = 0, 0.12, 0.24, 0.6, 1.2, and 2.4 (solid line). The dot line denotes a fitting one obtained from Equation (17). The symbols in the inset denotes obtained from Equation (18b), which are fitted by the dot line.

Figure 6.
T dependence of , for = 3, 4, 5, 6, 7, and 10 with fixed R = 2.

Figure 7.
(Color online) T dependence of normalized by the value at T = 0.015 eV (174 K) in the interval range of 0.0005 eV 0.015 eV. The quantities and denote the normalized resistivity at P = 12.6 GPa [10] and 13 GPa [40] respectively, which are compared with those of = and . The line (4, 1.6) stays almost constant at high temperature.

Table 1.
Transfer energies for P = 5.9GPa [36] which are multiplied by eV. The energy difference between the HOMO and LUMO is taken as = 0.696 eV.
Table 1.
Transfer energies for P = 5.9GPa [36] which are multiplied by eV. The energy difference between the HOMO and LUMO is taken as = 0.696 eV.
| (stacking) | ||||
| Layer 1 | ||||
| — | — | |||
| (stacking) | ||||
| Layer 2 | ||||
| — | — | |||
| Interlayer | ||||
© 2020 by the authors. Licensee MDPI, Basel, Switzerland. This article is an open access article distributed under the terms and conditions of the Creative Commons Attribution (CC BY) license (http://creativecommons.org/licenses/by/4.0/).
Share and Cite
MDPI and ACS Style
Suzumura, Y.; Kato, R.; Ogata, M. Electric Transport of Nodal Line Semimetals in Single-Component Molecular Conductors. Crystals 2020, 10, 862. https://0-doi-org.brum.beds.ac.uk/10.3390/cryst10100862
AMA Style
Suzumura Y, Kato R, Ogata M. Electric Transport of Nodal Line Semimetals in Single-Component Molecular Conductors. Crystals. 2020; 10(10):862. https://0-doi-org.brum.beds.ac.uk/10.3390/cryst10100862
Chicago/Turabian StyleSuzumura, Yoshikazu, Reizo Kato, and Masao Ogata. 2020. "Electric Transport of Nodal Line Semimetals in Single-Component Molecular Conductors" Crystals 10, no. 10: 862. https://0-doi-org.brum.beds.ac.uk/10.3390/cryst10100862
Note that from the first issue of 2016, this journal uses article numbers instead of page numbers. See further details here.