Cationically Modified Nanocrystalline Cellulose/Carboxyl-Functionalized Graphene Quantum Dots Nanocomposite Thin Film: Characterization and Potential Sensing Application

 ,
, 
Abstract
:1. Introduction
2. Materials and Methods
2.1. Reagent and Materials
2.2. Preparation of Chemicals
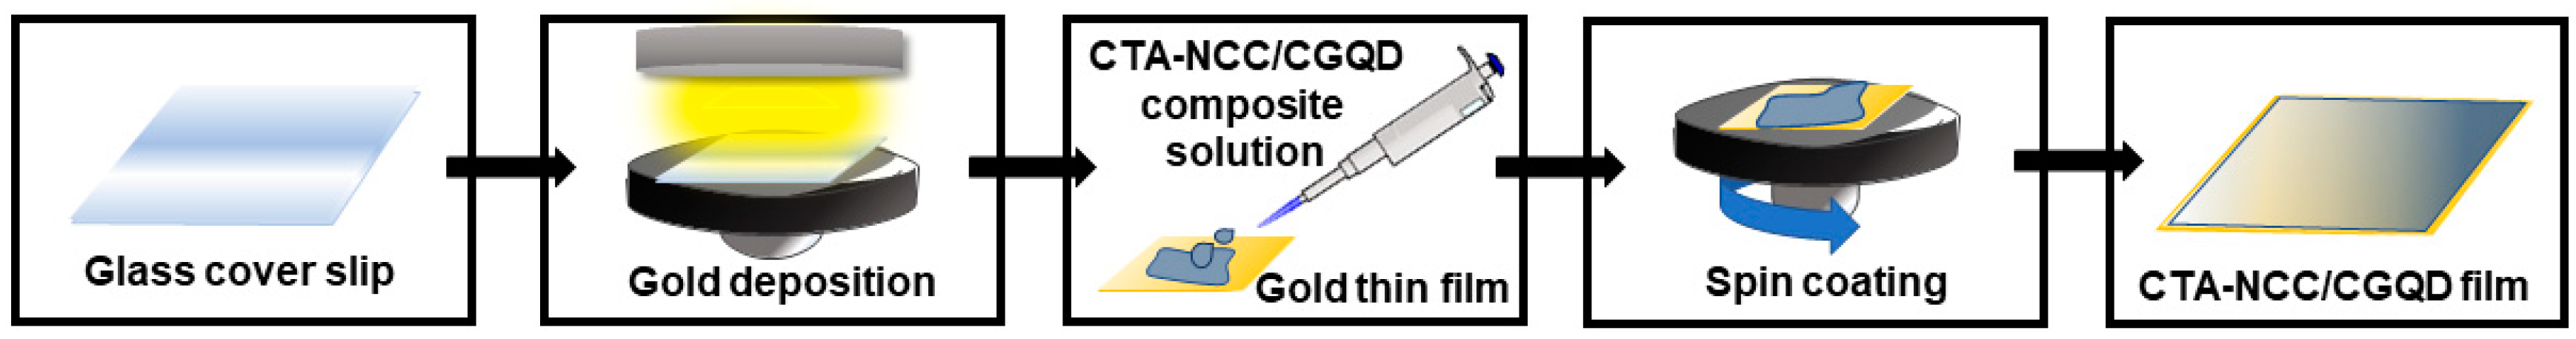
2.3. Preparation of CTA-NCC/CGQD Nanocomposite Thin Film
2.4. Characterization Instrument
2.5. Surface Plasmon Resonance
3. Results
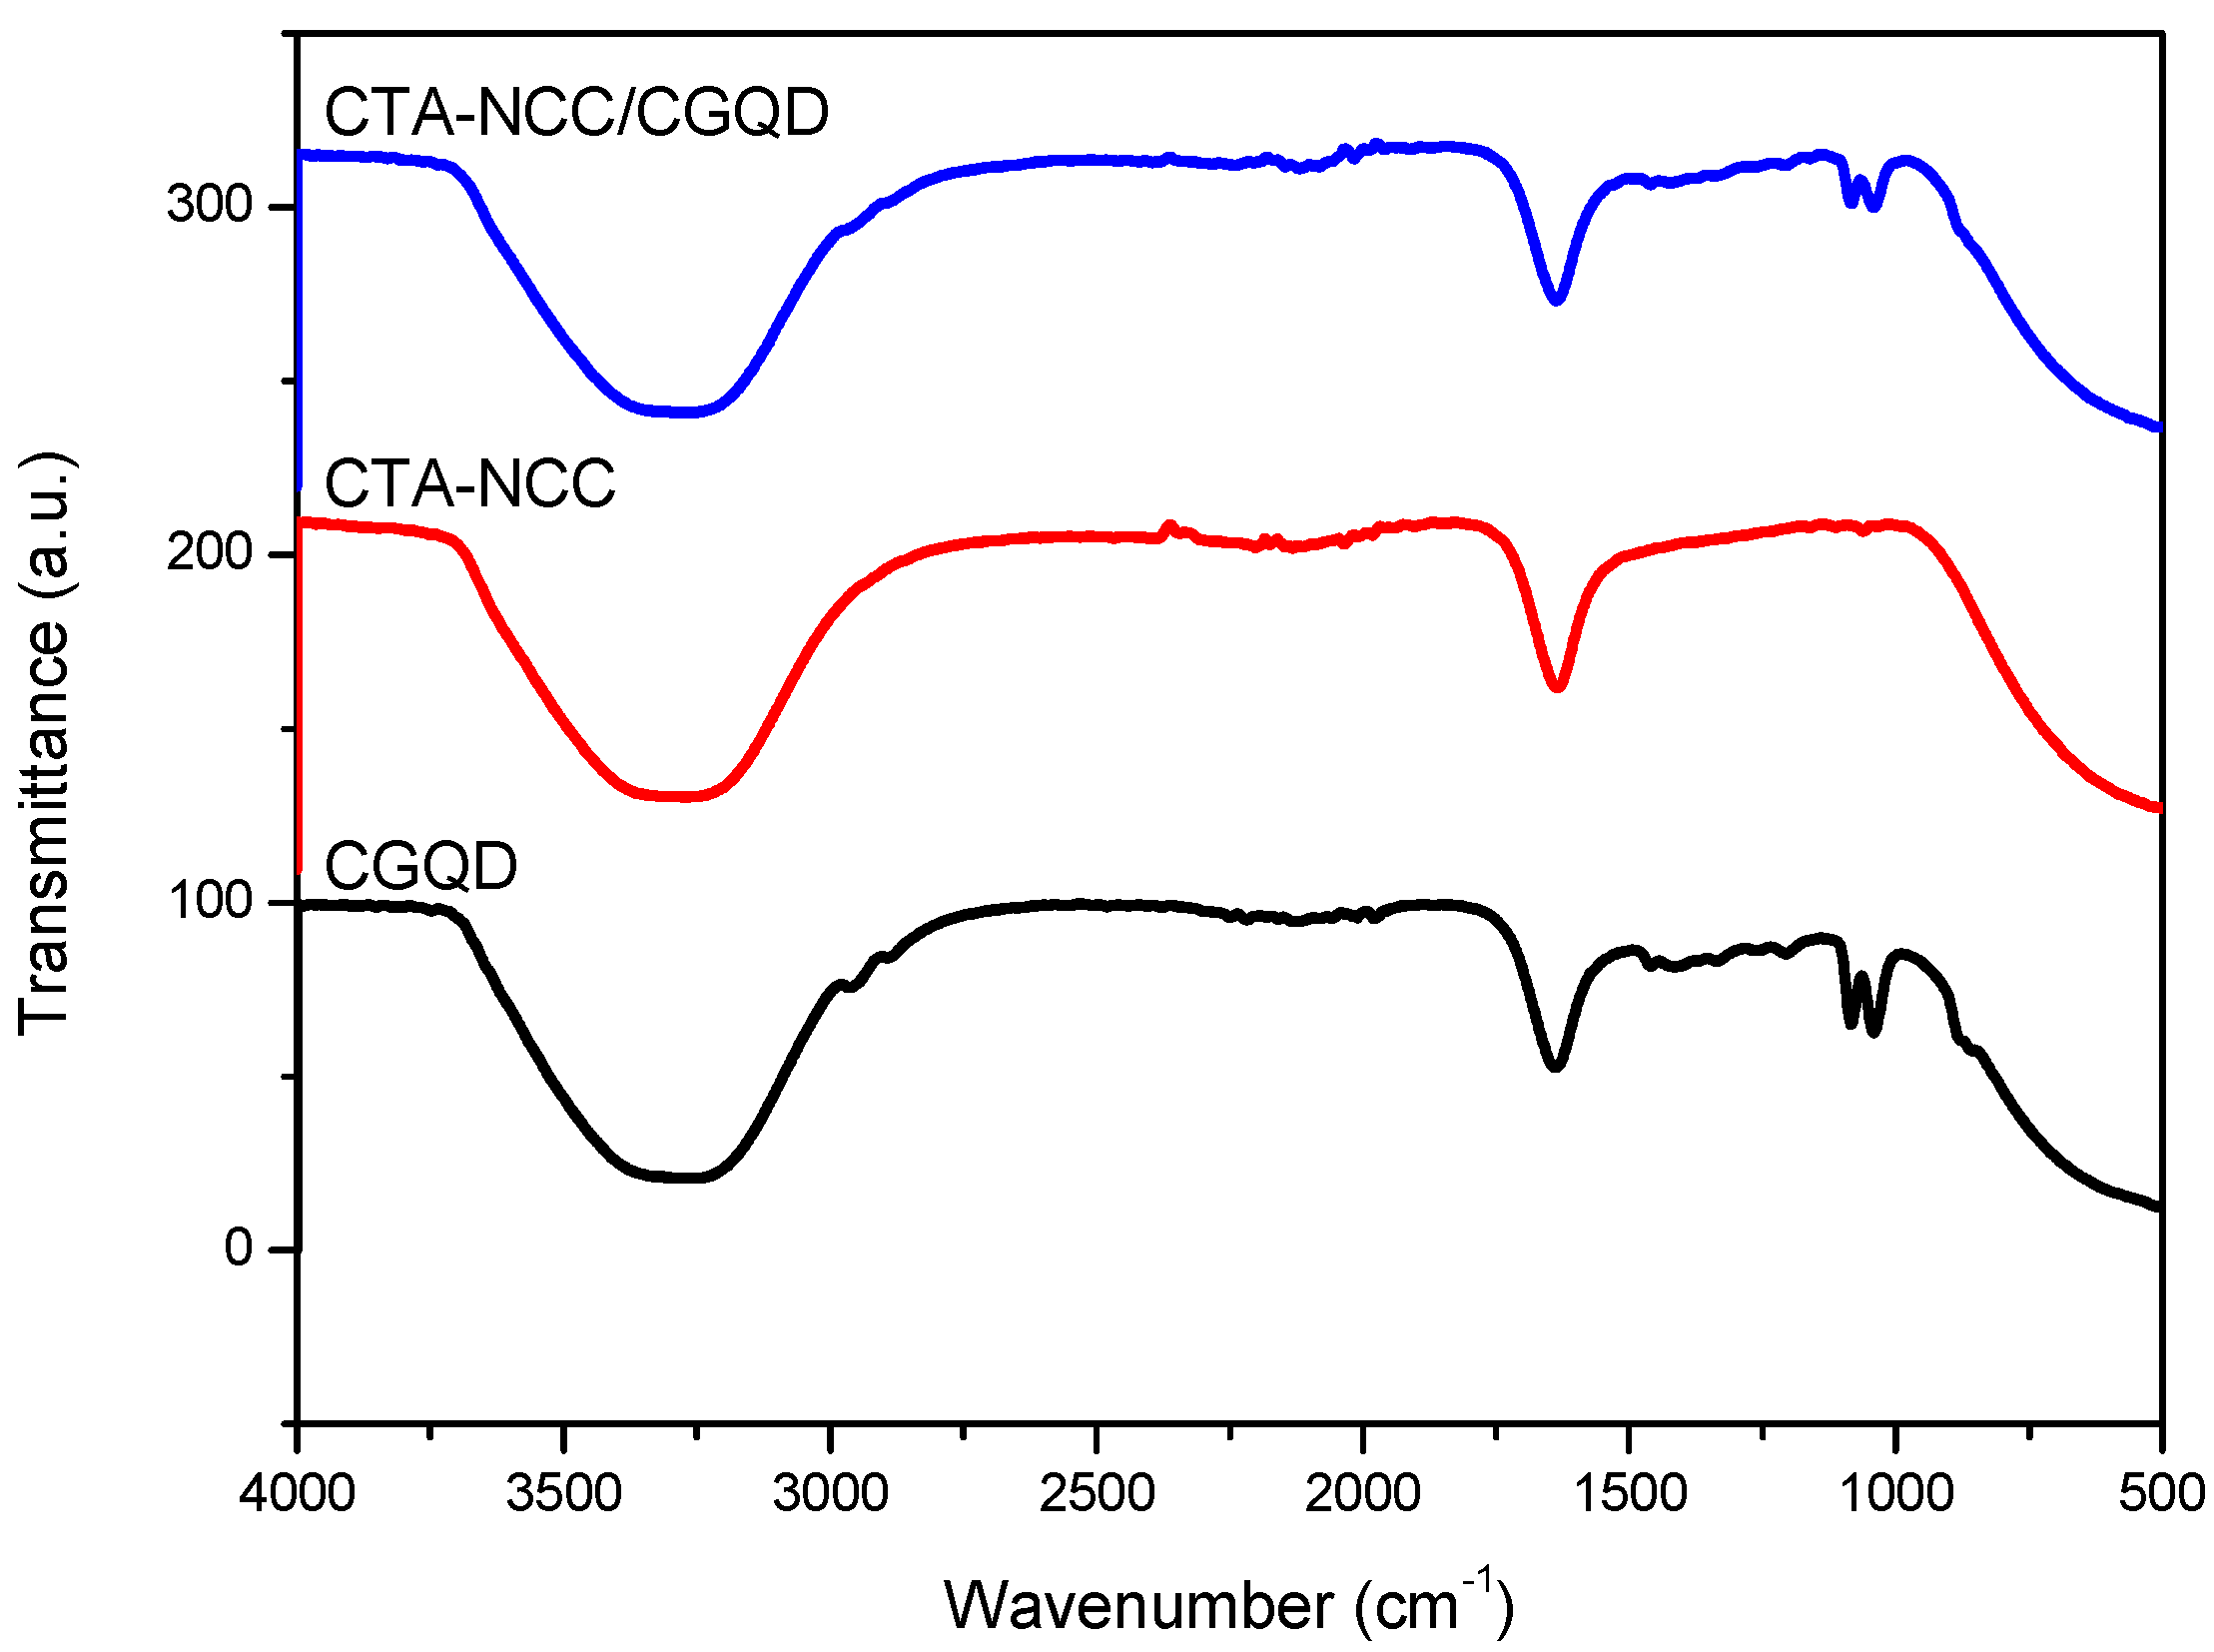
3.1. FTIR Analysis
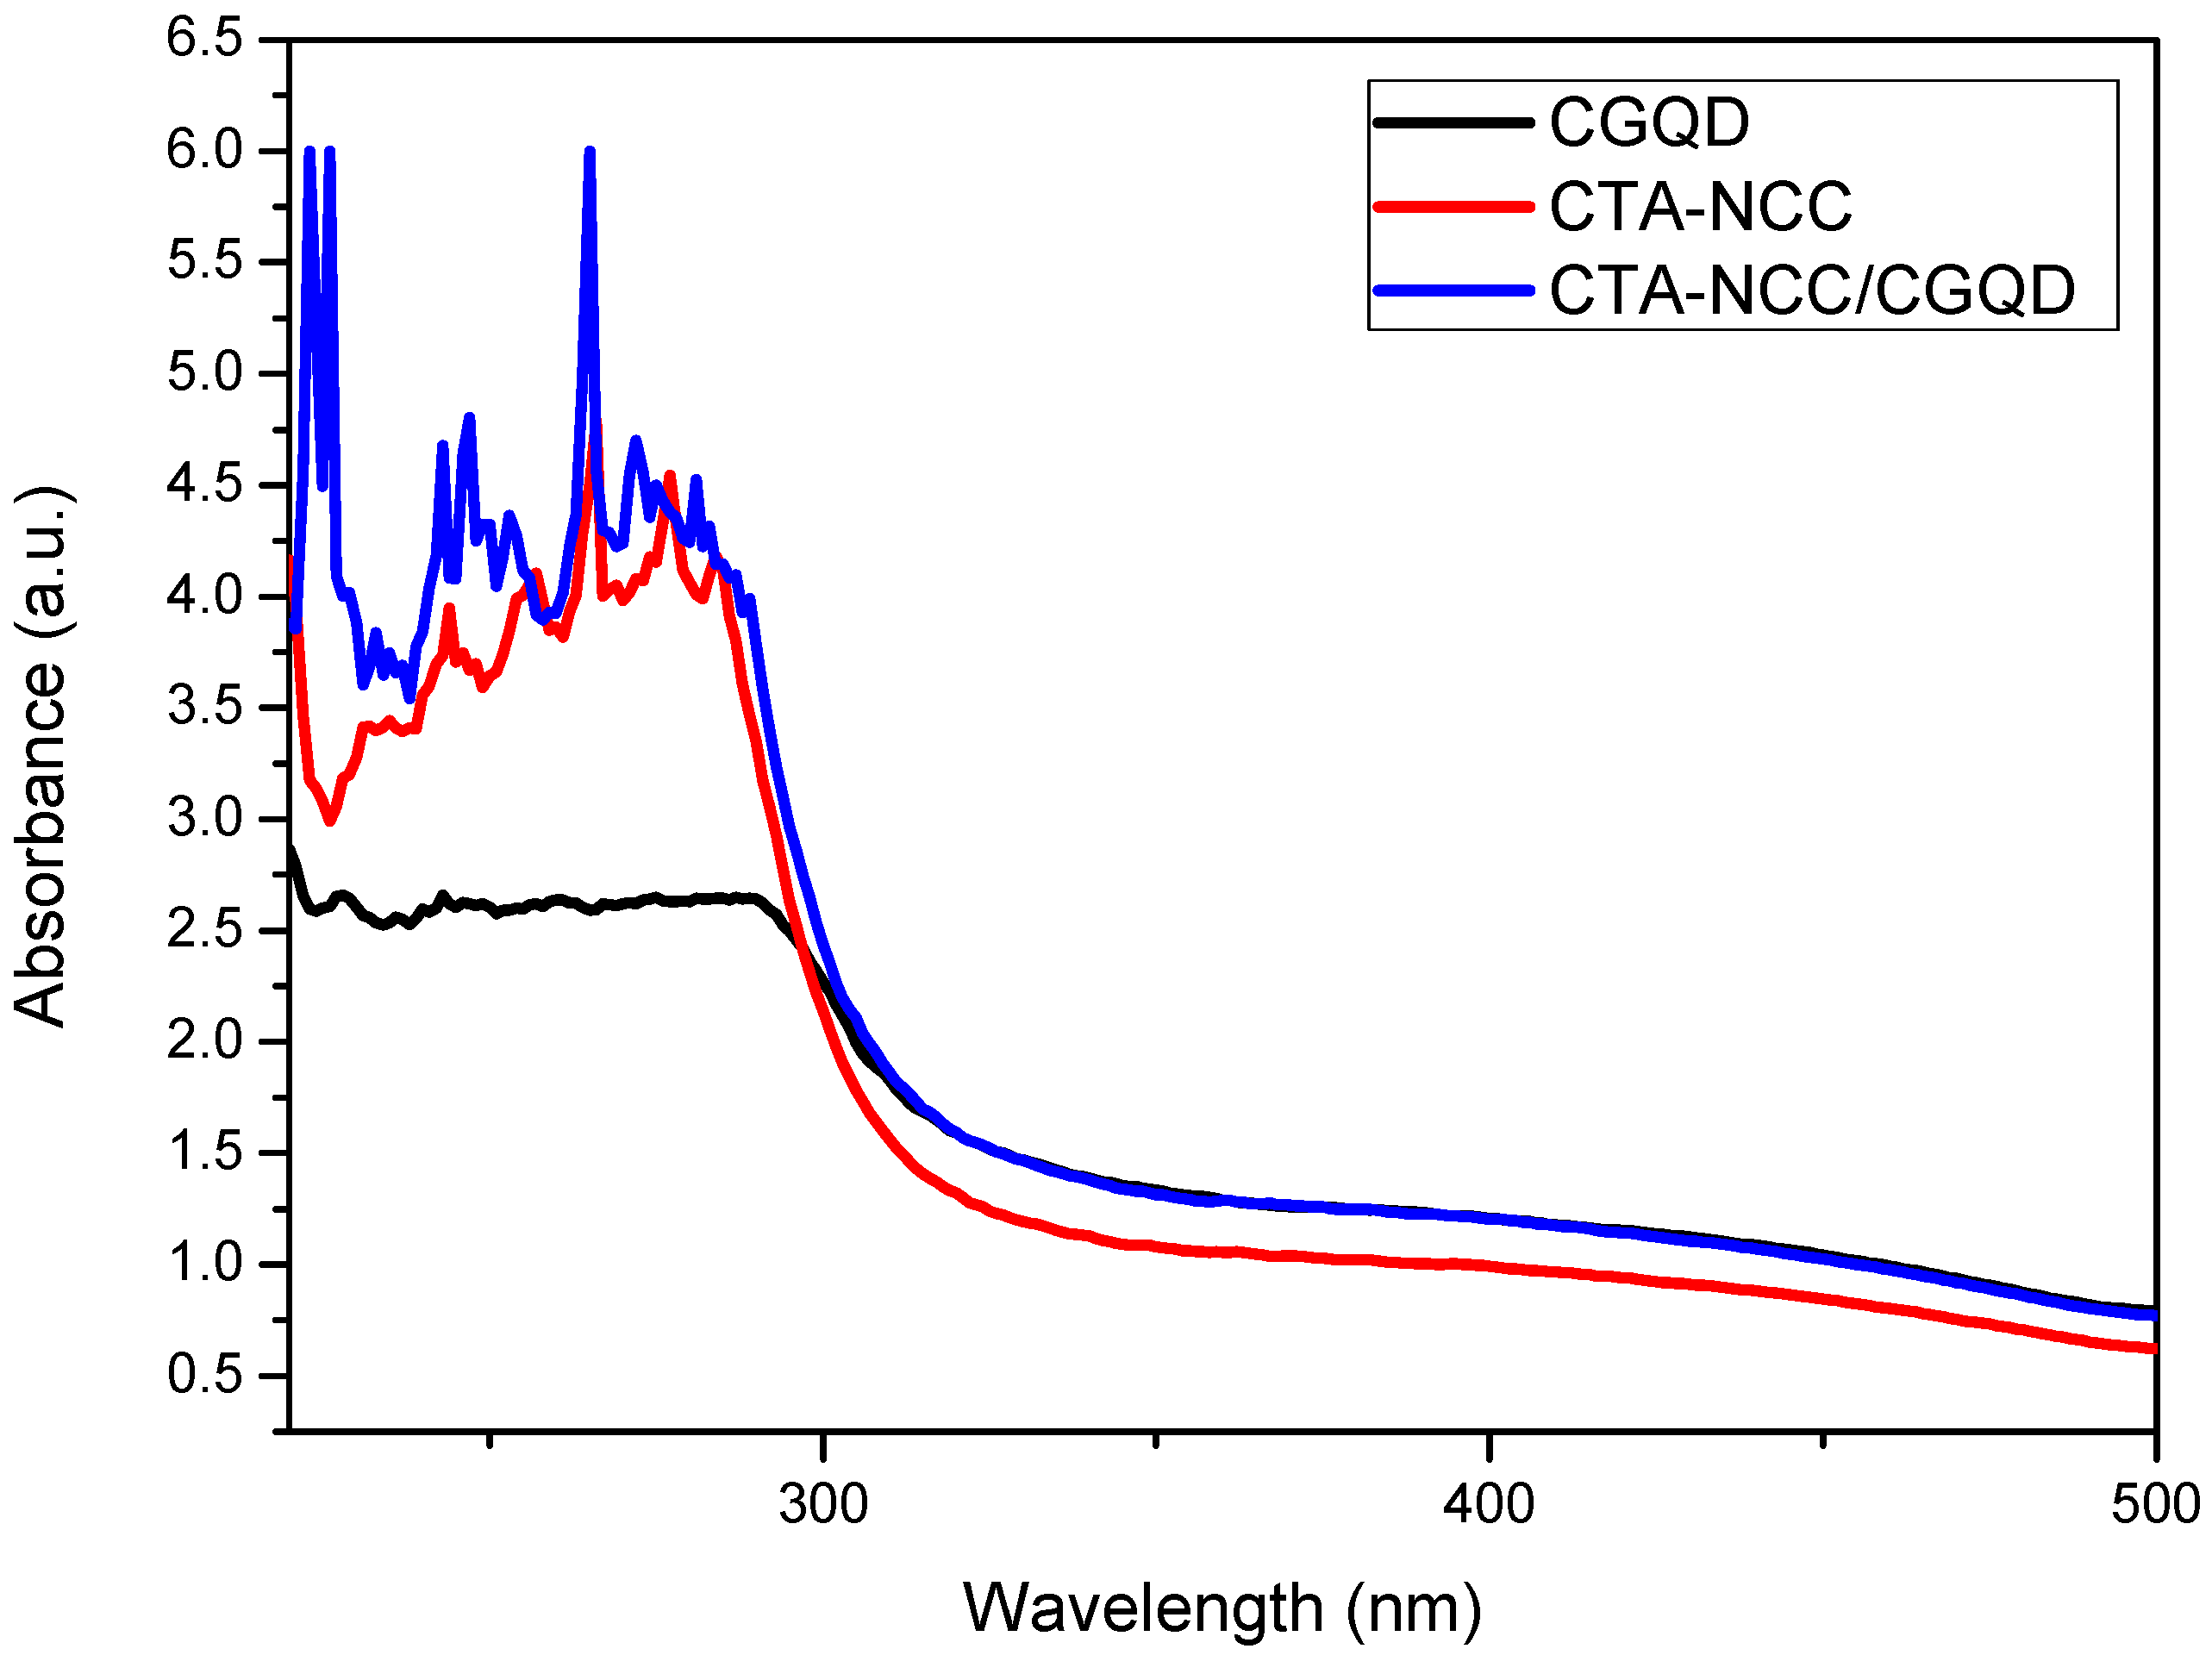
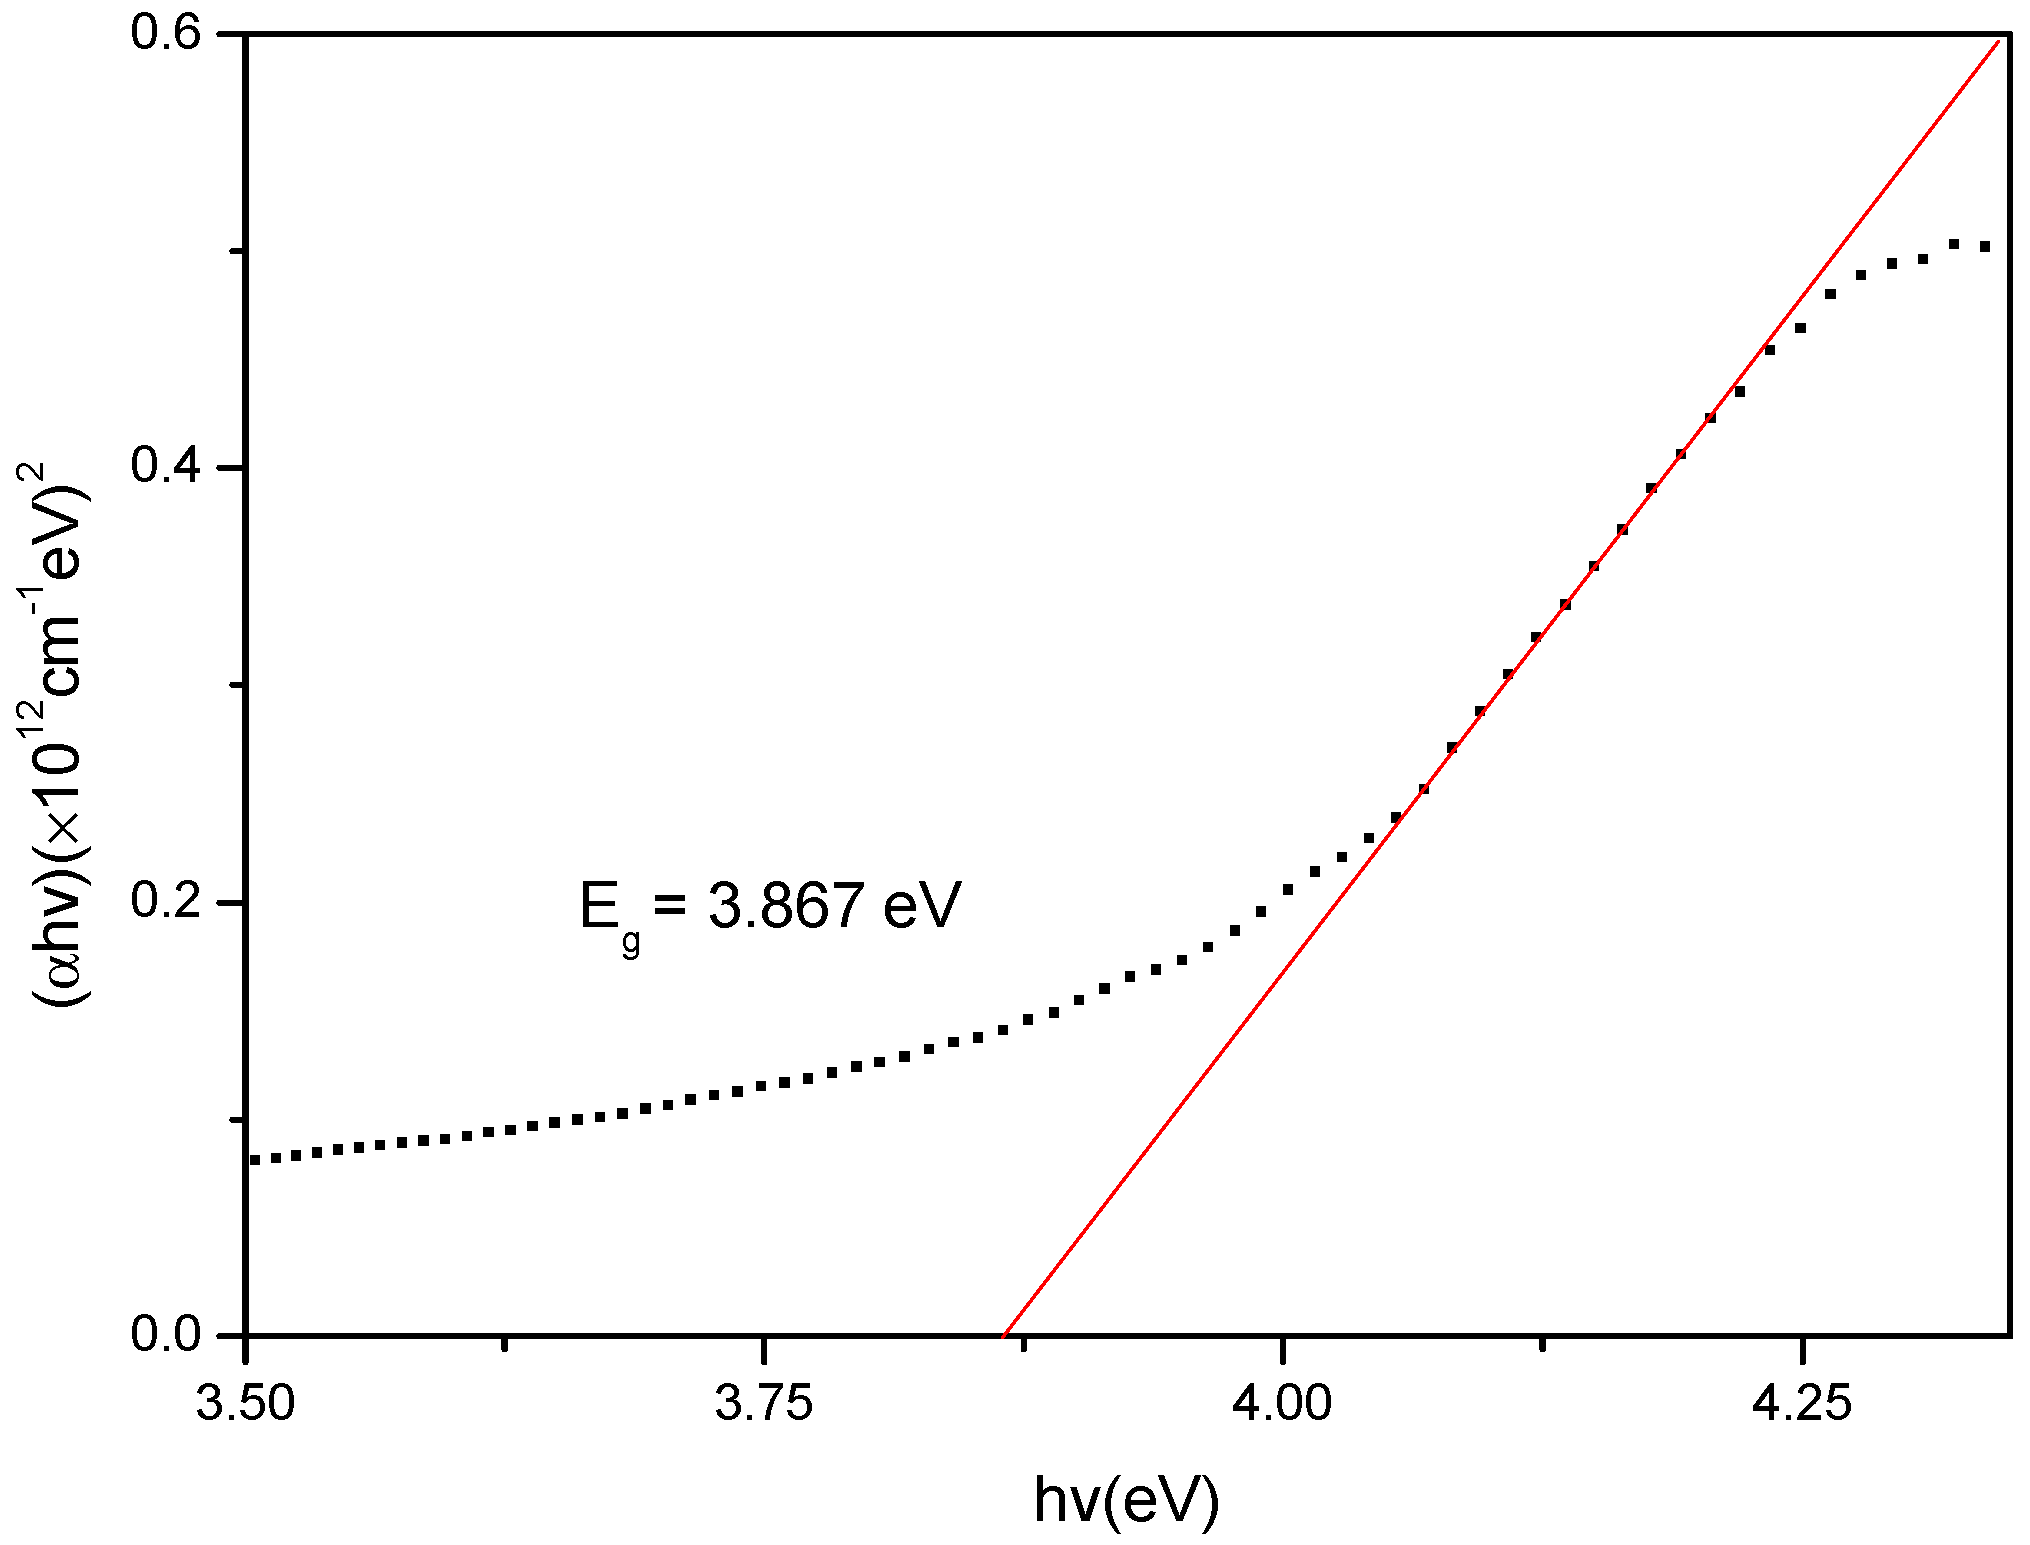
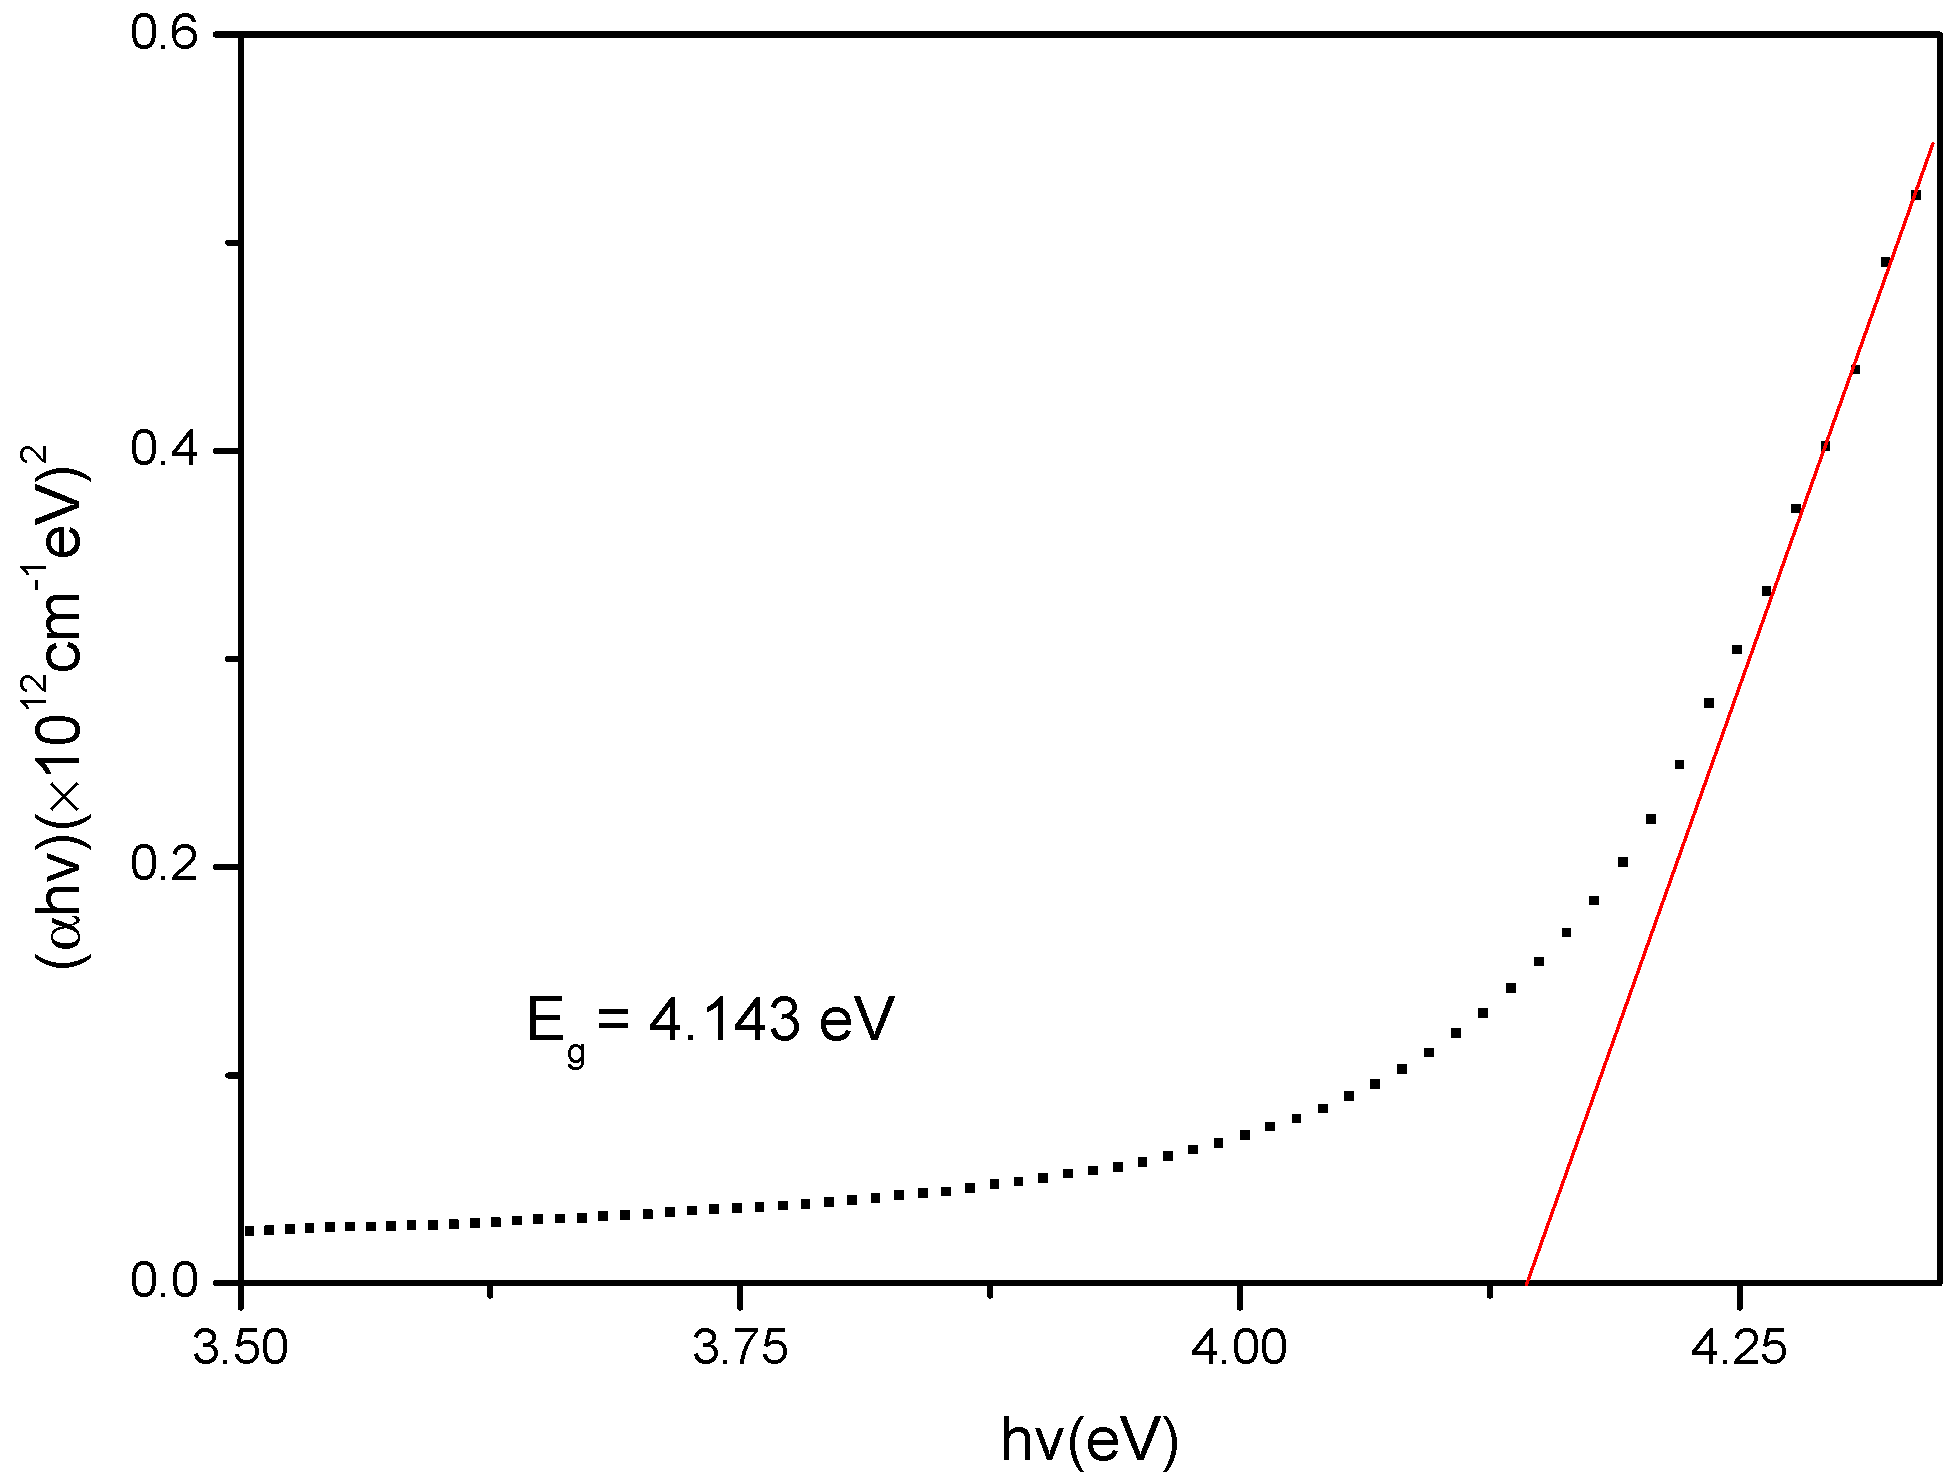
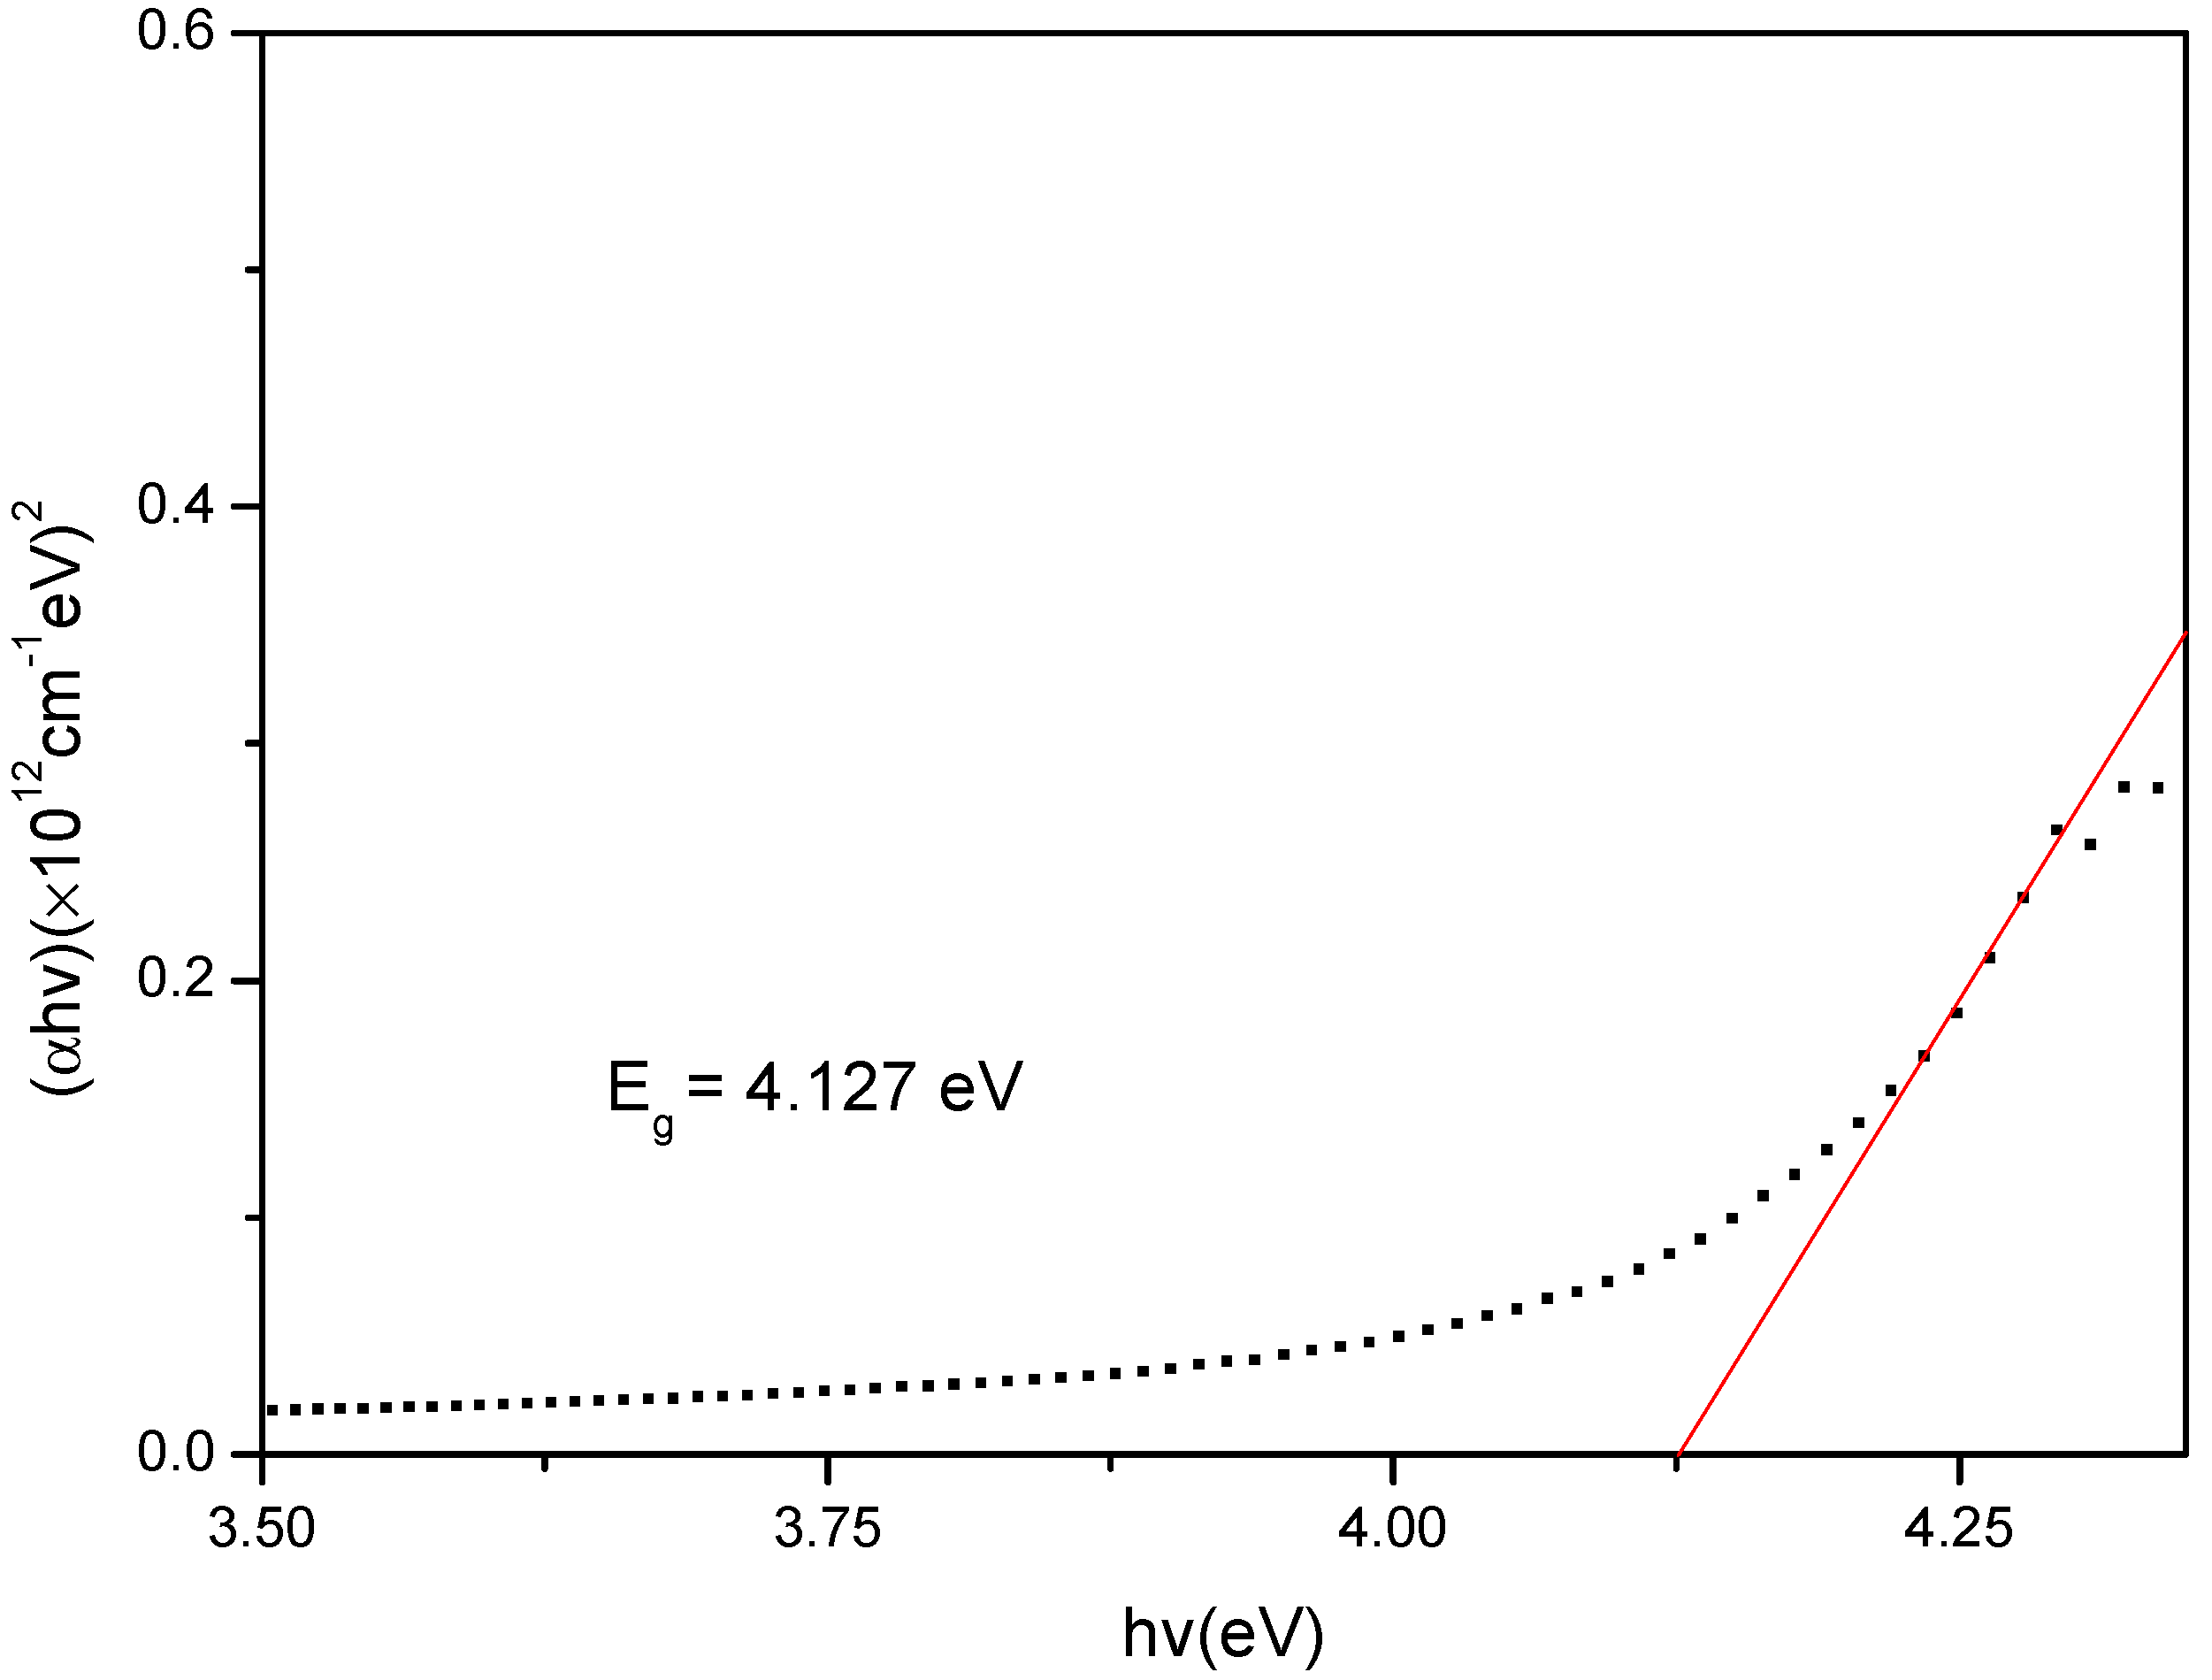
3.2. Optical Studies
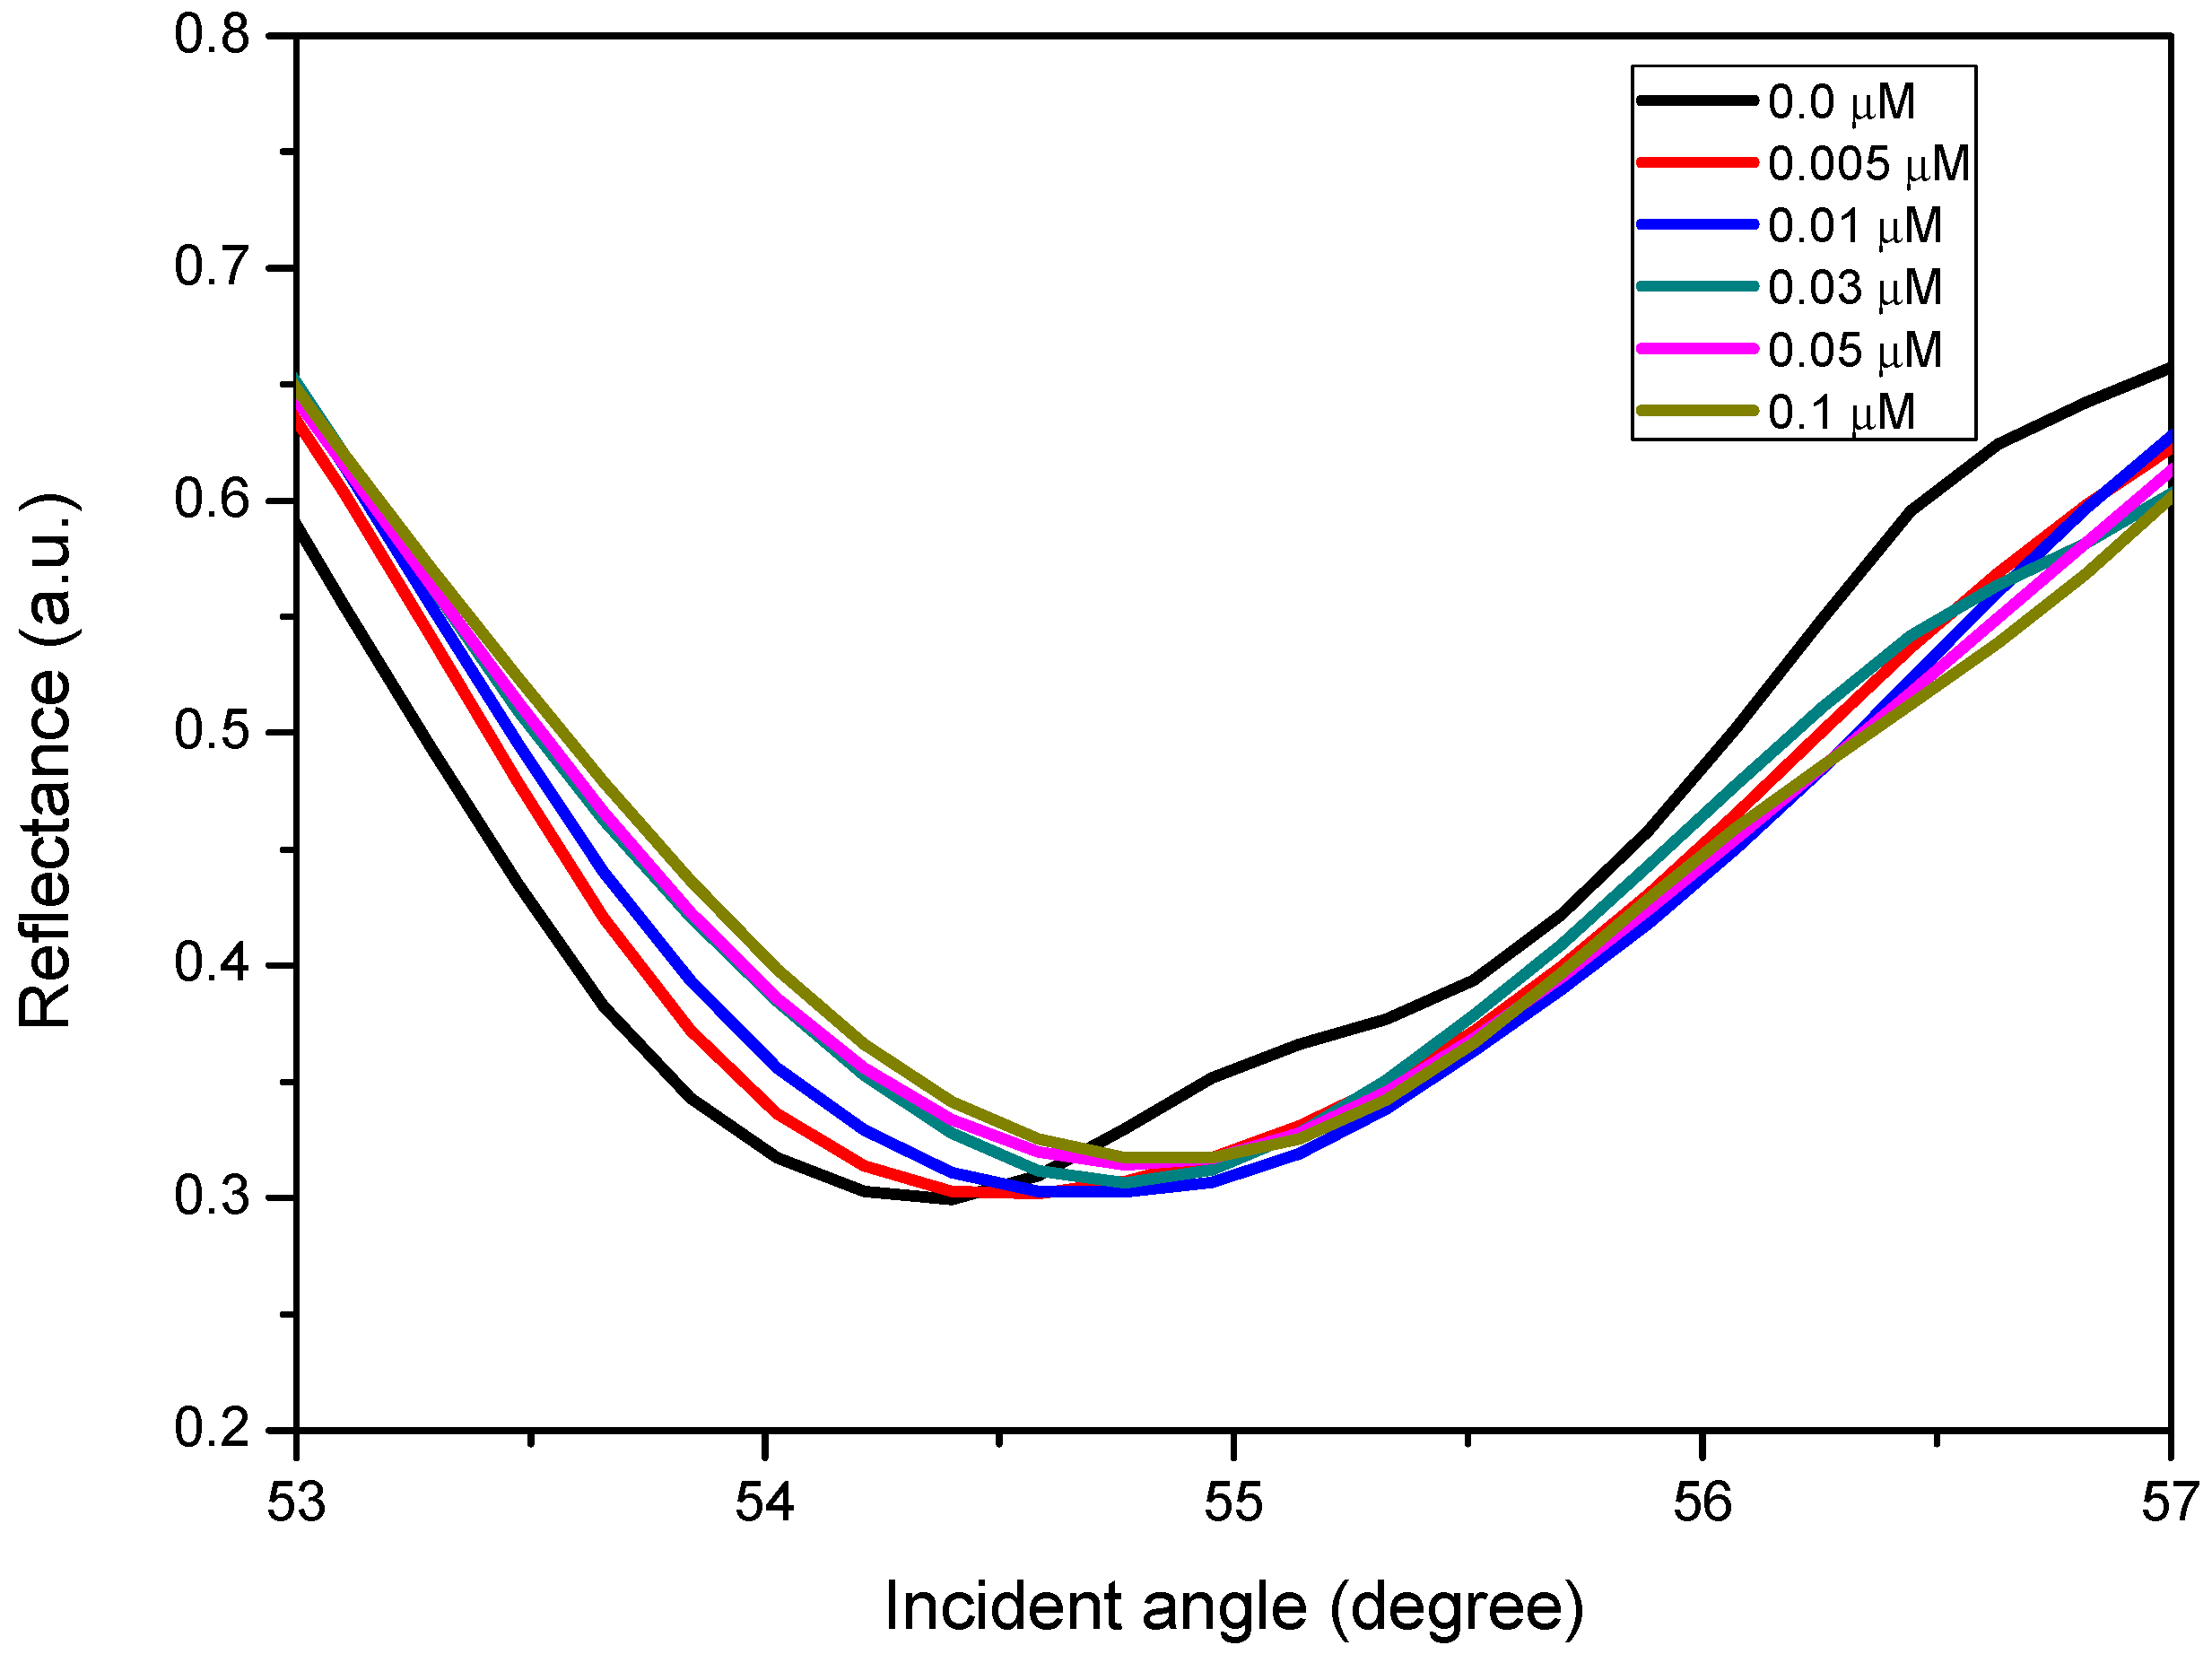
3.3. Potential Sensing Analysis
4. Conclusions
Author Contributions
Funding
Acknowledgments
Conflicts of Interest
References
- Azrinaa, Z.A.Z.; Beg, M.D.H.; Rosli, M.Y.; Ramli, R.; Junadi, N.; Alam, A.K.M.M. Spherical nanocrystalline cellulose (NCC) from oil palm empty fruitbunch pulp via ultrasound assisted hydrolysis. Carbohydr. Polym. 2017, 162, 115–120. [Google Scholar] [CrossRef] [PubMed]
- Daniyal, W.M.E.M.M.; Fen, Y.W.; Abdullah, J.; Sadrolhosseini, A.R.; Saleviter, S.; Omar, N.A.S. Exploration of surface plasmon resonance for sensing copper ion based on nanocrystalline cellulose-modified thin film. Opt. Express 2018, 26, 34880–34893. [Google Scholar] [CrossRef] [PubMed]
- Junior, E.A.P.; Dávila, J.L.; d’Ávila, M.A. Rheological studies on nanocrystalline cellulose/alginate suspensions. J. Mol. Liq. 2019, 277, 418–423. [Google Scholar]
- Kaboorani, A.; Riedl, B.; Blanchet, P.; Fellin, M.; Hosseinaei, O.; Wang, S. Nanocrystalline cellulose (NCC): A renewable nanomaterial for polyvinyl acetate (PVA) adhesive. Eur. Polym. J. 2012, 48, 1829–1837. [Google Scholar] [CrossRef]
- Sun, Y.; Liu, P.; Liu, Z. Catalytic conversion of carbohydrates to 5-hydroxymethylfurfuralfrom the waste liquid of acid hydrolysis NCC. Carbohydr. Polym. 2016, 142, 177–182. [Google Scholar] [CrossRef] [PubMed]
- Li, M.C.; Wu, Q.; Song, K.; Qing, Y.; Wu, Y. Cellulose nanoparticles as modifiers for rheology and fluid loss in bentonite water-based fluids. ACS Appl. Mater. Interfaces 2015, 7, 5006–5016. [Google Scholar] [CrossRef]
- Taheri, A.; Mohammadi, M. The use of cellulose nanocrystals for potential application in topical delivery of hydroquinone. Chem. Biol. Drug Des. 2015, 86, 102–106. [Google Scholar] [CrossRef]
- Yang, Y.; Chen, Z.; Zhang, J.; Wang, G.; Zhang, R.; Suo, D. Preparation and Applications of the Cellulose Nanocrystal. Int. J. Polym. Sci. 2019, 2019, 1767028. [Google Scholar] [CrossRef]
- Daniyal, W.M.E.M.M.; Fen, Y.W.; Anas, N.A.A.; Omar, N.A.S.; Ramdzan, N.S.M.; Nakajima, H.; Mahdi, M.A. Enhancing the sensitivity of a surface plasmon resonance-based optical sensor for zinc ion detection by the modification of a gold thin film. RSC Adv. 2019, 9, 41729–41736. [Google Scholar] [CrossRef] [Green Version]
- Salajková, M.; Berglund, L.A.; Zhou, Q. Hydrophobic cellulose nanocrystals modified with quaternary ammonium salts. J. Mater. Chem. 2012, 22, 19798–19805. [Google Scholar] [CrossRef]
- Grunert, M.; Winter, W.T. Nanocomposites of cellulose acetate butyrate reinforced with cellulose nanocrystals. J. Polym. Environ. 2002, 10, 27–30. [Google Scholar] [CrossRef]
- Abitbol, T.; Marway, H.; Cranston, E.D. Surface modification of cellulose nanocrystals with cetyltrimethylammonium bromide. Nord. Pulp Pap. Res. J. 2014, 29, 7764–7779. [Google Scholar] [CrossRef]
- Mao, Y.; Fan, Q.; Li, J.; Yu, L.; Qu, L.-B. A novel and green CTAB-functionalized graphene nanosheets electrochemical sensor for Sudan I determination. Sens. Actuators B Chem. 2014, 203, 759–765. [Google Scholar] [CrossRef]
- Selvi, S.S.T.; Linet, J.M.; Sagadevan, S. Influence of CTAB surfactant on structural and optical properties of CuS and CdS nanoparticles by hydrothermal route. J. Exp. Nanosci. 2018, 13, 130–143. [Google Scholar] [CrossRef] [Green Version]
- Yao, P.J.; Wang, J.; Du, H.Y.; Zhao, L.; Yan, W.P. Effect of CTAB concentration on synthesis and sensing properties of perovskite oxide via a hydrothermal process. Key Eng. Mater. 2013, 543, 330–333. [Google Scholar] [CrossRef]
- Jin, Y.; Liu, F.; Tong, M.; Hou, Y. Removal of arsenate by cetyltrimethylammonium bromide modified magnetic nanoparticles. J. Hazard. Mater. 2012, 227, 461–468. [Google Scholar] [CrossRef]
- Leng, Y.; Qian, S.; Wang, Y.; Lu, C.; Ji, X.; Lu, Z.; Lin, H. Single-indicator-based multidimensional sensing: Detection and identification of heavy metal ions and understanding the foundations from experiment to simulation. Sci. Rep. 2016, 6, 25354. [Google Scholar] [CrossRef] [Green Version]
- Ramdzan, N.S.M.; Fen, Y.W.; Omar, N.A.S.; Saleviter, S.; Zainudin, A.A. Optical and surface plasmon resonance sensing properties for chitosan/carboxyl-functionalized graphene quantum dots thin film. Optik 2019, 178, 802–812. [Google Scholar] [CrossRef]
- Shen, S.; Wang, J.; Wu, Z.; Du, Z.; Tang, Z.; Wu, X. Graphene quantum dots with high yield and high quality synthesized from low cost precursor of aphanitic graphite. Nanomaterials 2020, 10, 375. [Google Scholar] [CrossRef] [Green Version]
- Kaciulis, S.; Mezzi, A.; Soltani, P.; Pizzoferrato, R.; Ciotta, E.; Prosposito, P. Graphene quantum dots obtained by unfolding fullerene. Thin Solid Films 2019, 673, 19–25. [Google Scholar] [CrossRef]
- Li, L.; Li, L.; Wang, C.; Liu, K.; Zhu, R.; Qiang, H.; Lin, Y. Synthesis of nitrogen-doped and amino acid-functionalized graphene quantum dots from glycine, and their application to the fluorometric determination of ferric ion. Microchim. Acta 2014, 182, 763–770. [Google Scholar] [CrossRef]
- Tang, Y.; Li, J.; Guo, Q.; Nie, G. An ultrasensitive electrochemiluminescence assay for Hg2+ through graphene quantum dots and poly(5-formylindole) nanocomposite. Sens. Actuators B Chem. 2019, 282, 824–830. [Google Scholar] [CrossRef]
- Tian, P.; Tang, L.; Teng, K.S.; Lau, S.P. Graphene quantum dots from chemistry to applications. Mater. Today Chem. 2018, 10, 221–258. [Google Scholar] [CrossRef]
- Li, Y.; Hu, Y.; Zhao, Y.; Shi, G.; Deng, L.; Hou, Y.; Qu, L. An electrochemical avenue to green-luminescent graphene quantum dots as potential electron-acceptors for photovoltaics. Adv. Mater. 2010, 23, 776–780. [Google Scholar] [CrossRef] [PubMed]
- Kováčová, M.; Špitalská, E.; Markovic, Z.; Špitálský, Z. Carbon quantum dots as antibacterial photosensitizers and their polymer nanocomposite applications. Part. Part. Syst. Charact. 2020, 37, 1900348. [Google Scholar] [CrossRef]
- Fen, Y.W.; Yunus, W.M.M. Surface plasmon resonance spectroscopy as an alternative for sensing heavy metal ions: A review. Sens. Rev. 2013, 33, 305–314. [Google Scholar]
- Omar, N.A.S.; Fen, Y.W.; Saleviter, S.; Daniyal, W.M.E.M.M.; Anas, N.A.A.; Ramdzan, N.S.M.; Roshidi, M.D.A. Development of a graphene-based surface plasmon resonance optical sensor chip for potential biomedical application. Materials 2019, 12, 1928. [Google Scholar] [CrossRef] [Green Version]
- Anas, N.A.A.; Fen, Y.W.; Omar, N.A.S.; Daniyal, W.M.E.M.M.; Ramdzan, N.S.M.; Saleviter, S. Development of graphene quantum dots-based optical sensor for toxic metal ion detection. Sensors 2019, 19, 3850. [Google Scholar] [CrossRef] [Green Version]
- Eddin, F.B.K.; Fen, Y.W. The principle of nanomaterials based surface plasmon resonance biosensors and its potential for dopamine detection. Molecules 2020, 25, 2769. [Google Scholar] [CrossRef] [PubMed]
- Hashim, H.S.; Fen, Y.W.; Omar, N.A.S.; Omar, N.A.S.; Abdullah, J.; Daniyal, W.M.E.M.M.; Saleviter, S. Detection of phenol by incorporation of gold modified-enzyme based graphene oxide thin film with surface plasmon resonance technique. Opt. Express 2020, 28, 9738–9752. [Google Scholar] [CrossRef] [PubMed]
- Daniyal, W.M.E.M.M.; Saleviter, S.; Fen, Y.W. Development of surface plasmon resonance spectroscopy for metal ion detection. Sens. Mater. 2018, 30, 2023–2038. [Google Scholar] [CrossRef] [Green Version]
- Jia, Y.; Peng, Y.; Bai, J.; Zhang, X.; Cui, Y.; Ning, B.; Cui, J.; Gao, Z. Magnetic nanoparticle enhanced surface plasmon resonance sensor for estradiol analysis. Sens. Actuators B Chem. 2017, 254, 629–635. [Google Scholar] [CrossRef]
- Fen, Y.W.; Yunus, W.M.M.; Yusof, N.A. Surface plasmon resonance optical sensor for detection of essential heavy metal ions with potential for toxicity: Copper, zinc and manganese ions. Sens. Lett. 2011, 9, 1704–1711. [Google Scholar] [CrossRef]
- Fen, Y.W.; Yunus, W.M.M.; Yusof, N.A. Detection of mercury and copper ions using surface plasmon resonance optical sensor. Sens. Mater. 2011, 23, 325–334. [Google Scholar]
- Zainudin, A.A.; Fen, Y.W.; Yusof, N.A.; Al-Rekabi, S.H.; Mahdi, M.A.; Omar, N.A.S. Incorporation of surface plasmon resonance with novel valinomycin doped chitosan-graphene oxide thin film for sensing potassium ion. Spectrochim. Acta A Mol. Biomol. Spectrosc. 2018, 191, 111–115. [Google Scholar] [CrossRef]
- Omar, N.A.S.; Fen, Y.W. Recent development of SPR spectroscopy as potential method for diagnosis of dengue virus E-protein. Sens. Rev. 2018, 38, 106–116. [Google Scholar] [CrossRef]
- Saleviter, S.; Fen, Y.W.; Omar, N.A.S.; Zainudin, A.A.; Yusof, N.A. Development of optical sensor for determination of Co(II) based on surface plasmon resonance phenomenon. Sens. Lett. 2017, 15, 862–867. [Google Scholar] [CrossRef]
- Fen, Y.W.; Yunus, W.M.M.; Talib, Z.A. Analysis of Pb(II) ion sensing by crosslinked chitosan thin film using surface plasmon resonance spectroscopy. Optik 2013, 124, 126–133. [Google Scholar] [CrossRef]
- Ramdzan, N.S.M.; Fen, Y.W.; Anas, N.A.A.; Omar, N.A.S.; Saleviter, S. Development of biopolymer and conducting polymer-based optical sensors for heavy metal ion detection. Molecules 2020, 25, 2548. [Google Scholar] [CrossRef]
- Anas, N.A.A.; Fen, Y.W.; Omar, N.A.S.; Ramdzan, N.S.M.; Daniyal, W.M.E.M.M.; Saleviter, S.; Zainudin, A.A. Optical properties of chitosan/hydroxyl-functionalized graphene quantum dots thin film for potential optical detection of ferric(III) ion. Opt. Laser Technol. 2019, 120, 105724. [Google Scholar] [CrossRef]
- Al-Rekabi, S.H.; Kamil, Y.M.; Bakar, M.H.A.; Fen, Y.W.; Lim, H.N.; Kanagesan, S.; Mahdi, M.A. Hydrous ferric oxide-magnetite-reduced graphene oxide nanocomposite for optical detection of arsenic using surface plasmon resonance. Opt. Laser Technol. 2019, 111, 417–423. [Google Scholar] [CrossRef]
- Fen, Y.W.; Yunus, W.M.M.; Talib, Z.A.; Yusof, N.A. Development of surface plasmon resonance sensor for determining zinc ion using novel active nanolayers as probe. Spectrochim. Acta A Mol. Biomol. Spectrosc. 2015, 134, 48–52. [Google Scholar] [CrossRef]
- Saleviter, S.; Fen, Y.W.; Daniyal, W.M.E.M.M.; Abdullah, J.; Sadrolhosseini, A.R.; Omar, N.A.S. Design and analysis of surface plasmon resonance optical sensor for determining cobalt ion based on chitosan-graphene oxide decorated quantum dots-modified gold active layer. Opt. Express 2019, 27, 32294–32307. [Google Scholar] [CrossRef] [PubMed]
- Omar, N.A.S.; Fen, Y.W.; Abdullah, J.; Sadrolhosseini, A.R.; Kamil, Y.M.; Fauzi, N.I.F.; Hashim, H.S.; Mahdi, M.A. Quantitative and selective surface plasmon resonance response based on a reduced graphene oxide-polyamidoamine nanocomposite for detection of dengue virus e-proteins. Nanomaterials 2020, 10, 569. [Google Scholar] [CrossRef] [PubMed] [Green Version]
- Fen, Y.W.; Yunus, W.M.M.; Yusof, N.A. Optical properties of crosslinked chitosan thin film as copper ion detection using surface plasmon resonance technique. Opt. Appl. 2011, 41, 999–1013. [Google Scholar]
- Roshidi, D.A.; Fen, Y.W.; Daniyal, W.M.E.M.M.; Omar, N.A.S.; Zulholinda, M. Structural and optical properties of chitosan–poly(amidoamine) dendrimer composite thin film for potential sensing Pb2+ using an optical spectroscopy. Optik 2019, 185, 351–358. [Google Scholar] [CrossRef]
- Omar, N.A.S.; Fen, Y.W.; Abdullah, J.; Zaid, M.H.M.; Daniyal, W.M.E.M.M.; Mahdi, M.A. Sensitive surface plasmon resonance performance of cadmium sulfide quantum dots-amine functionalized graphene oxide based thin film towards dengue virus E-protein. Opt. Laser Technol. 2019, 114, 204–208. [Google Scholar] [CrossRef]
- Anas, N.A.A.; Fen, Y.W.; Yusof, N.A.; Omar, N.A.S.; Ramdzan, N.S.M.; Daniyal, W.M.E.M.M. Investigating the properties of cetyltrimethylammonium bromide/hydroxylated graphene quantum dots thin film for potential optical detection of heavy metal ions. Materials 2020, 13, 2591. [Google Scholar] [CrossRef]
- Homola, J. Surface plasmon resonance sensors for detection of chemical and biological species. Chem. Rev. 2008, 108, 462–493. [Google Scholar] [CrossRef]
- Fen, Y.W.; Yunus, W.M.M. Utilization of chitosan-based sensor thin films for the detection of lead ion by surface plasmon resonance optical sensor. IEEE Sens. J. 2013, 13, 1413–1418. [Google Scholar] [CrossRef]
- Fen, Y.W.; Yunus, W.M.M.; Yusof, N.A. Surface plasmon resonance optical sensor for detection of Pb2+ based on immobilized p-tert-butylcalix[4 ]arene-tetrakis in chitosan thin film as an active layer. Sens. Actuators B Chem. 2012, 171–172, 287–293. [Google Scholar] [CrossRef]
- Saleviter, S.; Fen, Y.W.; Omar, N.A.S.; Daniyal, W.M.E.M.M.; Abdullah, J.; Zaid, M.H.M. Structural and optical studies of cadmium sulfide quantum dot-graphene oxide-chitosan nanocomposite thin film as a novel SPR spectroscopy active layer. J. Nanomater. 2018, 2018, 4324072. [Google Scholar] [CrossRef]
- Zainudin, A.A.; Fen, Y.W.; Yusof, N.A.; Omar, N.A.S. Structural, optical and sensing properties of ionophore doped graphene based bionanocomposite thin film. Optik 2017, 144, 308–315. [Google Scholar] [CrossRef]
- Fen, Y.W.; Yunus, W.M.M.; Moksin, M.M.; Talib, Z.A.; Yusof, N.A. Surface plasmon resonance optical sensor for mercury ion detection by crosslinked chitosan thin film. J. Optoelectron. Adv. Mater. 2011, 13, 279–285. [Google Scholar]
- Fauzi, N.I.M.; Fen, Y.W.; Omar, N.A.S.; Saleviter, S.; Daniyal, W.M.E.M.M.; Hashim, H.S.; Nasrullah, M. Nanostructured chitosan/maghemite composites thin film for potential optical detection of mercury ion by surface plasmon resonance investigation. Polymers 2020, 12, 1497. [Google Scholar] [CrossRef]
- Daniyal, W.M.E.M.M.; Fen, Y.W.; Abdullah, J.; Saleviter, S.; Omar, N.A.S. Preparation and characterization of hexadecyltrimethyl-ammonium bromide modified nanocrystalline cellulose/graphene oxide composite thin film and its potential in sensing copper ion using surface plasmon resonance technique. Optik 2018, 173, 71–77. [Google Scholar] [CrossRef]
- Zamiranvari, A.; Solati, E.; Dorranian, D. Effect of CTAB concentration on the properties nanosheet produced by laser ablation. Opt. Laser Technol. 2017, 97, 209–218. [Google Scholar] [CrossRef]
- Rattana, T.; Chaiyakun, S.; Witit-Anun, N.; Nuntawong, N.; Chindaudom, P.; Oaew, S.; Kedkeaw, C.; Limsuwan, P. Preparation and characterization of graphene oxide nanosheets. Procedia Eng. 2012, 32, 759–764. [Google Scholar] [CrossRef] [Green Version]
- Li, X.; Lao, S.P.; Tang, L.; Ji, R.; Yang, P. Sulphur doping: A facile approach to tune the electronic structure and optical properties of graphene quantum dots. Nanoscale 2014, 6, 5323–5328. [Google Scholar] [CrossRef]
- Fen, Y.W.; Yunus, W.M.M.; Yusof, N.A.; Ishak, N.S.; Omar, N.A.S.; Zainudin, A.A. Preparation, characterization and optical properties of ionophore doped chitosan biopolymer thin film and its potential application for sensing metal ion. Optik 2015, 126, 4688–4692. [Google Scholar] [CrossRef]
- Saleviter, S.; Fen, Y.W.; Omar, N.A.; Zainudin, A.A.; Daniyal, W.M.E.M.M. Optical and structural characterization of immobilized 4-(2-pyridylazo) resorcinol in chitosan-graphene oxide composite thin film and its potential for Co2+ sensing using surface plasmon resonance technique. Results Phys. 2018, 11, 118–122. [Google Scholar] [CrossRef]
- Roshidi, M.D.A.; Fen, Y.W.; Omar, N.A.S.; Saleviter, S.; Daniyal, W.M.E.M.M. Optical studies of graphene oxide/poly(amidoamine) dendrimer composite thin film and its potential for sensing Hg2+ using surface plasmon resonance spectroscopy. Sens. Mater. 2018, 31, 1147–1156. [Google Scholar] [CrossRef] [Green Version]
- Hashim, H.S.; Fen, Y.W.; Omar, N.A.S.; Daniyal, W.M.E.M.M.; Saleviter, S.; Abdullah, J. Structural, optical and potential sensing properties of tyrosinase immobilized graphene oxide thin film on gold surface. Optik 2020, 212, 164786. [Google Scholar] [CrossRef]
- Abdulla, H.S.; Abbo, A.I. Optical and electrical properties of thin films of polyaniline and polypyrrole. Int. J. Electrochem. Sci. 2012, 7, 10666–10678. [Google Scholar]
- Daniyal, W.M.E.M.M.; Fen, Y.W.; Abdullah, J.; Sadrolhosseini, A.R.; Saleviter, S.; Omar, N.A.S. Label-free optical spectroscopy for characterizing binding properties of highly sensitive nanocrystalline cellulose-graphene oxide based nanocomposite towards nickel ion. Spectrochim. Acta Part A Mol. Biomol. Spectrosc. 2019, 212, 25–31. [Google Scholar] [CrossRef]
- Omar, N.A.S.; Fen, Y.W.; Saleviter, S.; Kamil, Y.M.; Daniyal, W.M.E.M.M.; Abdullah, J.; Mahdi, M.A. Experimental evaluation on surface plasmon resonance sensor performance based on sensitive hyperbranched polymer nanocomposite thin films. Sens. Actuators A Phys. 2020, 303, 111830. [Google Scholar] [CrossRef]
- Sadrolhosseini, A.; Noor, A.; Bahrami, A.; Lim, H.N.; Talib, Z.A.; Mahdi, M.A. Application of polypyrrole multi-walled carbon nanotube composite layer for detection of mercury, lead and iron ions using surface plasmon resonance technique. PLoS ONE 2014, 9, e93962. [Google Scholar] [CrossRef] [Green Version]


© 2020 by the authors. Licensee MDPI, Basel, Switzerland. This article is an open access article distributed under the terms and conditions of the Creative Commons Attribution (CC BY) license (http://creativecommons.org/licenses/by/4.0/).
Share and Cite
Rosddi, N.N.M.; Fen, Y.W.; Anas, N.A.A.; Omar, N.A.S.; Ramdzan, N.S.M.; Daniyal, W.M.E.M.M. Cationically Modified Nanocrystalline Cellulose/Carboxyl-Functionalized Graphene Quantum Dots Nanocomposite Thin Film: Characterization and Potential Sensing Application. Crystals 2020, 10, 875. https://0-doi-org.brum.beds.ac.uk/10.3390/cryst10100875
Rosddi NNM, Fen YW, Anas NAA, Omar NAS, Ramdzan NSM, Daniyal WMEMM. Cationically Modified Nanocrystalline Cellulose/Carboxyl-Functionalized Graphene Quantum Dots Nanocomposite Thin Film: Characterization and Potential Sensing Application. Crystals. 2020; 10(10):875. https://0-doi-org.brum.beds.ac.uk/10.3390/cryst10100875
Chicago/Turabian StyleRosddi, Najwa Norimanina Muhammad, Yap Wing Fen, Nur Ain Asyiqin Anas, Nur Alia Sheh Omar, Nur Syahira Md Ramdzan, and Wan Mohd Ebtisyam Mustaqim Mohd Daniyal. 2020. "Cationically Modified Nanocrystalline Cellulose/Carboxyl-Functionalized Graphene Quantum Dots Nanocomposite Thin Film: Characterization and Potential Sensing Application" Crystals 10, no. 10: 875. https://0-doi-org.brum.beds.ac.uk/10.3390/cryst10100875