A Combined Experimental and Modelling Study on Solubility of Calcium Oxalate Monohydrate at Physiologically Relevant pH and Temperatures

 ,
,
Abstract
:
1. Introduction
2. Materials and Methods
2.1. Preparation of Equilibrated Suspensions for ICP-OES and ICP-MS
2.2. Preparation of Equilibrated Suspensions for Titration
2.3. Inductively Coupled Plasma-Optical Emission Spectrometry (ICP-OES)
2.4. Inductively Coupled Plasma-Mass-Spectrometry (ICP-MS)
2.5. Titration
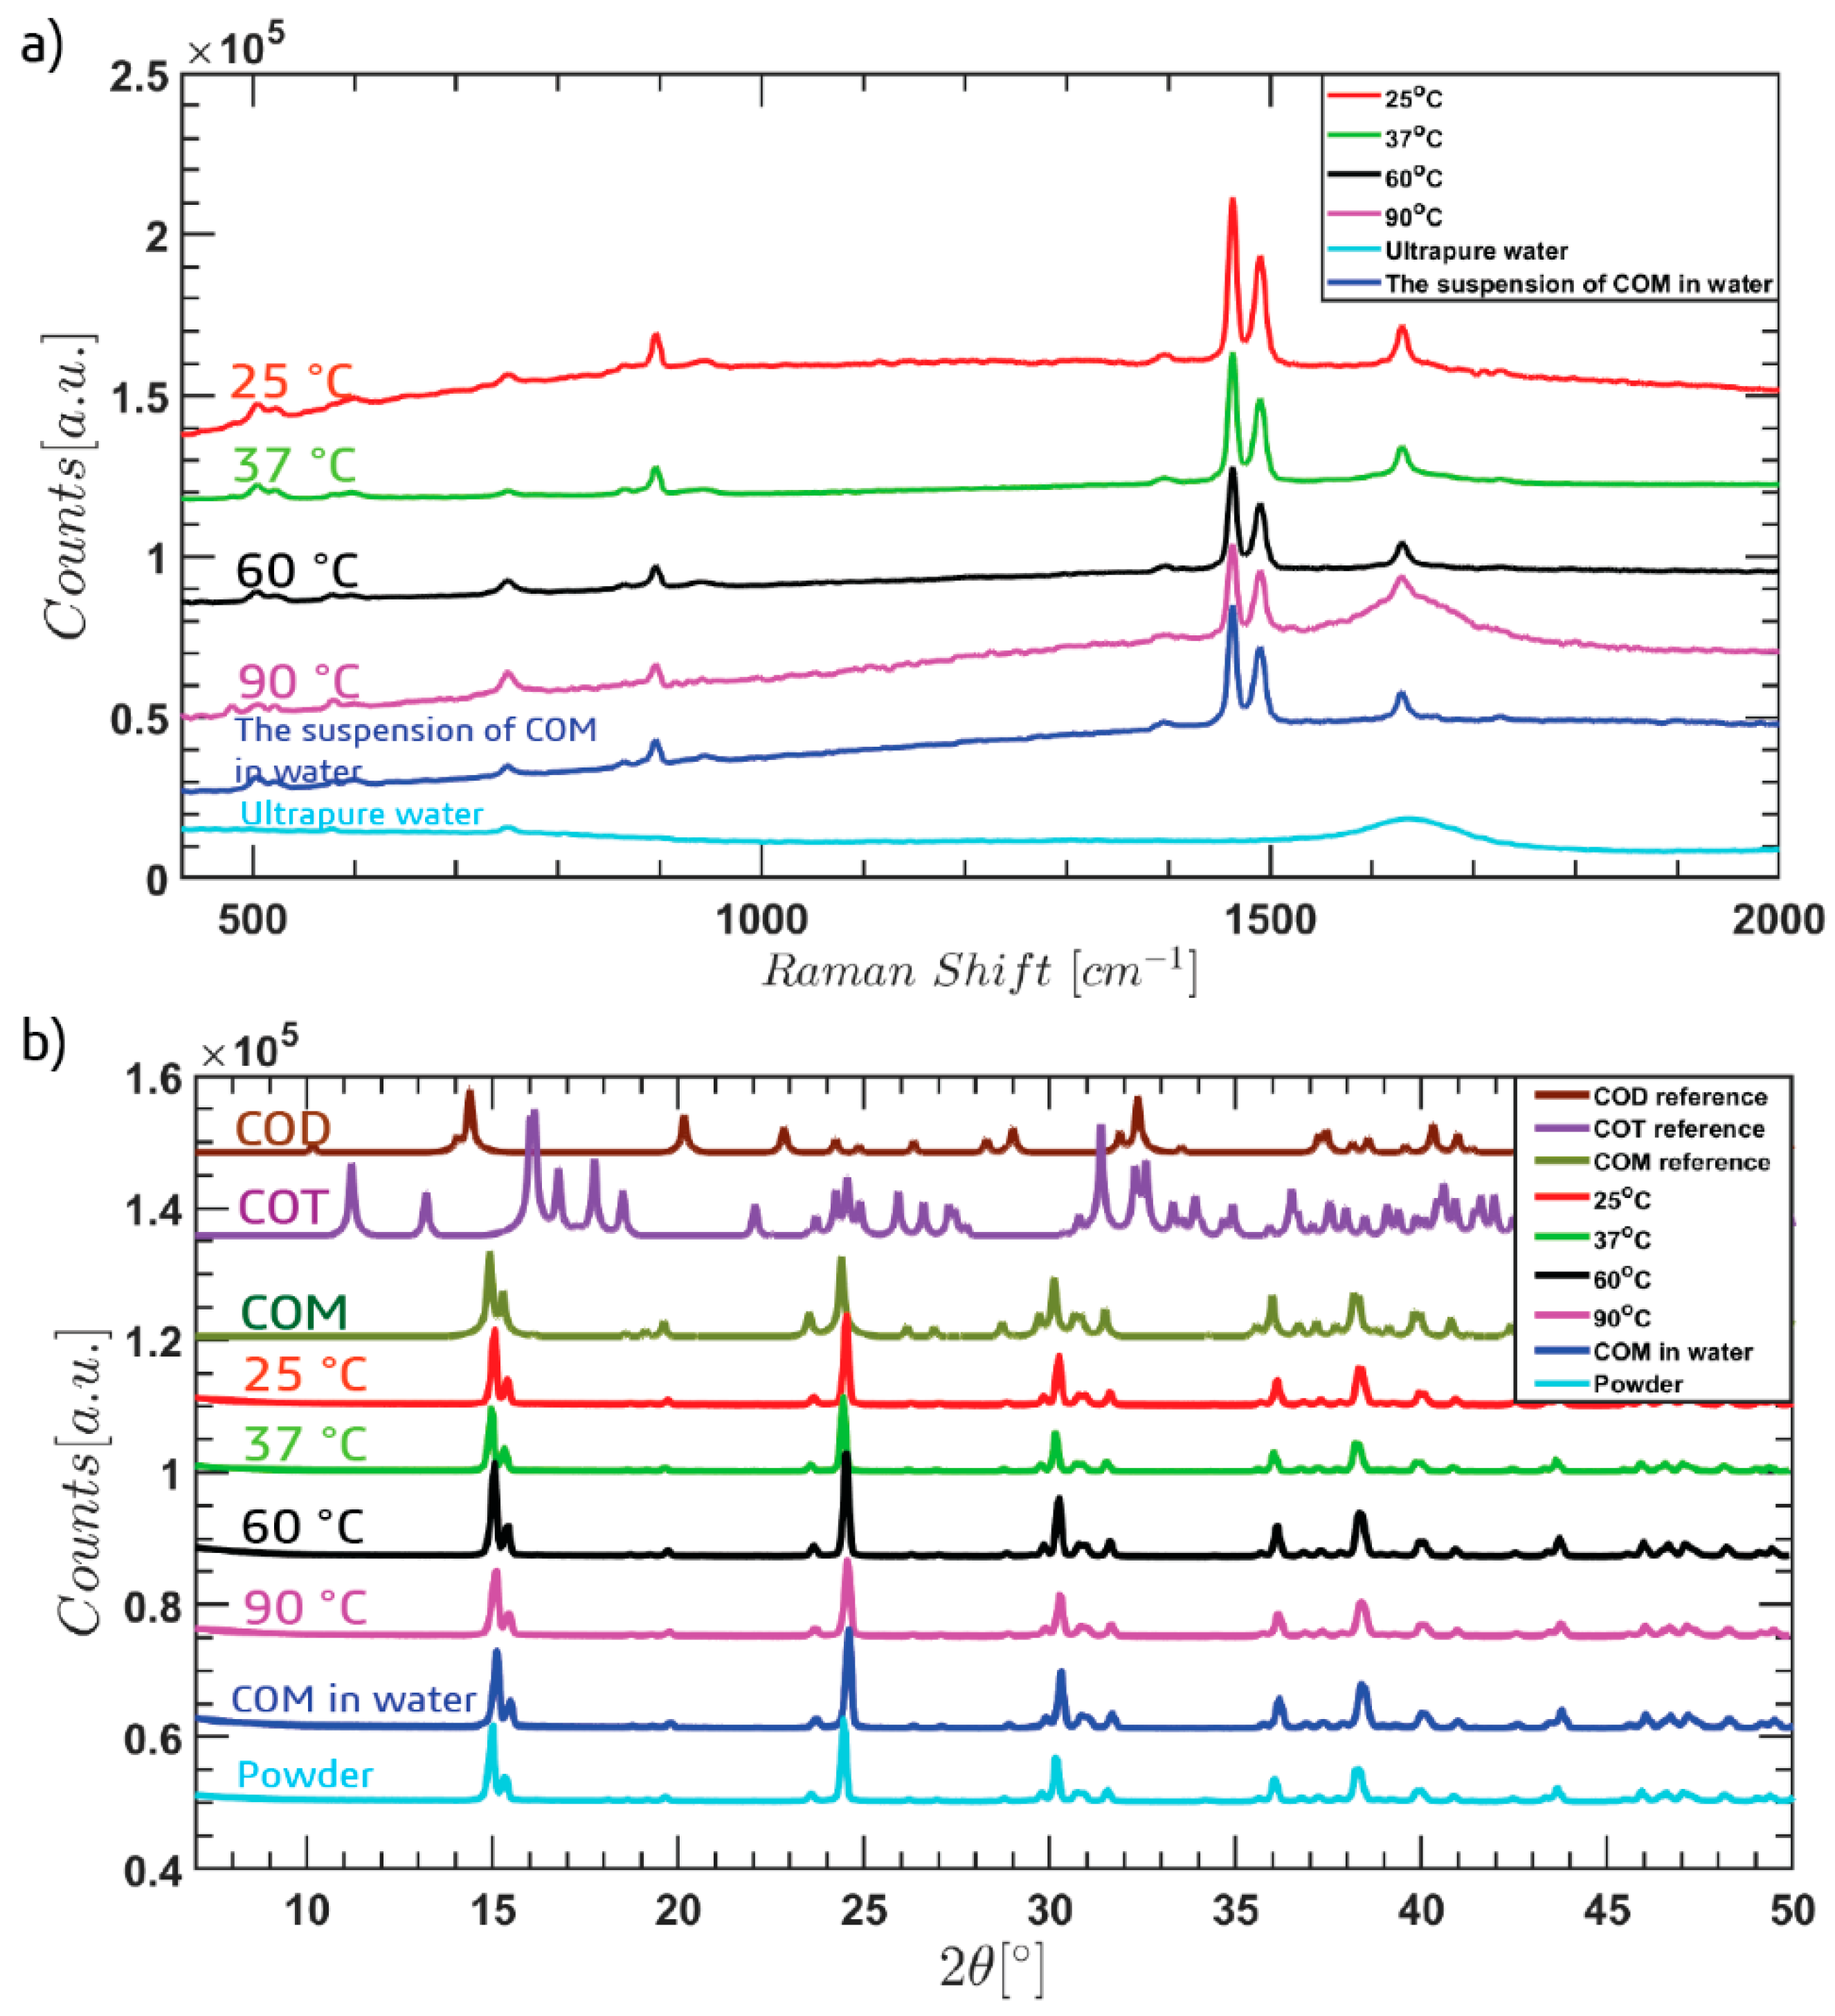
2.6. Pseudopolymorphic/Hydrate Form Characterization of Excess COM Crystals in Equilibrated Suspension
3. Results and Discussion
4. Conclusions
Supplementary Materials
Author Contributions
Funding
Acknowledgments
Conflicts of Interest
Abbreviations
| ICP-OES | Inductively coupled plasma optical emission spectrometry, |
| ICP-MS | Inductively coupled plasma mass spectrometry, |
| FBRM | Focused beam reflectance measurement, |
| UV-VIS | Ultraviolet–visible spectrophotometry, |
| COM | Calcium oxalate monohydrate, |
| CaOx | Calcium oxalate, |
| AAS | Atomic absorption spectrophotometers. |
References
- Alelign, T.; Petros, B. Kidney stone disease: An update on current concepts. Adv. Urol. 2018, 2018, 1–12. [Google Scholar] [CrossRef]
- Bowers, G.M.; Kirkpatrick, R.J. Natural Abundance43Ca NMR as a tool for exploring calcium biomineralization: Renal stone formation and growth. Cryst. Growth Des. 2011, 11, 5188–5191. [Google Scholar] [CrossRef]
- Goldfarb, D.S. A woman with recurrent calcium phosphate kidney stones. Clin. J. Am. Soc. Nephrol. 2012, 7, 1172–1178. [Google Scholar] [CrossRef] [Green Version]
- Zhai, H.; Wang, L.; Putnis, C.V. Inhibition of spiral growth and dissolution at the brushite (010) interface by chondroitin 4-sulfate. J. Phys. Chem. B 2019, 123, 845–851. [Google Scholar] [CrossRef]
- Worcester, M.E.; Coe, F.L. Nephrolithiasis. Prim. Care Clin. Off. Pract. 2008, 35, 369–391. [Google Scholar] [CrossRef] [Green Version]
- Maarten, T.; Glenn, C.; Philip, M.; Karl, S.; Alan., Y.; Barry, B. Brenner and Rector’s the Kidney E-Book; Elsevier Health Sciences: Amsterdam, The Netherlands, 2015. [Google Scholar]
- Romero, V.; Akpinar, H.; Assimos, D.G. Kidney stones: A global picture of prevalence, incidence, and associated risk factors. Rev. Urol. 2010, 12, e86–e96. [Google Scholar] [PubMed]
- Ridley, J.W. Fundamentals of the Study of Urine and Body Fluids; Springer: Berlin/Heidelberg, Germany, 2018. [Google Scholar]
- Bird, V.Y.; Khan, S.R. How do stones form? Is unification of theories on stone formation possible? Arch. Españoles Urol. (Ed. Impresa) 2017, 70, 12–27. [Google Scholar]
- Hall, V.M.; Thornton, A.; Miehls, E.K.; Bertke, J.A.; Swift, J.A. Uric acid crystallization interrupted with competing binding agents. Cryst. Growth Des. 2019, 19, 7363–7371. [Google Scholar] [CrossRef]
- Khan, S.R.; Pearle, M.S.; Robertson, W.G.; Gambaro, G.; Canales, B.K.; Doizi, S.; Traxer, O.; Tiselius, H.-G. Kidney stones. Nat. Rev. Dis. Prim. 2016, 2, 16009. [Google Scholar] [CrossRef]
- Miller, G.; Vermeulen, C.; Moore, J. Calcium oxalate solubility in urine: Experimental urolithiasis XIV. J. Urol. 1958, 79, 607–612. [Google Scholar] [CrossRef]
- Izatulina, A.R.; Gurzhiy, V.V.; Krzhizhanovskaya, M.; Kuz’Mina, M.A.; Leoni, M.; Frank-Kamenetskaya, O.V. Hydrated calcium oxalates: crystal structures, thermal stability, and phase evolution. Cryst. Growth Des. 2018, 18, 5465–5478. [Google Scholar] [CrossRef]
- Kelland, M.A.; Mady, M.F.; Lima-Eriksen, R. Kidney stone prevention: dynamic testing of edible calcium oxalate scale inhibitors. Cryst. Growth Des. 2018, 18, 7441–7450. [Google Scholar] [CrossRef]
- Pahira, J.J.; Pevzner, M. Nephrolithiasis. In Penn Clinical Manual of Urology; Elsevier: Amsterdam, The Netherlands, 2007; pp. 235–257. [Google Scholar]
- Sun, X.-Y.; Zhang, C.-Y.; Bhadja, P.; Ouyang, J.M. Preparation, properties, formation mechanisms, and cytotoxicity of calcium oxalate monohydrate with various morphologies. CrystEngComm 2018, 20, 75–87. [Google Scholar] [CrossRef]
- Worcester, E.M.; Coe, F.L. Calcium kidney stones. N. Engl. J. Med. 2010, 363, 954–963. [Google Scholar] [CrossRef] [PubMed]
- Childs-Sanford, S. The captive maned wolf (Chrysocyon brachyurus): nutritional considerations with emphasis on management of cystinuria. In Proceedings of the Fourth Conference on Zoo and Wildlife Nutrition; Edwards, M., Lisi, K.J., Schlegel, M.L., Bray, R.E., Eds.; AZA Nutrition Advisory Group: Lake Buena Vista, FL, USA, 2005. [Google Scholar]
- Bono, M.J.; Reygaert, W.C. Urinary Tract Infection. In StatPearls; StatPearls Publishing: Treasure Island, FL, USA; Available online: https://0-www-ncbi-nlm-nih-gov.brum.beds.ac.uk/books/NBK470195/ (accessed on 12 October 2020).
- Singh, R.P. On the existence of NaC2O4− ion pair complex. Bull. Chem. Soc. Jpn. 1989, 62, 4089–4091. [Google Scholar] [CrossRef] [Green Version]
- Pan, H.-B.; Darvell, B.W. Calcium phosphate solubility: The need for re-evaluation. Cryst. Growth Des. 2009, 9, 639–645. [Google Scholar] [CrossRef]
- Streit, J.; Tran-Ho, L.-C.; Königsberger, E. Solubility of the three calcium oxalate hydrates in sodium chloride solutionsand urine-like liquors. Mon. Chem. Chem. Mon. 1998, 129, 1225–1236. [Google Scholar] [CrossRef]
- Molzon, J.A. The Solubility of Calcium Oxalate as a Function of Dielectric Constant. Master’s Thesis, University of Rhode Island, Kingston, RI, USA, 1976. [Google Scholar]
- McComas, W.H., Jr.; Rieman, W. The Solubility of calcium oxalate monohydrate in pure water and various neutral salt solutions at 25. J. Am. Chem. Soc. 1942, 64, 2946–2947. [Google Scholar] [CrossRef]
- Shehyn, H.; Pall, D.B. The solubility of calcium oxalate in various salt solutions. J. Phys. Chem. 1940, 44, 166–171. [Google Scholar] [CrossRef]
- Gutzow, I.; Atanassova, S.; Budevsky, G.; Neykov, K. Solubility, inhibited growth and dissolution kinetics of calcium oxalate crystals in solutions, containing hippuric acid. Urol. Res. 1993, 21, 181–185. [Google Scholar] [CrossRef]
- Muhs, G.; Herz, W. Ueber die Lösliohkeit einiger Salze der Ekdalkalimetalle mit organisohen Sauren in Essigsiiure. Ber. Dtsch. Chem. Ges. 1903, 36, 3715–3718. [Google Scholar]
- Hammersten, G. On Calcium Oxalate and Its Solubility in the Presence of Inorganic Salts with Special Reference to the Occurrence of Oxaluria; C.R. Trav. Lab. Carlsberg: Copenhagen, Denmark, 1929; Volume 17, p. 1. [Google Scholar]
- Gardner, G.L.; Nancollas, G.H. Kinetics of dissolution of calcium oxalate monohydrate. J. Phys. Chem. 1975, 79, 2597–2600. [Google Scholar] [CrossRef]
- Robertson, W.G. Diet and calcium stones. Miner. Electrolyte Metab. 1987, 13, 228–234. [Google Scholar] [PubMed]
- Finlayson, B.; Roth, R. Appraisal of calcium oxalate solubility In sodium chloride and sodium-calcium chloride solutions. Urology 1973, 1, 142–144. [Google Scholar] [CrossRef]
- Gardner, G.L.; Nancollas, G.H. Crystal growth in aqueous solution at elevated temperatures. Barium sulfate growth kinetics. J. Phys. Chem. 1983, 87, 4699–4703. [Google Scholar] [CrossRef]
- Garside, J.; Brečević, L.; Mullin, J. The effect of temperature on the precipitation of calcium oxalate. J. Cryst. Growth 1982, 57, 233–240. [Google Scholar] [CrossRef]
- Baumann, J.; Ackermann, D.; Affolter, B. The influence of hydroxyapatite and pyrophosphate on the formation product of calcium oxalate at different pHs. Urol. Res. 1989, 17, 153–155. [Google Scholar] [CrossRef]
- Tiselius, H.-G. The effect of ph on the urinary inhibition of calcium oxalate crystal growth. BJU Int. 1981, 53, 470–474. [Google Scholar] [CrossRef]
- Højgaard, I.; Fornander, A.-M.; Nilsson, M.-A.; Tiselius, H.-G. The effect of pH changes on the crystallization of calcium salts in solutions with an ion composition corresponding to that in the distal tubule. Urol. Res. 1999, 27, 409–416. [Google Scholar] [CrossRef]
- Elemental-Analysis/icp-ms. Available online: https://www.ru.nl/science/gi/facilities-activities/ (accessed on 15 January 2019).
- Elemental-Analysis/icp-oes. Available online: https://www.ru.nl/science/gi/facilities-activities/ (accessed on 15 February 2019).
- Elkadi, M.; Ae, P.; Fok, S.; Feghali, F.; Bassioni, G.; Stephen, S. Depth profiling (ICP-MS) study of toxic metal buildup in concrete matrices: Potential environmental impact. Sustainability 2010, 2, 3258–3269. [Google Scholar] [CrossRef] [Green Version]
- Biological-Buffers/Learning-Center/Buffer-Reference-Center.html, Sigma-Aldrich. Buffer Reference Center. Available online: https://www.sigmaaldrich.com/life-science/core-bioreagents/ (accessed on 15 May 2019).
- Buffers, Plant Microtechnique and Microscopy. 1999. Available online: http://microscopy.berkeley.edu/Resources/instruction/buffers.html (accessed on 15 May 2019).
- Vallapragada, V.V.; Inti, G.; Ramulu, J. A validated inductively coupled plasma-optical emission spectrometry (ICP-OES) method to estimate free calcium and phosphorus in in vitro phosphate binding study of eliphos tablets. Am. J. Anal. Chem. 2011, 2, 718–725. [Google Scholar] [CrossRef] [Green Version]
- Green, D.R.H.; Cooper, M.J.; German, C.R.; Wilson, P.A. Optimization of an inductively coupled plasma-optical emission spectrometry method for the rapid determination of high-precision Mg/Ca and Sr/Ca in foraminiferal calcite. Geochem. Geophys. Geosyst. 2003, 4. [Google Scholar] [CrossRef]
- De Souza, R.M.; Leocádio, L.G.; Da Silveira, C.L.P. ICP OES simultaneous determination of Ca, Cu, Fe, Mg, Mn, Na, and P in biodiesel by axial and radial inductively coupled plasma-optical emission spectrometry. Anal. Lett. 2008, 41, 1615–1622. [Google Scholar] [CrossRef]
- Buffer. Available online: https://www.sigmaaldrich.com/life-science/core-bioreagents/biological-buffers/learning-center/buffer-reference-center.html#citric2 (accessed on 15 June 2019).
- Nancollas, G.; Gardner, G. Kinetics of crystal growth of calcium oxalate monohydrate. J. Cryst. Growth 1974, 21, 267–276. [Google Scholar] [CrossRef]
- Singh, R.P.; Yeboah, Y.D.; Pambid, E.R.; Debayle, P. Stability constant of the calcium-citrate(3-) ion pair complex. J. Chem. Eng. Data 1991, 36, 52–54. [Google Scholar] [CrossRef]
- May, P.M.; Murray, K.; Williams, D.R. The use of glass electrodes for the determination of formation constants—II Simulation of titration data. Talanta 1985, 32, 483–489. [Google Scholar] [CrossRef]
- Davies, C.W.; Hoyle, B.E. 842. The interaction of calcium ions with some phosphate and citrate buffers. J. Chem. Soc. 1953, 4134. [Google Scholar] [CrossRef]
- Robertson, W. Measurement of ionized calcium in biological fluids. Clin. Chim. Acta 1969, 24, 149–157. [Google Scholar] [CrossRef]
- Marrero, V.R.V.; Berríos, C.P.; Rodríguez, L.D.D.; Stelzer, T.; López-Mejías, V. In the context of polymorphism: Accurate measurement, and validation of solubility data. Cryst. Growth Des. 2019, 19, 4101–4108. [Google Scholar] [CrossRef]
- Richards, T.W.; Zeitschr, C.T.M.a.H.B. Anorg. Chemie. 1901. 28. Available online: https://books.google.nl/books?id=wu1FmlWKW_MC&pg=PA101&lpg=PA101&dq=Richards,+proc.+am.+acad.+arts+sci+36+375+1901&source=bl&ots=KsxL2v70ll&sig=ACfU3U0s4_EImd7LHcR9pswRqXwpwBEfcg&hl=en&sa=X&ved=2ahUKEwi51bKuqdzjAhWIJFAKHbVdC5wQ6AEwAHoECAkQAQ#v=onepage&q=Richards%2C%20proc.%20am.%20acad.%20arts%20sci%2036%20375%201901&f=false (accessed on 15 June 2018).
- Hall, W.T. The oxalate method for separating calcium and magnesium. J. Am. Chem. Soc. 1928, 50, 2704–2707. [Google Scholar] [CrossRef]
- Frausto-Reyes, C.; Loza-Cornejo, S.; Terrazas, T.; Miranda-Beltrán, M.D.L.L.; Aparicio-Fernández, X.; López-Macías, B.M.; Morales-Martínez, S.E.; Ortiz-Morales, M. Raman spectroscopy study of calcium oxalate extracted from cacti stems. Appl. Spectrosc. 2014, 68, 1260–1265. [Google Scholar] [CrossRef] [PubMed]
- Kodati, V.R.; Tomasi, G.E.; Turumin, J.L.; Tu, A.T. Raman spectroscopic identification of calcium-oxalate-type kidney stone. Appl. Spectrosc. 1990, 44, 1408–1411. [Google Scholar] [CrossRef]
- Edwards, H.G.M.; Seaward, M.R.D.; Attwood, S.J.; Little, S.J.; De Oliveira, L.F.C.; Tretiach, M. FT-Raman spectroscopy of lichens on dolomitic rocks: an assessment of metal oxalate formation. Analyst 2003, 128, 1218–1221. [Google Scholar] [CrossRef] [PubMed]
- Orlando, M.T.D.; Kuplich, L.; De Souza, D.O.; Belich, H.; Depianti, J.B.; Orlando, C.G.P.; Medeiros, E.F.; Da Cruz, P.C.M.; Martinez, L.G.; Corrêa, H.P.S.; et al. Study of calcium oxalate monohydrate of kidney stones by X-ray diffraction. Powder Diff. 2008, 23, S59–S64. [Google Scholar] [CrossRef] [Green Version]
- Manzoor, M.A.P.; Agrawal, A.K.; Singh, B.; Mujeeburahiman, M.; Rekha, P.D. Morphological characteristics and microstructure of kidney stones using synchrotron radiation μCT reveal the mechanism of crystal growth and aggregation in mixed stones. PLoS ONE 2019, 14, e0214003. [Google Scholar] [CrossRef] [PubMed]
- Hammond, R.; Pencheva, K.; Roberts, K. Molecular modeling of crystal−crystal interactions between the α-and β-polymorphic forms of l-glutamic acid using grid-based methods. Cryst. Growth Des. 2007, 7, 875–884. [Google Scholar] [CrossRef]
- Eral, H.B.; O’Mahony, M.; Shaw, R.; Trout, B.L.; Myerson, A.S.; Doyle, P.S. Composite hydrogels laden with crystalline active pharmaceutical ingredients of controlled size and loading. Chem. Mater. 2014, 26, 6213–6220. [Google Scholar] [CrossRef] [Green Version]
- Blomen, L.J.; Will, E.J.; Bijvoet, O.L.; Van Der Linden, H. Growth kinetics of calcium oxalate monohydrate: II. The variation of seed concentration. J. Cryst. Growth 1983, 64, 306–315. [Google Scholar] [CrossRef]


| Authors | Year | Solubility 10−4 [M] | Measurements Method |
|---|---|---|---|
| Gutzow et al. [26] | 1993 | 0.57 | Atomic absorption spectrometry |
| Molzon [23] | 1976 | 1.329 | Dielectric constant measurements |
| McComas et al. [24] | 1942 | 0.455 | Titration |
| Shehyn and Pall [25] | 1940 | 0.60 | Titration |
| Hammarsten [28] | 1929 | 0.466 | Titration |
| Herz et al. [27] | 1903 | 2.33 | Titration |
| Singh et al. [20] | 1989 | 0.564 | Ion Chromatography |
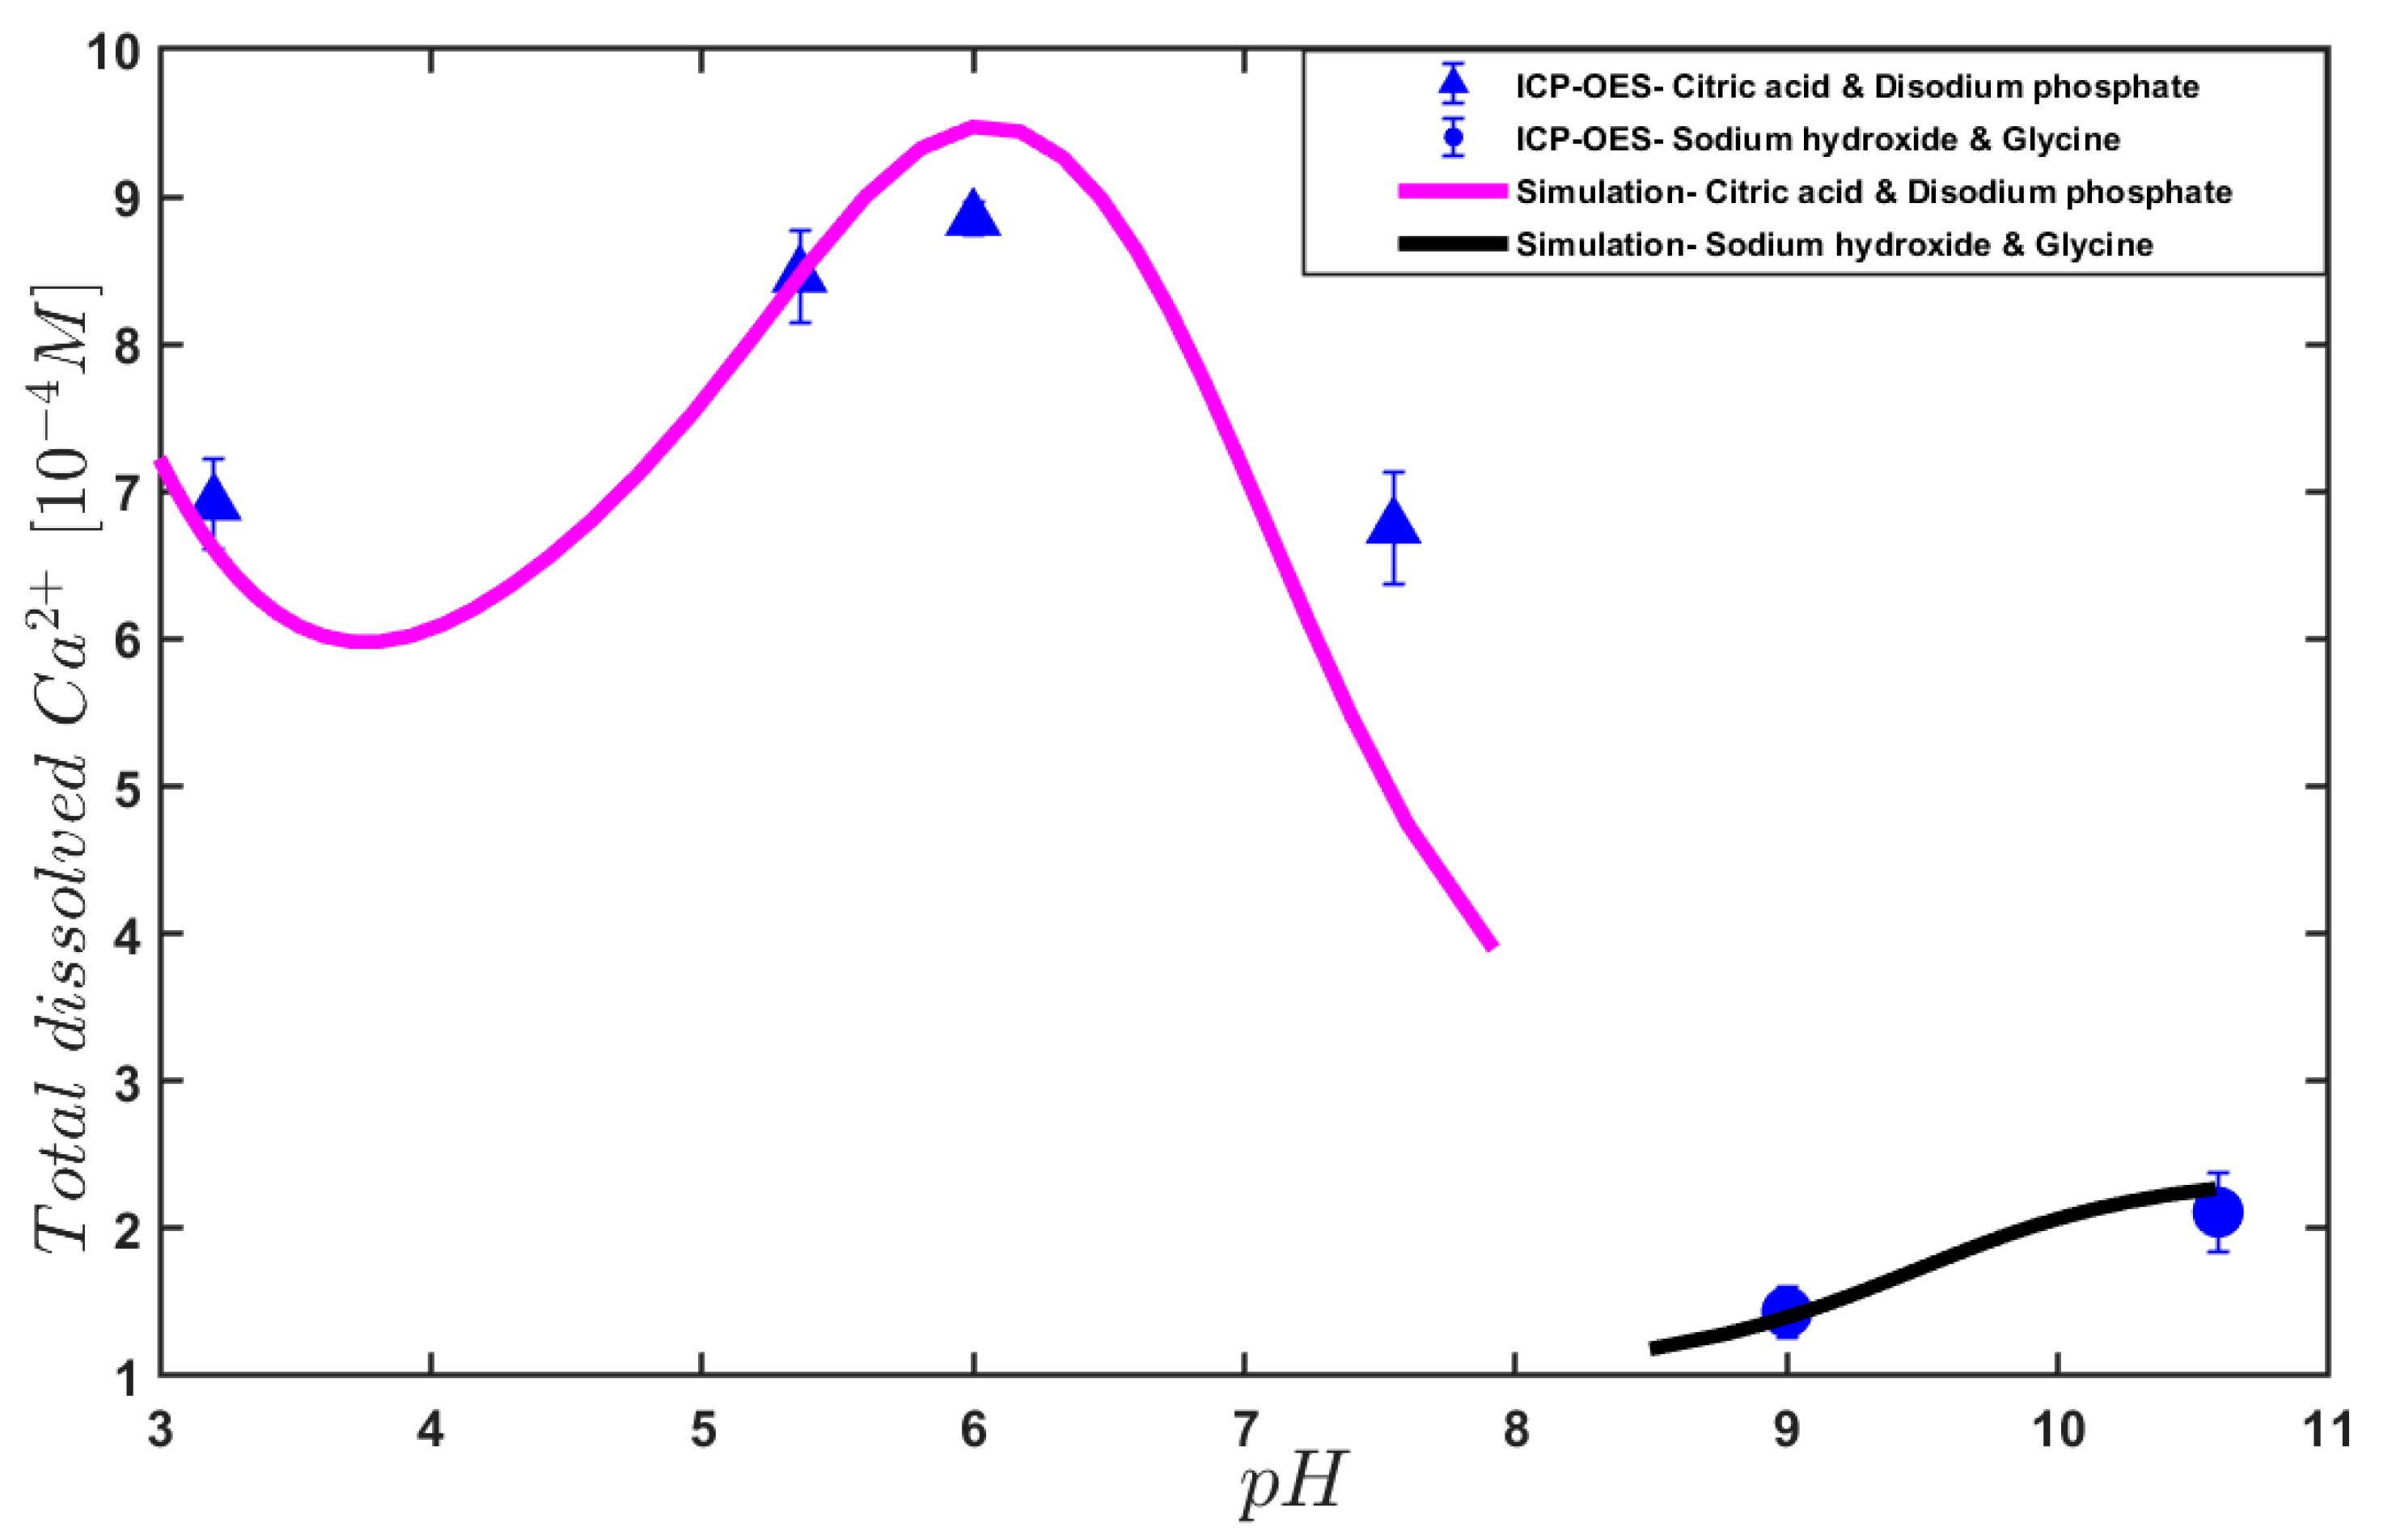
| pH | Mixing of Buffer Solutions |
|---|---|
| 3.2, 5.36, 6.0, 7.55 | Citric Acid (C6H8O7) (Merck, CAS: 77-92-9) Disodium phosphate (Na2HPO4) (Sigma-Aldrich, CAS: 7558-79-4) |
| 9.0, 10.6 | Sodium hydroxide (NaOH) (Sigma-Aldrich, CAS: 7558-79-4) Glycine (C2H5NO2) (Sigma-Aldrich, CAS: 1310-73-2) |
| Parameters | Reaction | Source | ||
|---|---|---|---|---|
| [33] | 18.17 [L·mol−1] | 3.2 | ||
| [33] | 18,450 [L·mol−1] | 8.32 | ||
| [47] | 2746 [L·mol−1] | 0 | ||
| [22] | 1.7 × 10⁻⁹ [mol2 L−2] | 17.9 | ||
| This study | 6.7 × 10⁻⁹ [mol2 L−2] | 5.5 |
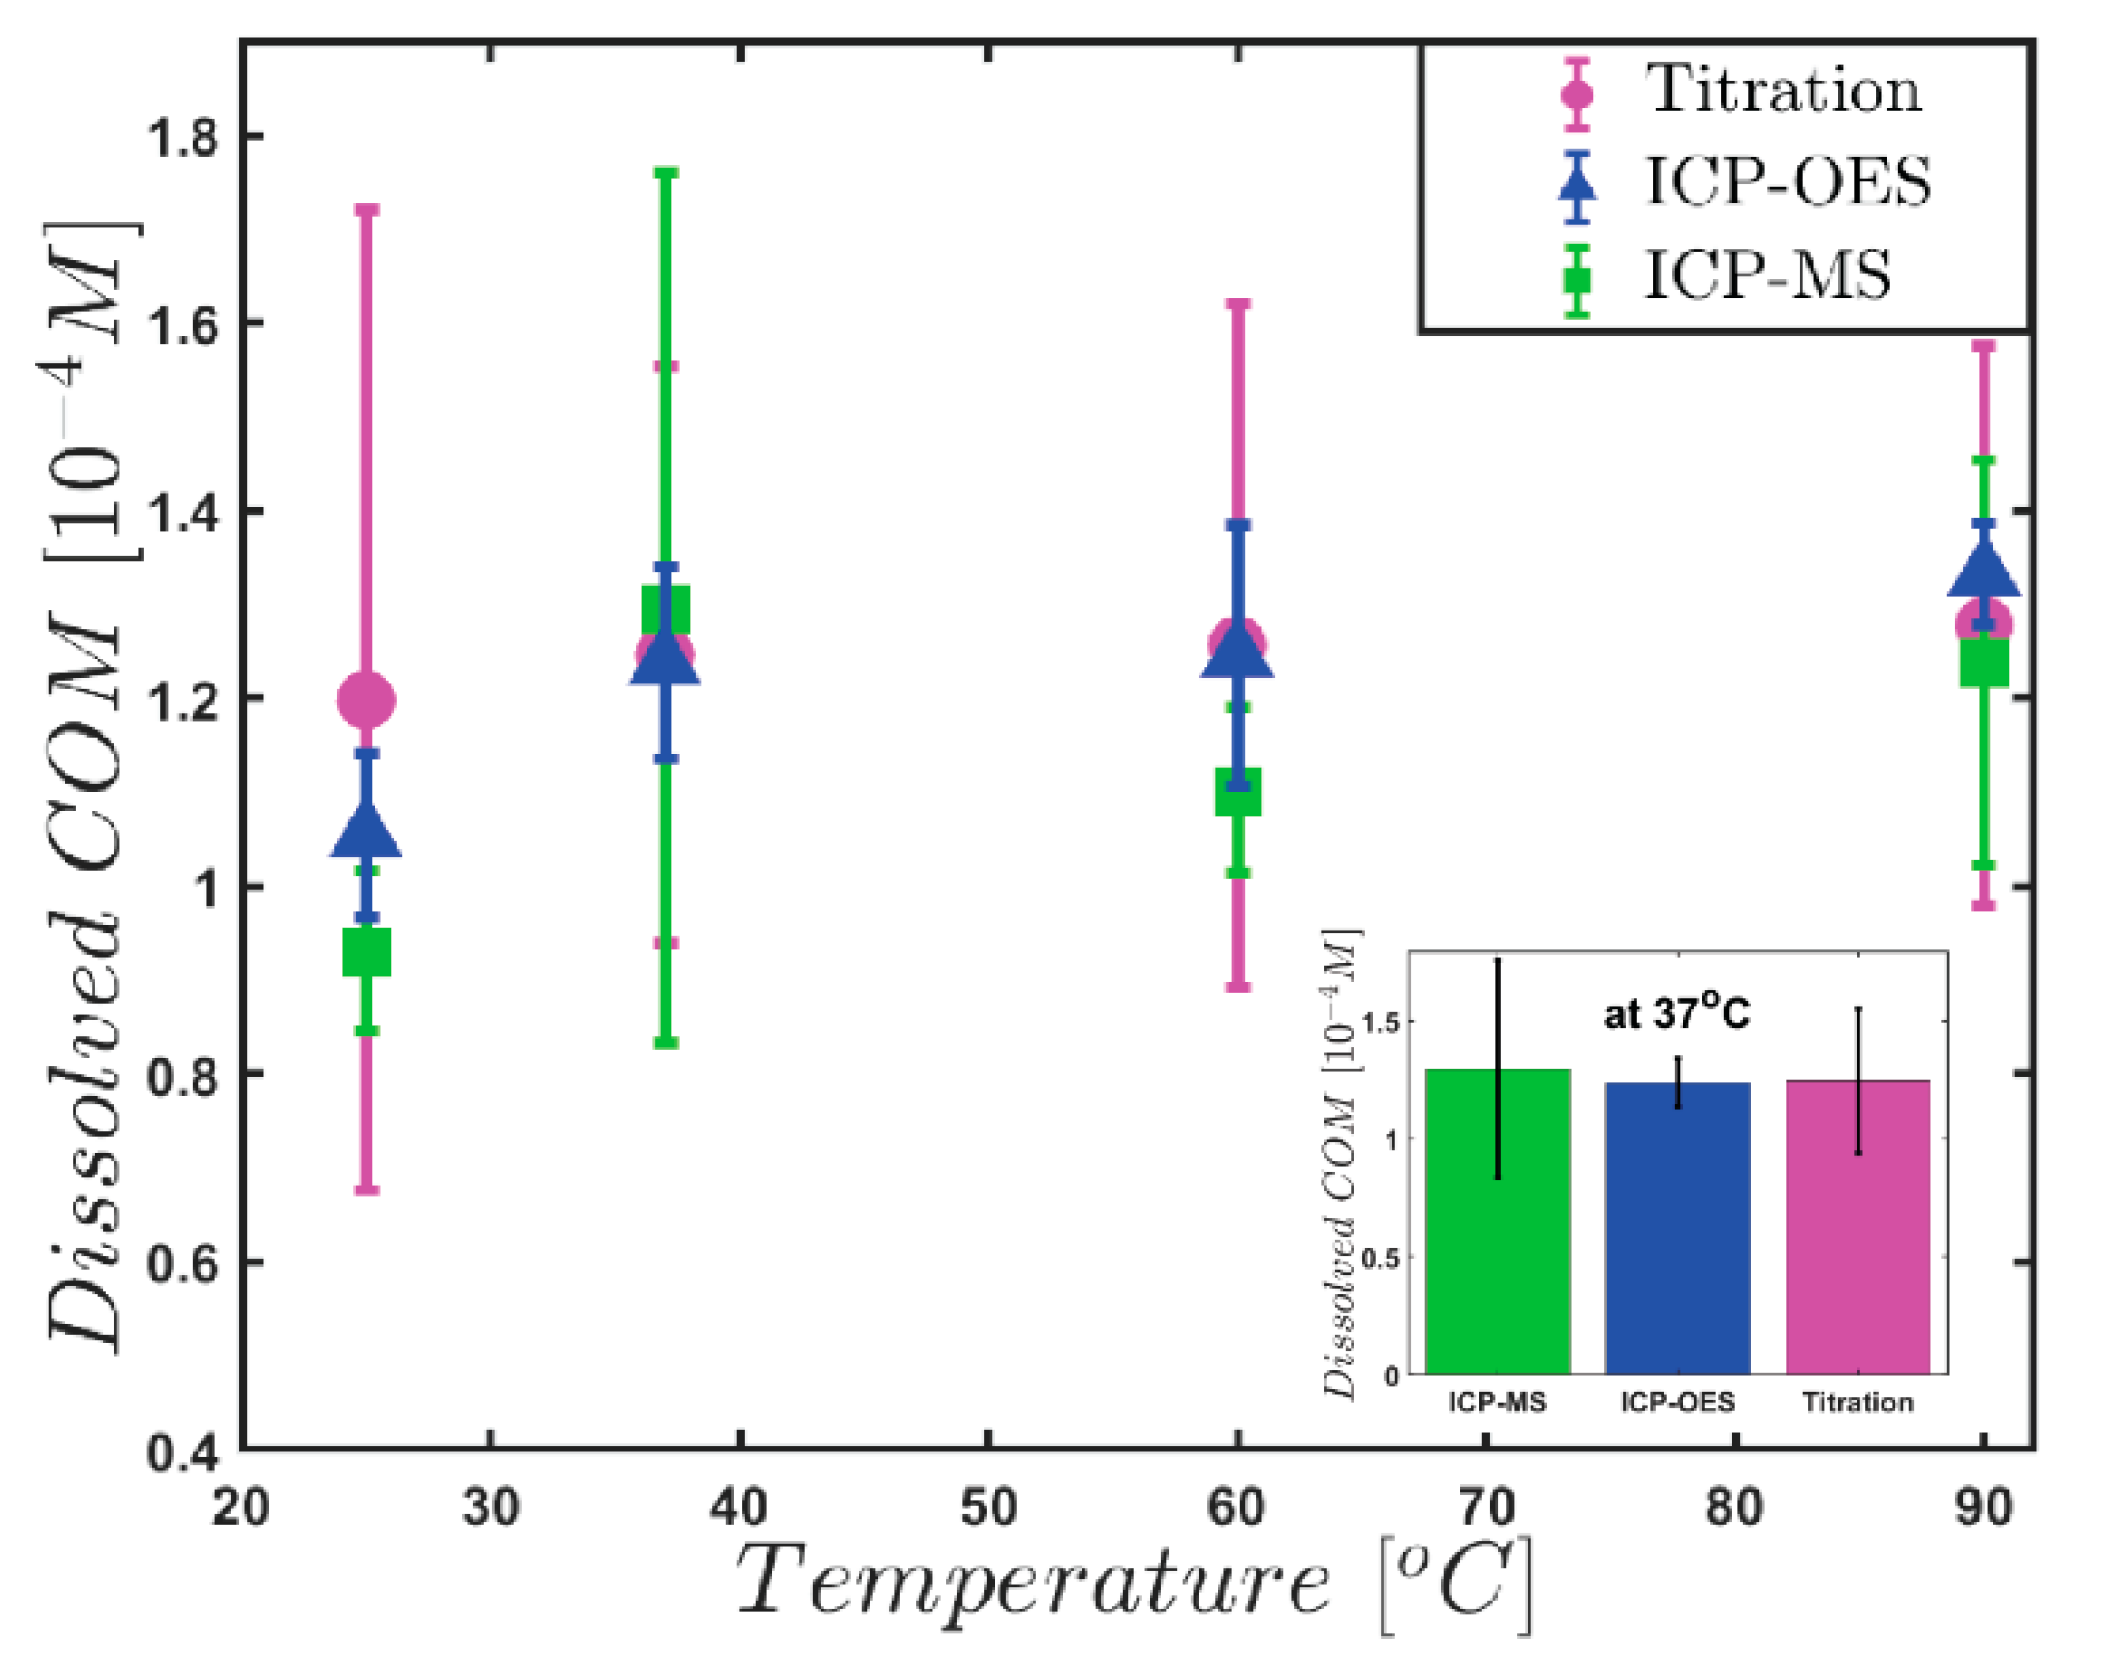
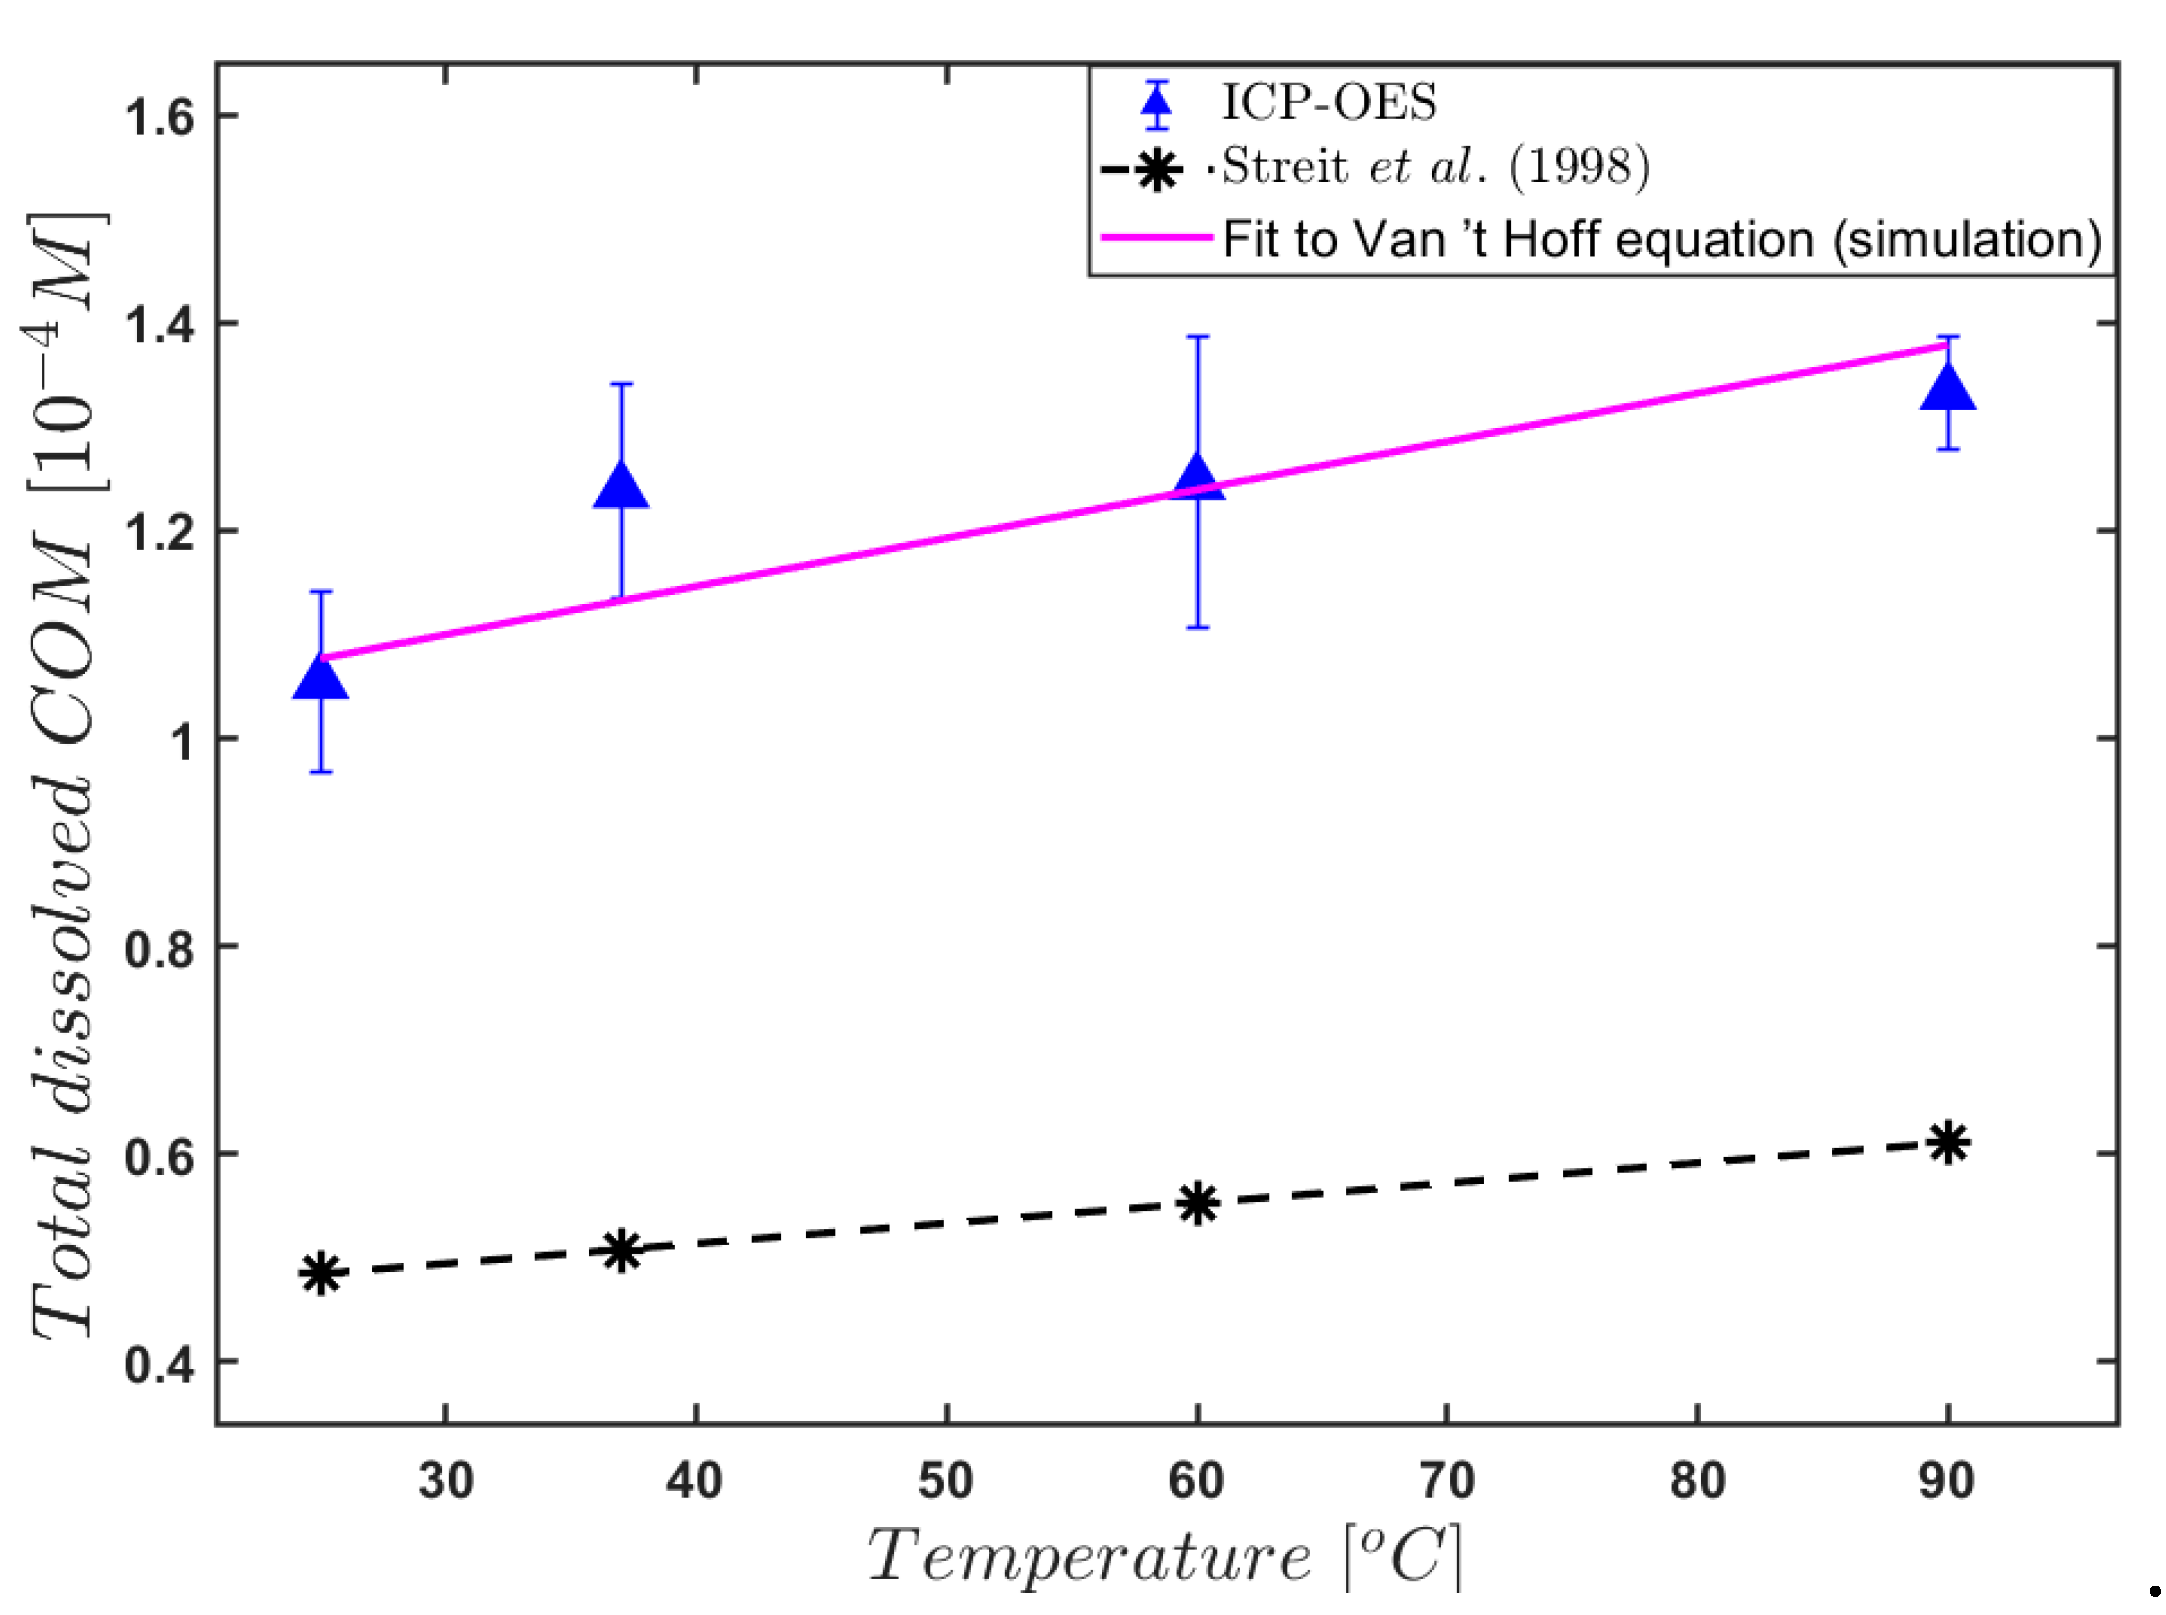
| Temperature (°C) | Titration [10−4 M] | ICP-OES [10−4 M] | ICP-MS [10−4 M] | |||
|---|---|---|---|---|---|---|
| [C2O42−] tot | [Ca2+] tot | [Ca2+] tot | ||||
| 25 | 1.198 | 0.521 | 1.054 | 0.087 | 0.931 | 0.086 |
| 37 | 1.244 | 0.307 | 1.238 | 0.103 | 1.296 | 0.463 |
| 60 | 1.258 | 0.378 | 1.246 | 0.140 | 1.102 | 0.089 |
| 90 | 1.279 | 0.290 | 1.332 | 0.055 | 1.238 | 0.216 |
© 2020 by the authors. Licensee MDPI, Basel, Switzerland. This article is an open access article distributed under the terms and conditions of the Creative Commons Attribution (CC BY) license (http://creativecommons.org/licenses/by/4.0/).
Share and Cite
Ibis, F.; Dhand, P.; Suleymanli, S.; van der Heijden, A.E.D.M.; Kramer, H.J.M.; Eral, H.B. A Combined Experimental and Modelling Study on Solubility of Calcium Oxalate Monohydrate at Physiologically Relevant pH and Temperatures. Crystals 2020, 10, 924. https://0-doi-org.brum.beds.ac.uk/10.3390/cryst10100924
Ibis F, Dhand P, Suleymanli S, van der Heijden AEDM, Kramer HJM, Eral HB. A Combined Experimental and Modelling Study on Solubility of Calcium Oxalate Monohydrate at Physiologically Relevant pH and Temperatures. Crystals. 2020; 10(10):924. https://0-doi-org.brum.beds.ac.uk/10.3390/cryst10100924
Chicago/Turabian StyleIbis, Fatma, Priya Dhand, Sanan Suleymanli, Antoine E. D. M. van der Heijden, Herman J. M. Kramer, and Huseyin Burak Eral. 2020. "A Combined Experimental and Modelling Study on Solubility of Calcium Oxalate Monohydrate at Physiologically Relevant pH and Temperatures" Crystals 10, no. 10: 924. https://0-doi-org.brum.beds.ac.uk/10.3390/cryst10100924