Article

Effect of Process Conditions on Particle Size and Shape in Continuous Antisolvent Crystallisation of Lovastatin

1
Future Manufacturing Research Hub in Continuous Manufacturing and Advanced Crystallisation, Technology and Innovation Centre, University of Strathclyde, 99 George Street, Glasgow G1 1RD, UK
2
Department of Chemical and Process Engineering, University of Strathclyde, James Weir Building, 75 Montrose Street, Glasgow G1 1XJ, UK
3
WestCHEM, Centre for Process Analytics and Control Technology (CPACT), Department of Pure and Applied Chemistry, University of Strathclyde, 295 Cathedral Street, Glasgow G1 1XL, UK
*
Author to whom correspondence should be addressed.
Submission received: 21 September 2020 / Revised: 6 October 2020 / Accepted: 9 October 2020 / Published: 12 October 2020
(This article belongs to the Special Issue Crystallization Processes: Food and Pharmaceutical Crystals)

Abstract

:
Lovastatin crystals often exhibit an undesirable needle-like morphology. Several studies have shown how a needle-like morphology can be modified in antisolvent crystallisation with the use of additives, but there is much less experimental work demonstrating crystal shape modification without the use of additives. In this study, a series of unseeded continuous antisolvent crystallisation experiments were conducted with the process conditions of supersaturation, total flow rate, and ultrasound level being varied to determine their effects on crystal size and shape. This experimental work involved identifying acetone/water as the most suitable solvent/antisolvent system, assessing lovastatin nucleation behaviour by means of induction time measurements, and then designing and implementing the continuous antisolvent crystallisation experiments. It was found that in order to produce the smallest and least needle-like particles, the maximum total flow rate and supersaturation had to be combined with the application of ultrasound. These results should aid development of pharmaceutical manufacturing processes where the ability to control particle size and shape would allow for optimisation of crystal isolation and more efficient downstream processing.

Graphical Abstract

1. Introduction

Crystallisation is an important unit operation which is widely used for particle formation, purification, and separation in the pharmaceutical industry. In particular, antisolvent crystallisation is often implemented when the solubility of the solute has a weak dependence on temperature or if the solute has thermal instability issues. The traditional approach in the pharmaceutical industry is to operate the antisolvent crystallisation process batch-wise in a stirred tank reactor (STR), but this presents several challenges [1]. The major challenge is that of scaling up, as it is usually very difficult to transfer from the batch antisolvent addition method used in the laboratory to the batch antisolvent addition method used in production. For this reason, there has been greater effort put into utilising continuous mixing methods in place of batch addition methods. Continuous mixing is typically achieved with the use of static mixers, as their confined volumes allow for intense and controlled mixing, which is much easier to scale [2,3,4]. Static mixers are especially useful in processes that exhibit fast kinetics, where the mixing time needs to be minimised. However, producing solids in these small volumes can lead to major fouling and blockage issues, which is the main challenge that still has to be overcome.
It is common to implement an unseeded antisolvent crystallisation process with the aim of producing a crystal seed suspension. The size, shape, and polymorphic form of these seed crystals will be determined by several factors, which have been explored in previous literature [5,6,7,8,9,10]. By achieving good control over the properties of these seed crystals, the overall crystallisation process can be better controlled. Several studies [11,12,13,14,15] have utilised continuous mixing strategies in antisolvent crystallisation with the specific aim of controlling particle size distribution (PSD) and/or mean particle size. Some studies [11,16,17,18] have compared continuous mixing processes in static mixers with conventional batch processes and shown that the more controlled mixing environment in the static mixer does result in a more narrow PSD with a smaller mean particle size. Furthermore, when using a static mixer, the PSD and mean particle size can be controlled by changing the initial supersaturation and flow velocity [11,12,13,15,17,18]. Sometimes ultrasound is applied to rapidly mixed, highly supersaturated solutions to further decrease particle size due to enhanced primary nucleation rates [14,16].
Lovastatin is an active pharmaceutical ingredient (API) in the statin family, which is used for the treatment of hypercholesterolemia [19,20]. As a compound, it is well characterised and reported in the literature [21,22,23,24,25,26,27]. With regards to the crystal structure of lovastatin, there is currently only one known polymorphic form [21]. The crystal structure of this polymorph, as recorded in the Cambridge Structural Database (CSD) with CSD reference code CEKBEZ01, yields a predicted needle-like morphology, which has been confirmed experimentally in several studies [23,24,25,26,27]. It is because of this needle-like morphology that lovastatin has been selected as the focus of this work, although it should be noted that many other crystalline materials also exhibit a needle-like morphology, e.g., L-glutamic acid, p-aminobenzoic acid, carbamazepine, ibuprofen, and Brivaracetam [9,28,29,30,31,32]. Needle-like crystals are undesirable in the pharmaceutical industry, as they present significant challenges to crystal isolation (filtration, drying) and exhibit poor flow properties complicating further downstream unit operations, such as blending [33,34]. For these reasons, it would clearly be desirable to modify the shape of needle-like crystals produced in a crystallisation process, for example by modifying the relative growth rates of the different crystal faces [23,24,34]. Several studies have demonstrated this type of crystal shape control in antisolvent crystallisation with the use of additives [35,36,37]. More specifically, additives were used in a study to demonstrate how the aspect ratio of lovastatin crystals could be modified by a factor of 3.8 in evaporative and cooling crystallisation [24]. In addition to using additives, it is possible by changing the antisolvent used that the crystal shape can be modified [34,38,39], but in a process where the solvent/antisolvent system is fixed, there have been no methods reported for controlling crystal shape. Therefore, it would be beneficial to develop an antisolvent crystallisation process where the particle size and shape can be controlled by the process conditions alone, without using any additives.
In this study, we firstly performed a solvent/antisolvent screen based on literature data and experimental measurements, which resulted in acetone/water being selected as the most suitable solvent/antisolvent system for the antisolvent crystallisation of lovastatin. A series of induction time measurements were then made to assess the nucleation behaviour of lovastatin before conducting a series of unseeded continuous antisolvent crystallisation experiments. In these continuous experiments, the supersaturation and total flow rate were varied in an effort to control particle size and shape. In addition, ultrasound was either applied or not applied to the mixing region in order to further control the particle size and shape. Process analytical technology (PAT) was used for in situ monitoring of the antisolvent crystallisation process via focussed beam reflectance measurement (FBRM) and ultraviolet-visible (UV-vis) and infrared (IR) spectroscopies.

2. Materials and Methods

2.1. Materials

Lovastatin (>98.5%) was obtained from Molekula. Acetone (>99.8%) was obtained from VWR. 2-Butanone (>99.5%) and tert-Butyl acetate (>99%) were obtained from Sigma Aldrich. Deionised water was produced using the in-house Milli-Q system (Merck Millipore, Burlington, MA, USA).

2.2. Methods

2.2.1. Experimental Solubility Measurements

For each of the shortlisted solvent/antisolvent pairs from the solvent/antisolvent screen (acetone/water, acetone/tert-butyl acetate, and 2-butanone/tert-butyl acetate), the lovastatin solubility was experimentally measured at various solvent/antisolvent compositions. These solubility measurements were performed at 25 °C for all the solvent/antisolvent pairs and at 45 °C for the acetone/water system only. As discussed in Section 3.2, the additional solubility measurements at 45 °C were made for the acetone/water system, because this was the system that showed the most promise for antisolvent crystallisation based on the solubility measurements at 25 °C.
All solubility measurements for the shortlist of solvent/antisolvent pairs (acetone/water, acetone/tert-butyl acetate, and 2-butanone/tert-butyl acetate) were performed using the same gravimetric method. A slurry of lovastatin in the desired solvent/antisolvent mixture was stirred in an 8 mL vial sitting on a submersible stirrer plate inside a water bath set at the desired temperature (25 or 45 °C). A magnetic stirrer was inside each vial to agitate the slurry at 700 rpm. For each solvent/antisolvent mixture, vials were held at 24, 48, and 72 h to ensure the slurry had reached equilibrium. At least three vials were used for each combination of solvent/antisolvent mixture and time point to ensure the results were reliable. At each time point, agitation was stopped and a pipette was used to withdraw 1–2 mL of clear mother liquor from each vial and injected into new vials. The new vials containing the clear mother liquor were placed in a vacuum oven to evaporate the solvent. Once all the solvent had evaporated the solid residue in each vial was weighed. Knowledge of the masses at each point in this procedure allowed for the solution concentration to be determined. If solid–liquid equilibrium has been reached (which is demonstrated by the values at different time points) then the solution concentration corresponds to the solubility value at that specific temperature and solvent/antisolvent composition.

2.2.2. Induction Time Measurements

This study utilised an unseeded antisolvent crystallisation process and for that reason induction time measurements were conducted to identify the most suitable operating conditions. The initial lovastatin solution was prepared by dissolving lovastatin powder in an acetone/water solvent mixture (90:10 wt.%) to create a solution with a concentration of 91.63 g/kg solvent. This initial solution composition was chosen, as this gives the greatest opportunity for supersaturation generation when the water antisolvent is added. All induction times were measured by using a pipette to rapidly add the water antisolvent to an 8 mL sample vial containing 2 g lovastatin solution. The vials were submerged in a water bath set at 25 °C. Throughout the measurements, the samples were stirred at 700 rpm with a magnetic stirrer. Different masses of water were added to reach different supersaturation levels. The masses of water added were 2, 1, 0.67, 0.5, and 0.4 g, which corresponded to solution:antisolvent mass ratios of 1:1, 2:1, 3:1, 4:1, and 5:1, respectively. These corresponded to supersaturation levels of 13.7, 5.20, 2.65, 1.88, and 1.55, respectively. In this work, supersaturation (S) was defined as the ratio of solution concentration to saturation concentration. This addition of antisolvent to lovastatin solution in the 8 mL vials was monitored with a webcam, with the induction time being the time between the point of antisolvent addition and the point where the solution becomes turbid.

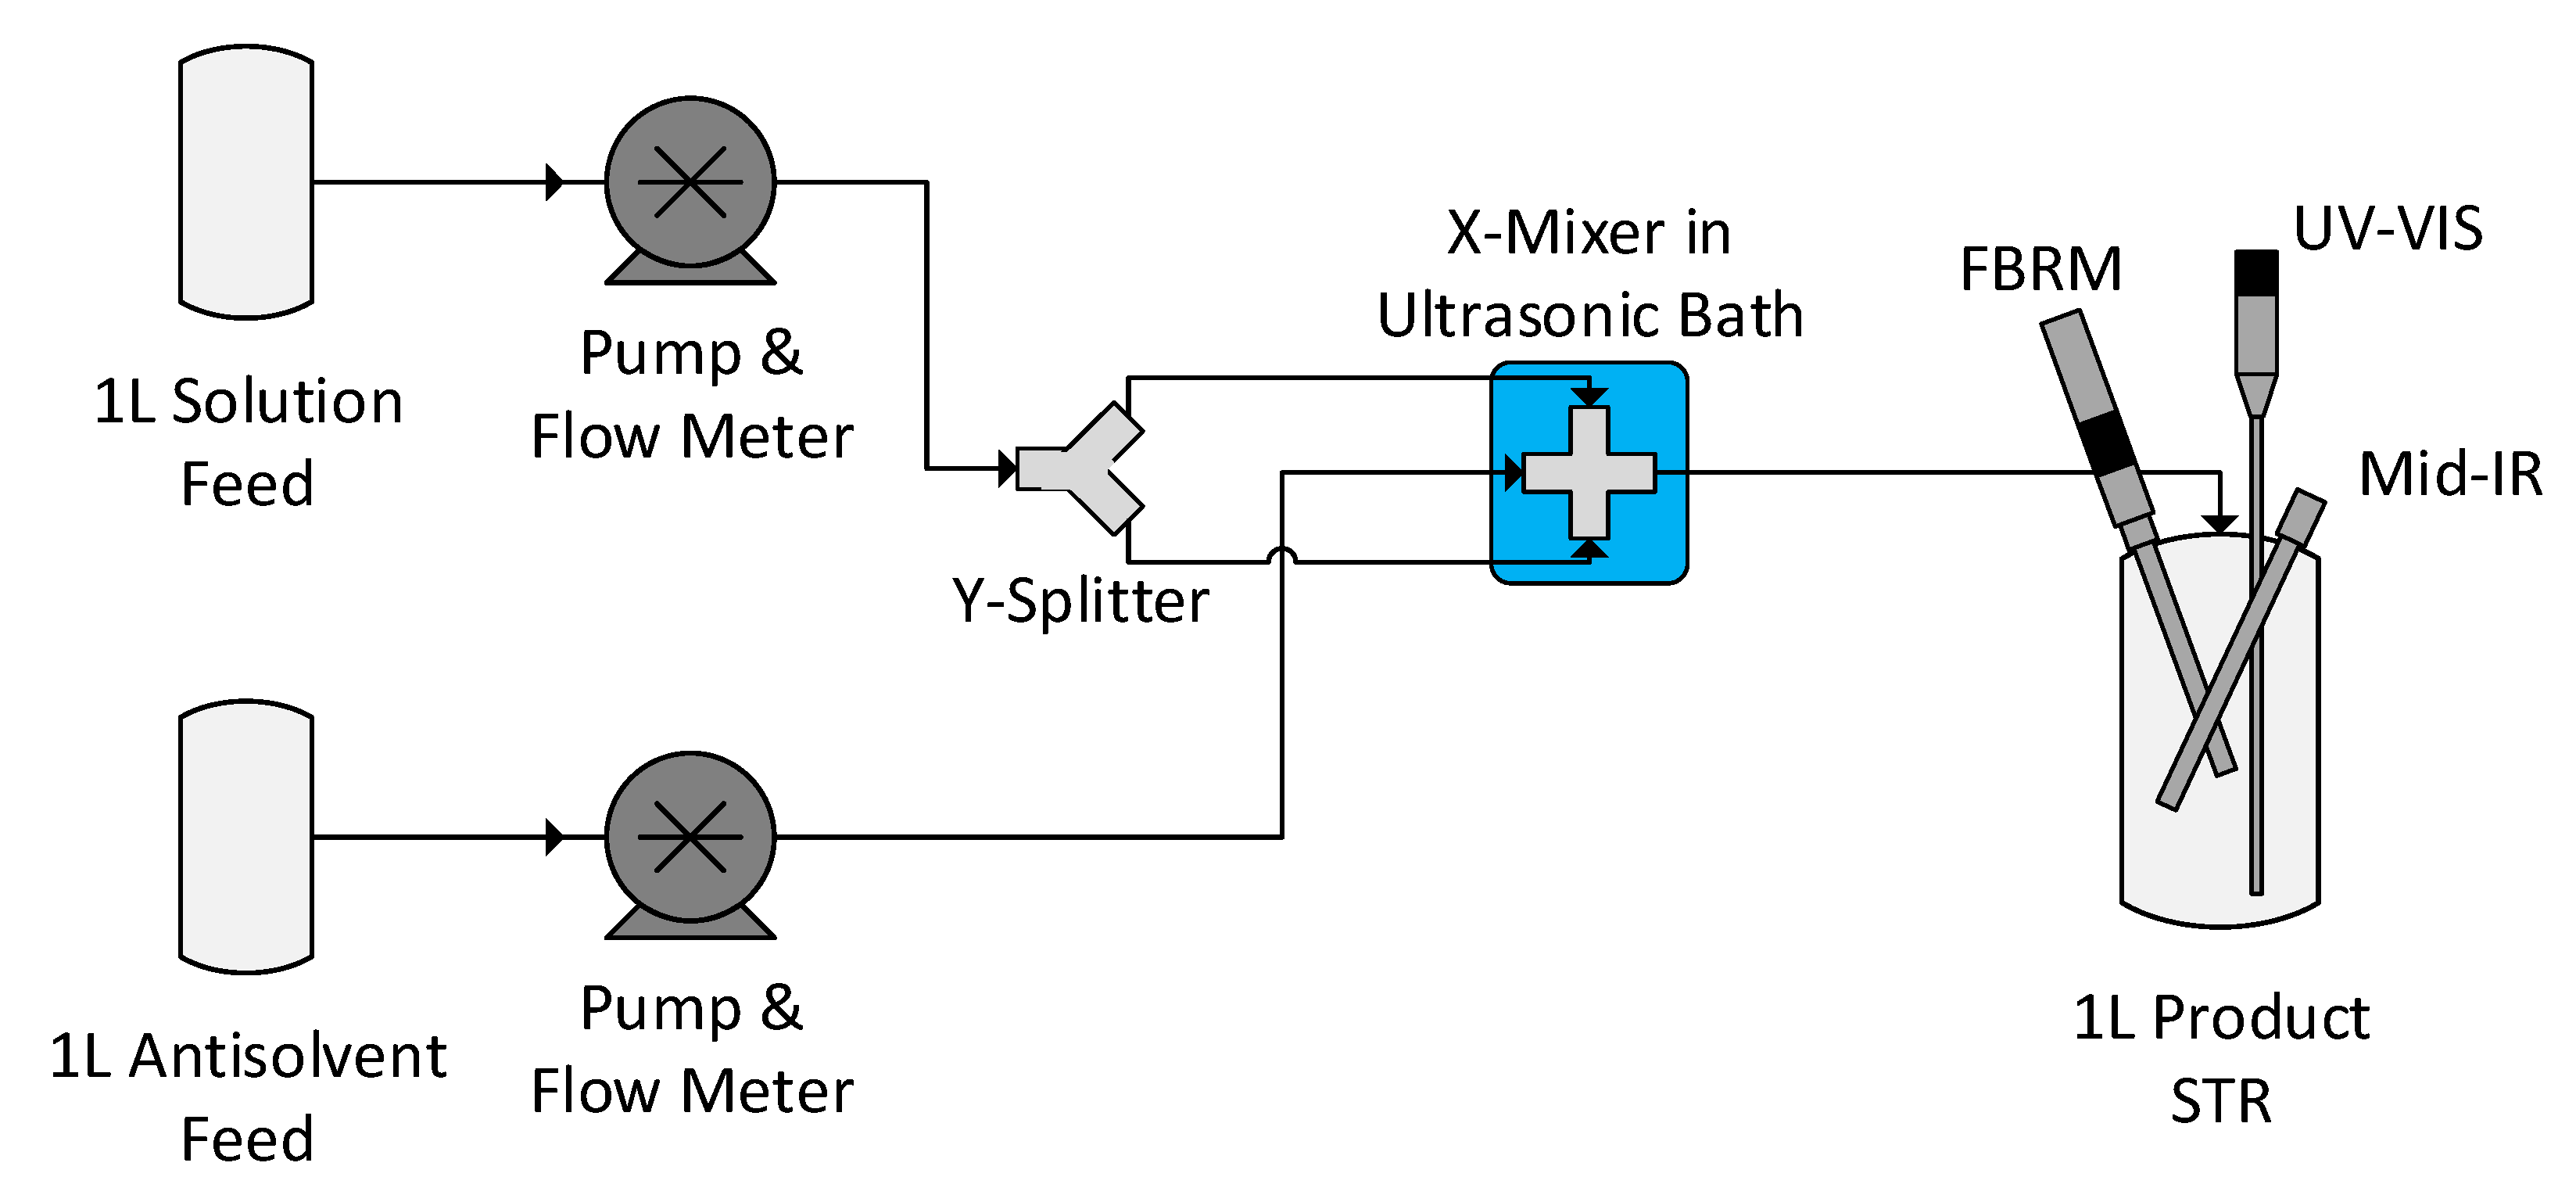
2.2.3. Antisolvent Crystallisation of Lovastatin

Lovastatin crystals were produced in an unseeded antisolvent crystallisation process. This process was initiated by the continuous mixing of the solution and antisolvent with the use of a static mixer. In particular, an X-shaped static mixer was selected over other shapes due to it being able to minimise the difference in velocity between the feed streams when there is a large difference in flow rates between the solution and antisolvent. Minimising the difference in velocities helps avoid backflow. The product of this mixing process was then continuously fed to a 1 L jacketed stirred tank reactor (STR) to allow for the crystallisation to proceed and for PAT monitoring to take place.
The initial lovastatin solution was prepared by dissolving lovastatin powder in an acetone/water solvent mixture (90:10 wt.%) to create a solution with a concentration of 91.63 g/kg solvent (same as for the induction time measurements). Pure deionised water was used as the antisolvent. A diagram of the full antisolvent crystallisation setup is shown in Figure 1.
The lovastatin solution was pumped from a flask through a Y-mixer to split it in half before it recombined in the X-mixer, while the water antisolvent was pumped from a flask through the centre of the X-mixer. This approach meant that the two streams started mixing in the centre of the X-mixer, and the resultant mixture flowed to the jacketed 1 L STR. The agitation rate in the STR was always 500 rpm, as this was the minimum that could be used while still keeping the crystals fully suspended. The STR jacket maintained the temperature at 25 °C. The X and Y mixers, and all connected tubing, had 1/8 th in. internal diameter throughout. The X and Y mixers had smooth bores and no internal geometry. The feed solutions were pumped through the X-mixer to the STR using a Bronkhorst Mini CORI-FLOW system coupled with gear pumps, allowing for accurate control of mass flow rates. Several probes were inserted into the STR in order to monitor the lovastatin crystallisation process throughout. The purpose of the FBRM probe was to monitor particle size, the purpose of the UV-vis probe was to monitor lovastatin solution concentration, and the purpose of the IR probe was to monitor solvent composition. In addition to online monitoring, slurry samples were collected from the STR at the end of the experiment and filtered immediately in a Buchner funnel with 0.45 μm filter paper. All the filtered solid samples were dried overnight under vacuum. The dry powder samples were analysed by the Morphologi G3 (Malvern Panalytical, Malvern, United Kingdom) to determine particle size and aspect ratio in addition to the Tensor II Fourier Transform Infrared (FTIR) Spectrometer (Bruker, Billerica, MA, USA) to confirm there have been no observable changes in the solid form. The total mass flow rate through the system was either 200 or 400 g/min, while the lovastatin solution:water antisolvent flow ratio ranged from 1:1 to 3:1. The ultrasonic bath in which the X-mixer was submerged was set to either “on” or “off”.

2.2.4. Offline Analysis of Dry Powder Samples

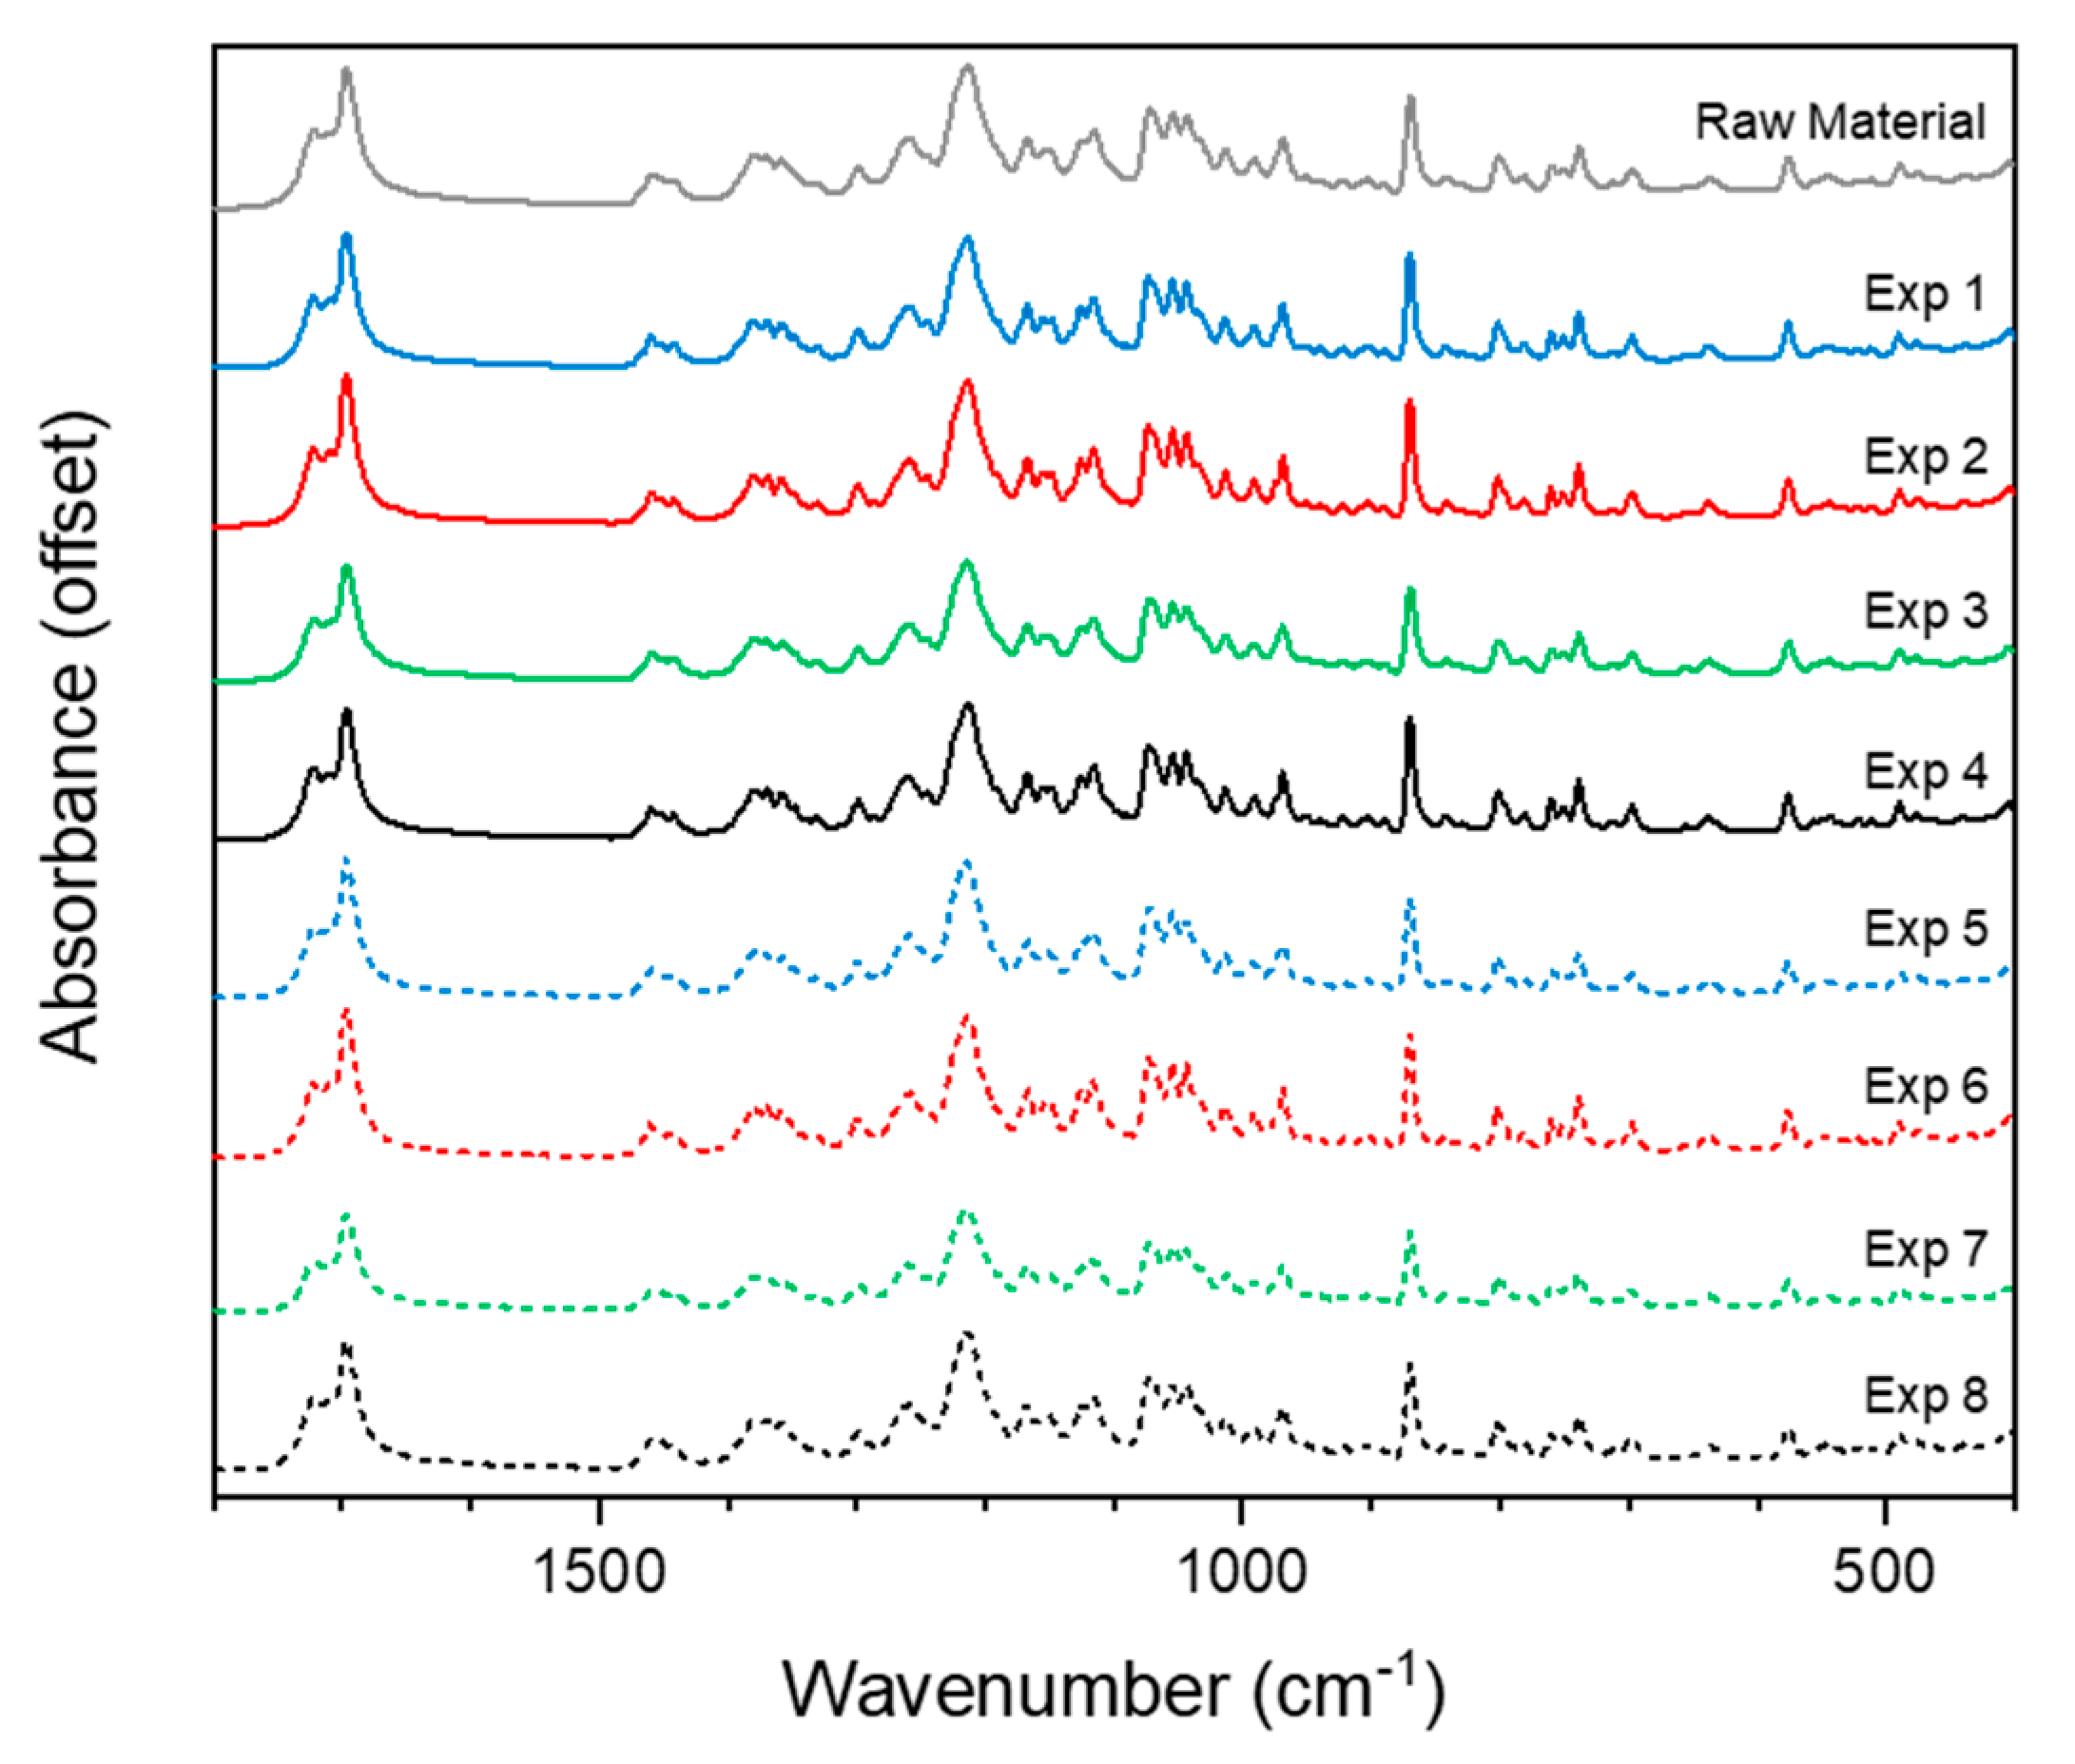
Fourier Transform Infrared Spectroscopy (FTIR)
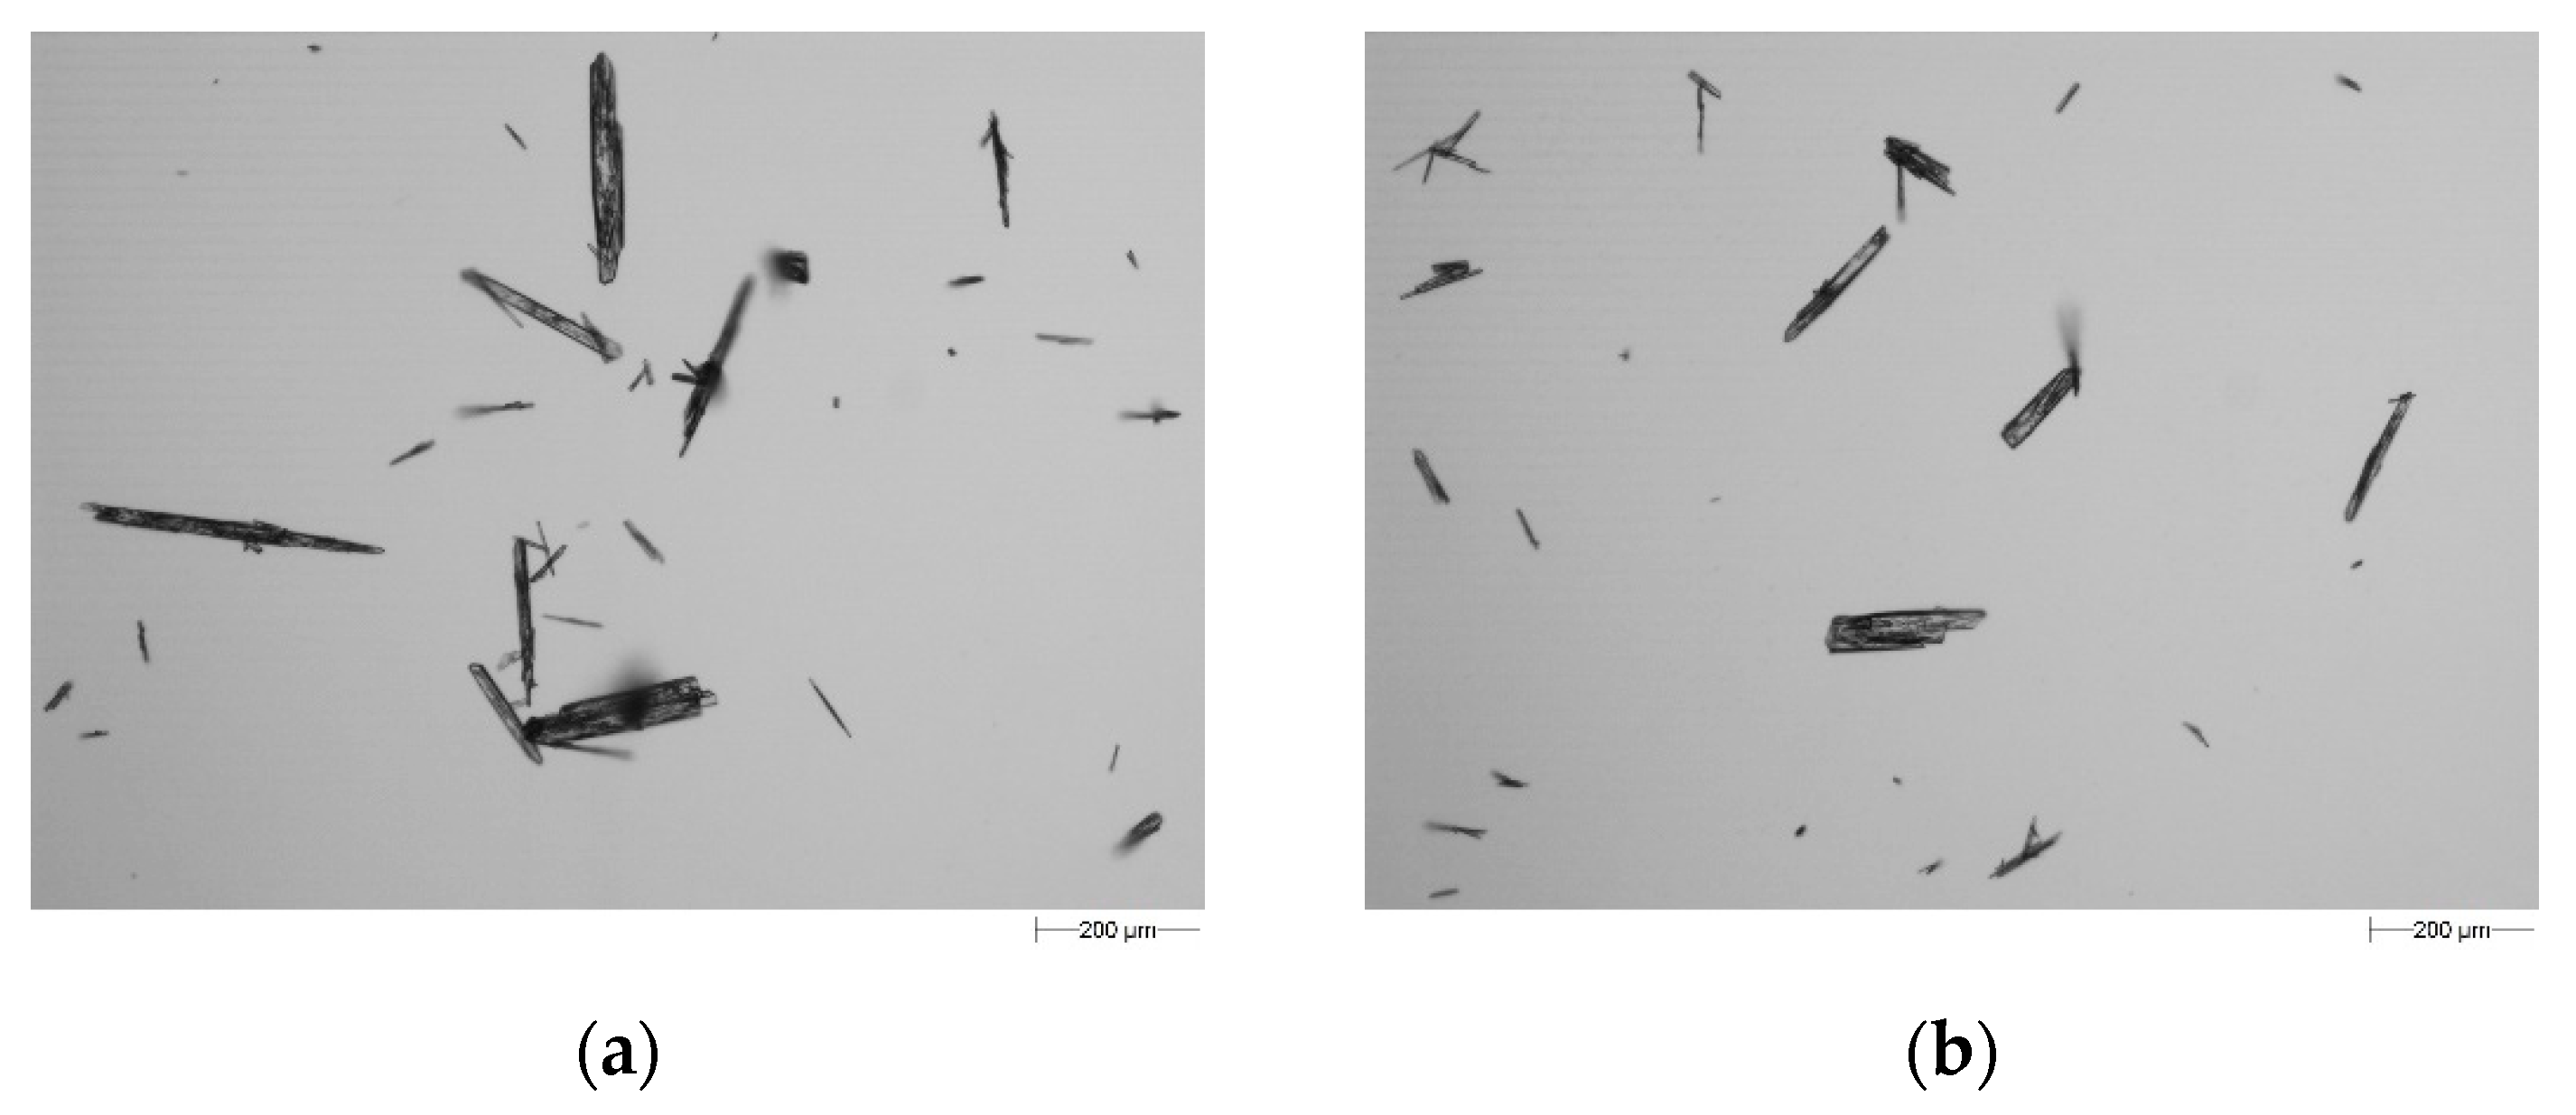
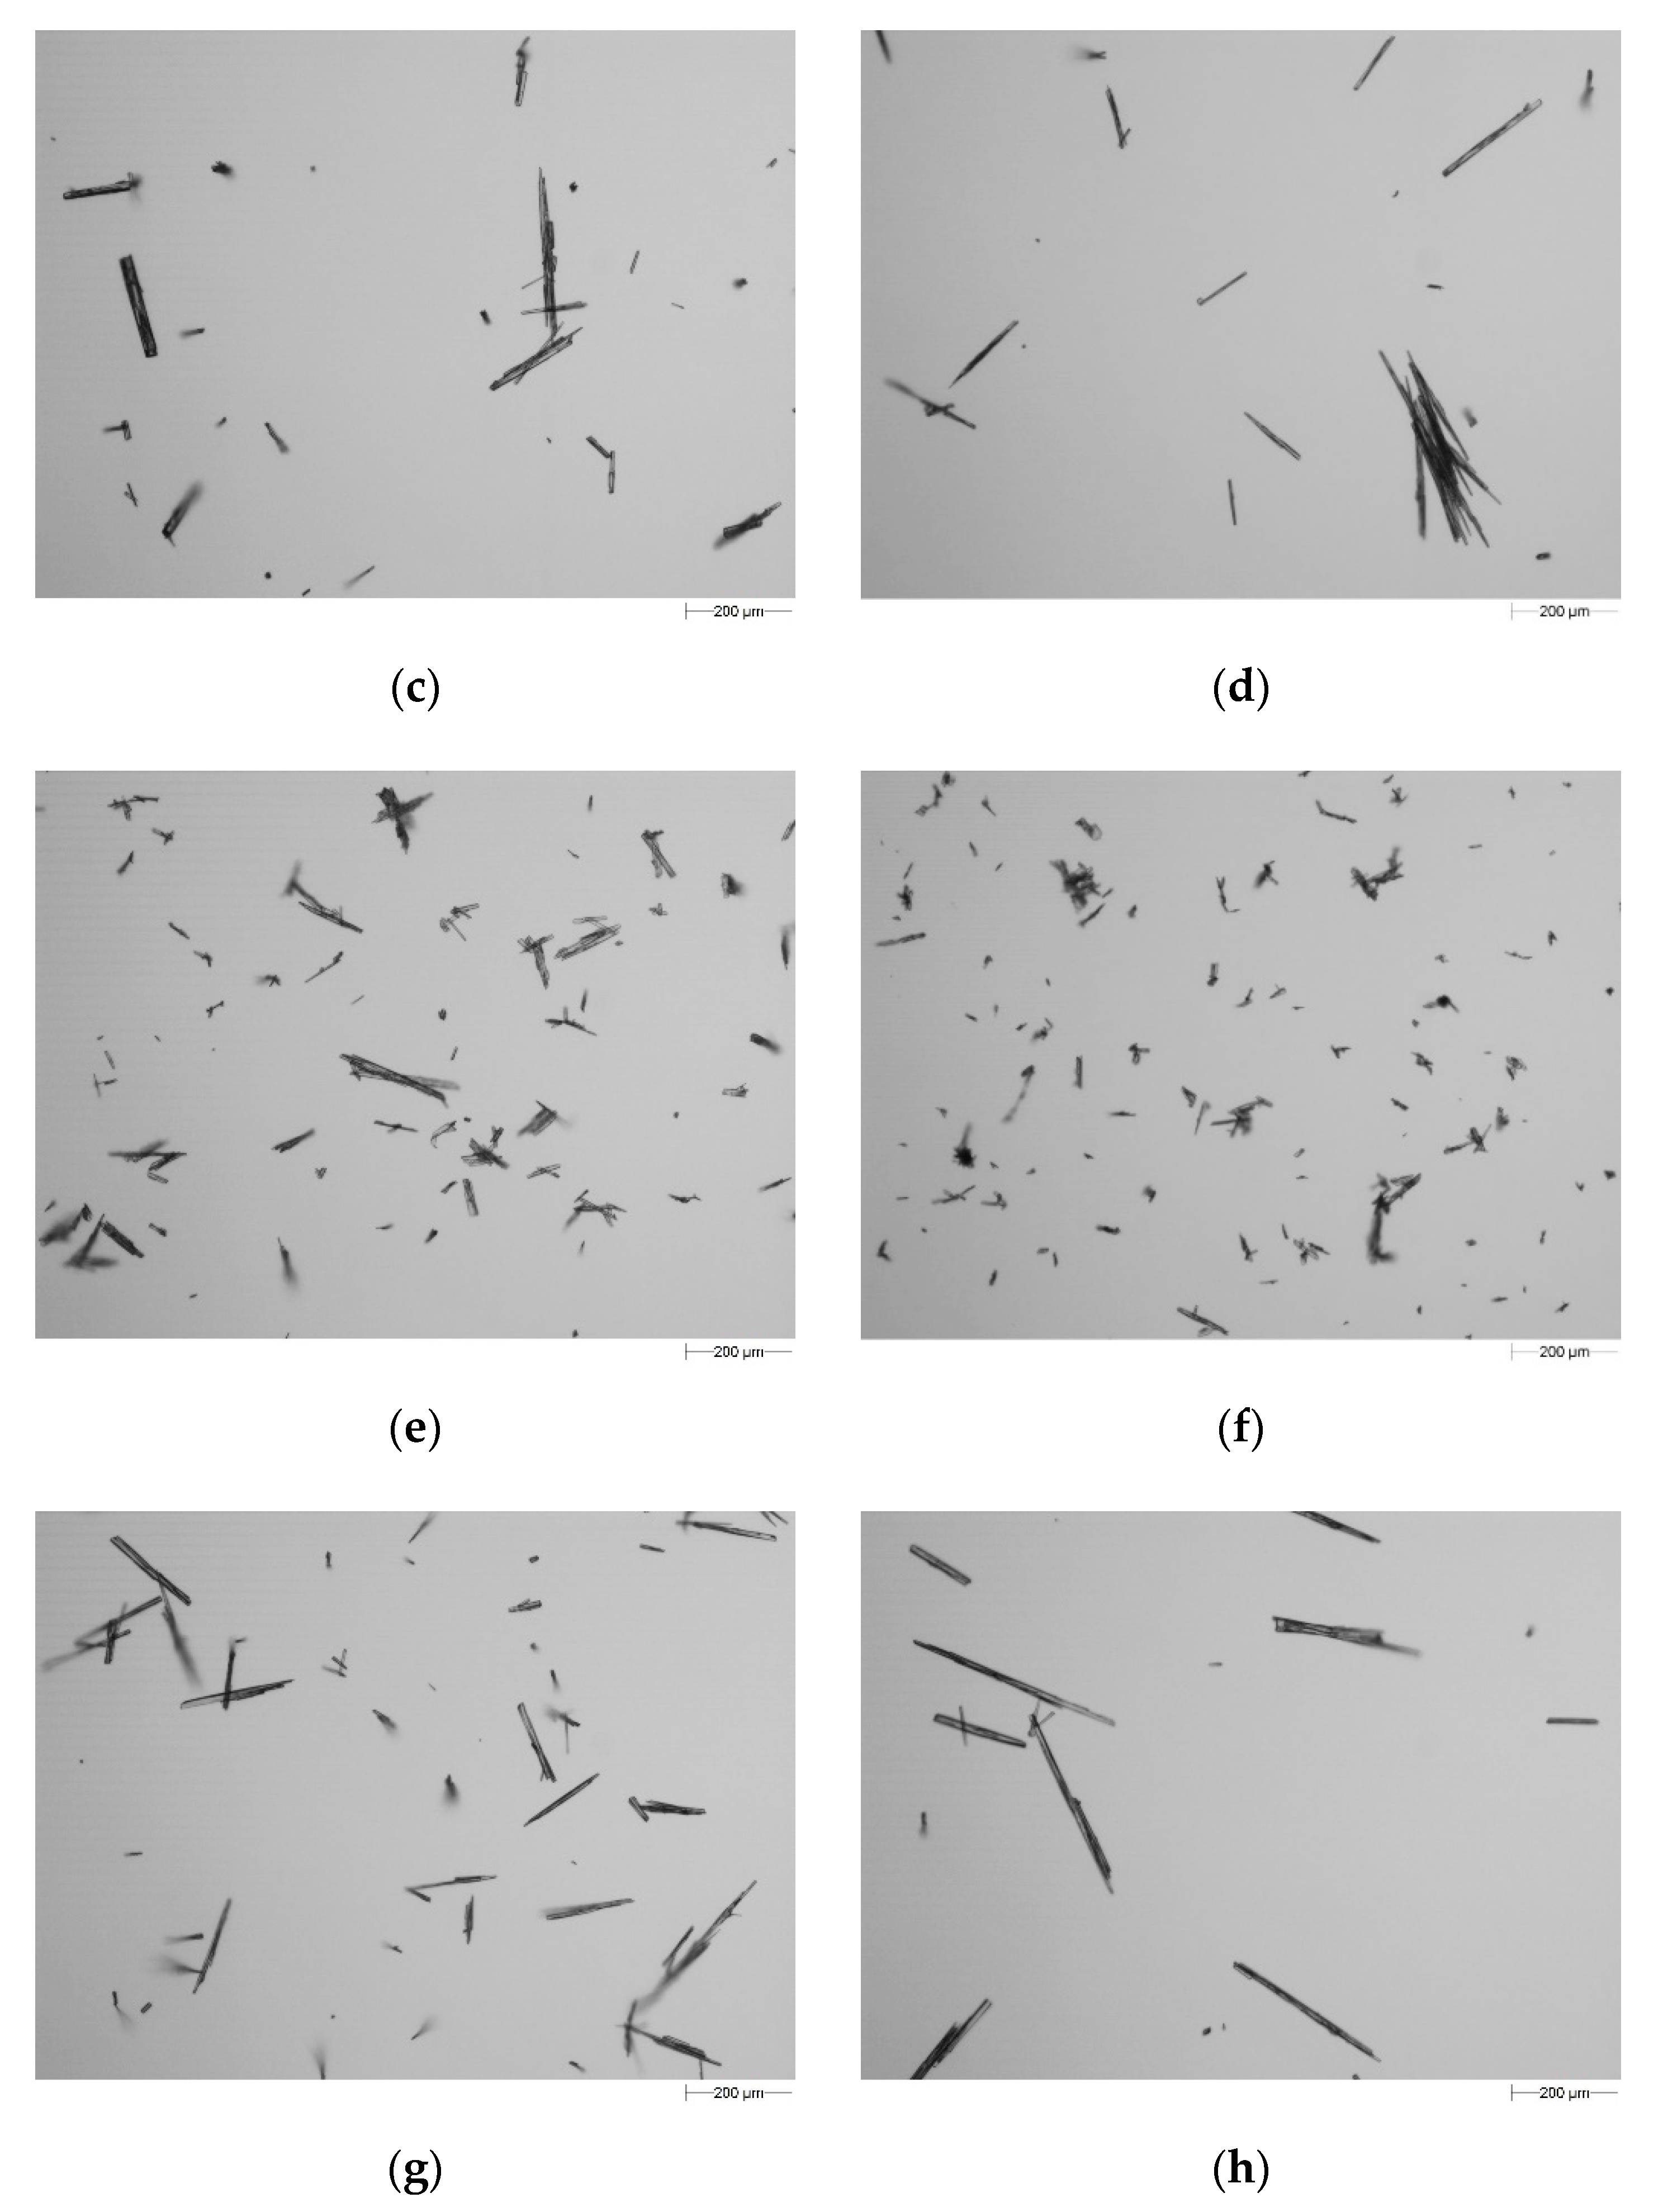
The dry powder samples were analysed by the Bruker Tensor II FTIR to check for observable changes in the solid form. The IR spectra were collected for each dry powder sample and compared with the raw material used to prepare the initial lovastatin solutions to check if the solid form had changed. Spectra were acquired averaging eight scans of the IR region from 4000 to 400 cm−1, with a resolution of 4 cm−1. Before each sample spectrum was collected, the background spectrum was collected. The background spectrum was collected in the air at room temperature. No samples were ground before analysis.

Optical Microscopy

The dry powder samples were analysed by the Malvern Morphologi G3 to obtain the particle size and aspect ratio distributions. The procedure involved placing the solid sample into the integrated powder dispersion unit and using a low energy dispersion method to form a circle of flat separate particles on the glass plate. A low energy was used in order to break up agglomerates but not break the individual particles. The instrument then scanned the powder sample while capturing images with the use of 5× magnification, as this ensured the full range of particle sizes were in focus. For all of the particles captured, the full range of size and shape properties were determined by the integrated image analysis software.

2.2.5. Online Process Analytical Technology (PAT) Monitoring

To monitor the solute concentration and solvent composition, ATR probe measurements were selected to ensure in situ sampling of the liquid phase. Lovastatin is known to absorb in the UV region [40], making UV a suitable technique for monitoring the solute concentration. To account for the change in solvent composition, reference spectra were collected in air and the physical properties were not expected to change significantly with the change in solvent composition [41]. IR was selected for monitoring of the solvent composition. Data for calibration model building was collected via a series of dilutions, with the UV and IR spectra recorded simultaneously, to minimise the quantity of the lovastatin used for process development (a key performance indicator for the project). Full details of the calibration model building procedure are provided in the Supplementary Materials. These include the experimental details of the data acquisition in addition to the calibration model development.
UV-vis and IR spectra were both collected in absorbance mode, using an air reference. UV-vis spectra were acquired using a MCS 501 UV-NIR spectrometer (Carl Zeiss Spectroscopy, Jena, Germany) with a 6 mm ATR probe (Katana 6, 12334/2.4602) (Hellma Analytics, Müllheim, Germany). Spectra were acquired at 15 s intervals using an integration time of 65 ms, 16 scans, and over the range 200–600 nm. IR spectra were acquired using an ABB MB3000 spectrometer (Clairet Scientific Ltd., Northampton, UK) with a 12 mm diamond ATR probe (ACC3–8008). Spectra were acquired at 30 s intervals with a resolution of 4 cm−1 and 8 scans, over a range of 500–2000 cm−1 and using a gain of 3600.
Data analysis was performed in Matlab (R2018a, Mathworks, Natick, MA, USA) using PLS_Toolbox (8.6.2, Eigenvector Research, Manson, WA, USA).

3. Results and Discussion

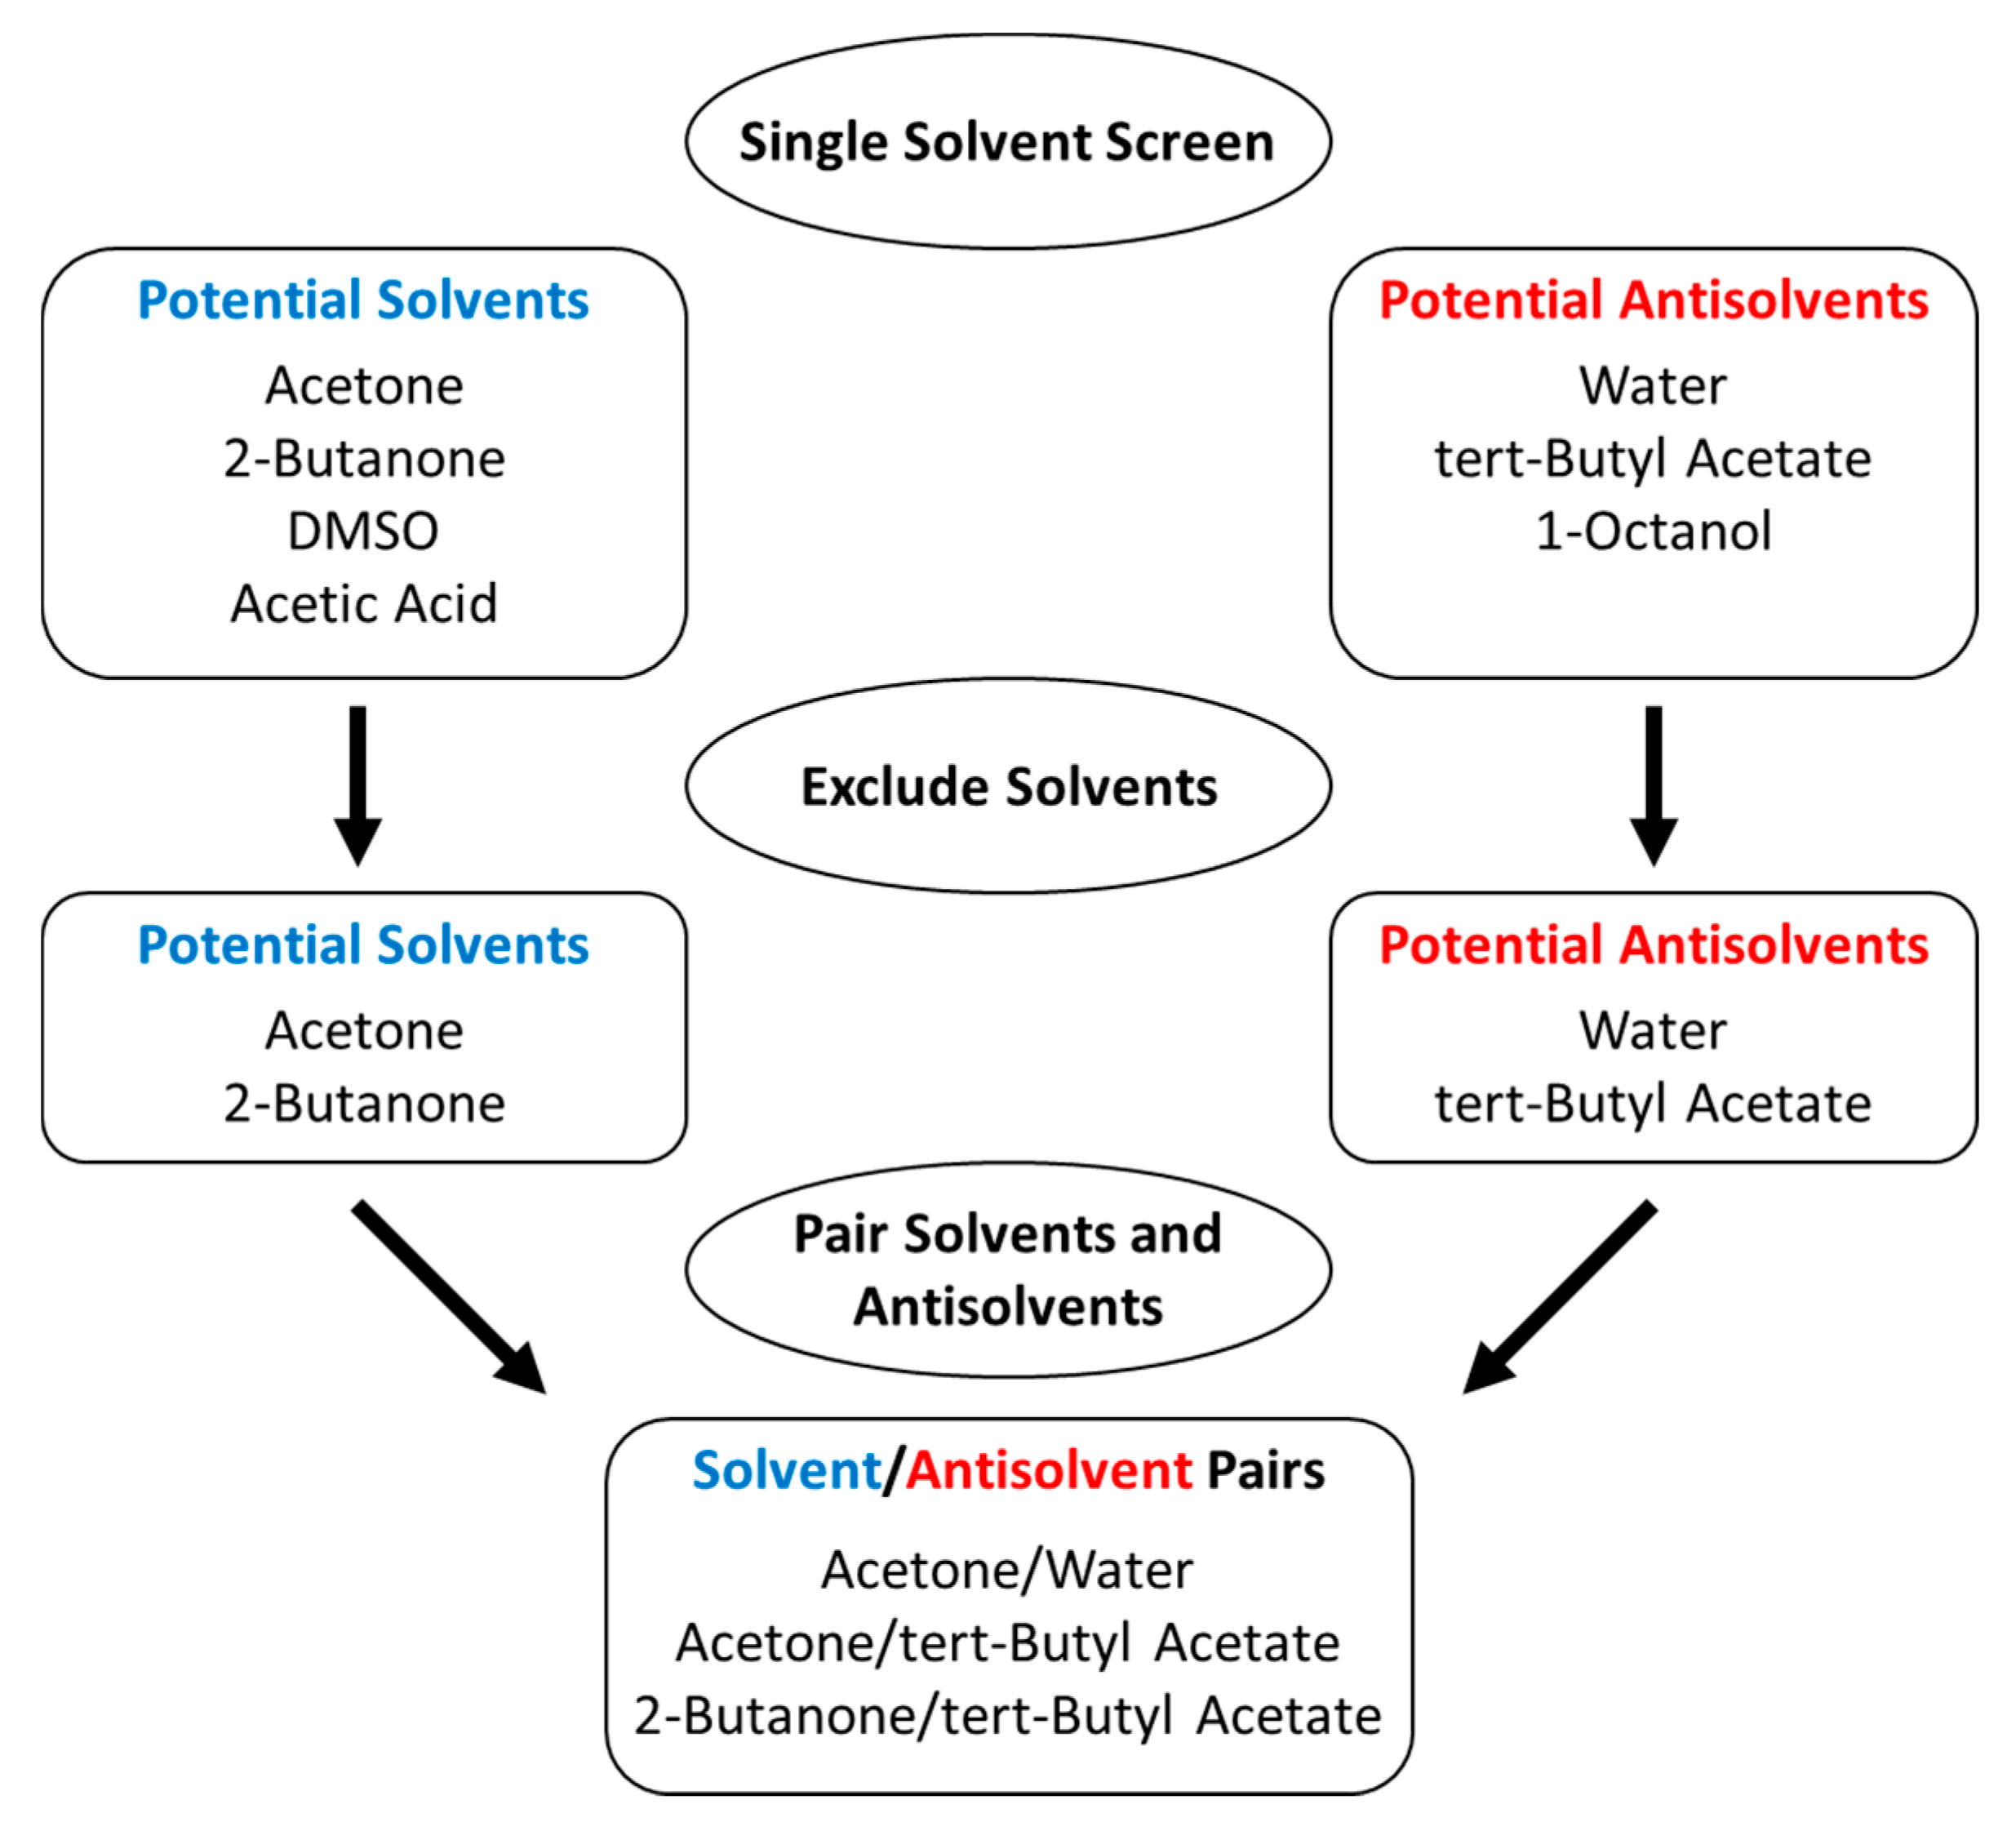
3.1. Literature Solvent/Antisolvent Screen

The solvent/antisolvent screen involved broadly classifying solvents as either soluble or insoluble (solvent or antisolvent) based solely on literature solubility data [42,43,44]. Solvents considered in this screen were restricted to class 2 (solvents to be limited) and 3 (solvents with low toxic potential) solvents from the ICH classification for residual solvents [45]. Furthermore, potential solvents and antisolvents were excluded if they had extreme physical properties. Dimethyl sulfoxide (DMSO) and acetic acid were excluded as potential solvents, because their freezing points ruled out cooling below 16 °C. 1-Octanol was excluded as a potential antisolvent, because its viscosity is much greater than the potential solvents. Therefore, the remaining potential solvents were acetone and 2-butanone, while the remaining potential antisolvents were water and tert-butyl acetate.
This solvent/antisolvent screen resulted in a list of potential solvent/antisolvent pairs, which was then refined by excluding those pairs that are immiscible or have a viscosity ratio greater than 3 (may cause emulsions) [46]. Therefore, the refined list of potential solvent/antisolvent pairs is as follows: acetone/water, acetone/tert-butyl acetate, and 2-butanone/tert-butyl acetate. This screening process is graphically depicted in Figure 2.

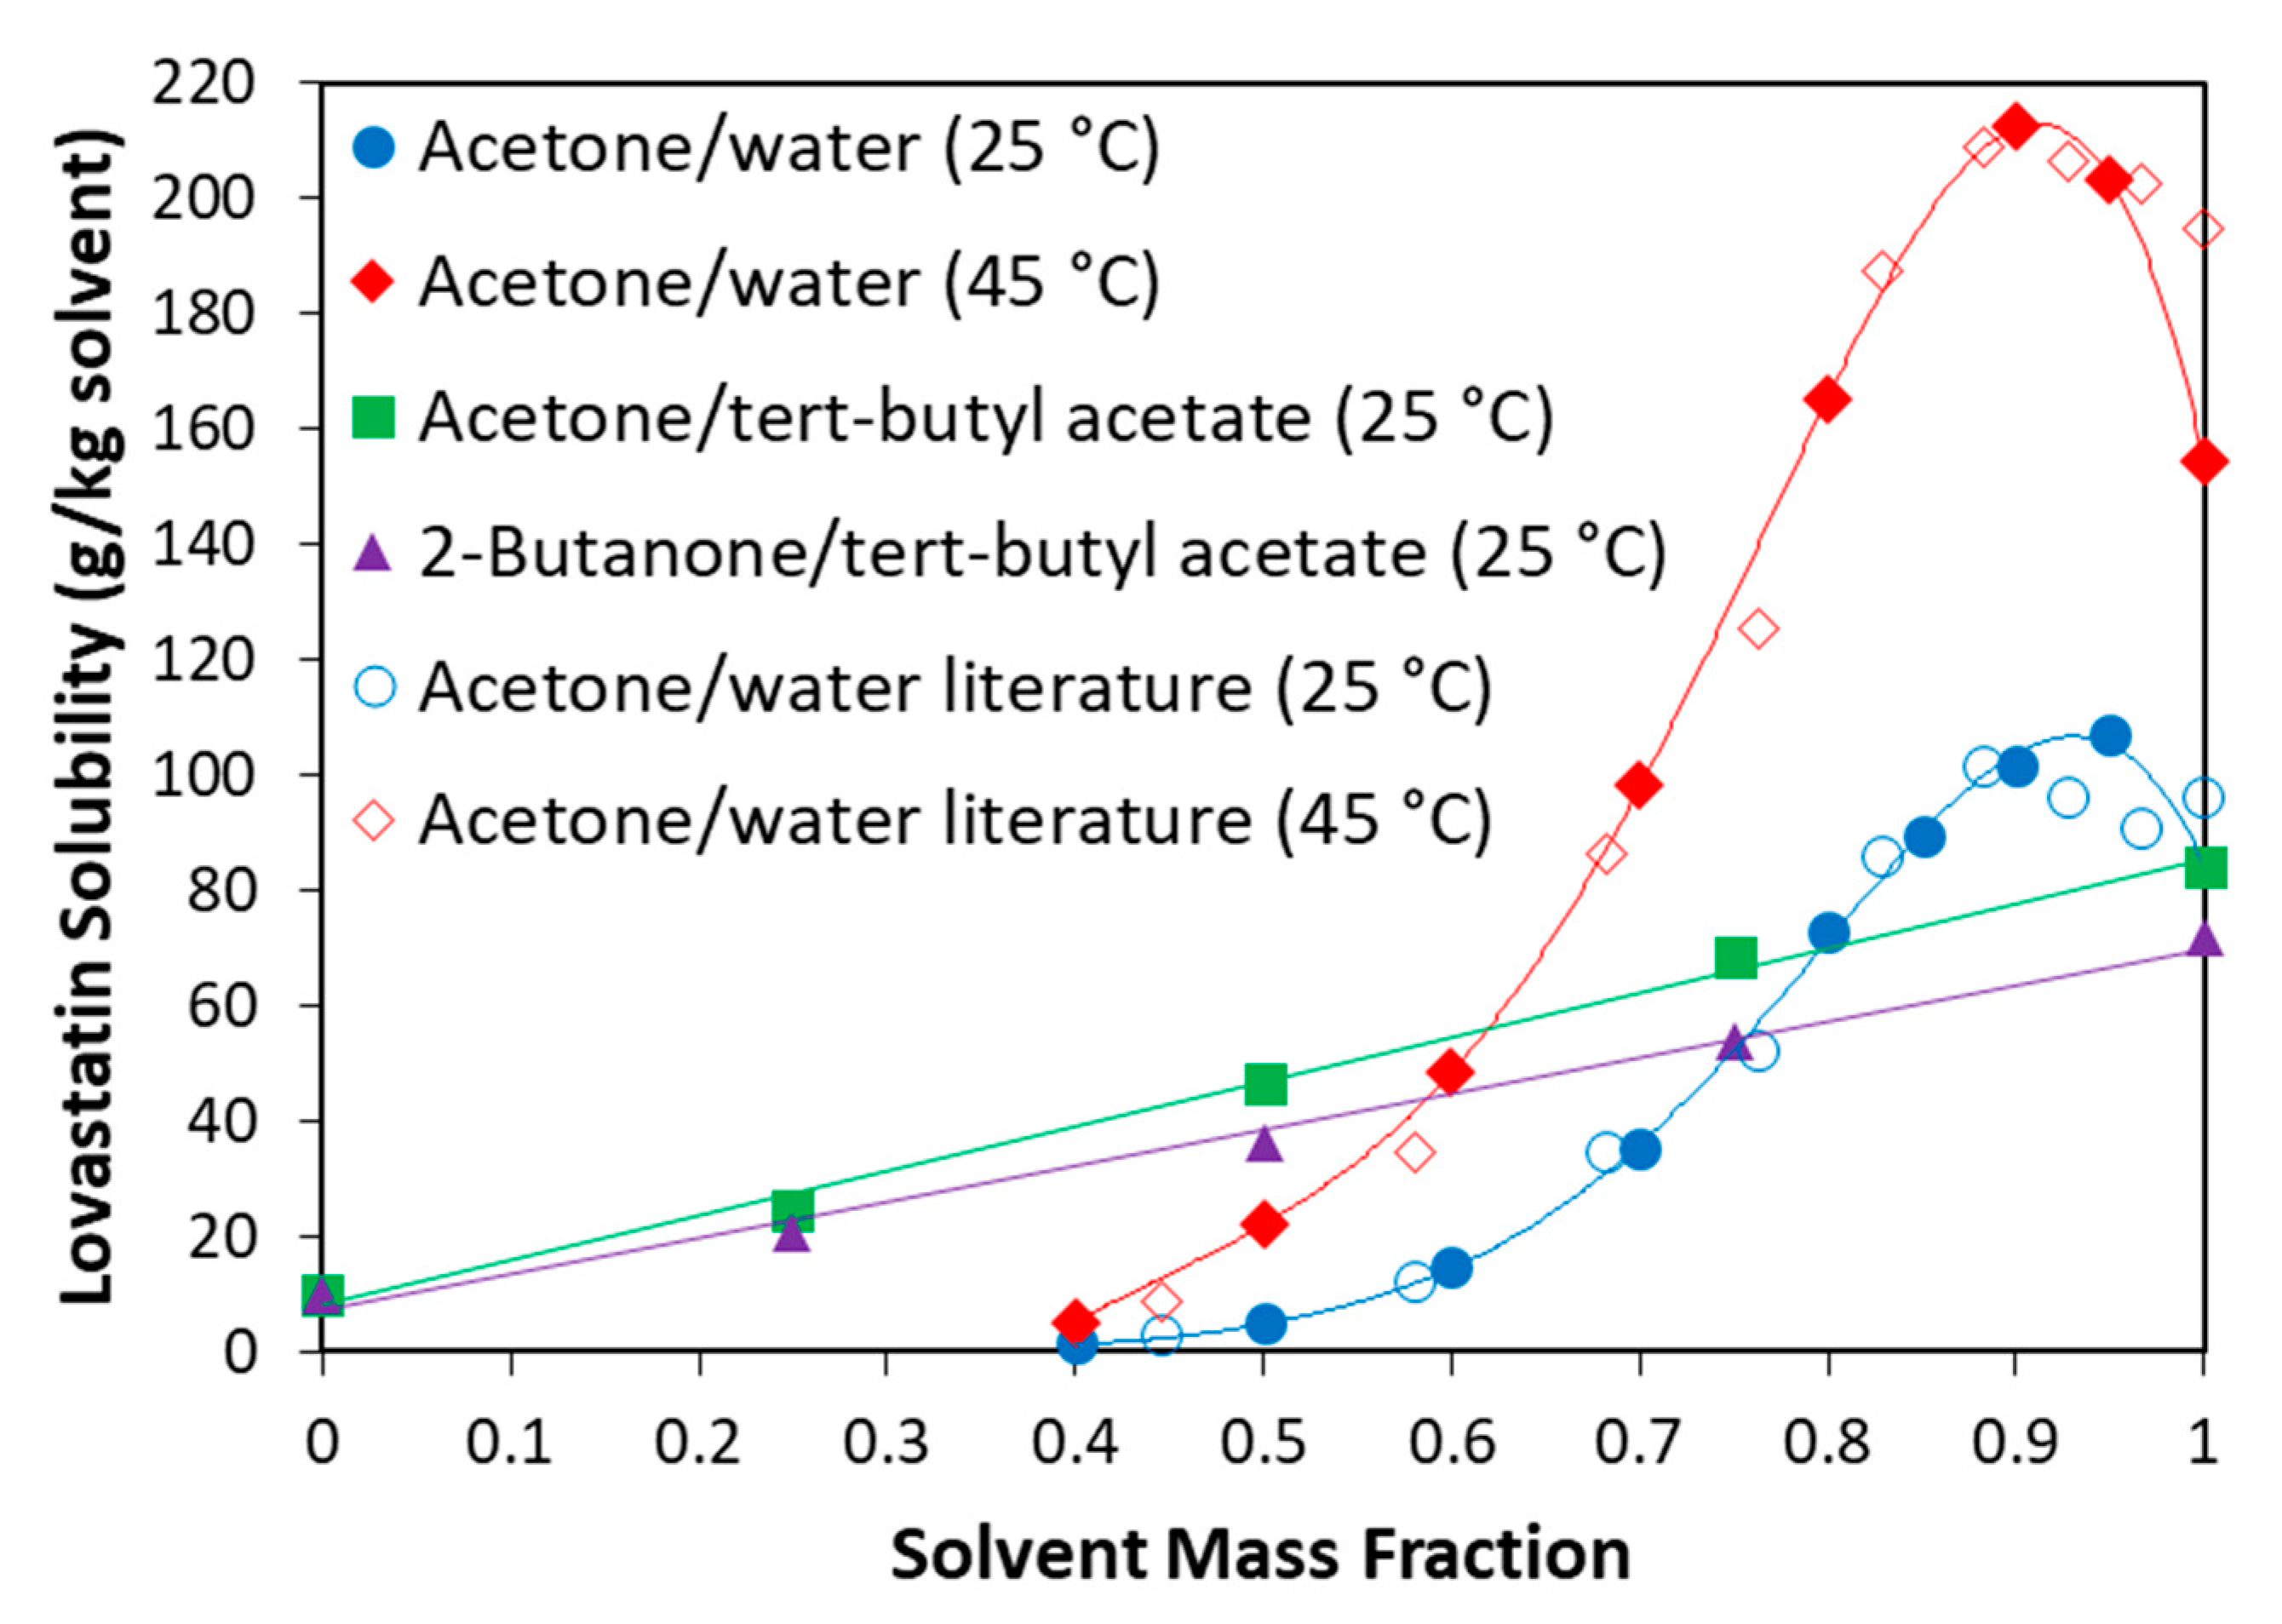
3.2. Experimental Solubility Measurements

The measured lovastatin solubility in various acetone/water mixtures at both 25 and 45 °C is shown in Figure 3 and compared with literature data [47] for comparison. The measured lovastatin solubility in various acetone/tert-butyl acetate mixtures and various 2-butanone/tert-butyl acetate mixtures at 25 °C are also shown in Figure 3.
The shape of the mixed-solvent solubility curve is clearly very important in antisolvent crystallisation and must fulfil the requirement that with increasing antisolvent fraction, the solubility of the solute decreases at a greater rate than the rate of dilution if an antisolvent is added. This allows for antisolvent addition to generate a supersaturated solution where crystallisation may proceed. With regards to maximising crystallisation yield, the solute solubility should decrease at as great a rate as possible when the antisolvent is added. With these considerations in mind, it is clear from Figure 3 that the shapes of the mixed-solvent solubility curves for acetone/tert-butyl acetate and 2-butanone/tert-butyl acetate are not suitable for the antisolvent crystallisation of lovastatin. In fact, acetone/water is the only solvent/antisolvent system that is suitable.
For the acetone/water system, the measured values agree very well with the literature values. One small difference is the lower measured solubility value in pure acetone compared with literature at 45 °C. This difference could be due to the difference in measurement techniques. This study used a gravimetric method, while the literature study [47] utilised a laser system where the laser intensity was monitored while adding lovastatin powder to the solvent mixture. It is thought that the laser system had a limit of detection with regards to the excess mass of particles that would be required to see a clear response in the laser intensity. This could have led to a small over-adding of lovastatin powder, which would have led to a small overestimation of solubility.

3.3. Induction Time Measurements

The measured induction times for the antisolvent crystallisation of lovastatin are shown in Figure 4. The results demonstrate that the induction times are strongly dependent on supersaturation with higher supersaturations leading to very short induction times (and a small spread) and lower supersaturations leading to very long induction times (and a large spread), as expected. If a seeded antisolvent crystallisation process with little/no primary nucleation was desired, then a supersaturation of 1.88 or less would be suitable due to the long induction times exhibited. However, this study required the operation of an unseeded antisolvent crystallisation process, and so a supersaturation of at least 2.65 was required. At supersaturation 2.65, there is an appreciable induction time (between 45 s and 3 min), whereas at the higher supersaturation levels the induction time is near zero, which could lead to differences in the crystal product. Therefore, for the unseeded antisolvent crystallisation process in this study, the selected target supersaturations were 2.65, 5.20, and 13.7, which correspond to solution:antisolvent mass flow ratios of 3:1, 2:1, and 1:1, respectively.

3.4. Antisolvent Crystallisation of Lovastatin

3.4.1. Experimental Conditions

The aim of this study was to control lovastatin particle size and shape. Therefore, a series of experiments were performed that varied the key process conditions, namely solution: antisolvent flow ratio (supersaturation), total flow rate, and ultrasound level, to investigate their effect on these particle attributes. The experimental conditions used in the antisolvent crystallisation experiments are shown in Table 1. All of these experiments were performed at 25 °C, and the composition of the initial lovastatin solution was the same.

3.4.2. Process Overview

The experimental conditions determine how the crystallisation proceeds in the experimental setup. In all the experiments, except Experiment 4, visible nucleation takes place in the tubing immediately after the static mixer but before the STR. Therefore, these experimental conditions are prone to fouling of the tubing and PAT with blockage of the tubing also occurring after a certain period of time (ranging from 1 to 3.5 min). Conversely, in Experiment 4, the STR is filled with the mixture before visible nucleation takes place. For this reason, there is no blockage of the tubing and the PAT is fouled much less. It should be noted that there was no visible fouling of the STR walls in any of the experiments.
For each antisolvent crystallisation experiment, the dry powder sample was analysed with the Bruker Tensor II FTIR in order to obtain the IR spectra. The IR spectra, shown in Figure 5, confirm that there is no observable difference in solid form between the lovastatin produced in the antisolvent crystallisation experiments and the raw material used to prepare the initial lovastatin solutions. This is to be expected, as lovastatin is thought to exhibit only one polymorphic form.

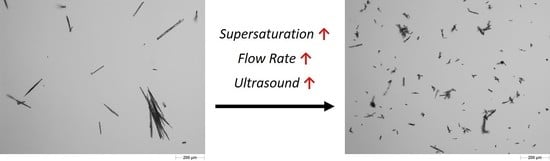
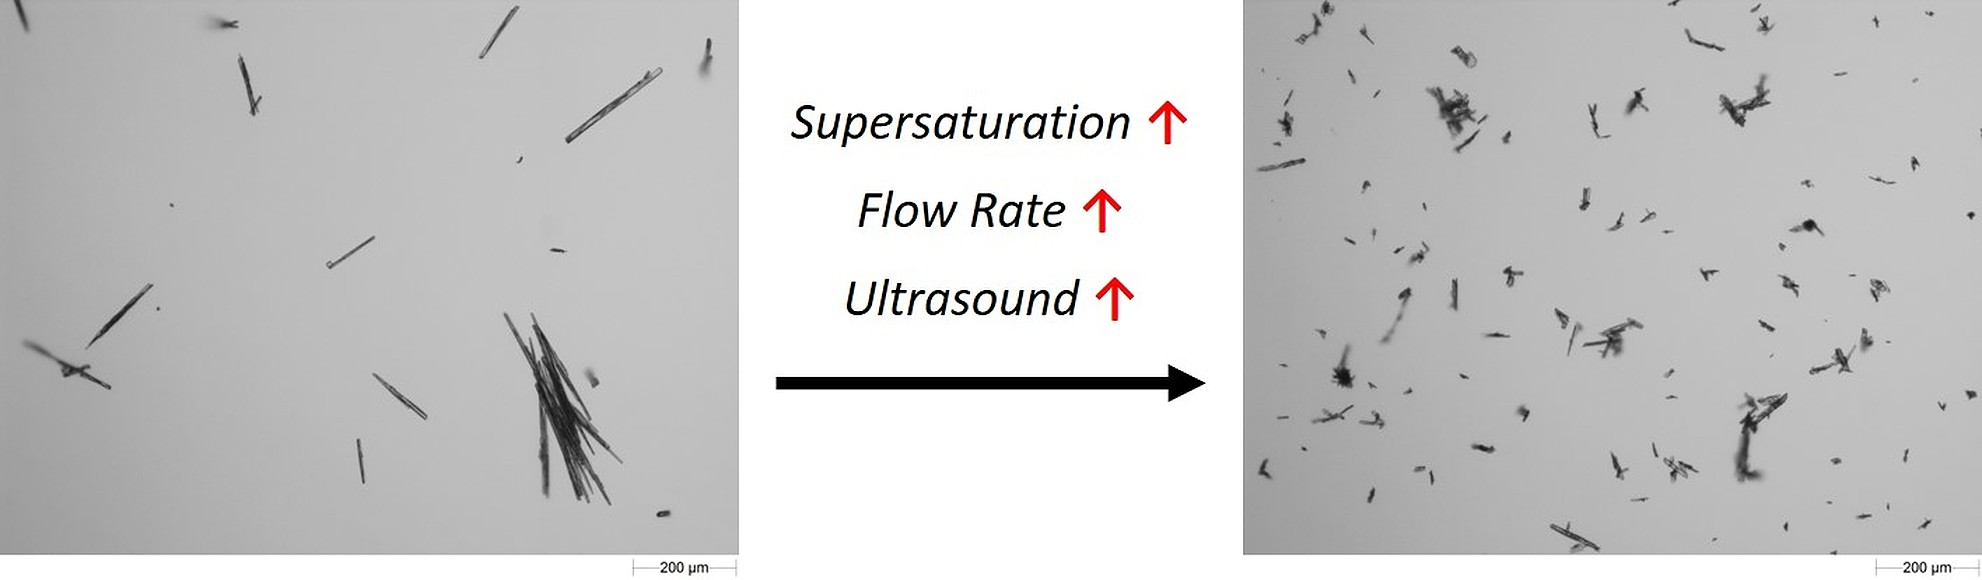
3.4.3. Particle Size and Shape

For each antisolvent crystallisation experiment, the dry powder sample was analysed with the Malvern Morphologi G3 in order to obtain the particle size and aspect ratio distributions. The volume-weighted length distribution for each experiment is shown in Figure 6.
The length distributions show that the particle size is reduced by decreasing flow ratio (increasing supersaturation), increasing total flow rate, and using ultrasound. In particular, the conditions used in Experiment 6, where the maximum supersaturation, maximum total flow rate, and use of ultrasound are combined, produces significantly smaller particles than in the other experiments. The length distributions also show that the use of ultrasound has by far the greatest effect on particle size, whereas supersaturation and total flow rate have comparatively minor effects. This could be explained by ultrasound causing significant increase in primary nucleation rates, which increases the number of particles and reduces subsequent crystal size.
The aspect ratio distribution for each experiment is shown in Figure 7. Here, aspect ratio is defined as the ratio of the Feret’s minimum length to the Feret’s maximum length which means that values closer to 0 are more needle-like and values closer to 1 are less needle-like.
The aspect ratio distributions show that the use of ultrasound appears to make the particles less needle-like in the experiments operated at the highest supersaturation but not in the experiments operated at the two lower supersaturations. Similarly, increasing the supersaturation from 2.65 to 5.2 has little effect on the aspect ratio distribution whether ultrasound is applied or not. The conditions used in Experiment 6, where the maximum supersaturation, maximum total flow rate, and use of ultrasound are combined, produce crystals that are significantly less needle-like. These observations are confirmed by the microscope images taken by the Morphologi G3 with the crystals from all the experiments being shown in Figure 8 to visually demonstrate the changes in particle size and shape. Comparing experiments 4 and 6, the most to least needle-like product, the aspect ratio has been modified approximately by a factor of 2.7, which is similar to the factor of 3.8 achieved in literature [24] when using additives to crystallise lovastatin in an ethyl acetate system.
The fact that Experiment 6 produced both the smallest length and least needle-like particles provides some insight into how supersaturation and sonication affect the crystal size and shape. While the length of the crystals is significantly reduced, the aspect ratio is significantly increased. To understand why this may have happened, it is important to consider the mechanism behind the formation of needle-like morphologies. Needle-like morphologies form because the elongated axis grows at a much faster rate than the other axes [34]. For this reason, the needle-like morphology can be inhibited by reducing the growth rate of the elongated axis relative to the other axes. This can be due to additives, which selectively inhibit growth along the elongated axis, but no addtives were used in this work. It can also be due to differences in solvent composition or in supersaturation, as these can influence the ratio of growth rates along different axes. Therefore, we believe the less needle-like crystals in Experiment 6 can be explained by the variation in supersaturation and/or solvent composition of the crystal growth environment due to the occurrence of oiling out at these conditions. It should be noted that oiling out was not directly observed during the experiments, as the mixture became cloudy immediately upon mixing, but it is a compelling hypothesis. If oiling out did occur, this type of liquid–liquid phase separation (LLPS) would result in nuclei forming inside oil droplets and growing in an environment that is significantly different to the other experiments in terms of both local supersaturation and solvent composition [48]. This hypothesis is also consistent with previous observations that ultrasound can influence where in the phase diagram LLPS will take place [49,50].

3.4.4. Yield and Solid Recovery

The yield (percentage of lovastatin recovered with respect to total amount of material dissolved) and solid recovery (percentage of lovastatin recovered with respect to the amount of material that could be crystallised based on solubility) were calculated for each experiment. The yield and solid recovery values for each experiment are shown in Table 2.
In the experiments where ultrasound is not applied, the solid recovery values are relatively high (81–96%). In the experiments where ultrasound is applied, there is a clear trend that as supersaturation is increased, the solid recovery decreases, falling from 96% to 60%. In addition, at the lower supersaturations of 2.65 and 5.2, the application of ultrasound has no significant effect on solid recovery. On the other hand, at the highest supersaturation of 13.7, the application of ultrasound appears to significantly decrease the solid recovery. All of these trends appear to suggest that the combination of high supersaturation and the use of ultrasound somehow results in less material being crystallised, which is surprising. Taking this result into consideration with the particle size and aspect ratio data seems to show that not only are nucleation rates increased and growth reduced, but the growth process is limited. Again, this may also be explained by the occurrence of oiling out, because the growth environment within the oil droplets may have a limited solute concentration, which would inhibit overall crystal growth.

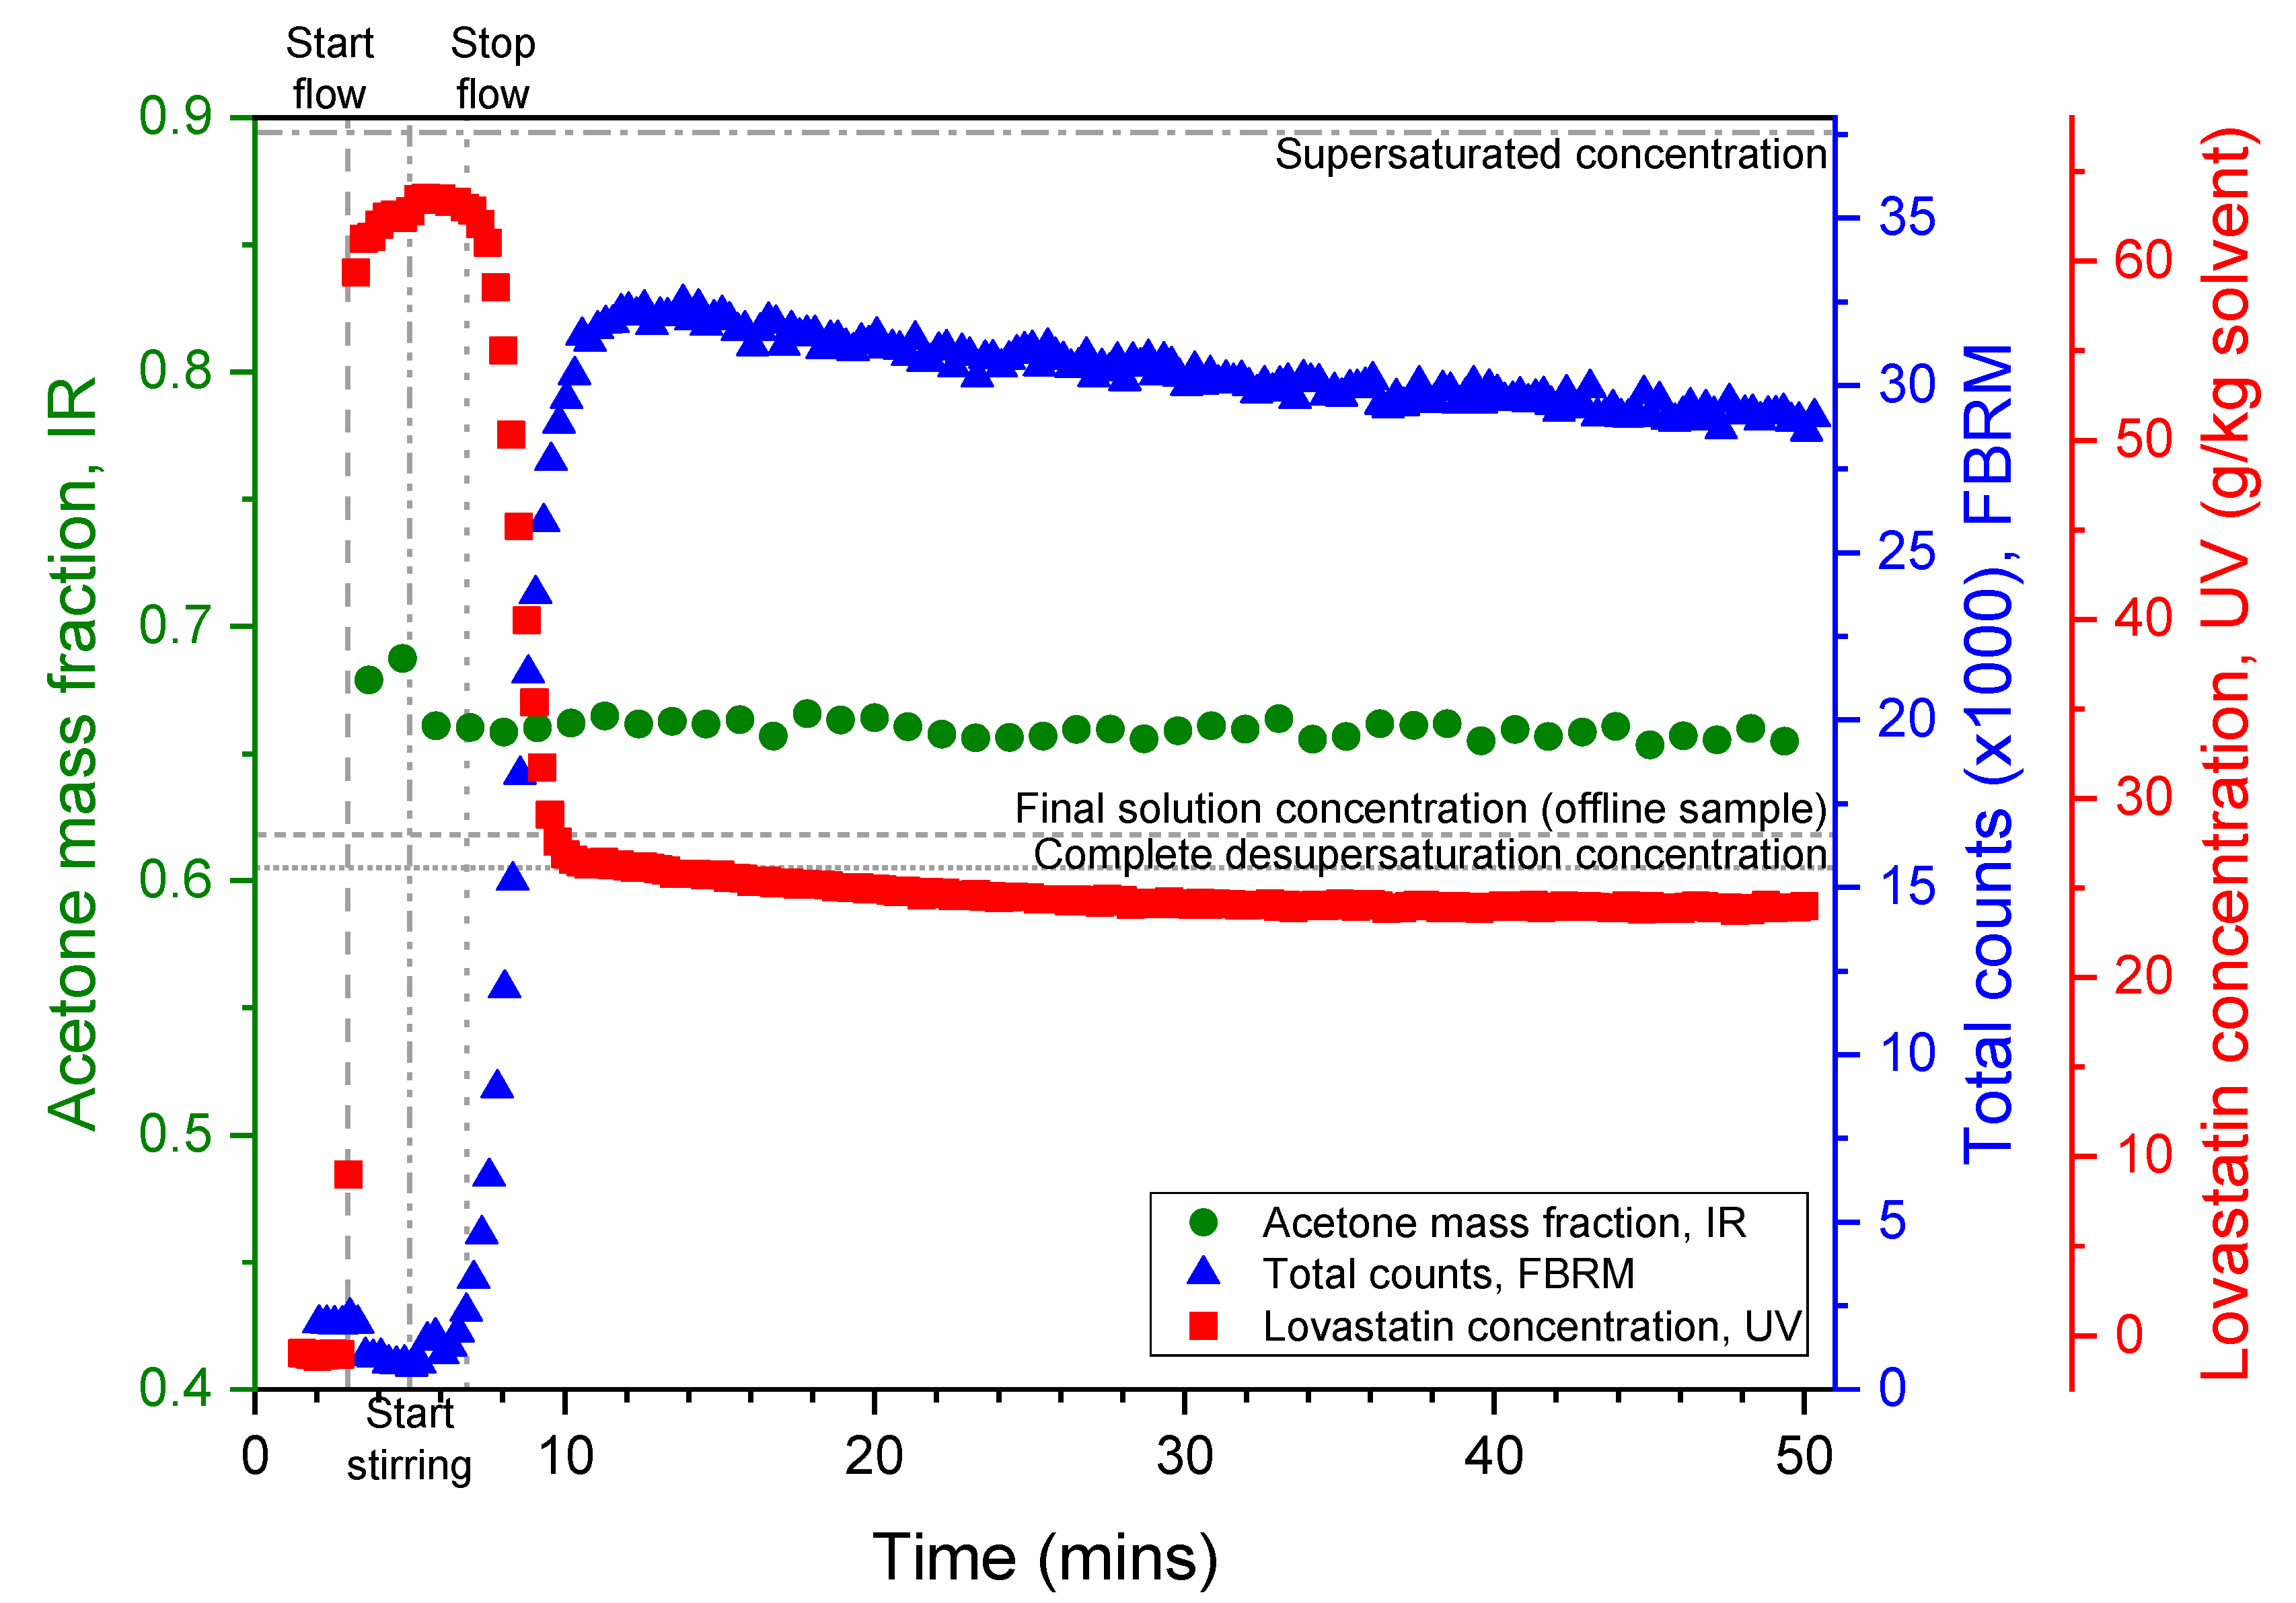
3.4.5. Online PAT Monitoring

During the antisolvent crystallisation experiments, in situ monitoring of the 1 L STR was carried out using FBRM, UV-vis, and IR. As discussed in Section 3.4.2, the PAT probes were significantly fouled in all experiments with the exception of Experiment 4, where visible nucleation did not take place until the STR was filled with clear solution. This fouling was due to the conditions that were required for the control of lovastatin particle size and shape (high supersaturations, fast nucleation rates). For this reason, the most useful PAT data came from Experiment 4, where quantitative measurements of solution concentration and solvent composition were achieved. The trends of lovastatin solution concentration, acetone solvent mass fraction, and FBRM total counts for Experiment 4 is given in Figure 9.
The maximum concentration predicted by UV is 63.52 g/kg solvent (5.5 min), with the expected maximum concentration (at maximum supersaturation) being 67.17 g/kg solvent. The FBRM counts begin to rapidly increase at 5.6 min, which indicates the onset of significant nucleation (also observed visually). The observed decrease in the predicted lovastatin concentration by UV coincides with this increase in the total counts measured by FBRM. The acetone mass fraction predicted by IR after stirring has commenced is between the range 0.65–0.67. There is evidence of minor fouling observed in the IR spectra, which clears over the course of the experiment. The small discrepancy between the predicted and expected concentration may be a result of minor fouling and a potential initial temperature deviation from 25 °C due to the mixing of acetone and water being exothermic.
The PAT trends for Experiment 4 show that firstly the continuous mixing process is efficient and consistent in that the acetone solvent mass fraction is as expected. Furthermore, even though this experiment has the slowest rate of nucleation, the UV and FBRM measurements show that the solution desupersaturates over a relatively short time period (approximately 4 min). Finally, once the solution has desupersaturated, the FBRM measurement shows that there is likely some particle attrition while the slurry is being suspended for 40 min. Full details of the UV, IR, and FBRM results for all experiments are given in the Supplementary Materials. These include the PAT trends for all experiments and an assessment of probe fouling.

4. Conclusions

A literature-based solvent/antisolvent screen identified promising solvent systems for the antisolvent crystallisation of lovastatin. For each of these systems, solubility measurements were performed to determine the shape of the mixed-solvent solubility curve, and it was found that the acetone/water system was the most suitable for the antisolvent crystallisation of lovastatin. Induction times were measured across a range of supersaturations in the acetone/water system to identify the best conditions to operate an unseeded continuous antisolvent crystallisation process with the aim of creating crystal seed suspensions. Supersaturations of 2.65 and above exhibited very short induction times, and so this operating region was deemed the most suitable.
In the continuous antisolvent crystallisation of lovastatin, the particle size and shape could be controlled without the use of additives, simply by changing the process conditions. It was found that applying ultrasound to the static mixer had the greatest effect on particle size, whereas supersaturation and total flow rate had lesser effects in comparison. This is most likely explained by the ultrasound causing significant increase in primary nucleation rates and resulting in an increased number of particles and reduced crystal size. In order to obtain lovastatin particles with a significantly less needle-like shape and smaller length, it was necessary to combine the maximum supersaturation, the highest total flow rate, and the application of ultrasound. This is thought to be due to the occurrence of oiling out, causing nuclei to form in oil droplets and grow in an environment where the relative crystal growth rates along different crystal axes are significantly different. This demonstrates how crystal shape can be modified in an antisolvent crystallisation process without the use of additives.

Supplementary Materials

The following are available online at https://0-www-mdpi-com.brum.beds.ac.uk/2073-4352/10/10/925/s1. Table S1: Summary of model performance metrics—root mean square error (RMSE) and coefficient of determination (R2). Table S2: Summary of PLS model performance metrics for prediction of solvent composition by IR. Table S3: Experimental lovastatin concentration and acetone mass fraction predicted by UV and IR, respectively. A lovastatin concentration was calculated for the offline sample and the acetone mass fraction calculated from the ratio of the solution and antisolvent feeds. Figure S1: Experimentally determined solubility of lovastatin in acetone/water at 25 °C and the calibration and validation data points used for construction of a PLS model to predict the concentration of lovastatin by UV. Figure S2: Actual vs. predicted values of lovastatin concentration measured by UV. Figure S3: UV-vis calibration spectra with selected region for PLS model building selected in white (left) and after pre-processing (right). Figure S4: Loadings for each latent variable used in the PLS model to predict lovastatin concentration by UV. Figure S5: Experimentally determined solubility of lovastatin in acetone/water at 25 °C and the calibration and validation data points used for construction of a PLS model to predict the acetone mass fraction by IR, where the calibration points are slurries the precise lovastatin concentration is unknown, and the supersaturated concentration has been plotted. Figure S6: Actual vs. predicted values of acetone mass fraction of acetone/water mixtures measured by IR (left). RMSE of calibration and cross validation against latent variable number (right). Figure S7: IR calibration spectra with selected region for PLS model building selected in white (left) and after pre-processing (right). Figure S8: Loadings for each latent variable used in the PLS model to predict acetone mass fraction by IR. Figure S9: Predicted acetone mass fraction by IR, predicted lovastatin concentration by UV and total counts from FBRM from monitoring of the STR during Experiment 1. Experimental events and expected concentrations have been outlined. Figure S10: Predicted acetone mass fraction by IR, predicted lovastatin concentration by UV, and total counts from FBRM from monitoring of the STR during Experiments 2 (top) and 6 (bottom). Experimental events and expected concentrations have been outlined. Figure S11: Comparison of chord length distributions at the end of each experiment. The FBRM data is from the macro mode and the distributions are square weighted. Figure S12: Comparison of fouling index values from FBRM over the course of each experiment. The data displayed begins from the point at which the FBRM probe was thought to be submerged in the solution. Figure S13: Photographs of (a) the full antisolvent crystallisation experimental setup (not running), (b) the X-mixer connected to the tubing in the ultrasonic bath, (c) a close-up view of the 1 L jacketed STR with the PAT probes inserted, (d) a close-up, top-down view of only the X-mixer, and (e) a close-up, top-down view of only the Y-splitter.

Author Contributions

Conceptualization: J.S., A.N. and C.J.B.; methodology: J.M. and M.W.S.C.; validation: J.M., M.W.S.C. and A.M.; formal analysis: J.M. and M.W.S.C.; investigation: J.M., M.W.S.C. and A.M.; data curation: J.M. and M.W.S.C.; writing—original draft preparation: J.M. and M.W.S.C.; writing—review and editing: J.M., M.W.S.C., A.M., C.J.B., A.N. and J.S.; visualization: J.M. and M.W.S.C.; supervision: J.S. and A.N.; project administration: J.S., A.N. and C.J.B.; funding acquisition: J.S. and A.N. All authors have read and agreed to the published version of the manuscript.

Funding

This research was funded by EPSRC and the Future Manufacturing Research Hub in Continuous Manufacturing and Advanced Crystallization (Grant ref: EP/P006965/1).

Acknowledgments

The authors thank EPSRC and the Future Manufacturing Research Hub in Continuous Manufacturing and Advanced Crystallization (Grant ref: EP/P006965/1) for funding this work. We also acknowledge that this work was carried out in the CMAC National Facility supported by the UKRPIF (UK Research Partnership Investment Fund) award from the Higher Education Funding Council for England (HEFCE) (Grant ref: HH13054).

Conflicts of Interest

The authors declare no conflict of interest. The funders had no role in the design of the study; in the collection, analyses, or interpretation of data; in the writing of the manuscript; or in the decision to publish the results.

References

  1. Plumb, K. Continuous processing in the pharmaceutical industry—Changing the mind set. Chem. Eng. Res. Des. 2005, 83, 730–738. [Google Scholar] [CrossRef]
  2. Lindenberg, C.; Scholl, J.; Vicum, L.; Mazzotti, M.; Brozio, J. Experimental characterization and multi-scale modeling of mixing in static mixers. Chem. Eng. Sci. 2008, 63, 4135–4149. [Google Scholar] [CrossRef]
  3. Lindenberg, C.; Mazzotti, M. Experimental characterization and multi-scale modeling of mixing in static mixers. Part 2. Effect of viscosity and scale-up. Chem. Eng. Sci. 2009, 64, 4286–4294. [Google Scholar] [CrossRef]
  4. Ghanem, A.; Lemenand, T.; Della Valle, D.; Peerhossaini, H. Static mixers: Mechanisms, applications, and characterization methods—A review. Chem. Eng. Res. Des. 2014, 92, 205–228. [Google Scholar] [CrossRef]
  5. Raza, S.A.; Schacht, U.; Svoboda, V.; Edwards, D.P.; Florence, A.J.; Pulham, C.R.; Sefcik, J.; Oswald, L.D.H. Rapid Continuous Antisolvent Crystallization of Multicomponent Systems. Cryst. Growth Des. 2018, 18, 210–218. [Google Scholar] [CrossRef] [Green Version]
  6. Svoboda, V.; MacFhionnghaile, P.; McGinty, J.; Connor, L.E.; Oswald, I.D.H.; Sefcik, J. Continuous Cocrystallization of Benzoic Acid and Isonicotinamide by Mixing-Induced Supersaturation: Exploring Opportunities between Reactive and Antisolvent Crystallization Concepts. Cryst. Growth Des. 2017, 17, 1902–1909. [Google Scholar] [CrossRef] [Green Version]
  7. MacFhionnghaile, P.; Svoboda, V.; McGinty, J.; Nordon, A.; Sefcik, J. Crystallization Diagram for Antisolvent Crystallization of Lactose: Using Design of Experiments To Investigate Continuous Mixing-Induced Supersaturation. Cryst. Growth Des. 2017, 17, 2611–2621. [Google Scholar] [CrossRef] [Green Version]
  8. Ramakers, L.A.I.; McGinty, J.; Beckmann, W.; Levilain, G.; Lee, M.; Wheatcroft, H.; Houson, I.; Sefcik, J. Investigation of Metastable Zones and Induction Times in Glycine Crystallization across Three Different Antisolvents. Cryst. Growth Des. 2020, 20, 4935–4944. [Google Scholar] [CrossRef]
  9. Briggs, N.E.B.; Schacht, U.; Raval, V.; McGlone, T.; Sefcik, J.; Florence, A.J. Seeded Crystallization of beta-L-Glutamic Acid in a Continuous Oscillatory Baffled Crystallizer. Org. Process. Res. Dev. 2015, 19, 1903–1911. [Google Scholar] [CrossRef] [Green Version]
  10. McGinty, J.; Yazdanpanah, N.; Price, C.; ter Horst, J.H.; Sefcik, J. Chapter 1 Nucleation and Crystal Growth in Continuous Crystallization. In The Handbook of Continuous Crystallization; The Royal Society of Chemistry: London, UK, 2020; pp. 1–50. [Google Scholar]
  11. Ferguson, S.; Morris, G.; Hao, H.X.; Barrett, M.; Glennon, B. In-situ monitoring and characterization of plug flow crystallizers. Chem. Eng. Sci. 2012, 77, 105–111. [Google Scholar] [CrossRef]
  12. Zhao, Y.; Kamaraju, V.K.; Hou, G.Y.; Power, G.; Donnellan, P.; Glennon, B. Kinetic identification and experimental validation of continuous plug flow crystallisation. Chem. Eng. Sci. 2015, 133, 106–115. [Google Scholar] [CrossRef]
  13. Jiang, M.; Li, Y.E.D.; Tung, H.H.; Braatz, R.D. Effect of jet velocity on crystal size distribution from antisolvent and cooling crystallizations in a dual impinging jet mixer. Chem. Eng. Process. 2015, 97, 242–247. [Google Scholar] [CrossRef]
  14. Beck, C.; Dalvi, S.V.; Dave, R.N. Controlled liquid antisolvent precipitation using a rapid mixing device. Chem. Eng. Sci. 2010, 65, 5669–5675. [Google Scholar] [CrossRef]
  15. Lindenberg, C.; Mazzotti, M. Continuous Precipitation of L-Asparagine Monohydrate in a Micromixer: Estimation of Nucleation and Growth Kinetics. AIChE J. 2011, 57, 942–950. [Google Scholar] [CrossRef]
  16. Furuta, M.; Mukai, K.; Cork, D.; Mae, K. Continuous crystallization using a sonicated tubular system for controlling particle size in an API manufacturing process. Chem. Eng. Process. 2016, 102, 210–218. [Google Scholar] [CrossRef]
  17. Stahl, M.; Alund, B.L.; Rasmuson, A.C. Reaction crystallization kinetics of benzoic add. AIChE J. 2001, 47, 1544–1560. [Google Scholar] [CrossRef]
  18. Blandin, A.F.; Mangin, D.; Nallet, V.; Klein, J.P.; Bossoutrot, J.M. Kinetics identification of salicylic acid precipitation through experiments in a batch stirred vessel and a T-mixer. Chem. Eng. J. 2001, 81, 91–100. [Google Scholar] [CrossRef]
  19. Moore, R.N.; Bigam, G.; Chan, J.K.; Hogg, A.M.; Nakashima, T.T.; Vederas, J.C. Biosynthesis of The Hypocholesterolemic Agent Mevinolin by Aspergillus-Terreus—Determination of the Origin of Carbon, Hydrogen, and Oxygen-Atoms by C-13-Nmr and Mass-Spectrometry. J. Am. Chem. Soc. 1985, 107, 3694–3701. [Google Scholar] [CrossRef]
  20. Alberts, A.W.; Chen, J.; Kuron, G.; Hunt, V.; Huff, J.; Hoffman, C.; Rothrock, J.; Lopez, M.; Joshua, H.; Harris, E.; et al. Mevinolin—A Highly Potent Competitive Inhibitor of Hydroxymethylglutaryl-Coenzyme-a Reductase and a Cholesterol-Lowering Agent. Proc. Natl. Acad. Sci. USA 1980, 77, 3957–3961. [Google Scholar] [CrossRef] [PubMed] [Green Version]
  21. Yoshida, M.I.; Oliveira, M.A.; Gomes, E.C.L.; Mussel, W.N.; Castro, W.V.; Soares, C.D.V. Thermal characterization of lovastatin in pharmaceutical formulations. J. Therm. Anal. Calorim. 2011, 106, 657–664. [Google Scholar] [CrossRef]
  22. Javernik, S.; Kreft, S.; Strukelj, B.; Vrecer, F. Oxidation of lovastatin in the solid state and its stabilization with natural antioxidants. Pharmazie 2001, 56, 738–740. [Google Scholar] [PubMed]
  23. Turner, T.D.; Hatcher, L.E.; Wilson, C.C.; Roberts, K.J. Habit Modification of the Active Pharmaceutical Ingredient Lovastatin Through a Predictive Solvent Selection Approach. J. Pharm. Sci. 2019, 108, 1779–1787. [Google Scholar] [CrossRef] [PubMed] [Green Version]
  24. Hatcher, L.E.; Li, W.; Payne, P.; Benyahia, B.; Rielly, C.D.; Wilson, C.C. Tuning Morphology in Active Pharmaceutical Ingredients: Controlling the Crystal Habit of Lovastatin through Solvent Choice and Non-Size-Matched Polymer Additives. Cryst. Growth Des. 2020, 20, 5854–5862. [Google Scholar] [CrossRef]
  25. Mulder, K.C.L.; Mulinari, F.; Franco, O.L.; Soares, M.S.F.; Magalhaes, B.S.; Parachin, N.S. Lovastatin production: From molecular basis to industrial process optimization. Biotechnol. Adv. 2015, 33, 648–665. [Google Scholar] [CrossRef]
  26. Nagy, Z.K.; Fujiwara, M.; Braatz, R.D. Modelling and control of combined cooling and antisolvent crystallization processes. J. Process. Control 2008, 18, 856–864. [Google Scholar] [CrossRef] [Green Version]
  27. Zhang, X.Y.; Yang, Z.Q.; Chai, J.; Xu, J.Y.; Zhang, L.; Qian, G.; Zhou, X.G. Nucleation kinetics of lovastatin in different solvents from metastable zone widths. Chem. Eng. Sci. 2015, 133, 62–69. [Google Scholar] [CrossRef]
  28. Sullivan, R.A.; Davey, R.J. Concerning the crystal morphologies of the alpha and beta polymorphs of p-aminobenzoic acid. Crystengcomm 2015, 17, 1015–1023. [Google Scholar] [CrossRef]
  29. Holmback, X.; Rasmuson, A.C. Size and morphology of benzoic acid crystals produced by drowning-out crystallisation. J. Cryst. Growth 1999, 198, 780–788. [Google Scholar] [CrossRef]
  30. Nguyen, T.T.H.; Rosbottom, I.; Marziano, I.; Hammond, R.B.; Roberts, K.J. Crystal Morphology and Interfacial Stability of RS-Ibuprofen in Relation to Its Molecular and Synthonic Structure. Cryst. Growth Des. 2017, 17, 3088–3099. [Google Scholar] [CrossRef] [Green Version]
  31. Rimez, B.; Conte, J.; Lecomte-Norrant, E.; Cognet, P.; Gourdon, C.; Scheid, B. Continuous-Flow Tubular Crystallization To Discriminate between Two Competing Crystal Polymorphs. 2. Antisolvent Crystallization. Cryst. Growth Des. 2018, 18, 6440–6447. [Google Scholar] [CrossRef]
  32. Sypek, K.; Burns, I.S.; Florence, A.J.; Sefcik, J. In Situ Monitoring of Stirring Effects on Polymorphic Transformations during Cooling Crystallization of Carbamazepine. Cryst. Growth Des. 2012, 12, 4821–4828. [Google Scholar] [CrossRef]
  33. Variankaval, N.; Cote, A.S.; Doherty, M.F. From form to function: Crystallization of active pharmaceutical ingredients. AIChE J. 2008, 54, 1682–1688. [Google Scholar] [CrossRef]
  34. Lovette, M.A.; Doherty, M.F. Needle-Shaped Crystals: Causality and Solvent Selection Guidance Based on Periodic Bond Chains. Cryst. Growth Des. 2013, 13, 3341–3352. [Google Scholar] [CrossRef]
  35. Zhao, S.F.; Chen, C.; Zhu, P.; Xia, H.M.; Shi, J.Y.; Yan, F.Y.H.; Shen, R.Q. Passive Micromixer Platform for Size- and Shape-Controllable Preparation of Ultrafine HNS. Ind. Eng. Chem. Res. 2019, 58, 16709–16718. [Google Scholar] [CrossRef]
  36. Bodnar, K.; Hudson, S.P.; Rasmuson, A.C. Stepwise Use of Additives for Improved Control over Formation and Stability of Mefenamic Acid Nanocrystals Produced by Antisolvent Precipitation. Cryst. Growth Des. 2017, 17, 454–466. [Google Scholar] [CrossRef]
  37. Tierney, T.B.; Rasmuson, A.C.; Hudson, S.P. Size and Shape Control of Micron-Sized Salicylic Acid Crystals during Antisolvent Crystallization. Org. Process. Res. Dev. 2017, 21, 1732–1740. [Google Scholar] [CrossRef]
  38. Zhou, X.Q.; Shan, J.H.; Chen, D.; Li, H.Z. Tuning the Crystal Habits of Organic Explosives by Antisolvent Crystallization: The Case Study of 2,6-dimaino-3,5-dinitropyrazine-1-oxid (LLM-105). Crystals 2019, 9, 11. [Google Scholar] [CrossRef] [Green Version]
  39. Park, Y.; Koo, J.Y.; Choi, H.C. Additive-Free Morphology Control of Organic Polyhedral Molecular Crystals by the Antisolvent Molecular Geometry: From Rod, Disk, to Cube. Cryst. Growth Des. 2018, 18, 7239–7243. [Google Scholar] [CrossRef]
  40. Li, S.W.; Song, H.P.; Leng, Y. Rapid determination of lovastatin in the fermentation broth of Aspergillus terreus using dual-wavelength UV spectrophotometry. Pharm. Biol. 2014, 52, 129–135. [Google Scholar] [CrossRef] [Green Version]
  41. Kurtz, S.S.; Wikingss, A.E.; Camin, D.L.; Thompson, A.R. Refractive index and density of acetone-water solutions. J. Chem. Eng. Data 1965. [Google Scholar] [CrossRef]
  42. Nti-Gyabaah, J.; Chmielowski, R.; Chan, V.; Chiew, Y.C. Solubility of lovastatin in a family of six alcohols: Ethanol, 1-propanol, 1-butanol, 1-pentanol, 1-hexanol, and 1-octanol. Int. J. Pharm. 2008, 359, 111–117. [Google Scholar] [CrossRef] [PubMed]
  43. Nti-Gyabaah, J.; Chiew, Y.C. Solubility of lovastatin in ethyl acetate, propyl acetate, isopropyl acetate, butyl acetate, sec-butyl acetate, isobutyl acetate, tert-butyl acetate, and 2-butanone, between (285 and 313) K. J. Chem. Eng. Data 2008, 53, 2060–2065. [Google Scholar] [CrossRef]
  44. Sun, H.; Gong, J.B.; Wang, J.K. Solubility of lovastatin in acetone, methanol, ethanol, ethyl acetate, and butyl acetate between 283 K and 323 K. J. Chem. Eng. Data 2005, 50, 1389–1391. [Google Scholar] [CrossRef]
  45. International Conference of Harmonisation Expert Working Group. Impurities: Guideline for Residual solvents Q3C(R5); International Conference on Harmonisation: Geneva, Switzerland, 2011. [Google Scholar]
  46. Wang, X.; Gillian, J.M.; Kirwan, D.J. Quasi-emulsion precipitation of pharmaceuticals. 1. Conditions for formation and crystal nucleation and growth behavior. Cryst. Growth Des. 2006, 6, 2214–2227. [Google Scholar] [CrossRef]
  47. Sun, H.; Wang, J.K. Solubility of lovastatin in acetone plus water solvent mixtures. J. Chem. Eng. Data 2008, 53, 1335–1337. [Google Scholar] [CrossRef]
  48. Meng, Z.C.; Huang, Y.; Cheng, S.; Wang, J.T. Investigation of Oiling-Out Phenomenon of Small Organic Molecules in Crystallization Processes: A Review. ChemistrySelect 2020, 5, 7855–7866. [Google Scholar] [CrossRef]
  49. Parimaladevi, P.; Supriya, S.; Srinivasan, K. The role of ultrasound in controlling the liquid-liquid phase separation and nucleation of vanillin polymorphs I and II. J. Cryst. Growth 2018, 484, 21–30. [Google Scholar] [CrossRef]
  50. Gao, Z.G.; Altimimi, F.; Gong, J.B.; Bao, Y.; Wang, J.K.; Rohani, S. Ultrasonic Irradiation and Seeding To Prevent Metastable Liquid-Liquid Phase Separation and Intensify Crystallization. Cryst. Growth Des. 2018, 18, 2628–2635. [Google Scholar] [CrossRef]
Figure 1. Diagram of the full antisolvent crystallisation setup.
Crystals 10 00925 g001
Figure 2. Graphical representation of the literature-based solvent/antisolvent screen for lovastatin.
Crystals 10 00925 g002
Figure 3. Comparison of measured lovastatin solubility in various mixtures of acetone/water, acetone/tert-butyl acetate, and 2-butanone/tert-butyl acetate at 25 °C in addition to measured lovastatin solubility in various mixtures of acetone/water at 45 °C. Literature lovastatin solubility in various acetone/water mixtures at both 25 and 45 °C is also included for comparison [47]. The measured values have error bars, which are obscured by the marker points, as the standard deviations are extremely small.
Crystals 10 00925 g003
Figure 4. The measured induction times for the antisolvent crystallisation of lovastatin from an acetone/water solvent mixture (90:10 wt.%) at 25 °C as a function of supersaturation. There are five data points for S = 13.7, but they all overlap, as they are the same (≤1 s).
Crystals 10 00925 g004
Figure 5. Comparison of the offline FTIR spectra for the lovastatin raw material used to prepare the initial solutions and the lovastatin produced from each antisolvent crystallisation experiment.
Crystals 10 00925 g005
Figure 6. Volume-weighted length distribution for each antisolvent crystallisation experiment.
Crystals 10 00925 g006
Figure 7. Aspect ratio distribution for each antisolvent crystallisation experiment.
Crystals 10 00925 g007
Figure 8. Microscope images of the crystals from experiments 1–8 are shown in (ah), respectively. The image in (f) confirms that the conditions used in Experiment 6 produce the smallest and least needle-like crystals.
Crystals 10 00925 g008aCrystals 10 00925 g008b
Figure 9. Trends from PAT monitoring of the 1 L STR during Experiment 4: predicted acetone mass fraction by IR, predicted lovastatin concentration by UV, and total counts from FBRM. Experimental events and expected concentrations have been outlined.
Crystals 10 00925 g009
Table 1. Experimental conditions used in the antisolvent crystallisation experiments.
Experiment LabelUltrasoundSolution: Antisolvent Flow RatioTotal Flow Rate (g/min)Pre-Nucleation Supersaturation
Exp 1Off1:120013.7
Exp 2Off1:140013.7
Exp 3Off2:12005.20
Exp 4Off3:12002.65
Exp 5On1:120013.7
Exp 6On1:140013.7
Exp 7On2:12005.20
Exp 8On3:12002.65
Table 2. Yield and solid recovery values for the antisolvent crystallisation experiments.
Experiment LabelFinal Solution Concentration (g/kg Solvent)Yield (%)Solid Recovery (%)
Exp 111.2775.1281.29
Exp 27.2684.0590.95
Exp 321.3764.4386.04
Exp 427.9758.1396.16
Exp 520.3354.7260.11
Exp 613.7069.7075.42
Exp 721.8063.6985.06
Exp 831.6352.4695.55

