Article

Effect of 3D Representative Volume Element (RVE) Thickness on Stress and Strain Partitioning in Crystal Plasticity Simulations of Multi-Phase Materials

1
Institute of Metal Forming, Technische Universität Bergakademie Freiberg, 09599 Freiberg, Germany
2
Geotechnical Institute, Technische Universität Bergakademie Freiberg, 09599 Freiberg, Germany
*
Author to whom correspondence should be addressed.
These authors contributed equally to this work.
Submission received: 27 August 2020 / Revised: 4 October 2020 / Accepted: 9 October 2020 / Published: 17 October 2020
(This article belongs to the Special Issue Crystal Plasticity)

Abstract

:
Crystal plasticity simulations help to understand the local deformation behavior of multi-phase materials based on the microstructural attributes. The results of such simulations are mainly dependent on the Representative Volume Element (RVE) size and composition. The effect of RVE thickness on the changing global and local stress and strain is analyzed in this work for a test case of dual-phase steels in order to identify the minimal RVE thickness for obtaining consistent results. 100 × 100 × 100 voxel representative volume elements are constructed by varying grain size and random orientation distribution in DREAM-3D. The constructed RVEs are sliced in depth up to 1, 5, 10, 15, 20, 25, 30, 40, and 50 layers to construct different geometries with increasing thickness. Crystal plasticity model parameters for ferrite and martensite are taken from already published data and assigned to respective phases. Although the global stress/strain behavior of different RVEs is similar (<5% divergence), the local stress/strain partitioning in RVEs with varying thickness and grain size shows a considerable variation when statistically compared. It is concluded that two-dimensional (2D) RVEs can be used for crystal plasticity simulations when global deformation behavior is of interest. Whereas, it is necessary to consider three-dimensional (3D) RVEs, which have a specific thickness and number of grains for determining stabilized and more accurate local deformation behavior. This estimation will help researchers in optimizing the computation time for accurate mesoscale simulations.

Graphical Abstract

1. Introduction

The micro-structure of a material plays an important role in defining the mechanical properties [1] and service life of a component [2,3]. Numerical models can help to understand and improve the component’s life by providing detailed insight into the local [4,5] and global [6,7,8] deformation behaviors. A concept of Representative Volume Element (RVE) is used in order to numerically simulate continuous yet locally heterogeneous materials [9,10]. A lot of work in the recent past has been carried out to estimate the local deformation behavior of single and multi-phase materials based on two-dimensional (2D) and three-dimensional (3D) RVEs [11,12,13,14]. 2D and 3D RVEs can be constructed using single [15] or multilayer [16] Voronoi tessellation using measured or virtual local grain size, phase, and orientation distribution data [17]. They can also be constructed by processing EBSD map of a material appropriately [18], and specifically 3D RVEs can be constructed by multi-layer EBSD mapping of a local region while using Focused Ion Beam (FIB) milling [19].
Using RVEs in CP simulations has been common practice for quite some time, and most researchers used 2D RVEs, as they are easier to collect and they can help compare the locally observed deformation behavior with simulation results [20,21,22]. In recent studies [19,23], it was shown that 3D RVEs—compared with 2D RVEs—yield nearly accurate local stress–strain evolution results, yet the effect of RVE thickness on results was not analyzed in these studies. The computational costs in CP simulations are quite high and largely depend on the size of RVE, especially for high-resolution full phase simulations, it can take weeks to yield the desired results [24]. It is important to know the effective RVE thickness relative to the material, average grain size, and develop a simulation model accordingly. Such estimation leads to reduced computational cost while maintaining the accuracy of the results. In the past, researchers analyzed the effects of RVE size and applied boundary conditions on the deformation behavior of heterogeneous materials [4,25,26]. Scale-dependent elastic and elastoplastic deformation behaviors of periodic [27] and random [28] composites were analyzed.
DREAM-3D [29] is an open-source tool that is available to construct RVEs from experimentally or analytically available micro-structural data. Recently, the coupling of DREAM-3D with DAMASK has been made easier by introducing a pipeline object in order to directly export the generated RVE to a readable geometry file [30]. This technique is used in the current study to construct virtual RVEs with different grain sizes. Recently, researchers suggested a methodology for calibrating the DAMASK models using a benchmark 1000 grain RVE [18] by comparing the results with experimental flow curves. In another work, they calibrated the model by comparing it with the in-situ acoustic emission data [31]. In both of these publications, the calibrated model was used to carry out full phase simulations for the TRIP steel matrix and TRIP steel Mg-PSZ composite. EBSD maps were used as 2D geometries for simulations. Although local evolution of stress, strain, dislocation density, transformation, and twinning were analyzed, it was reported that the results are only qualitatively accurate for comparison as there is no third dimension for these attributes to evolve in. It was concluded that 3D RVEs should be considered for accurate full phase simulations. Considering such work to be capital and computationally intensive, selecting appropriate RVE thickness with respect to the material grain size is very important. Recently, Diehl et al. [32] investigated the influence of neighborhood on stress and strain partitioning in DP steel microstructures and showed the relevance of subsurface microstructures in this regard. It was concluded that structural changes farther than three times the average grain size have a negligible effect on the region of interest. However, the conclusions were made based on a fixed grain size range and limited statistical analysis.
Considerable research has been carried out in the development of RVEs from experimental and statistical data [33]. A very detailed review of the generation of 3D representative volume elements for heterogeneous materials was recently published [34]. Several experimental, physical-based, and geometrical methods were discussed, along with the available commercial and open-source tools in this work. Researchers have also used the constructed RVEs in order to run mesoscale simulations and they have analyzed the effect of different RVEs on the outcome of simulations [35,36,37,38]. CP simulations are increasingly being used to model and analyze complex problems from the single crystal up to the component scale [39]. It has been reported that the simulation results get better with increasing RVE size, as larger RVEs are better informed and incorporate more microstructural features [34,40]. Zeghadi et al. [41,42] tried to establish such a relationship for single-phase materials. However, it was mentioned while concluding the study to check results for a bigger data set and more grains on the free surface. Harris et al. [43,44] carried out a detailed study for determining the appropriate RVE size for 3D microstructural material characterization that is based on the multi-phase composite gas separation membrane. They showed that the developed statistical model was able to predict the experimental observations reasonably. A study that identifies the optimal finite thickness of an RVE—relative to the material grain size—in multi-phase materials for optimal simulation time without compromising the accuracy of results is still missing. Different researchers in the past have approached this problem differently. The method that is presented in the current work is unique, fast, and effective in establishing the desired output.
In this work, the effect of RVE thickness—with the intention of identifying the amount of finite thickness required for consistent results—on the changing global and local stress and strain is analyzed for a test case of dual-phase steels. RVEs were constructed by varying mean feature ESD ( D f ) between 3 to 18 μ m using DREAM-3D with grains having randomly assigned orientation distributions. The constructed RVEs were sliced in up to 1, 5, 10, 15, 20, 25, 30, 40, and 50 layers to produce different geometries comprising the same microstructure—with increasing thickness. Crystal plasticity model parameters for ferrite and martensite are taken from already published data and assigned to respective phases. Probability Distribution Functions (PDF) and Cumulative Distribution Functions (CDF) of all simulation results are compared in order to estimate the solution convergence with changing grain size statistically. In the end, a simple function is proposed for calculating the sufficient RVE thickness that is necessary for obtaining a converged solution.
Section 2 provides the details of material data, RVE construction, simulation scheme, and CP material model parameters. Section 3 presents the results that were obtained in this study. In Section 4, the results are discussed in comparison with state of the art, and insight into the outlook is provided. Eventually, the study is concluded in Section 5.

2. Numerical Simulation Model Development

For the numerical simulation modeling, RVEs were virtually constructed while using open source tool DREAM-3D [29]. The case of dual-phase steel is considered as a case study in the current work. Micro-structural attributes were adopted from the literature [45]. 3D RVEs were constructed—with varying grain size—using open source tool DREAM-3D [29]. These constructed RVEs were sliced into varying thickness ranges from one layer to 50 layers and used as input geometries for numerical simulations. Crystal plasticity based open source tool DAMASK was used to model and solve numerical simulations by adopting already published methodology [22].

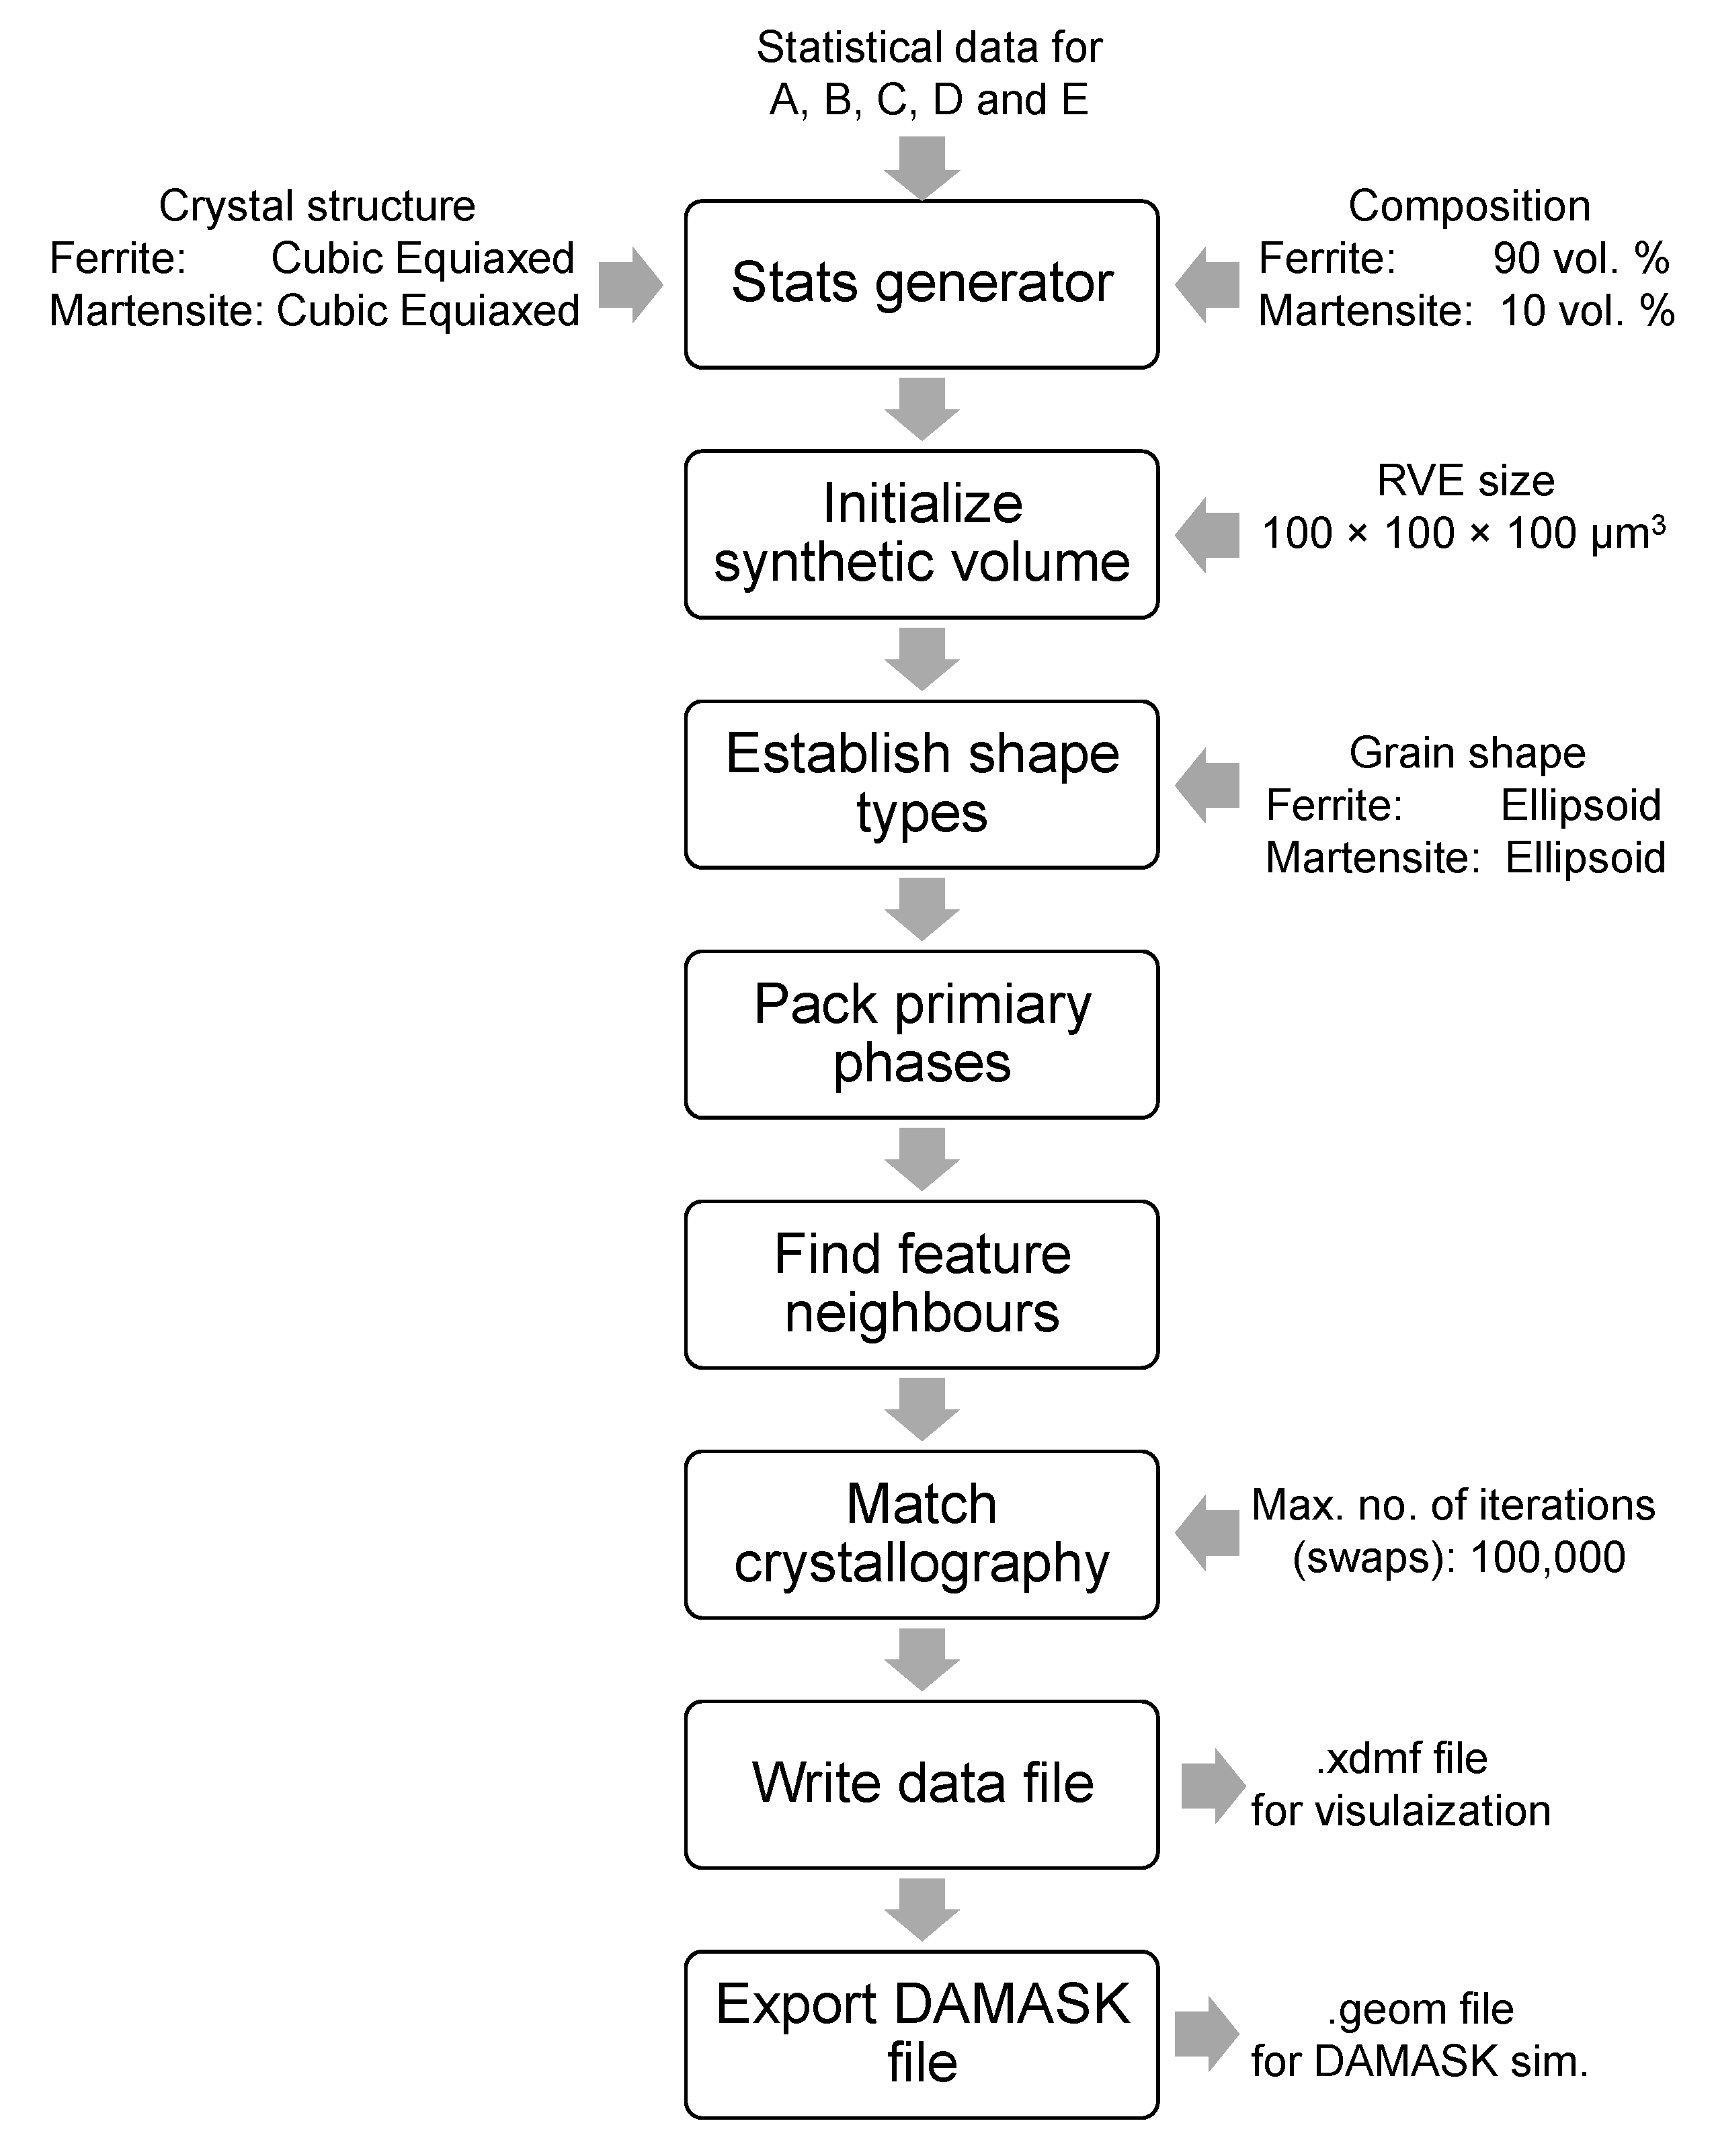
2.1. RVE Construction and Geometry Files Production

Dual-phase steel is chosen as a case study in the current work, because, on the one hand, it is a simple material that consists of ferrite matrix and embedded martensite islands (consisting of laths with different crystallographic orientations) in it, while, on the other hand, it is an excellent example of multi-phase materials with two phases comprising of drastically different mechanical properties. The microstructural attributes i.e., grain size and martensite percentage, were adopted from the previous work of Jiang et al. [46]. It has been reported that, in DP steels, the grain size of ferrite ranges from 5 to 25 μ m, whereas martensite grain size ranges from 3 to 18 μ m. Considering this upper and lower grain size limit, DREAM-3D was used for the construction of virtual RVEs with varying grain sizes, while keeping the ferrite and martensite grain size ratio to be 1:1 intentionally to keep the problem at hand simple.
Table 1 provides the total number of grain in each 100 3 RVE for a corresponding ESD given as a dimensionless entity. A pipeline was built with the initialization of virtual data generation while using a stats generator filter. The ratio of 90 vol.% primary phase(ferrite), 10 vol.% secondary phase(martensite) was chosen for all cases to simplify the simulation model results and generalize the comparison of statistical data. As the crystal structure of both Ferrite and Martensite is body-centered cubic. Therefore, they were generated as “cubic equiaxed” phases. Different RVEs were generated by varying the ESD statistical distribution data. The grain size distribution of ferrite and martensite for each RVE taken is given in Table 1.
The synthetic volume size of all RVEs was kept 100 × 100 × 100 voxels (where the size of each voxel is 1 μ m 3 ) and specified number of particles could pack in the defined volume, which means that more grains packed in the defined volume when D f was small and lesser when D f was large as given in last column of Table 1. For both phases, grain shape was stated to be “ellipsoid”. The maximum number of iterations (swaps) allowed was 100,000. Using already published methodology [30], the generated RVEs were recorded as .xdmf file, which is readable by Paraview for visualization, and .geom files were saved, which are readable by DAMASK. Figure 1 presents the general flow of information in the pipeline with associated inputs and outputs.
Figure 2 shows a schematic diagram representing the generated 3D RVEs and their slicing sequence for the construction of simulation geometries. RVE-A and E are shown for representation, whereas B, C, and D were modeled in a similar fashion. Ferrite (F) and Martensite (M) are shown separately in the sliced images for better visualization of phase distributions. This research’s primary objective is to identify the optimal RVE thickness with respect to the material grain size for obtaining converged local results. For this reason, each constructed 3D RVE with varying grain size was sliced into geometries with increasing thickness from one to 50 layers. Slicing sequence is also shown in Figure 2 for each RVE with yellow dotted lines, whereas green dotted lines in the schematic diagram represent more sliced geometries that are not shown in the current figure, but were constructed for simulations. There are 100,000 gaussian mesh elements in one layer, which means that each geometry contains 100,000 gaussian mesh elements multiplied by the number of layers considered in each case. A complete grain comes into account with a lesser number of slices in the case of small D f , whereas more slices are needed in order to represent full-grain with bigger D f .

2.2. Material Properties and Loading Conditions

Although there is a large difference in the mechanical properties of ferrite and martensite, in current research, both of the phases were assigned elastic-viscoplastic properties by adopting already developed phenomenological power law available in DAMASK [47]. Details of the hardening model with equations is provided in Appendix A for the readers who are not familiar with the constitutive equations used in DAMASK. The elastic coefficients, variables defining plastic flow behavior and fitting parameters for both phases were adopted from the already published literature [45]. Table 2 presents the adopted parameters. In the spectral method each grid point is considered as a computation point which is assigned a phase and initial crystallographic orientation before the simulations start. In the current work, mixed boundary conditions were applied uni-axially along x-direction as follows, while keeping the out-of-plain surfaces in all geometries stress-free:
F ˙ i j = 1 0 0 0 * 0 0 0 * × 10 3 . s 1
P i j = * * * * 0 * * * 0 Pa
Periodicity of the solution is inherent to the spectral method due to the FOURIER approximation of the deformation gradient field [47]. Yet, it is known that the immediate neighborhood mainly influences the strain heterogeneity, and the influence of artificial periodicity introduced by the boundary description is confined to a narrow zone [22]. Therefore, in the current study, this effect is ignored. For strongly different phases i.e., ferrite and martensite, the reference stiffness has a strong influence on stability and convergence rate, as was shown earlier by Michel et al. [48]. The readers are encouraged to refer to the work by Diehl et al. [19] for the explanation of the assumptions in the FFT regarding the reference stiffness that are used within the framework of the crystal plasticity provided by DAMASK.
The simulation results were post-processed by using already available subroutines in the DAMASK installation module, and data were further statistically analyzed using the Seaborn library in Python. The local stress–strain distributions were visualized using open source tool Paraview [49].

3. Results

If global/averaged stress–strain behavior of all the simulations is plotted and compared for multiple layers of a specific RVE, as shown in Figure 3, similar results with slight variation of slope are observed for varying thickness of geometry (Figure 3a,b) or variation of grain size (Figure 3c). It can be clearly observed in these figures that the trend of stress–strain curve is the same for all grain sizes with slight variation (higher stress response to same strain with increasing grain size).
Although stress–strain curves are used by engineers and scientists to understand the overall material behavior, they can be very misleading in the case of such full phase simulations where the local results may vary drastically. Still, the averages’ response remains the same. To make this point, during the post-processing of the data, the RVEs were sectioned as schematically represented in Figure 4. This scheme was adopted to expose the top surface and middle section of the RVE-E as an example case. Local stress and strain values are represented with the same scale to show how they change with varying RVE thickness at 25% of true strain.
Figure 5 shows the local von Mises true stress distribution in all geometries of RVE-E at 25% of true strain. Only the ferrite phase is shown here for better visualization by filtering out the martensite phase, which, due to very high stresses (≈2.5 GPa), distorts the scale. It is observed that there is a high contrast of stress distribution in the 01-layer RVE with some areas of very high stresses and others with very low stresses. As the thickness of the RVE is increased from 01 layers to 50 layers, the stresses on the surface diminish and they are relatively more homogeneously distributed within the matrix, and the high contrast for stresses diminishes. There is very less difference in the local stress distribution of 40-layer and 50-layer simulations. In these 3D simulations, it is observed that, although the phase interface is more prone to higher stresses, it is not always the case. In the middle section, it is observed that the local stress distribution becomes consistent with similar areas of high and low stresses. This similarity in obtained results—with increased RVE thickness—represents the convergence of the point to point local solutions.
Figure 6 shows local von Mises true strain distribution in all geometries of RVE-E at 25% of global true strain. In this figure, both—ferrite and martensite—phases are shown. Embedded martensite grains undergo negligible plastic strain during overall deformation and, hence, exhibit almost zero strain in Figure 6 (pointed out by green arrows). In 01-layer simulation results, it is observed that the local strain contrast is quite large with sharp strain channels around martensite grains oriented 45 ° to the applied load direction. As the RVE thickness increases from 01-layer to 50-layers, it is observed that this sharp strain contrast on the top surface diminishes due to strain distribution in the third dimension. In the middle section of simulated geometry, it is observed that the local strain distribution converges with similar solution output in case of 40-layer and 50-layer geometries, respectively (pointed out by red arrows). The magnitude and position of local strain distribution in these cases are identical.
The visual comparison of local stress and strain distribution in multiple varying geometries to observe the convergence of results—as shown in Figure 5 and Figure 6—is a very challenging task. Visual inspections are primarily dependent on subjective choices; therefore, statistical data analysis tools are adopted in the current research in order to work out the convergence of the observed results. For statistical analysis, PDFs and CDFs of true local stress and strain distributions in each phase are constructed for each simulated geometry at the maximum global strain. Local stress and strain distributions in each phase of each geometry are compared. This detailed comparison is shown in Figure 7 by intelligently grouping data in different subplots.
It is observed that, with small D f , i.e., in the case of RVE-A, as shown in Figure 7a, the local stress, and strain distribution in both phases is quite different for 01-layer geometry as compared with thicker geometries. It is observed that, with increasing geometry thickness, the PDFs and CDFs become similar after more than 10-layers.
When D f increases, i.e., in case of RVE-C as shown in Figure 7c, similar trend of convergence with increasing geometry thickness is observed. The distribution varies up to 20-layer geometry for the current case and it does not change with a further increase in geometry thickness. It is observed that, with increasing D f in all RVEs i.e., in Figure 7a–e, the PDFs and CDFs converge with increasing geometry thicknesses, but more geometry thickness is needed when D f is large. It is an expected response because for RVEs with large D f more geometry thickness is needed to define a grain completely and hence the flow of stresses and strains around it becomes possible.
The stress and strain distribution behavior of martensite in thin geometries (one-layer to 15-layers) is different from thick geometries (20-layers to 50-layers), as observed in Figure 7(iii,iv). One-layer simulations in Figure 7(iii) represent a large and packed strain distribution profile compared to higher thickness results. Distribution is relatively more dispersed over a broad strain range, independent of D f . The stress distribution profile of one-layer simulations in Figure 7(iv) for all RVEs shows two peaks and a wider dispersion, whereas the distribution in close to bell shape when the RVE thickness is increased.
In Figure 7a–e, it is observed that at 50-layers geometry—due to very less change in the local stress and strain distribution—a converged solution for all RVEs is obtained. The PDF and CDF plots for both phases and all geometries with varying D f are compared in Figure 8. It is observed that the curves accurately match with a slight difference in the peak values. When considering the same composition and material properties in all cases, this comparison confirms the convergence of the obtained results. From these data, one can interpret that with increasing layers in the RVE, the material volume and number of mesh points increase, or more specifically, a total number of randomly oriented grains increase. Therefore, the statistical behavior converges towards an average and, hence, produces a false notion of local convergence. This interpretation is not correct, as it can be verified by comparing local plots in Figure 5 and Figure 6 that the local point-to-point convergence of the results happens, which is captured by the statistical comparison presented in Figure 7.
Although with increasing geometry thickness, the stress and strain distributions for both phases in Figure 7 are observed to move in multiple dimensions with varying shape. The maxima were noted and normalized against 50-layer geometries to simplify the convergence criteria. Peak values of PDF normalized against the 50-layer thickness simulation for ferrite strain are shown in Figure 9a and for ferrite stress in Figure 9b. Here, it is important to mention that the convergence of a result was analyzed against 50-layer thickness simulations, assuming them as perfectly converged, which might not be the case.

4. Discussion

Full phase simulation models are extensively used to study microstructural attributes’ effects on local and global material deformation behaviors. The validation of such simulation models simultaneously on a global and local scale is a challenge that has not been addressed in the existing literature [32,41,42], but with its limitations. Crystal plasticity-based full-phase simulation models rely upon many constitutive and fitting parameters identified by comparing the experimental evolution of deformation mechanisms with the simulation results. These averaged stress–strain curves are compared to represent the accuracy of simulation results [17,22]. Based on such—global results based calibrated—models, the local material behavior is analyzed and studied. This methodology is useful for the inexpensive employment of such models. From the results of the current work, it is now clear that such methodology can be misleading as a wide variety of microstructures, which might result in very different local results, can yield the same global results.
It is shown in Figure 5 and Figure 6 that the problems arise when the local deformation behaviors are compared. Owing to time and capital-intensive critical task, not many researchers in the past have carried out such analysis and observed that results only match qualitatively [19,31]. It has been reported by earlier researchers [19] that, in 2D DAMASK simulations, there is a high local stress and strain contrast due to the non-availability of the third direction. Experimental analysis of stresses and strains in 3D is almost impossible due to which the 3D simulation results cannot be validated. Additionally, paradoxically, if 3D EBSD data are measured, then there is no sample left to perform experimentation. On the other hand, if in-situ tests are executed on a sample to analyze deformation behavior, 3D EBSD data cannot be collected.
In the past, it has been elaborated that the 3D results are different from the 2D results, and realistic 3D geometries are better than the generalized 3D geometries [19]. How much of the 3D dimension is required for a converged solution was reported by Diehl et al. [32] by running simulations with fixed grain size RVEs. In this study, the effect of varying grain size of ferrite and martensite in DP steel is analyzed in order to study its effect. RVEs with varying mean feature size were synthetically constructed for dual-phase steel case in the current work. The RVEs were sliced to construct geometries with varying thicknesses from one to 50 layers. In 2D simulations with actual EBSD data or synthetically constructed RVEs, non-realistic high contrast stress and strain distribution are observed. It is evident that there is a drastic difference in the local results in 2D geometry when compared with 3D geometry.
The current work has not analyzed the effect of free surface on the convergence of the results, which can be important when comparing the converged local solutions with in-situ test observations. This should be kept in consideration while adopting the current methodology for such analysis. The readers are encouraged to refer to [32,50] for such modelling methodology.
In current work, statistical probability and cumulative distribution curves were compared for each phase in order to comprehensively analyze the local stress and strain distributions. The following relationship can be drawn for the obtained results, which is in accordance with the previous publications [32,42]:
c o n v e r g e d s o l u t i o n f o r D f 1 G N L N
An empirical function can be drawn and it generalizes the convergence results trend by normalizing the peak of stress and strain PDFs in the ferrite phase. Figure 10 shows the constructed empirical convergence criteria from the results of RVE-A, B, and C converged simulations. Only the first three points were considered in the development of the proposed empirical model. This is because the convergence of results here is used as a relative term against 50-layer thickness simulations, which might be misleading in the case of larger grain size RVEs. More simulations are needed with bigger RVEs in the future to be sure about their convergence. It is understood from previous work [18] that a large number of grains is vital for a solution convergence and, therefore, it is not good practice to reduce the total number of grains below 500 in an RVE.
This criterion helps in setting the upper bound limit of D f to 15. The number of layers required for a specific D f can be calculated using the following derived empirical function:
L N 5 D f 15
this equation is very specific and it is only valid for the similar grain sizes of two phases having 100 3 μ m 3 RVE size. To generalize the conclusions for a more general use, the equation can be modified as:
t R V E 500 D f 100 15 × 2   μ m
This given criterion is the new finding of the current research. It should be adopted and fulfilled while carrying out full phase simulations and discussing the local stress and strain evolution in a given microstructure.

5. Conclusions

In this research, the effect of RVE thickness on the changing global and local results is analyzed for an exemplary case of dual-phase steels. This research’s primary objective is to identify the optimal RVE thickness with respect to the defined feature size for obtaining converged local results. RVEs were constructed by varying the mean feature sizes between 3 to 18 μ m using DREAM-3D with grains having randomly assigned orientation distributions. The constructed RVEs were sliced into 1, 5, 10, 15, 20, 25, 30, 40, and 50 layers to construct different geometries with increasing thickness. Crystal plasticity model parameters for ferrite and martensite phases were adopted from already published work. The global and local simulation results were directly and statistically compared in order to draw the following conclusions from the study:
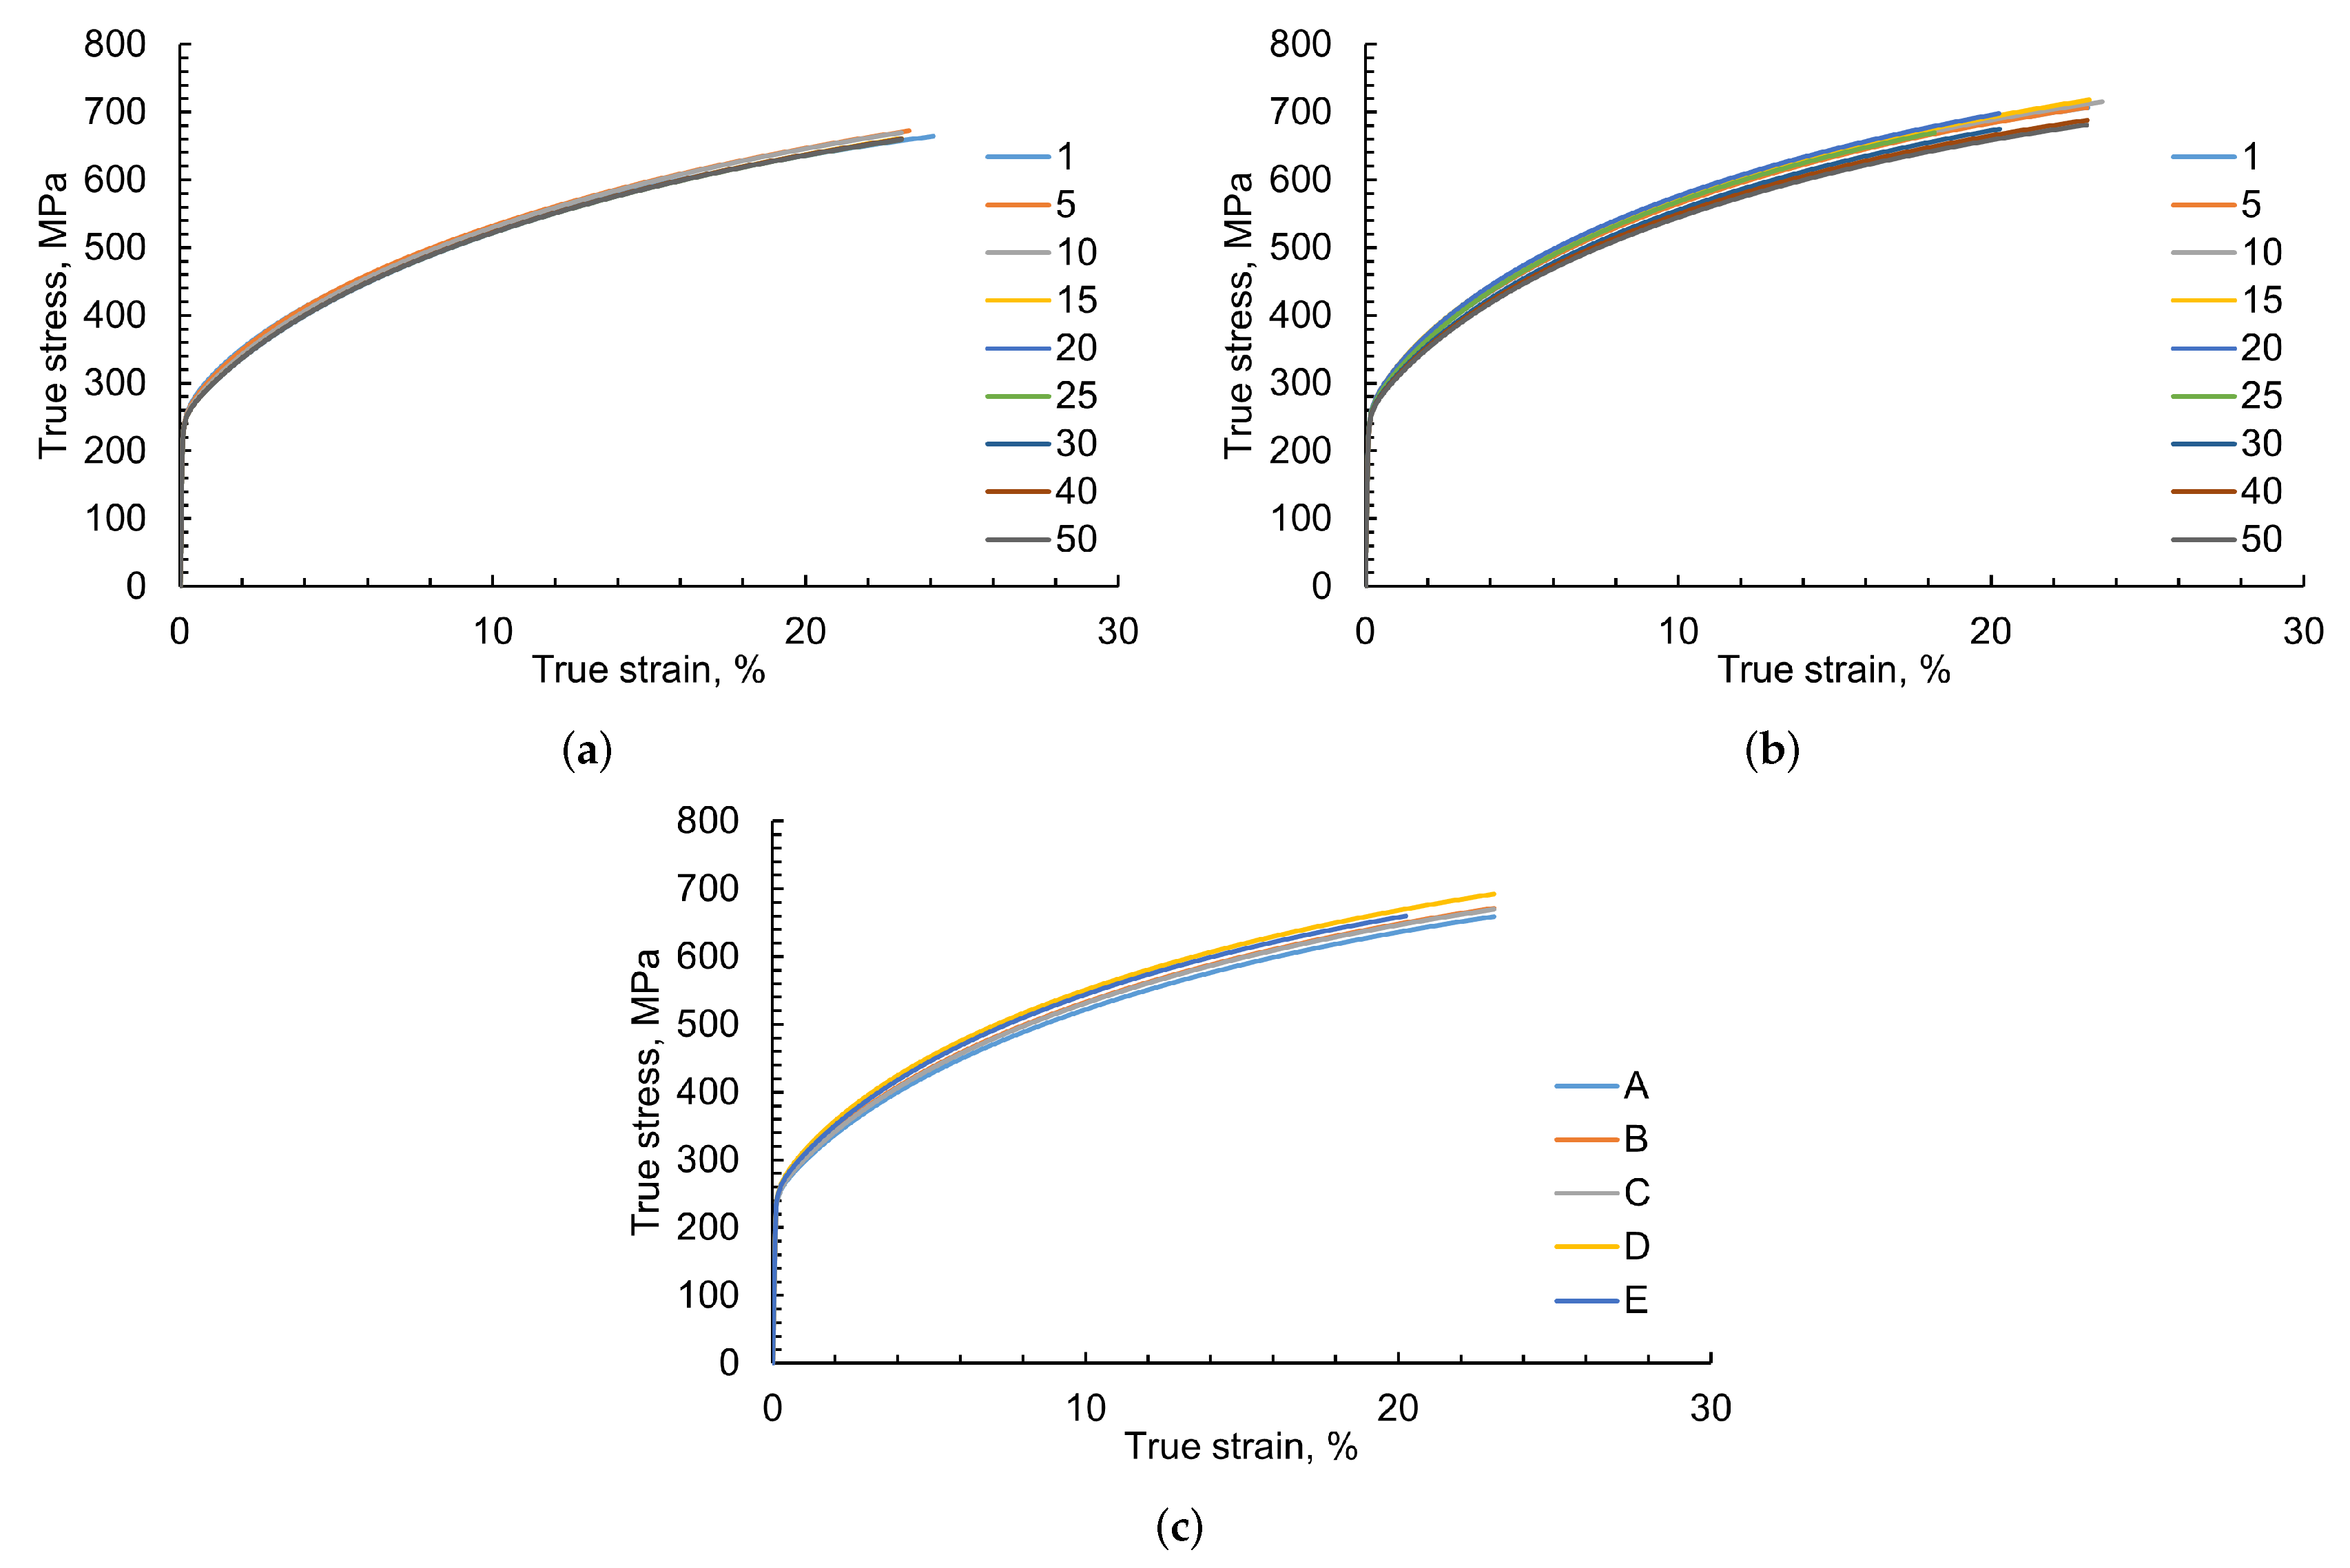
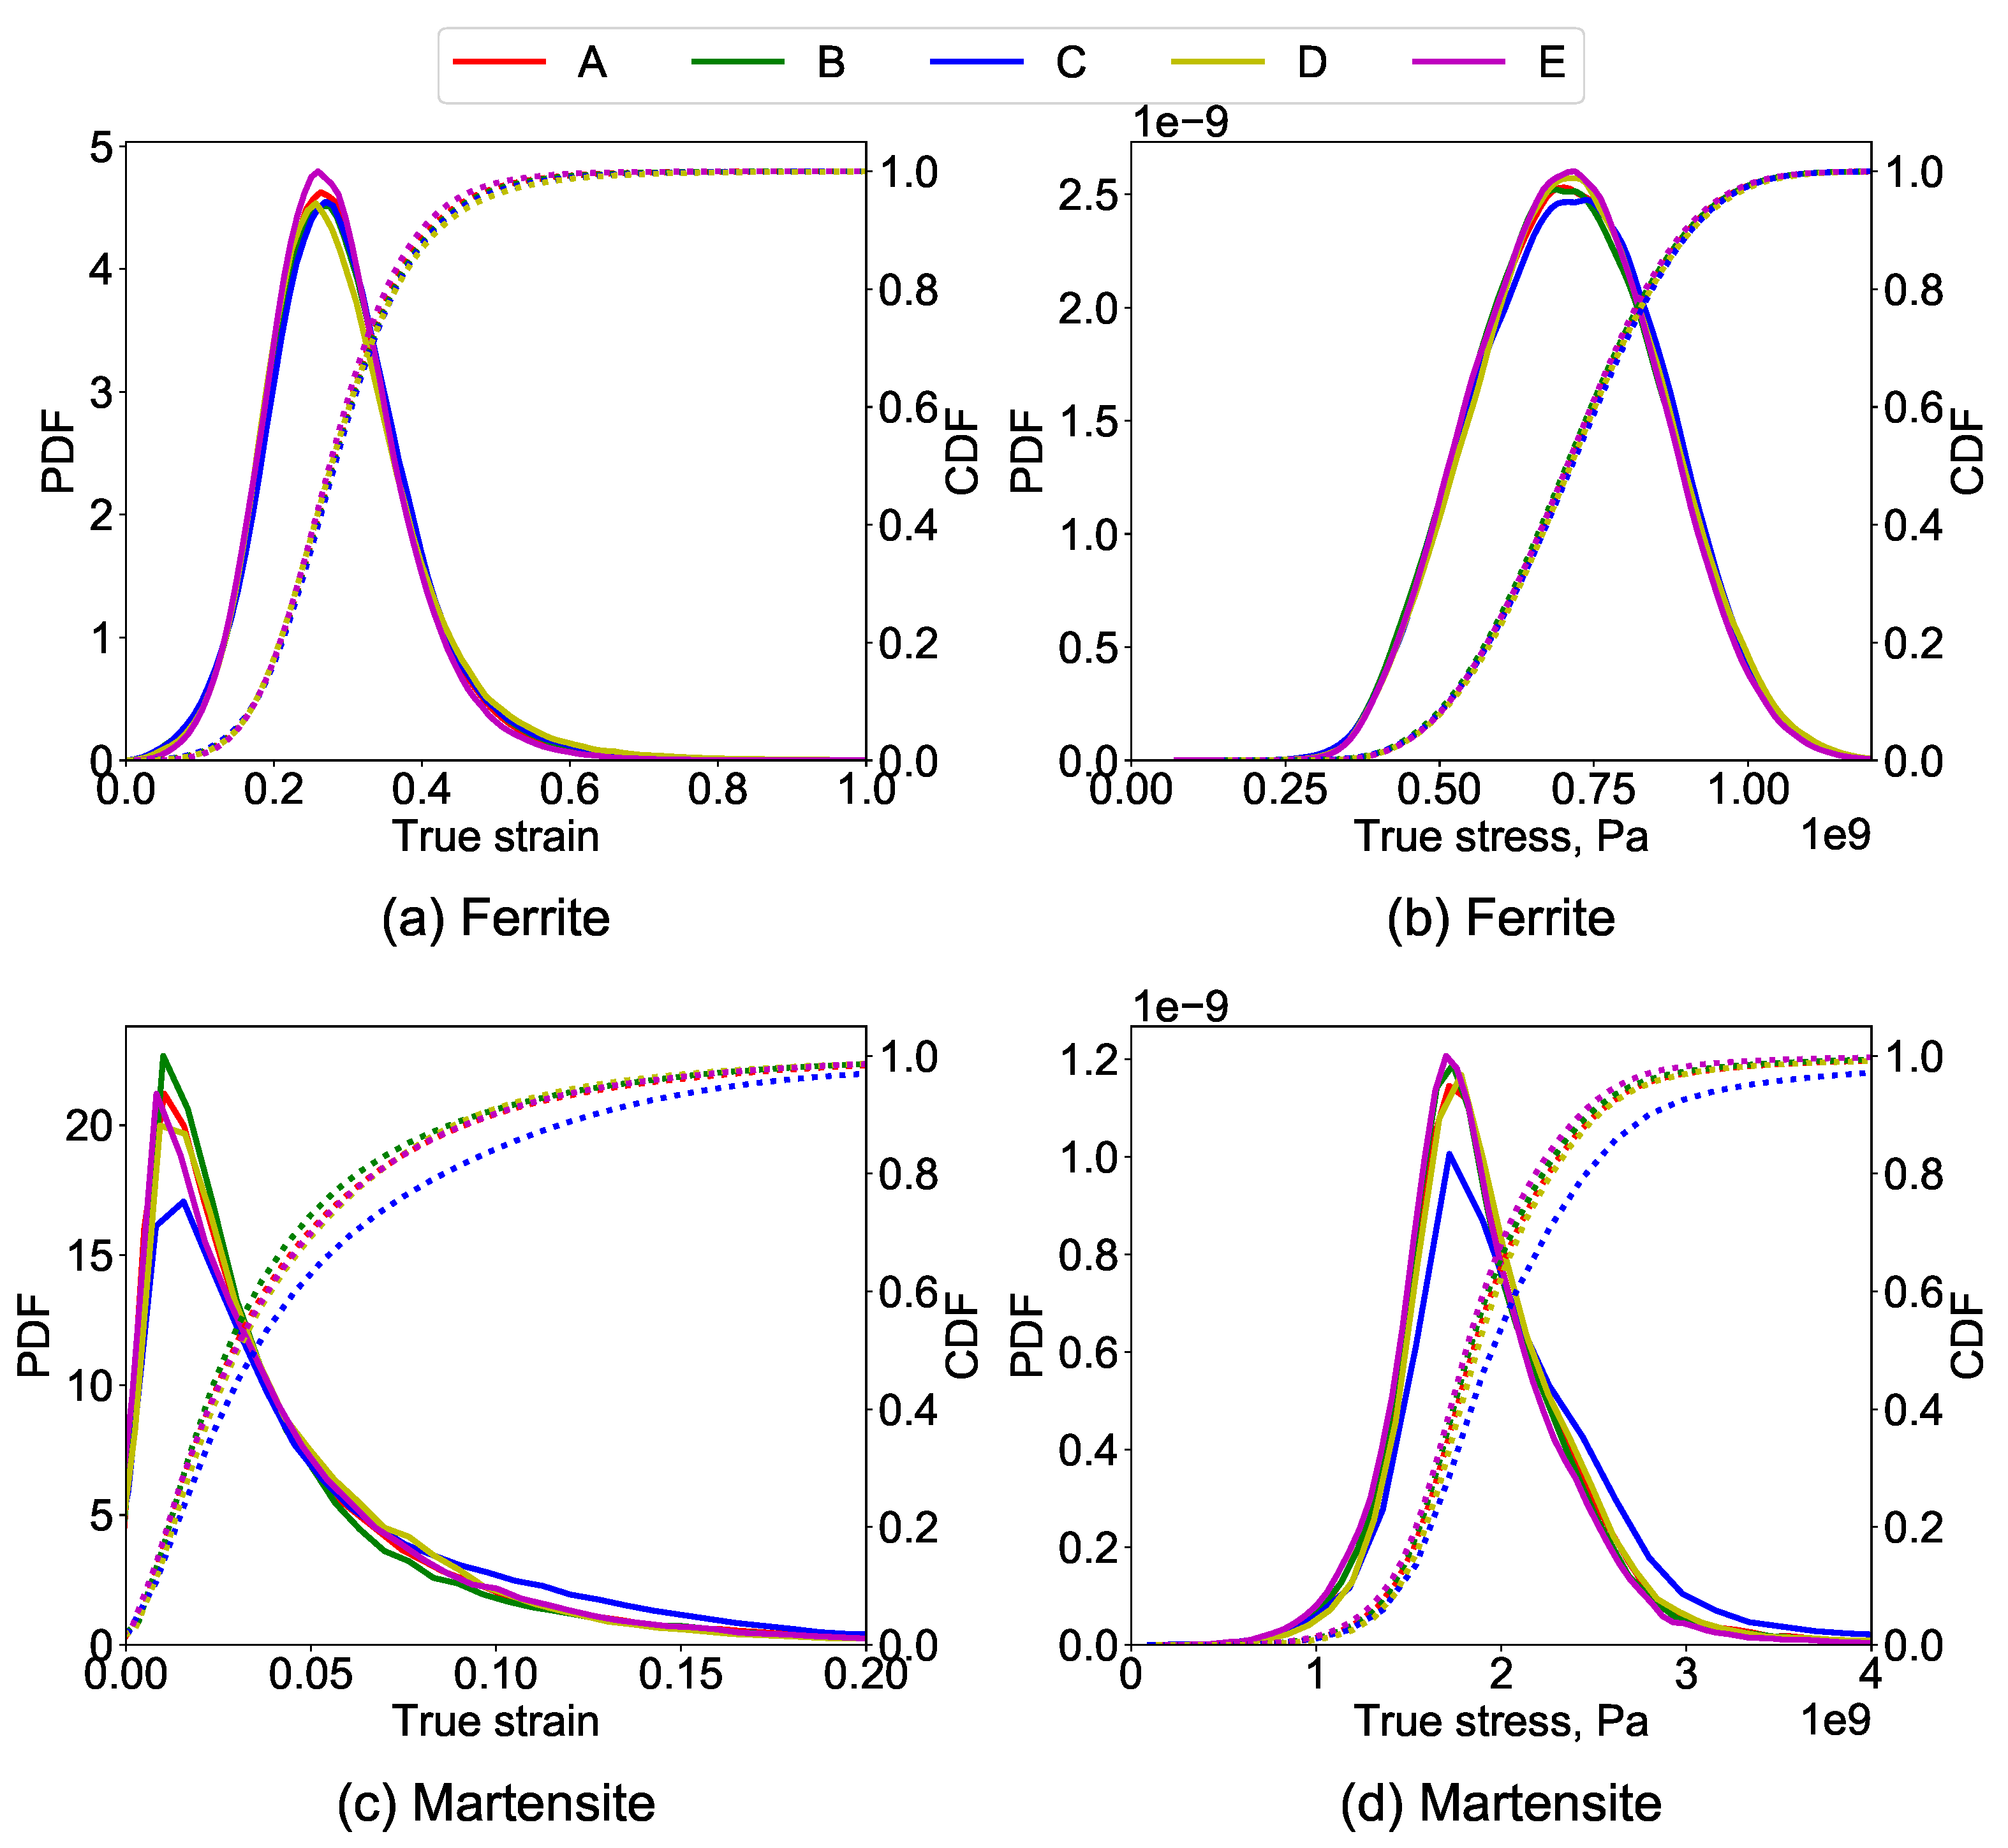
  • As long as the orientation distribution and composition of the material is the same—even with changing mean feature size, the total number of grains and geometry thickness—the global deformation and stress–strain behavior of the material does not change drastically (<5% divergence)
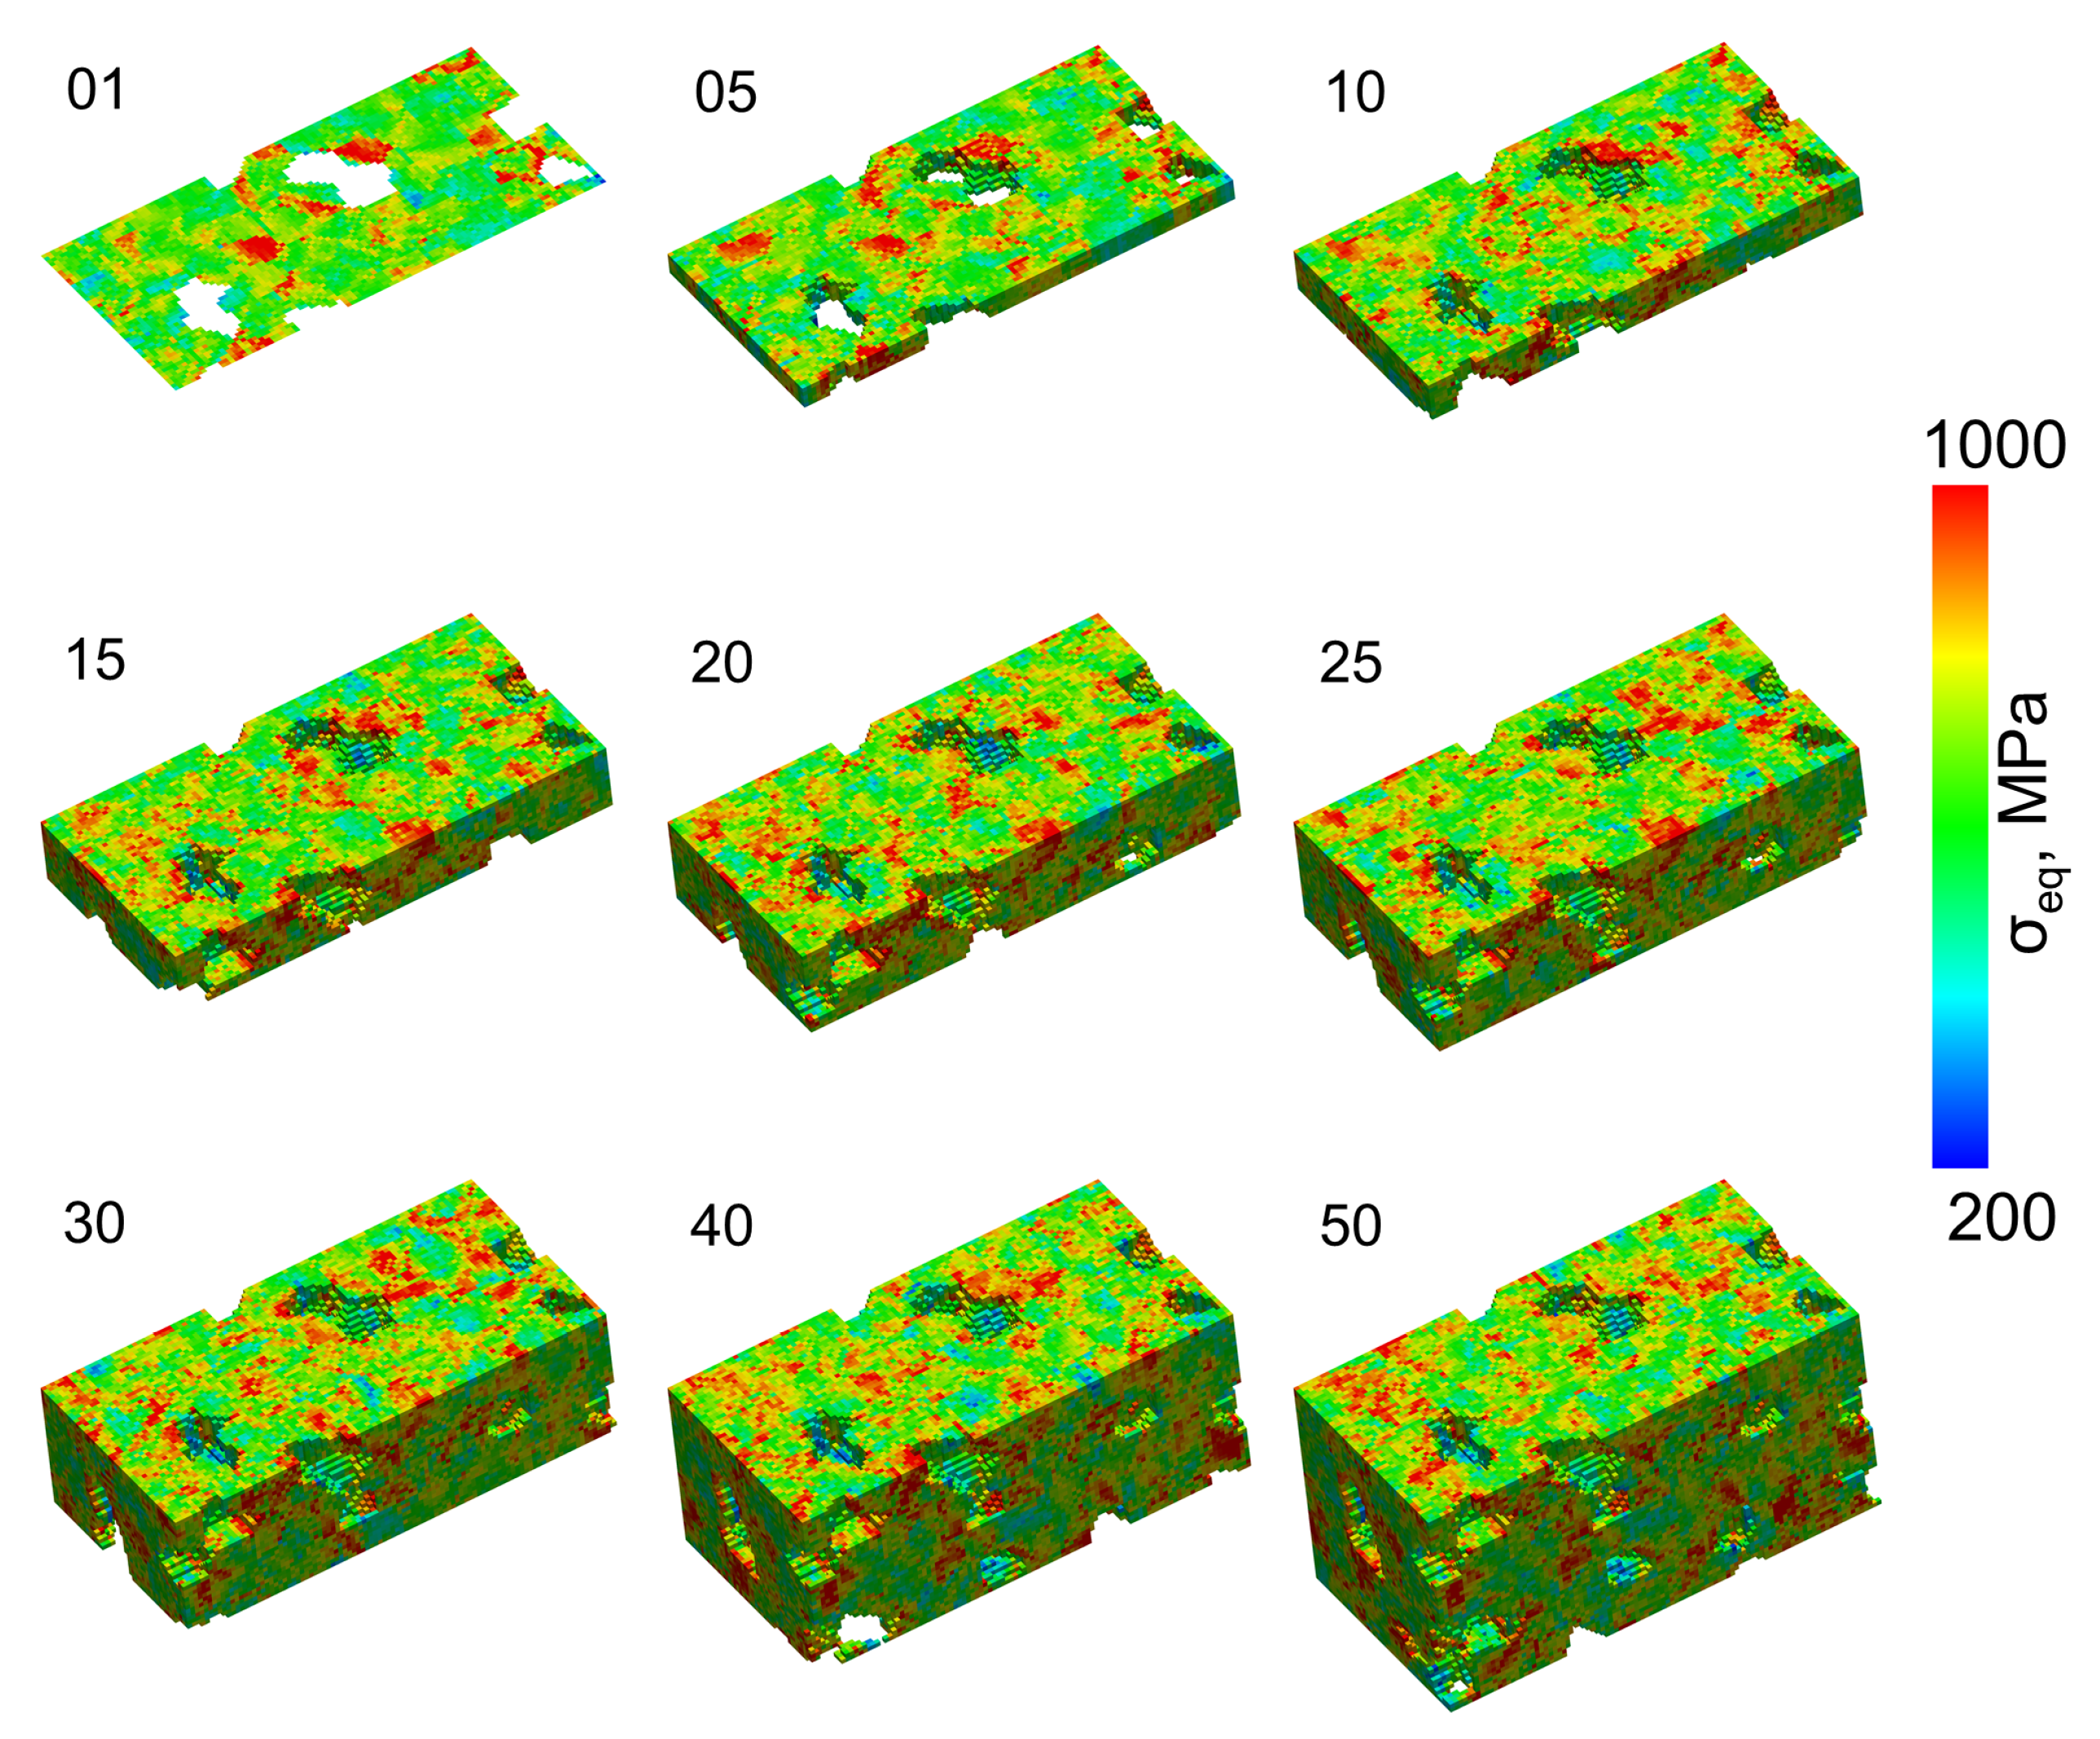
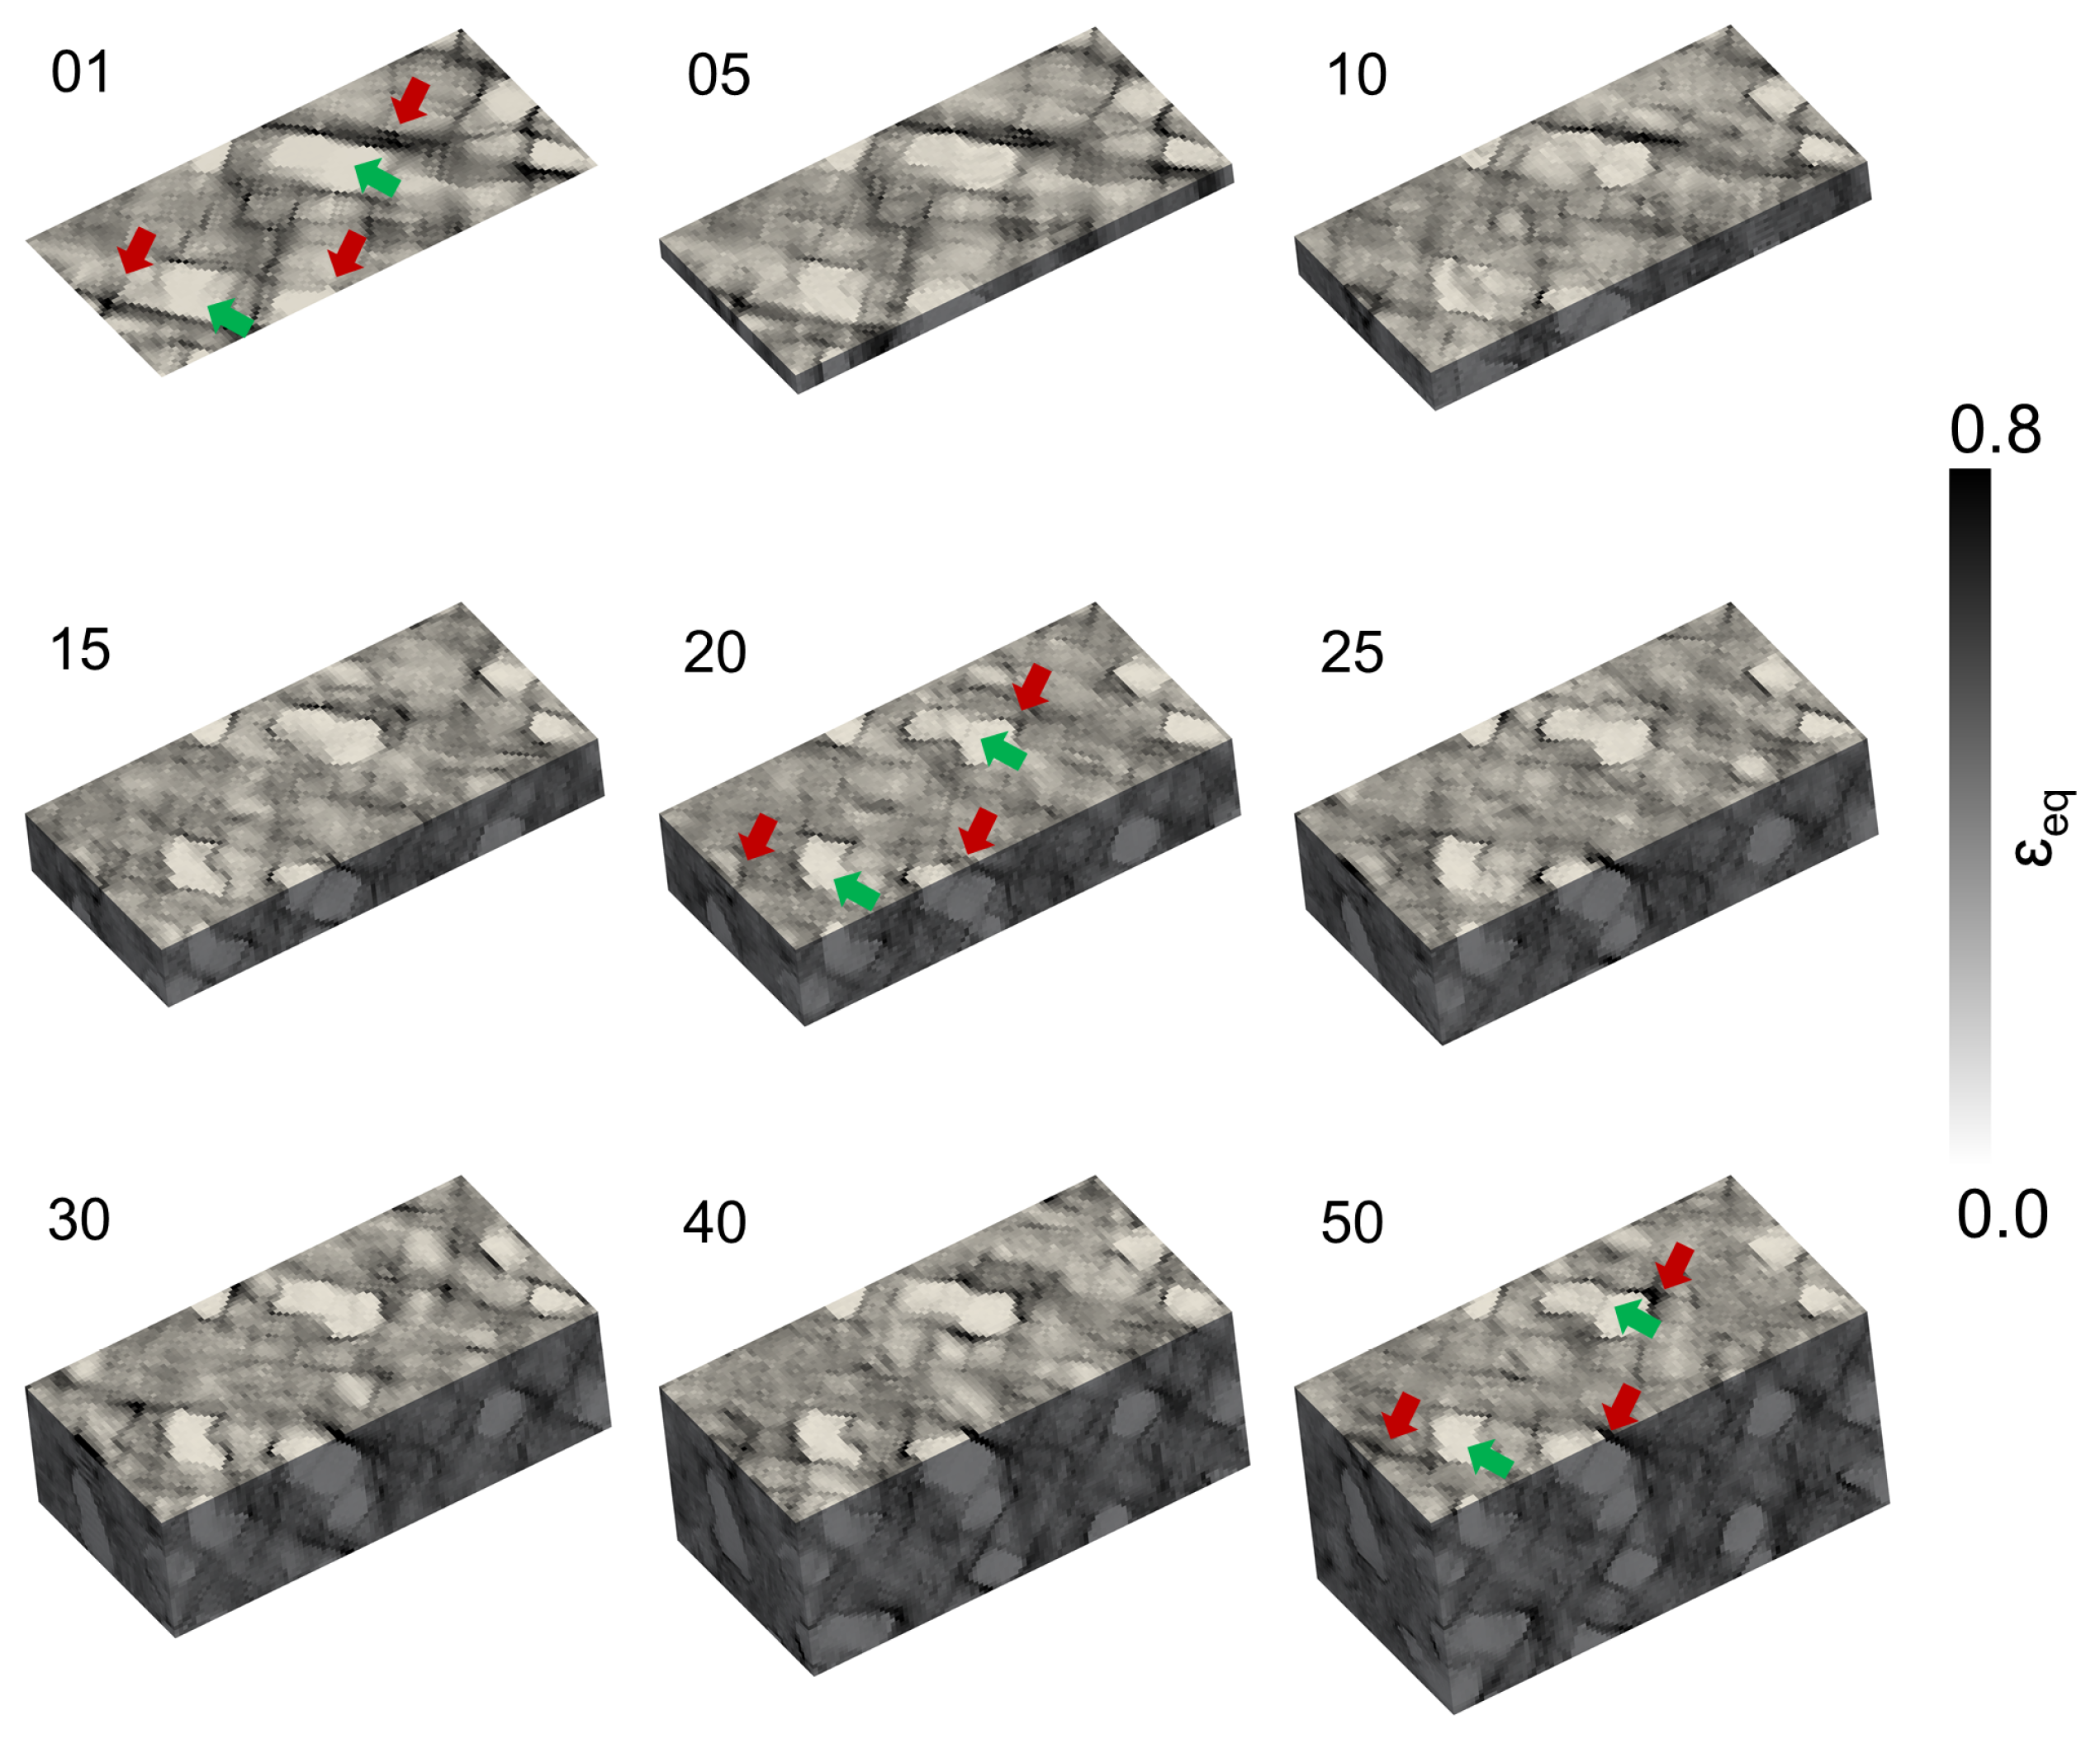
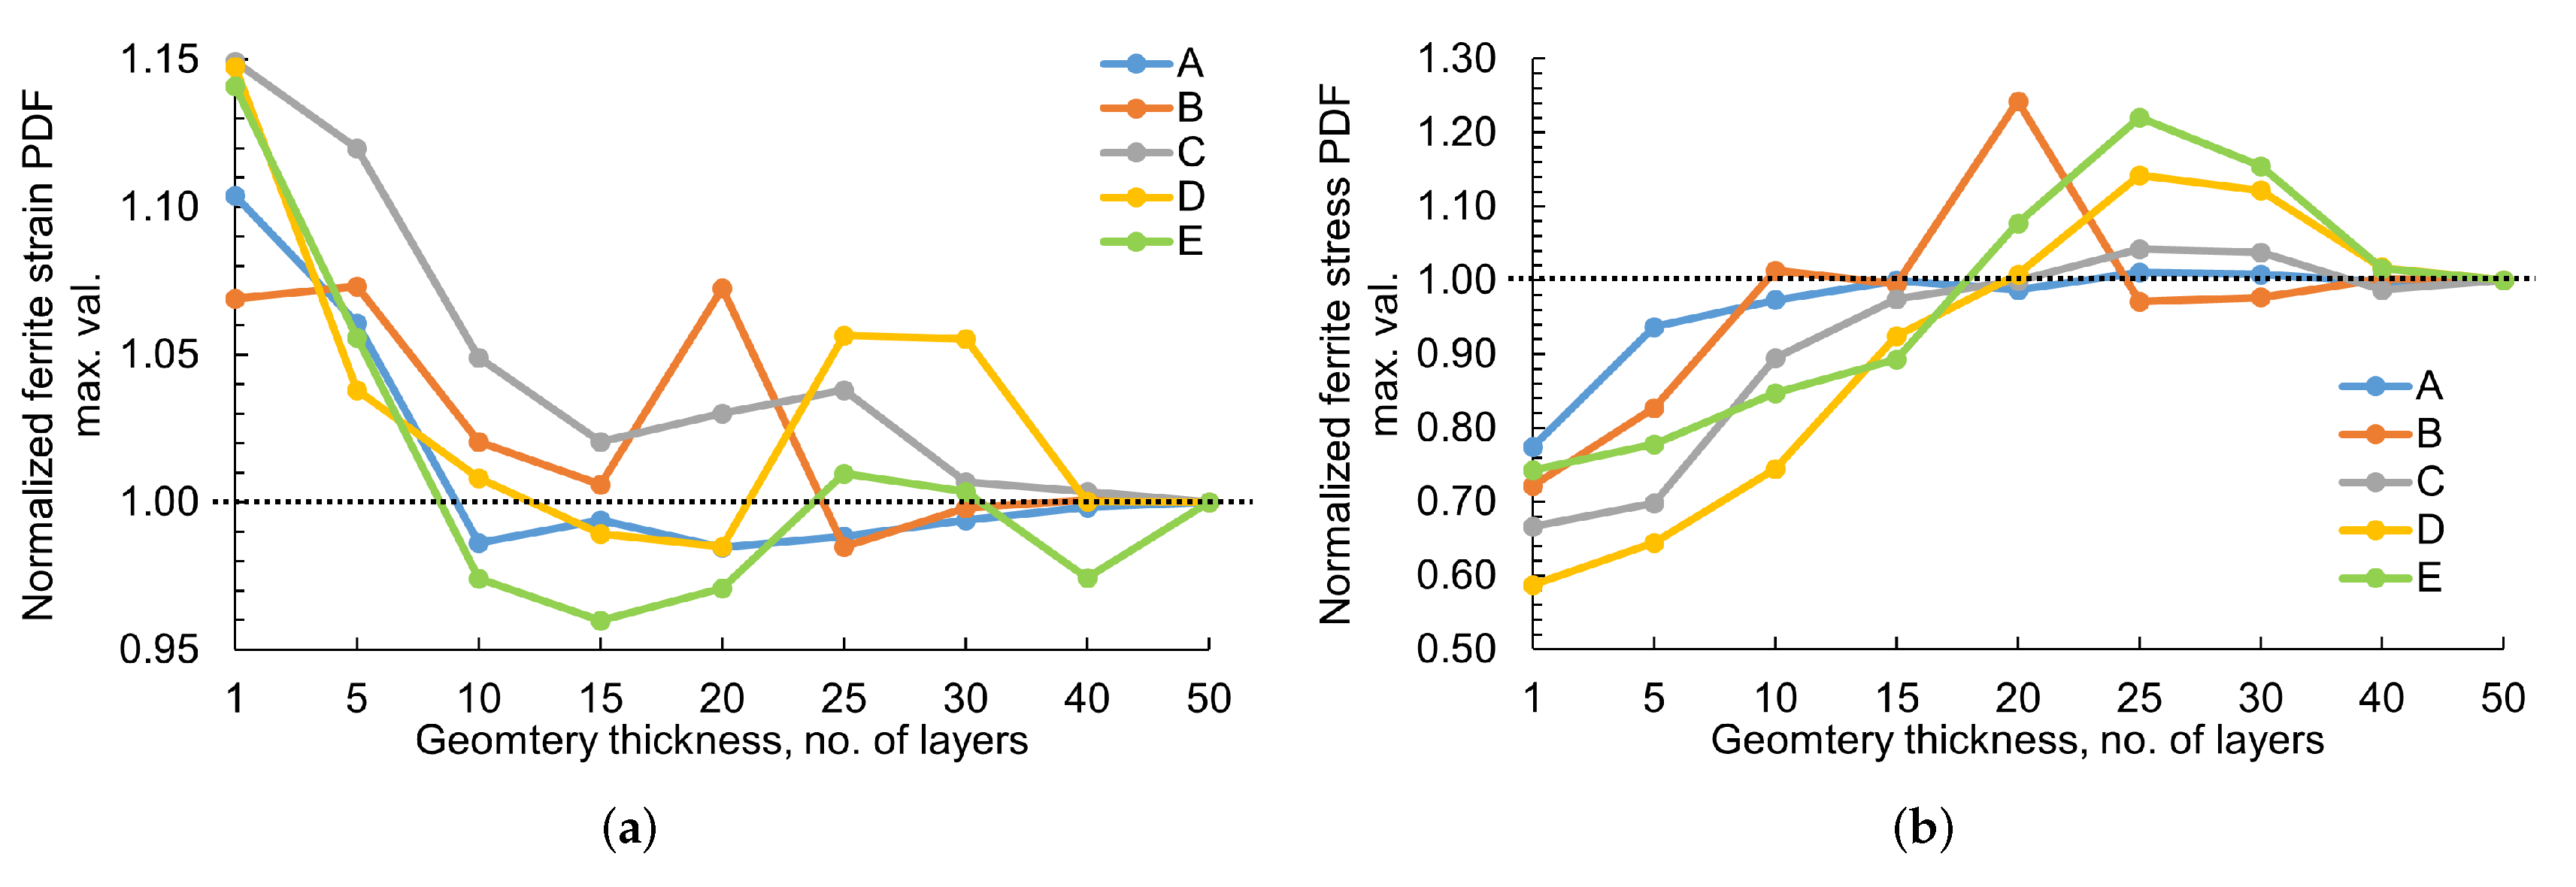
  • Although the global stress–strain behavior of different RVEs is similar, a large variation in the local stress—strain of RVEs with varying thickness and the feature size is observed during the visual and statistical comparison.
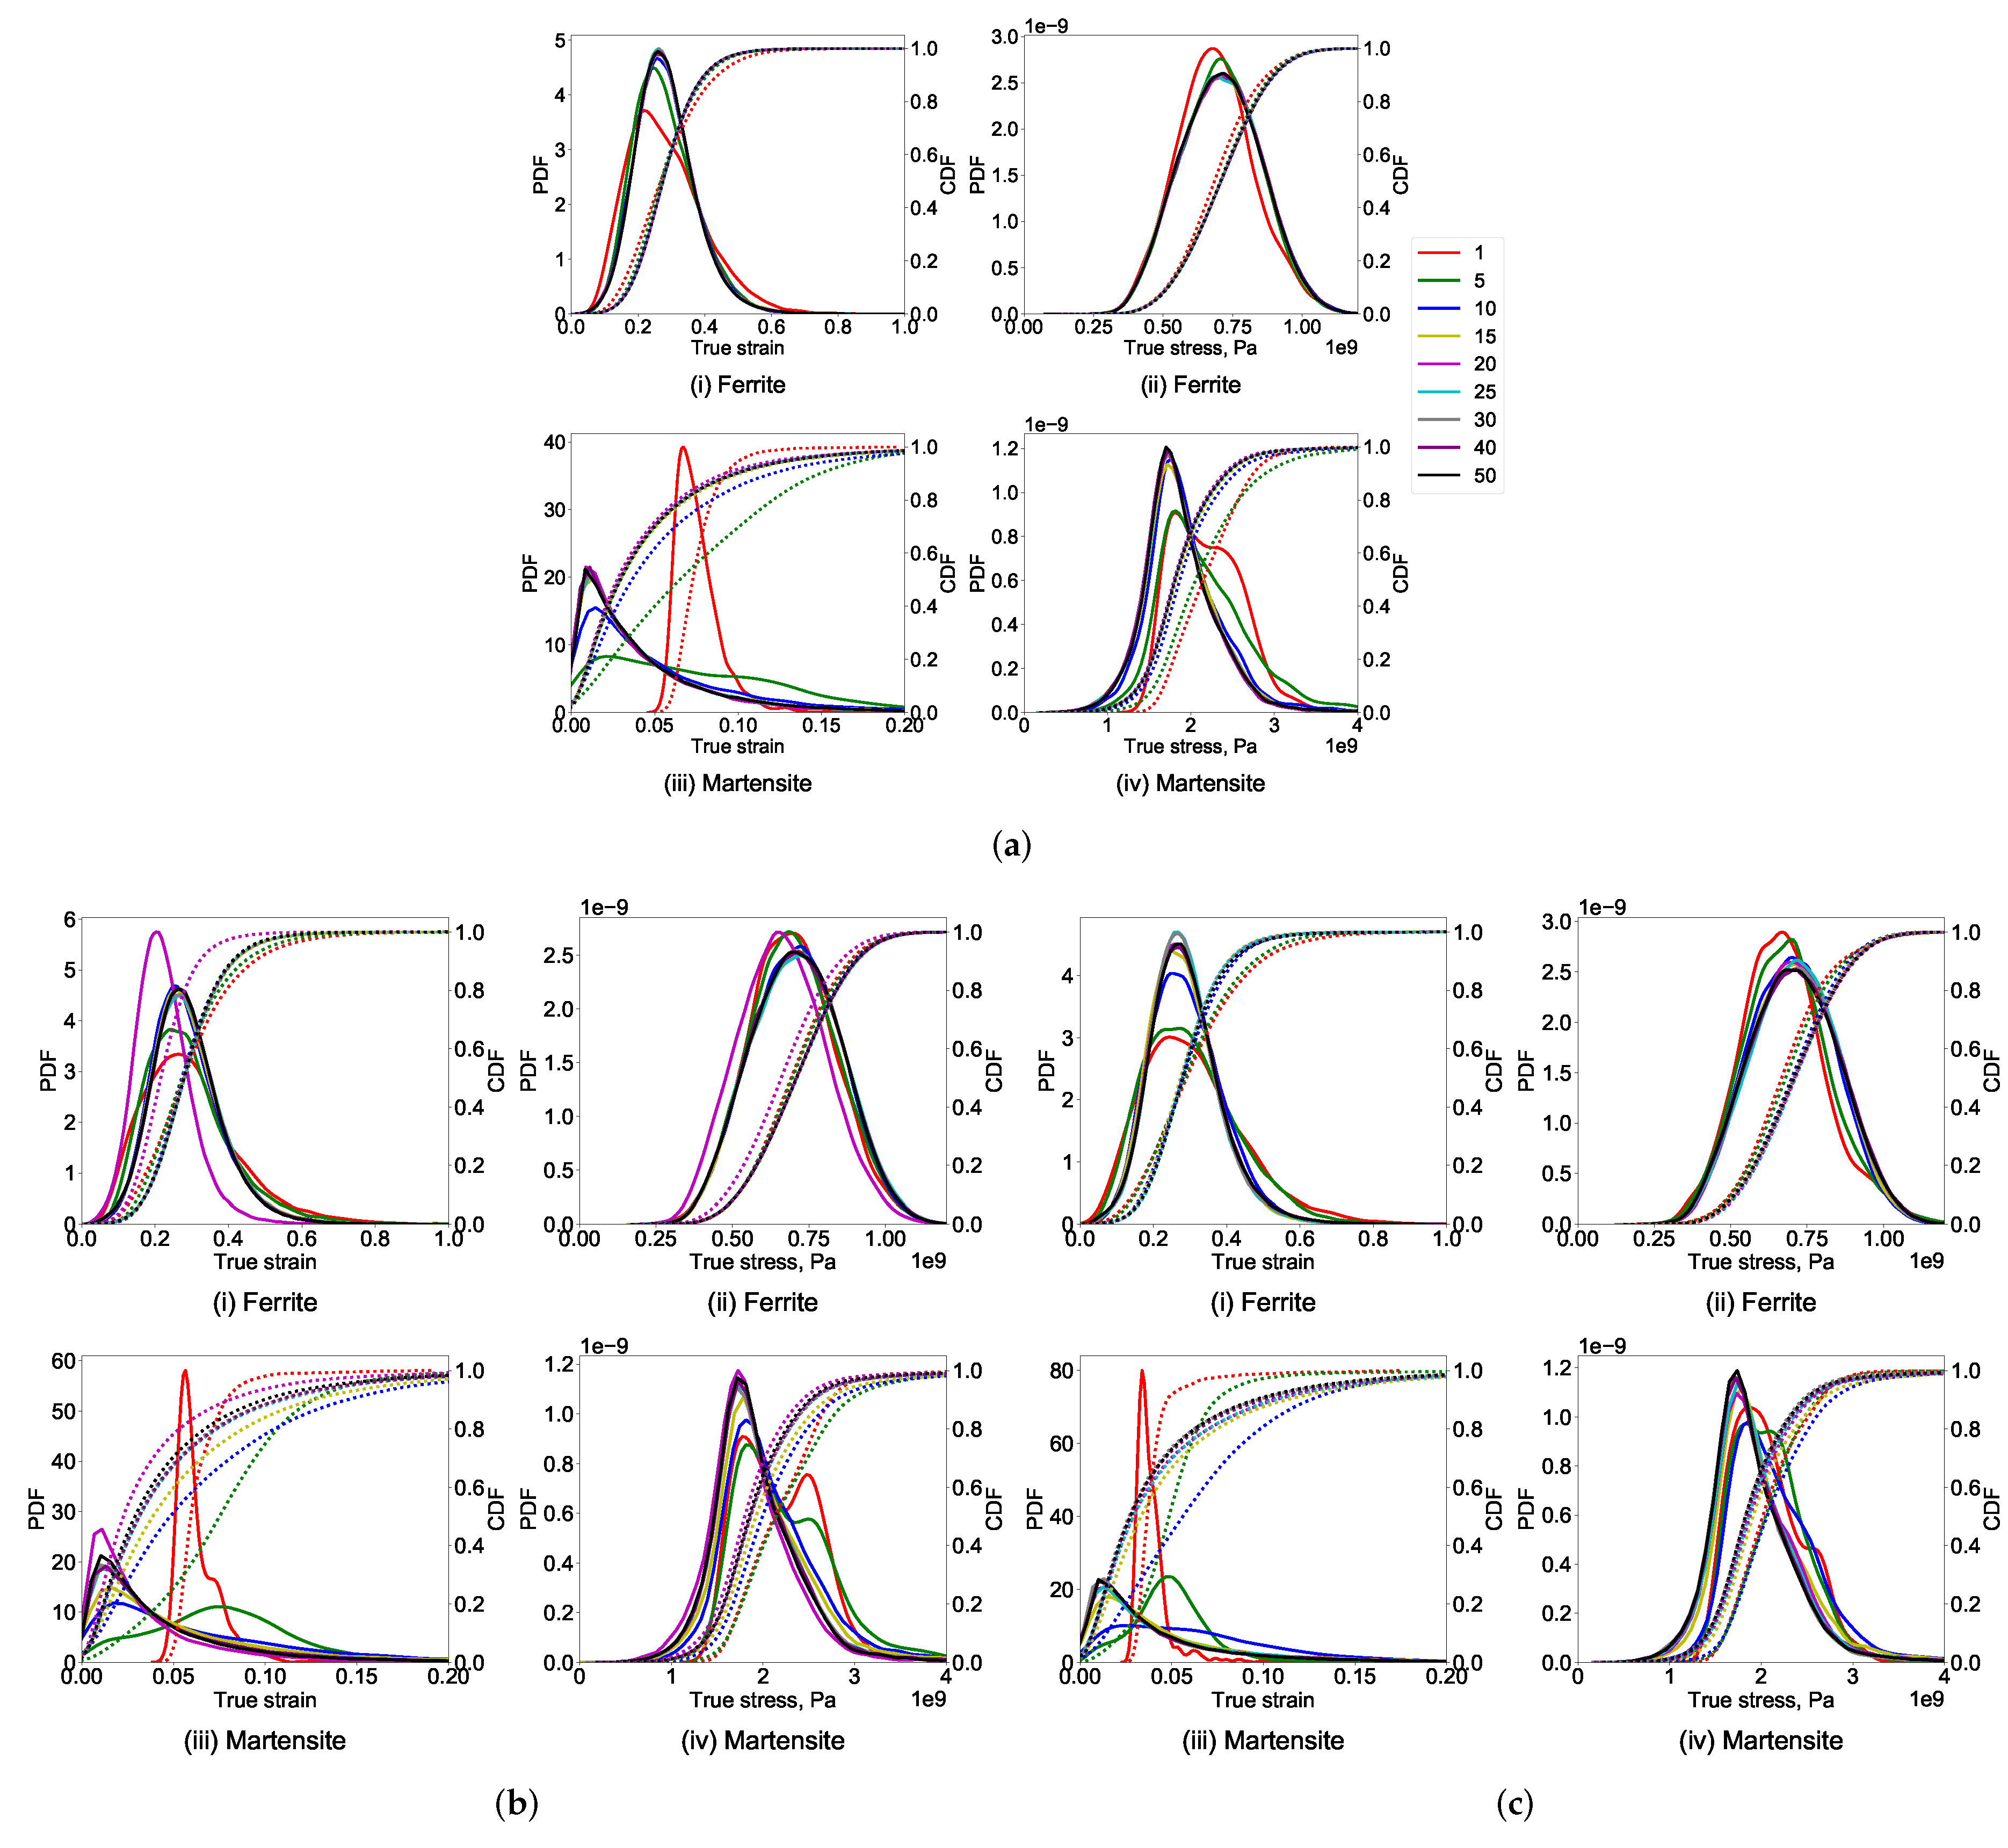
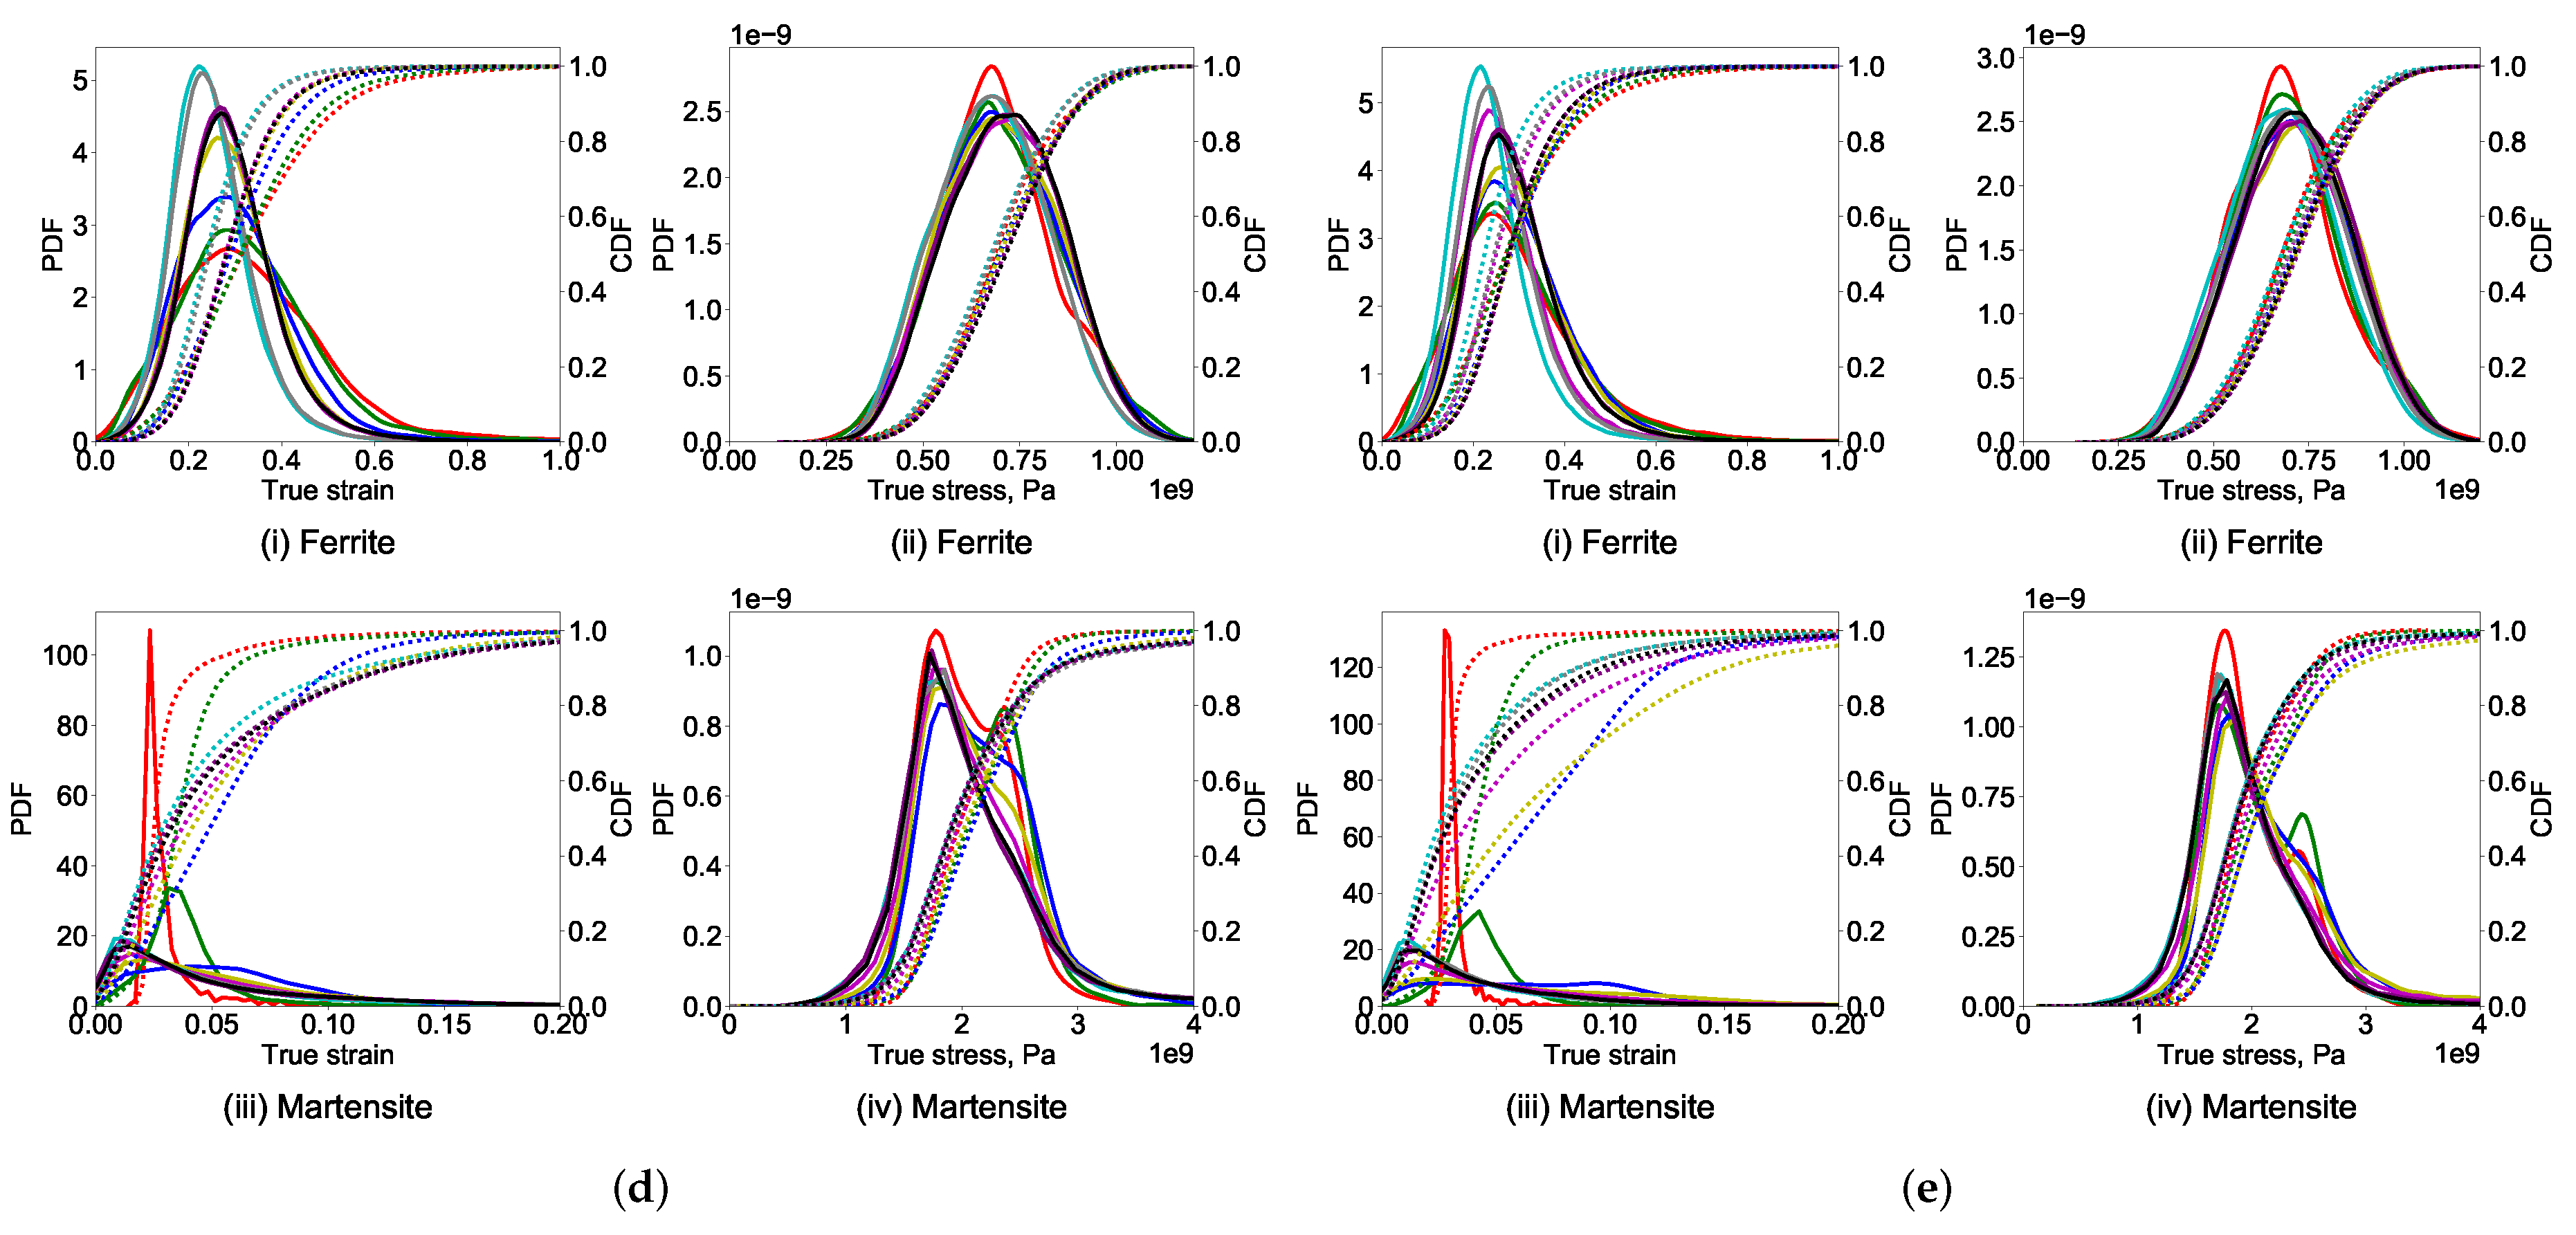
  • Stress and strain probability distribution in 2D RVEs is drastically different from 3D RVEs. In 2D RVEs, the strain prediction in the soft phase is higher, in the hard phase is lower, whereas the stress prediction in the soft phase is lower and the hard phase is higher.
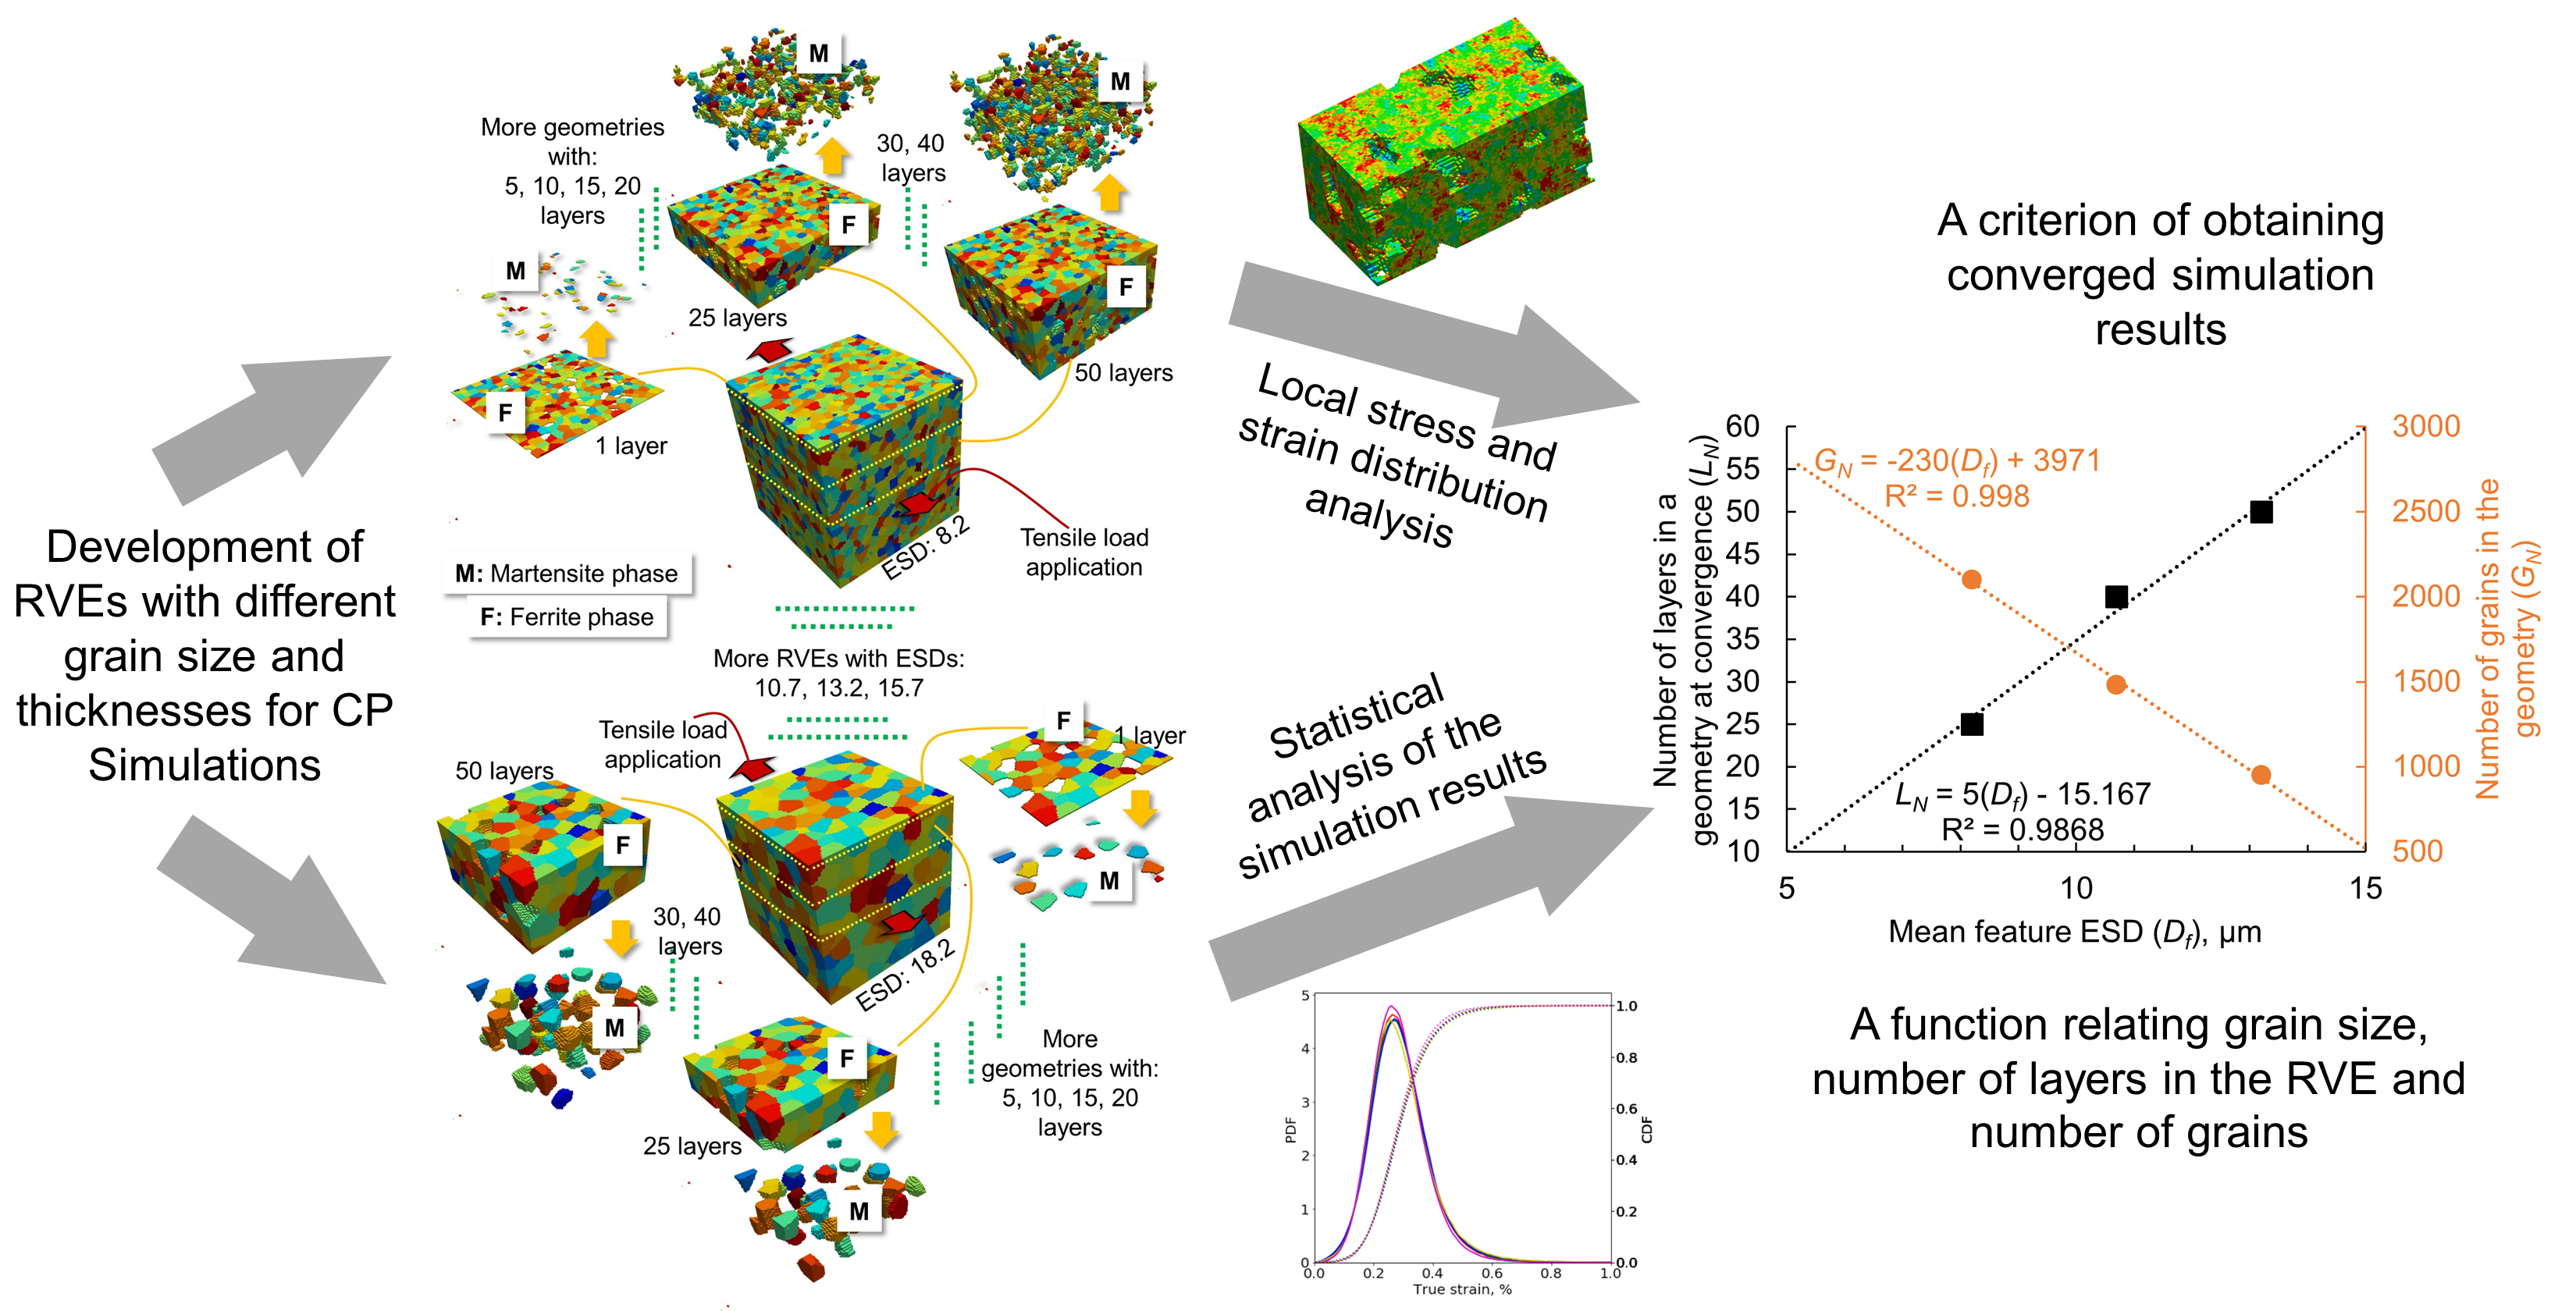
  • It is necessary to consider 3D RVEs, which are at least five times larger than the average grain size for stabilized and more accurate local deformation behavior determination. This estimation helps in optimizing the computation time for accurate mesoscale simulations.
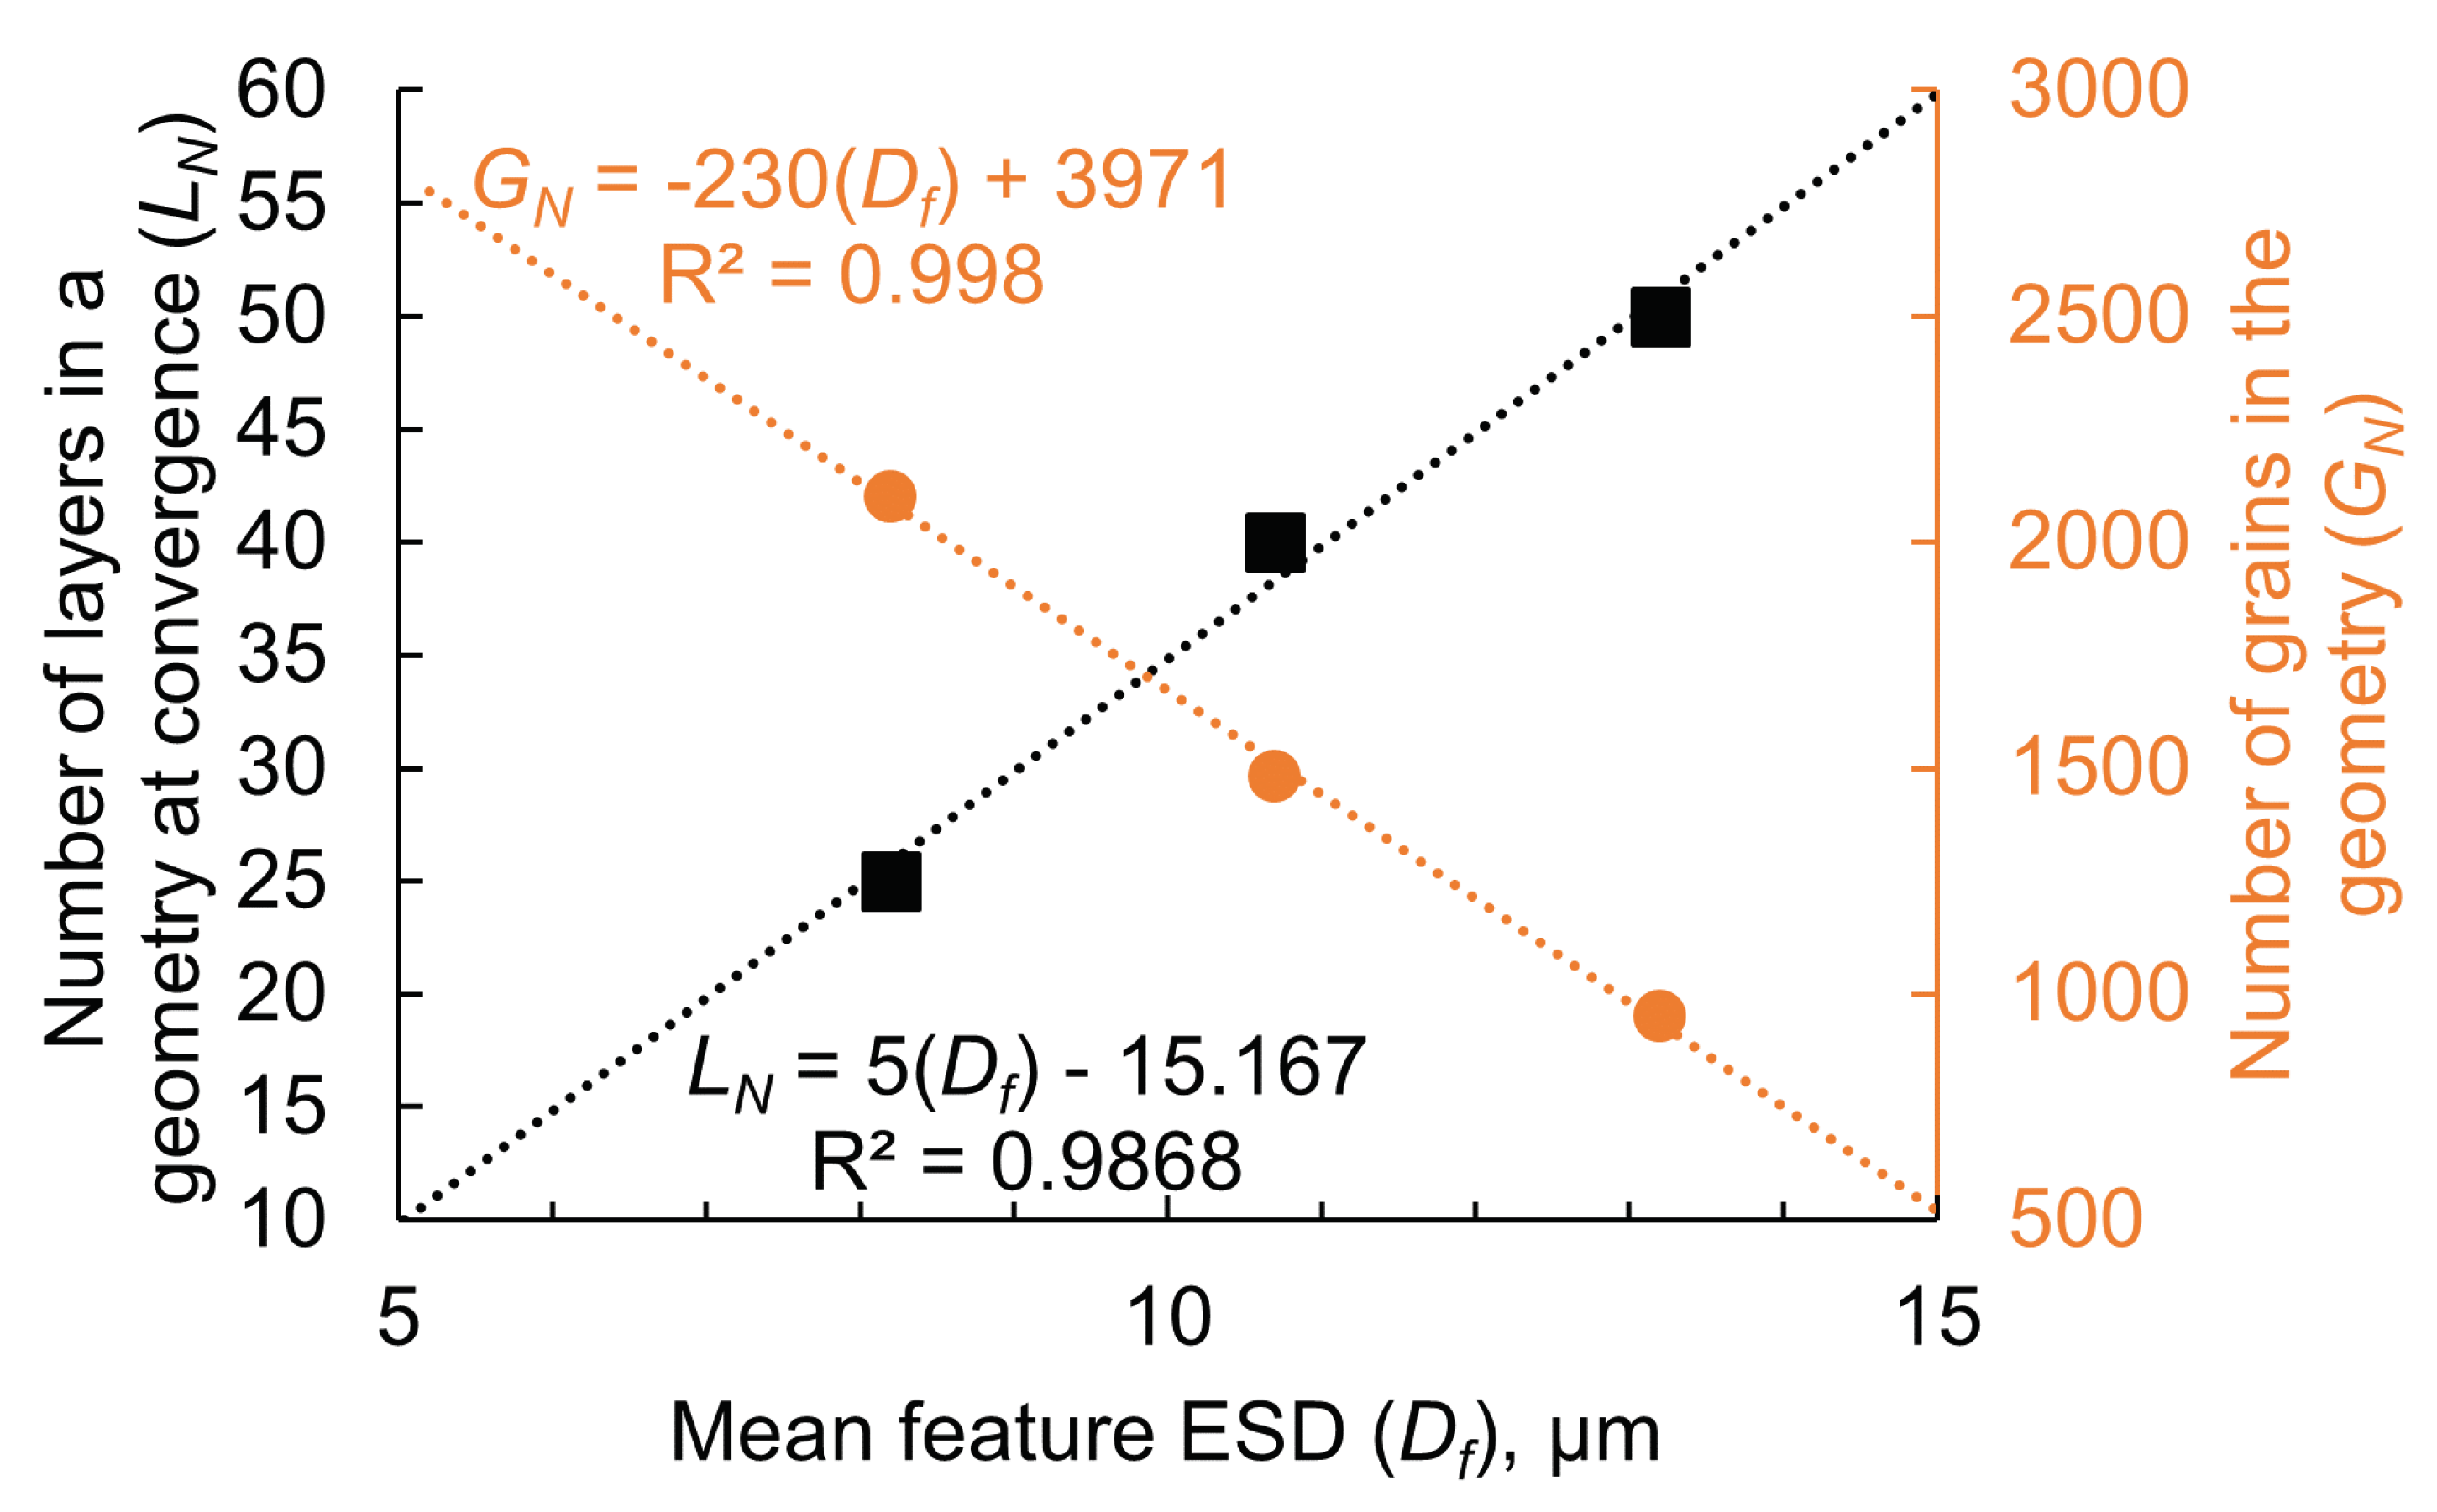
  • Figure 10 and Equations (4) & (5) provide a criterion for choosing the mean feature ESD and effective RVE thickness. This criterion should be fulfilled for full phase simulations carried out using DAMASK in the future for obtaining converged simulation results for multi-phase materials i.e., DP steel.

Author Contributions

Conceptualization, F.Q. and A.A.C.; methodology, F.Q.; software, A.A.C.; validation, F.Q., A.A.C., and S.G.; formal analysis, A.A.C.; investigation, F.Q.; resources, S.G. and M.S.; data curation, F.Q.; writing—original draft preparation, F.Q. and A.A.C.; writing—review and editing, F.Q., A.A.C.; visualization, F.Q. and M.S.; supervision, S.G., M.S. and U.P.; project administration, R.K. and U.P.; funding acquisition, F.Q. and U.P. All authors have read and agreed to the published version of the manuscript.

Funding

This research was funded by Deutsche Forschungsgemeinschaft (DFG, German Research Foundation) within the framework of collaborative research group “TRIP Matrix Composites” project number 54473466 – SFB 799. The APC is also funded by SFB799.

Acknowledgments

The authors acknowledge the DAAD Faculty Development for Candidates (Balochistan), 2016 (57245990)—HRDI-UESTP’s/UET’s funding scheme in cooperation with the Higher Education Commission of Pakistan (HEC) for sponsoring the stay of Faisal Qayyum at IMF TU Freiberg. This work is conducted within the DFG funded collaborative research group “TRIP Matrix Composites” (SFB 799). The authors gratefully acknowledge the German Research Foundation (DFG) for the financial support of the SFB 799. The authors also acknowledge the support of Martin Diehl & Franz Roters (MPIE, Düsseldorf) for their help regarding the functionality of DAMASK.

Conflicts of Interest

The authors declare no conflict of interest.

Nomenclature

Acronyms
SymbolDescriptionUnit
RVERepresentative Volume Element
EBSDElectron Back Scatter Diffraction
CPCrystal Plasticity
TRIPTransformation Induced Plasticity
Greek Symbols
SymbolDescriptionUnit
ESDEstimated Sphere Diameter μ m
Mg-PSZMagnesium Partially Stabilized Zirconia
PDFProbability Distribution Function
CDFCummulative Distribution Function
G N Number of considered grains
L N Number of considered layers
D f Mean feature estimated sphere diameter μ m
t R V E RVE thickness μ m

Appendix A. Phenomenological Crystal Plasticity Model

The model is adopted for the body-centered cubic (bcc) crystals of the phenomenological crystal plasticity description by Peirce et al. [51]. The microstrcuture is parametrized in terms of a slip resistance S { 011 } α on each of the 12 { 011 } 111 slip systems, and S { 211 } α on each of the 12 { 211 } 111 slip systems which are indexed by α = 1 , , 24 . These resistances increase asymptotically towards S α with shear γ according to the relationship
S ˙ α = h 0 ( 1 S α / S α ) w h α β γ ˙ β
with interaction ( h α β ) and fitting ( w , h 0 ) parameters. Given a set of current slip resistances, shear on each system evolves at a rate of
γ ˙ α = γ ˙ 0 τ α S α n sgn ( τ α )
with τ α = S . ( b α n α ), a reference shear rate γ ˙ 0 and a stress exponent n. The superposition of shear on all slip systems in turn determines the plastic velocity gradient:
L P = γ ˙ α b α n α
where b α and n α are unit vectors along the slip direction and slip plane normal respectively.
Using the quasi-static strain rate of 1 × 10 4 all RVEs were loaded in tension for 2500 s (load direction with reference to the top surface is shown in Figure 2 with red arrows) to reach a total strain of average 25%.

References

  1. Clyne, T.; Withers, P. An Introduction to Metal Matrix Composites; Cambridge University Press: Cambridge, UK, 1995. [Google Scholar]
  2. Ullah, M.; Wu, C.S.; Qayyum, F. Prediction of crack tip plasticity induced due to variation in solidification rate of weld pool and its effect on fatigue crack propagation rate (FCPR). J. Mech. Sci. Technol. 2018, 32, 3625–3635. [Google Scholar] [CrossRef]
  3. Mukhtar, F.; Qayyum, F.; Anjum, Z.; Shah, M. Effect of chrome plating and varying hardness on the fretting fatigue life of AISI D2 components. Wear 2019, 418, 215–225. [Google Scholar] [CrossRef]
  4. Berisha, B.; Hirsiger, S.; Hippke, H.; Hora, P.; Mariaux, A.; Leyvraz, D.; Bezençon, C. Modeling of anisotropic hardening and grain size effects based on advanced numerical methods and crystal plasticity. Arch. Mech. 2019, 71, 489–505. [Google Scholar]
  5. Hazanov, S. Hill condition and overall properties of composites. Arch. Appl. Mech. 1998, 68, 385–394. [Google Scholar] [CrossRef]
  6. Ullah, M.; Pasha, R.A.; Chohan, G.Y.; Qayyum, F. Numerical simulation and experimental verification of CMOD in CT specimens of TIG welded AA2219-T87. Arab. J. Sci. Eng. 2015, 40, 935–944. [Google Scholar] [CrossRef]
  7. Hussain, N.; Qayyum, F.; Pasha, R.A.; Shah, M. Development of multi-physics numerical simulation model to investigate thermo-mechanical fatigue crack propagation in an autofrettaged gun barrel. Def. Technol. 2020, in press. [Google Scholar] [CrossRef]
  8. Mukhtar, F.; Qayyum, F.; Elahi, H.; Shah, M. Studying the Effect of Thermal Fatigue on Multiple Cracks Propagating in an SS316L Thin Flange on a Shaft Specimen Using a Multi-Physics Numerical Simulation Model. Strojniški Vestnik J. Mech. Eng. 2019, 65, 565–573. [Google Scholar] [CrossRef]
  9. Zaoui, A. Changement d’échelle: Motivation et méthodologie. In Homogénéisation en Mécanique des Matériaux, Tome 1: Matériaux Aléatoires Élastiques et Milieux Périodiques; Hermes Science: Paris, France, 2001; pp. 19–39. [Google Scholar]
  10. Besson, J.; Cailletaud, G.; Chaboche, J.L.; Forest, S. Mécanique Non Linéaire des Matériaux; Hermès Science Publications: Paris, France, 2001. [Google Scholar]
  11. Lebensohn, R.A.; Kanjarla, A.K.; Eisenlohr, P. An elasto-viscoplastic formulation based on fast Fourier transforms for the prediction of micromechanical fields in polycrystalline materials. Int. J. Plast. 2012, 32, 59–69. [Google Scholar] [CrossRef]
  12. Qayyum, F.; Guk, S.; Kawalla, R.; Prahl, U. Experimental investigations and multiscale modeling to study the effect of sulfur content on formability of 16MnCr5 alloy steel. Steel Res. Int. 2019, 90, 1800369. [Google Scholar] [CrossRef]
  13. Anbarlooie, B.; Hosseini-Toudeshky, H.; Hosseini, M.; Kadkhodapour, J. Experimental and 3D Micromechanical Analysis of Stress–Strain Behavior and Damage Initiation in Dual-Phase Steels. J. Mater. Eng. Perform. 2019, 28, 2903–2918. [Google Scholar] [CrossRef]
  14. Kim, D.K.; Kim, E.Y.; Han, J.; Woo, W.; Choi, S.H. Effect of microstructural factors on void formation by ferrite/martensite interface decohesion in DP980 steel under uniaxial tension. Int. J. Plast. 2017, 94, 3–23. [Google Scholar] [CrossRef]
  15. Liu, Y.; Wang, W.; Lévy, B.; Sun, F.; Yan, D.M.; Lu, L.; Yang, C. On centroidal voronoi tessellation—energy smoothness and fast computation. ACM Trans. Graph. (ToG) 2009, 28, 1–17. [Google Scholar] [CrossRef] [Green Version]
  16. Kok, P.; Spanjer, W.; Vegter, H. A microstructure based model for the mechanical behavior of multiphase steels. Key Eng. Mater. 2015, 651, 975–980. [Google Scholar] [CrossRef]
  17. Diehl, M.; Groeber, M.; Haase, C.; Molodov, D.A.; Roters, F.; Raabe, D. Identifying Structure–Property Relationships Through DREAM.3D Representative Volume Elements and DAMASK Crystal Plasticity Simulations: An Integrated Computational Materials Engineering Approach. J. Miner. 2017, 69, 848–855. [Google Scholar] [CrossRef] [Green Version]
  18. Qayyum, F.; Guk, S.; Prüger, S.; Schmidtchen, M.; Saenko, I.; Kiefer, B.; Kawalla, R.; Prahl, U. Investigating the local deformation and transformation behavior of sintered X3CrMnNi16-7-6 TRIP steel using a calibrated crystal plasticity-based numerical simulation model. Int. J. Mat. Res. (Zeitschrift für Metallkunde) 2020, 111, 392–404. [Google Scholar] [CrossRef]
  19. Diehl, M.; An, D.; Shanthraj, P.; Zaefferer, S.; Roters, F.; Raabe, D. Crystal plasticity study on stress and strain partitioning in a measured 3D dual phase steel microstructure. Phys. Mesomech. 2017, 20, 311–323. [Google Scholar] [CrossRef]
  20. Liu, C.; Shanthraj, P.; Diehl, M.; Roters, F.; Dong, S.; Dong, J.; Ding, W.; Raabe, D. An integrated crystal plasticity–phase field model for spatially resolved twin nucleation, propagation, and growth in hexagonal materials. Int. J. Plast. 2018, 106, 203–227. [Google Scholar] [CrossRef]
  21. Diehla, M.; Naunheim, Y.; Yan, D.; Morsdorf, L.; An, D.; Tasan, C.C.; Zaefferer, S.; Roters, F.; Raabe, D. Coupled Experimental-Numerical Analysis of Strain Partitioning in Metallic Microstructures: The Importance of Considering the 3D Morphology. In Proceedings of the BSSM 12th International Conference on Advances in Experimental Mechanics, Sheffield, UK, 29–31 August 2017; pp. 1–2. [Google Scholar]
  22. Tasan, C.C.; Hoefnagels, J.P.M.; Diehl, M.; Yan, D.; Roters, F.; Raabe, D. Strain localization and damage in dual phase steels investigated by coupled in-situ deformation experiments and crystal plasticity simulations. Int. J. Plast. 2014, 63, 198–210. [Google Scholar] [CrossRef] [Green Version]
  23. Ramazani, A.; Mukherjee, K.; Quade, H.; Prahl, U.; Bleck, W. Correlation between 2D and 3D flow curve modelling of DP steels using a microstructure-based RVE approach. Mater. Sci. Eng. A 2013, 560, 129–139. [Google Scholar] [CrossRef]
  24. Knezevic, M.; Savage, D.J. A high-performance computational framework for fast crystal plasticity simulations. Comput. Mater. Sci. 2014, 83, 101–106. [Google Scholar] [CrossRef]
  25. He, Q.C. Effects of size and boundary conditions on the yield strength of heterogeneous materials. J. Mech. Phys. Solids 2001, 49, 2557–2575. [Google Scholar] [CrossRef]
  26. Gitman, I.; Askes, H.; Sluys, L. Representative volume: Existence and size determination. Eng. Fract. Mech. 2007, 74, 2518–2534. [Google Scholar] [CrossRef]
  27. Jiang, M.; Jasiuk, I.; Ostoja-Starzewski, M. Apparent elastic and elastoplastic behavior of periodic composites. Int. J. Solids Struct. 2002, 39, 199–212. [Google Scholar] [CrossRef]
  28. Jiang, M.; Ostoja-Starzewski, M.; Jasiuk, I. Scale-dependent bounds on effective elastoplastic response of random composites. J. Mech. Phys. Solids 2001, 49, 655–673. [Google Scholar] [CrossRef]
  29. Groeber, M.A.; Jackson, M.A. DREAM. 3D: A digital representation environment for the analysis of microstructure in 3D. Integr. Mater. Manuf. Innov. 2014, 3, 5. [Google Scholar] [CrossRef] [Green Version]
  30. Barrett, T.J.; Savage, D.J.; Ardeljan, M.; Knezevic, M. An automated procedure for geometry creation and finite element mesh generation: Application to explicit grain structure models and machining distortion. Comput. Mater. Sci. 2018, 141, 269–281. [Google Scholar] [CrossRef]
  31. Qayyum, F.; Guk, S.; Schmidtchen, M.; Kawalla, R.; Prahl, U. Modeling the Local Deformation and Transformation Behavior of Cast X8CrMnNi16-6-6 TRIP Steel and 10% Mg-PSZ Composite Using a Continuum Mechanics-Based Crystal Plasticity Model. Crystals 2020, 10, 221. [Google Scholar] [CrossRef] [Green Version]
  32. Diehl, M.; Shanthraj, P.; Eisenlohr, P.; Roters, F. Neighborhood influences on stress and strain partitioning in dual-phase microstructures. Meccanica 2016, 51, 429–441. [Google Scholar] [CrossRef]
  33. Hitti, K.; Laure, P.; Coupez, T.; Silva, L.; Bernacki, M. Precise generation of complex statistical Representative Volume Elements (RVEs) in a finite element context. Comput. Mater. Sci. 2012, 61, 224–238. [Google Scholar] [CrossRef]
  34. Bargmann, S.; Klusemann, B.; Markmann, J.; Schnabel, J.E.; Schneider, K.; Soyarslan, C.; Wilmers, J. Generation of 3D representative volume elements for heterogeneous materials: A review. Prog. Mater. Sci. 2018, 96, 322–384. [Google Scholar] [CrossRef]
  35. Lee, S.B.; Lebensohn, R.; Rollett, A.D. Modeling the viscoplastic micromechanical response of two-phase materials using Fast Fourier Transforms. Int. J. Plast. 2011, 27, 707–727. [Google Scholar] [CrossRef]
  36. Zhang, C.; Li, H.; Eisenlohr, P.; Liu, W.; Boehlert, C.; Crimp, M.; Bieler, T. Effect of realistic 3D microstructure in crystal plasticity finite element analysis of polycrystalline Ti-5Al-2.5 Sn. Int. J. Plast. 2015, 69, 21–35. [Google Scholar] [CrossRef] [Green Version]
  37. Prüger, S.; Seupel, A.; Kuna, M. A thermomechanically coupled material model for TRIP-steel. Int. J. Plast. 2014, 55, 182–197. [Google Scholar] [CrossRef]
  38. Madivala, M.; Schwedt, A.; Wong, S.L.; Roters, F.; Prahl, U.; Bleck, W. Temperature dependent strain hardening and fracture behavior of TWIP steel. Int. J. Plast. 2018, 104, 80–103. [Google Scholar] [CrossRef]
  39. Roters, F.; Diehl, M.; Shanthraj, P.; Eisenlohr, P.; Reuber, C.; Wong, S.L.; Maiti, T.; Ebrahimi, A.; Hochrainer, T.; Fabritius, H.O.; et al. DAMASK–The Düsseldorf Advanced Material Simulation Kit for modeling multi-physics crystal plasticity, thermal, and damage phenomena from the single crystal up to the component scale. Comput. Mater. Sci. 2019, 158, 420–478. [Google Scholar] [CrossRef]
  40. Shanthraj, P.; Eisenlohr, P.; Diehl, M.; Roters, F. Numerically robust spectral methods for crystal plasticity simulations of heterogeneous materials. Int. J. Plast. 2015, 66, 31–45. [Google Scholar] [CrossRef]
  41. Zeghadi, A.; N’guyen, F.; Forest, S.; Gourgues, A.F.; Bouaziz, O. Ensemble averaging stress–strain fields in polycrystalline aggregates with a constrained surface microstructure–Part 1: Anisotropic elastic behaviour. Philos. Mag. 2007, 87, 1401–1424. [Google Scholar] [CrossRef]
  42. Zeghadi, A.; Forest, S.; Gourgues, A.F.; Bouaziz, O. Ensemble averaging stress–strain fields in polycrystalline aggregates with a constrained surface microstructure–Part 2: Crystal plasticity. Philos. Mag. 2007, 87, 1425–1446. [Google Scholar] [CrossRef]
  43. Harris, W.M.; Chiu, W.K. Determining the representative volume element size for three-dimensional microstructural material characterization. Part 1: Predictive models. J. Power Sources 2015, 282, 552–561. [Google Scholar] [CrossRef] [Green Version]
  44. Harris, W.M.; Chiu, W.K. Determining the representative volume element size for three-dimensional microstructural material characterization. Part 2: Application to experimental data. J. Power Sources 2015, 282, 622–629. [Google Scholar] [CrossRef] [Green Version]
  45. Tjahjanto, D.; Turteltaub, S.; Suiker, A. Crystallographically based model for transformation-induced plasticity in multiphase carbon steels. Contin. Mech. Thermodyn. 2008, 9, 399–422. [Google Scholar] [CrossRef]
  46. Jiang, Z.; Guan, Z.; Lian, J. Effects of microstructural variables on the deformation behaviour of dual-phase steel. Mater. Sci. Eng. A 1995, 190, 55–64. [Google Scholar] [CrossRef]
  47. Eisenlohr, P.; Diehl, M.; Lebensohn, R.A.; Roters, F. A spectral method solution to crystal elasto-viscoplasticity at finite strains. Int. J. Plast. 2013, 46, 37–53. [Google Scholar] [CrossRef]
  48. Michel, J.; Moulinec, H.; Suquet, P. A computational scheme for linear and non-linear composites with arbitrary phase contrast. Int. J. Numer. Methods Eng. 2001, 52, 139–160. [Google Scholar] [CrossRef]
  49. Ahrens, J.; Geveci, B.; Law, C. Paraview: An end-user tool for large data visualization. In The Visualization Handbook; Academic Press: New York, NY, USA, 2005; Volume 717. [Google Scholar]
  50. Maiti, T.; Eisenlohr, P. Fourier-based spectral method solution to finite strain crystal plasticity with free surfaces. Scr. Mater. 2018, 145, 37–40. [Google Scholar] [CrossRef]
  51. Peirce, D.; Asaro, R.; Needleman, A. An analysis of nonuniform and localized deformation in ductile single crystals. Acta Metall. 1982, 30, 1087–1119. [Google Scholar] [CrossRef]
Figure 1. Block diagram of the DREAM-3D pipeline for RVE generation with associated inputs and outputs of various pipeline blocks. Table 1 provides details of statistical input data for A, B, C, D, and E.
Crystals 10 00944 g001
Figure 2. Schematic diagram representing the generated 3D RVEs and their slicing sequence for the construction of simulation geometries. RVE-A and E are shown in this figure, whereas B, C, and D were modeled similarly. The slicing sequence is also shown in the figure with a yellow dotted line, and green dotted lines represent more sliced geometries that are not shown here but were constructed for simulations. Ferrite (F) and Martensite (M) are shown separately in the sliced images for better visualization of phase distribution in the RVEs.
Crystals 10 00944 g002
Figure 3. Comparison of global stress–strain curves of different cases (a) RVE-A all layers’ comparison, (b) RVE-E all layers’ comparison, (c) showing true stress strain curves for RVEs with different grain sizes. It is observed that there is not much difference in the results and almost any geometry yields very similar results. Some numerical simulation models crashed due to the non convergence of global stress/strain equilibrium at the spectral code level, and therefore are presented up to that certain level of strain.
Crystals 10 00944 g003
Figure 4. Schematic diagram showing the sectioning scheme to expose the middle and top surfaces for visual comparison of local stress and strain in the upcoming figures. Local von Mises true stress distribution in the ferrite phase has been used here just as an example for color coding of the section of interest.
Crystals 10 00944 g004
Figure 5. Local von Mises true stress distribution—in ferrite phase—for all geometries of RVE-E at 25% of global true strain.
Crystals 10 00944 g005
Figure 6. Local von Mises true strain distribution—in ferrite and martensite phases—for all geometries of RVE-E at 25% of global true strain. Red arrows represent areas of high strain in ferrite matrix, and green arrows represent areas of low strain in martensite grains.
Crystals 10 00944 g006
Figure 7. Comparison of (i) local strain distribution in ferrite, (ii) local stress distribution in ferrite, (iii) local strain distribution in martensite, (iv) local stress distribution in martensite, using Probability Distribution Functions (PDF) and Cumulative Distribution Functions (CDF) curves for RVEs with varying D f , (a) RVE-A, (b), RVE-B (c), RVE-C (d), RVE-D (e), and RVE-E at 25% of global true strain.
Crystals 10 00944 g007aCrystals 10 00944 g007b
Figure 8. Comparison of (a) local strain distribution in ferrite, (b) local stress distribution in ferrite, (c) local strain distribution in martensite, and (d) local stress distribution in martensite, using PDF and CDF curves for RVEs with varying D f at 25% of global true strain.
Crystals 10 00944 g008
Figure 9. Peak values of PDF normalized against the 50-layer thickness simulation for (a) ferrite strain and (b) ferrite stress for D f between 8.2 μ m to 18.2 μ m at 25% of the true global strain. Dotted lines represent normalization index of 1. It is observed that for all D f , increasing the RVE thickness converges the solution.
Crystals 10 00944 g009
Figure 10. Constructed empirical convergence criteria from results of RVE-A, B and C converged simulations, where black trend line represented the function between mean feature ESD and required number of layers for converged solution. Orange trend line represents the relationship between mean feature ESD and number of grains that can be packed in a 100 × 100 × 100 μ m 3 geometry.
Crystals 10 00944 g010
Table 1. Grain size distribution data for ferrite and martensite used for the construction of Representative Volume Elements (RVEs). The grain sizes are in  μ m and “Total Grains” is a dimensionless entity.
NomenclatureFerrite GrainsMartensite GrainsTotal Grains
Min.MaxAvg.Min.MaxAvg.
A5.17.66.353.55.74.68400
B6.69.98.255.28.46.83700
C8.512.710.65.48.87.11900
D9.714.512.18.213.210.71200
E11.216.814.09.815.812.8770
Table 2. Parameters for ferrite and martensite adopted from literature [45] for the numerical simulation modeling.
Parameter DefinitionSymbolAttributes for FerriteAttributes for MartensiteUnit
First elastic stiffness constant with normal strain C 11 233.3417.4GPa
Second elastic stiffness constant with normal strain C 12 135.5242.4GPa
First elastic stiffness constant with shear strain C 44 128.0211.1GPa
Shear strain rate γ ˙ 0 1110 3 /s
Initial Shear resistance on [ 111 ] S 0 [ 111 ] 95406MPa
Saturation shear resistance on [ 111 ] S [ 111 ] 222873MPa
Initial Shear resistance on [ 112 ] S 0 [ 112 ] 96457MPa
Saturation shear resistance on [ 112 ] S [ 112 ] 412971MPa
Slip hardening parameter h 0 1.0563GPa
Interaction hardening parameter h α , β 1.01.0-
Stress exponentn2020-
Curve fitting parameterw2.02.0-
Publisher’s Note: MDPI stays neutral with regard to jurisdictional claims in published maps and institutional affiliations.

