Controlled Synthesis of Magnetic Iron Oxide Nanoparticles: Magnetite or Maghemite?


Bioseparation Engineering Group, Department of Mechanical Engineering, Technical University of Munich, 85748 Garching, Germany
*
Authors to whom correspondence should be addressed.
Crystals 2020, 10(3), 214; https://0-doi-org.brum.beds.ac.uk/10.3390/cryst10030214
Submission received: 2 March 2020
/
Revised: 10 March 2020
/
Accepted: 13 March 2020
/
Published: 19 March 2020
(This article belongs to the Special Issue Synthesis, Structure, and Properties of Inorganic Nanotubes)
Abstract
:Today, magnetic nanoparticles are present in multiple medical and industrial applications. We take a closer look at the synthesis of magnetic iron oxide nanoparticles through the co-precipitation of iron salts in an alkaline environment. The variation of the synthesis parameters (ion concentration, temperature, stirring rate, reaction time and dosing rate) change the structure and diameter of the nanoparticles. Magnetic iron oxide nanoparticles are characterized by X-ray diffraction (XRD), Raman spectroscopy and transmission electron microscopy (TEM). Magnetic nanoparticles ranging from 5 to 16 nm in diameter were synthesized and their chemical structure was identified. Due to the evaluation of Raman spectra, TEM and XRD, the magnetite and maghemite nanoparticles can be observed and the proportion of phases and the particle size can be related to the synthesis conditions. We want to highlight the use of Raman active modes A1g of spinel structured iron oxides to determine the content of magnetite and maghemite in our samples. Magnetite nanoparticles can be derived from highly alkaline conditions even without establishing an inert atmosphere during the synthesis. The correlation between the particle properties and the various parameters of the synthesis was modelled with linear mixture models. The two models can predict the particle size and the oxidation state of the synthesized nanoparticles, respectively. The modeling of synthesis parameters not only helps to improve synthesis conditions for iron oxide nanoparticles but to understand crystallization of nanomaterials.
1. Introduction
Nanotechnology is of great interest to multiple research fields due to the change of physical and chemical properties when reducing the dimension of a material to 1–100 nm. There are multiple fields of applications for these fascinating little particles ranging from packing and textile industry to catalysis and semiconductor industry [1].
While often the surface to volume ratio, the reactivity, optical or electrical properties when using nanomaterials can be employed in applications, iron oxides possess superparamagnetic properties at the nanoscale [2,3,4]. The magnetic properties are temperature dependent since the Brownian motion and the Neél relaxation, which lead to a fluctuation of magnetic fields on single nanoparticles are temperature dependent [4]. For iron oxides (magnetite and maghemite), the critical particle diameter leading to no remanence is below 20–30 nm at room temperature (300 K) [3]. With these magnetic properties, iron oxide nanoparticles are the basis for multiple applications such as magnetic imaging, magnetic targeting and hyperthermia [4,5]. Aside from medical applications, iron oxide nanoparticles can be used in protein purification [6,7], enzyme and catalyst immobilization [8,9,10], sensing [11] and energy storage [12,13].
For these applications, an understanding and development of effective and low-cost synthesis routes are necessary. The size, stability and composition of magnetic nanoparticles need to be controlled in order to affect magnetic, optic and surface properties [5,14]. Since these physical and chemical properties are often related to the dimension of nanomaterials, the most simple approach is to investigate the size of nanoparticles for distinct synthesis conditions [2,15,16,17]. Forge et al. and Roth et al. investigated the influence of several parameters on the particle size of iron oxide nanoparticles based on the alkaline co-precipitation synthesis [17,18,19]. Other studies focus on the formation pathways of iron oxide nanoparticles depending on the synthesis conditions and especially on the reaction time [20]. Such studies include the formation, which can be quite versatile for multiple synthesis routes [2,14,20,21,22,23,24,25,26]. Although some works approach parameter studies by design of experiments, multiple questions concerning the co-precipitation are not understood [17,18]. For these nanoscale particles, it is quite challenging to characterize and predict their structure, especially at the surface [14,27]. Multiple approaches exist on classifying magnetic iron oxide nanoparticles and describing them according to their properties, which are strongly dependent on their environment, synthesis conditions, stabilizers, and their age [4,28]. A further issue is the oxidation and phase transformations occurring during synthesis as well as during storage and use of iron oxide nanoparticles [28]. The oxidation mechanism and the transition of ions within the nanoparticles and lattice distortion are not completely understood due to the complexity and size-dependence of nanoscale systems [28,29,30]. Thus, multiple questions arise: In what phase are those nanoparticles really ordered? How strongly dependent is this structure on the particle size? How can results obtained by different techniques such as Raman spectroscopy, Mössbauer spectroscopy, magnetic measurements or XRD be interpreted, since size, surface and phase effects overlay?
We want to correlate the synthesis parameters of a cost-effective co-precipitation synthesis route with the properties of the magnetic nanoparticles. Therefore, the systematic parameter variation is analyzed with design of experiments (DoE) and the parameters of educt concentrations (iron salts and sodium hydroxide), reaction time and temperature as well as dosing and stirring rate are evaluated towards their influence on particle size and composition. The particle size is analyzed with transmission electron microscopy (TEM) and X-ray diffraction (XRD) where the lattice disorder can be correlated to the particle size via the Scherrer equation. The lattice constant, obtained from the Bragg equation from the position of reflections in XRD, is correlated to the content of magnetite and maghemite in the synthesized nanoparticles [31]. The magnetite content is further investigated with Raman spectroscopy as a better measure for the ratio of Fe3O4 to γ-Fe2O3, due to different vibration modes corresponding to different distances between Fe–O for the spinel and distorted spinel structure. We are the first to use Raman spectroscopy to statistically evaluate the structure of iron oxide nanoparticles synthesized with co-precipitation over a wide parameter range. With these data, we are able to correlate the synthesis parameters to the iron oxide phase of obtained nanoparticles, which can be very useful for multiple applications.
2. Materials and Methods
2.1. Design of Experiments
Design of experiments was planned with the software “Design Expert”. The defined parameters and their range is illustrated in Table 1. All conditions for each experiment are summarized in Tables S1 and S2.
2.2. Synthesis
Ferrous and ferric chloride were used as received from Sigma-Aldrich as Fe(III)Cl3x(H2O)6 and Fe(II)Cl2x(H2O)4, respectively. In accordance with Table 1, the salts were weighed and dissolved in 20 mL of deionized and degassed water. Sodium hydroxide (Fluka) was dissolved in 100 mL of deionized and degassed water, leading to a total reaction volume of 140 mL for each experiment. The sodium hydroxide solution was stirred with a magnetic stirrer in a glass beaker and the reaction temperature was adjusted before adding the iron chloride solutions with the respective dosing speeds. For long reaction times at high temperatures, the reaction volume was kept constant by adding deionized and degassed water. The co-precipitated product was magnetically decanted and washed with deionized and degassed water until a neutral pH (7–8) and a low ionic strength (<200 µS/cm) was reached. For XRD and Raman spectroscopy analysis, the samples were freeze-dried.
2.3. Characterization
For TEM analysis, the samples were diluted and precipitated on carbon-coated copper grids. A JEOL JEM-1400 Plus (JEOL (Germany), Freising, Germany) was used for the microscopic characterization of nanoparticles. For each sample at least five pictures were taken and analyzed with ImageJ. Thereby, a minimum of 30 particles were counted for each picture.
XRD experiments were carried out in transmission geometry of powder samples with a STOE Stadi P diffractometer (STOE & Cie GmbH, Darmstadt, Germany) using a molybdenum Kα source (λ = 0.709 Å). The range of 2–48° was analyzed with a Dectris detector (DECTRIS Ltd., Baden-Daettwil, Switzerland). Particle size was estimated from reflex broadening according to the Scherrer equation with a K factor of 0.89. The 440 reflection was fitted with a Voigt function with the software Origin in order to analyze the content of magnetite and maghemite based on the areas (A) of the respective reflections considering the following Equation (1).
The Raman spectroscopy of powder samples was performed with a Raman SENTERRA from Bruker (Bruker Optics, Ettlingen, Germany). A 488 nm laser was used at 0.1 mW power for 30 seconds. Two co-additions were used to correct cosmical spikes. All measurements were performed in triplicates. The spectra were further processed with a concave rubber band correction in the software OPUS. The bands at 660 cm−1 and 710 cm−1 were fitted with Voigt functions in Origin and used for magnetite content analysis (OriginLab Corporation, Wellesley, Massachusetts, US). The deconvolution was processed with Equation (2) in order to obtain the magnetite share [28].
3. Results
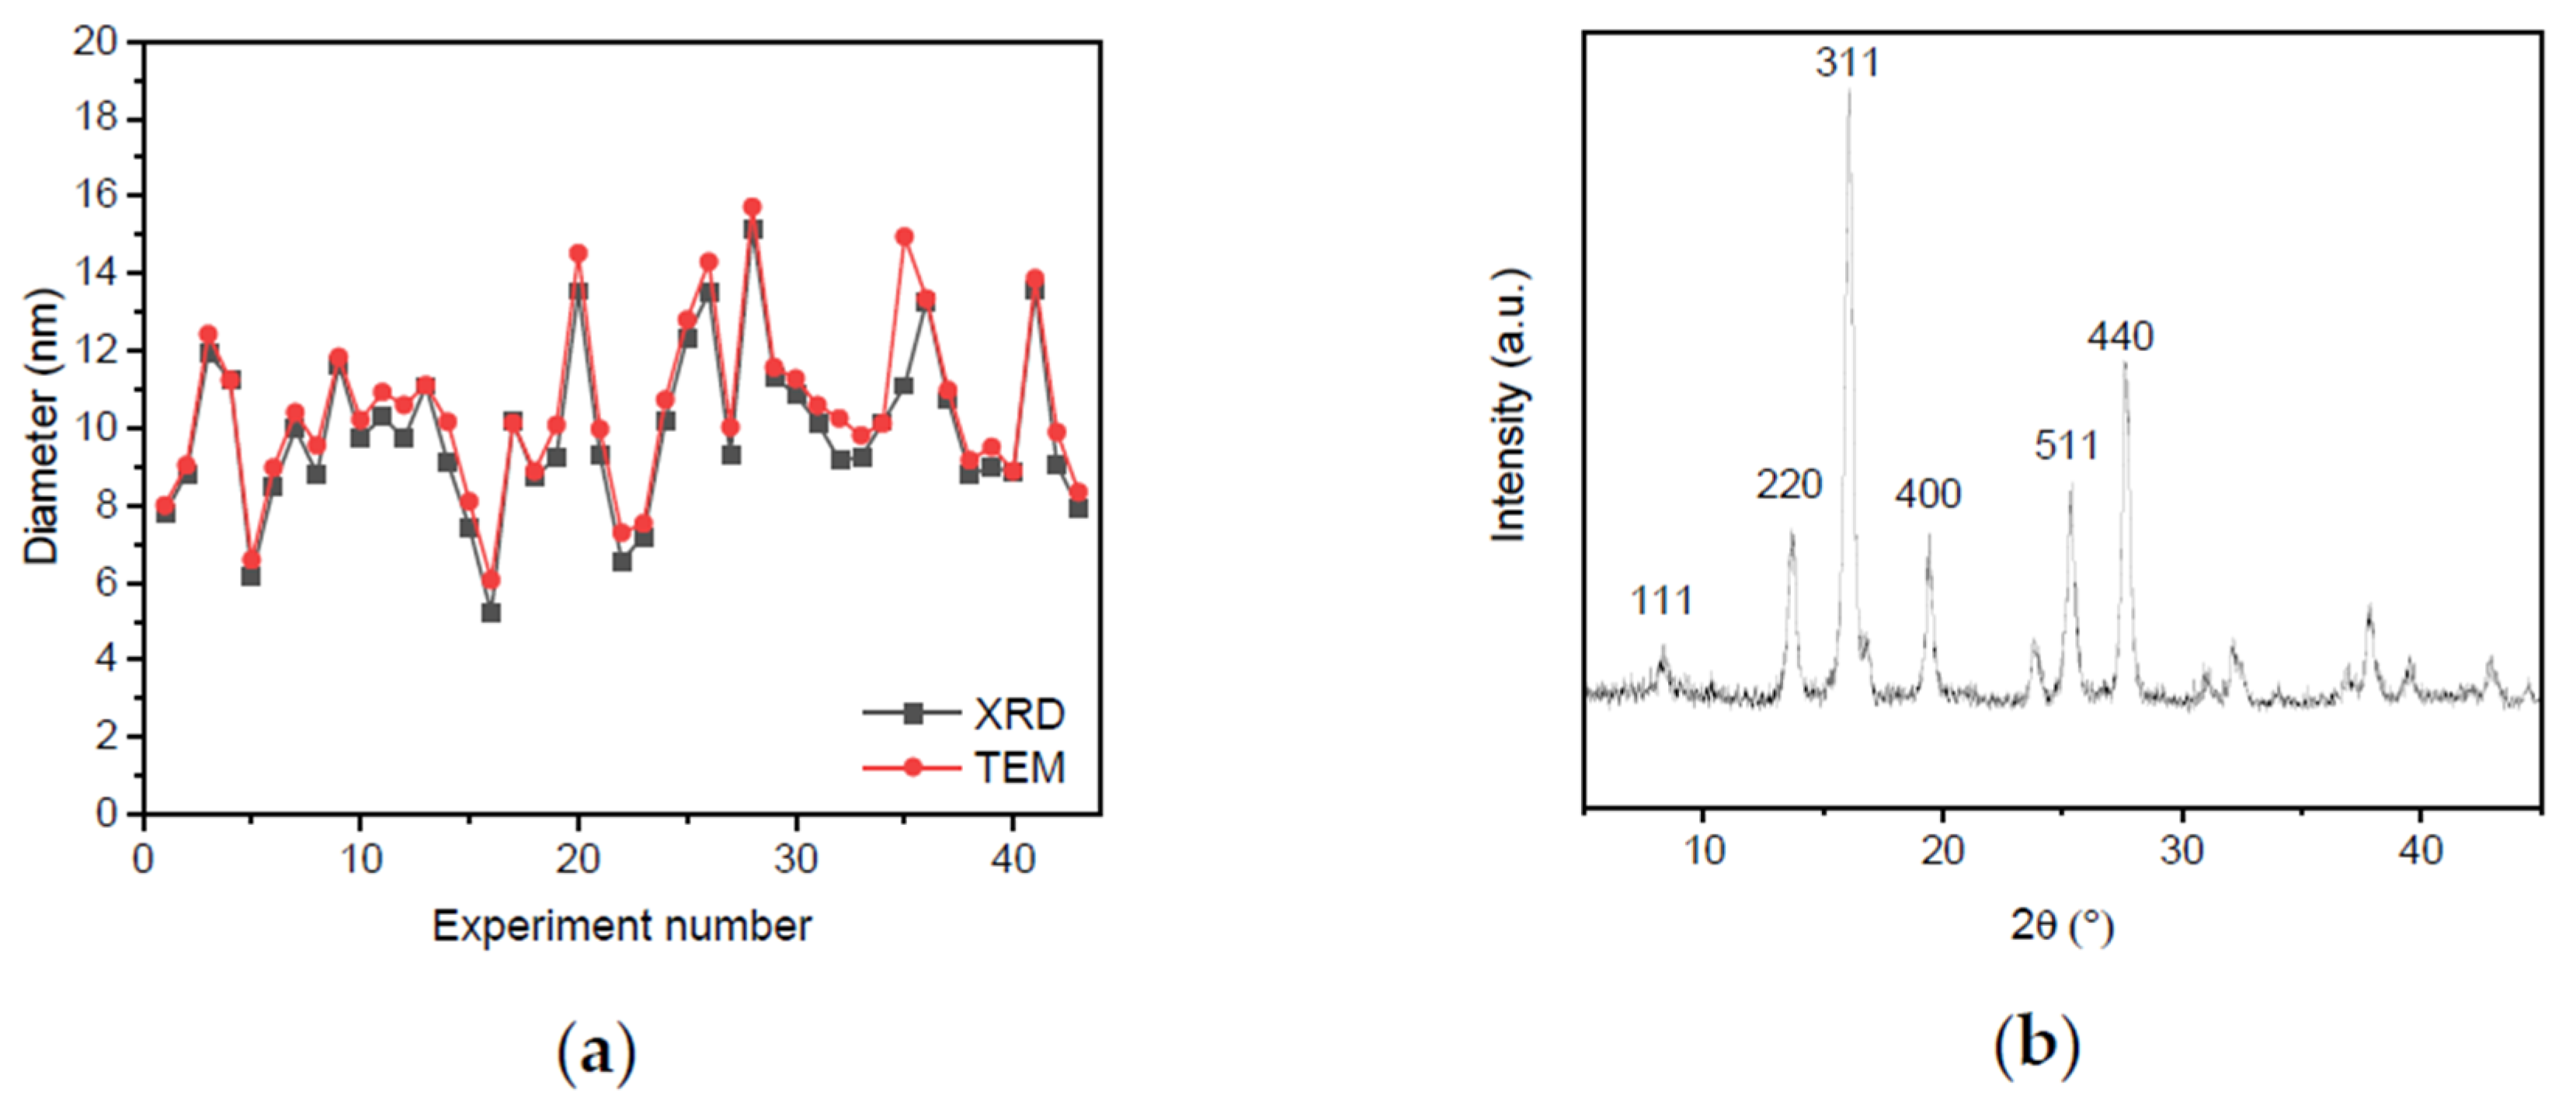
The analysis of TEM and XRD results yield the average sizes of synthesized iron oxide nanoparticles, which range between 5 and 16 nm. Generally, the TEM results indicate a slightly larger diameter than the XRD diameters of around 0.3 nm, which is consistent with literature. The results of all experiments are shown in Figure 1a and Table S3. A typical diffractogram of magnetic iron oxide nanoparticles is shown in Figure 1b. The full width at half maximum of the 311 reflection was used for the size analysis with the Scherrer equation, while the 440 reflection was evaluated towards phase analysis and discrimination between magnetite and maghemite [31].
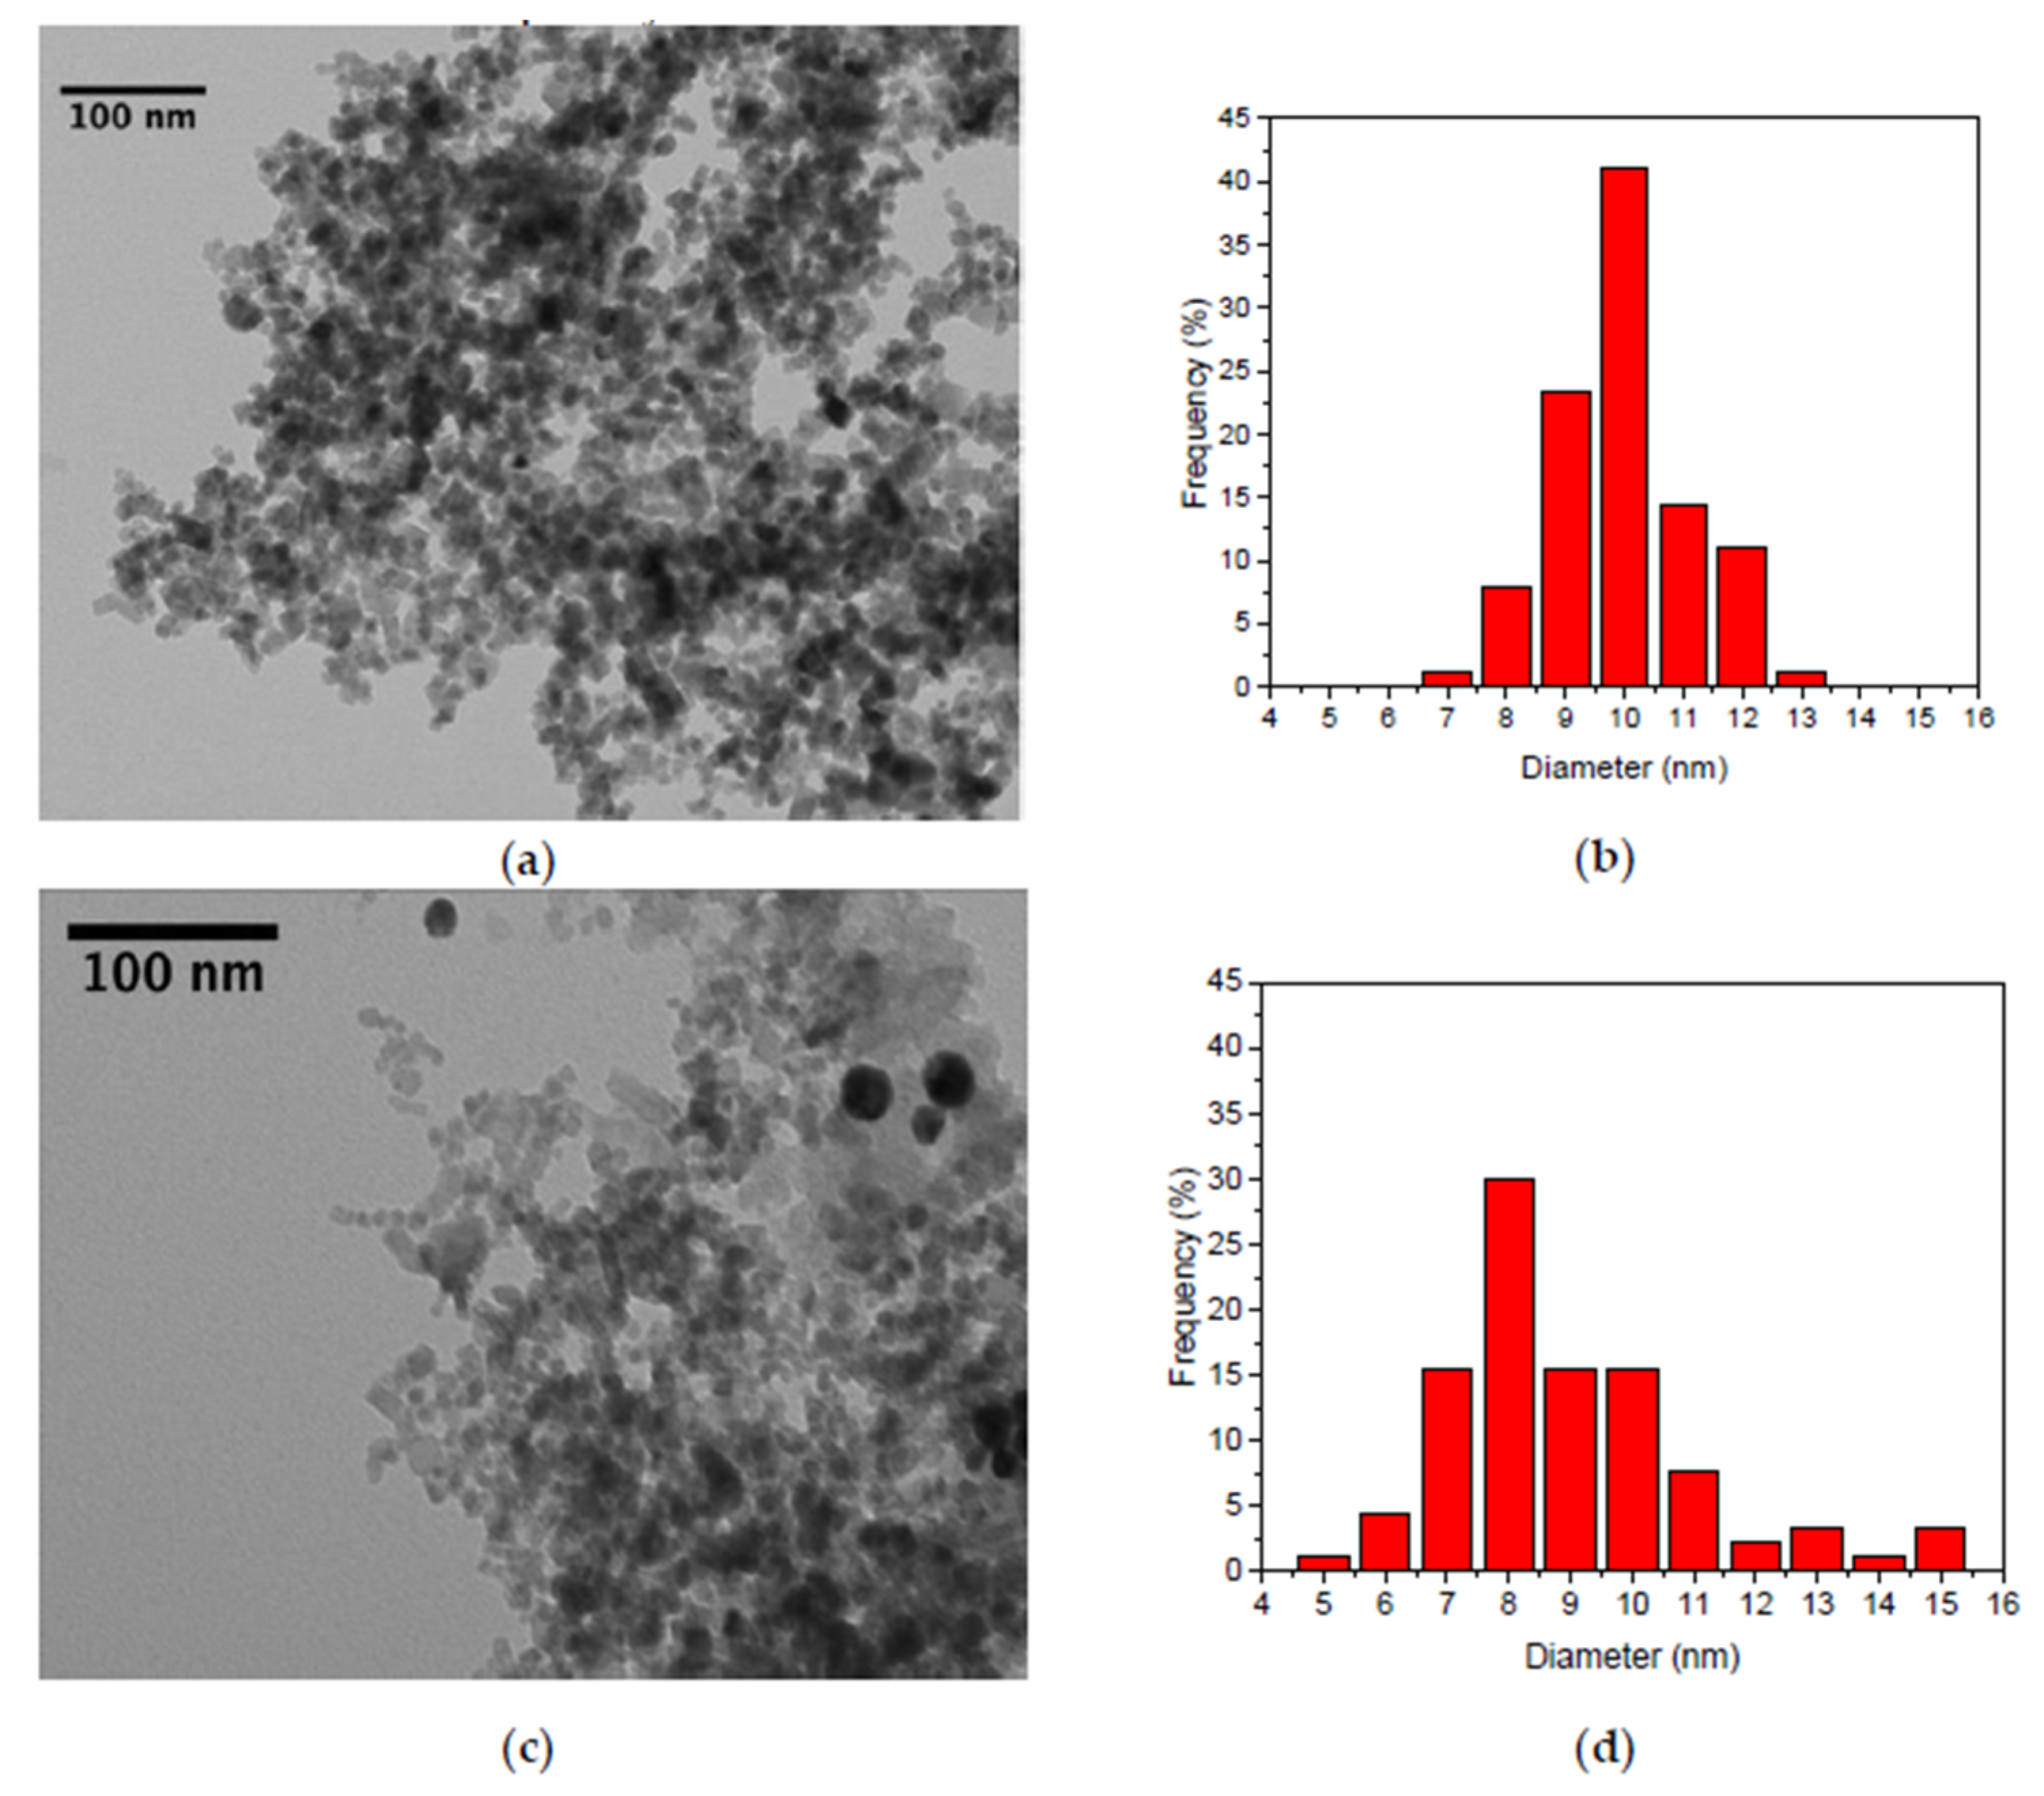
While the XRD data represents a statistical representation of lattice errors and crystal deformations due to the nanoscale confinement of particles, the TEM analysis allows a shape analysis and a rudimentary analysis of the particle distribution. In Figure 2, two different experiments, which yield a similar particle size from TEM and XRD analysis are compared. While the mean diameter is between 9 and 10 nm, for both experiments, the standard deviation is completely different, which indicates a different dispersity.
While the mean diameter is between 9 and 10 nm, for both experiments, the standard deviation is completely different, which indicates a different dispersity. Thus, the synthesis parameters also influence the particle size distribution and not only the primary particle size. Parameters of experiment 21 lead to a small size distribution (σ = 0.891), while experiment 2 yields a broad size distribution (σ = 2.572). In the case of those two experiments shown here, the longer titration time of iron chlorides to the base (experiment 2) leads to a broader size distribution. In order to facilitate a near to statistical size distribution, at least 100 particles are counted per synthesis. Even though this approach does not yield completely statistical data on the particle size distribution, we use it as an indicator.
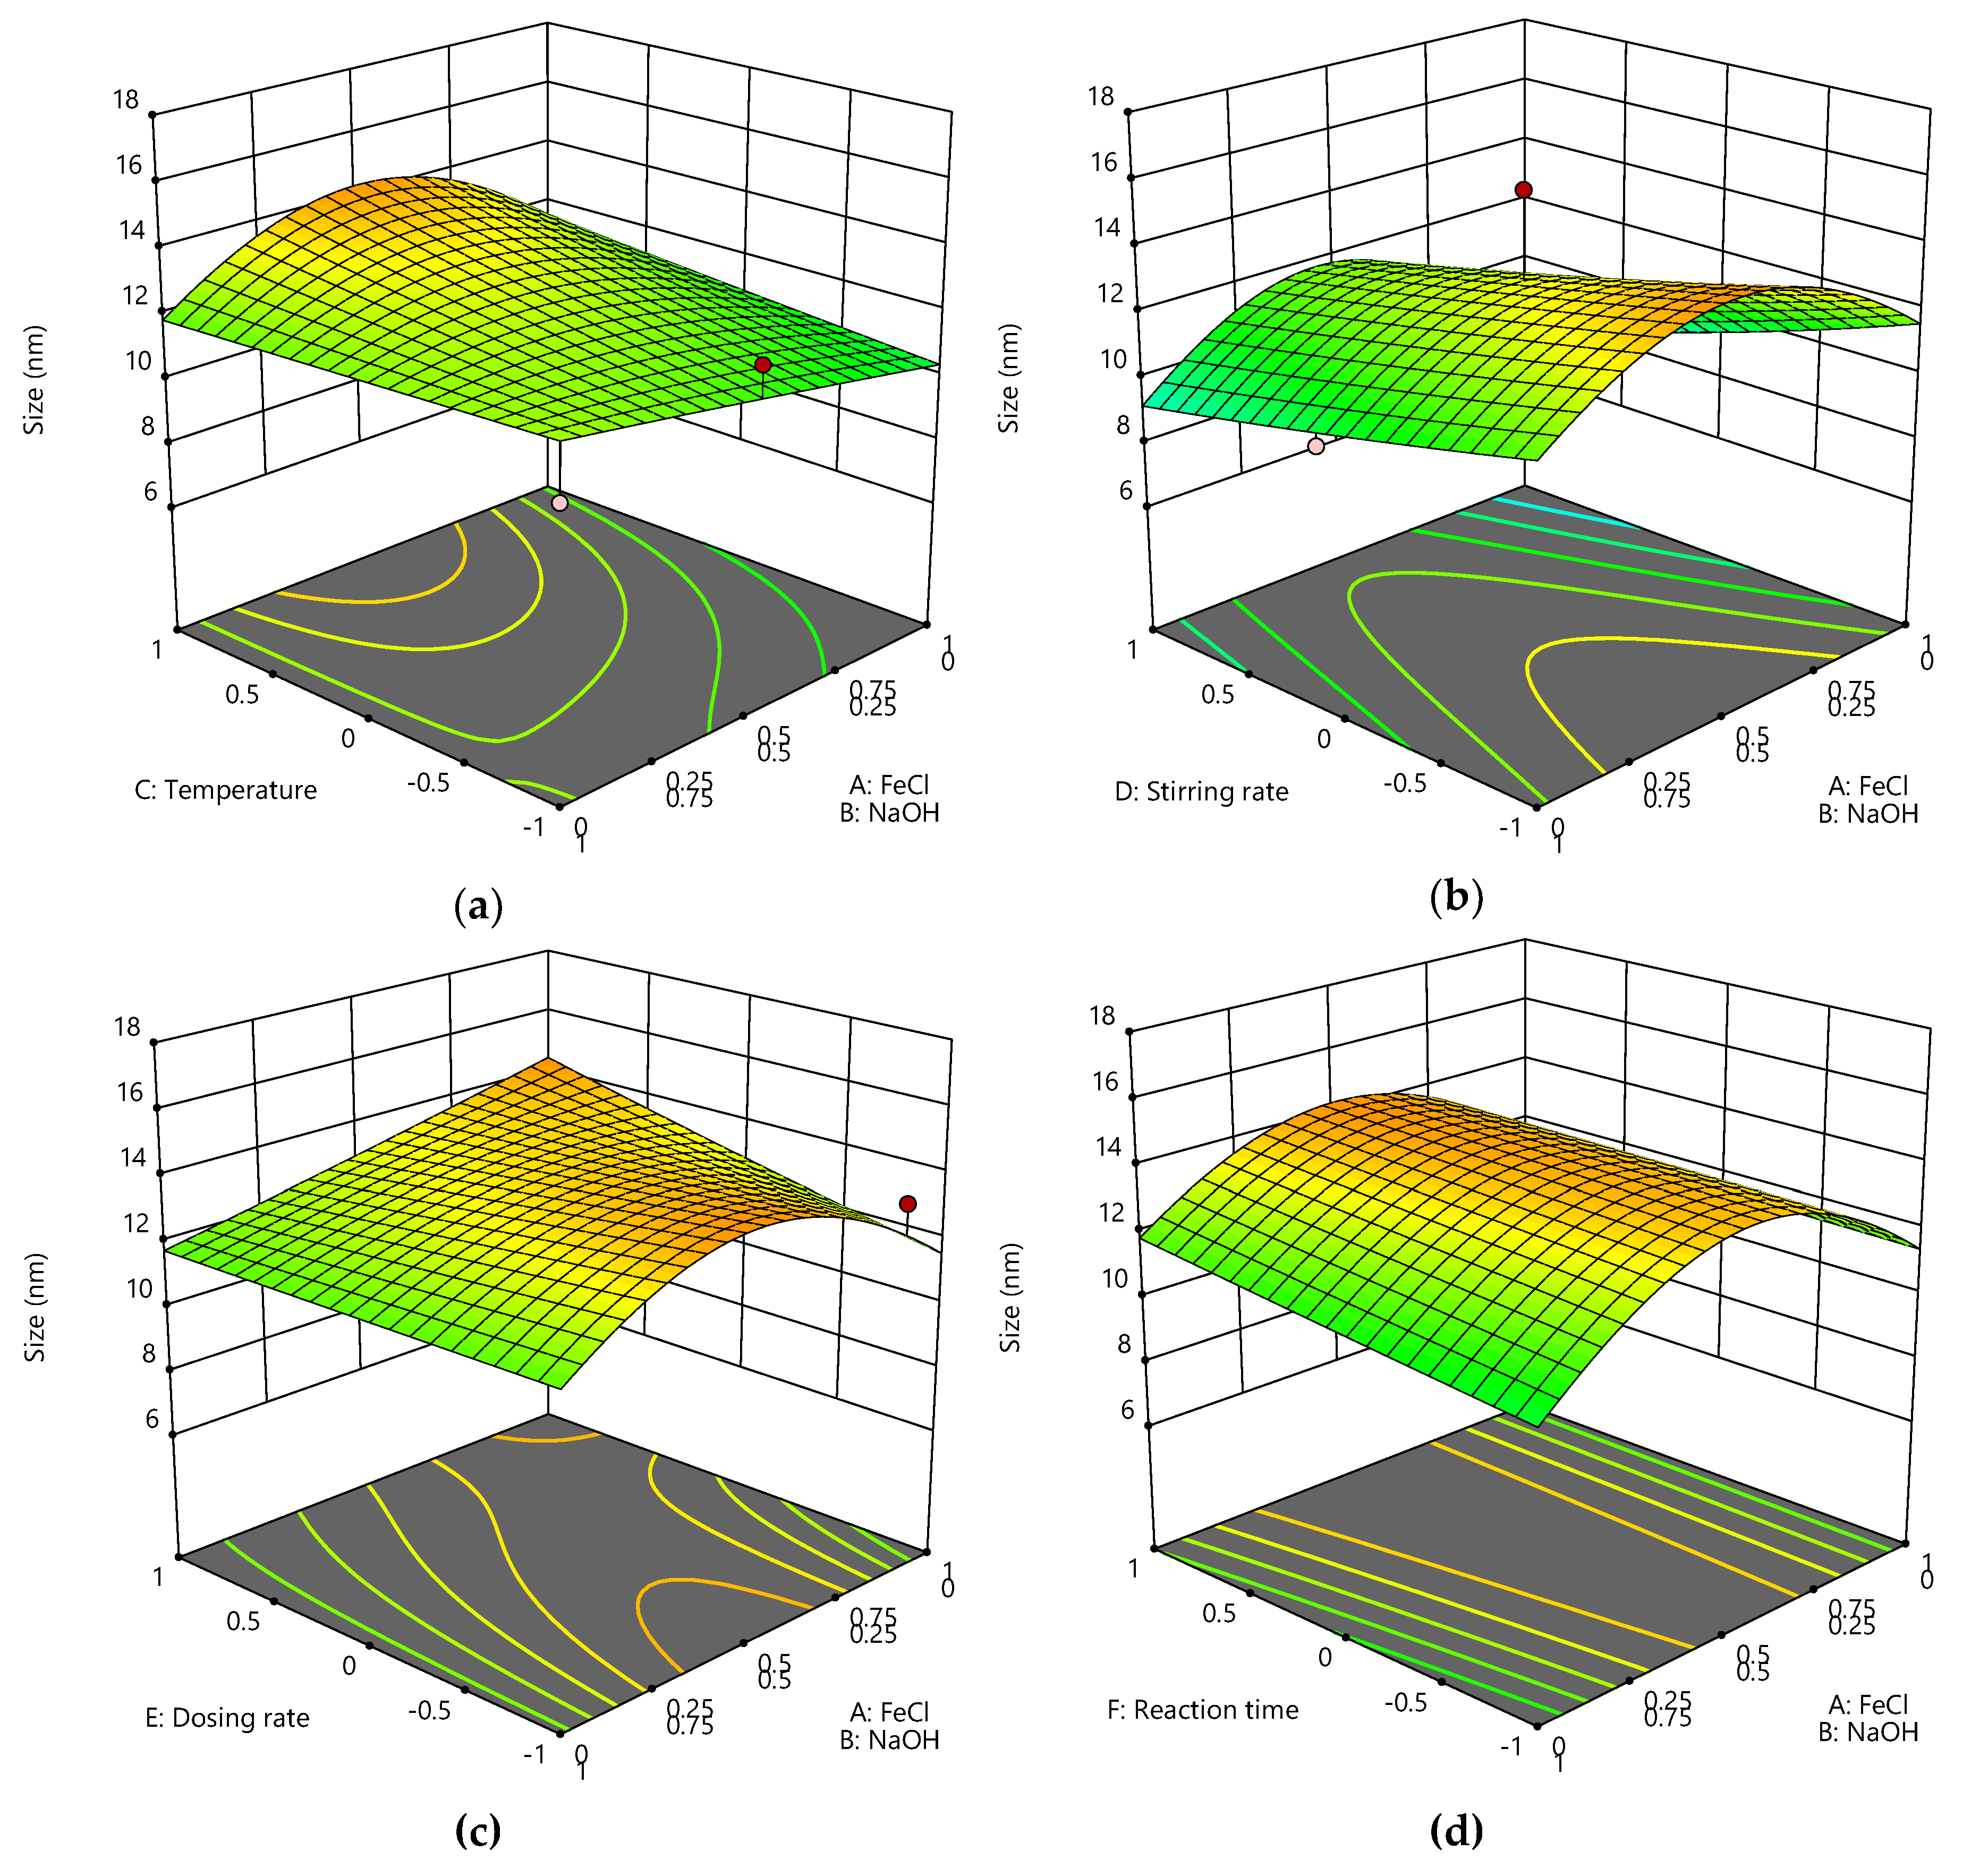
We observe an influence of synthesis parameters on the particle size and visualized our findings in Figure 3. The ratio of iron salts to sodium hydroxide is the most significant parameter here and a stoichiometric ratio yields larger particles than either an excess of iron chlorides or an excess of sodium hydroxide. This was expected and is in good agreement with previous studies [17,18]. Furthermore, we were able to observe an influence of reaction time and temperature as well as stirring rate and dosing rate. Reaction time and dosing rate only moderately affect the particle size.
Powder XRD yields the crystal structure and with analysis of crystal defects, even the diameter of nanoparticles can be estimated. Furthermore, it is possible to differentiate between the phases magnetite and maghemite even though they have a very similar spinel and distorted spinal structure, respectively. A differentiation between magnetite and maghemite on the nanoscale is quite challenging, due to the crystal defects. A method proposed by Kim et al. can be used, where the 440 and the 511 reflection is compared due to the slightly greater lattice constant of maghemite [31]. Another possibility to distinguish between magnetite and maghemite is Raman spectroscopy [29,32]. With this technique, the distance between Fe-O and thus a different vibration constant leading to two distinct bands in the spectrum can be analyzed. This means that the distortion of the spinel structure during the oxidation process leads to two Fe-O distances which can be observed around 660 and 710 cm−1 in a Raman spectrum. Schwaminger et al. have demonstrated an analysis of these bands and their ratios, which help to identify the amount of magnetite and maghemite in an iron oxide nanoparticle [28]. However, multiple effects due to distortion and surface effects cannot be identified with this method. Furthermore, a change of the Fe-O distance does not always correlate to a change in the crystal structure, differences between XRD and Raman spectrum of the same particles are expected [28]. A comparison of our phase analysis is shown in Figure 4 and the full data set is presented in Table S4. We were not able to detect any other iron oxide or oxyhydroxide phases with XRD or Raman spectroscopy.
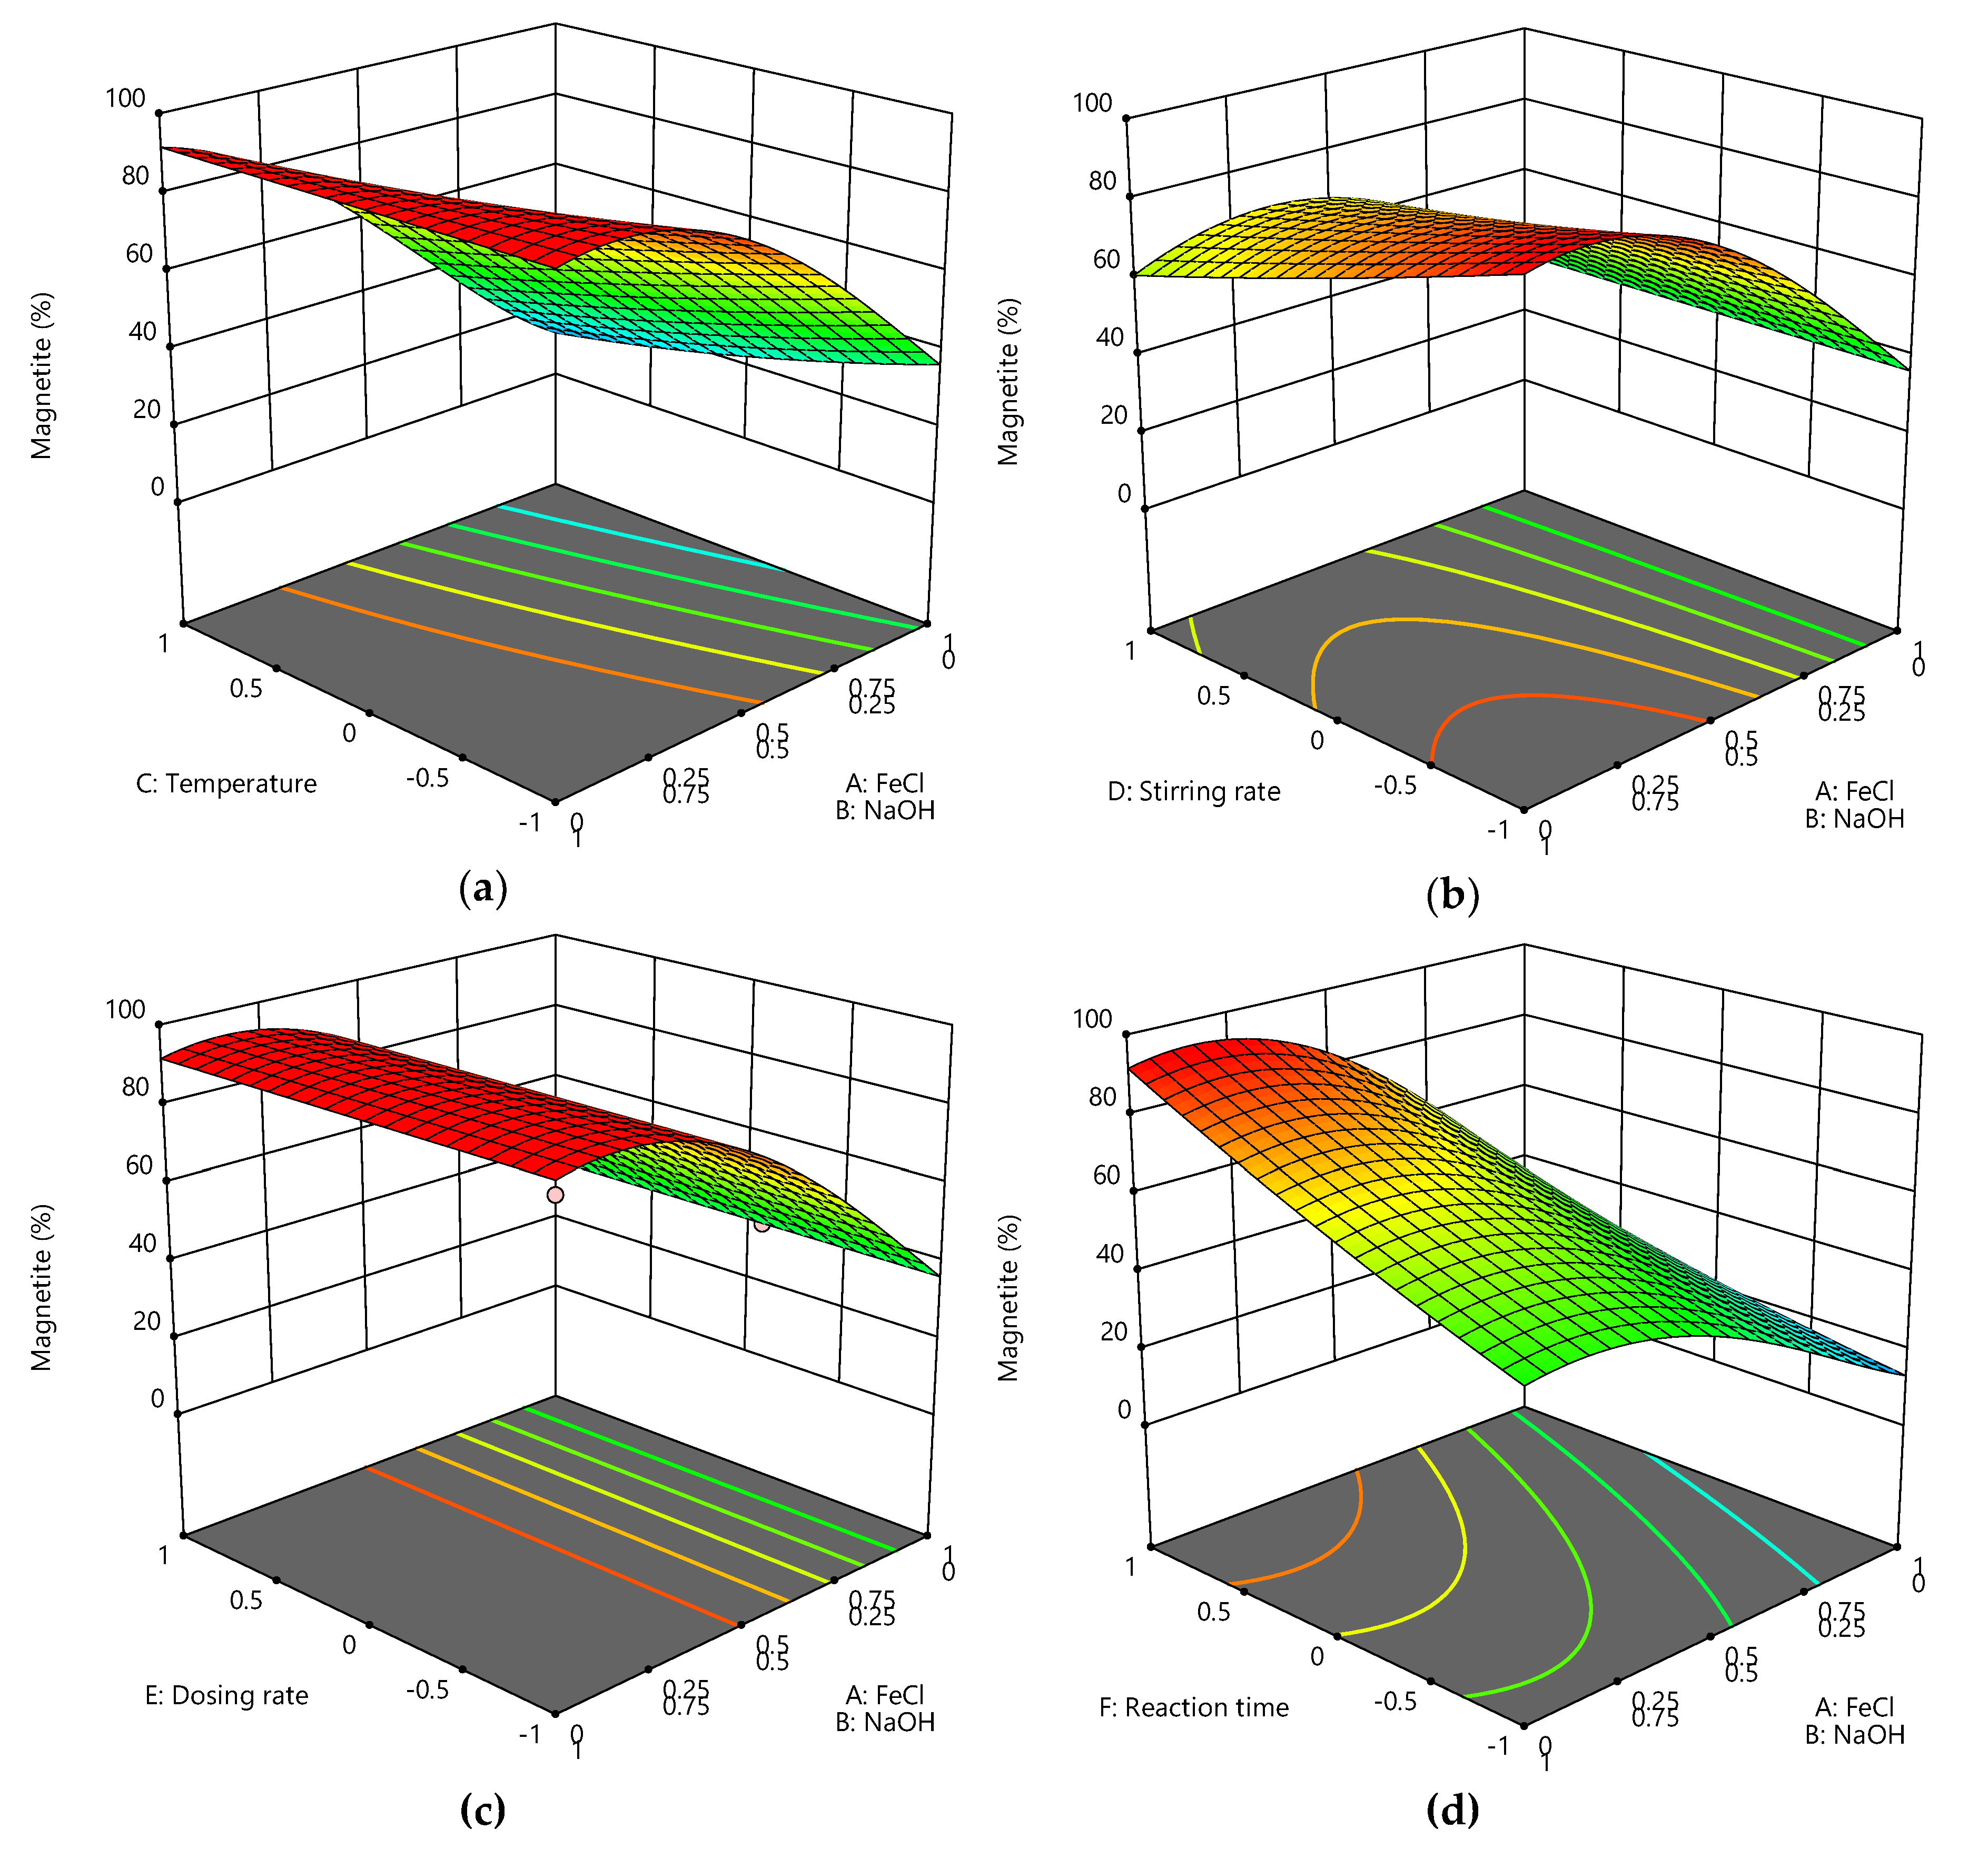
While Kim et al. have demonstrated that XRD is a useful tool to distinguish between maghemite and magnetite [31], we want to emphasize the interpretation of Raman spectra for iron oxide phase analysis. A great advantage of the analysis of Raman spectra is that non-crystalline and extremely small particles can be investigated. We investigated the influence of the ratio between educts sodium hydroxide and iron chlorides on the phase composition as well as the influence of temperature, stirring rate, dosing rate and reaction time (Figure 5). A higher magnetite content can be observed for high sodium hydroxide and low iron chloride concentrations. The temperature and the stirring rate only slightly affect the magnetite content in the iron oxide nanoparticles. Lower temperatures and lower stirring rates lead to a higher magnetite content than higher temperatures and higher stirring rates. The dosing rate does not significantly influence the magnetite content of the synthesized nanoparticles. The reaction time influences the content of magnetite. Higher reaction times lead to a higher magnetite content.
An evaluation of the model is important in order to compare and understand the prediction models for iron oxide nanoparticle synthesis. The correlation between the parameters and the obtained values can be described with the DoE model. Size and magnetite content prediction models are based on linear mixture models. The predicted particle size values by the model are compared to the actual values obtained from TEM analysis (Figure 6a) The model predicts the particle size significantly with a p value of 0.0011. The higher p value compared to the study of Roth et al. (p < 0.0001) can be explained by more parameters and a larger parameter range [17]. The model describing the magnetite content is significant as well with a p value of 0.0062 (Figure 6b). However, the distribution of the correlation between actual and predicted values is broader than the correlation of the size prediction model.
4. Discussion
The study focusses on two aspects of the co-precipitation of magnetic iron oxide nanoparticles. On the one hand, how can we control and influence the size of iron oxide nanoparticles? On the other hand, how is the iron oxide phase influenced by the synthesis conditions?
The particle size is significantly affected by the ratio of iron chloride to sodium hydroxide. If the ratio between iron ions and sodium hydroxide is in the range of a 3:10 molar ratio of iron ions to sodium hydroxide (corresponding to parameters of A = B = 0.5), the co-precipitated particles will be larger than for other conditions. This behavior is expected and has been demonstrated by Roth et al. and Forge et al. [17,18]. A higher amount of sodium hydroxide will lead to more seeds since the co-precipitation starts in a supercritical regime which will then lead to smaller crystals. If the amount of sodium hydroxide is too low, seeding will take longer, but the crystal growth will stop at a point where the pH drops below the needed conditions for iron oxide co-precipitation. The temperature plays an important role for seeding and crystal growth [16,33]. Especially the Ostwald ripening process is strongly dependent on the temperature. Thus, a higher temperature leads to larger particles, which is in accordance with the study of Forge et al. and consistent with the nucleation model of LaMer and Dinegar [18,34]. The temperature affects the solubility of iron salts and the pH value. On the other hand, a higher temperature would lead to a higher nucleation rate than a lower temperature [33]. Thus, a higher temperature leads to more seeds followed by a shorter growth phase and therefore smaller nanoparticles. Roth et al. observed the same controversial behavior with increasing temperatures [17]. Aside from the temperature, the stirring rate has a significant effect on particle size. We observe the smallest nanoparticles with the highest (1000 rpm) and the largest nanoparticles with the smallest stirring speed (100 rpm) investigated. A higher stirring speed is related to a higher energy dissipation in the system, which is related to a faster seeding and thus more seeds compared to slower stirring rates. The number of seeds is usually reciprocally related to the size of nanoparticles. The same effect was observed by Forge et al., who also proposed the largest iron oxide nanoparticles by using a slow stirring speed and a high temperature [18]. Therefore, our studies concerning the parameters affecting the particle size of a co-precipitation process to synthesize iron oxide nanoparticles agrees very well with literature and considers more parameters than previous studies [17,18]. Concerning the magnetite content of iron oxide nanoparticles, multiple studies discuss a dependence of particle size and magnetite content and a dependence of oxidative conditions on the iron oxide phase [14,29]. We used the same parameter range and the same experiments to obtain a model predicting the oxidation state of iron oxide nanoparticles, which was evaluated with Raman spectroscopy and XRD. The magnetite content derived from XRD and Raman spectroscopy show similarities but there are also multiple deviations, which can be explained by the orthogonal analytical measurement methods. Which method gives us the more accurate result for the phase content? Here it is quite challenging to answer this question. We want to show with our, that there is no black and white, no magnetite or maghemite but multiple phase mixtures and transition states. The phase was not dependent on the size of the synthesized nanoparticles nor on the environment, but the most important parameter is the sodium hydroxide content. We tested the co-precipitation under oxidative environment (air/open vessel) and still found conditions which allow the synthesis of “pure” magnetite nanoparticles. Therefore, the oxidative environment does not influence the phase to same amount as the concentration of the base. The higher the ratio of base to iron salts, the higher the probability of obtaining pure magnetite nanoparticles. This finding can be explained due to the thermodynamic stability of the magnetite phase in alkaline environments. The parameters temperature and stirring rate, which are most relevant for seeding and crystal growth due to energy input to the reactor only slightly influence the phase of the generated nanoparticles. Interestingly, the reaction time is the most decisive factor aside from the stoichiometric ratio of educts. This is unexpected since the reaction was not performed in an inert atmosphere or in a closed vessel. However, this behavior can be explained by the high stability of the magnetite phase in alkaline environments. This means a phase transformation from maghemite to magnetite can take place during the nanoparticle formation in a co-precipitation synthesis [20]. Both DoE models are significant due to their low p values. On the other hand, even well-fitting models should be tested and verified. We identified the important parameters and use a large parameter range for this investigation. However, due to the higher amount of parameters compared to Forge et al. and Roth et al., our model predicting the particle size shows a higher p value, a higher lack of fit and a lower confidence level [17,18]. The model is in good agreement with literature data on iron oxide synthesis conditions and now spans a large range of parameters for the prediction of size and phase of iron oxide nanoparticles.
5. Conclusions
Iron oxide nanoparticles have been synthesized and their synthesis parameters have been systematically investigated with design of experiments. The particle size was investigated with TEM and XRD, while the composition was analyzed with XRD and Raman spectroscopy. The focus of this work is on the influence of synthesis parameters towards the chemical composition and the particle size for a co-precipitation reaction of iron salts in alkaline environment. The nanoparticles synthesized with this method can be varied in the range of 5–16 nm within the used parameter range. The size of iron oxide nanoparticles can be influenced significantly by the stirring speed and reaction temperature. Furthermore, the stoichiometric ratio between iron salts and sodium hydroxide influence both size and chemical composition of the materials. We were not able to observe the formation of any other iron oxide or hydroxide species other than magnetite or maghemite with these synthesis parameters. Raman spectroscopy allows for a fast and simple distinction between iron oxide phases. Here, Raman spectroscopy has proven to be a well-suited technique to evaluate the magnetite content of iron oxide samples, which allows to dispense complex analysis techniques such as Mössbauer spectroscopy. The goal of this work was to investigate how iron oxide nanoparticles can be tailored towards their size and composition with a simple and low-cost co-precipitation method without using an inert atmosphere. The understanding of parameters helps to tailor and design magnetic nanoparticles for multiple uses and to better understand the crystallization, particle growth and oxidation of iron oxides at the nanoscale. Thus, these models are a useful tool for all people who want to synthesize iron oxide nanoparticles cost-effectively and in a way that is tailored to their application.
Supplementary Materials
The following are available online at https://0-www-mdpi-com.brum.beds.ac.uk/2073-4352/10/3/214/s1, Table S1. The parameter range according to the design of experiments with 6 parameters. Table S2. Absolute values of parameters implemented in the DoE model for all experiments. Table S3. XRD results for all samples obtained from 311 reflections and TEM diameters. Table S4. Ratio of deconvoluted A1g bands and magnetite share obtained from Raman and XRD (440) reflections.
Author Contributions
Conceptualization, S.P.S. and S.B.; methodology, S.P.S. and C.S.; validation, S.P.S. and C.S.; formal analysis, C.S. and S.P.S.; investigation, C.S. and S.P.S.; resources, S.B.; data curation, C.S. and S.P.S.; writing—original draft preparation, S.P.S.; writing—review and editing, S.B. and S.P.S.; visualization, S.P.S.; supervision, S.B. and S.P.S.; project administration, S.B. and S.P.S.; funding acquisition, S.B. All authors have read and agreed to the published version of the manuscript.
Funding
We appreciate support from the German Research Foundation (DFG) and the Technical University of Munich (TUM) in the framework of the Open-Access Publishing Program and by TUM International Graduate School of Science and Engineering (IGSSE).
Acknowledgments
The authors would like to thank Carsten Peters for support with TEM imaging and Tom Nilges for the provision of the X-ray diffractometer.
Conflicts of Interest
The authors declare no conflict of interest. The funders had no role in the design of the study; in the collection, analyses, or interpretation of data; in the writing of the manuscript, or in the decision to publish the results.
References
- Wu, W.; Changzhong, J.; Roy, V.A.L. Recent progress in magnetic iron oxide-semiconductor composite nanomaterials as promising photocatalysts. Nanoscale 2015, 7, 38–58. [Google Scholar] [CrossRef] [PubMed] [Green Version]
- Baumgartner, J.; Dey, A.; Bomans, P.H.H.; Le Coadou, C.; Fratzl, P.; Sommerdijk, N.A.J.M.; Faivre, D. Nucleation and growth of magnetite from solution. Nat. Mater. 2013, 12, 310–314. [Google Scholar] [CrossRef] [PubMed]
- Kolhatkar, A.G.; Jamison, A.C.; Litvinov, D.; Willson, R.C.; Lee, T.R. Tuning the magnetic properties of nanoparticles. Int. J. Mol. Sci. 2013, 14, 15977–16009. [Google Scholar] [CrossRef] [PubMed] [Green Version]
- Laurent, S.; Forge, D.; Port, M.; Roch, A.; Robic, C.; Vander Elst, L.; Muller, R.N. Magnetic iron oxide nanoparticles: Synthesis, stabilization, vectorization, physicochemical characterizations, and biological applications. Chem. Rev. 2008, 108, 2064–2110. [Google Scholar] [CrossRef] [PubMed]
- Lu, A.-H.; Salabas, E.L.; Schüth, F. Magnetic nanoparticles: Synthesis, protection, functionalization, and application. Angew. Chem. Int. Ed. Eng. 2007, 46, 1222–1244. [Google Scholar] [CrossRef]
- Schwaminger, S.P.; Blank-Shim, S.A.; Scheifele, I.; Pipich, V.; Fraga-García, P.; Berensmeier, S. Design of Interactions Between Nanomaterials and Proteins: A Highly Affine Peptide Tag to Bare Iron Oxide Nanoparticles for Magnetic Protein Separation. Biotechnol. J. 2019, 14, e1800055. [Google Scholar] [CrossRef]
- Schwaminger, S.P.; Fraga-García, P.; Blank-Shim, S.A.; Straub, T.; Haslbeck, M.; Muraca, F.; Dawson, K.A.; Berensmeier, S. Magnetic One-Step Purification of His-Tagged Protein by Bare Iron Oxide Nanoparticles. ACS Omega 2019, 4, 3790–3799. [Google Scholar] [CrossRef]
- Roth, H.-C.; Schwaminger, S.P.; Peng, F.; Berensmeier, S. Immobilization of Cellulase on Magnetic Nanocarriers. ChemistryOpen 2016, 5, 183–187. [Google Scholar] [CrossRef] [Green Version]
- Rossi, L.M.; Costa, N.J.S.; Silva, F.P.; Wojcieszak, R. Magnetic nanomaterials in catalysis: Advanced catalysts for magnetic separation and beyond. Green Chem. 2014, 16, 2906. [Google Scholar] [CrossRef]
- Schnell, F.; Kube, M.; Berensmeier, S.; Schwaminger, S.P. Magnetic Recovery of Cellulase from Cellulose Substrates with Bare Iron Oxide Nanoparticles. ChemNanoMat 2019, 5, 422–426. [Google Scholar] [CrossRef]
- Lartigue, L.; Wilhelm, C.; Servais, J.; Factor, C.; Dencausse, A.; Bacri, J.-C.; Luciani, N.; Gazeau, F. Nanomagnetic sensing of blood plasma protein interactions with iron oxide nanoparticles: Impact on macrophage uptake. ACS Nano 2012, 6, 2665–2678. [Google Scholar] [CrossRef] [PubMed]
- Owusu, K.A.; Qu, L.; Li, J.; Wang, Z.; Zhao, K.; Yang, C.; Hercule, K.M.; Lin, C.; Shi, C.; Wei, Q.; et al. Low-crystalline iron oxide hydroxide nanoparticle anode for high-performance supercapacitors. Nat. Commun. 2017, 8, 14264. [Google Scholar] [CrossRef] [PubMed]
- Tian, L.-L.; Zhang, M.-J.; Wu, C.; Wei, Y.; Zheng, J.-X.; Lin, L.-P.; Lu, J.; Amine, K.; Zhuang, Q.-C.; Pan, F. γ-Fe2O3 Nanocrystalline Microspheres with Hybrid Behavior of Battery-Supercapacitor for Superior Lithium Storage. ACS Appl. Mater. Interfaces 2015, 7, 26284–26290. [Google Scholar] [CrossRef] [PubMed]
- Baaziz, W.; Pichon, B.P.; Fleutot, S.; Liu, Y.; Lefevre, C.; Greneche, J.-M.; Toumi, M.; Mhiri, T.; Begin-Colin, S. Magnetic Iron Oxide Nanoparticles: Reproducible Tuning of the Size and Nanosized-Dependent Composition, Defects, and Spin Canting. J. Phys. Chem. C 2014, 118, 3795–3810. [Google Scholar] [CrossRef]
- Carvalho, M.D.; Henriques, F.; Ferreira, L.P.; Godinho, M.; Cruz, M.M. Iron oxide nanoparticles: The Influence of synthesis method and size on composition and magnetic properties. J. Solid State Chem. 2013, 201, 144–152. [Google Scholar] [CrossRef]
- Fang, M.; Ström, V.; Olsson, R.T.; Belova, L.; Rao, K.V. Particle size and magnetic properties dependence on growth temperature for rapid mixed co-precipitated magnetite nanoparticles. Nanotechnology 2012, 23, 145601. [Google Scholar] [CrossRef]
- Roth, H.-C.; Schwaminger, S.P.; Schindler, M.; Wagner, F.E.; Berensmeier, S. Influencing factors in the CO-precipitation process of superparamagnetic iron oxide nano particles: A model based study. J. Magn. Magn. Mater. 2015, 377, 81–89. [Google Scholar] [CrossRef]
- Forge, D.; Roch, A.; Laurent, S.; Tellez, H.; Gossuin, Y.; Renaux, F.; Vander Elst, L.; Muller, R.N. Optimization of the Synthesis of Superparamagnetic Contrast Agents by the Design of Experiments Method. J. Phys. Chem. C 2008, 112, 19178–19185. [Google Scholar] [CrossRef]
- Massart, R. Preparation of aqueous magnetic liquids in alkaline and acidic media. IEEE Trans. Magn. 1981, 17, 1247–1248. [Google Scholar] [CrossRef]
- Ahn, T.; Kim, J.H.; Yang, H.-M.; Lee, J.W.; Kim, J.-D. Formation Pathways of Magnetite Nanoparticles by Coprecipitation Method. J. Phys. Chem. C 2012, 116, 6069–6076. [Google Scholar] [CrossRef]
- Daou, T.J.; Grenèche, J.M.; Pourroy, G.; Buathong, S.; Derory, A.; Ulhaq-Bouillet, C.; Donnio, B.; Guillon, D.; Begin-Colin, S. Coupling Agent Effect on Magnetic Properties of Functionalized Magnetite-Based Nanoparticles. Chem. Mater. 2008, 20, 5869–5875. [Google Scholar] [CrossRef]
- Fan, T.; Pan, D.; Zhang, H. Study on Formation Mechanism by Monitoring the Morphology and Structure Evolution of Nearly Monodispersed Fe3O4 Submicroparticles with Controlled Particle Sizes. Ind. Eng. Chem. Res. 2011, 50, 9009–9018. [Google Scholar] [CrossRef]
- Kluge, S.; Deng, L.; Feroughi, O.; Schneider, F.; Poliak, M.; Fomin, A.; Tsionsky, V.; Cheskis, S.; Wlokas, I.; Rahinov, I.; et al. Initial reaction steps during flame synthesis of iron-oxide nanoparticles. CrystEngComm 2015, 17, 6930–6939. [Google Scholar] [CrossRef] [Green Version]
- Ramimoghadam, D.; Bagheri, S.; Hamid, S.B.A. Progress in electrochemical synthesis of magnetic iron oxide nanoparticles. J. Magn. Magn. Mater. 2014, 368, 207–229. [Google Scholar] [CrossRef]
- Yathindranath, V.; Rebbouh, L.; Moore, D.F.; Miller, D.W.; van Lierop, J.; Hegmann, T. A Versatile Method for the Reductive, One-Pot Synthesis of Bare, Hydrophilic and Hydrophobic Magnetite Nanoparticles. Adv. Funct. Mater. 2011, 21, 1457–1464. [Google Scholar] [CrossRef]
- Cheng, C.; Xu, F.; Gu, H. Facile synthesis and morphology evolution of magnetic iron oxide nanoparticles in different polyol processes. New J. Chem. 2011, 35, 1072. [Google Scholar] [CrossRef]
- Cornell, R.M.; Schwertmann, U. The Iron Oxides. Structure, Properties, Reactions, Occurrences, and Uses, 2nd ed.; Completely rev. and Extended Ed.; Wiley-VCH: Weinheim, Germany, 2003; ISBN 9783527302741. [Google Scholar]
- Schwaminger, S.P.; Bauer, D.; Fraga-García, P.; Wagner, F.E.; Berensmeier, S. Oxidation of magnetite nanoparticles: Impact on surface and crystal properties. CrystEngComm 2017, 19, 246–255. [Google Scholar] [CrossRef] [Green Version]
- Rebodos, R.L.; Vikesland, P.J. Effects of oxidation on the magnetization of nanoparticulate magnetite. Langmuir 2010, 26, 16745–16753. [Google Scholar] [CrossRef]
- El Mendili, Y.; Grasset, F.; Randrianantoandro, N.; Nerambourg, N.; Greneche, J.-M.; Bardeau, J.-F. Improvement of Thermal Stability of Maghemite Nanoparticles Coated with Oleic Acid and Oleylamine Molecules: Investigations under Laser Irradiation. J. Phys. Chem. C 2015, 119, 10662–10668. [Google Scholar] [CrossRef]
- Kim, W.; Suh, C.-Y.; Cho, S.-W.; Roh, K.-M.; Kwon, H.; Song, K.; Shon, I.-J. A new method for the identification and quantification of magnetite-maghemite mixture using conventional X-ray diffraction technique. Talanta 2012, 94, 348–352. [Google Scholar] [CrossRef]
- Jubb, A.M.; Allen, H.C. Vibrational Spectroscopic Characterization of Hematite, Maghemite, and Magnetite Thin Films Produced by Vapor Deposition. ACS Appl. Mater. Interfaces 2010, 2, 2804–2812. [Google Scholar] [CrossRef]
- Vayssières, L.; Chanéac, C.; Tronc, E.; Jolivet, J.P. Size Tailoring of Magnetite Particles Formed by Aqueous Precipitation: An Example of Thermodynamic Stability of Nanometric Oxide Particles. J. Colloid Interface Sci. 1998, 205, 205–212. [Google Scholar] [CrossRef] [PubMed]
- LaMer, V.K.; Dinegar, R.H. Theory, Production and Mechanism of Formation of Monodispersed Hydrosols. J. Am. Chem. Soc. 1950, 72, 4847–4854. [Google Scholar] [CrossRef]
Figure 1.
The diameters obtained from TEM and XRD analysis are compared for each experiment (a). Diffractogram of sample 21, which illustrates the reflexes which can be found for spinel structures such as Fe3O4 and γ-Fe2O3 and a reflection broadening corresponding to 9.3 nm (b). The reflections are indicated with Miller indices.

Figure 2.
TEM picture of sample 21 (a) and particle size distribution obtained from picture analysis (b). TEM picture of sample 2 (c) and particle size distribution obtained from picture analysis (d).
Figure 2.
TEM picture of sample 21 (a) and particle size distribution obtained from picture analysis (b). TEM picture of sample 2 (c) and particle size distribution obtained from picture analysis (d).

Figure 3.
The predicted particle diameter (size) depending on temperature and iron salt/sodium hydroxide concentration while stirring rate and reaction time is maximal and dosing rate is minimal (a). The predicted particle diameter (size) depending on stirring rate and iron salt/sodium hydroxide concentration while temperature and reaction time is maximal and dosing rate is minimal (b). The predicted particle diameter (size) depending on dosing rate and iron salt/sodium hydroxide concentration while temperature, stirring rate and reaction time is maximal (c). The predicted particle diameter (size) depending on reaction time and iron salt/sodium hydroxide concentration while stirring rate and temperature is maximal and dosing rate is minimal (d).

Figure 4.
Raman spectra of sample 25 and 26 which illustrate the deconvolution fitting (a). Correlation of magnetite ratios obtained from Raman spectroscopy (Ratio between 660 and 710 cm−1 band) and XRD (440 reflection) for all samples according to their number in the design of experiments (b).
Figure 4.
Raman spectra of sample 25 and 26 which illustrate the deconvolution fitting (a). Correlation of magnetite ratios obtained from Raman spectroscopy (Ratio between 660 and 710 cm−1 band) and XRD (440 reflection) for all samples according to their number in the design of experiments (b).

Figure 5.
The predicted magnetite share in the iron oxide nanoparticles obtained from Raman spectroscopy depending on temperature and iron salt/sodium hydroxide concentration while stirring rate and reaction time is maximal and dosing rate is minimal (a). The predicted magnetite share depending on stirring rate and iron salt/sodium hydroxide concentration while temperature and reaction time is maximal and dosing rate is minimal (b). The predicted magnetite share depending on dosing rate and iron salt/sodium hydroxide concentration while temperature, stirring rate and reaction time is maximal (c). The predicted magnetite share and iron salt/sodium hydroxide concentration while stirring rate and temperature is maximal and dosing rate is minimal (d).

Figure 6.
Predicted particle sizes in comparison to the actual particle sizes (a). Predicted magnetite content in comparison to the actual magnetite content (b).
Figure 6.
Predicted particle sizes in comparison to the actual particle sizes (a). Predicted magnetite content in comparison to the actual magnetite content (b).


Table 1.
Parameter range for design of experiments. For the substrates, the parameter range is between 0 und 1.
Table 1.
Parameter range for design of experiments. For the substrates, the parameter range is between 0 und 1.
| Parameter | −1 | 0 | 1 |
|---|---|---|---|
| A1: Iron(II)chloride in g | 3.5 | 7 | |
| A2: Iron(III)chloride in g | 8.64 | 17.28 | |
| B: Sodium hydroxide in g | 7.2 | 14.4 | |
| C: Temperature T in °C | 30 | 55 | 80 |
| D: Stirring speed in rpm | 0 | 500 | 1000 |
| E: Titration time in minutes | 0 | 30 | 60 |
| F: Reaction time in minutes | 0 | 60 | 120 |
© 2020 by the authors. Licensee MDPI, Basel, Switzerland. This article is an open access article distributed under the terms and conditions of the Creative Commons Attribution (CC BY) license (http://creativecommons.org/licenses/by/4.0/).
Share and Cite
MDPI and ACS Style
Schwaminger, S.P.; Syhr, C.; Berensmeier, S. Controlled Synthesis of Magnetic Iron Oxide Nanoparticles: Magnetite or Maghemite? Crystals 2020, 10, 214. https://0-doi-org.brum.beds.ac.uk/10.3390/cryst10030214
AMA Style
Schwaminger SP, Syhr C, Berensmeier S. Controlled Synthesis of Magnetic Iron Oxide Nanoparticles: Magnetite or Maghemite? Crystals. 2020; 10(3):214. https://0-doi-org.brum.beds.ac.uk/10.3390/cryst10030214
Chicago/Turabian StyleSchwaminger, Sebastian P., Christopher Syhr, and Sonja Berensmeier. 2020. "Controlled Synthesis of Magnetic Iron Oxide Nanoparticles: Magnetite or Maghemite?" Crystals 10, no. 3: 214. https://0-doi-org.brum.beds.ac.uk/10.3390/cryst10030214
Note that from the first issue of 2016, this journal uses article numbers instead of page numbers. See further details here.