Zn Doped α-Fe2O3: An Efficient Material for UV Driven Photocatalysis and Electrical Conductivity

1
Department of Physics, Deenbandhu Chhotu Ram University of Science and Technology, Murthal 131039, Haryana, India
2
Department of Physics, J.C Bose, University of Science and Technology, YMCA, Faridabad 121006, Haryana, India
*
Author to whom correspondence should be addressed.
Crystals 2020, 10(4), 273; https://0-doi-org.brum.beds.ac.uk/10.3390/cryst10040273
Submission received: 18 March 2020
/
Revised: 29 March 2020
/
Accepted: 1 April 2020
/
Published: 4 April 2020
(This article belongs to the Special Issue Structural, Magnetic, Dielectric, Electrical, Optical and Thermal Properties of Nanocrystalline Materials: Synthesis, Characterization and Application)
Abstract
:Zinc (Zn) doped hematite (α-Fe2O3) nanoparticles with varying concentrations (pure, 2%, 4% and 6%) were synthesized via sol-gel method. The influence of divalent Zn ions on structural, optical and dielectric behavior of hematite were studied. X-ray diffraction (XRD) pattern of synthesized samples were indexed to rhombohedral R3c space group of hematite with 14–21 nm crystallite size. The lattice parameter (a and c) values increase upto Zn 4% and decrease afterwards. The surface morphology of prepared nanoparticles were explored using transmission electron microscopy (TEM). The band gap measured from Tauc’s plot, using UV-Vis spectroscopy, showed reduction in its values upto Zn 4% and the reverse trend was obtained in higher concentrations. The dielectric properties of pure and Zn doped hematite were investigated at room temperature and followed the same trends as that of XRD parameters and band gap. Photocatalytic properties of nanoparticles were performed for hazardous Rose bengal dye and showed effective degradation in the presence of UV light. Hence, Zn2+ doped hematite can be considered as an efficient material for the potential applications in the domain of photocatalysis and also higher value of dielectric constant at room temperature makes them applicable in high energy storage devices.
1. Introduction
In recent years, several dyes have been frequently used in textiles, printing, paper and pharmaceutical industries. The untreated hazardous dyes are discharged into the water, leading to enormous environmental problems, like perturbation of aquatic life and human health. Therefore, the removal of these dyes from water is of the utmost priority for the scientific community. Several approaches have been made to remove the toxic dye molecules from wastewater, such as adsorption, coagulation, membrane separation and ion exchange process. However, these methods fail on a larger scale due to their expensive equipments, slow processes and toxic byproducts [1]. Effective and successful methods to remove dye include photocatalytic activity in which metal oxide semiconductors are used as catalysts due to their large specific surface area, chemical stability and high photocatalytic response [2,3]. It is vitally important to establish the stability and activity of the photocatalyst to propose a photocatalytic system. From the existing transition metal oxide semiconductors, iron oxide has drawn scientific interest due to its outstanding physical and chemical properties. A variety of crystalline phases are exhibited by iron oxides, such as hematite (α-Fe2O3), akaganeite (β-Fe2O3), maghemite (γ-Fe2O3) and magnetite (Fe3O4) [4]. Among them, α-Fe2O3 exhibits thermodynamical, as well as chemical stability, over a broad pH scale. This compound has drawn significant interest for their potential applications such as photocatalysts, magnetic data storage, gas sensors, lithium-ion batteries, spintronics and ferrofluids [1,5,6,7,8]. The atomic arrangement possessed by hematite is similar to that of corundum α-Al2O3 structure, in which anions (O2− ions) are stacked in hexagonal close-packed arrangement (framework by the regular alternating layers, in each layer the atoms lie at the vertices of a series of equilateral triangles and the atoms overlie one another in one layer), with cations (Fe3+) occupying 2/3 octahedral coordination geometry [9].
α-Fe2O3 is a promising photocatalyst with optical band gap of ~2.6 eV. Also, hematite is one of the few semiconductors having valence band edge position suitable for oxygen evolution and the conduction band edge is more negative than the redox potential of H+/H2, thus, requiring an electrical bias to generate hydrogen [10]. However, the catalytic activity of α-Fe2O3 nanoparticles remains much lower due to rapid recombination of charge carriers, which reduces the degradation performance [1]. Thus, several methodologies have been made in order to sort out this problem. An effective process is doping of α-Fe2O3 with other metal ions, which can overcome their limitations. Doping of various metal ions such as Cr, Ti, Mn, Al, Zn, Ni, Ga, Rh, Zr and Co at Fe site in hematite influence the physical and photocatalytic properties. It is observed that Zr dopant limits the recombination of electron hole pairs in Fe2O3 nanorods array that act as a better catalyst for dye degradation [11]. Similarly, Ti-doped Fe2O3 enhances the donor density and lowers the electron-hole pair recombination rate that improves the photocatalytic activity [12].
The influence of divalent Zn cation on structural, electrical and optical behavior of hematite has become a field of scientific research. The substitution of Zn2+ at Fe3+ site causes the charge imbalance in the host lattice [13]. In order to maintain charge neutrality, one or more of the following mechanisms can occur: Transformation of Fe3+ to Fe2+ state, creation of cation vacancies and filling of oxygen vacancies. The physical properties of hematite are effected by the degree of crystallinity, particle size, doping and pressure [14,15,16,17]. A report by Velev et al. [18] showed that Zn2+ affects electronic properties of hematite that causes the creation of a hole in the oxygen valence band. The extra hole from Zn2+ is situated on the neighboring O sites inducing an acceptor level just below the fermi energy. This hole is relatively delocalized, and hence, provides good hope for high conductivity. The purpose of incorporation of Zn2+ ions is to promote the hopping mechanism of electrons by Fe3+-Fe2+ pairs and also modifying the optical properties. Based on these factors, we have synthesized Zn-doped Fe2O3 nanoparticles, with dilute concentrations, to study their structural, optical, dielectric and photocatalytic properties.
2. Materials and Methods
2.1. Synthesis of Nanoparticles
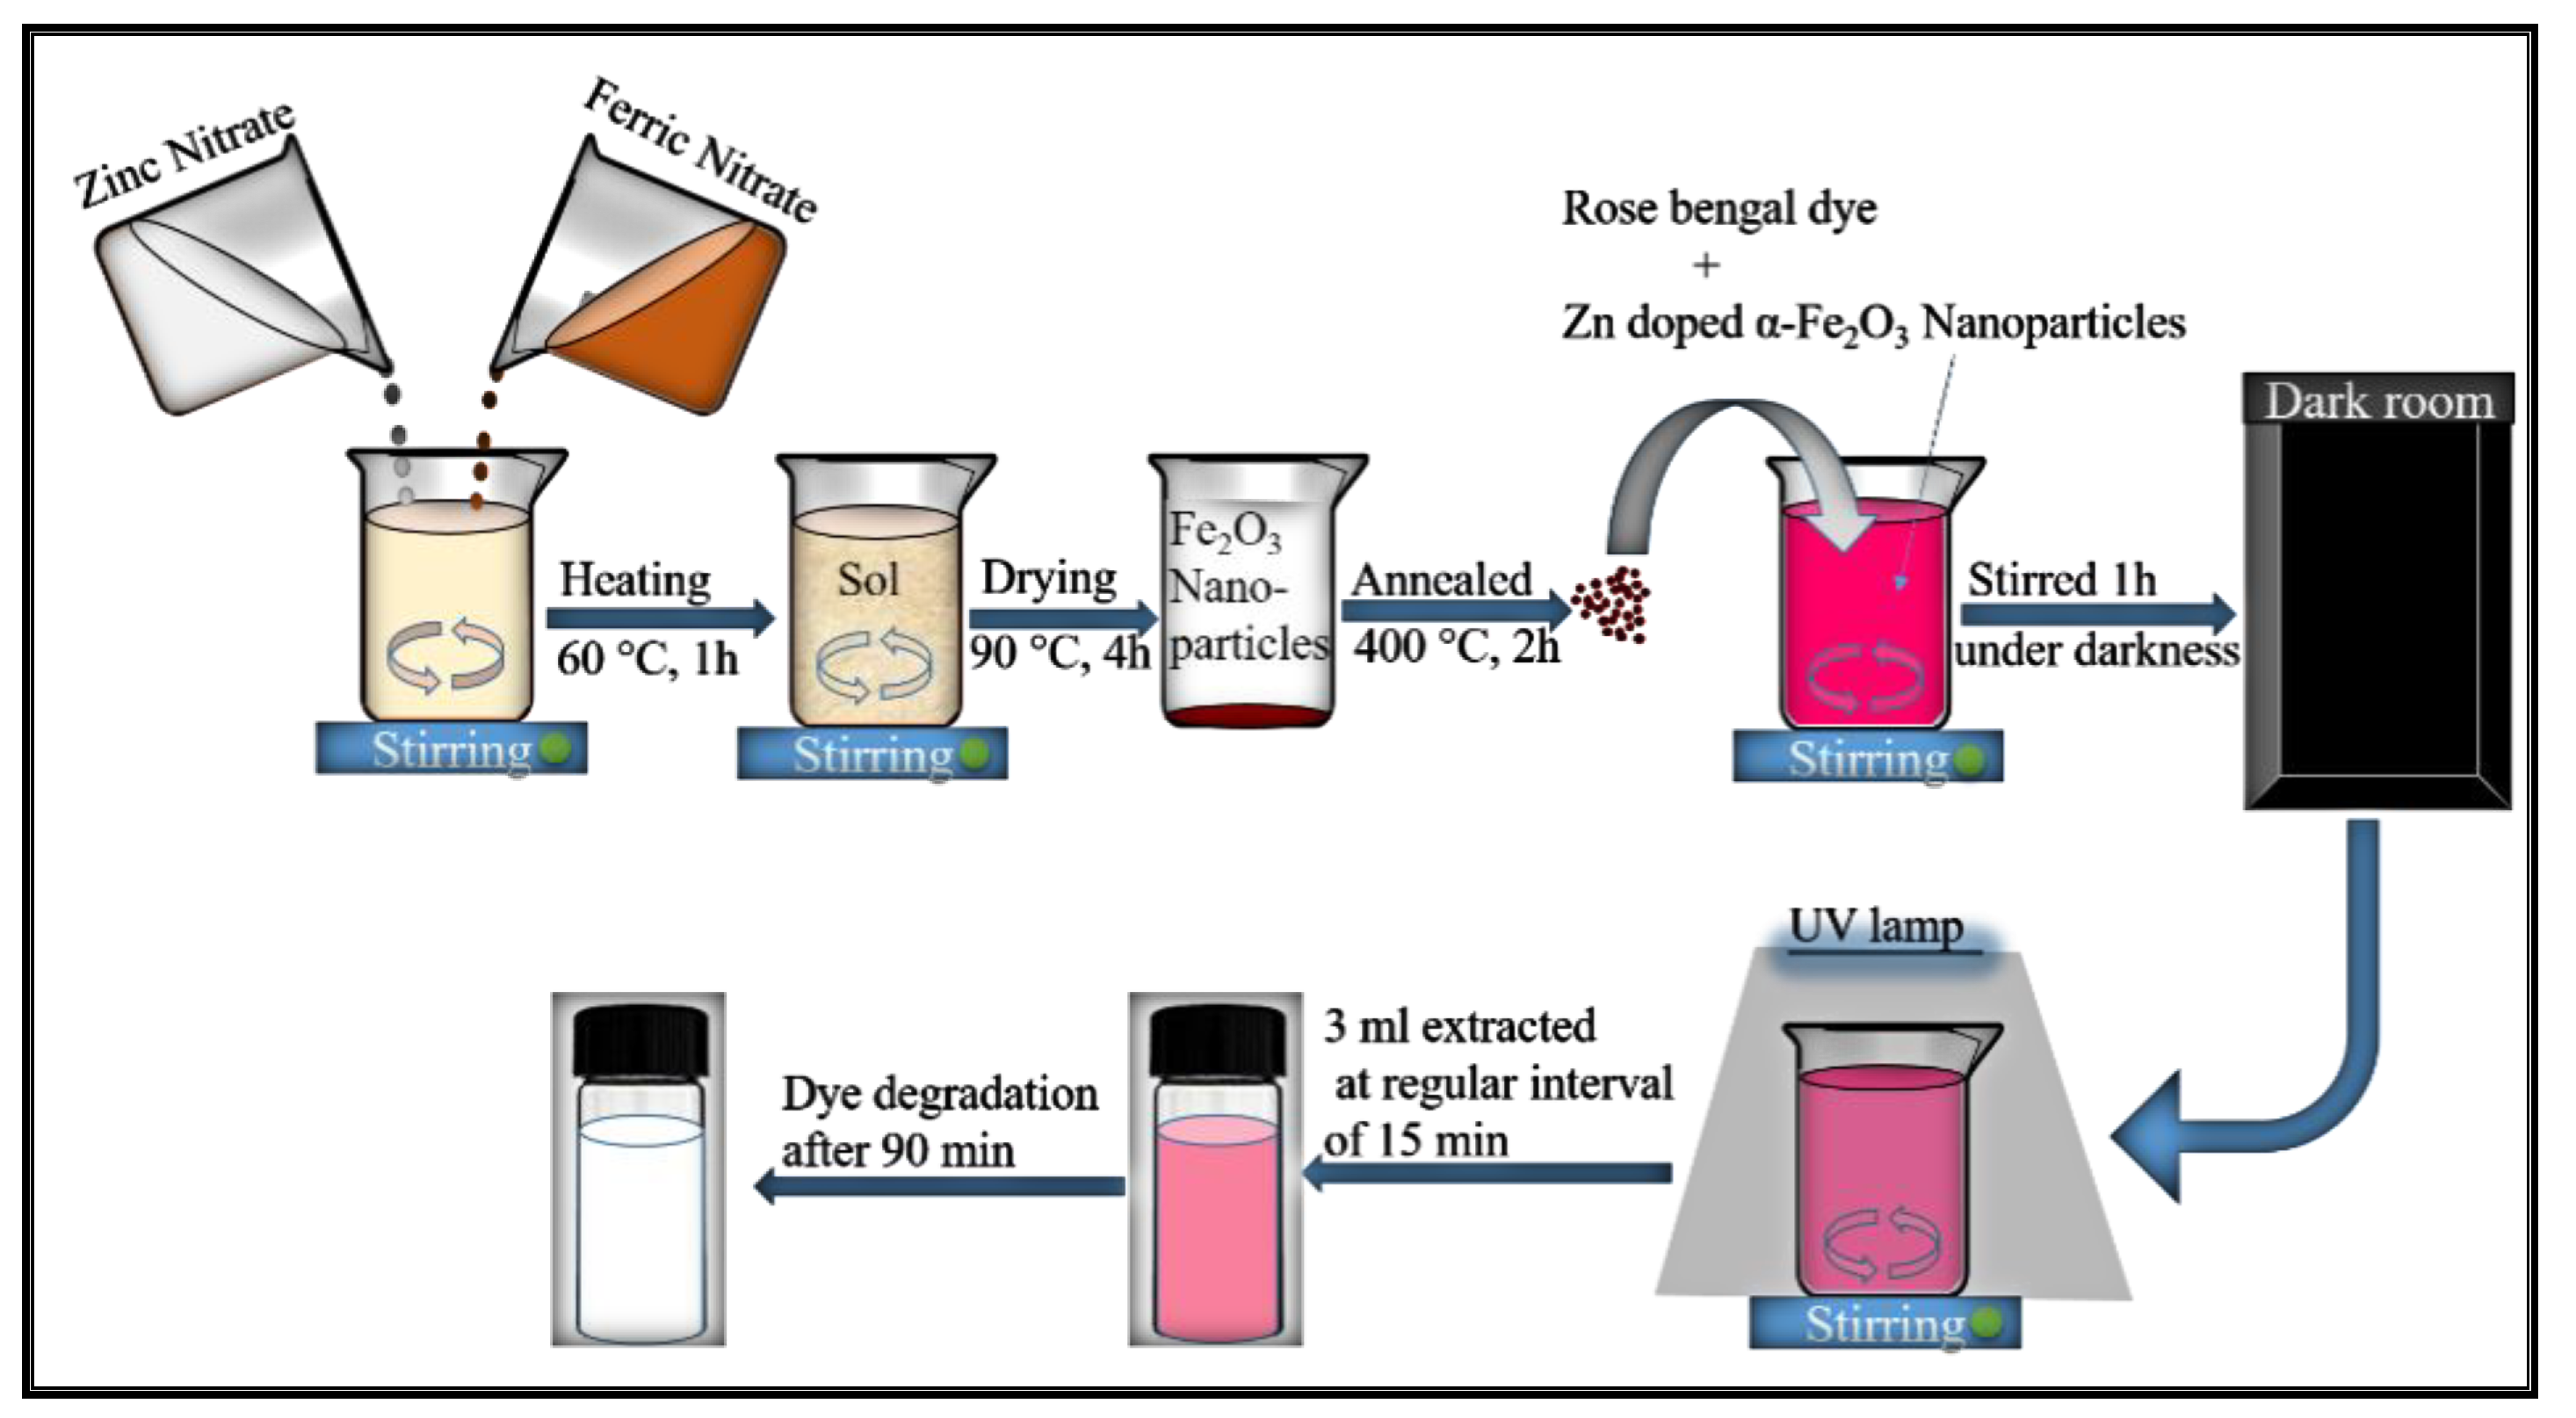
Pure and Zn doped α-Fe2O3 samples were synthesized by sol-gel method using high purity precursors Fe(NO3)3.9H2O and Zn(NO3)2.6H2O in a stoichiometry ratio with distilled water as solvent (as shown in Figure 1). The solutions were mixed and subjected to vigorous stirring for about 15 min to obtain a clear homogenous solution. The sol mixture was heated on hot plate at 60 °C with constant stirring for 1 h until the gel type solution was obtained. This gel was converted to solid particles by heating at 90 °C for 4 h and then crushed to get nanoparticles. The as obtained powder was annealed at 400 °C for 2 h and then grinded. The sample without doping is represented as pure Fe2O3 and Zn doped as Zn 2%, Zn 4% and Zn 6% corresponding to samples α-ZnxFe2−xO3 where x = 0, 0.02, 0.04 and 0.06.
2.2. Characterizations
Structural study of prepared samples was carried out by Rigaku X-ray Diffractometer (XRD) (installed at DCRUST, Murthal, India) as Cu Kα radiation source with wavelength 1.54 Å. The size and surface morphology of prepared nanoparticles were studied using Thermo Scientific Talos Cryo TEM (installed at AIIMS, New Delhi). Raman spectra were recorded with a STR 500 Confocal Micro Raman Spectrometer (DPSS Laser of wavelength of 532 nm at 12.5 MW power source) (installed at MNIT, Jaipur, India). Fourier transform infrared spectroscopy (FTIR) was explored by a NICOLET 5700 (present at DCRUST, Murthal, India) with transmittance in the range 400–4000 cm−1. Dielectric measurements were done using Novacontrol broadband (installed at Delhi University) impedance at room temperature to measure complex dielectric permittivity and tangent loss. UV-Vis absorption spectra were recorded at different time intervals to monitor the degradation process using LABINDIA UV 3092 UV-VIS spectrophotometer (present at DCRUST, Murthal, India).
2.3. Photocatalytic Test
Photocatalytic performance of Zn doped α-Fe2O3 samples were investigated by decomposition of Rose bengal (RB) dye using 300 W UV light source having 365 nm wavelength at room temperature which is shown in Figure 1. In this experiment, 0.05 g of catalyst was sprinkled in 50 mL of 5 ppm RB dye solution and vigorously stirred for 45 min in the dark to achieve equilibrium adsorption/desorption at the surface of photocatalyst. Then, the dye solution was continuously stirred throughout the experiment under UV light and 3 mL of solution was collected at regular 15 min time intervals to monitor the degradation process using UV-VIS spectrophotometer.
3. Results and Discussion
3.1. XRD Analysis
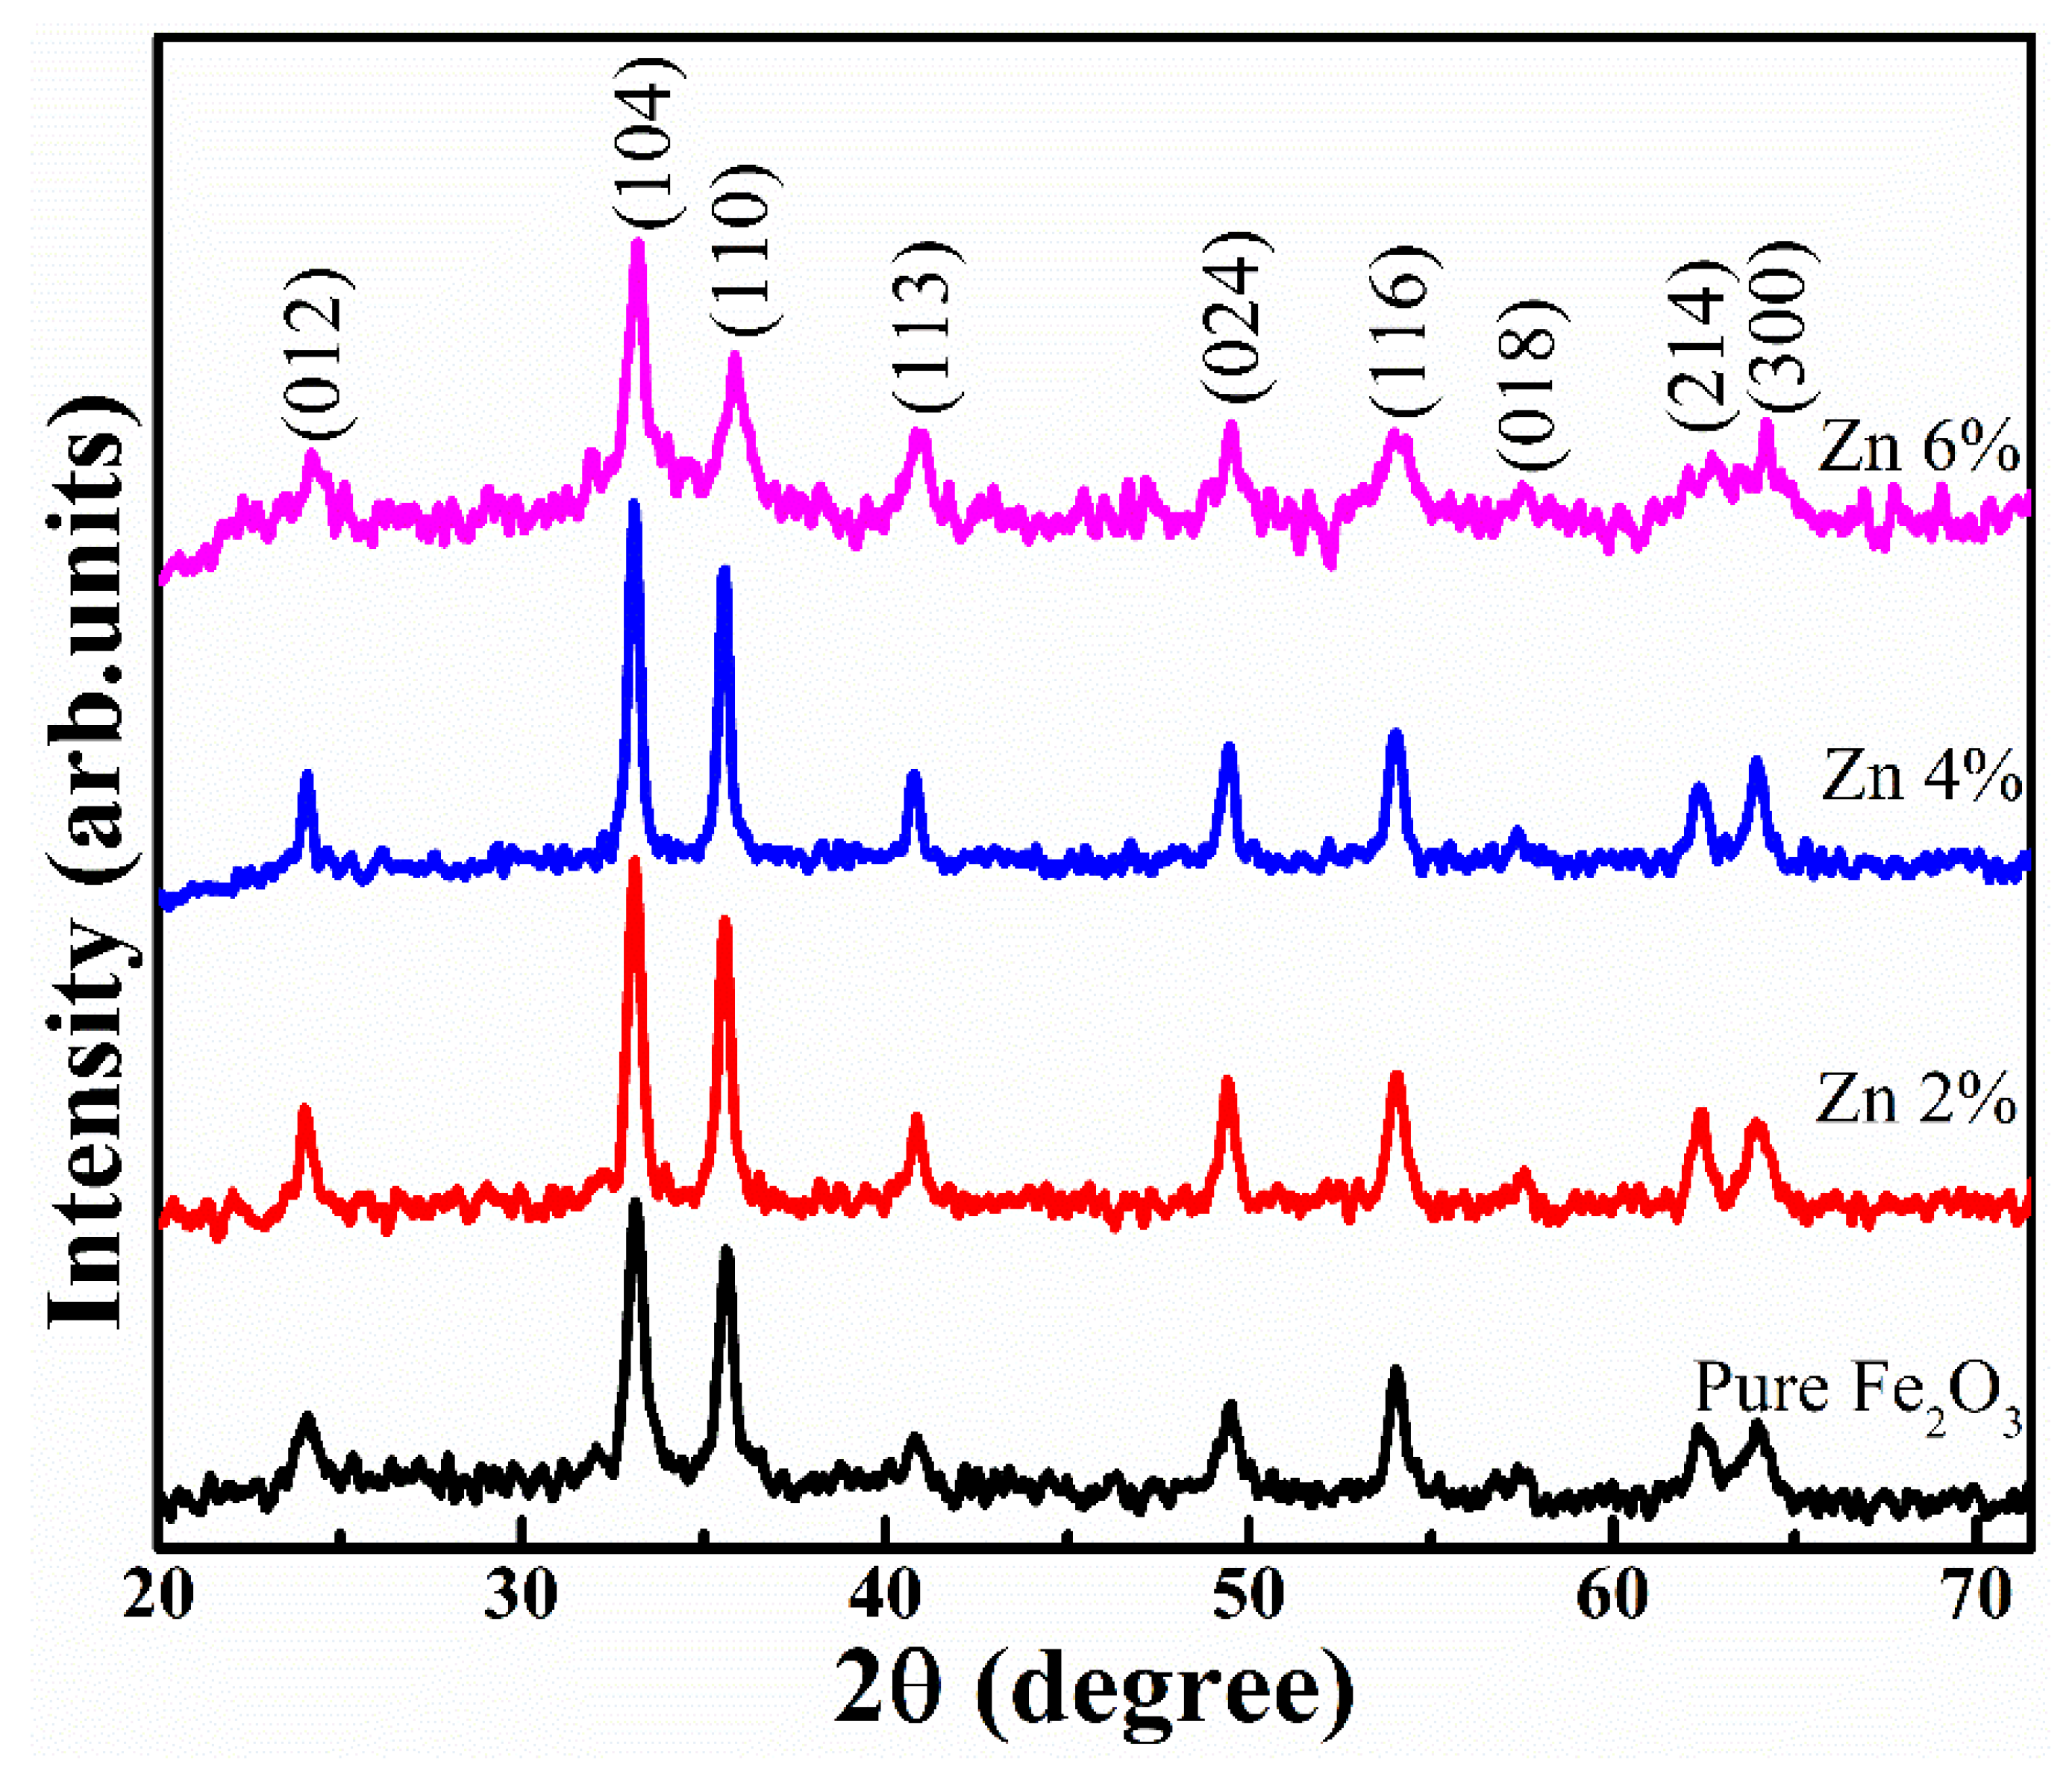
Structural and phase identification of the materials were confirmed using X-ray diffraction (XRD) as shown in Figure 2. All exhibited XRD peaks of pure and Zn doped hematite assigned to (012), (104), (110), (113), (024), (116), (214) and (300) planes can be easily indexed to rhombohedral with space group R3c phase of hematite (JCPDS card no. 84-0311) [19]. No diffraction peaks other than hematite has been observed, indicating that Zn atoms were incorporated in α-Fe2O3 matrices. Thus, crystallinity is altered by dopant atoms without disturbing the rhombohedral structure of hematite. A visual inspection of XRD reveals that (104) diffraction peak is shifting towards lower angle up to 4% of Zn doping and then shifts toward higher angle side for 6% Zn concentration. This shifting of XRD peaks result in the variation of lattice parameters (a and c) as shown in Table 1. It is contemplated that lower doping (≤4% Zn) concentration occupies substitutional sites, whereas, higher doping of Zn occupies partial interstitial sites or segregate on the surface which distorts the host lattice structure. In other words, higher concentrations of Zn2+ ions causes non uniform distribution in the host lattice, which plays a dominant role in modifying the various physical properties. Distortion in host matrix is expected due to incorporation of large size Zn2+ ions in place of smaller size Fe3+ ions which in turn leads to stress (σ) in the system. This can be obtained using the relation [20],
where represents strain, c0 and c corresponds to the lattice parameter values from JCPDS card and XRD results, respectively. The obtained negative values of stress indicates the compressive stress in the system. A report by K. Vijayalakshmi et al. stated that compressive stress (negative sign in stress value) may be attributed to zinc interstitials and tensile stress (positive sign in stress values) is associated with oxygen vacancy present in the Mg doped ZnO thin films [20]. The crystallite size (D) of these nanoparticles was calculated from the full-width half maxima (FWHM) of (104) peak using Debye-Scherer formula. It is observed that crystallite size increases up to 4% Zn concentration then decreases for 6% Zn concentration. The enhancement in crystallite size after Zn doping plays an important role in crystal growth and also in crystallization of Fe2O3. The enlargement in size is due to the substitution of Fe3+ ions with relatively large sized Zn2+ ions. The obtained trend in crystallite size for higher Zn doped Fe2O3 samples has a similar trend as also discussed in previous reports for Y doped ZnO, Mn-doped CeO2 and Mg-doped ZnO samples [21,22,23].
Additionally, to obtain more information about the defects present in the synthesized samples, dislocation density (δ) is evaluated from . The obtained dislocation density is significantly low for Zn 4% indicating the presence of large number of defects which is helpful in photocatalytic degradation. However, the defects are reduced for Zn 6%. The increase in crystallite size and decrease in dislocation density up to Zn 4% indicates that dopant atoms are entirely included in the lattice. While, in higher Zn dopant concentrations, the decrease in crystallite size and increase in dislocation density infers that dopant atoms occupy interstitial positions in the matrix. This results in a decrease in crystalline order and an increase in dislocation density. The change in dislocation density and stress in synthesized samples confirm the presence of defects in the lattice structure that are responsible for modification in various physical properties.
3.2. TEM Analysis
The surface morphology and particle size of Zn doped Fe2O3 nanoparticles were examined by transmission electron microscopy (TEM) measurements. It can be clearly seen from Figure 3a that Fe2O3 nanoparticles are almost spherical in shape. The estimated average particle size from TEM lies between 16 nm to 23 nm for pure, as well as Zn doped Fe2O3 nanoparticles. The particle size increases up to 4% of Zn concentration and then decreases which is consistent with XRD measurements and the values are given in Table 1. Figure 3a shows agglomerated nanoparticles of Fe2O3. The agglomeration is found to be decreasing with Zn content in Fe2O3 lattice (Figure 3b–d).
3.3. Raman Analysis
Raman spectroscopy is a fast and non-destructive tool for identifying the vibrational phonon modes that access the clear identification of compounds. Hence, the structural properties of as synthesized samples are further studied using Raman spectroscopy. The optical vibrational modes can be assumed as lattice waves arising due to an out of phase movement of atoms inside the crystal lattice. As these waves can interact with applied external electric field so, it is easy to excite them through conventional spectroscopic techniques. For a particular vibrational mode to be Raman active, it should be accompanied by change in polarizability. Whereas, changes in the dipole moment are required for vibrations to be infrared active. Vibrational modes of α-Fe2O3 at the first Brillouin zone center are represented by [24]:
Γ = 2A1g + 2A1u + 3A2g + 2A2u + 5Eg + 4Eu.
Among these, the acoustic modes (A1u and A2g) are optically silent, due to an in-phase movement of atoms inside the crystal lattice, and cannot be identified by these techniques, as they propagate with the speed of sound of a much lower frequency. The six antisymmetric modes (2A2u and 4Eu) are infrared active vibrations and seven symmetrical (2A1g and 5Eg) modes are Raman active vibrations. As the rhombohedral crystal structure of α-Fe2O3 features an inversion center, no modes are both infrared and Raman active.
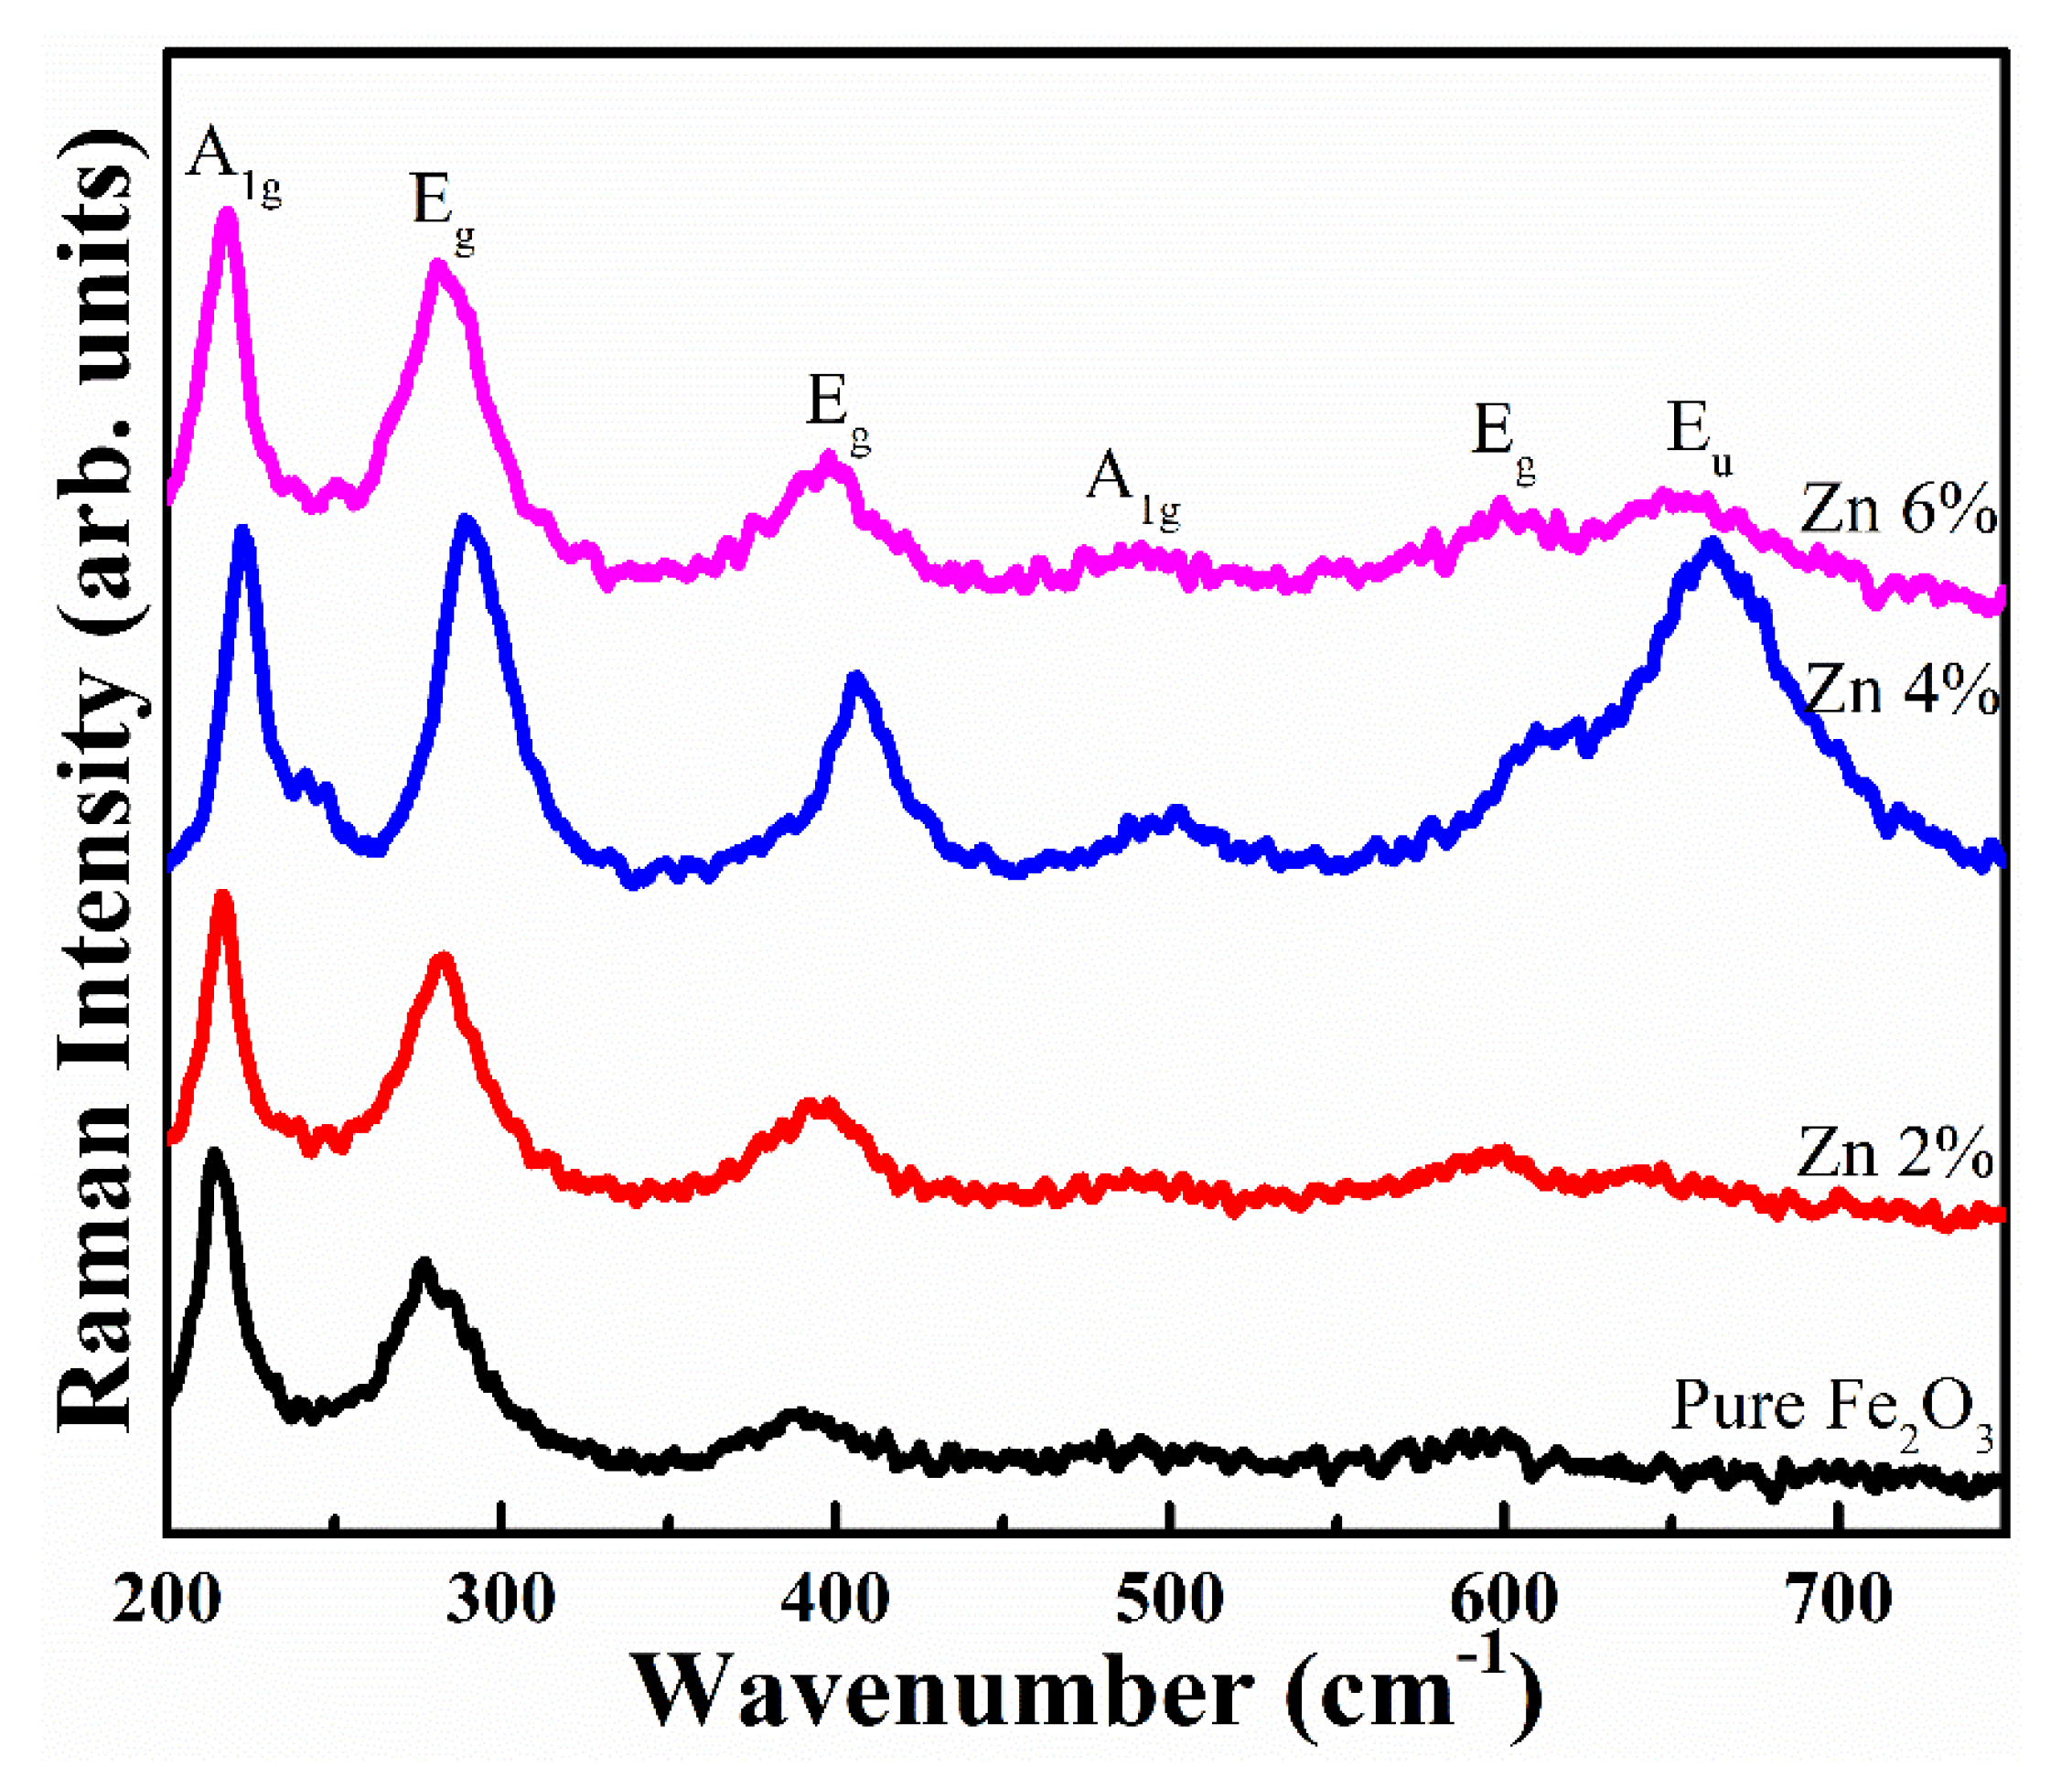
Raman spectra of Zn doped α-Fe2O3 in the range 200–800 cm−1 at room temperature is shown in Figure 4. The assignment of Raman active modes are consistent with the group theory predicted for the space group R3c of hematite. Five phonon modes (2 A1g and 3 Eg) of hematite corresponding to transverse optical (TO) modes are detected by group theory at A1g(1) ~215 cm−1, Eg(1) ~280 cm−1, Eg(2) ~398 cm−1, A1g(2) ~492 cm−1, Eg(3) ~544 cm−1 respectively, which are well in agreement with existing literature, thereby confirming the rhombohedral structure of synthesized samples [9]. The expected Raman spectra, corresponding to Eg modes at ~245 cm−1 and ~412 cm−1 is missing in the present case due to crystalline disorder or broadening of peaks. A1g symmetry can be viewed as the movement of Fe atoms along the crystallographic c-axis of the unit cell, while Eg symmetry involves the symmetric breathing mode of O atoms correlated to each iron cation (Fe) in the plane perpendicular to the c-axis of the unit cell. It is observed from Figure 4 that peaks shift towards higher wavenumber till 4% Zn doping and then shift towards lower wave number on further doping. This shifting in Raman modes is governed by the change in host lattice strain with the addition of foreign atoms. The observed variation in Raman spectra correlates well with the XRD results of variation in lattice parameter and stress values. Apart from these symmetrical phonon modes, it is observed that there is an additional feature illustrating IR (infrared) - active longitudinal optical (LO) Eu mode at ~597 cm−1 which is forbidden in Raman scattering, but is activated by surface defects or disorder in hematite crystalline lattice [25]. The intensity of this mode is maximum for Zn 4% sample. These defects attribute to oxygen vacancies and modify the electronic structure that, in turn, enhances the photocatalytic activity.
3.4. FTIR Analysis
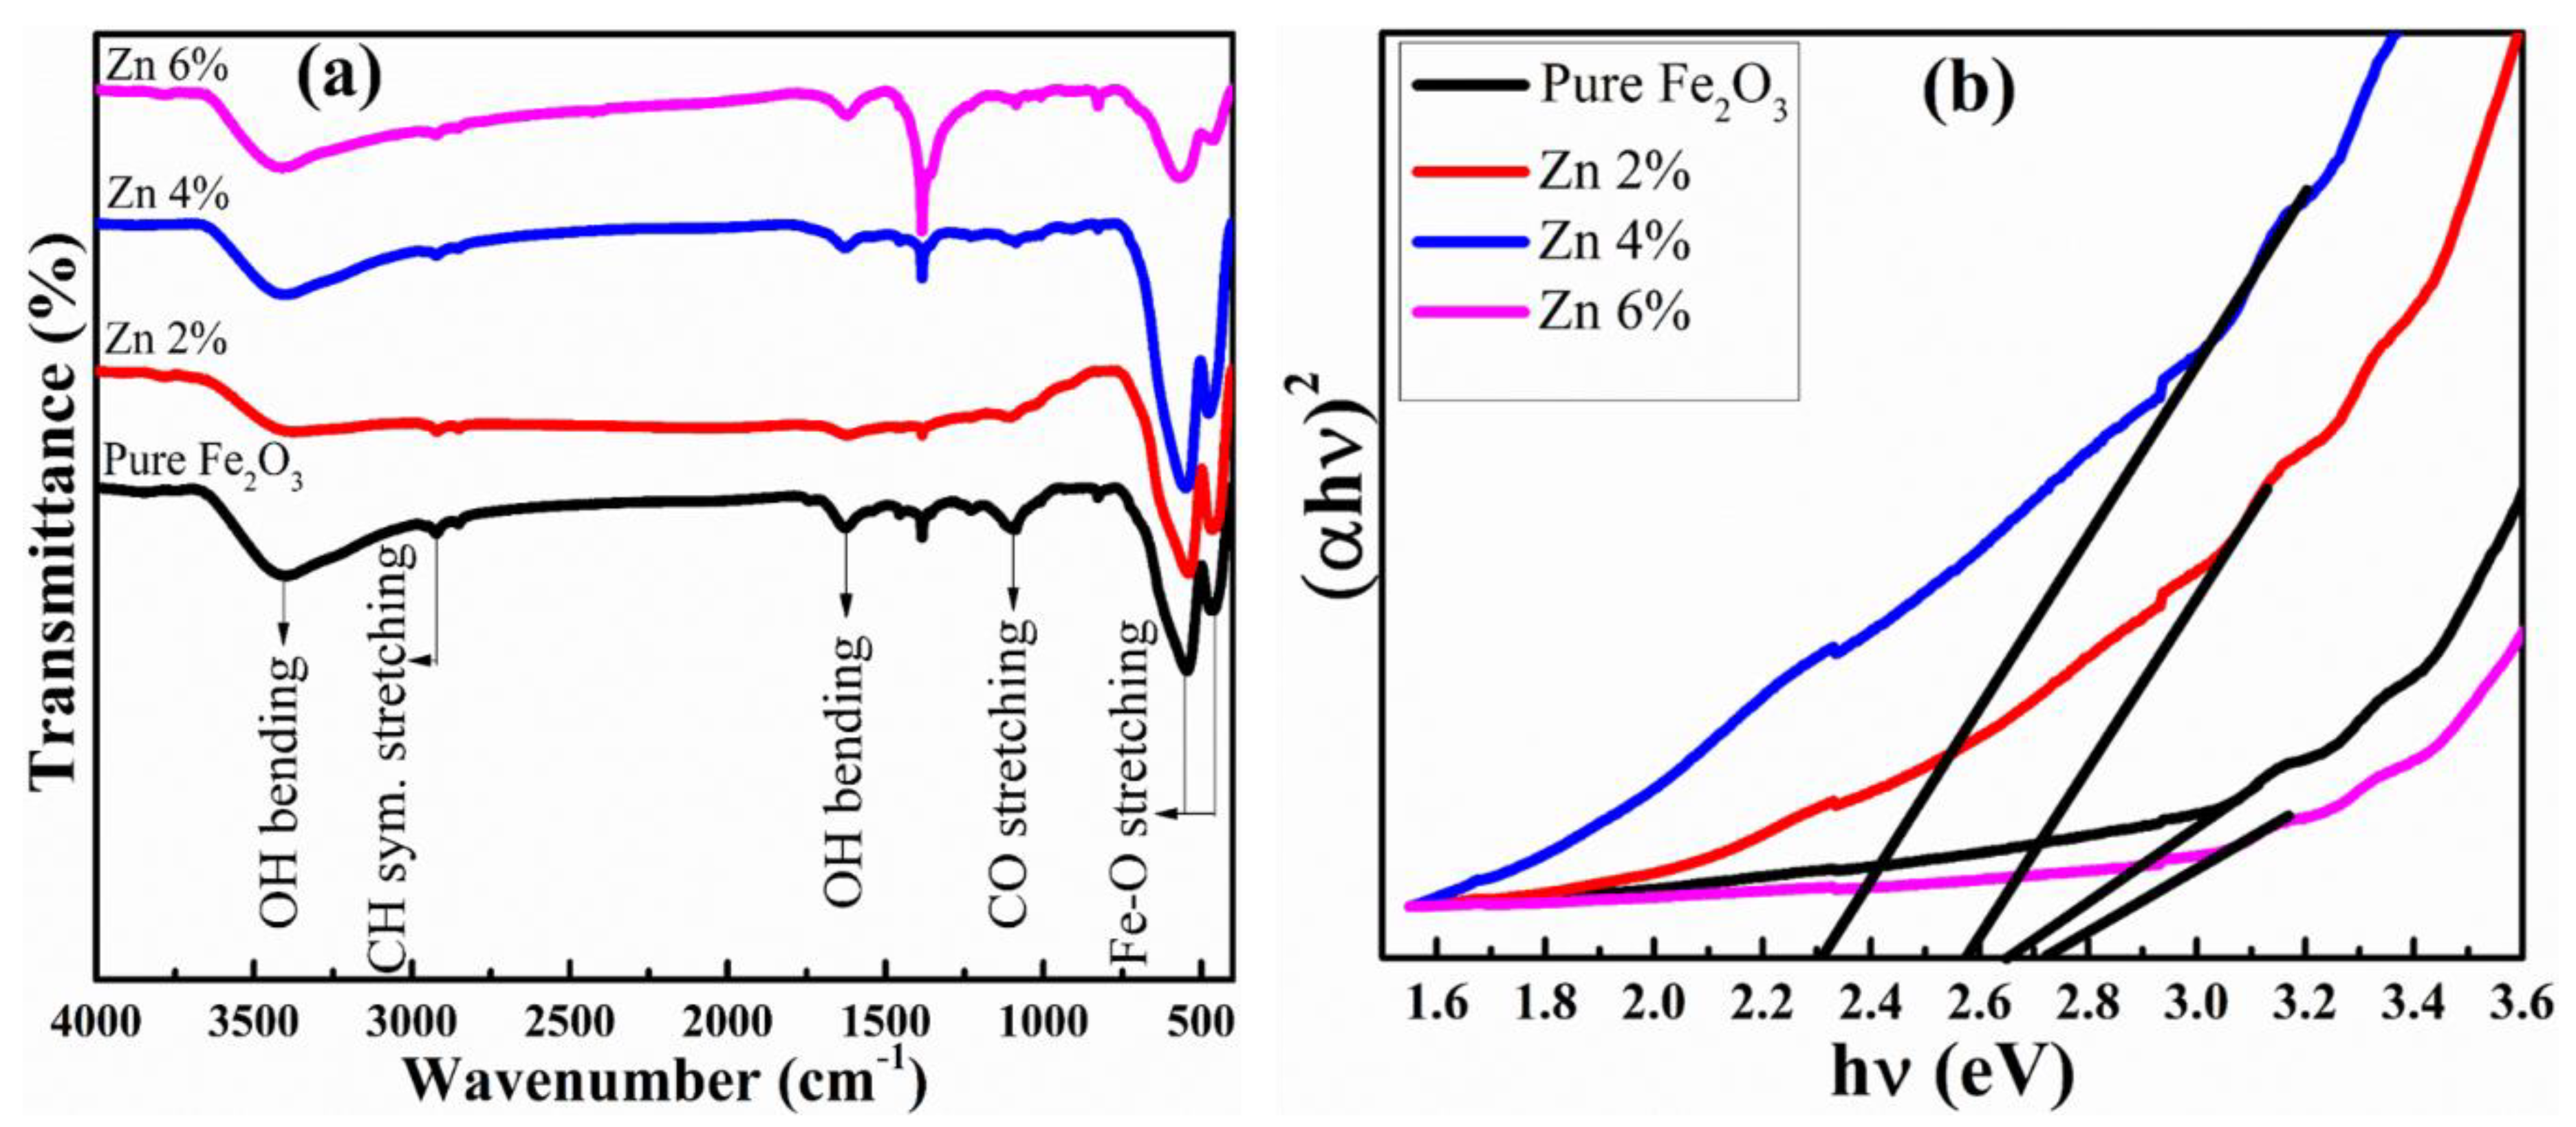
Fourier transform infrared (FTIR) spectroscopy is a powerful method to get the information related to chemical bonds adsorbed on the surface of the material. FTIR spectrum of pure and Zn doped α-Fe2O3 nanoparticles was recorded in the range 400–4000 cm−1 given in Figure 5a. Different bands in FTIR spectra arises due to various functional groups. As discussed above in Raman studies, group theory analysis predicts six infrared active modes corresponding to α-Fe2O3 lattice, out of which two infrared active A2u modes are associated with the vibrations polarized parallel to crystallographic c-axis, while other four active Eu modes are polarized perpendicular to crystallographic c-axis [26]. The spectra features two prominent peaks at ~463 cm−1 and ~551 cm−1 are assigned to Eu and A2u + Eu (overlapping of A2u and Eu) phonon modes, respectively. These sharp and strong intensity bands at ~463 cm−1 and ~551 cm−1 indicate the metal oxygen (Fe–O) vibrations in rhombohedral lattice of hematite [27]. Also, these peaks confirm the existence of α-Fe2O3 and are consistent with XRD data. In addition, peak observed at 1095 cm−1 is attributed to the presence of adsorbed CO2 and peak centered at ~1633 cm−1 is assigned to O-H bending of water [28,29]. Further, the band at ~2929 cm−1 is attributed to CH symmetric stretching vibrations and very broad peak observed at ~3413 cm−1 corresponds to the presence of hydroxyl group [30].
It has been demonstrated that band positions in FTIR spectra are sensitive to lattice parameters, particle size and the presence of impurities. As discussed above, bands at ~463 cm−1 and ~551 cm−1 are related with Fe–O stretching vibrations and these bands are shifting toward lower wavenumber side up to Zn 4% and then shift to higher wavenumber for Zn 6% due to variation in cation-oxygen bond length [31]. Also, it is well-established that bond length is inversely proportional to wavenumber or frequency. The shifting in these bands are analogous to the change in lattice parameter values analyzed through XRD measurements and reveals the strengthening of metal oxygen bond with the change in Zn content in the host matrix. Moreover, intensity of peaks increases up to Zn 4% doping and decreases for Zn 6% which is in accordance with crystallinity of XRD pattern.
.
3.5. UV–Vis Analysis
UV-Vis measurements in the absorption mode were carried out to reveal the electronic structure and size effect of as prepared nanoparticles. The optical band gap energy for synthesized nanoparticles has been calculated using the Tauc’s relation: , where, α is the absorption coefficient, hν is incident photon energy of light, A is a constant, Eg denotes the band gap energy and n is constant that depends on the nature of optical transition (n = 2 and 0.5 for direct and indirect transition respectively) [32]. Figure 5b shows the plot of (αhν)2 versus hν for Zn doped α-Fe2O3 nanoparticles that exhibits a direct band gap with n = 2. The charge transfer in α-Fe2O3 takes place between occupied O2− 2p state to empty Fe3+ 3d upper state that is responsible for direct band gap transition in Fe2O3. It is found that pure Fe2O3 nanoparticles has band gap of 2.66 eV which is higher than the reported band gap of 2.1 eV for pure Fe2O3 [1]. This indicates existence of Fe3+ in lower spin state that results in higher value of band gap for pure Fe2O3. Moreover, the obtained results show reduced band gap from 2.66 eV for pure Fe2O3 to 2.31 eV for Zn 4% and then increases for higher Zn concentration. This decrease in band gap may be ascribed to an increase in structural disorder or defects with increase in Zn doping up to 4% concentration. In addition, this decrease in band gap may also be due to partial hybridization between Zn t2g and O 2p states to empty Fe t*2g 3d orbitals. A report by Mashiko et al. explained the decrease in band gap on the basis of decrease in residual in-plane strain [33]. Based on the above considerations, the sequence of band gap for synthesized samples is Zn 6% > Pure Fe2O3 > Zn 2% > Zn 4% which agrees well with experimental data and measured band gap values are given in Table 2.
Band edge positions, bandgap as well as the overall band structure of semiconductors play an important role in photocatalytic applications. The energy position of the band edge level can be controlled by the electronegativity of the dopants, as well as by the quantum confinement effects. The valence band and conduction band edge potential of a semiconductor can be deduced from the relation [34,35],
where, EVB and ECB are the valence band and conduction band edge potential, respectively, χ is the absolute electronegativity of a semiconductor oxide and its value for Fe2O3 is 5.87 eV, Ee represents the energy of free electrons, which is about 4.5 eV on hydrogen scale. The calculated valence and conduction band edge position for synthesized samples are given in Table 2.
3.5.1. Photocatalytic Activity
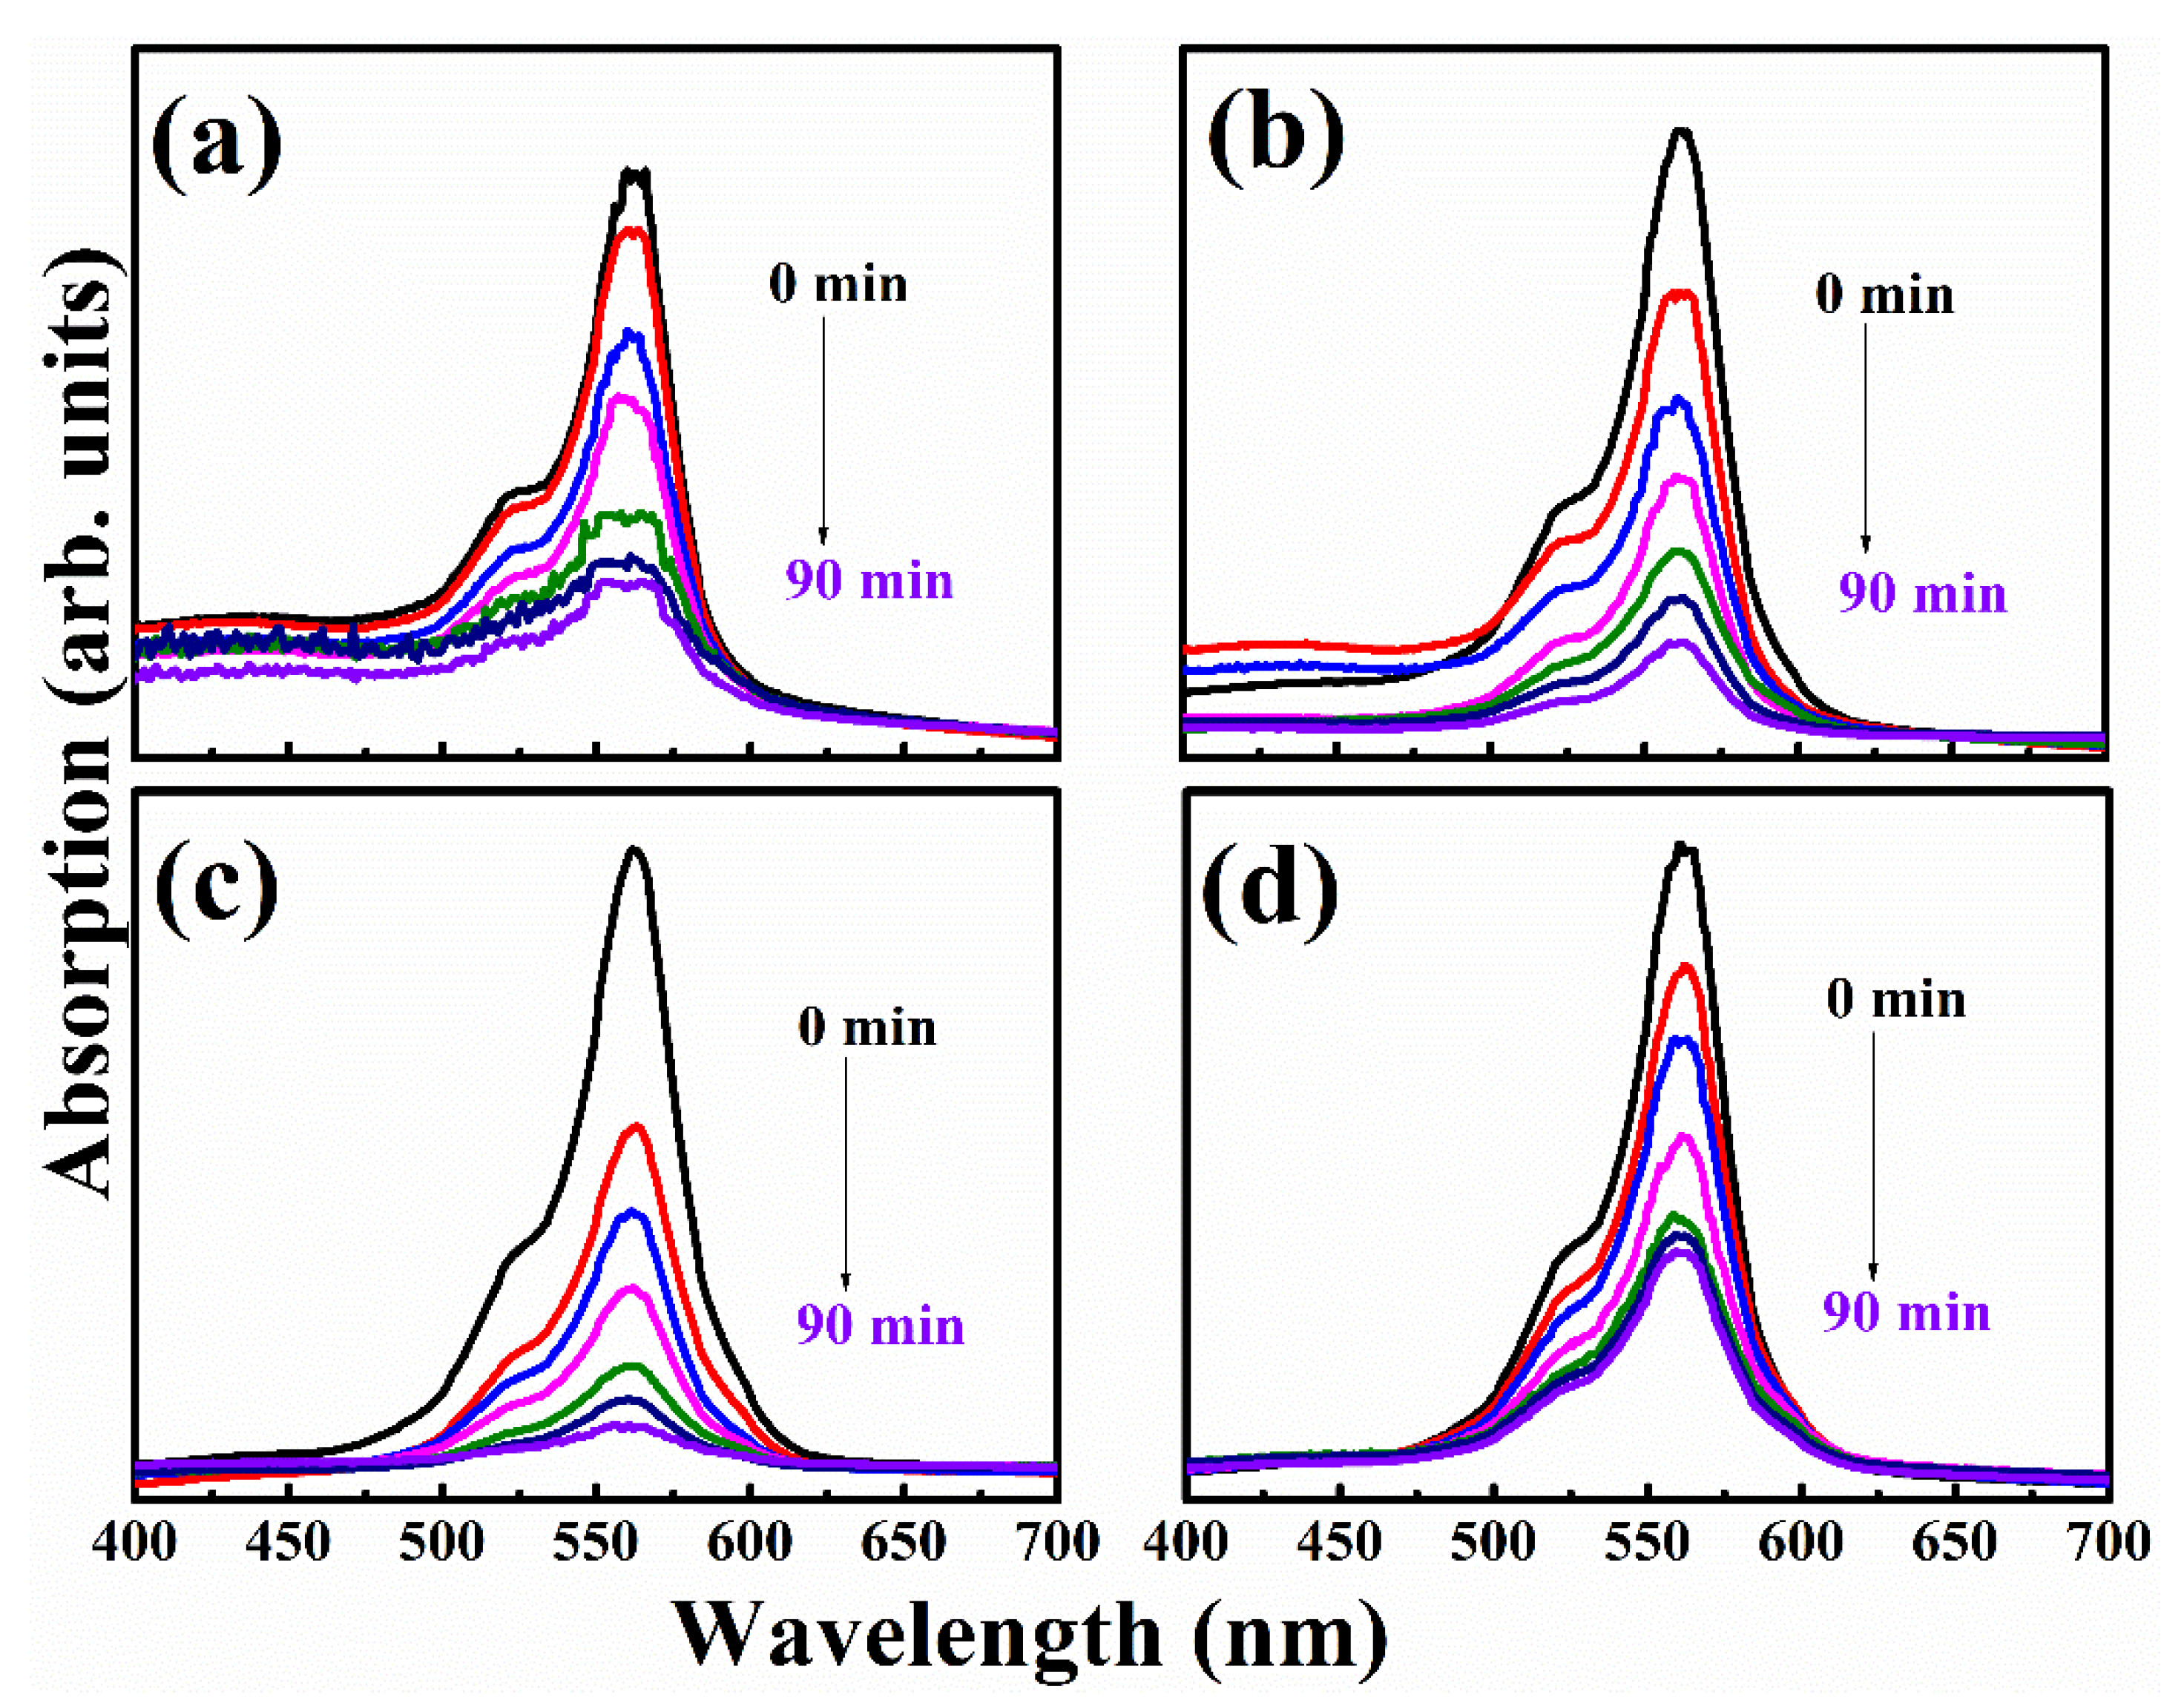
The photocatalytic performance of Zn doped α-Fe2O3 (catalyst) was investigated by recording the time-dependent degradation of RB dye (as a contaminant). Figure 6a–d showing the change in absorption spectra over time for RB dye solution with catalysts under the presence of UV light irradiation. Figure 6a demonstrates that pure α-Fe2O3 shows poor performance, compared to Zn doped (2% and 4%) samples as the high recombination rate between electrons and holes, and which cannot be easily separate out due to the short hole diffusion length in case of pure α-Fe2O3. However, the addition of Zn as dopant is a useful tactic to introduce localized electronic band structure which improves the charge separation efficiency. The appearance of no new absorption peak during whole process indicates the degradation in presence of proposed photocatalyst. The characteristic absorption peak intensity of RB dye gradually decreases with increasing exposure time from 0 min to 90 min. The intense absorption peak of RB dye around 562 nm decreases much faster in the presence of catalyst (Zn 4%) compared to other synthesized samples. The photodegradation activity increases with Zn dopant concentration of α-Fe2O3 in the following order: Zn 6% < pure Fe2O3 < Zn 2% < Zn 4% as shown in Figure 6a–d. It is well-established that synthesized samples in nano-region exhibit unique surface chemical reactivity for photocatalytic activity. There are several factors that influence the photocatalytic activity, such as type of dopant, recombination of electron hole pairs and band gap of semiconductors. Researchers have claimed that Cu2+ doping in α-Fe2O3 creates a trap state (separate band) which controls the electron hole recombination in photocatalytic process [1]. In the present study, Zn2+ forms a trap state in the band gap of α-Fe2O3, i.e., a separate band between conduction band and valence band. The trap state induces defect state/impurity level, which entraps the charge carriers, as soon as they have been generated by UV light illumination, and inhibits the recombination so that charge carriers can be used for the redox process. The band gap decreases in Zn doping (up to 4% concentration), resulting in further surface defects (as clearly seen in Raman spectra), as well as delaying the recombination of charge carriers also which yields better catalyst for the degradation of RB dye.
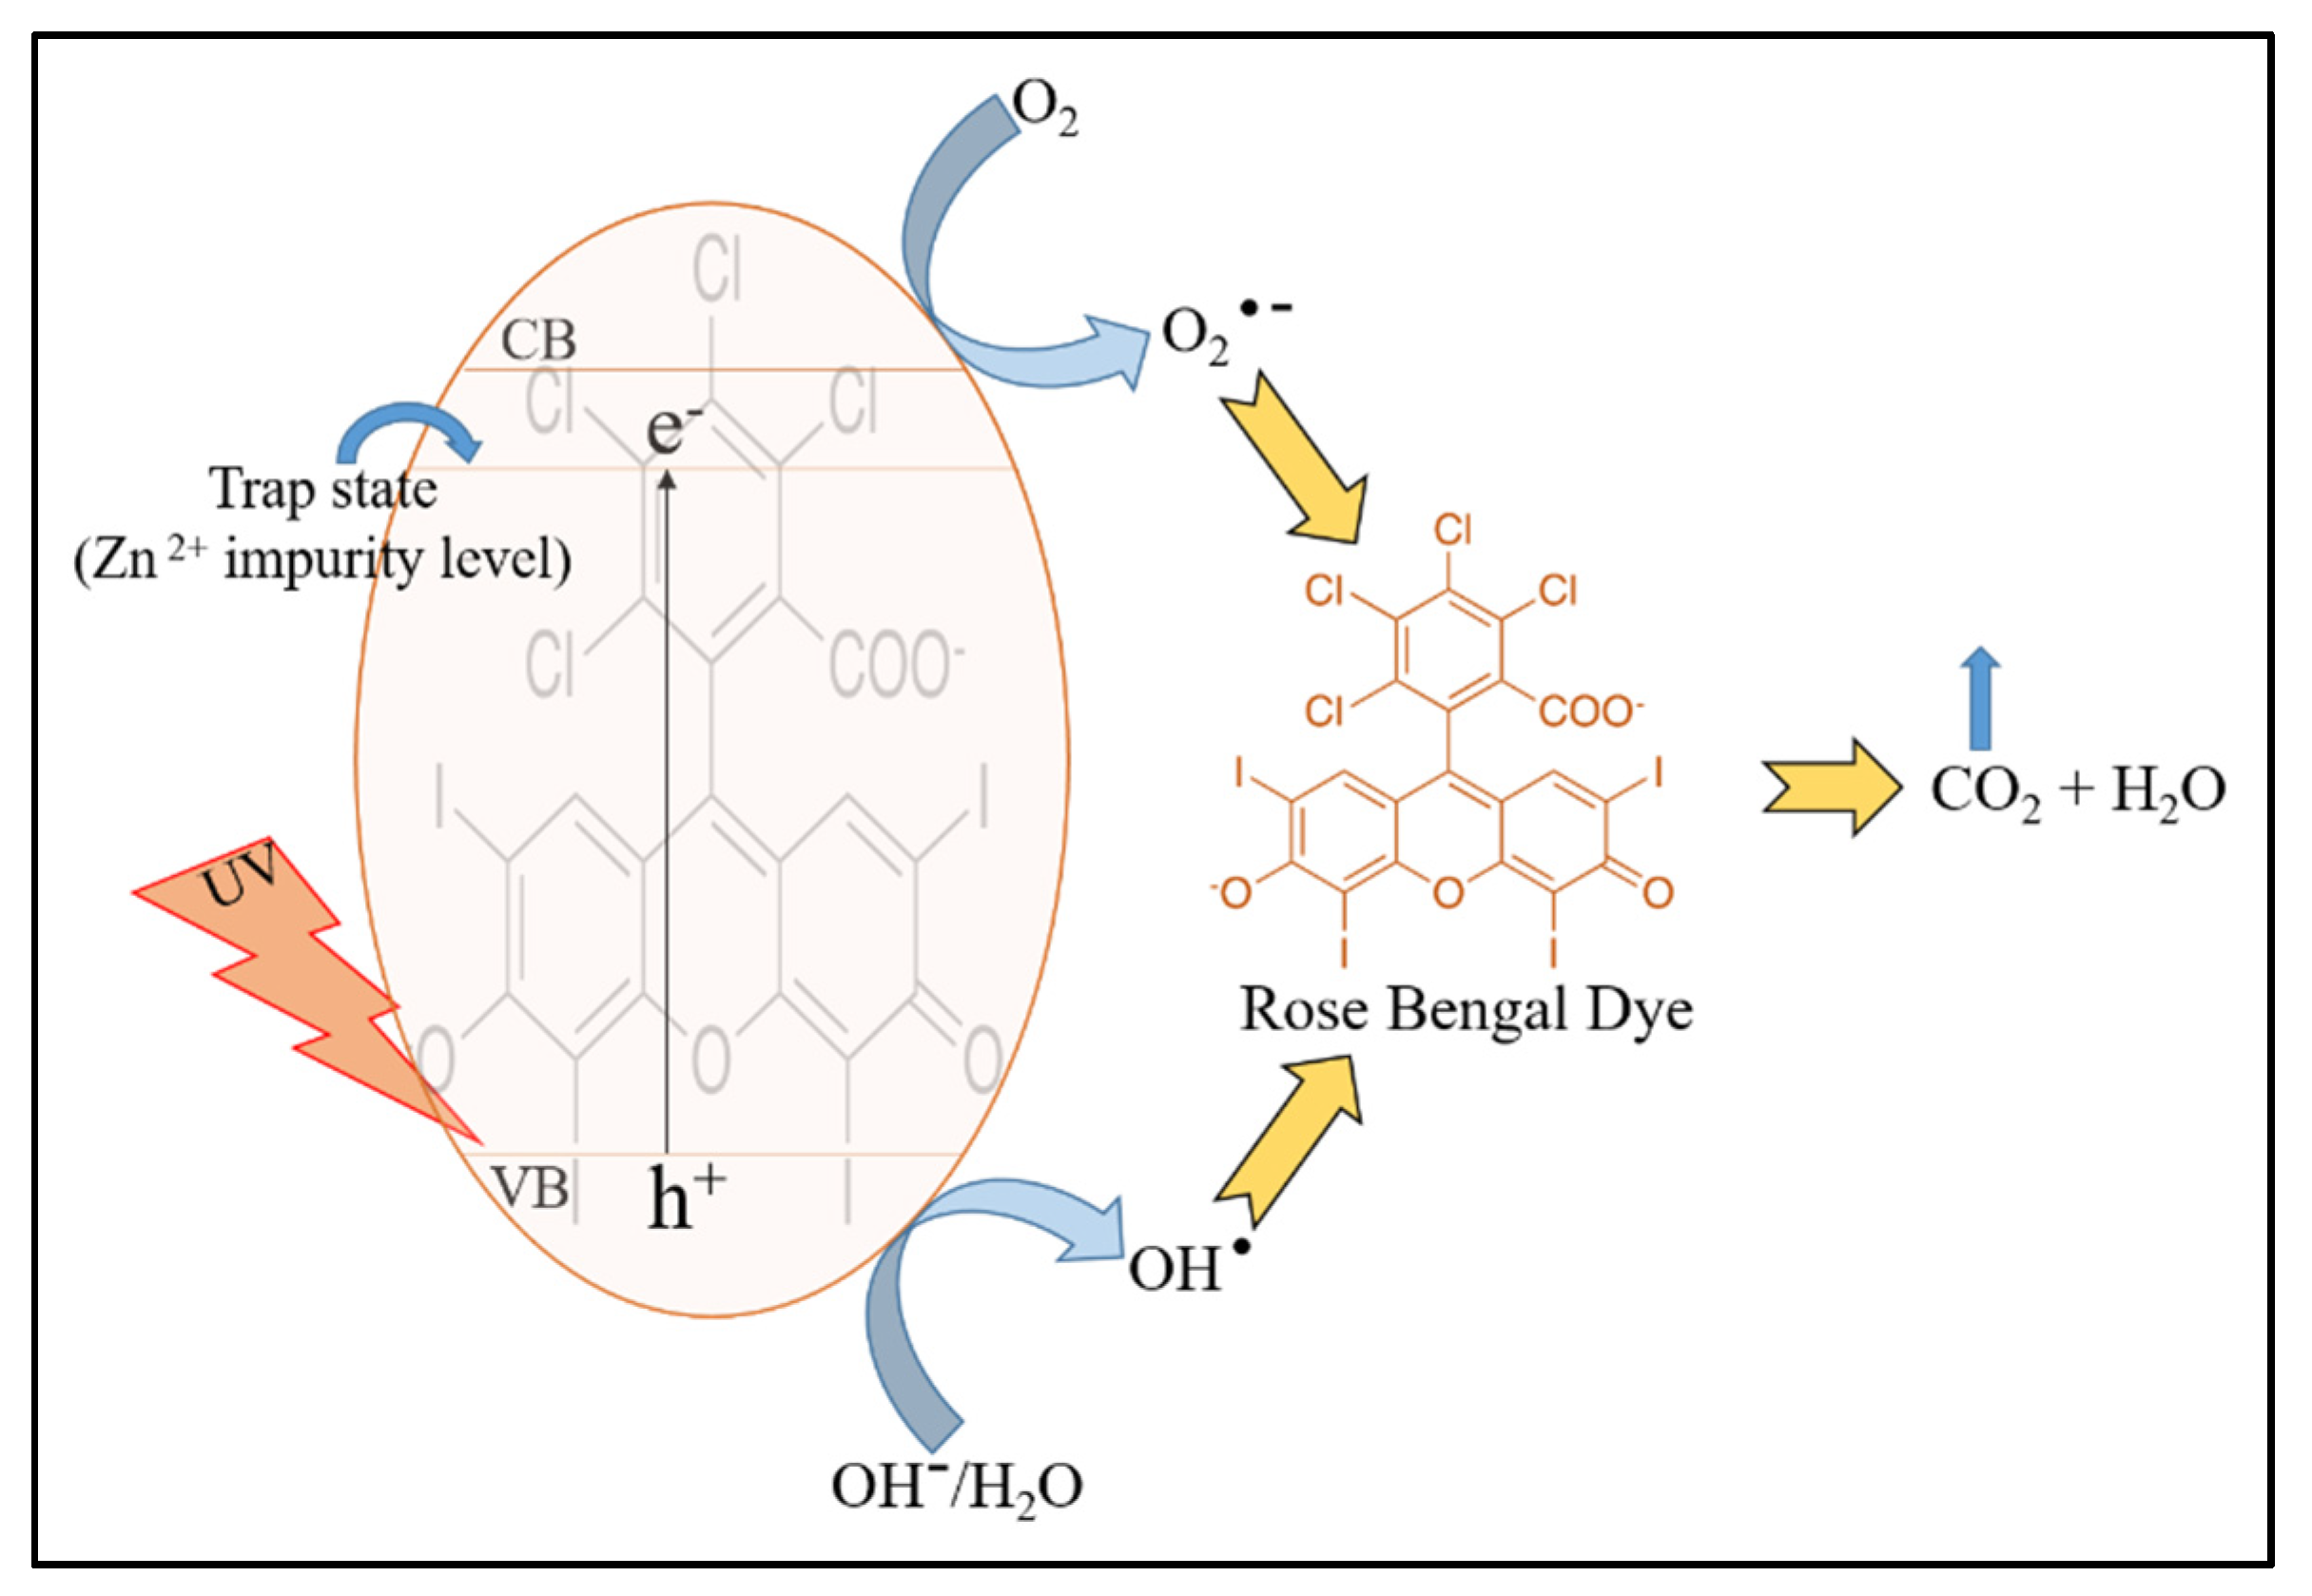
Photocatalytic activity generally includes the partial/complete degradation of organic waste dyes with the assistance of active species existing on the surface of the catalyst. When the catalyst is exposed to UV light, the photogenerated electrons (e−) are excited from top of valence band to the bottom of conduction band, leaving behind the holes in valence band. This lead to positive holes and negative electrons on the catalyst surface. The photogenerated holes interact with adsorbed water present on the surface of catalyst to generate reactive hydroxyl free radical (∙OH), while O2 acts as an electron acceptor to form a superoxide (O2∙−) anion radical which on protonation yields HOO∙ in the presence of water [36]. Further, the O2∙− can act as an oxidizing agent or as an additional source of OH∙ radicals. These hydroxyl radicals are, thus, more efficient for degradation of RB dye into some non-toxic organic compounds, such as CO2 and H2O, as shown in Figure 7. The oxidative (using holes) and reductive (using electrons) pathway, followed by the degradation process, are summarized as follows [33,37]:
This is in accordance with significant activity of samples which is attributed to the effective inhibition of (e−/h+) recombination and migrates to the photocatalyst surface to generate highly reactive free radicals that in turn oxidize RB dye (Figure 7).
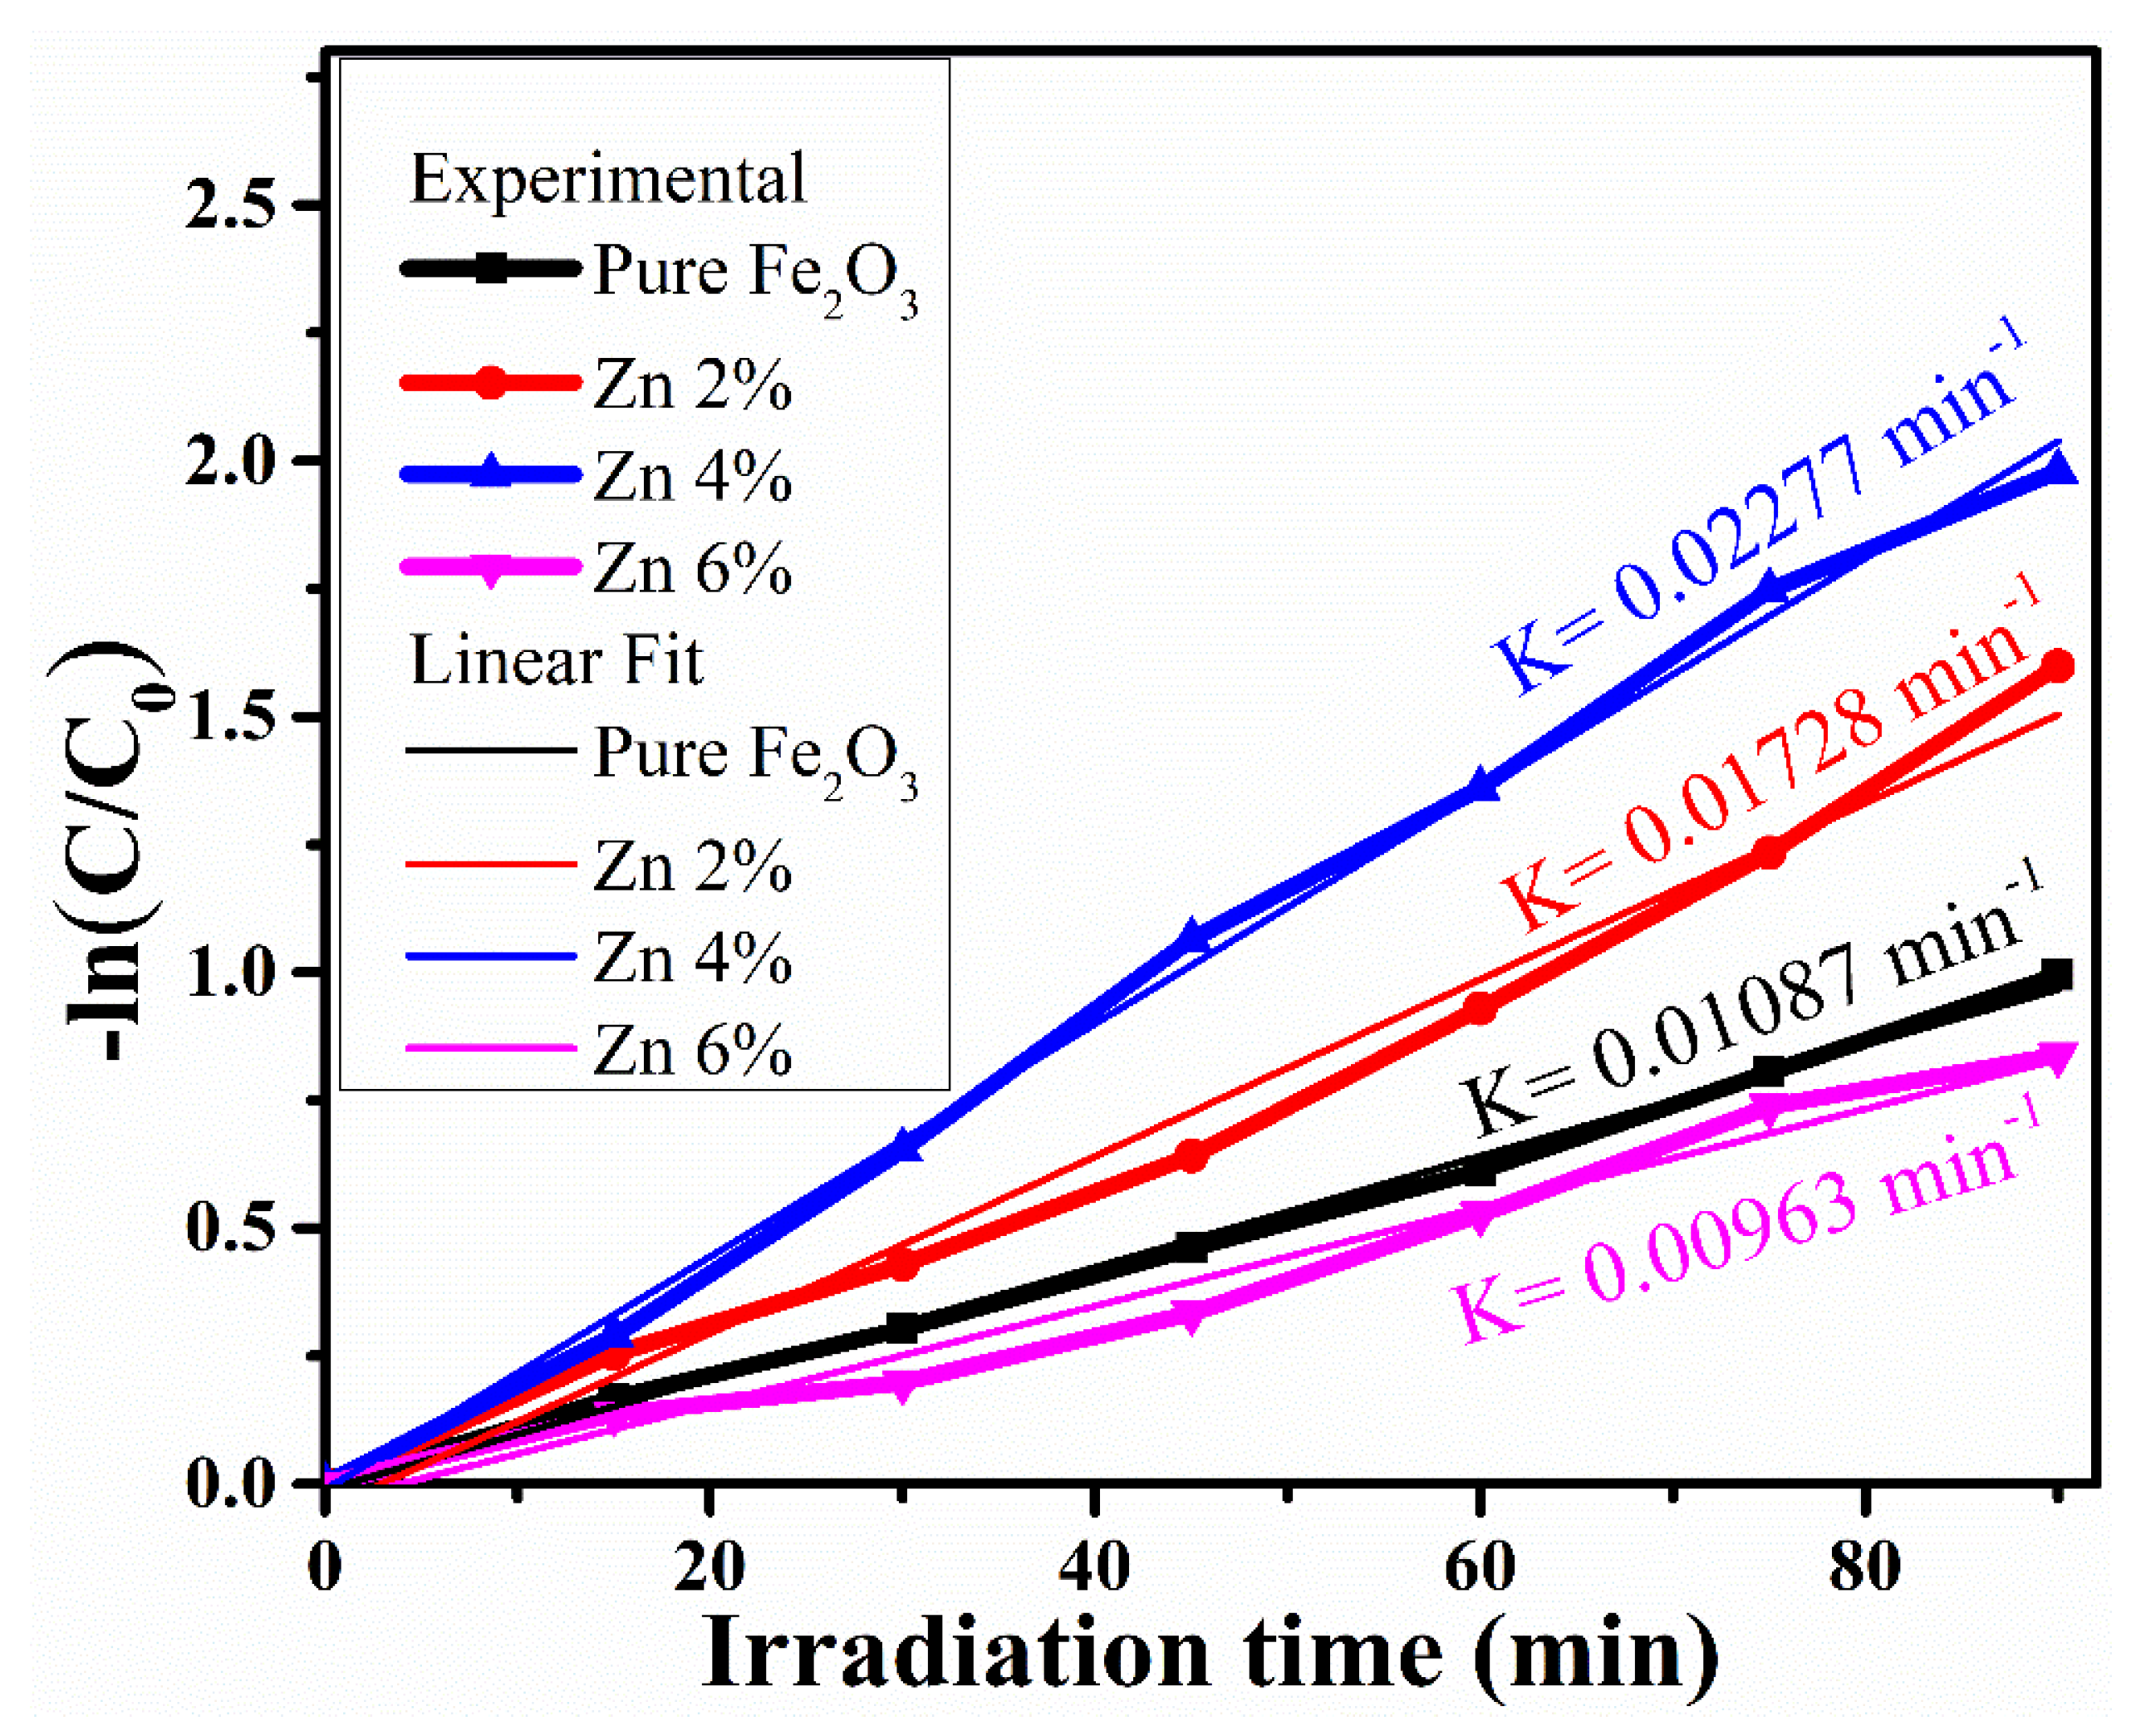
Figure 8 displaying the experimental and linear plot of −ln(c/c0) versus time (t) for RB dye with different Zn concentration in hematite. It suggests that photodegradation of RB molecules by catalyst follows the pseudo-first-order kinetics [38]:
where, C0 is the initial concentration of pollutant (RB dye) when the UV light is turned on, while C is the real-time concentration of pollutant under UV light irradiation, and k is the apparent rate constant of pseudo-first-order equation, t is the irradiation time. The half-life time (t1/2) is defined as the time required to degrade 50% of initial RB dye concentration. The slope of the plot −ln(C/C0) with irradiation time provides the estimated apparent rate constant as given in Table 3. The observed degradation rate constant of RB dye in the presence of a catalyst Zn 4% is 0.02277 min−1, which is significantly larger than other synthesized samples.
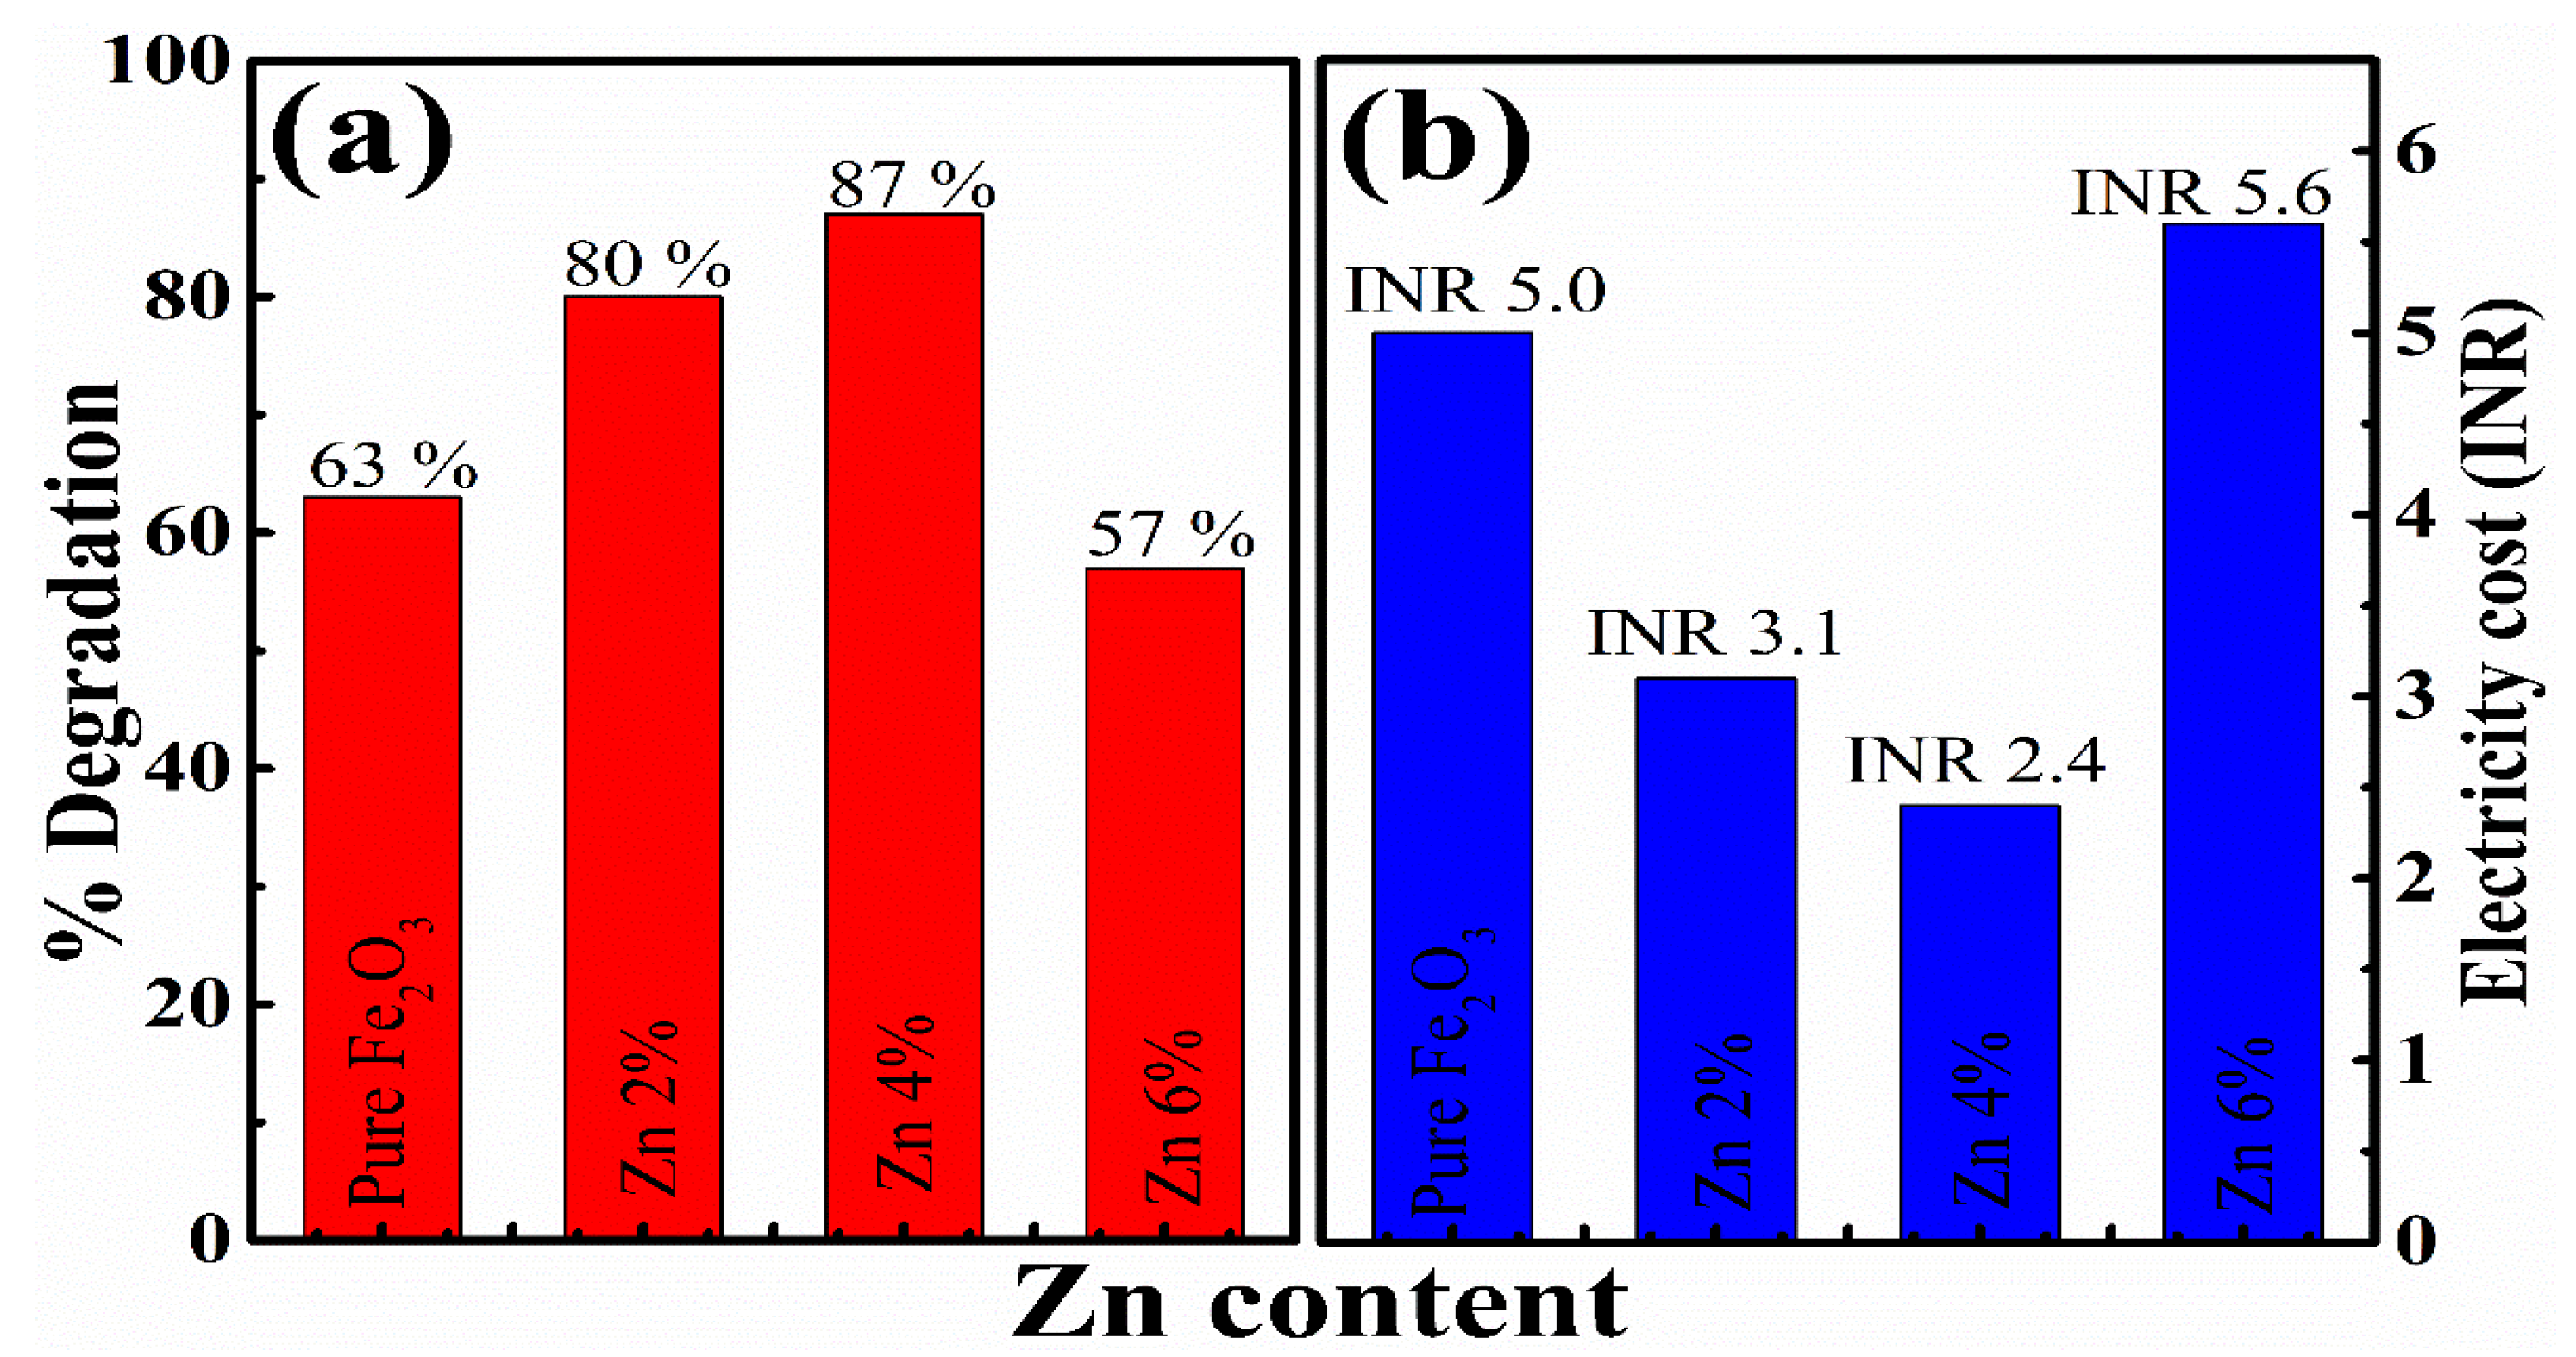
The percentage degradation of RB dye, using pure hematite as a catalyst, is 63% after UV irradiation for 90 min. Degradation % increases with an increase in Zn content up to Zn 4% and reached 87% as shown in Figure 9a. Further increase in Zn content decrease the degradation efficiency towards RB dye. Notably, the degradation rate of Zn 6% is even less than that of pure Fe2O3, due to the fact that Zn ions occupy interstitials site in the host matrix for this concentration responsible for the enhanced recombination rate between electrons and holes.
3.5.2. Electricity Cost
Cost evaluation is one of the most important factors in waste water treatment. As saving energy (electricity) benefits the world at large scale. The main reason behind saving electricity is that burning of fossil fuels in plants causes several environmental issues, such as global warming and the greenhouse effect, which directly affect human life. Our present study aims to reduce energy to mitigate the effects of greenhouse gases. The power consumption can be estimated using the following relation [39],
where, t90 signifies the time taken by any dye to be degraded 90% of its initial concentration, EC is electricity cost, P is power consumed (in Watt) of UV light source. Power consumers consuming a maximum 500 units of electricity per month pay INR 4.68 per unit in our locality, as shown in Figure 9b. The electricity cost is also found to be minimum for 4% Zn doped sample which has maximum % degradation.
3.6. Dielectric Properties
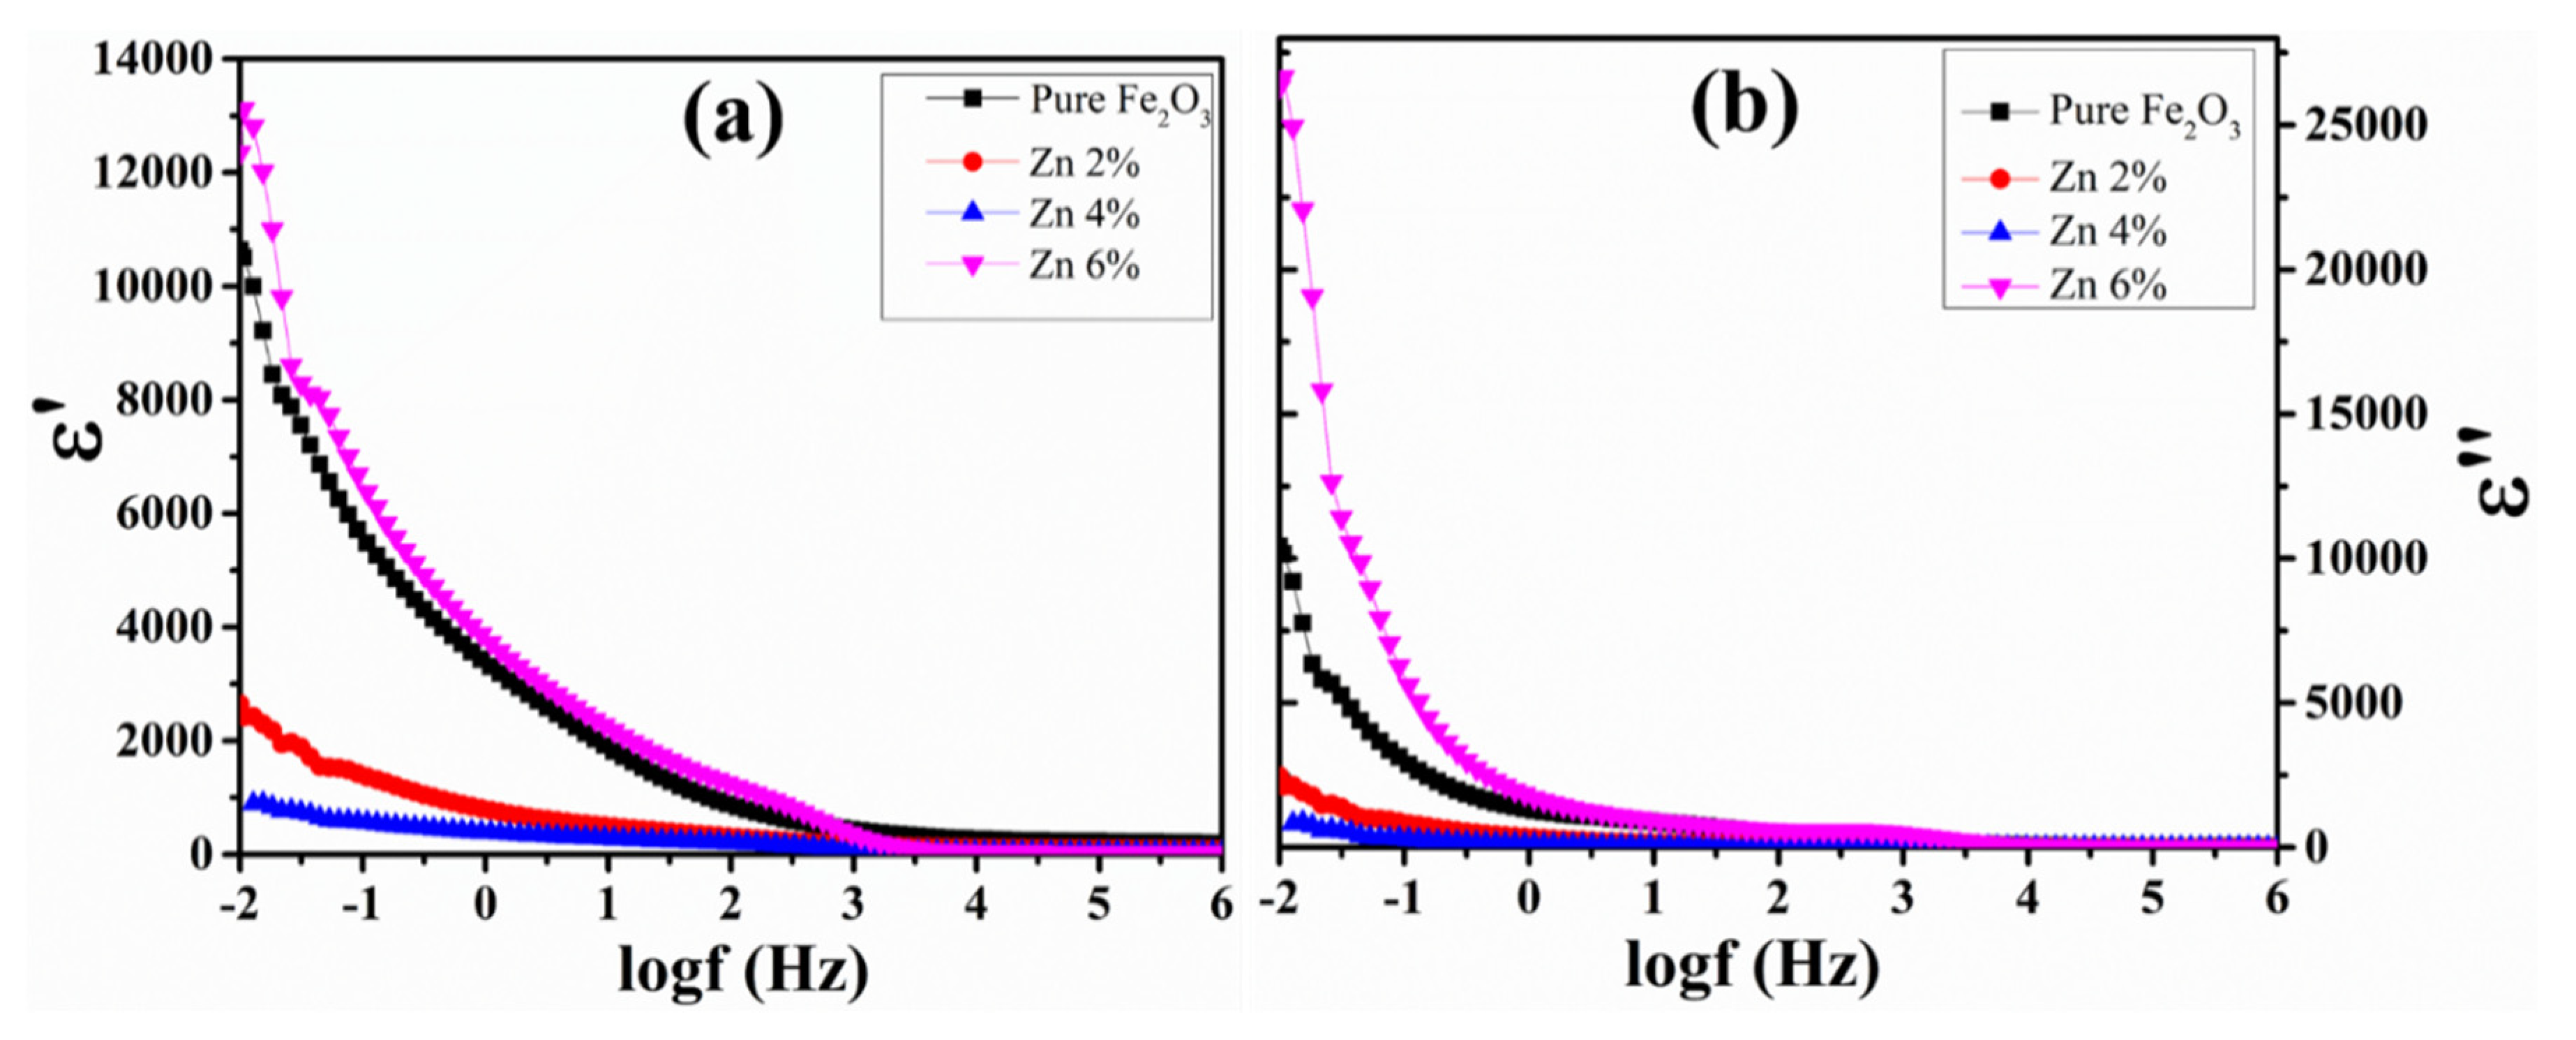
Materials under the oscillating electric field impart dielectric behavior which can be expressed as a complex form consisting of real (ε′) and imaginary (ε″) components that can be represented as ε٭ = ε′+ iε″. The real component (ε′) of dielectric constant depicts the energy storage and imaginary component signifies the dissipated energy in the material. Various external parameters like microstructure, frequency of applied electric field, sintering temperature, type of cation substitution, etc. affect the dielectric properties. Both components of the dielectric constant can be evaluated using the following relation:
Both real, and imaginary, components of dielectric constant have strong frequency dependence at room temperature in Zn doped hematite, and is demonstrated in Figure 10. The dielectric constant decreases with an increase in frequency, which agrees well with previous studies [40]. The strong decrease in dielectric constant with rise in frequency can be understood on the basis of Maxwell Wagner model and Koop’s phenomenological theory, which explains that ferrites are formed by highly conducting grains, embedded in the insulating matrix, i.e., grain boundaries [3]. High dielectric constant value at lower frequencies is contributed by grain boundaries.As the frequency increases, grains start to predominate over grain boundaries, which reduces the dielectric constant. The dispersion in dielectric constant with frequency can also be understood in terms of space charge polarization, due to the hopping of electrons between ferric and ferrous ions [41]. At low frequencies, hopping of electrons within grains causes the electrons to pile up at grain boundaries resulting in space charge polarization and contributes to higher value of dielectric constant. On the other hand, a reduction in orientation polarizability can be seen with increase in frequency, as the electron exchange between Fe2+ and Fe3+ ions loses the ability to follow alternative field and lags behind the field. As a result, probability of electrons reaching the grain boundary reduces. Consequently, the dielectric constant decreases and becomes almost constant at higher frequencies.
Compositional Dependent Dielectric Constant
The behavior of the dielectric constant (ε′ and ε″) with Zn concentration is dependent on many factors like hopping mechanism at octahedral site, lattice parameter and crystallite size. It is well known that the polarization and volume of the unit cell are inversely proportional to each other [42]. It is clearly seen from Figure 10 that value of dielectric constant decreases continuously (pure Fe2O3 > Zn 2% > Zn 4%) with increase in Zn2+ ions up to 4% concentration due to its increased lattice parameter, which yields increase in unit cell volume. Also, this can be justified based on the hopping mechanism. The hopping of ions between Fe2+ and Fe3+ in octahedral site is responsible for polarization. The decrease in dielectric constant with addition of Zn ions up to 4% arises from a decrease in Fe2+ ions at the octahedral site which reduces the electrons (n-type charge carriers) at the cost of increased holes (p-type charge carriers). The mobility of holes is less comparable to electrons and these holes contribute towards polarization resulting in a reduction of dielectric constant. The increase in dielectric constant for Zn 6% is due to decrease in its lattice parameter which reduces the cell volume resulting in large polarization and consequently increase in dielectric constant. Secondly, dielectric constant depends on crystallite size also. It is clearly seen from XRD that crystallite size is increased up to Zn 4% and then decreases for Zn 6%, which is in accordance with variation of dielectric constant with composition.
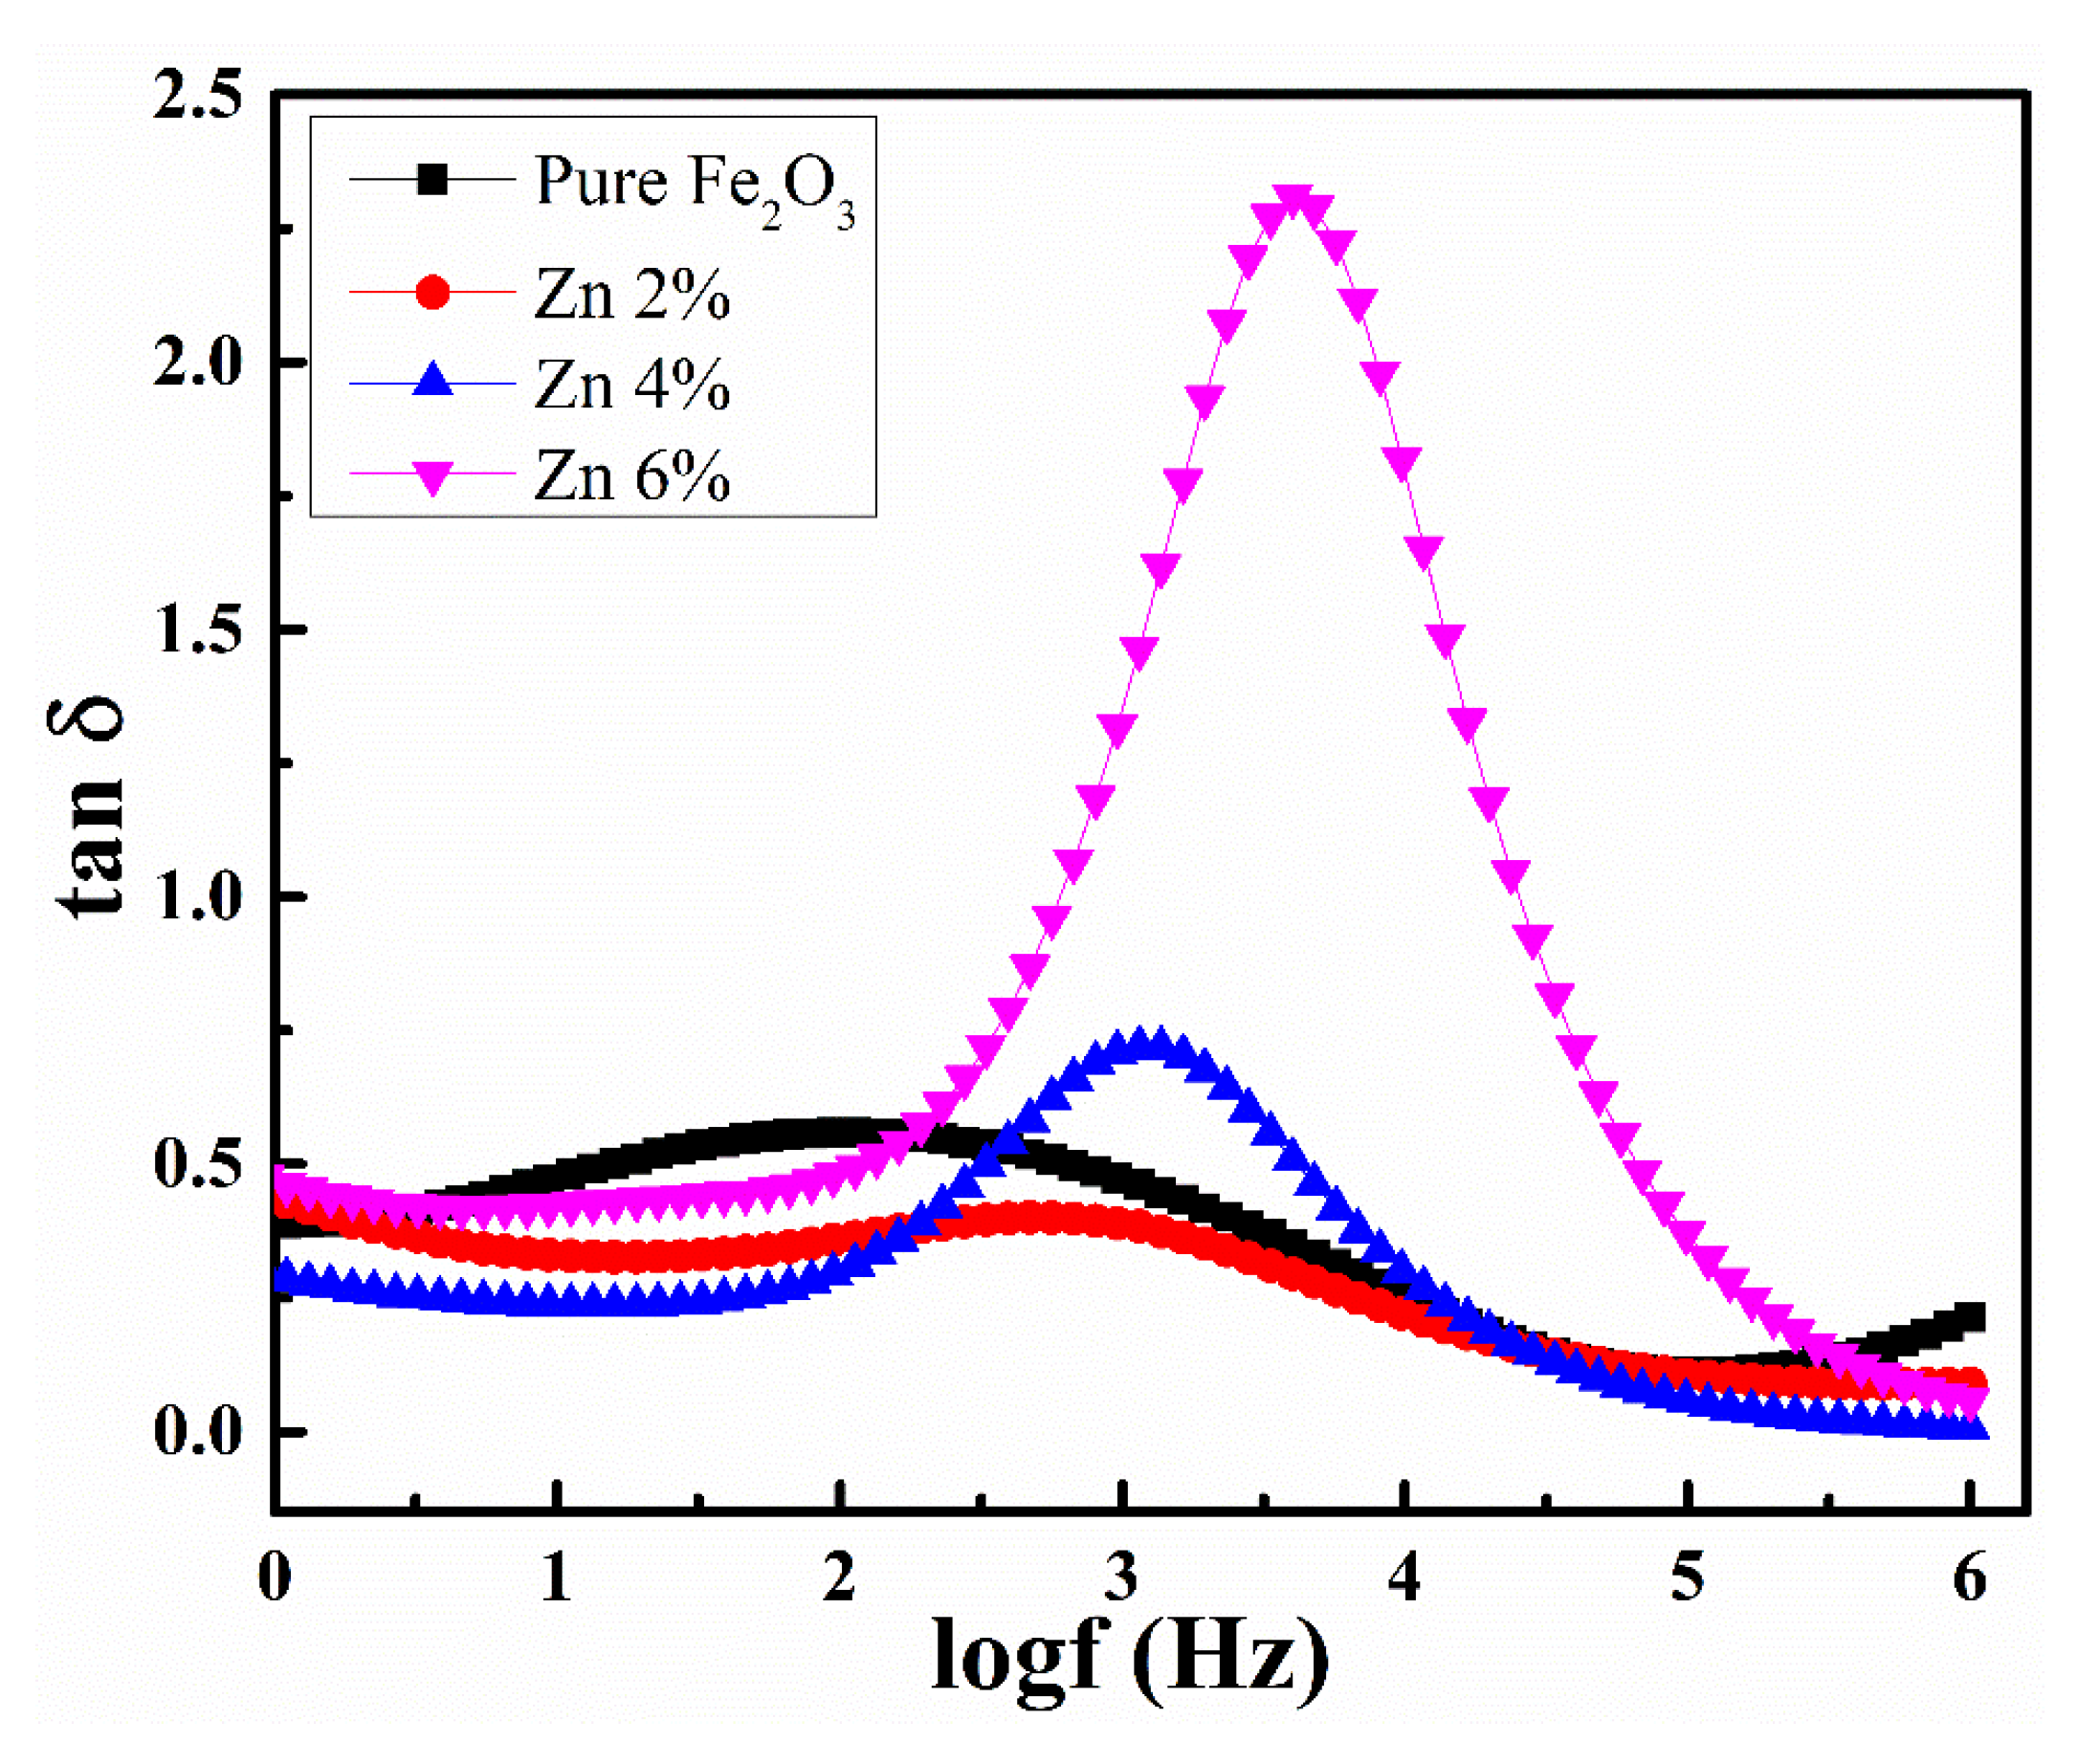
3.7. Dielectric Loss Tangent
Dissipation of energy is measured with respect to alternating external field which is recorded in terms of dielectric loss. The variation in dielectric loss as a function of frequency for varying Zn concentration in hematite is shown in Figure 11.
A report by Iwauchi et al. [43] showed that conduction hopping and dielectric behavior are strongly correlated. The dielectric loss is high at lower frequencies, due to the grain boundary behaving as an insulating interface, as the charge carriers undergo space charge polarization [44]. Diamagnetic dopant and organized growth of domains have a major impact on decrease of loss tangent at small frequencies. The loss factor decreases at higher frequencies, due to the mismatch of electrons with applied field frequency, as discussed above. Loss is dependent on various factors, such as ferric and ferrous content, the stoichiometry of material and heterogeneous domain wall geometry. It can be observed that loss tangent has a relaxation peak for α-ZnxFe2−xO3, which is consistent with earlier reports [45,46]. According to Rezlesque model [47], a peak in dielectric loss is expected when the hopping frequency of electrons between Fe2+ and Fe3+ states is in resonance with the external applied electric field’s frequency. The maxima in dielectric loss can be expressed as a relation ωτ = 1, where ω is the angular frequency of field and τ is relaxation time for hopping mechanism. The increase in peak height, as well as shifting in peak position with doping of Zn shows the variation in hopping probability of electrons between Fe2+ and Fe3+ states, and this is influenced by the number of Fe3+ ions in the octahedral site [48].
3.8. AC Conductivity
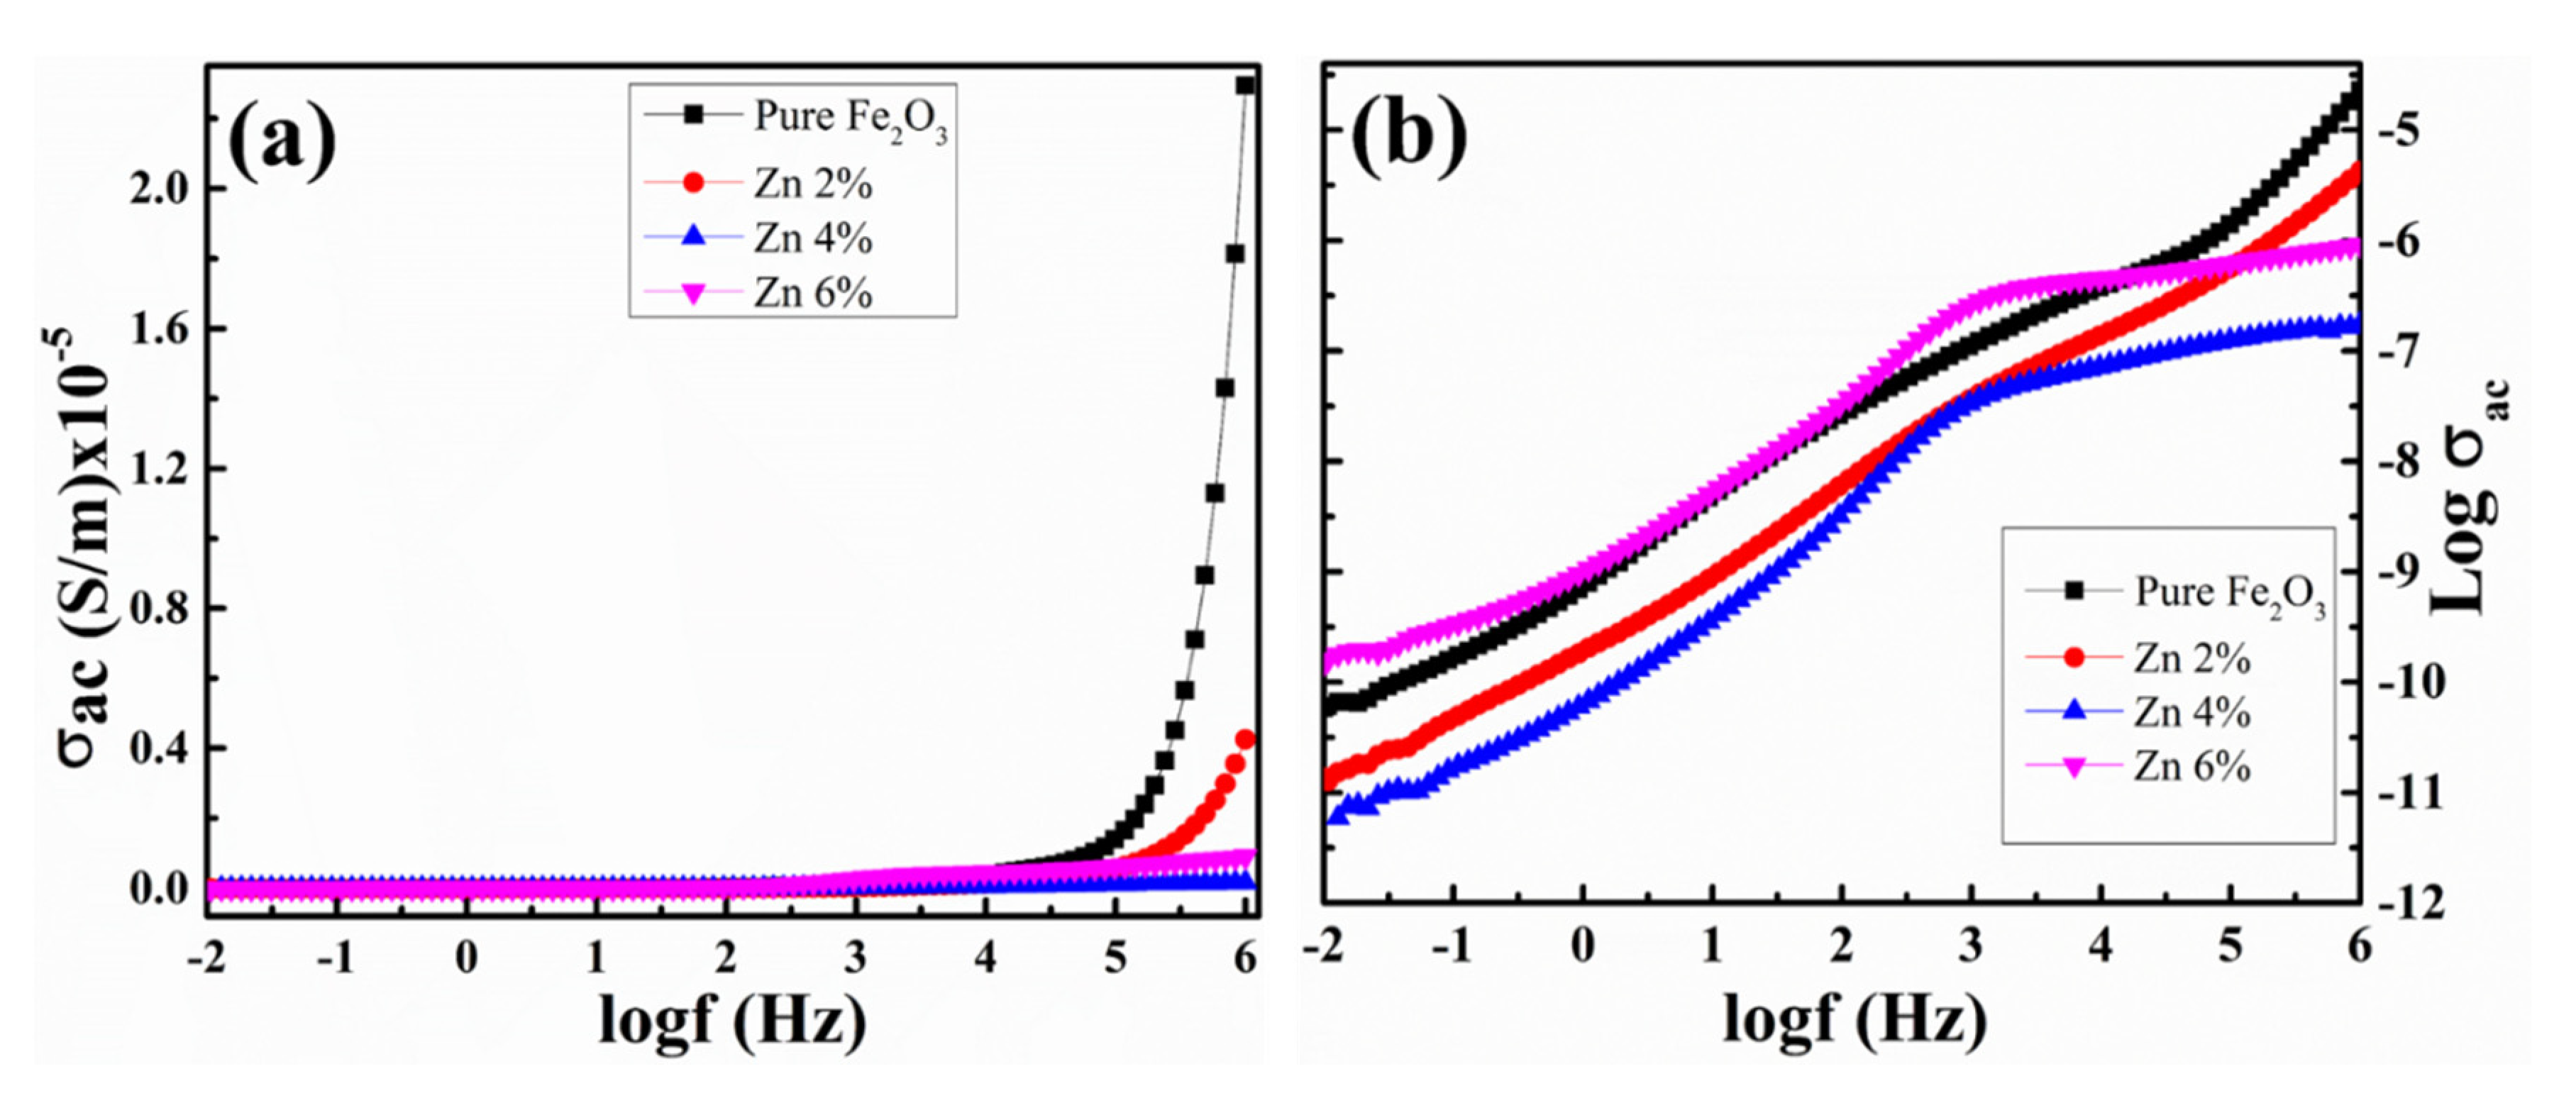
To study the hopping mechanism, ac conductivity (σac) versus logf of Zn doped hematite at room temperature is plotted (Figure 12a). At lower frequencies, conductivity seems to be constant and increases with rise in frequency. The type of polarons involved in hopping mechanism was estimated using log σac versus logf as shown in Figure 12b. In large polaron model, ac conductivity decreases, while in the small polaron model, ac conductivity increases with rise in frequency. In the present study, conductivity shows almost linear behavior with increases in frequency that indicates conduction hopping is followed by small polaron mechanism, as evident from Figure 12b. Conductivity is more affected by grain boundaries at lower frequencies, while grains have more impact on conduction at high frequencies [49]. The increase in frequency enhances the hopping of charge carriers between ferric and ferrous ions that leads to increase in conductivity. Low conductivity is observed at lower frequencies which is due to the blocking effects at grain boundaries.
The relation between frequency and ac conductivity can be depicted as [50],
where, f is frequency in Hz. The conductivity decrement with Zn dopant concentration could be described by the microstructures of the material, the probability of hopping and hopping duration of the electrons. This may arises due to the reduction of Fe3+ ions in octahedral site and creation of Fe3+ vacancies by substitution of Zn2+ ions.
3.9. Modulus Properties
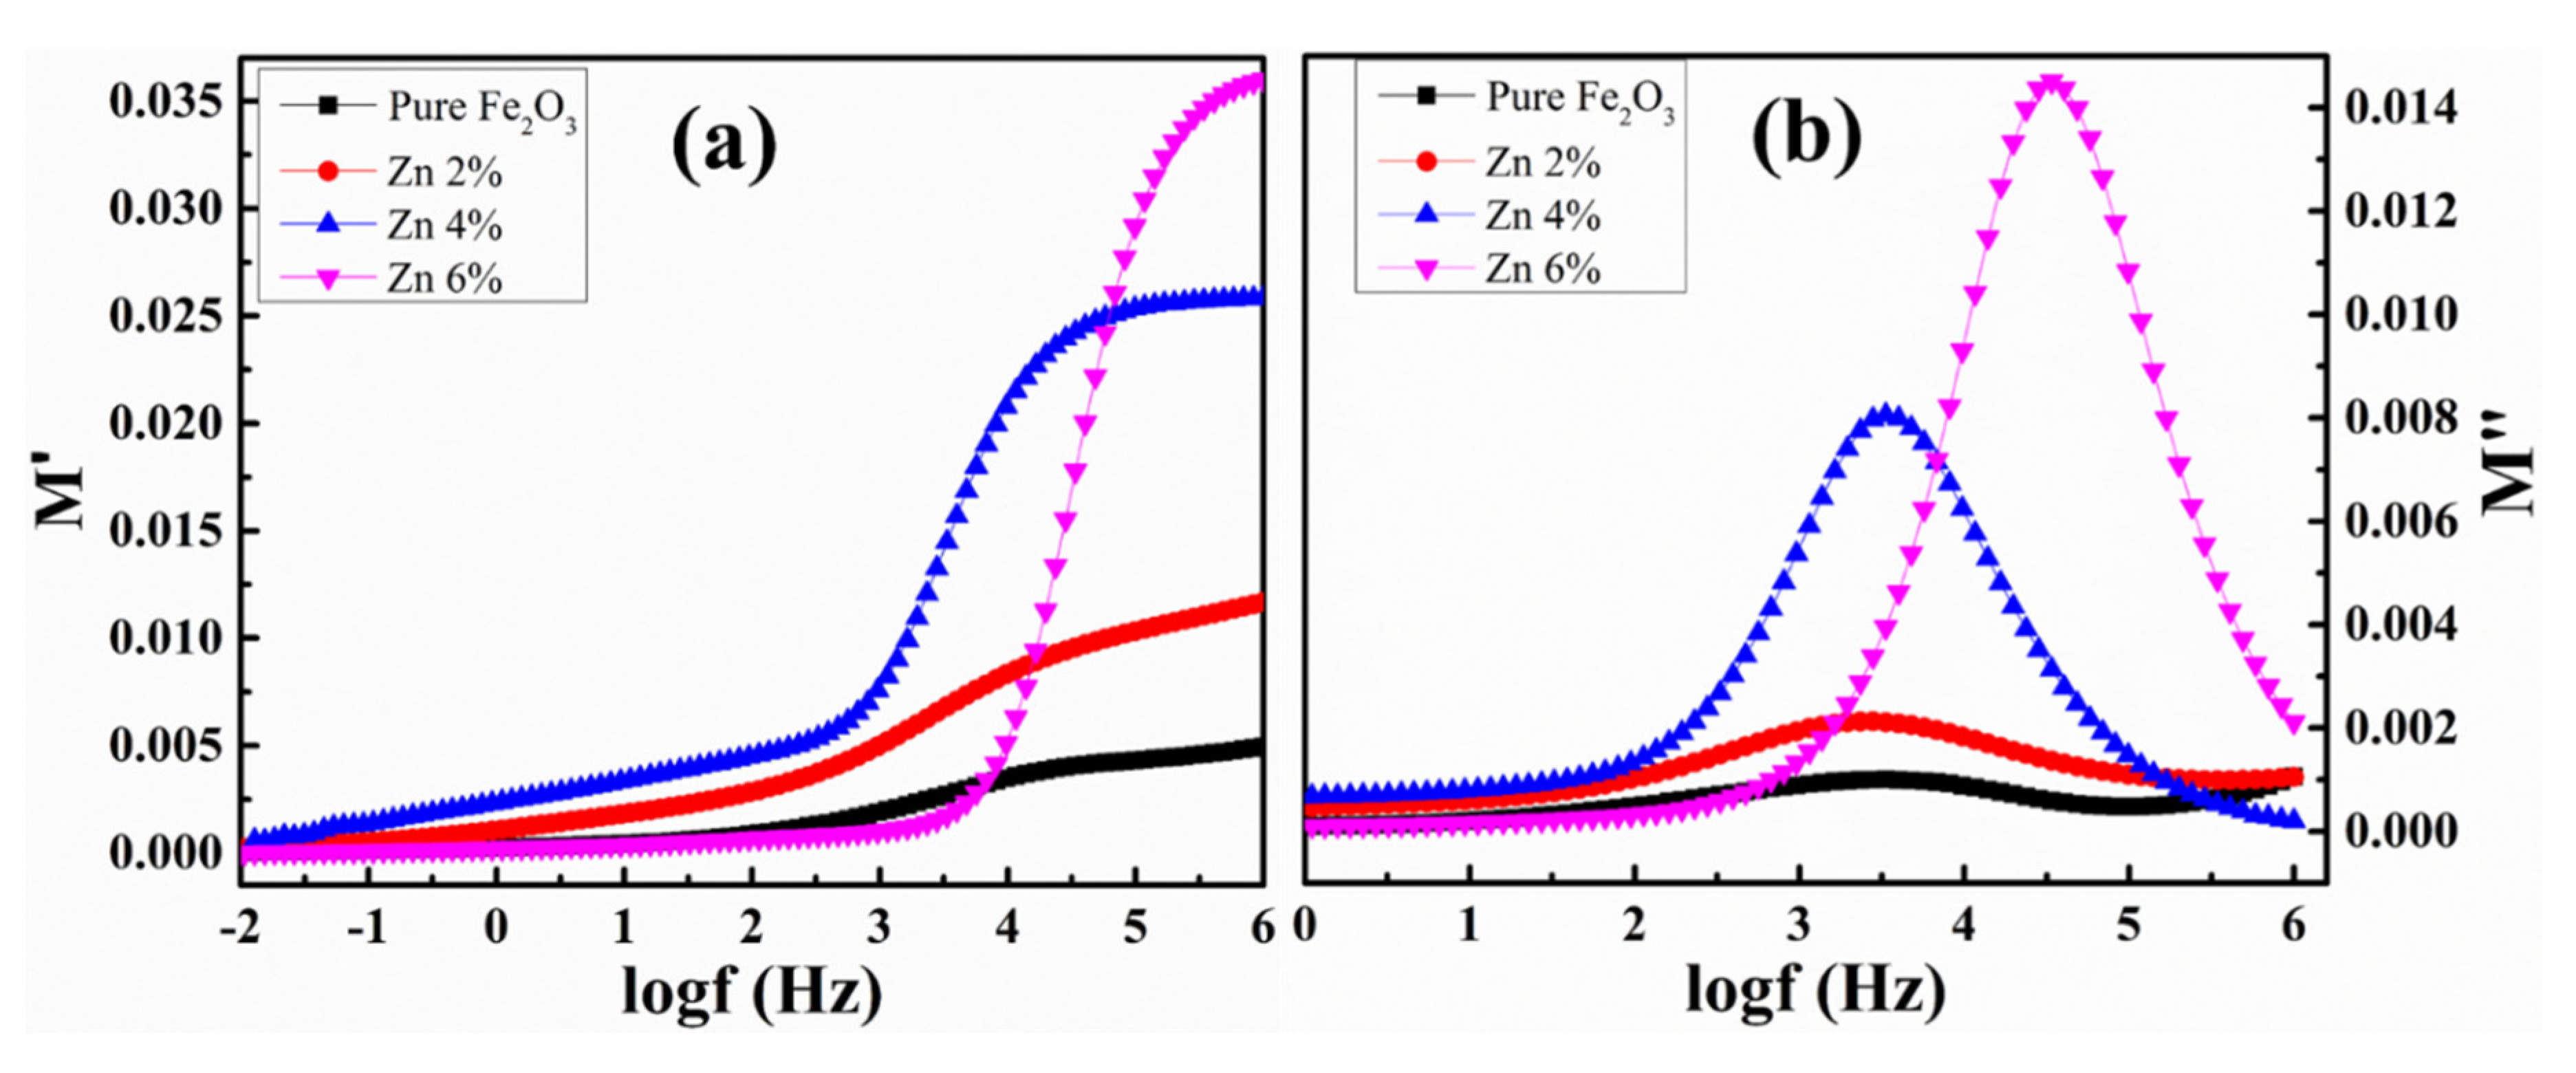
The electric modulus plays an important role in the study of conduction and relaxation behavior of materials, and also, in detecting the impedance sources like grains, grain boundary conduction effect, electrode polarization and electrical conductivity. The real (M’) and imaginary (M”) components of electric modulus can be obtained using dielectric constant (ε′ and ε″) [51]:
The real component (M’) of electric modulus represents the energy given to the system, and the imaginary component (M”) represents the dissipated energy during the conduction process.
The frequency dependence of electric modulus (M’, M”) at room temperature is shown in Figure 13. It is observed that at lower frequencies M’ is very small nearly to be zero and a continuous dispersion with frequency increases having a tendency to saturate at a maximum value for all the samples at higher frequencies due to the relaxation process. These observations implies the lack of restoring force for flow of charge carriers under the action of steady electric field. The small value of M’ at low frequency supports the long range mobility of charge carriers. While, in higher frequencies, M’ increases rapidly with frequency, indicating that the conduction mechanism, which may be due to the short range mobility of charge carriers.
The imaginary part of electrical modulus M” shows an increasing trend compared to frequency with relaxation peaks for all samples. The frequency region below peak frequency represents the frequency range by which ions drift to long distance, i.e., performing successful hopping from one site to neighboring site. Whereas, the high frequency region above the peak shows that the carriers are confined to their potential wells and can make localized motion inside the well. The occurrence of peak in electrical modulus M” indicates the transition from long range to short range mobility of charge carriers with rise in frequency. The behavior of the modulus spectrum is indicative of hopping type mechanism for electrical conduction in the system. The broadening of the peaks is the consequence of the distributions of relaxation time arise from the non-Debye type of the material. Further, it is observed that the peaks shift towards the higher frequency side, with Zn doping and the obtained relaxation peaks having resonance peaks, where the oscillating dipoles frequency matches the applied field frequency.
4. Conclusions
Zn-doped α-Fe2O3 nanoparticles were synthesized by sol-gel method to investigate the effect of Zn doping on structural, optical and dielectric behavior of hematite. XRD reveals the rhombohedral structure of as-prepared samples with average crystallite size lying between 14–21 nm and other various parameters like lattice parameter, strain, stress, dislocation density also has been discussed. Raman spectroscopy confirms defects in the host lattice exist that are consistent with XRD results. FTIR spectra reveals the metal oxygen vibrations and shifting in the spectra with doping ion concentration. The optical band gap obtained from Tauc plot decreases from 2.66 eV for pure Fe2O3 to 2.31 eV for 4% Zn doping and then increases for Zn 6%, which is in accordance with structural parameters. Photodegradation analysis shows that 4% Zn doped α–Fe2O3 is a good catalyst for degradation of RB dye under the illumination of UV light and almost 87% of RB dye has been degraded in 90 min in the presence of catalyst. In future, Zn doped α-Fe2O3 have been used as a very good photocatalyst to remove organic pollutants from waste water. AC conductivity increases with the increase in frequency for all the samples, due to the conduction hopping mechanism, revealing a small polaron hopping mechanism involved in conduction. The dispersion in dielectric constant spectra with frequency can be understood based on Koop and Maxwell-Wagner’s models and also on basis of space charge polarization. Higher value of dielectric constant of synthesized samples at room temperature makes them suitable for high energy storage applications.
Author Contributions
Conceptualization, S. & S.C.; investigation, S.; resources, P.K.; writing—original draft preparation, S.; writing—review and editing, A.K. & P.K.; visualization, A.K.; supervision, P.K.; project administration, P.K.; funding acquisition, P.K. All authors have read and agreed to the published version of the manuscript.
Funding
The present work was financially supported by DST, New Delhi for providing research grant under DST-INSPIRE faculty award (No. DST/INSPIRE/04/2015/003149) to Parmod Kumar. Also, Suman acknowledges University Grant Commission, India (UGC-JRF) for providing research fellowship (UGC-Ref. No.: 1320/ (OBC) (CSIR-UGC NET DEC. 2016)).
Conflicts of Interest
The authors declare no conflict of interest.
References
- Satheesh, R.; Vignesh, K.; Suganthi, A.; Rajarajan, M. Visible light responsive photocatalytic applications of transition metal (M = Cu, Ni, and Co) doped α-Fe2O3 nanoparticles. J. Environ. Chem. Eng. 2014, 2, 1956–1968. [Google Scholar] [CrossRef]
- Nguyen, C.C.; Vu, N.N.; Do, T.O. Recent Advances in the Development of Sunlight-Driven Hollow Structure Photocatalysts and their Applications. J. Mater. Chem. A 2015, 3, 18345–18359. [Google Scholar] [CrossRef]
- Chahal, S.; Rani, N.; Kumar, A.; Kumar, P. Electronic Structure and Photocatalytic Activity of Samarium Doped Cerium Oxide Nanoparticles for Hazardous Rose Bengal Dye Degradation. Vacuum 2020, 172, 109075. [Google Scholar] [CrossRef]
- Bagheri, S.; Chandrappa, C.K.G.; Hamid, S.B.A. Generation of Hematite Nanoparticles via Sol-Gel Method. Res. J. Chem. Sci. 2013, 3, 62–68. [Google Scholar]
- Showa, B.; Mukherjee, N.; Mondal, A. α-Fe2O3 nanospheres: Facile synthesis and highly efficient photo-degradation of organic dyes and surface activation by nano-Pt for enhanced methanol sensing. RSC Adv. 2016, 6, 75347–75358. [Google Scholar] [CrossRef]
- Dong, H.; Zhang, H.; Xu, Y.; Zhao, C. Facile synthesis of α-Fe2O3 nanoparticles on porous human hair-derived carbon as improved anode materials for lithium-ion batteries. J. Power Sources 2015, 300, 104–111. [Google Scholar] [CrossRef]
- Saritas, S.; Sakar, B.C.; Kundakci, M.; Yildirim, M. The effect of Mg dopants on magnetic and structural properties of iron oxide and zinc ferrite thin films. Results Phys. 2018, 9, 416–423. [Google Scholar] [CrossRef]
- Abareshi, M.; Sajjadi, S.H.; Zebarjad, S.M.; Goharshadi, E.K. Fabrication, characterization, and measurement of viscosity of α-Fe2O3-glycerol nanofluids. J. Mol. Liq. 2011, 163, 27–32. [Google Scholar] [CrossRef]
- Kumar, P.; Sharma, V.; Singh, J.P.; Kumar, A.; Chahal, S.; Sachdev, K.; Chae, K.H.; Kumar, A.; Asokan, K.; Kanjilal, D. Investigations on Magnetic and Electrical Properties of Zn doped Fe2O3 Nanoparticles and their correlation with local electronic structure. J. Magn. Magn. Mater. 2019, 489, 165398. [Google Scholar] [CrossRef]
- Boudjemaa, A.; Boumazaa, S.; Trari, M.; Bouarab, R.; Bouguelia, A. Physical and photo-electrochemical characterizations of α-Fe2O3. Application for hydrogen production. INT J. Hydrog. Energ. 2009, 34, 4268–4274. [Google Scholar] [CrossRef]
- Shen, S.; Guo, P.; Wheeler, D.A.; Jiang, J.; Lindley, S.A.; Kronawitter, C.X.; Zhang, J.Z.; Guoa, L.; Mao, S.S. Physical and Photoelectrochemical Properties of Zr-doped Hematite Nanorod Arrays. Nanoscale 2013, 5, 9867. [Google Scholar] [CrossRef] [PubMed]
- Wang, G.; Ling, Y.; Wheeler, D.A.; George, K.E.N.; Horsley, K.; Heske, C.; Zhang, J.Z.; Li, Y. Facile Synthesis of Highly Photoactive α-Fe2O3-Based Films for Water Oxidation. Nano Lett. 2011, 11, 3503–3509. [Google Scholar] [CrossRef] [PubMed]
- Yogi, A.; Varshney, D. Magnetic and structural properties of pure and Cr-doped hematite: α-Fe2−xCrxO3 (0 ≤ x ≤ 1). J. Adv. Ceram. 2013, 2, 360–369. [Google Scholar] [CrossRef] [Green Version]
- Dang, M.Z.; Rancourt, D.G.; Dutrizac, J.E.; Lamarche, G.; Provencher, R. Interplay of surface conditions, particle size, stoichiometry, cell parameters, and magnetism in synthetic hematite-like materials. Hyperfine Interact. 1998, 117, 271–319. [Google Scholar] [CrossRef]
- Zeng, S.; Tang, K.; Li, T. Controlled synthesis of α-Fe2O3 nanorods and its size-dependent optical absorption, electrochemical, and magnetic properties. J. Colloid Interface Sci. 2007, 312, 513–521. [Google Scholar] [CrossRef]
- Varshney, D.; Yogi, A. Structural and Electrical conductivity of Mn doped Hematite (α-Fe2O3) phase. J. Mol. Struct. 2011, 995, 157–162. [Google Scholar] [CrossRef]
- Bruzzone, C.L.; Ingalls, R. Mossbauer-effect study of the Morin transition and atomic positions in hematite under pressure. Phys. Rev. B 1983, 28, 2430–2440. [Google Scholar] [CrossRef]
- Velev, J.; Bandyopadhyay, A.; Butler, W.H.; Sarker, S. Electrionic and magnetic structure of transition-metal-doped α-hematite. Phys. Rev. B 2005, 71, 205208. [Google Scholar] [CrossRef]
- Lassoued, A.; Dkhil, B.; Gadri, A.; Ammar, S. Control of the shape and size of iron oxide (α-Fe2O3) nanoparticles synthesized through the chemical precipitation method. Results Phys. 2017, 7, 3007–3015. [Google Scholar] [CrossRef]
- Vijayalakshmin, K.; Renitta, A.; Karthick, K. Growth of high-quality ZnO:Mg films on ITO coated glass substrates for enhanced H2 sensing. Ceram. Int. 2014, 40, 6171–6177. [Google Scholar] [CrossRef]
- Kumar, P.; Singh, V.; Sharma, V.; Rana, G.; Malik, H.K.; Asokan, K. Investigation of phase segregation in yttrium-doped zinc oxide. Ceram. Int. 2015, 41, 6734–6739. [Google Scholar] [CrossRef]
- Kumar, P.; Kumar, P.; Kumar, A.; Meena, R.C.; Tomar, R.; Chand, F.; Asokan, K. Structural, morphological, electrical and dielectric properties of Mn-doped CeO2. J. Alloys Compd. 2016, 672, 543–548. [Google Scholar] [CrossRef]
- Kumar, P.; Singh, J.P.; Malik, H.K.; Gautam, S.; Chae, K.H.; Asokan, K. Structural, transport and ferroelectric properties of Zn1-xMgxO samples and their local electronic structure. Superlattices Microst. 2014, 78, 183–189. [Google Scholar] [CrossRef]
- Jubb, A.M.; Allen, H.C. Vibrational Spectroscopic Characterization of Hematite, Maghemite and Magnetite Thin Films Produced by Vapor Deposition. ACS Appl. Mater. Interfaces 2010, 2, 2804–2812. [Google Scholar] [CrossRef]
- Mccarty, K.F.; Boehme, D.R. A Raman Study of the Systems Fe3−xCrxO4 and Fe2−xCrxO3. J. Solid State Chem. 1989, 79, 19–27. [Google Scholar] [CrossRef]
- Chernyshova, I.V.; Hochella, M.F., Jr.; Madden, A.S. Size-dependent structural transformations of hematite nanoparticles. 1. Phase transition. Phys. Chem. Chem. Phys. 2007, 9, 1736. [Google Scholar] [CrossRef] [PubMed]
- Rani, B.J.; Mageswari, R.; Ravi, G.; Ganesh, V.; Yuvakkumar, R. Design, fabrication, and characterization of hematite (α-Fe2O3) Nanostructures. JOM 2017, 69, 2508–2514. [Google Scholar] [CrossRef]
- Wang, W.; Liang, L.; Johs, A.; Gu, B. Thin films of uniform hematite nano-particles: Control of surface hydrophobicity and self-assembly. J. Mater. Chem. 2008, 18, 5770–5775. [Google Scholar] [CrossRef]
- Darezereshki, E. One-step synthesis of hematite (α-Fe2O3) nano-particles by direct thermal-decomposition of maghemite. Mater. Lett. 2010, 65, 642–645. [Google Scholar] [CrossRef]
- Lian, J.; Duan, X.; Ma, J.; Peng, P.; Kim, T.; Zheng, W. Hematite (α-Fe2O3) with Various Morphologies: Ionic Liquid-Assisted Synthesis, Formation Mechanism and Properties. ACS Nano 2009, 3, 3749–3761. [Google Scholar] [CrossRef]
- Mohammed, K.A.; Al-Rawas, A.D.; Gismelseed, A.M.; Sellai, A.; Widatallah, H.M.; Yousif, A.; Elzain, M.E.; Shongwe, M. Infrared and structural studies of Mg1–xZnxFe2O4 ferrites. Phys. B 2012, 407, 795–804. [Google Scholar] [CrossRef]
- Lassoued, A.; Lassoued, M.S.; Granda, S.G.; Dkhil, B.; Ammar, S.; Gadri, A. Synthesis and characterization of Ni-doped α-Fe2O3 nanoparticles through co-precipitation method with enhanced photocatalytic activities. J. Mater. Sci. Mater. Electron. 2018, 29, 5726–5737. [Google Scholar] [CrossRef]
- Mashiko, H.; Oshima, T.; Ohtomo, A. Band-gap narrowing in α-(CrxFe1−x)2O3 solid-solution films. Appl. Phys. Lett. 2011, 99, 241904. [Google Scholar] [CrossRef] [Green Version]
- Arul, N.S.; Mangalaraj, D.; Ramachandran, R.; Grace, A.N.; Hana, J.I. Fabrication of CeO2/Fe2O3 composite nanospindles for enhanced visible light driven photocatalyst and supercapacitor electrode. J. Mater. Chem. 2015, 3, 15248–15258. [Google Scholar] [CrossRef]
- Nagaraju, P.; Kumar, Y.V.; Reddy, M.V.R.; Reddy, C.V.; Reddy, D.M. Phase, Preparation, Micro structural characterization and Optical characterization of pure and Gd doped ceria thin films. J. Sci. Eng. Res. 2014, 5, 2229–5518. [Google Scholar]
- Chahal, S.; Rani, N.; Kumar, A.; Kumar, P. UV-irradiated photocatalytic performance of yttrium doped ceria for hazardous Rose Bengal dye. Appl. Surf. Sci. 2019, 493, 87–93. [Google Scholar] [CrossRef]
- Anandan, K.; Rajendran, V. Effects of Mn on the magnetic and optical properties and photocatalytic activities of NiO nanoparticles synthesized via the simple precipitation process. Mater. Sci. Eng. B Adv. 2015, 199, 48–56. [Google Scholar] [CrossRef]
- Bharatha, G.; Ponpandiana, N. Hydroxyapatite nanoparticles on dendritic α-Fe2O3 hierarchical architectures for heterogeneous photocatalyst and adsorption of Pb (II) ions from industrial wastewater. RSC Adv. 2015, 5, 84685–84693. [Google Scholar] [CrossRef]
- Chahal, S.; Kumar, A.; Kumar, P. Erbium-doped oxygen deficient cerium oxide: Bi-functional material in the field of spintronics and photocatalysis. Appl. Nanosci. 2020, 1–13. [Google Scholar] [CrossRef]
- Şafak-asar, Y.; Asar, T.; Altindal, Ş.; Özçelik, S. Investigation of dielectric relaxation and ac electrical conductivity using impedance spectroscopy method in (AuZn)/TiO2/p-GaAs(110) schottky barrier diodes. J. Alloys Compd. 2015, 628, 442–449. [Google Scholar] [CrossRef]
- Phor, L.; Kumar, V. Structural, Magnetic and Dielectric properties of Lanthanum substituted Mn0.5Zn0.5Fe2O4. Ceram. Int. 2019, 17, 22972–22980. [Google Scholar] [CrossRef]
- Rana, G.; Johri, U.C.; Asokan, K. Correlation between structural and dielectric properties of Ni-substituted magnetite nanoparticles. Europhys. Lett. 2013, 103, 17008. [Google Scholar] [CrossRef]
- Iwauchi, K. Dielectric Properties of Fine Particles of Fe3O4 and Some Ferrites. Jpn. J. Appl. Phys. 1971, 10, 1520–1528. [Google Scholar] [CrossRef] [Green Version]
- Pervaiz, E.; Gul, I.H. High frequency AC response, DC resistivity and magnetic studies of holmium substituted Ni-ferrite: A novel electromagnetic material. J. Magn. Magn. Mater. 2014, 349, 27–34. [Google Scholar] [CrossRef]
- Dar, M.A.; Batoo, K.M.; Verma, V.; Siddiqui, W.A.; Kotnala, R.K. Synthesis and characterization of nano-sized pure and Al-doped lithium ferrite having high value of dielectric constant. J. Alloys Compd. 2010, 493, 553–560. [Google Scholar] [CrossRef]
- Ramesh, S.; Dhanalakshmi, B.; Sekhar, B.C.; Rao, P.S.V.S.; Rao, B.P. Effect of Mn/Co substitutions on the resistivity and dielectric properties of nickel-zinc ferrites. Ceram. Int. 2016, 42, 9591–9598. [Google Scholar] [CrossRef]
- Rezlescu, N.; Rezlescu, E. Dielectric properties of copper containing ferrites. Phys. Status Solidi A 1974, 23, 575–582. [Google Scholar] [CrossRef]
- Ashwini, L.S.; Sridhar, R.; Bellad, S.S. Dielectric and magnetoelectric properties of LiMg ferrite: Barium titanate composites. Mater. Chem. Phys. 2017, 200, 136–145. [Google Scholar] [CrossRef]
- Gul, I.H.; Ahmed, W.; Maqsood, A. Electrical and magnetic characterization of nanocrystalline Ni-Zn ferrite synthesis by co-precipitation route. J. Magn. Magn. Mater. 2008, 320, 270–275. [Google Scholar] [CrossRef]
- Alia, I.; Islama, M.U.; Ashiqb, M.N.; Iqbala, M.A.; Khana, H.M.; Karamat, N. Effect of Tb-Mn substitution on DC and AC conductivity of Y-type hexagonal ferrite. J. Alloys Compd. 2013, 579, 576–582. [Google Scholar] [CrossRef]
- Bindu, K.; Ajith, K.M.; Nagaraja, H.S. Electrical, dielectric and magnetic properties of Sn-doped hematite (α-SnxFe2−xO3) nanoplates synthesized by microwave-assisted method. J. Alloys Compd. 2017, 735, 847–854. [Google Scholar] [CrossRef]
Figure 1.
Schematic representation of synthesis and photocatalytic test of pure Fe2O3, Zn 2%, Zn 4% and Zn 6% nanoparticles.
Figure 1.
Schematic representation of synthesis and photocatalytic test of pure Fe2O3, Zn 2%, Zn 4% and Zn 6% nanoparticles.

Figure 2.
X-ray diffraction pattern of pure Fe2O3, Zn 2%, Zn 4% and Zn 6% nanoparticles.

Figure 3.
TEM images of (a) pure Fe2O3, (b) Zn 2%, (c) Zn 4% and (d) Zn 6% nanoparticles.

Figure 4.
Raman spectrum of pure Fe2O3, Zn 2%, Zn 4% and Zn 6% nanoparticles.

Figure 5.
(a) FTIR transmittance (%) spectra and (b) Tauc plot of pure Fe2O3, Zn 2%, Zn 4% and Zn 6% nanoparticles.
Figure 5.
(a) FTIR transmittance (%) spectra and (b) Tauc plot of pure Fe2O3, Zn 2%, Zn 4% and Zn 6% nanoparticles.

Figure 6.
Time-dependent UV–Vis absorption spectra for RB dye in the presence of Catalyst: (a) pure Fe2O3, (b) Zn 2%, (c) Zn 4% and (d) Zn 6%.
Figure 6.
Time-dependent UV–Vis absorption spectra for RB dye in the presence of Catalyst: (a) pure Fe2O3, (b) Zn 2%, (c) Zn 4% and (d) Zn 6%.

Figure 7.
Proposed photocatalytic mechanism in α-Fe2O3 for degrading RB dye.

Figure 8.
Experimental and linear plot of −ln(C/C0) versus irradiation time for pure Fe2O3, Zn 2%, Zn 4% and Zn 6% nanoparticles.
Figure 8.
Experimental and linear plot of −ln(C/C0) versus irradiation time for pure Fe2O3, Zn 2%, Zn 4% and Zn 6% nanoparticles.

Figure 9.
Bar diagram of (a) % degradation and (b) electricity cost in Indian rupees for degradation of RB dye with pure Fe2O3, Zn 2%, Zn 4% and Zn 6% nanoparticles.
Figure 9.
Bar diagram of (a) % degradation and (b) electricity cost in Indian rupees for degradation of RB dye with pure Fe2O3, Zn 2%, Zn 4% and Zn 6% nanoparticles.

Figure 10.
Variation of (a) real component (ε′) and (b) Imaginary component (ε″) of dielectric constant with frequency of pure Fe2O3, Zn 2%, Zn 4% and Zn 6% nanoparticles.
Figure 10.
Variation of (a) real component (ε′) and (b) Imaginary component (ε″) of dielectric constant with frequency of pure Fe2O3, Zn 2%, Zn 4% and Zn 6% nanoparticles.

Figure 11.
Variation of dielectric loss with frequency of pure Fe2O3, Zn 2%, Zn 4% and Zn 6% nanoparticles.
Figure 11.
Variation of dielectric loss with frequency of pure Fe2O3, Zn 2%, Zn 4% and Zn 6% nanoparticles.

Figure 12.
(a) Frequency dependency AC conductivity of pure Fe2O3, Zn 2%, Zn 4% and Zn 6% nanoparticles and (b) Linear plot of log σac versus logf.
Figure 12.
(a) Frequency dependency AC conductivity of pure Fe2O3, Zn 2%, Zn 4% and Zn 6% nanoparticles and (b) Linear plot of log σac versus logf.

Figure 13.
Frequency dependence (a) real component (M’) and (b) Imaginary component (M”) of electric modulus of pure Fe2O3, Zn 2%, Zn 4% and Zn 6% nanoparticles.
Figure 13.
Frequency dependence (a) real component (M’) and (b) Imaginary component (M”) of electric modulus of pure Fe2O3, Zn 2%, Zn 4% and Zn 6% nanoparticles.


Table 1.
Structural parameters of pure Fe2O3, Zn 2%, Zn 4% and Zn 6% synthesized nanoparticles.
| Samples | Lattice Parameter (Å) | Crystallite Size (nm) | Dislocation Density (nm)−2 × 10⁻⁴ | Stress (GPa) | Particle Size From TEM (nm) | |
|---|---|---|---|---|---|---|
| a–axis | c–axis | |||||
| Pure Fe2O3 | 5.035 | 13.229 | 15 | 44.44 | −8.41 | 18 |
| Zn 2% | 5.041 | 13.242 | 18 | 30.86 | −8.20 | 20 |
| Zn 4% | 5.043 | 13.248 | 21 | 22.67 | −8.10 | 23 |
| Zn 6% | 5.002 | 13.221 | 14 | 51.02 | −8.54 | 16 |
Table 2.
The calculated band gap, valence band and conduction band positions corresponding to pure Fe2O3, Zn 2%, Zn 4% and Zn 6% nanoparticles.
Table 2.
The calculated band gap, valence band and conduction band positions corresponding to pure Fe2O3, Zn 2%, Zn 4% and Zn 6% nanoparticles.
| Samples | Band Gap (eV) | Valence Band Position (eV) | Conduction Band Position (eV) |
|---|---|---|---|
| Pure Fe2O3 | 2.66 | 2.70 | 0.04 |
| Zn 2% | 2.58 | 2.66 | 0.08 |
| Zn 4% | 2.31 | 2.52 | 0.21 |
| Zn 6% | 2.72 | 2.73 | 0.01 |
Table 3.
Calculated photodegradation parameters of pure Fe2O3, Zn 2%, Zn 4% and Zn 6% nanoparticles.
Table 3.
Calculated photodegradation parameters of pure Fe2O3, Zn 2%, Zn 4% and Zn 6% nanoparticles.
| Samples | Rate Constant (k) (min)−1 | % Degradation (in 90 min) | R2 | t1/2 (min) | t90 (min) |
|---|---|---|---|---|---|
| Pure Fe2O3 | 0.01087 | 63 | 0.9962 | 63.8 | 211.8 |
| Zn 2% | 0.01728 | 80 | 0.98381 | 40.1 | 133.3 |
| Zn 4% | 0.02277 | 87 | 0.99605 | 30.4 | 101.1 |
| Zn 6% | 0.00963 | 57 | 0.97569 | 72.0 | 239.1 |
© 2020 by the authors. Licensee MDPI, Basel, Switzerland. This article is an open access article distributed under the terms and conditions of the Creative Commons Attribution (CC BY) license (http://creativecommons.org/licenses/by/4.0/).
Share and Cite
MDPI and ACS Style
Suman; Chahal, S.; Kumar, A.; Kumar, P. Zn Doped α-Fe2O3: An Efficient Material for UV Driven Photocatalysis and Electrical Conductivity. Crystals 2020, 10, 273. https://0-doi-org.brum.beds.ac.uk/10.3390/cryst10040273
AMA Style
Suman, Chahal S, Kumar A, Kumar P. Zn Doped α-Fe2O3: An Efficient Material for UV Driven Photocatalysis and Electrical Conductivity. Crystals. 2020; 10(4):273. https://0-doi-org.brum.beds.ac.uk/10.3390/cryst10040273
Chicago/Turabian StyleSuman, Surjeet Chahal, Ashok Kumar, and Parmod Kumar. 2020. "Zn Doped α-Fe2O3: An Efficient Material for UV Driven Photocatalysis and Electrical Conductivity" Crystals 10, no. 4: 273. https://0-doi-org.brum.beds.ac.uk/10.3390/cryst10040273
Note that from the first issue of 2016, this journal uses article numbers instead of page numbers. See further details here.